Conclusie - Ultradun werkstation met uitgebalanceerde functies
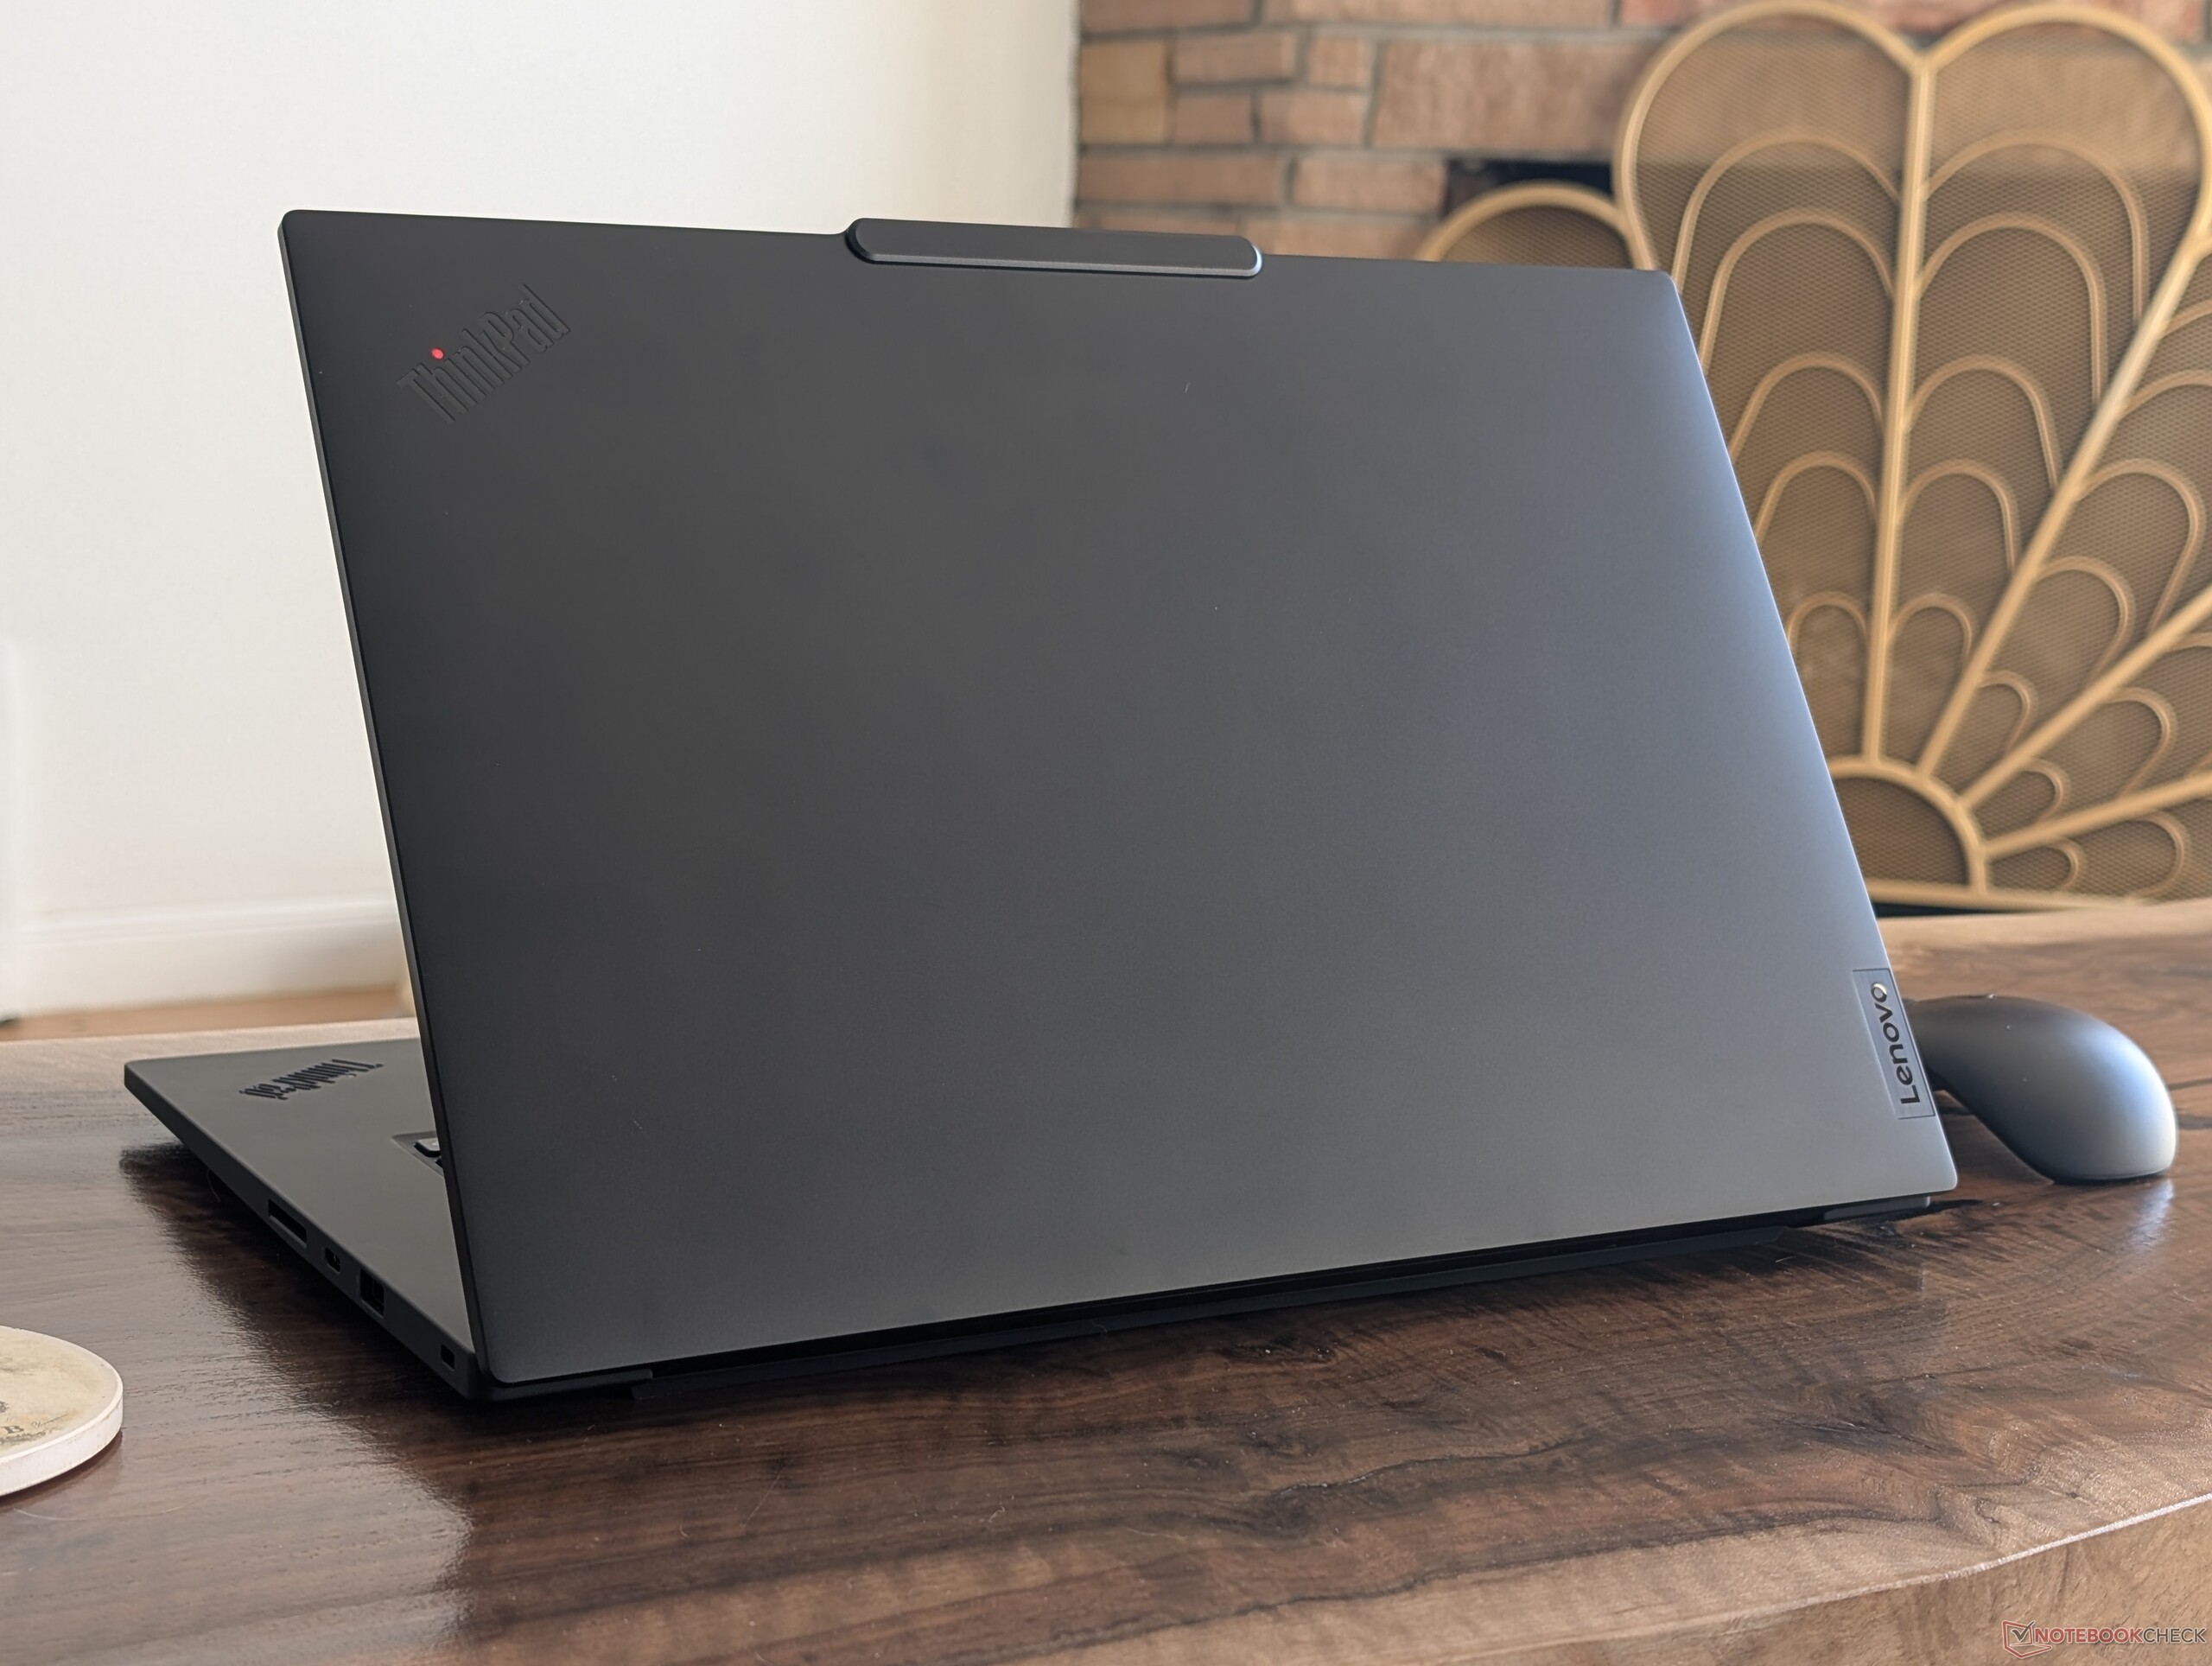
De ThinkPad P1 Gen 8 is een stap sneller dan de ThinkPad P1 Gen 7 en voegt ondersteuning voor Thunderbolt 5-connectiviteit en een nieuwe, kleinere USB-C AC-adapter toe. De serie staat bekend om het aanbieden van discrete Nvidia grafische opties ondanks het ultradunne profiel voor hoge prestaties-per-volume en dus zet dit nieuwste model de trend voort. Er zijn verder geen externe wijzigingen voor de revisie van dit jaar.
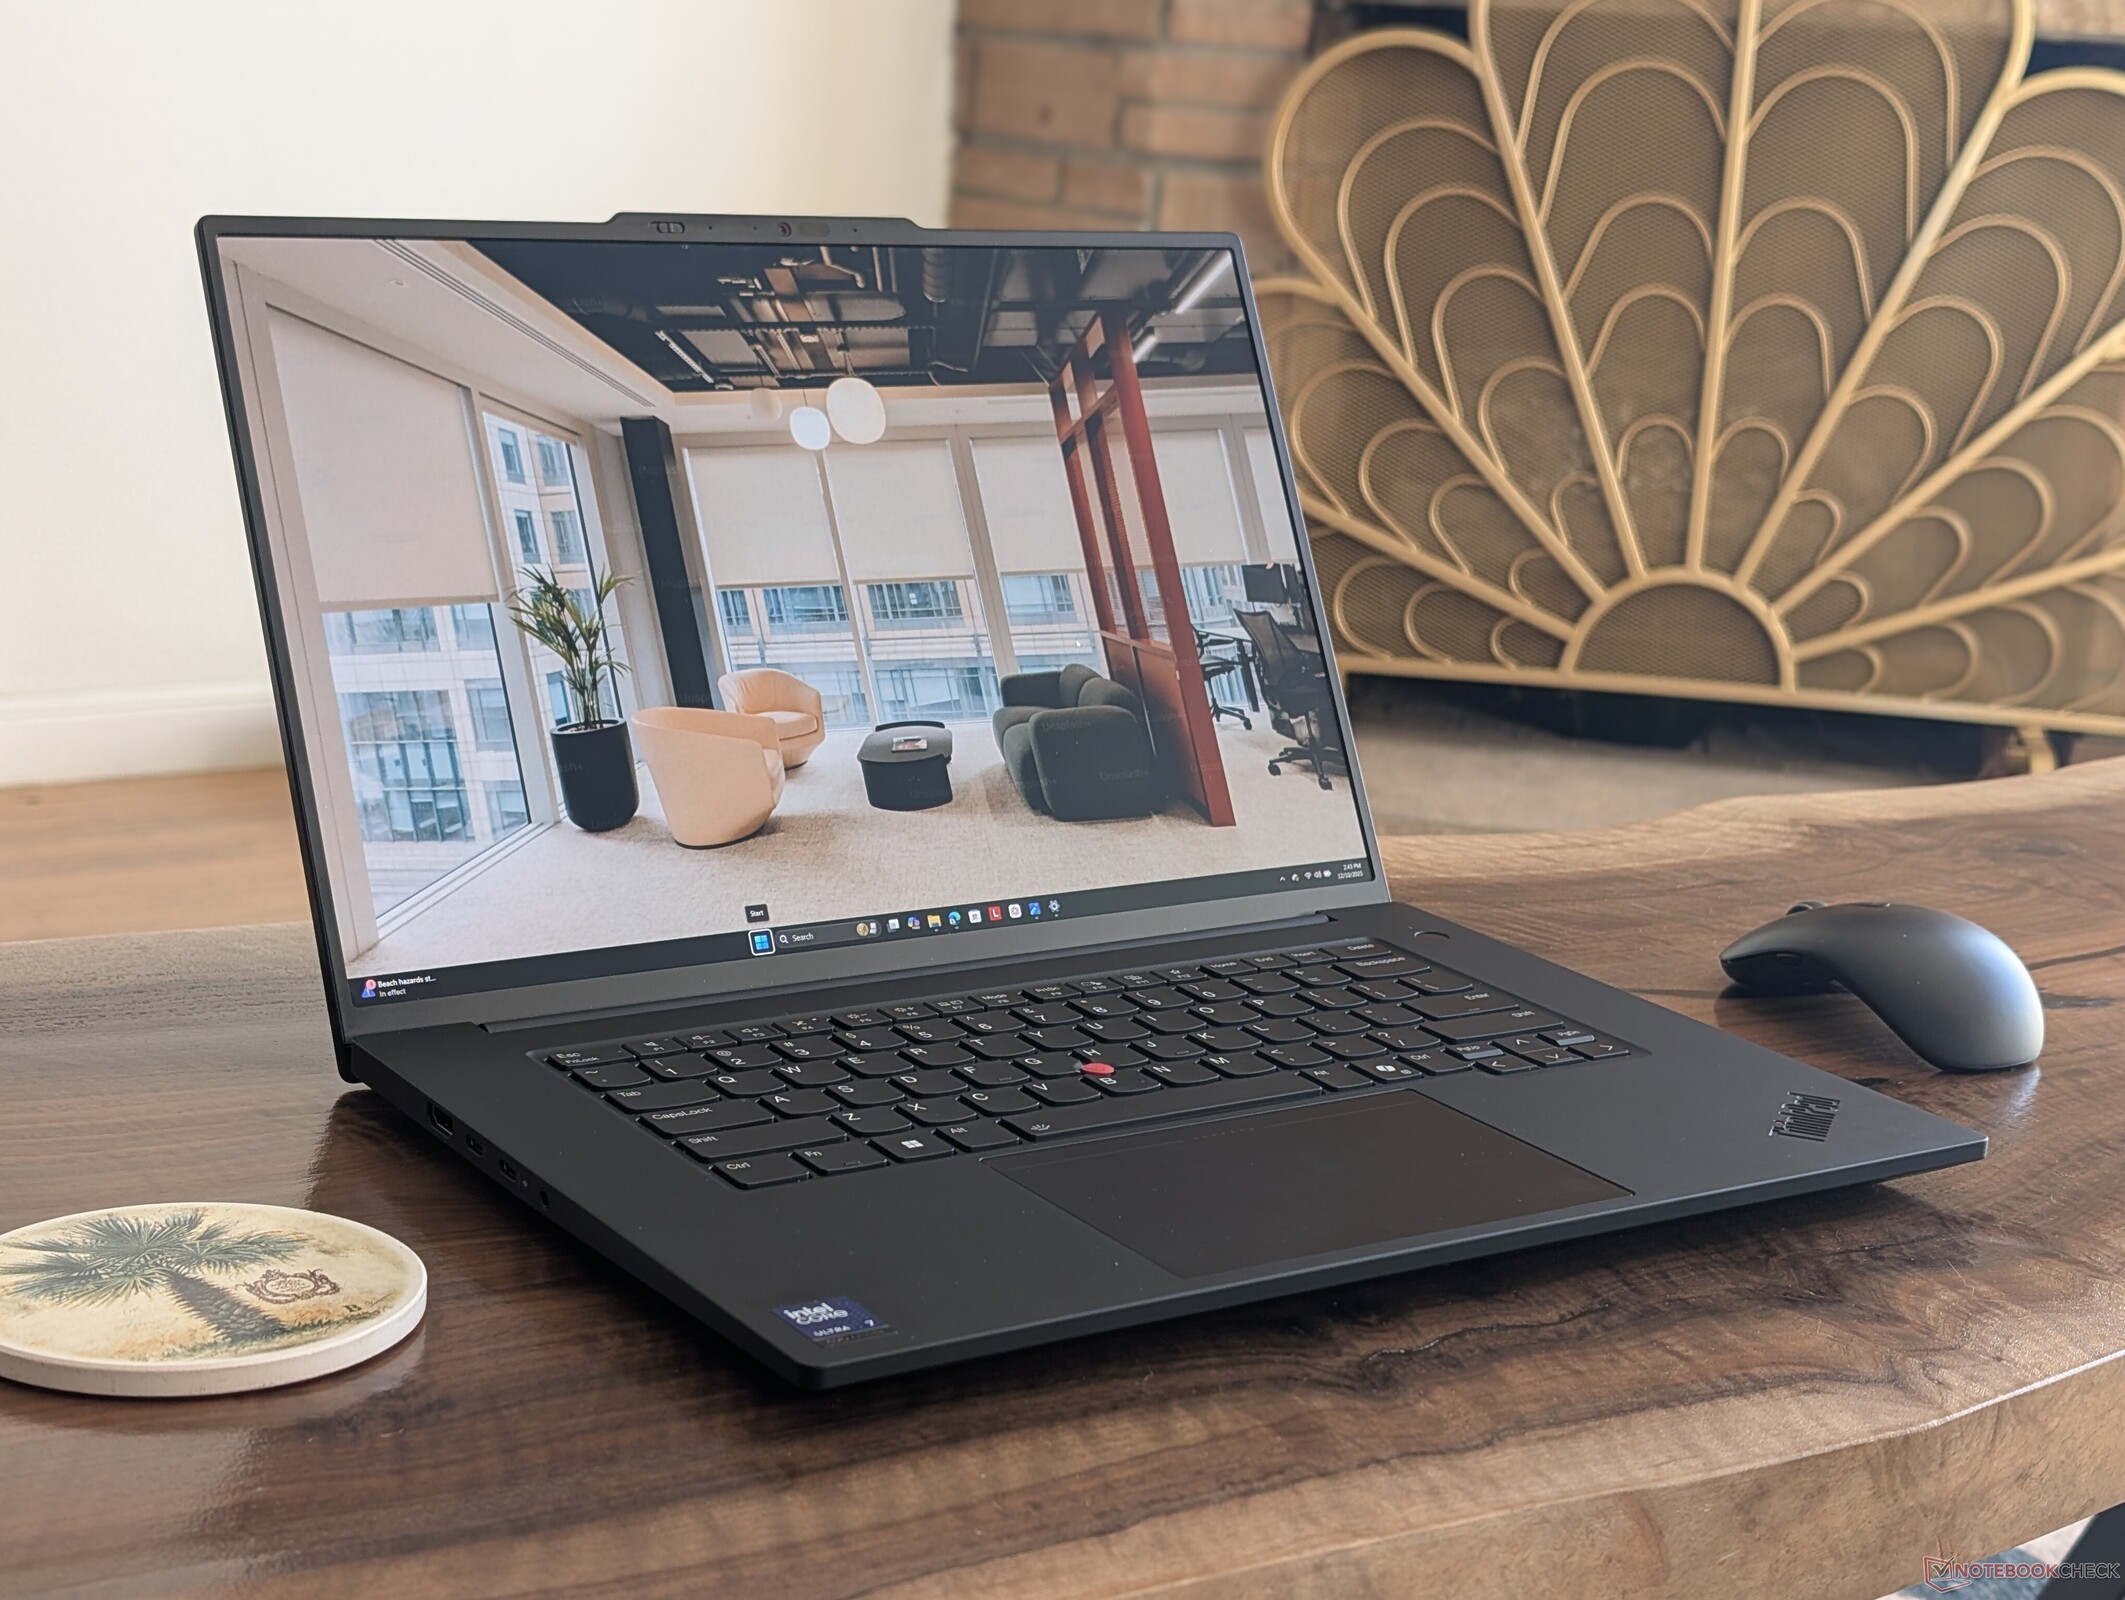
De meest opwindende eigenschap van de ThinkPad P1 Gen 8 is echter waarschijnlijk de nieuwe tandem OLED touchscreen optie. Met maximaal 1500 nits is dit verreweg een van de helderste 16-inch mobiele werkstations die verkrijgbaar zijn voor een betere HDR-weergave dan de overgrote meerderheid van de bestaande laptops. Het is dan ook vreemd om zo'n optie op een werkstation te zien, aangezien de doelgroep van professionals waarschijnlijk geen superheldere HDR-touchscreens nodig hebben voor hun dagelijkse werkzaamheden. In feite is de levensduur van de batterij korter met deze configuratie en daarom kunnen gebruikers beter kiezen voor het gewone 4K IPS-paneel, dat vergelijkbare kleuren en een hogere native resolutie biedt. Tandem OLED is wellicht beter geschikt voor gaming of multimedia-gerichte laptops zoals die uit de Yoga- of Legion -serie.
Krachtige gebruikers die meer paardenkracht vereisen, kunnen de dikkere P16-serie die grafische opties biedt die verder gaan dan de RTX Pro 2000 Blackwell.
Pro
Contra
Prijs en beschikbaarheid
De Lenovo ThinkPad P1 16 Gen 8 wordt nu rechtstreeks vanaf de fabrikant verzonden voor $2220 in de configuratie. Vergelijkbare configuraties zijn ook verkrijgbaar bij Amazon.
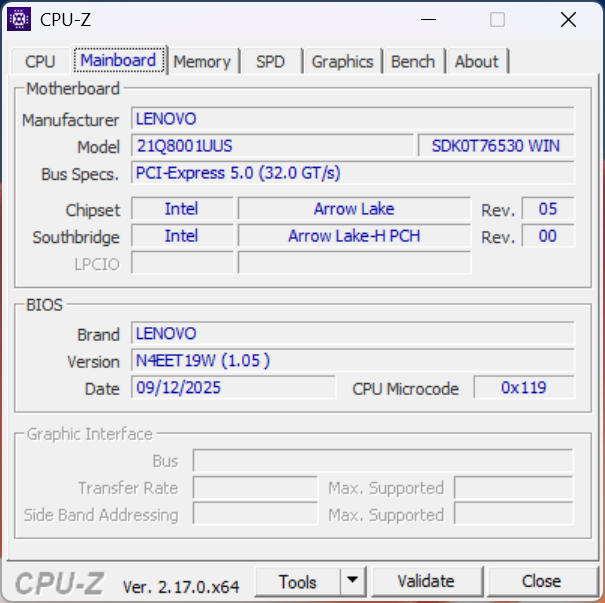
De ThinkPad P1 Gen 8 volgt de ThinkPad P1 Gen 7 van vorig jaar op door de introductie van Intel Arrow Lake-H en Nvidia Blackwell opties ter vervanging van respectievelijk de oudere Meteor Lake-H en Ada Lovelace opties. Hij wordt ook geleverd met nieuwe schermopties, waaronder 4K IPS of tandem OLED. Het chassis is verder ongewijzigd en daarom raden we aan om onze recensie van de ThinkPad P1 Gen 7 te bekijken voor meer informatie over de fysieke kenmerken van het systeem.
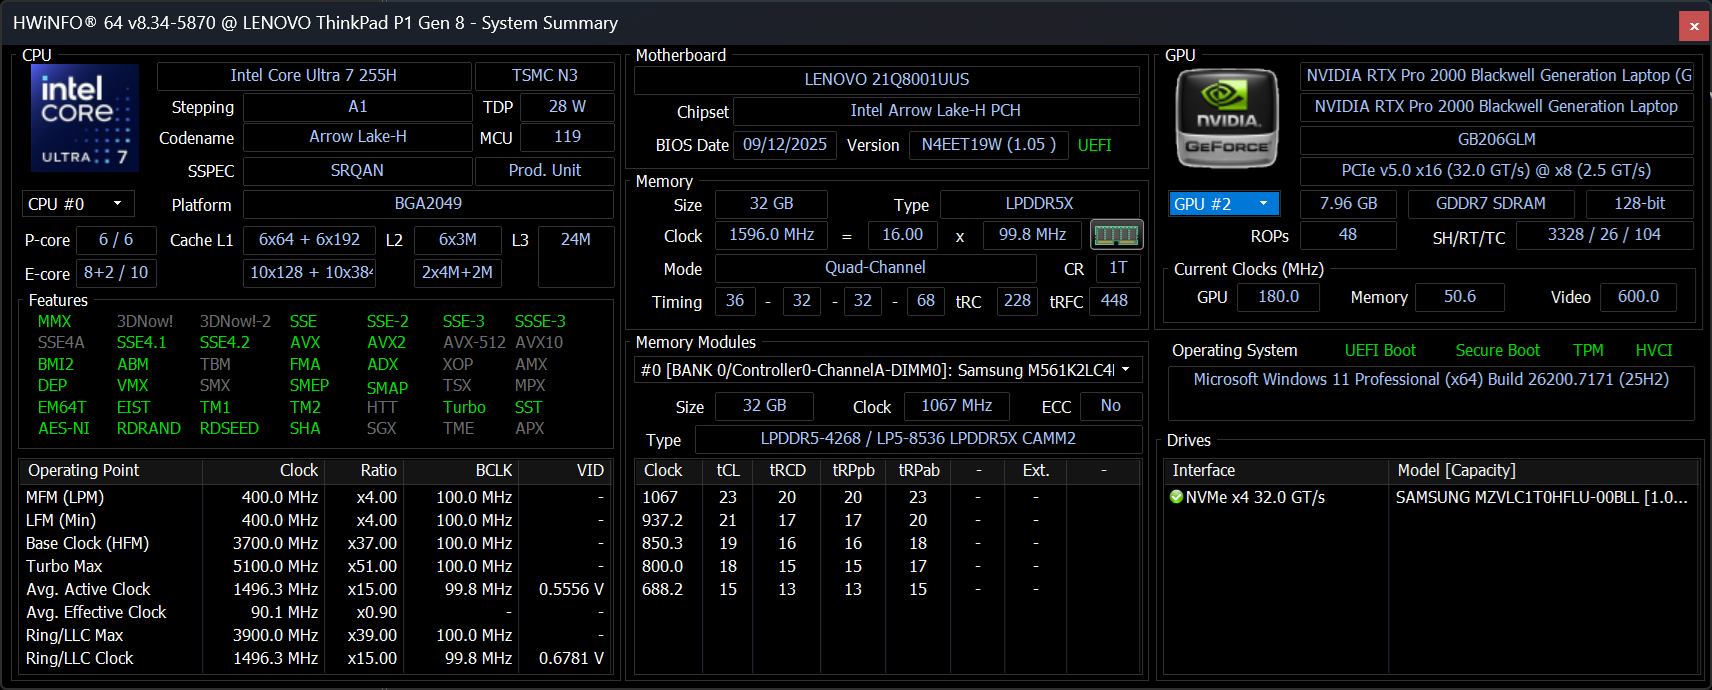
Onze testunit is een middelste configuratie met de Core Ultra 7 255H CPU, 75 W RTX Pro 2000 Blackwell GPU en 3,2K tandem OLED aanraakscherm voor ongeveer $2220. De goedkopere SKU's beginnen met de Core Ultra 5 235H en alleen geïntegreerde Arc 140T graphics met een standaard 1200p60 IPS-scherm, terwijl de duurdere SKU's met de Core Ultra 9 285H en een 4K IPS-scherm komen. Er zijn geen grafische opties boven de RTX Pro 2000 Blackwell.
Alternatieven voor de ThinkPad P1 Gen 8 zijn andere 16-inch ultradunne werkstations zoals de HP ZBook X G1i 16, Dell Pro 16 Plus, of de Asus ExpertBook serie.
Meer Lenovo beoordelingen:
Specificaties
Zaak
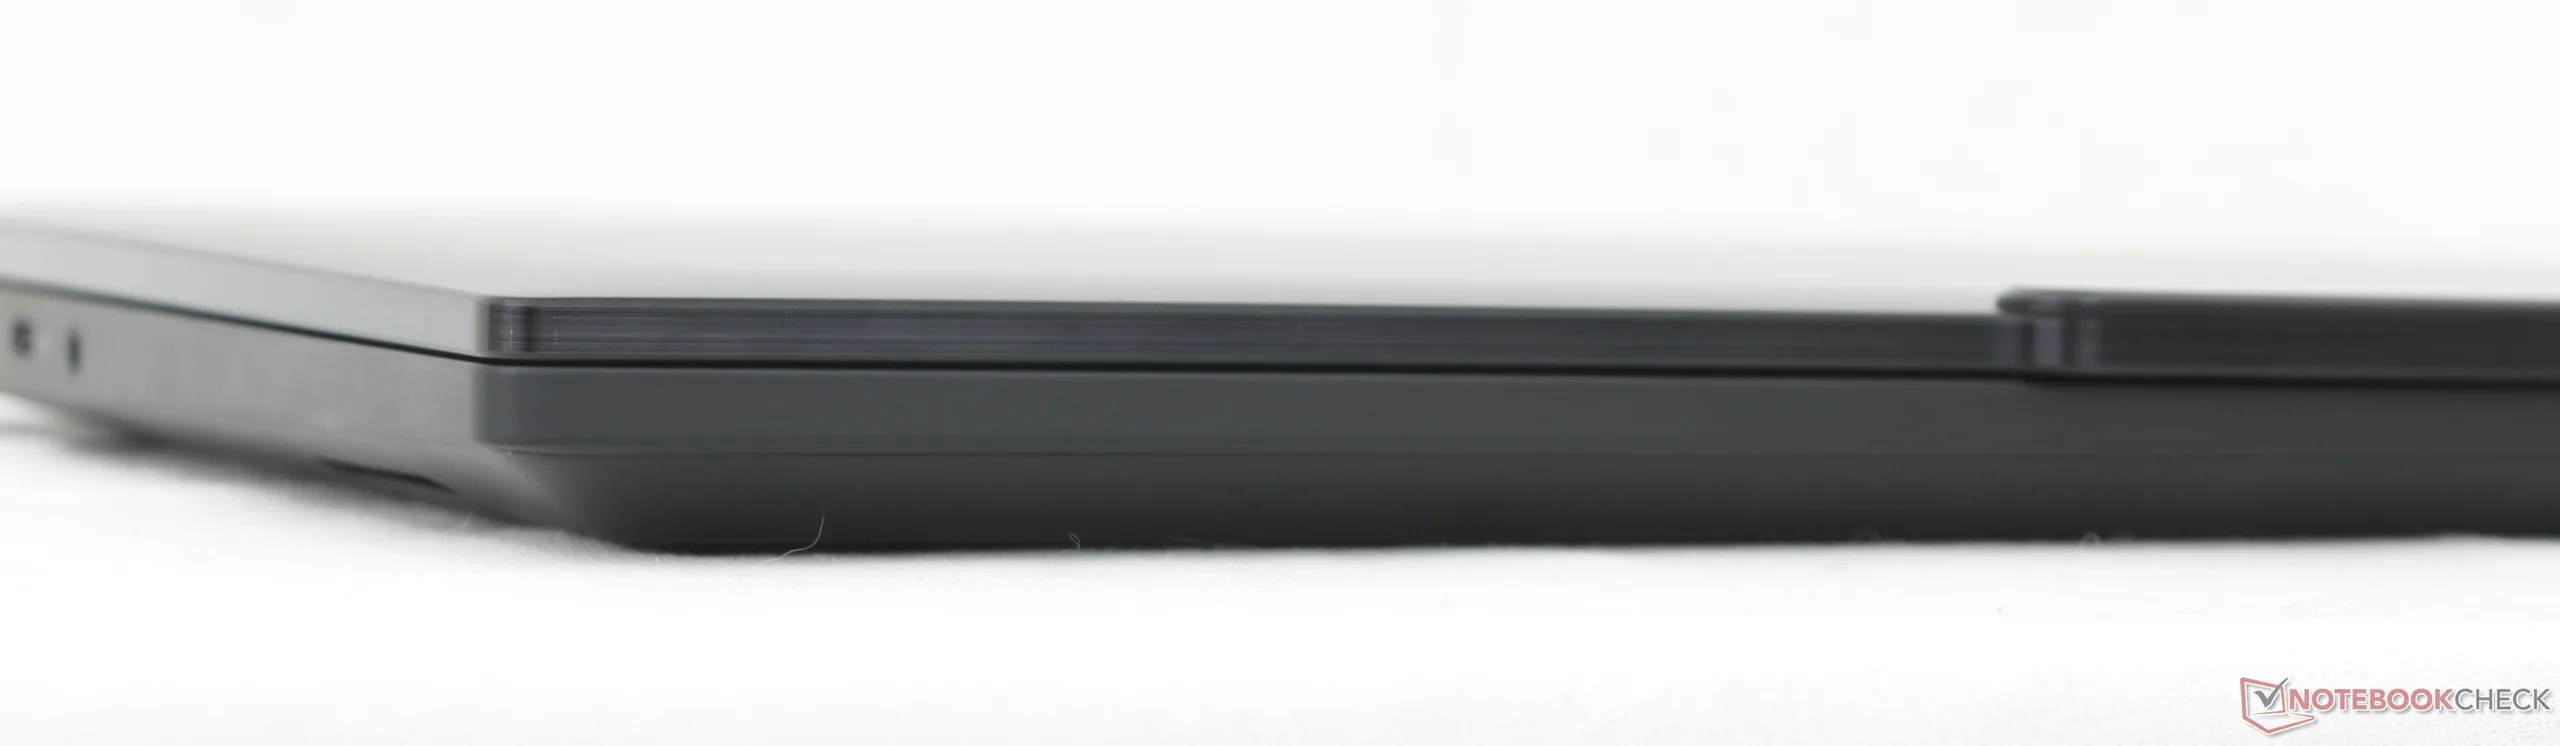
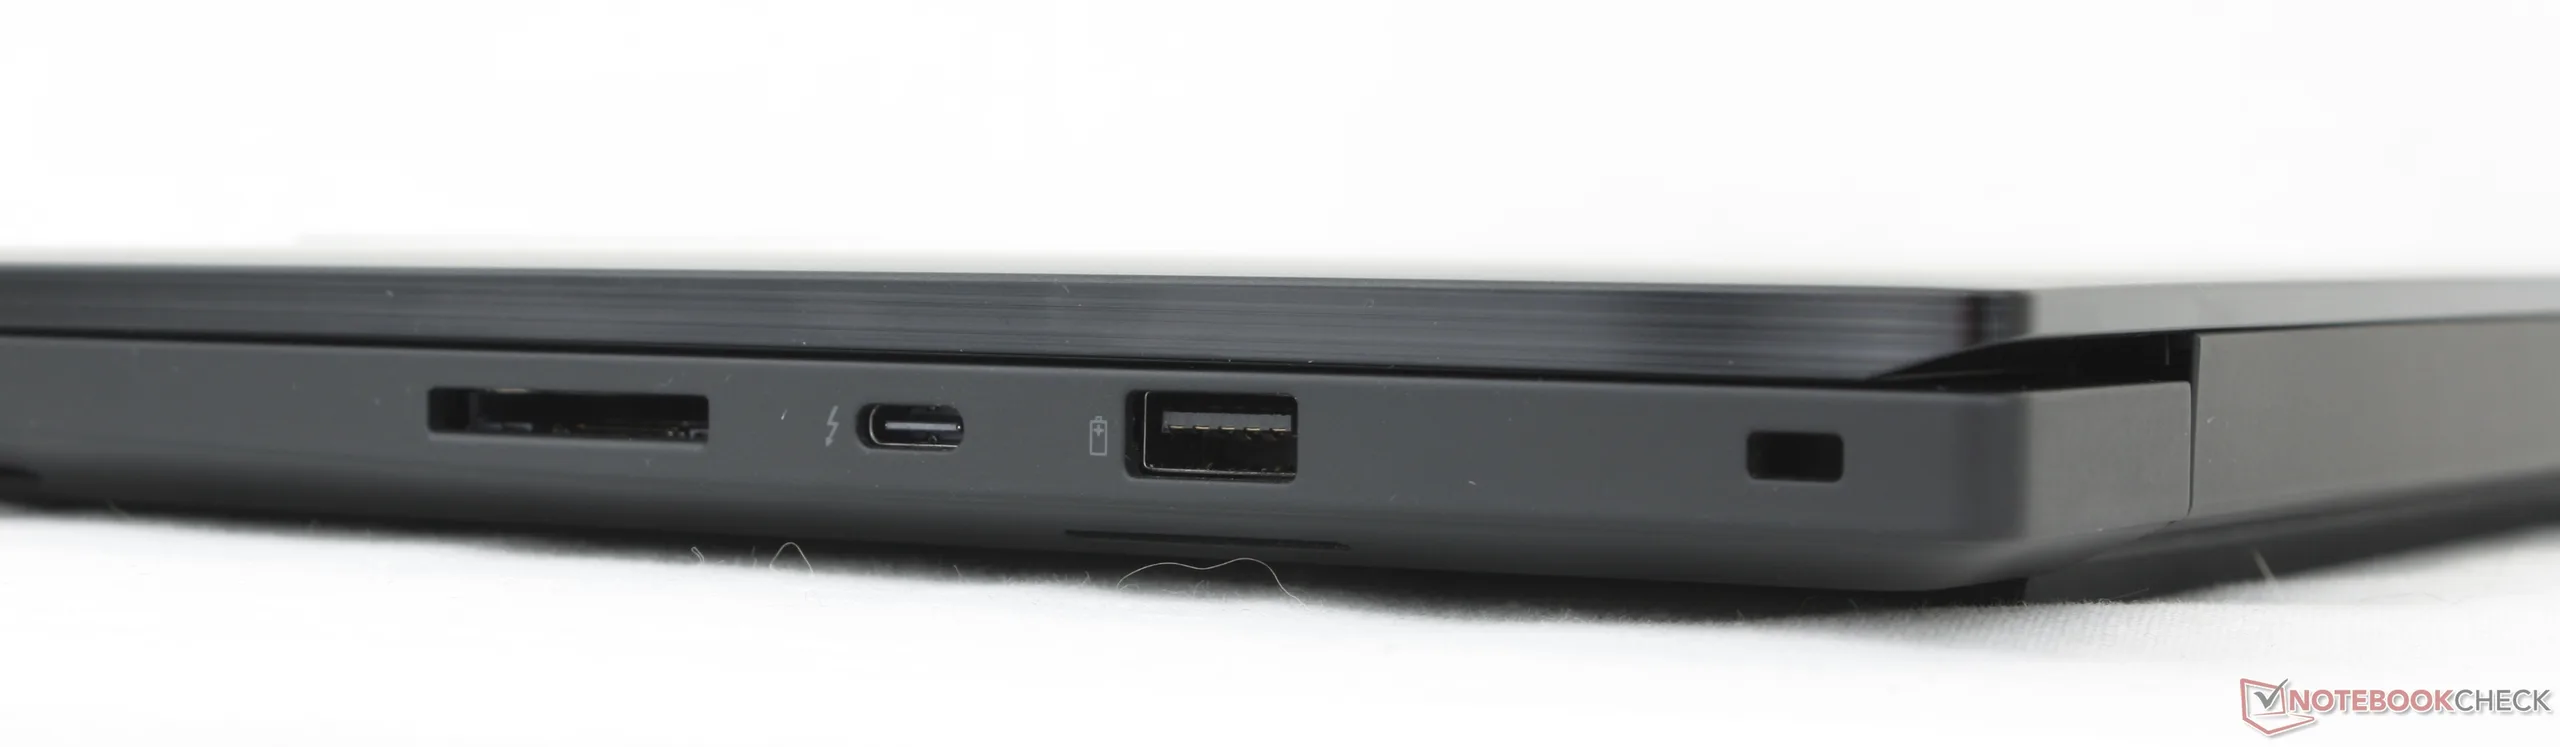
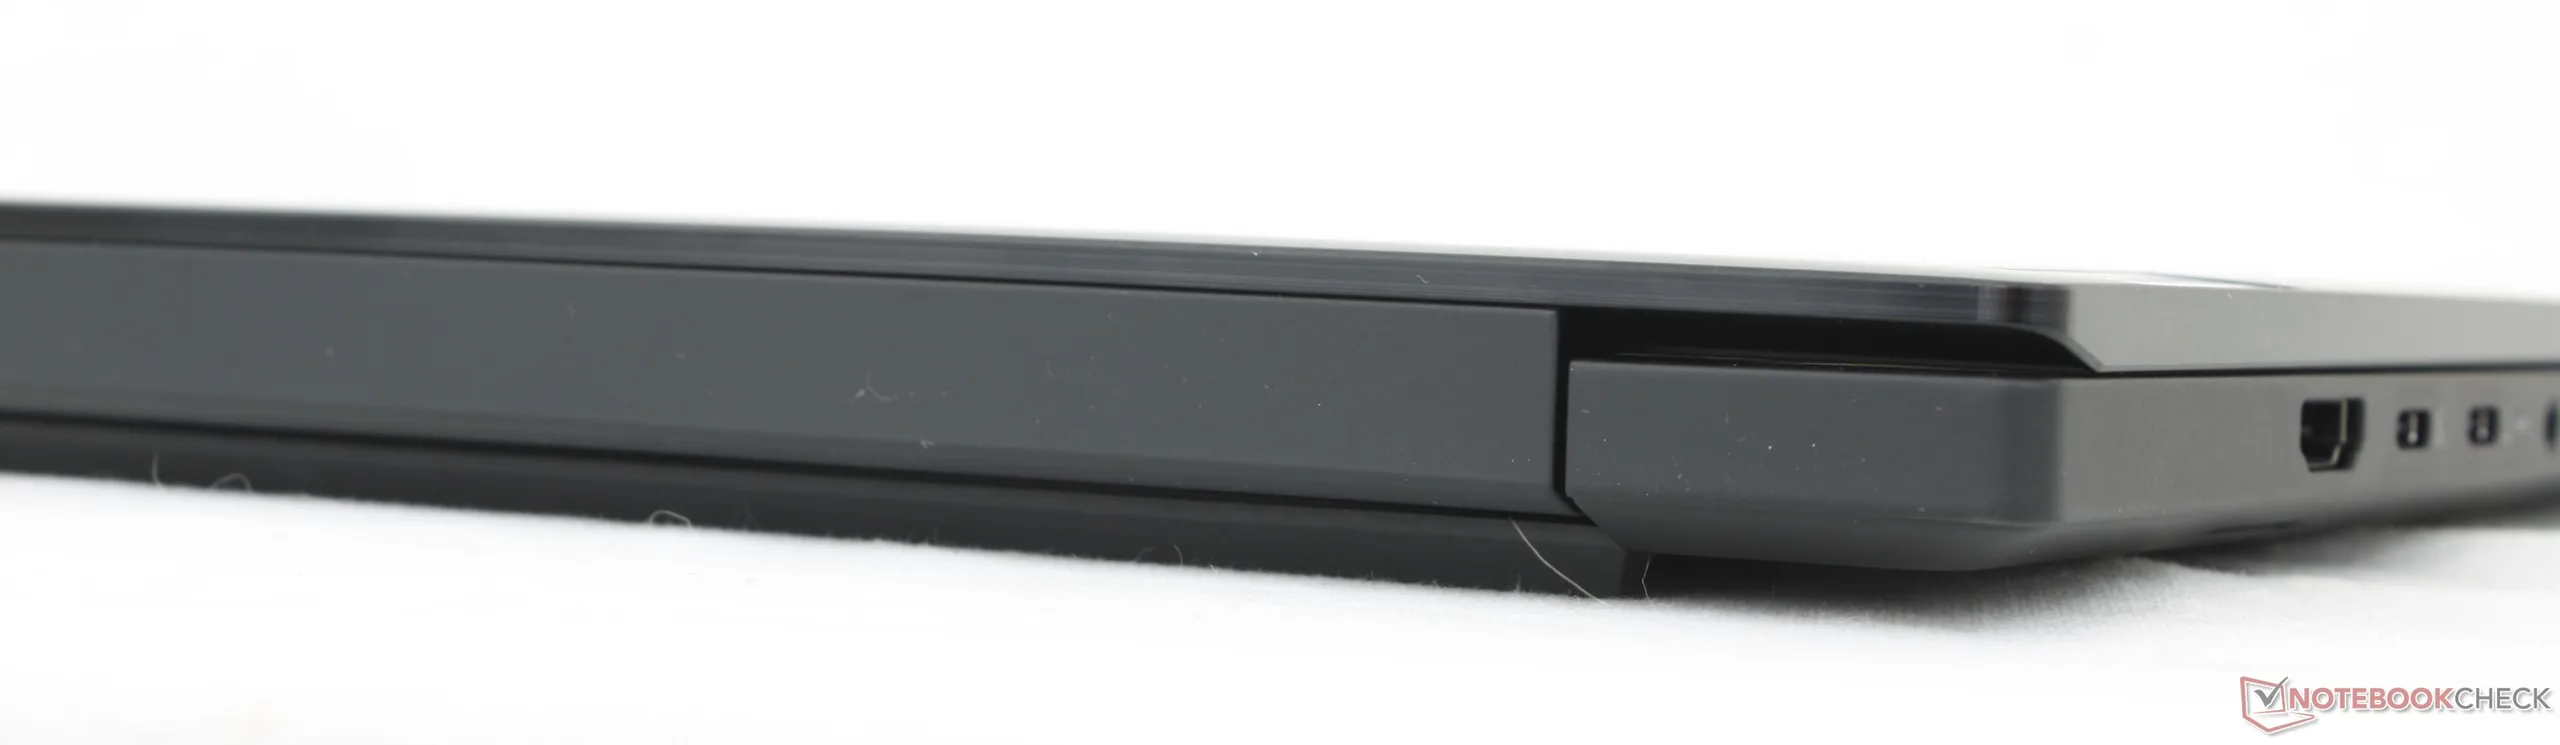
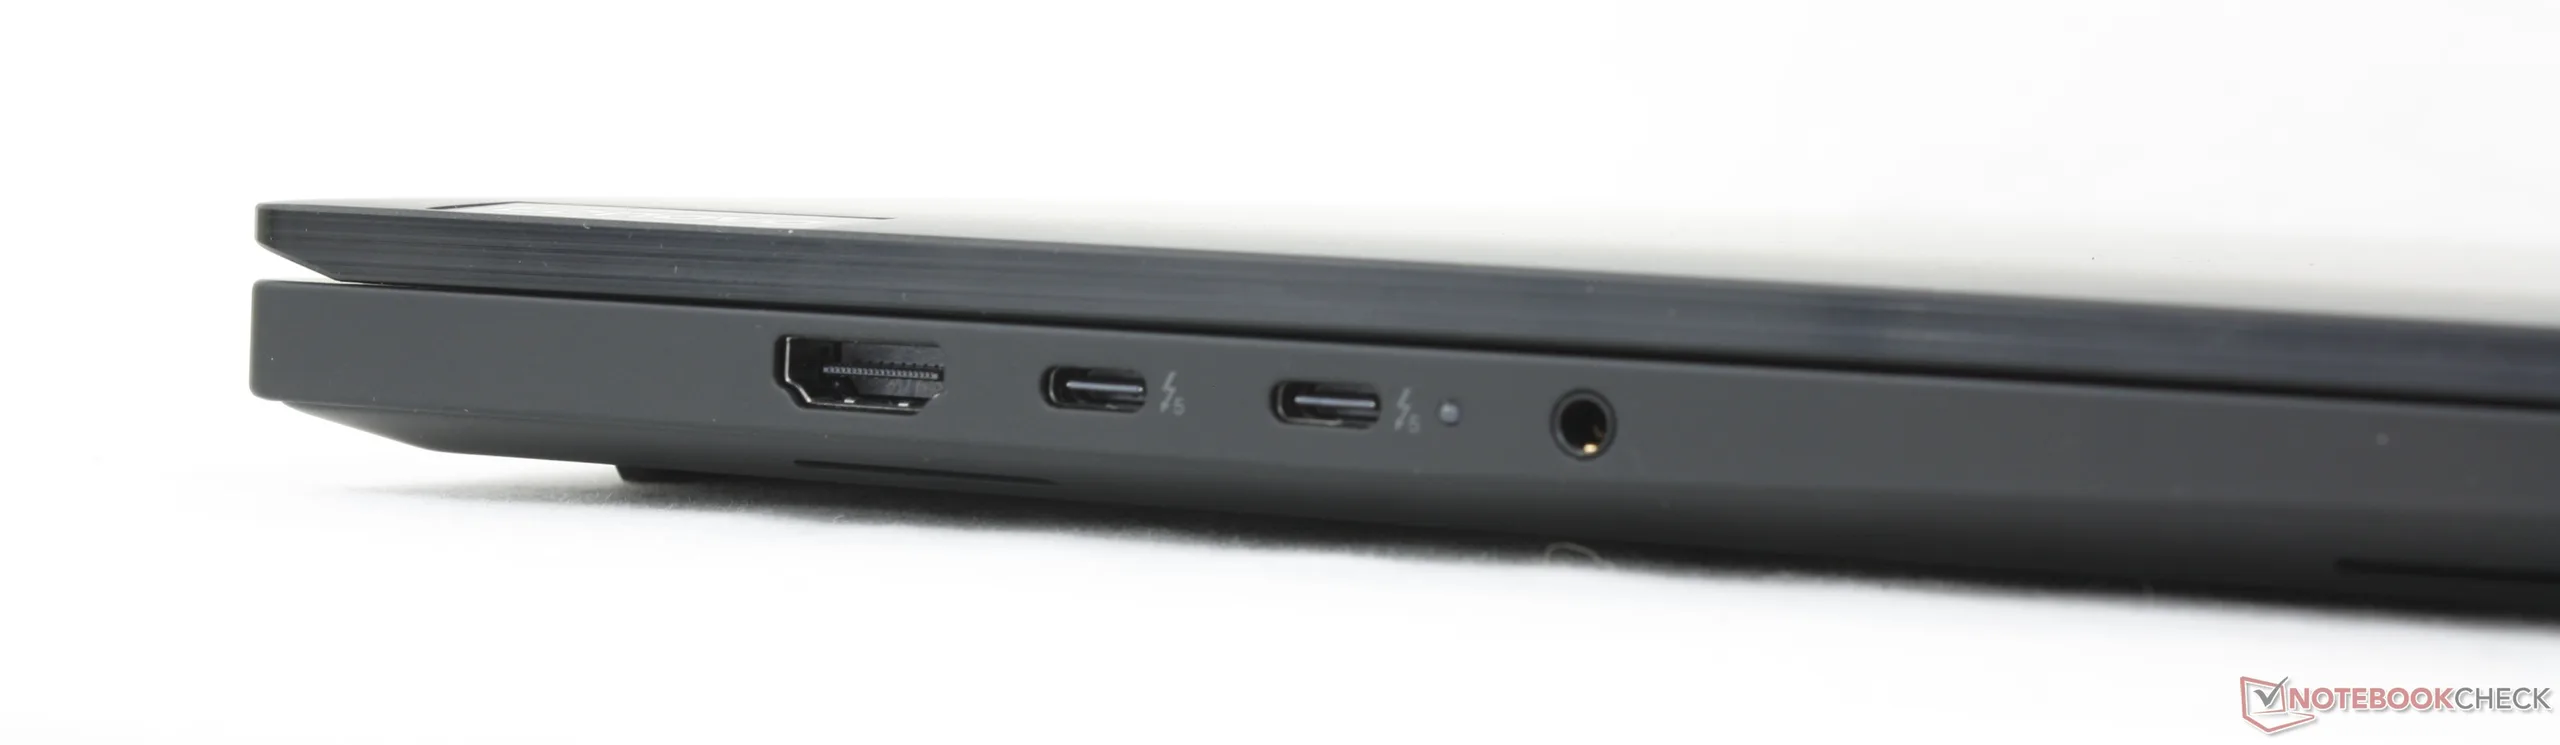
Terwijl het chassis en de afmetingen hetzelfde blijven als voorheen, introduceert het Gen 8-model een paar opmerkelijke poortwijzigingen ten opzichte van Gen 7. Ondersteuning voor Thunderbolt 5 is nu aanwezig, terwijl de eigen AC-adapterpoort is komen te vervallen ten gunste van USB-C voor alleen de stroomvoorziening. Een van de drie USB-C poorten zal dus altijd bezet zijn voor de voeding van de netstroomadapter, terwijl dit bij het model van vorig jaar niet het geval was.
Connectiviteit
SD-kaartlezer
| SD Card Reader | |
| average JPG Copy Test (av. of 3 runs) | |
| HP ZBook X G1i 16 (Toshiba Exceria Pro SDXC 64 GB UHS-II) | |
| Lenovo ThinkPad P1 Gen 8 (Toshiba Exceria Pro SDXC 64 GB UHS-II) | |
| Dell Pro Max 16 Plus (Toshiba Exceria Pro SDXC 64 GB UHS-II) | |
| Lenovo ThinkPad P1 Gen 7 21KV001SGE (AV Pro V60) | |
| maximum AS SSD Seq Read Test (1GB) | |
| HP ZBook X G1i 16 (Toshiba Exceria Pro SDXC 64 GB UHS-II) | |
| Dell Pro Max 16 Plus (Toshiba Exceria Pro SDXC 64 GB UHS-II) | |
| Lenovo ThinkPad P1 Gen 8 (Toshiba Exceria Pro SDXC 64 GB UHS-II) | |
| Lenovo ThinkPad P1 Gen 7 21KV001SGE (AV Pro V60) | |
Communicatie
Webcam


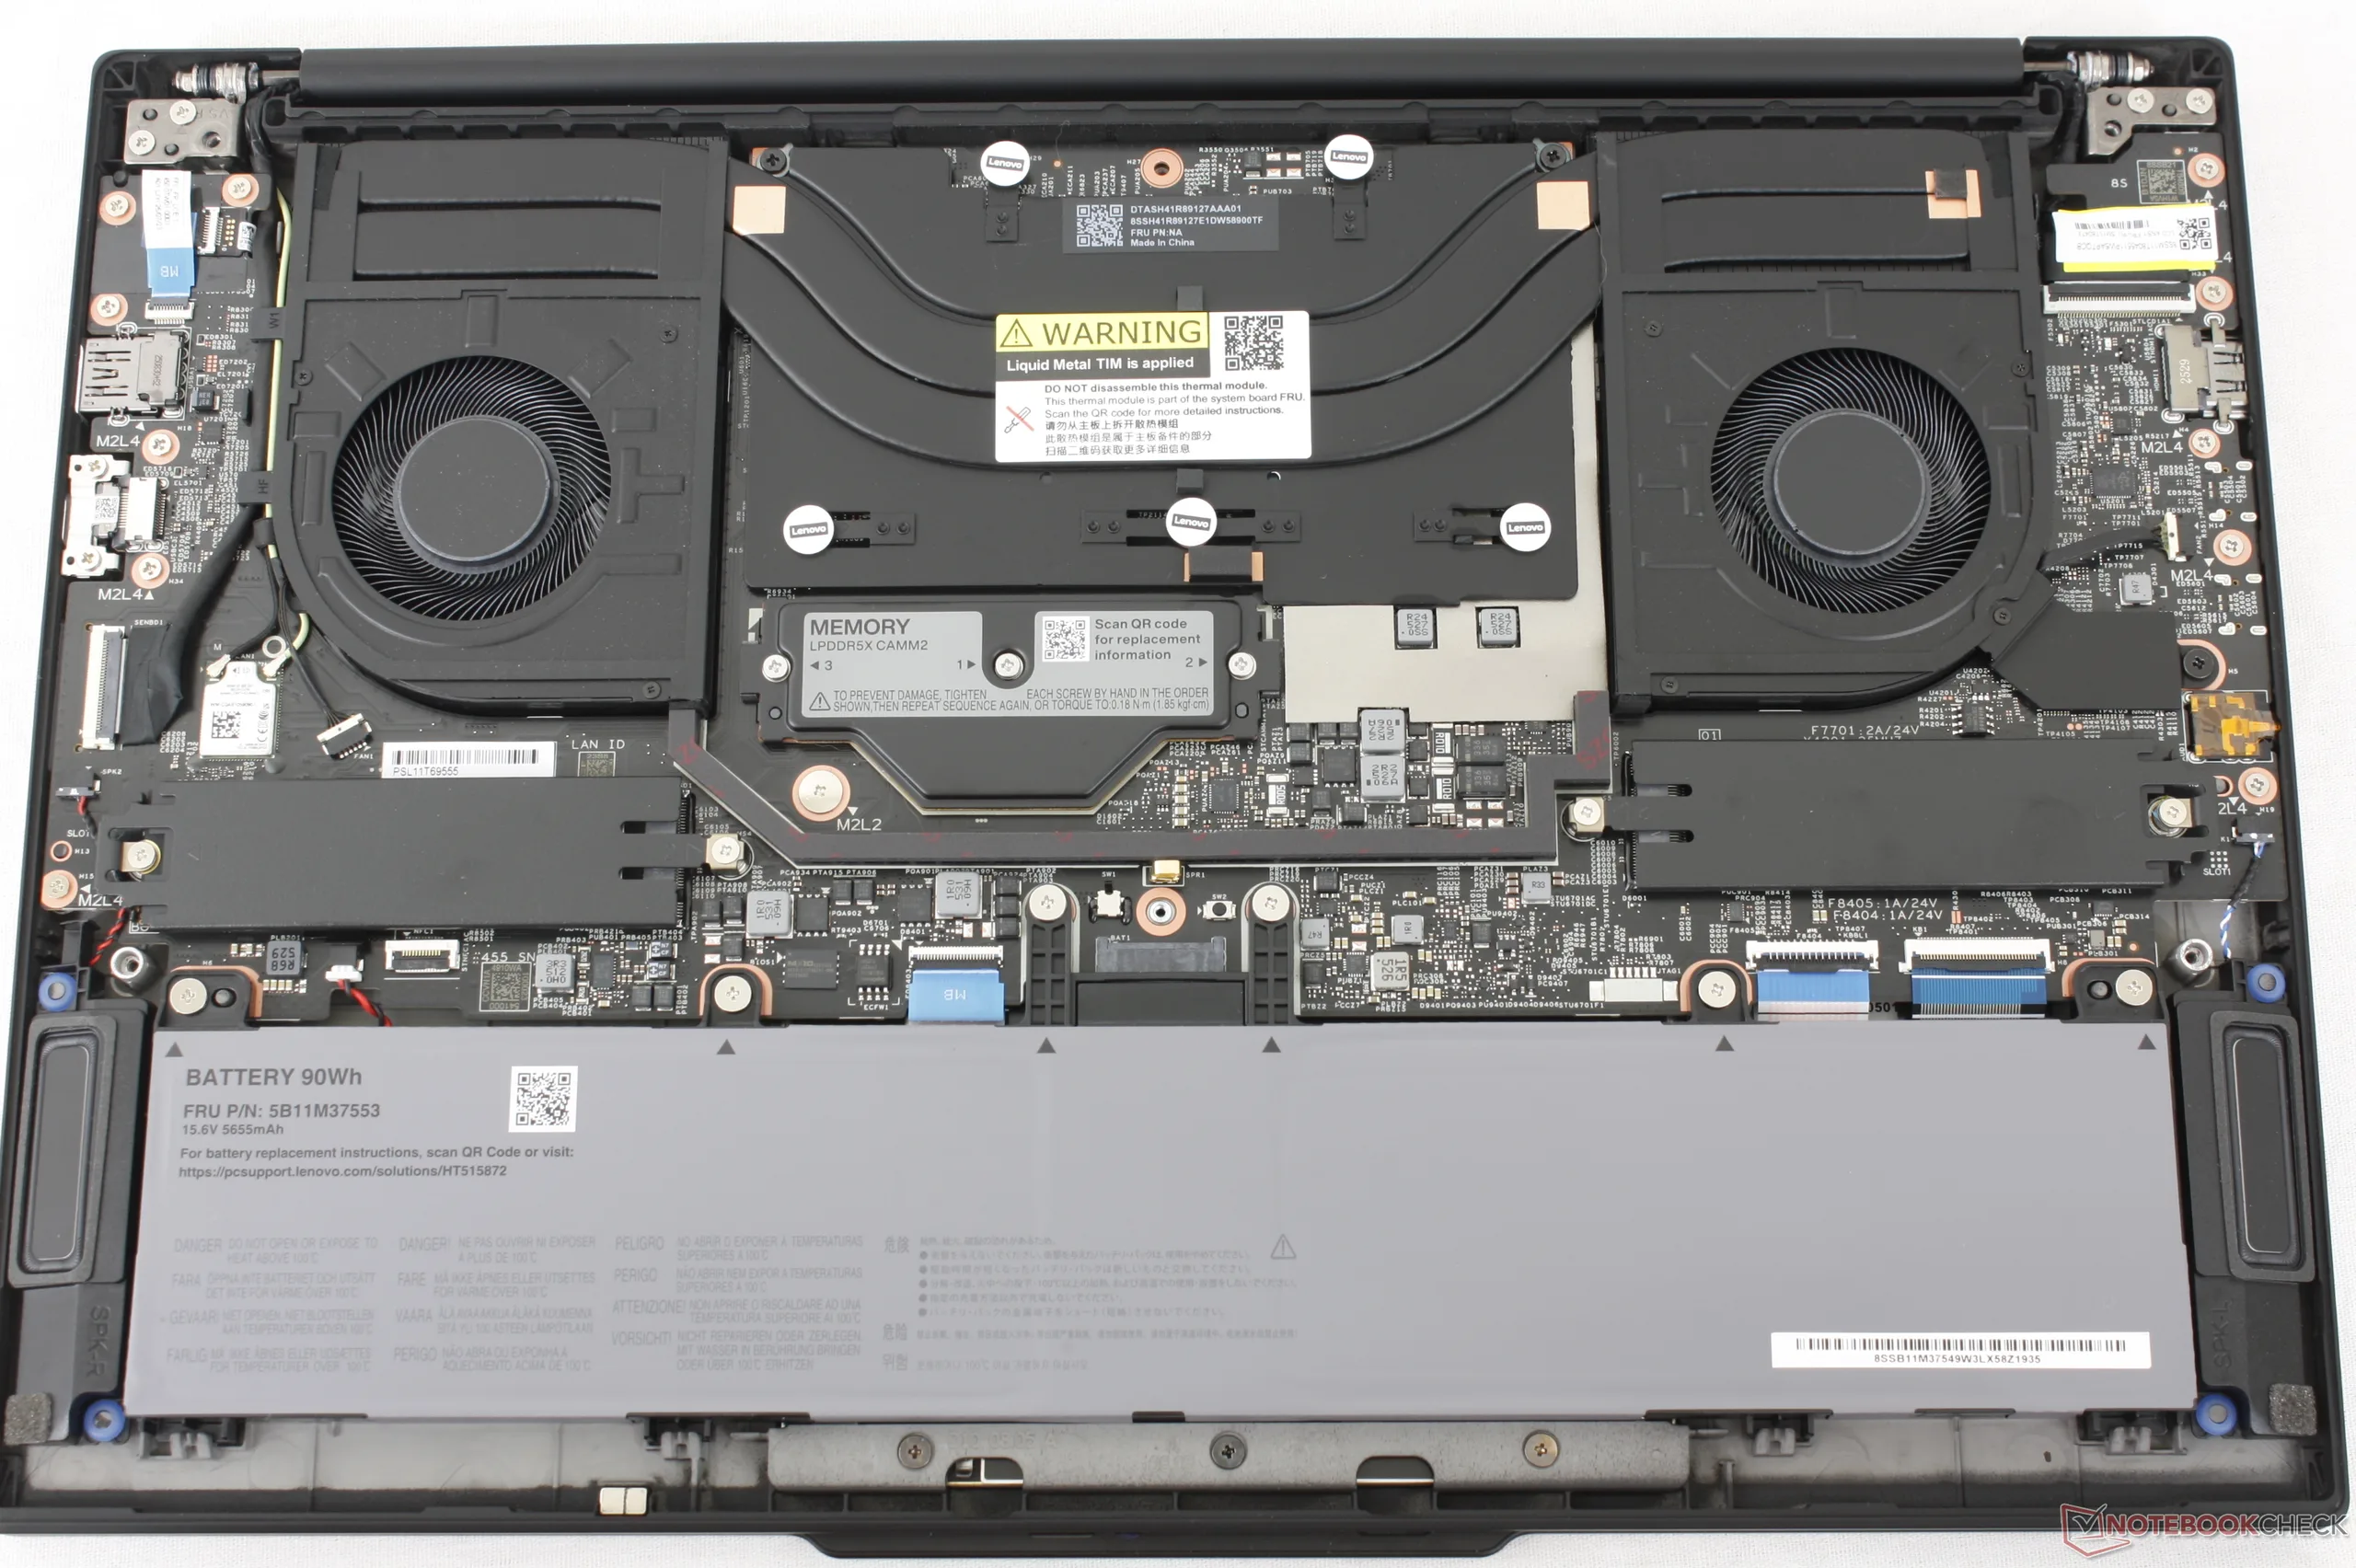
Onderhoud
Duurzaamheid
Het skelet bestaat voor 90 procent uit gerecycled magnesium en aluminium voor de basis van het toetsenbord, voor 55 tot 75 procent uit gerecycled aluminium voor de boven- en onderkant, en voor 50 tot 90 procent uit plastic voor bijna al het andere. De verpakking is ook vrij van plastic.
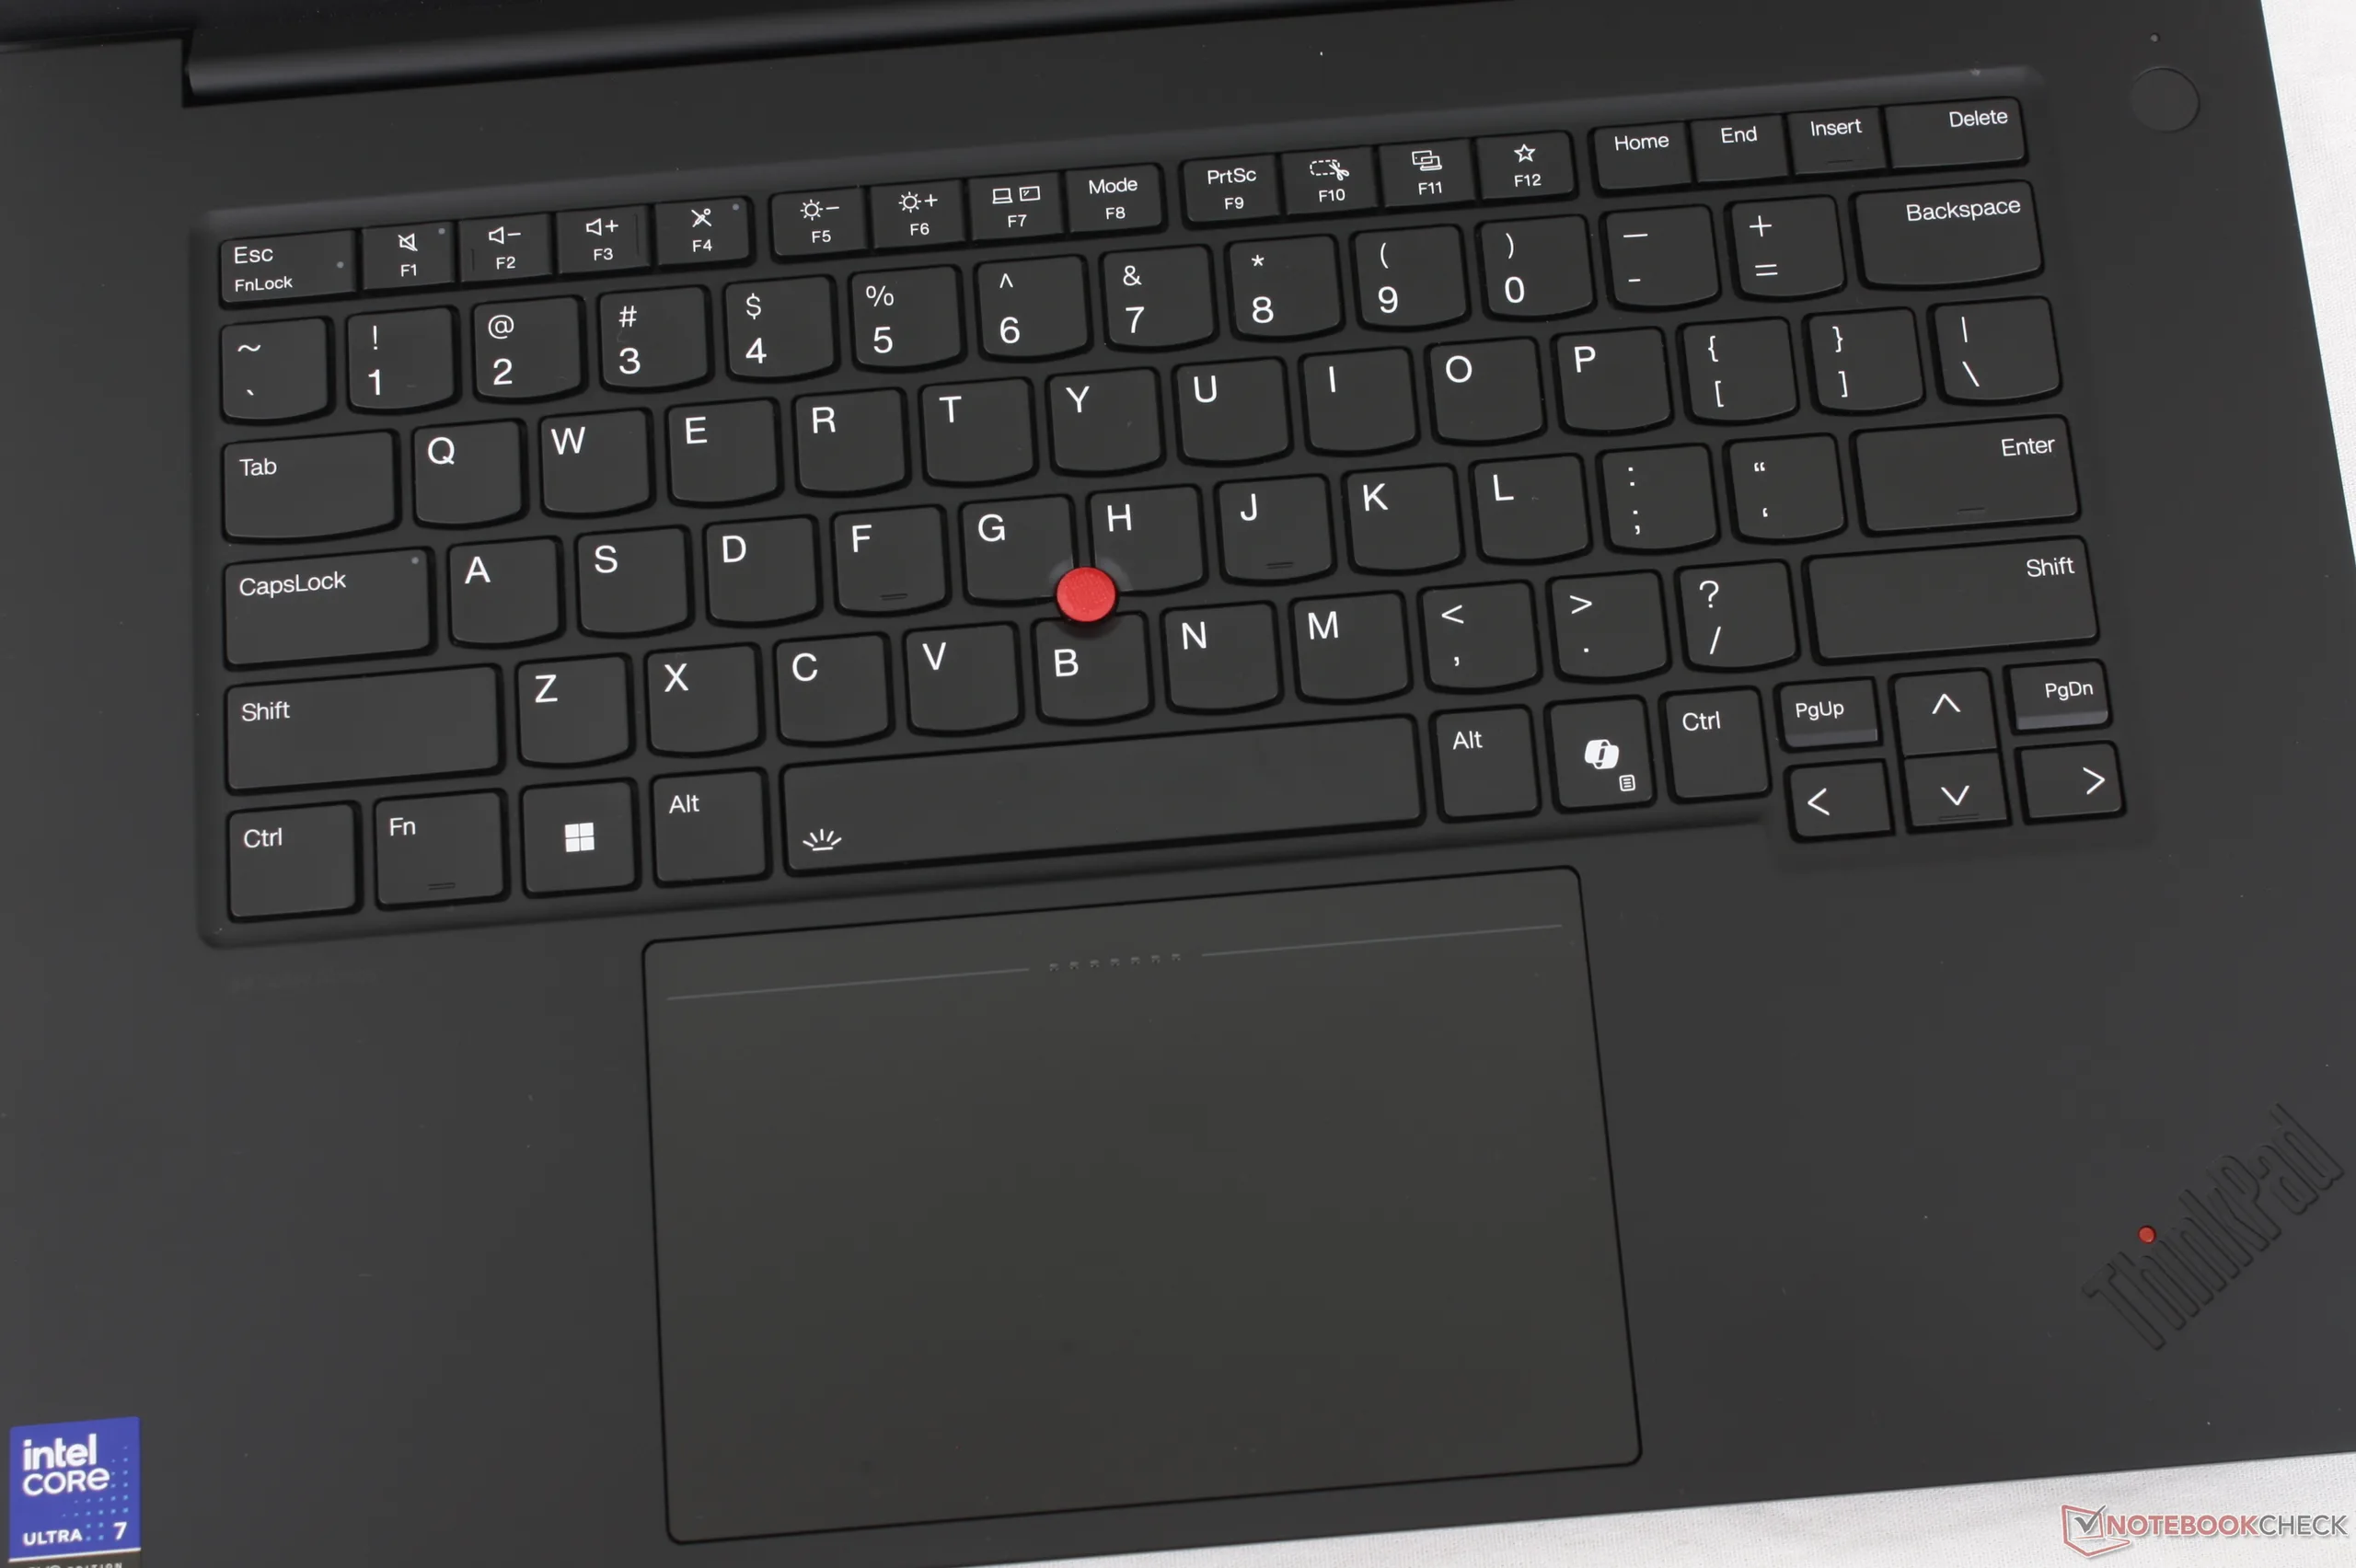
Invoerapparaten
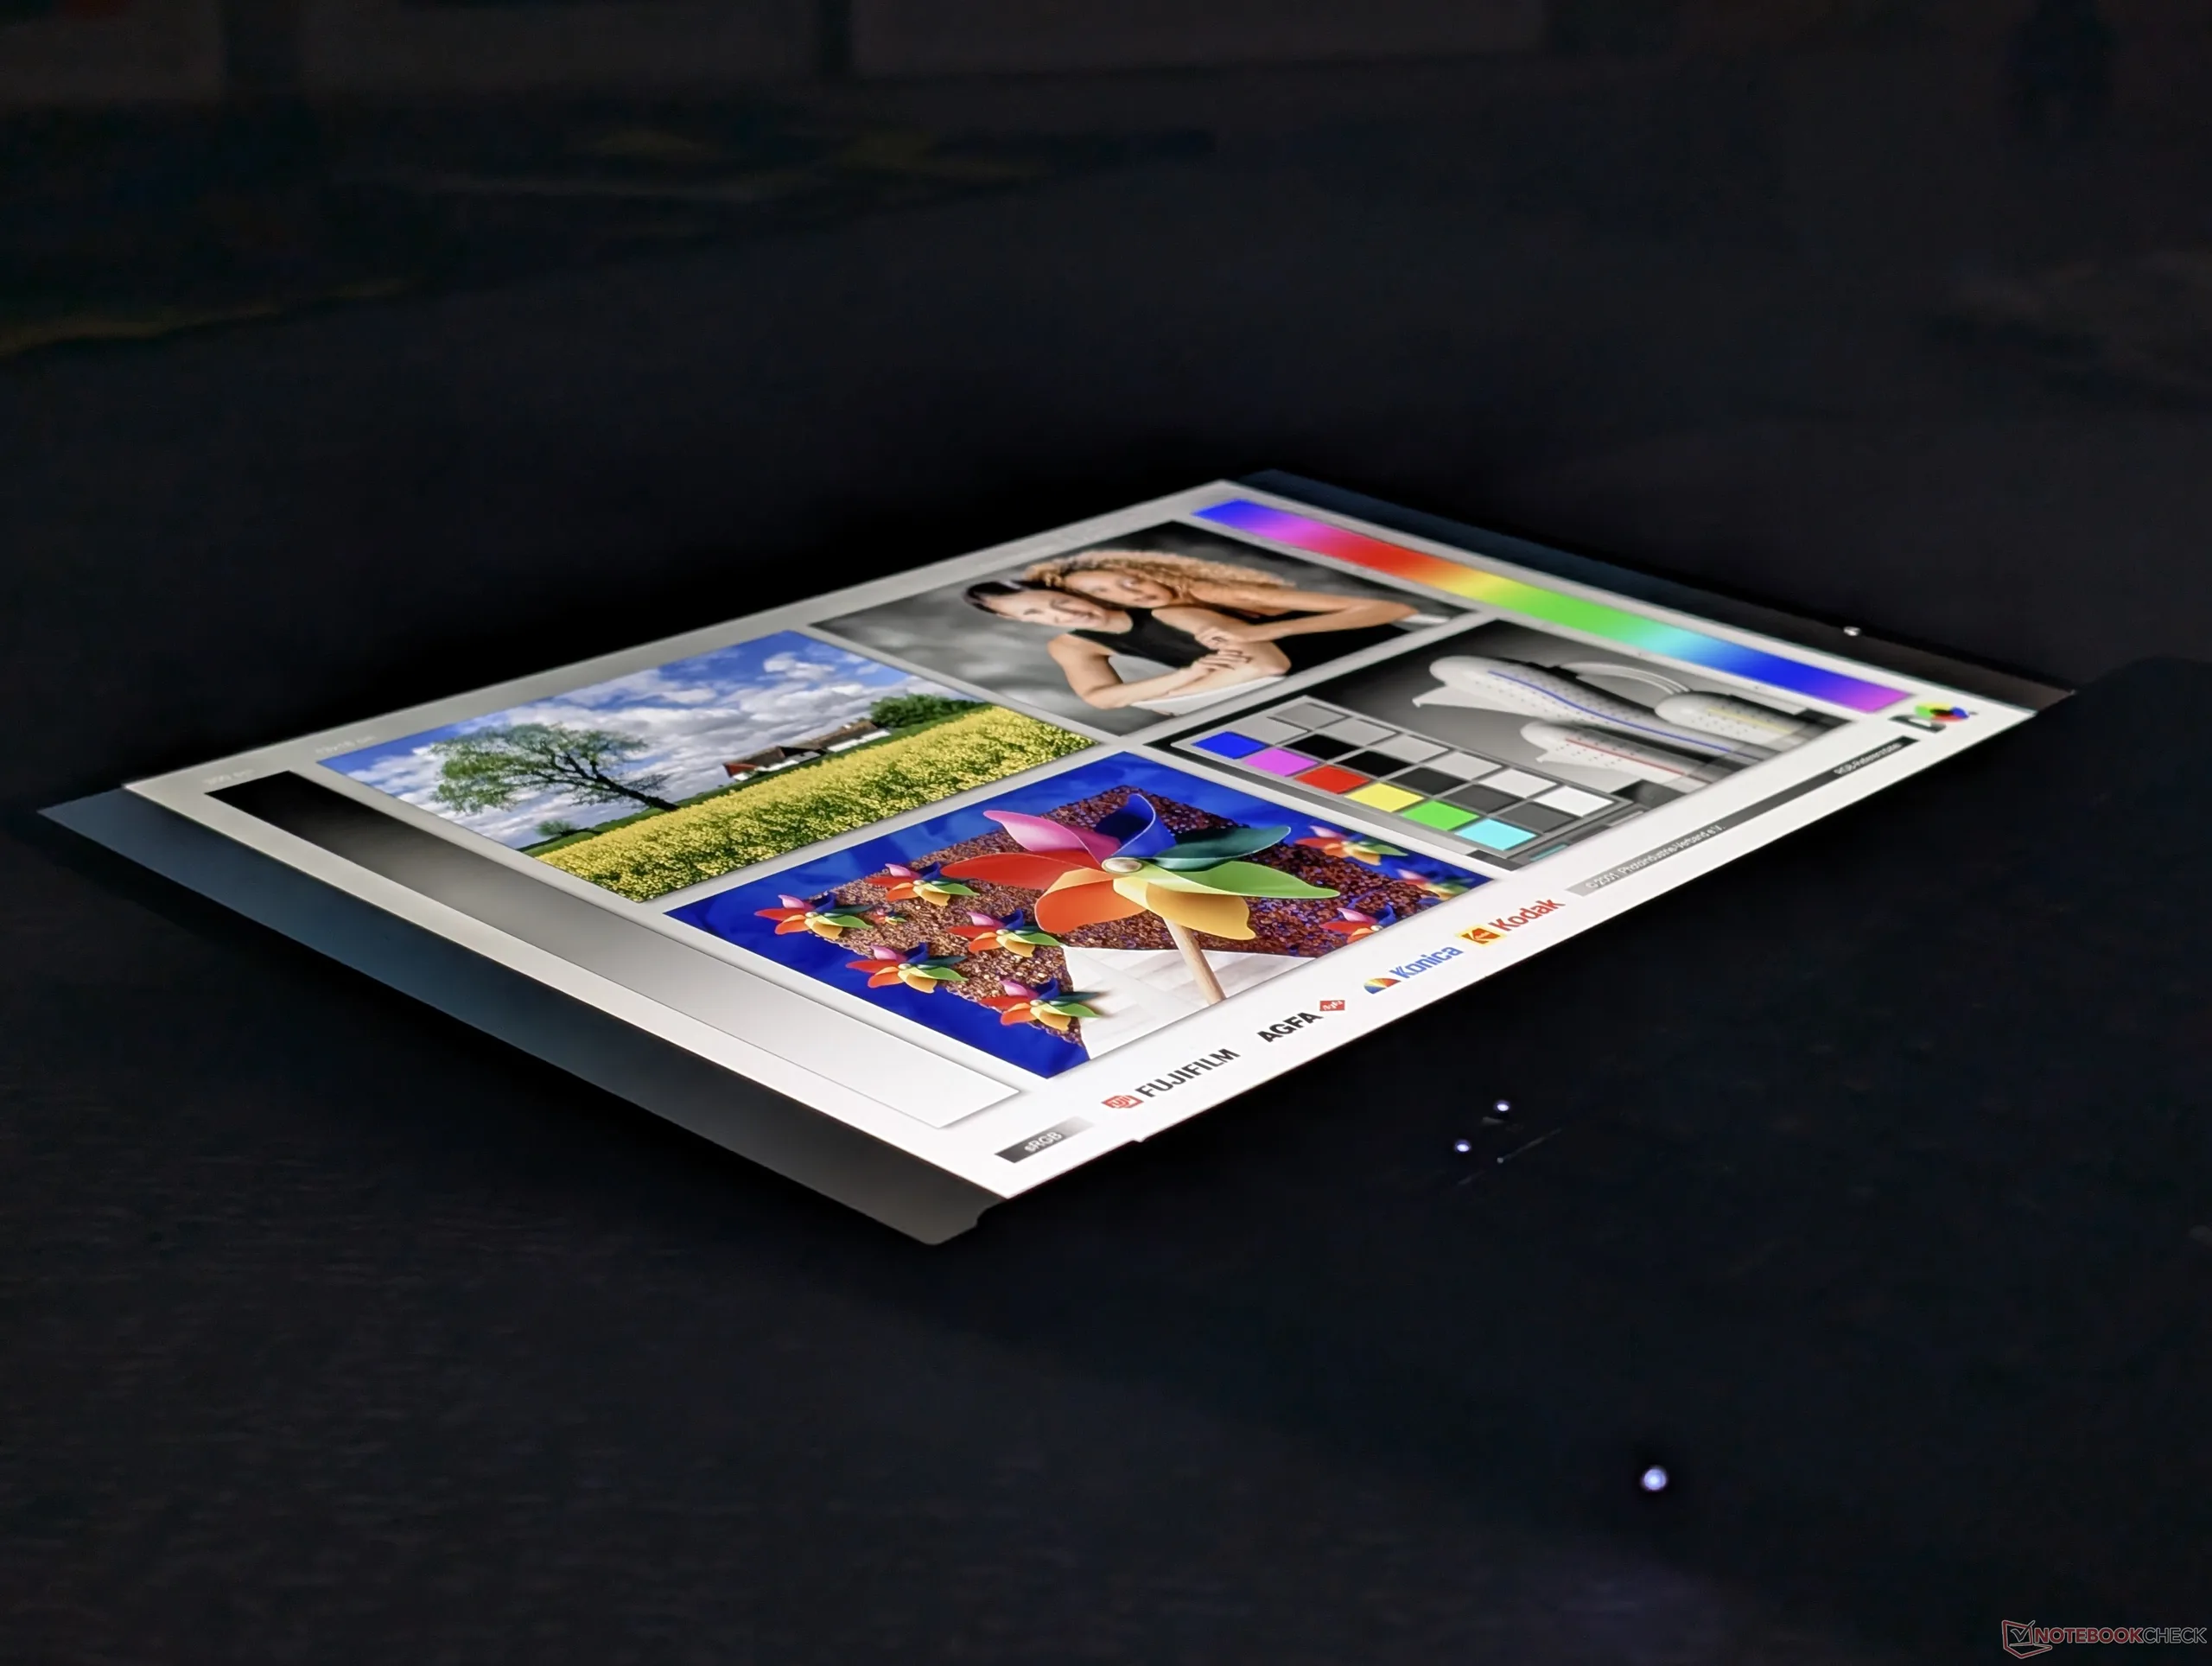
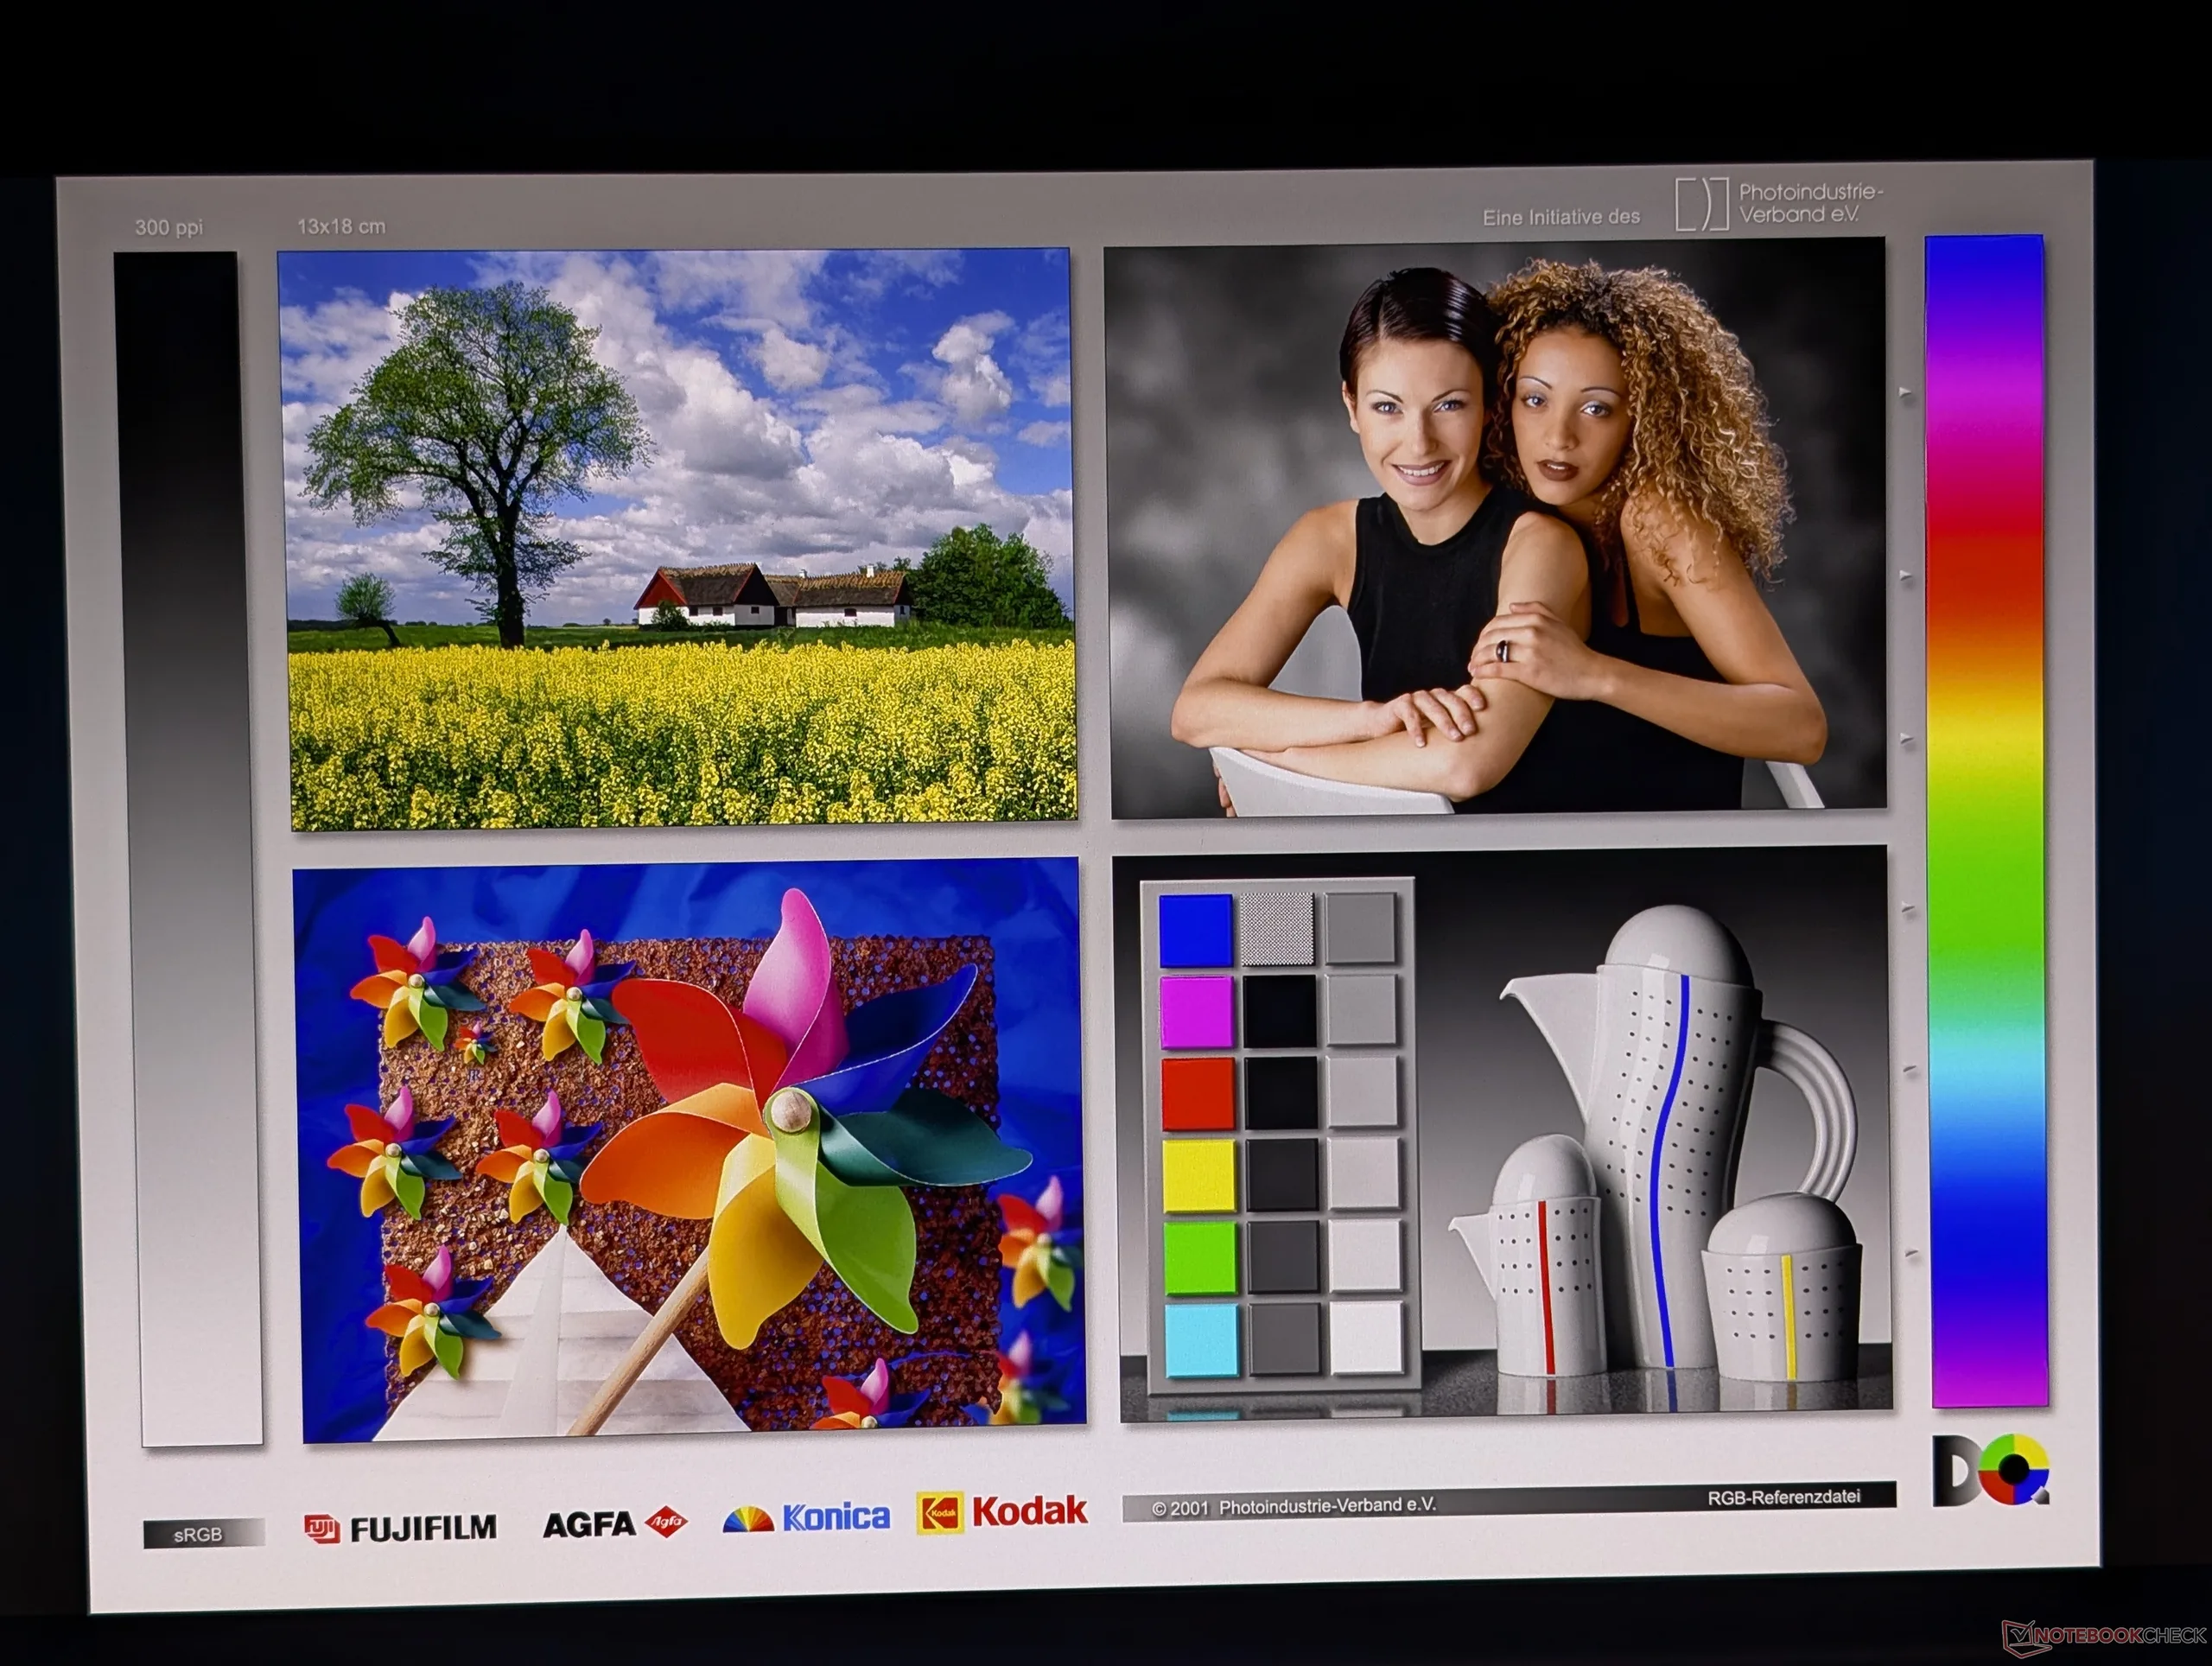
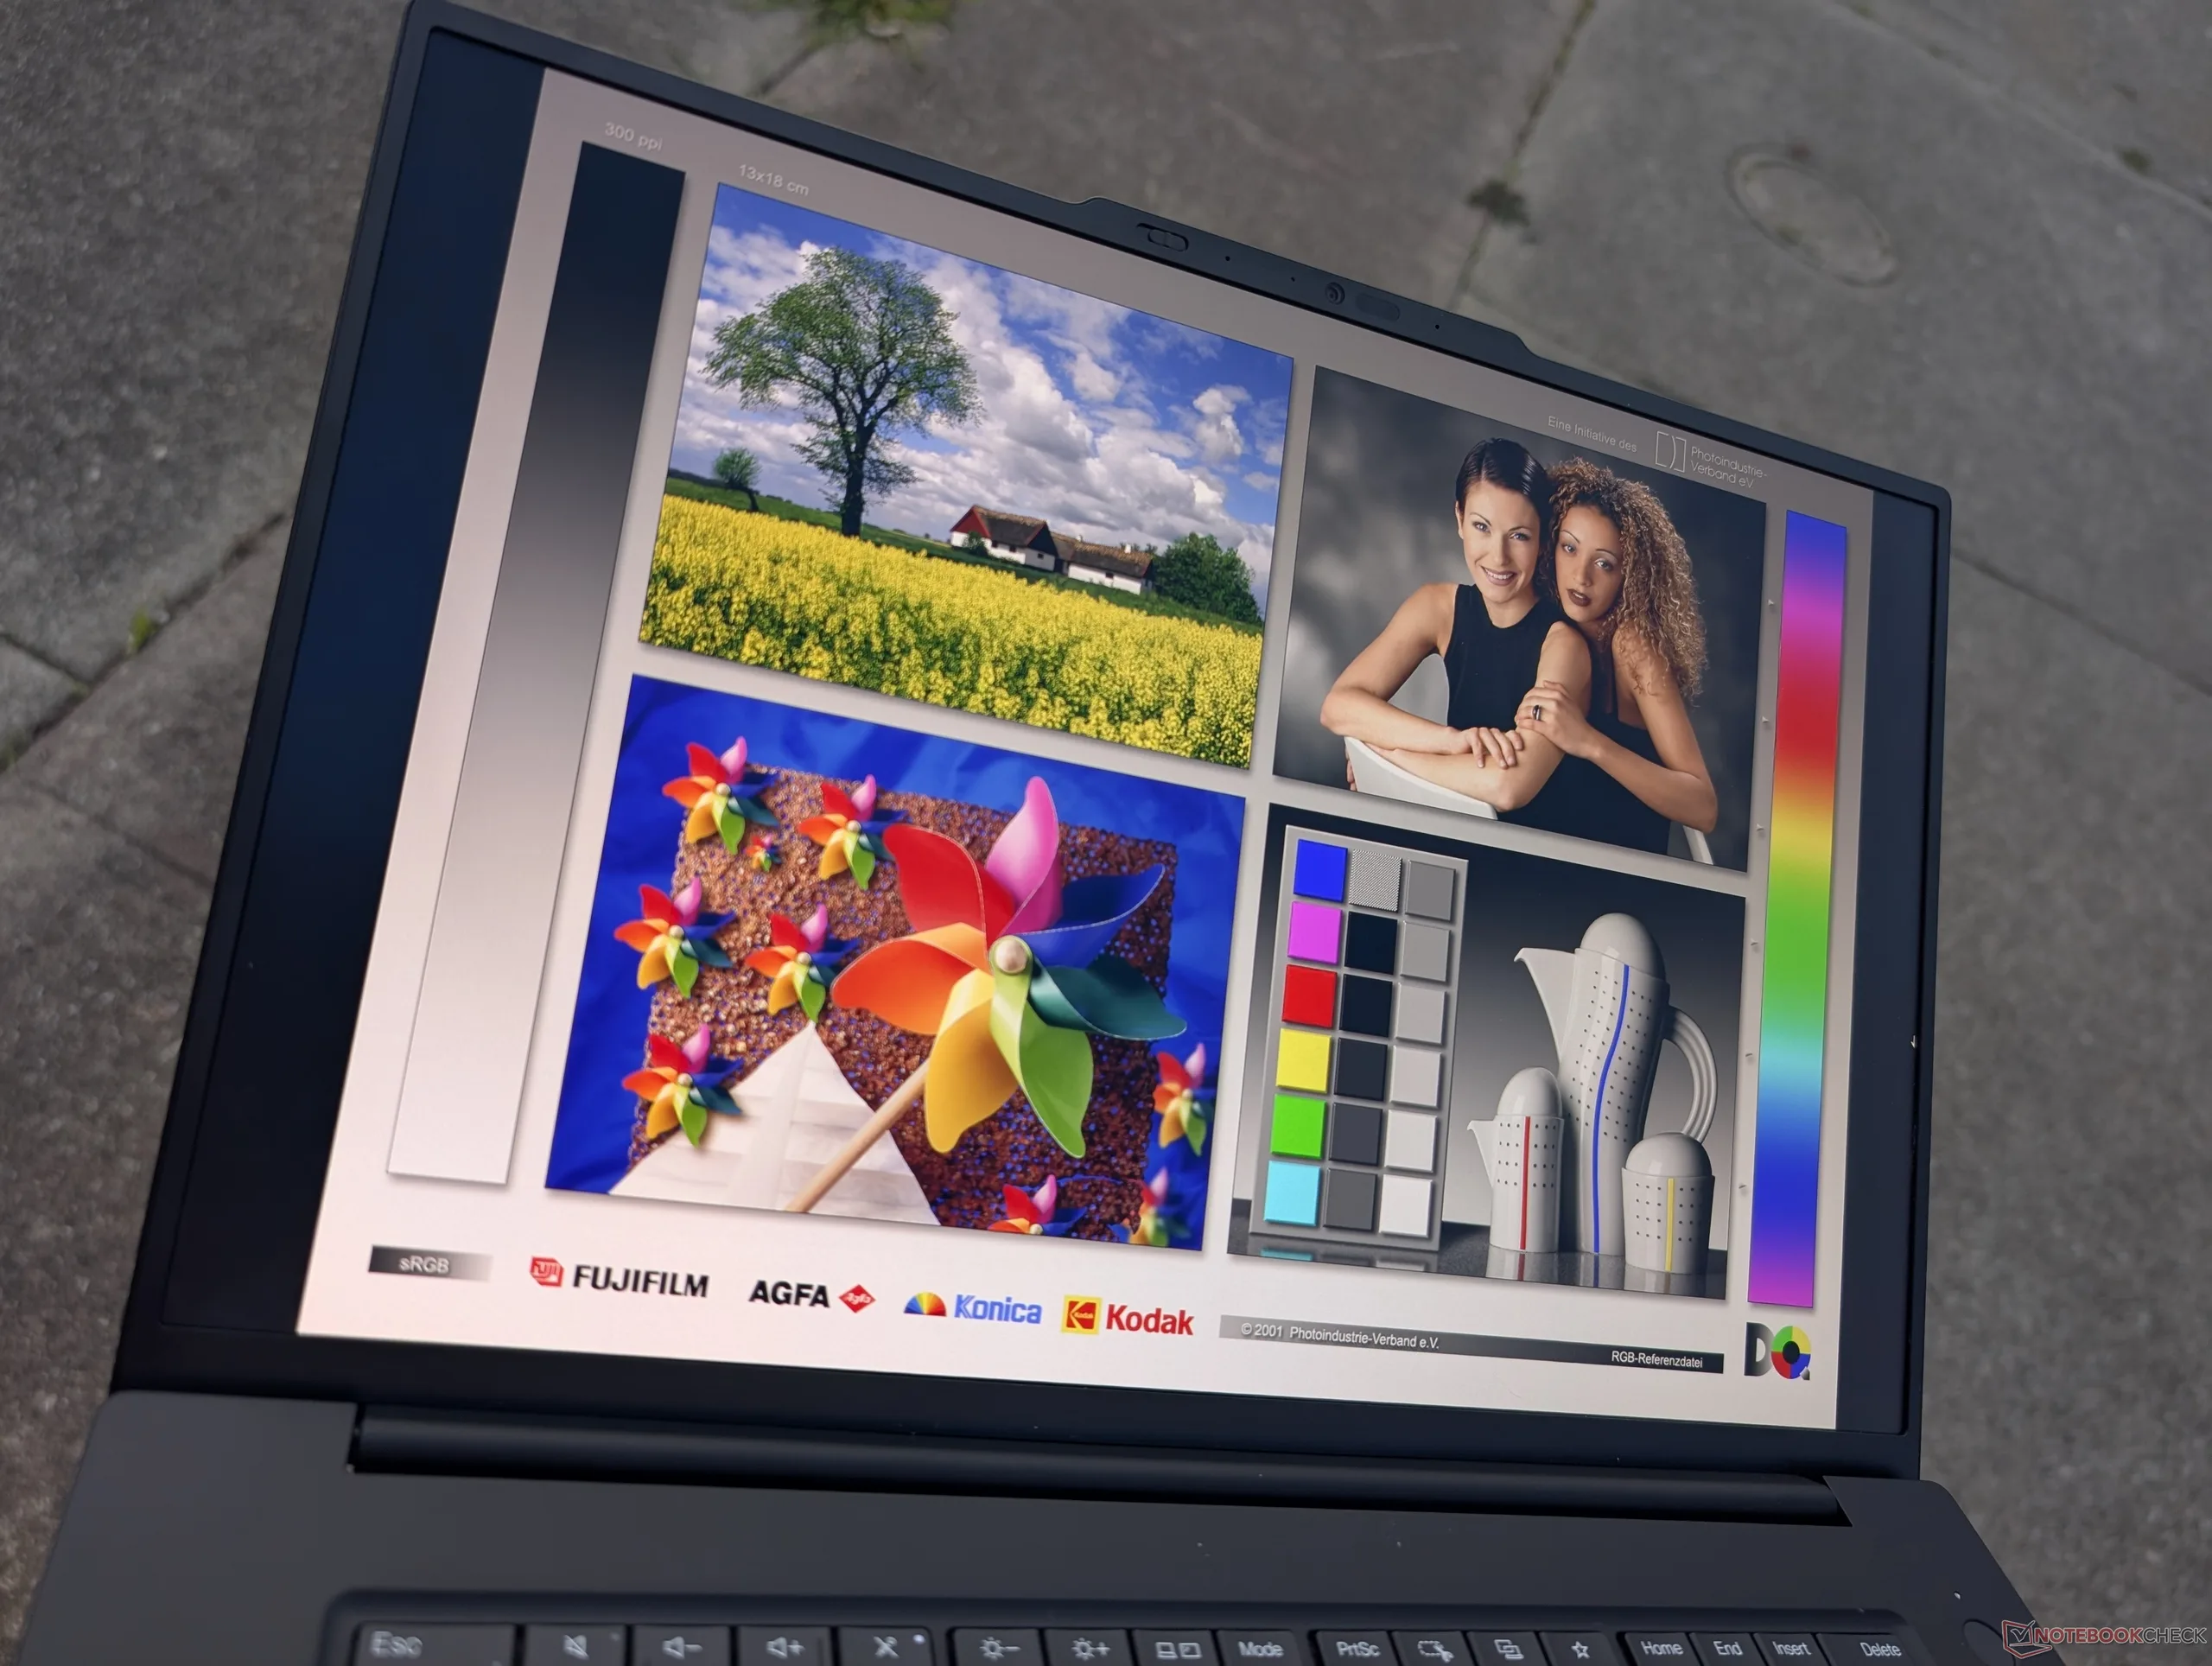
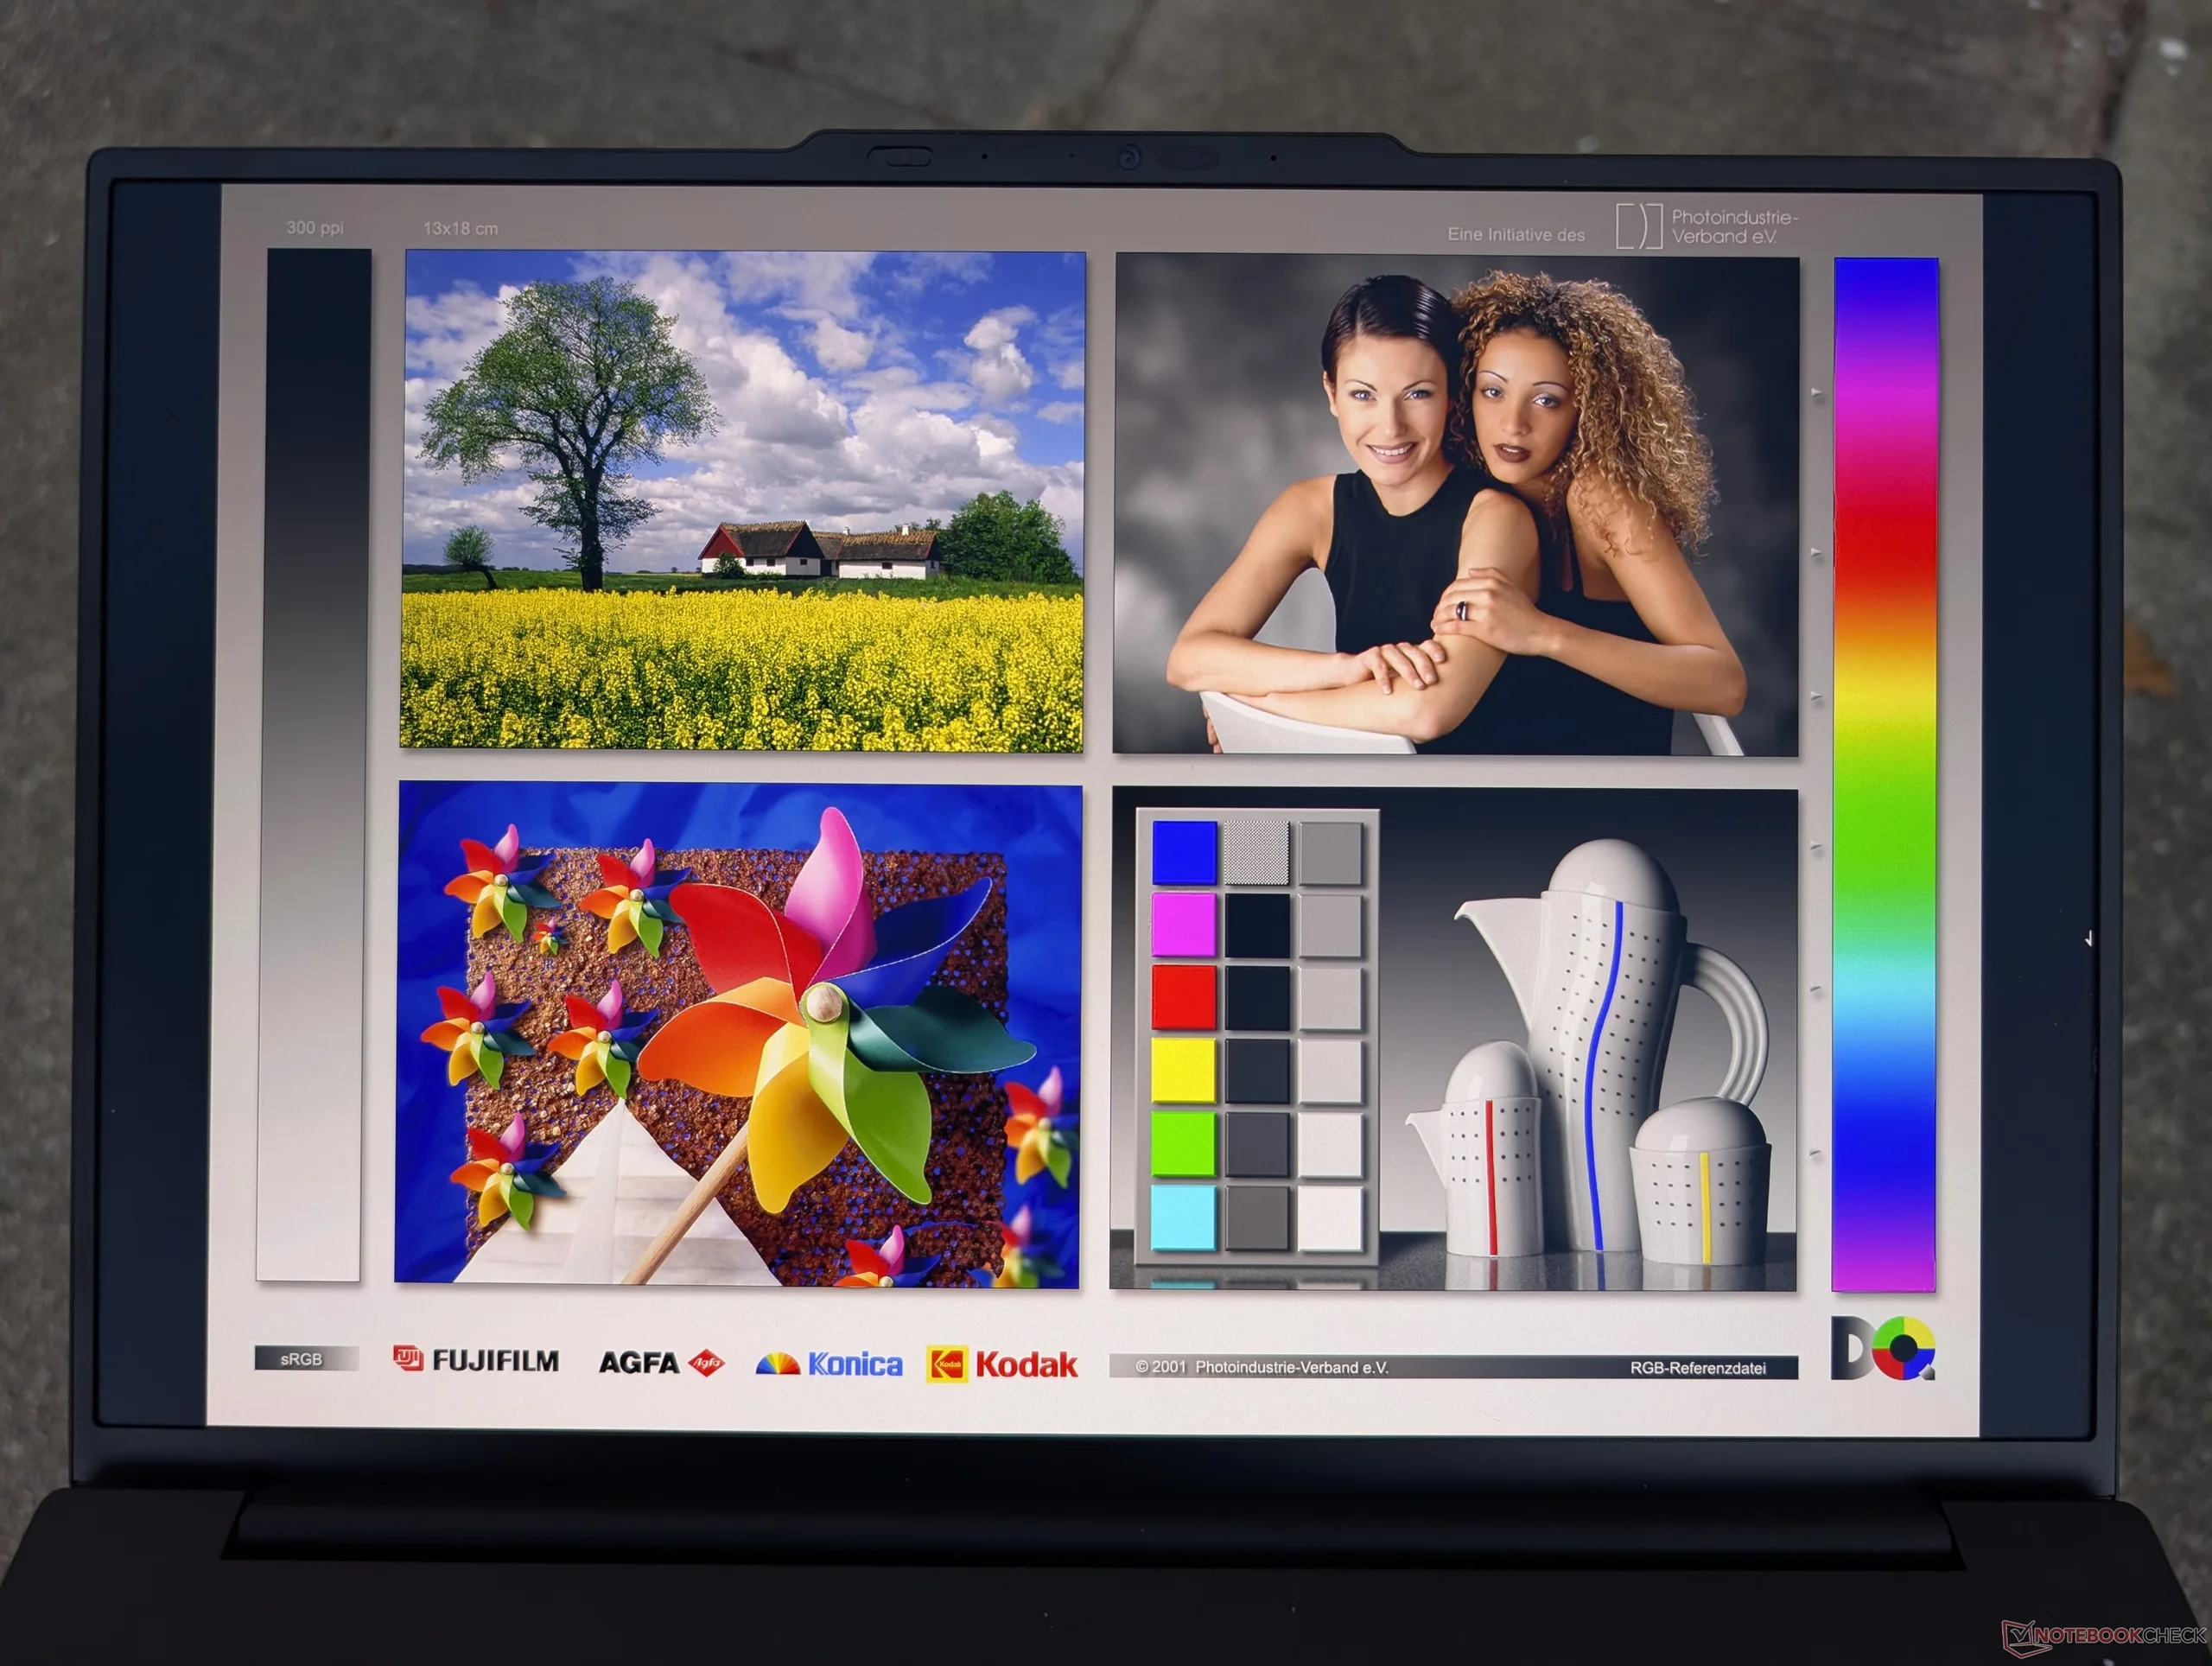
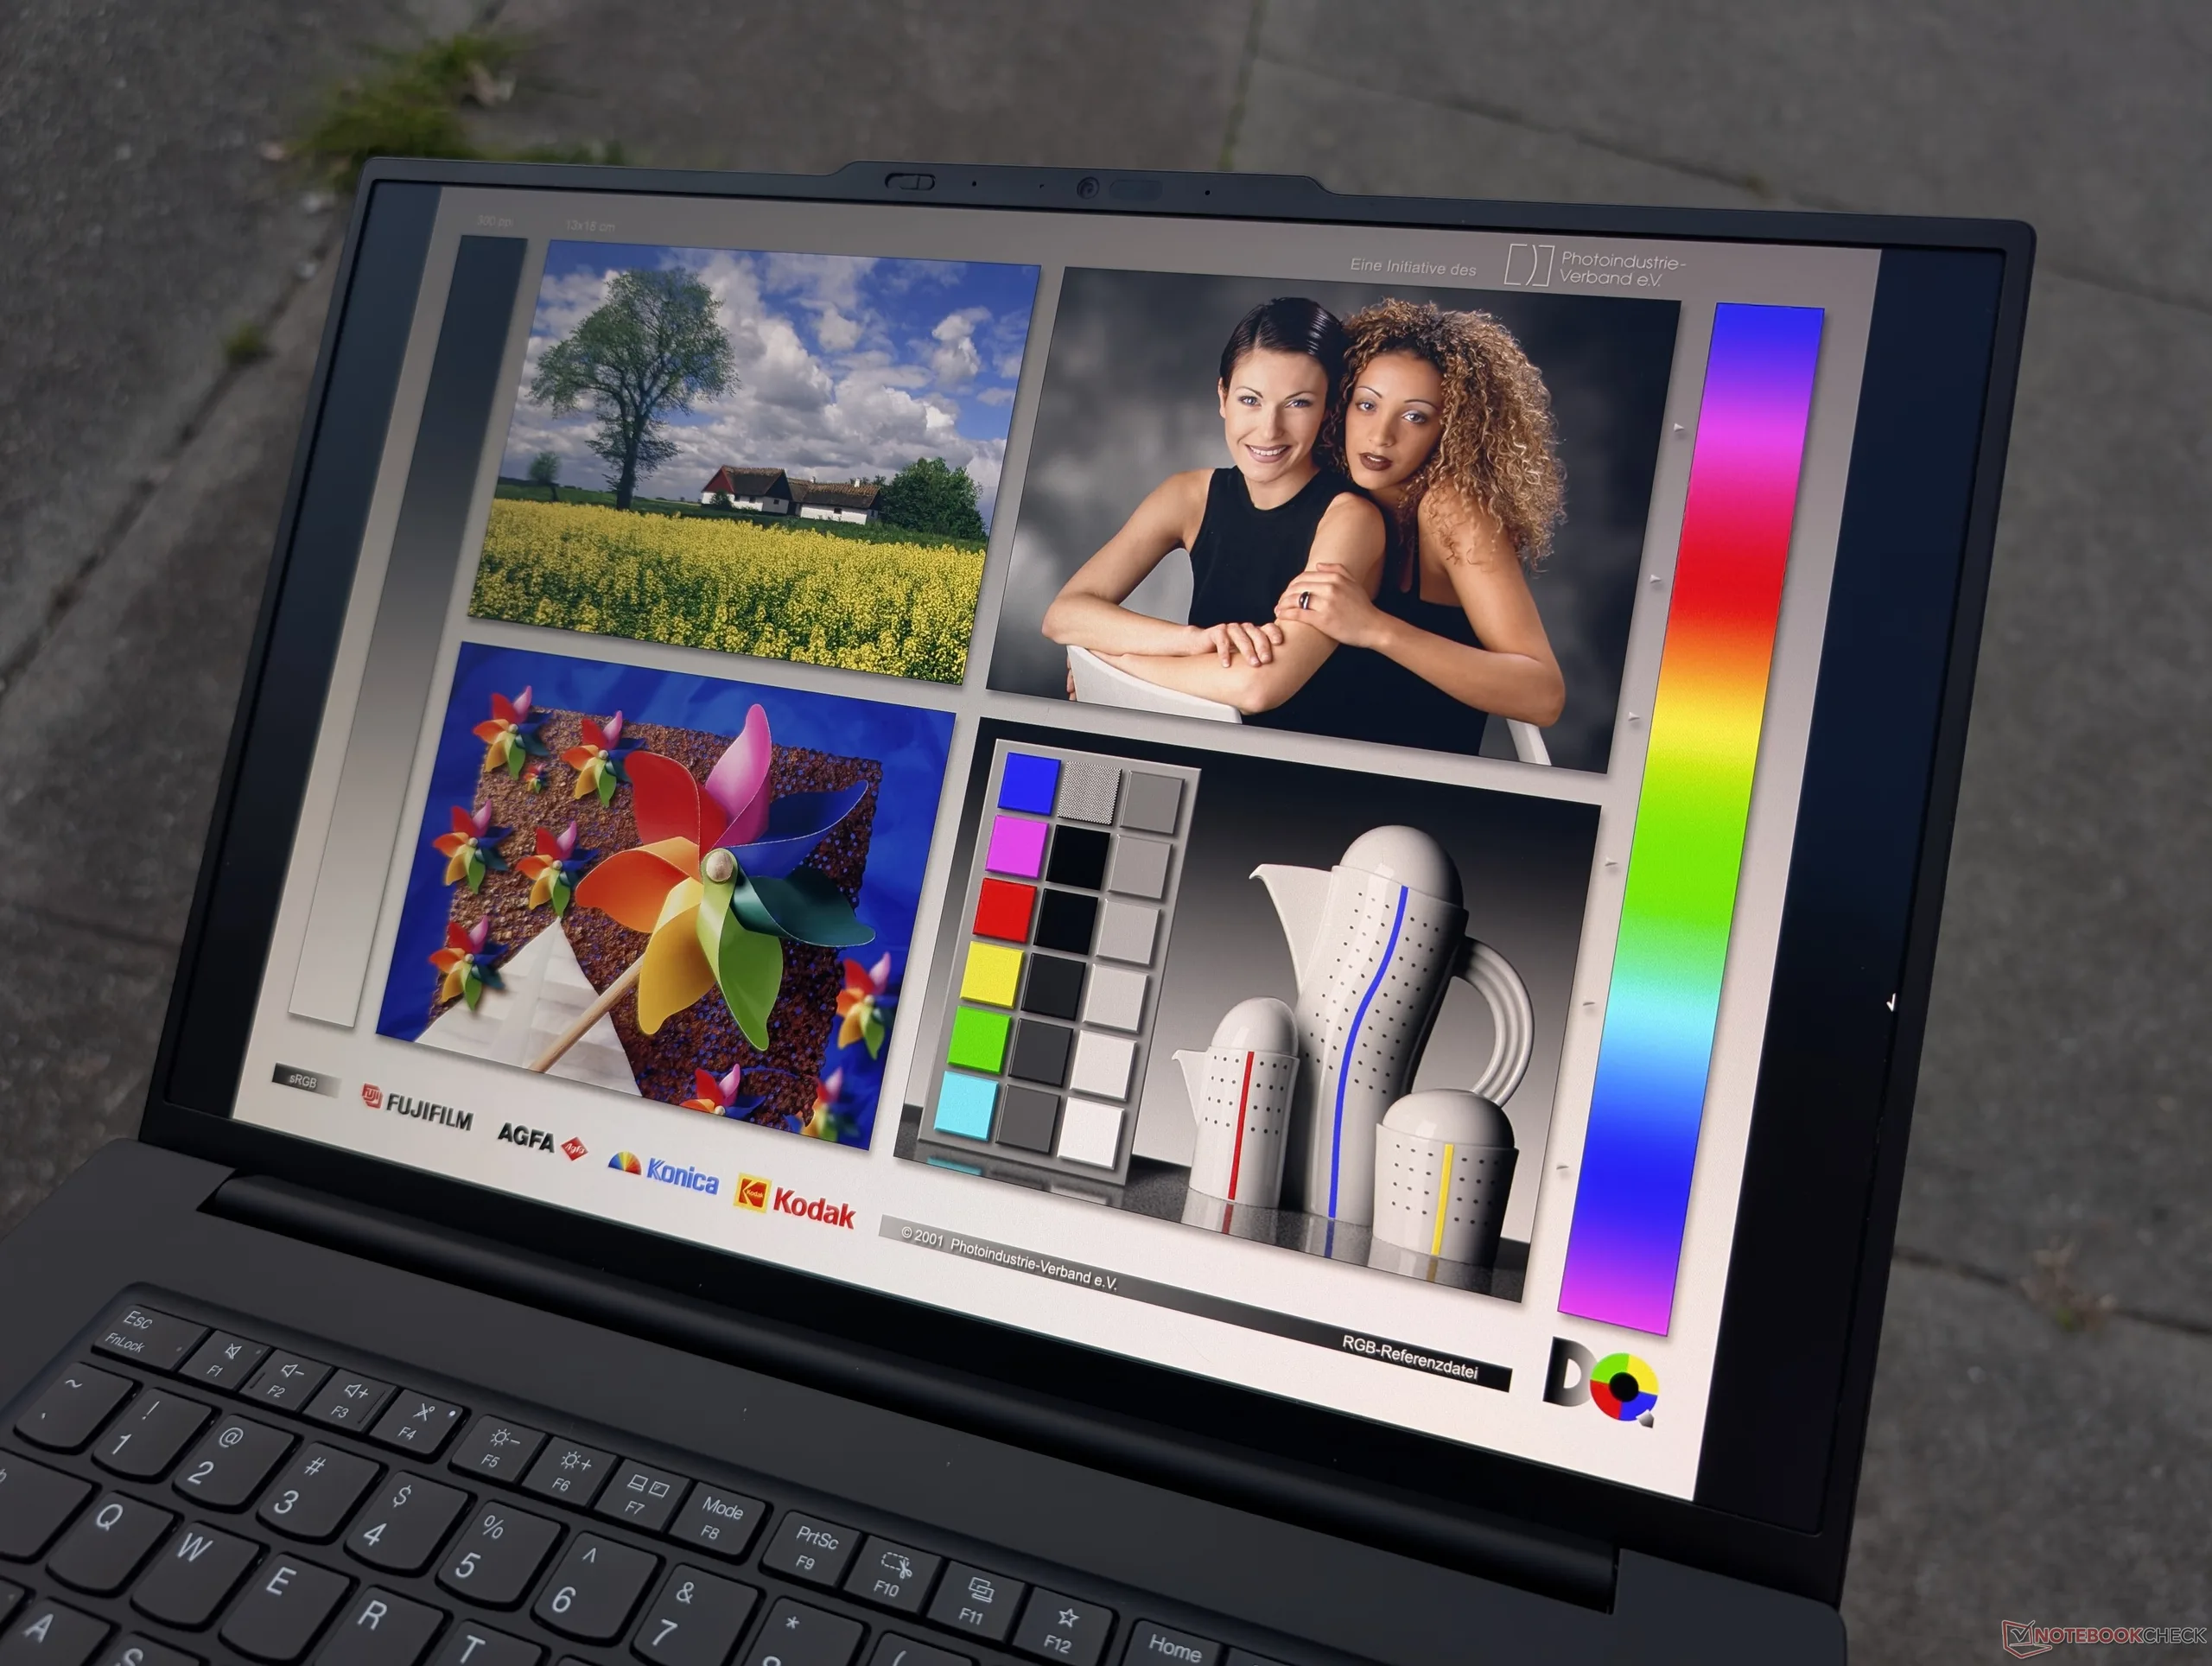
Weergave

Er zijn drie schermopties beschikbaar. Merk op dat de optie met de hoogste resolutie ten koste gaat van de snellere vernieuwingsfrequentie, diepe zwartniveaus, aanraakfunctionaliteit en superieure HDR-ondersteuning van de tandem OLED-optie.
- 1920 x 1200, non-touch, IPS, 500 nits, mat, 100% sRGB, 60 Hz, DC-dimming
- 3200 x 2000, aanraakgevoelig, Tandem OLED, 1500 nits HDR, mat, 100% DCI-P3, 120 Hz, PWM-dimmen
- 3840 x 2400, niet-touch, IPS, 800 nits, 100% DCI-P3, 60 Hz, gelijkstroomdimming
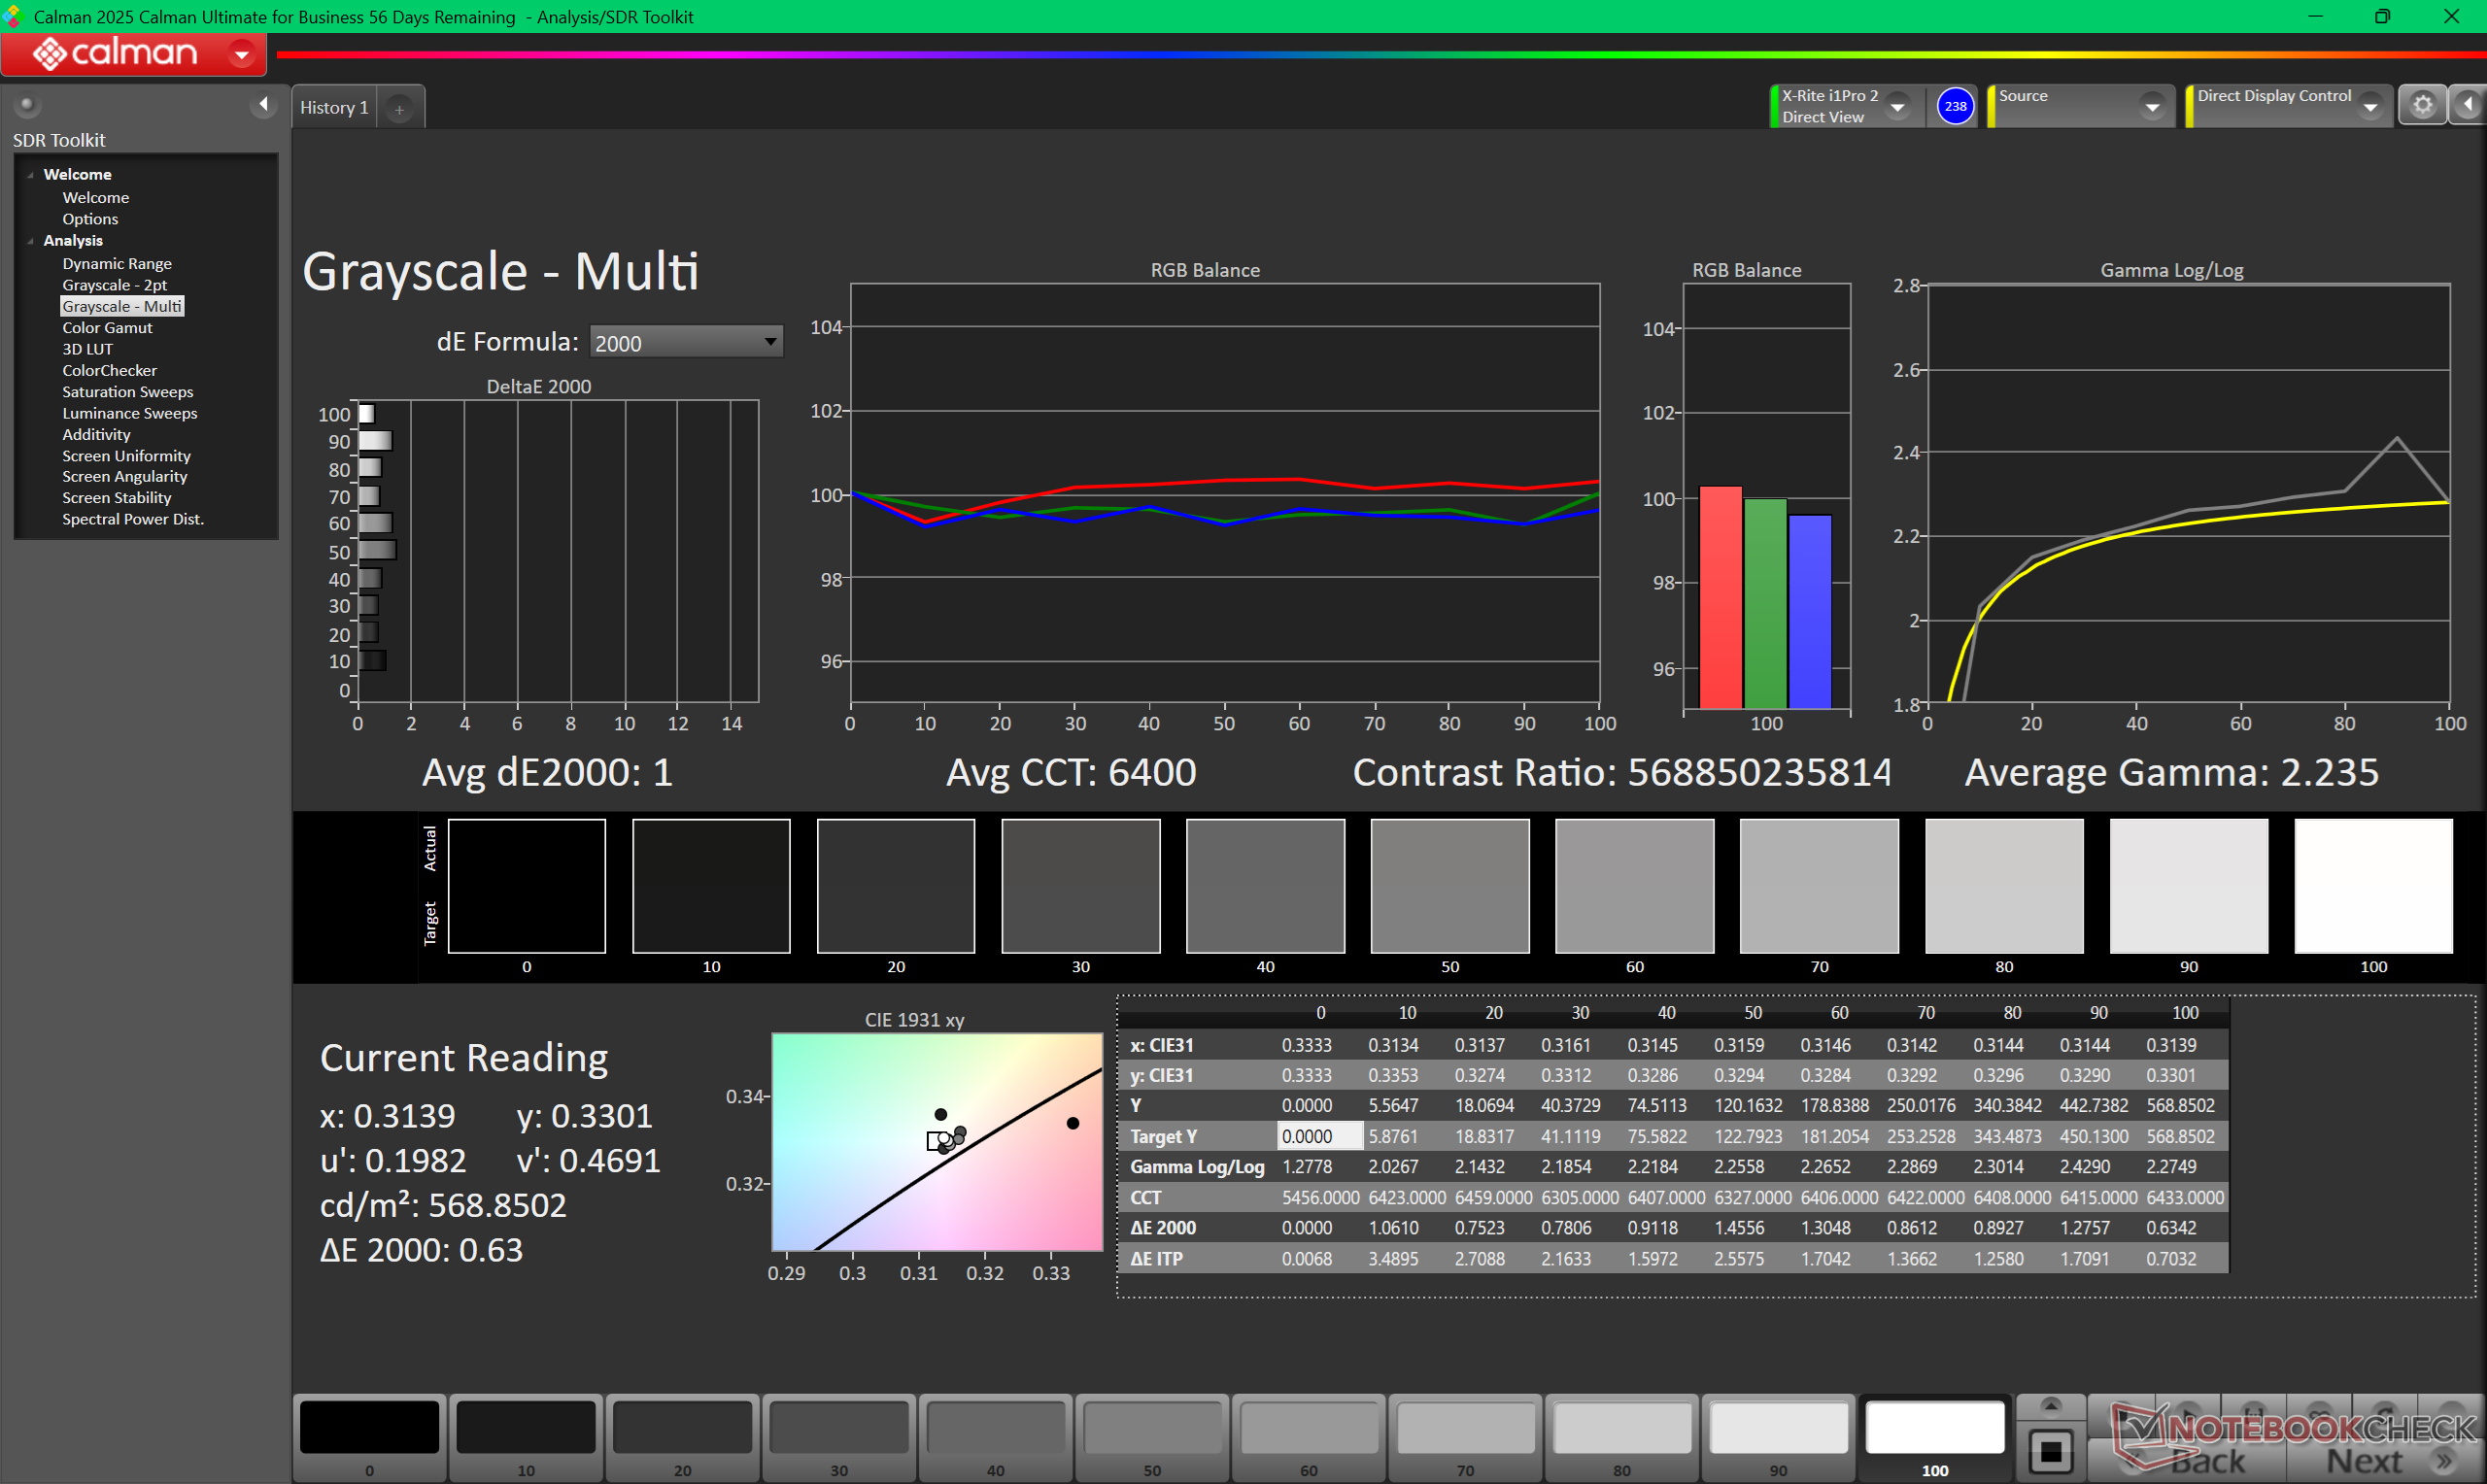
Subjectief gezien lijkt het matte tandem OLED-scherm op onze testunit korreliger dan een traditioneel glanzend alternatief, vooral bij het weergeven van een volledig wit beeld. Toch blinkt het nog steeds uit in HDR-weergave vanwege de zeer hoge helderheidsniveaus, vooral voor een OLED-paneel. Onze onafhankelijke metingen met een X-Rite colorimeter tonen een maximale helderheid van 566 nits in SDR-modus en 1430 nits in HDR-modus, wat dicht in de buurt komt van de geadverteerde waarden van respectievelijk 600 nits en 1500 nits. Als het aanraakscherm en de HDR-functies echter onbelangrijk zijn, is de 2400p-optie wellicht de moeite waard vanwege het grotere aantal pixels.
| |||||||||||||||||||||||||
Helderheidsverdeling: 99 %
Helderheid in Batterij-modus: 561.8 cd/m²
Contrast: ∞:1 (Zwart: 0 cd/m²)
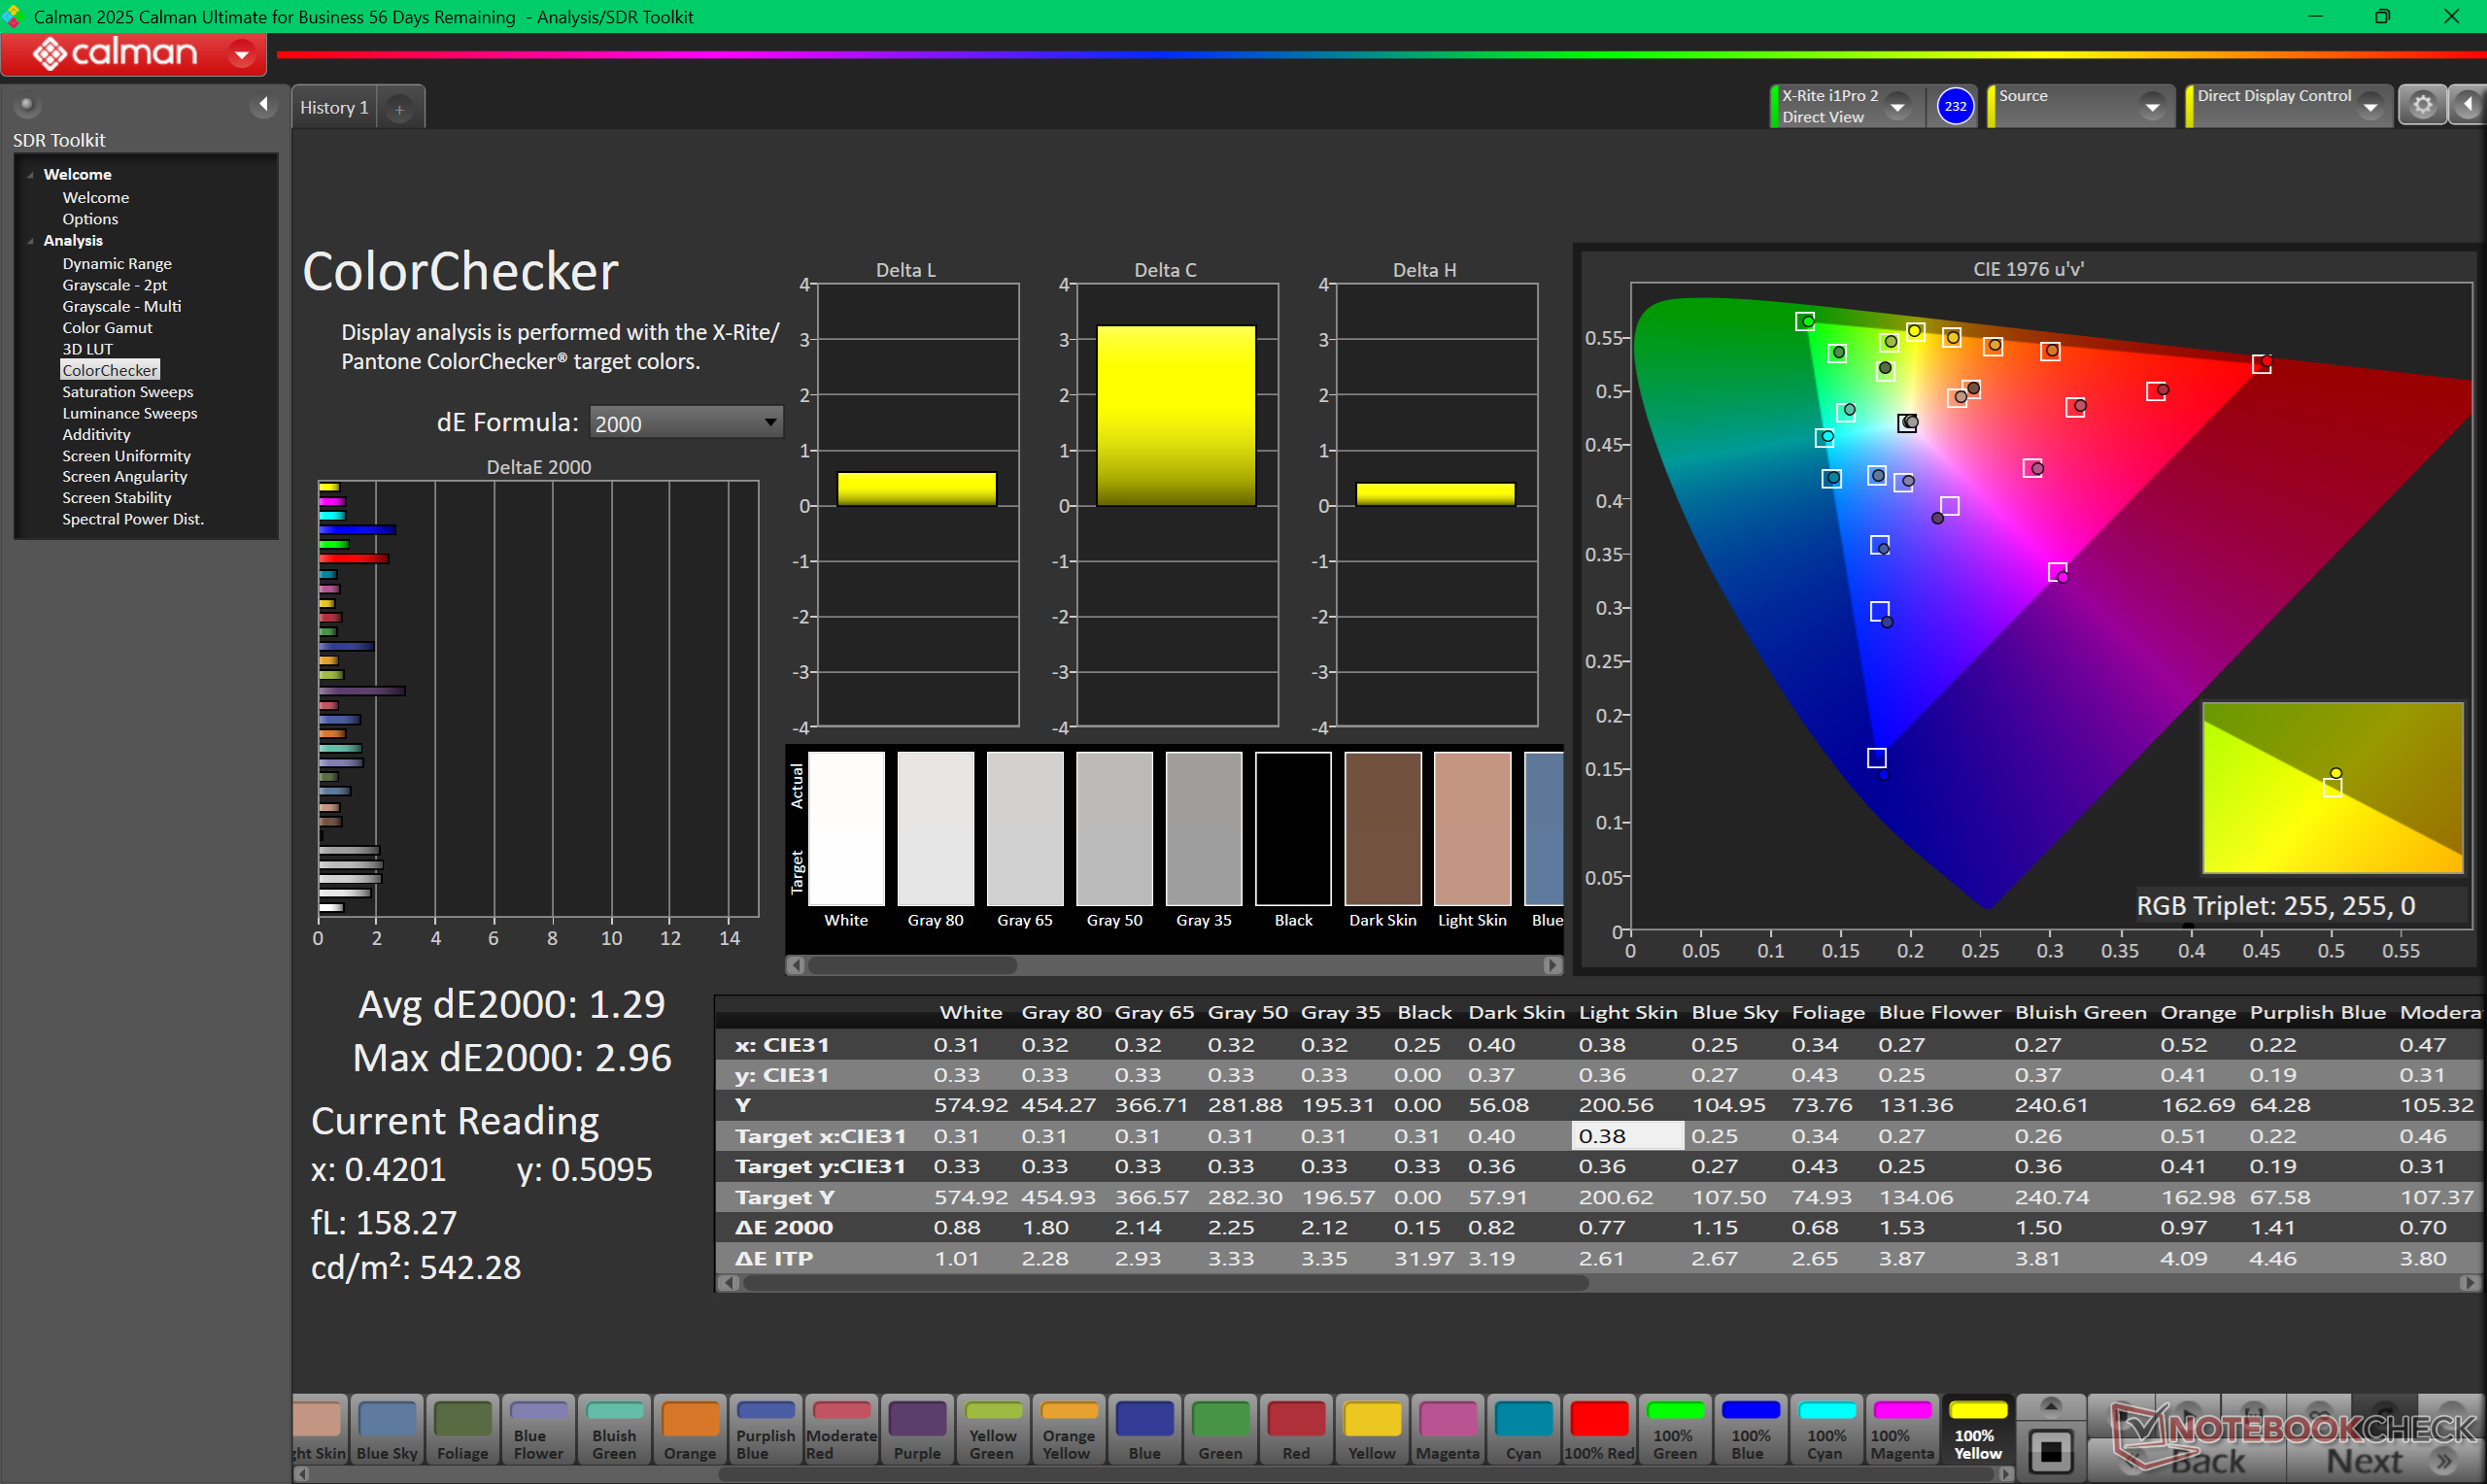
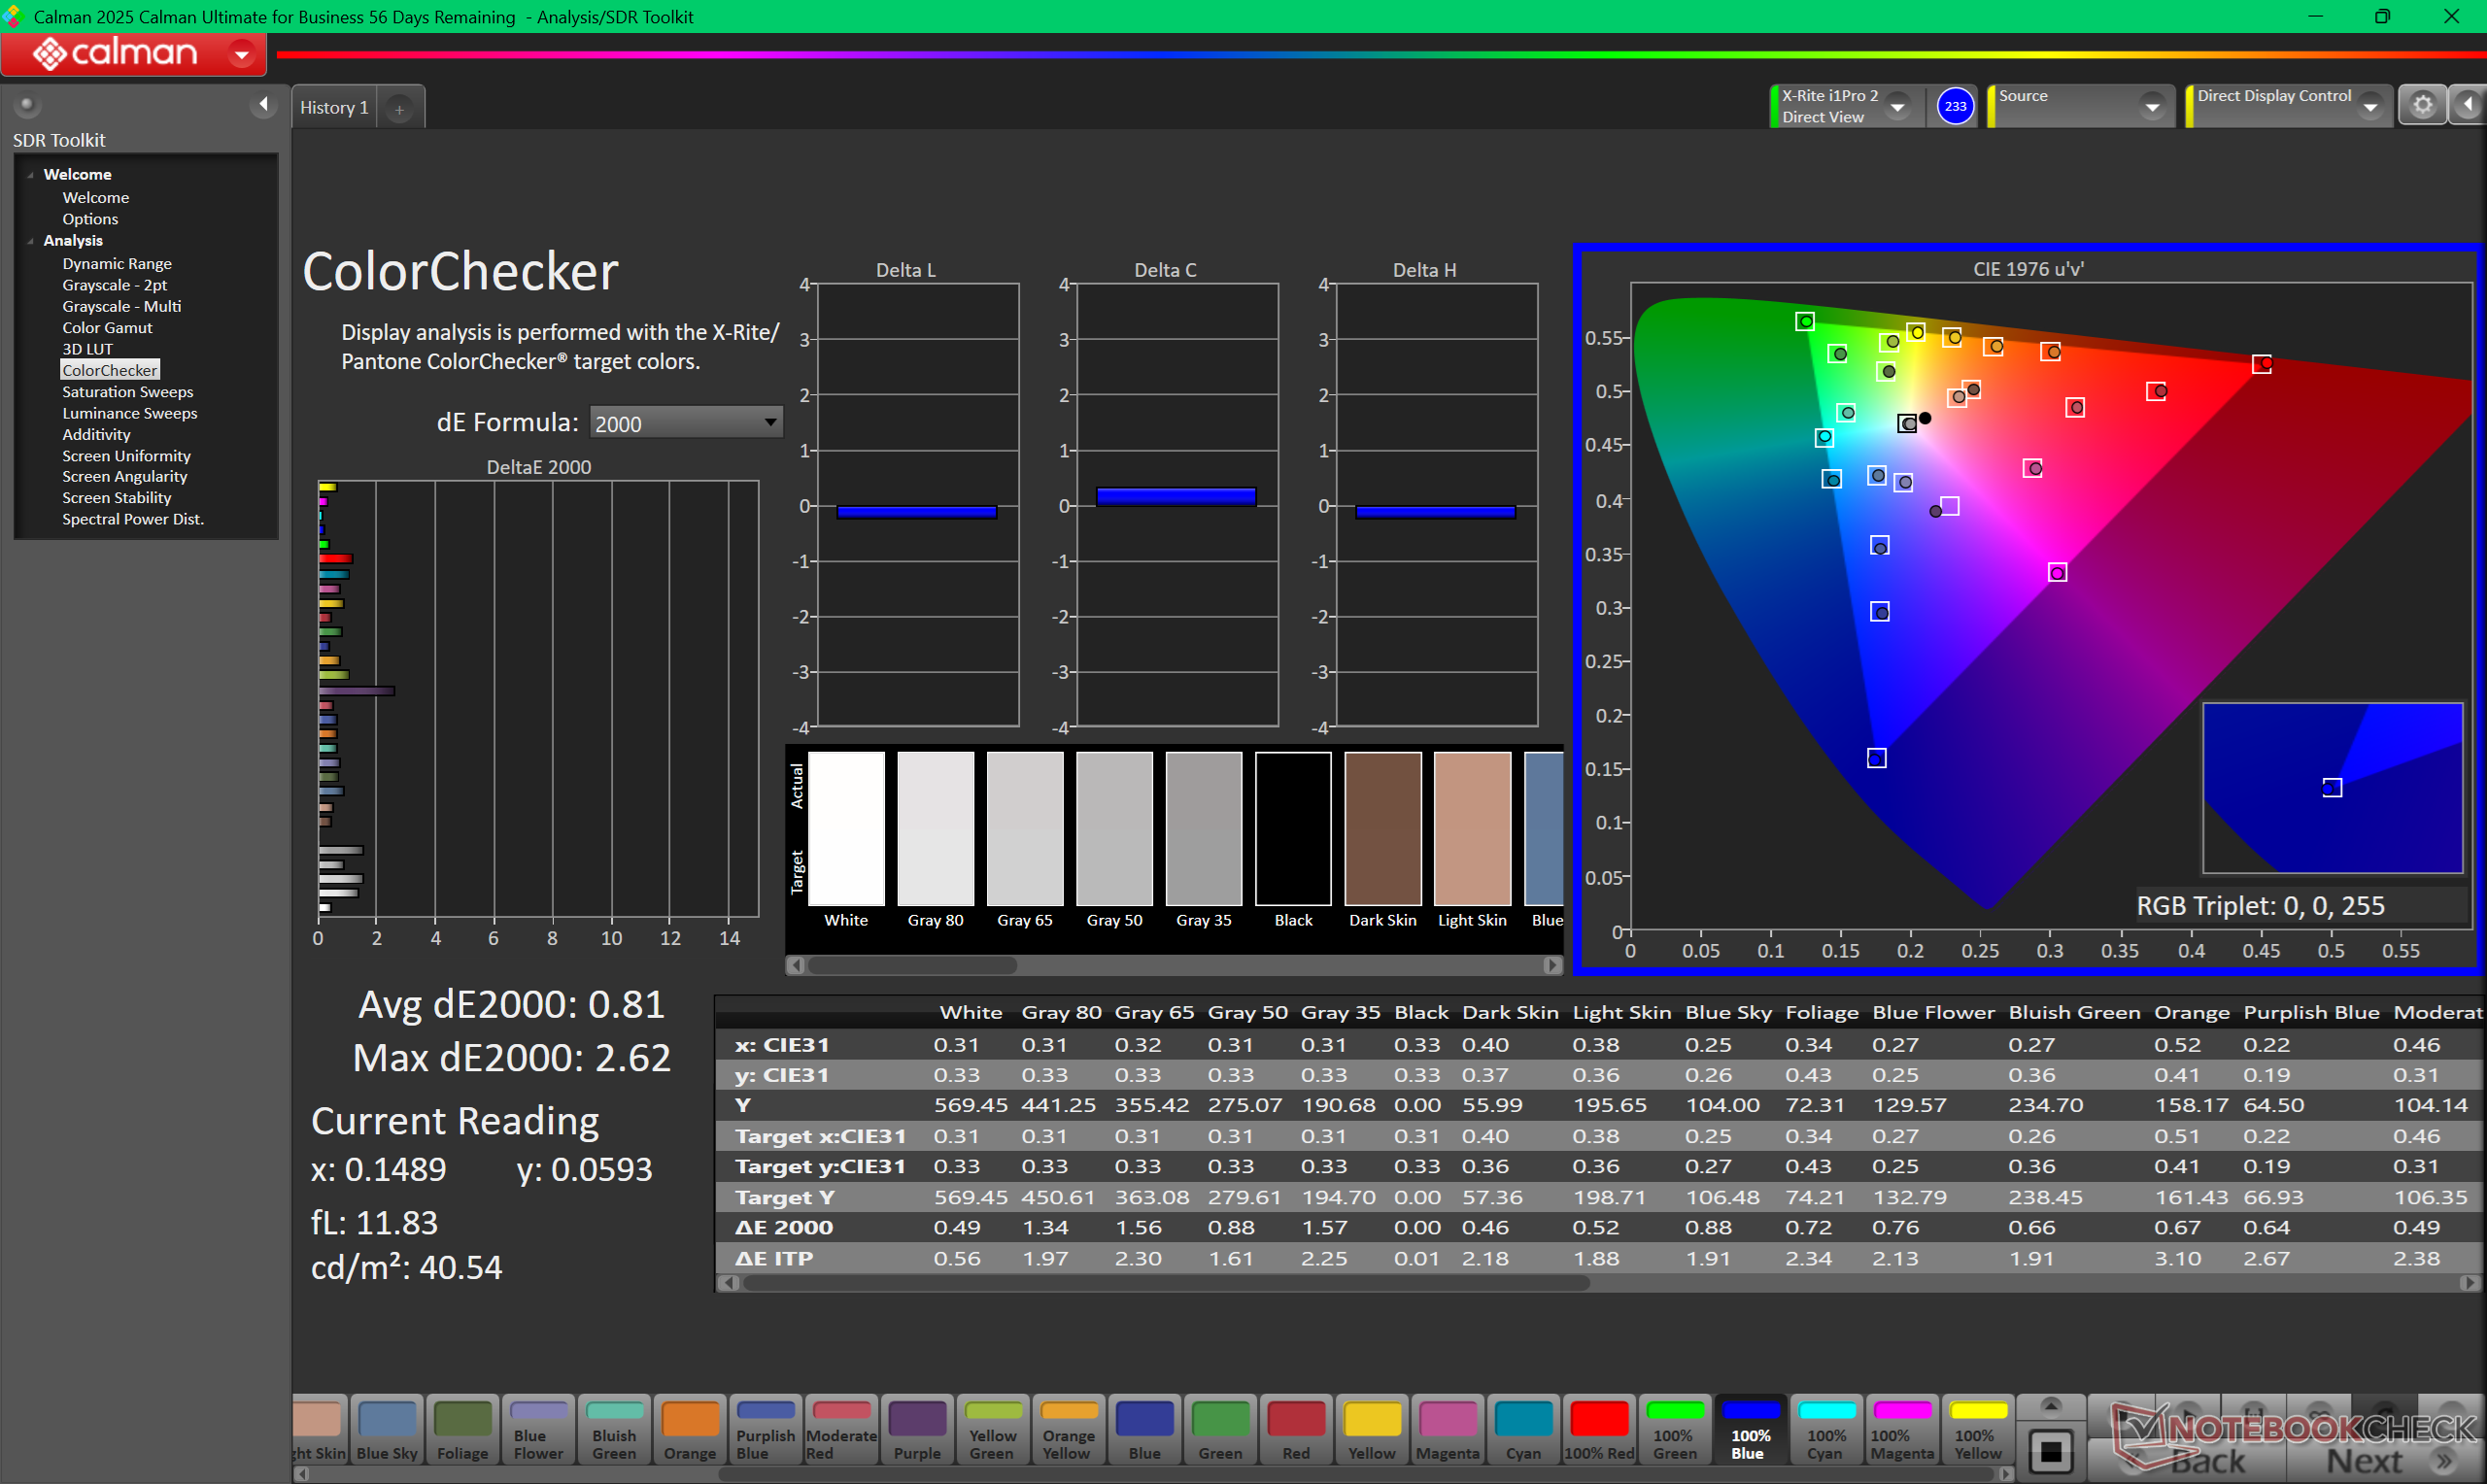
ΔE ColorChecker Calman: 1.29 | ∀{0.5-29.43 Ø4.71}
calibrated: 0.81
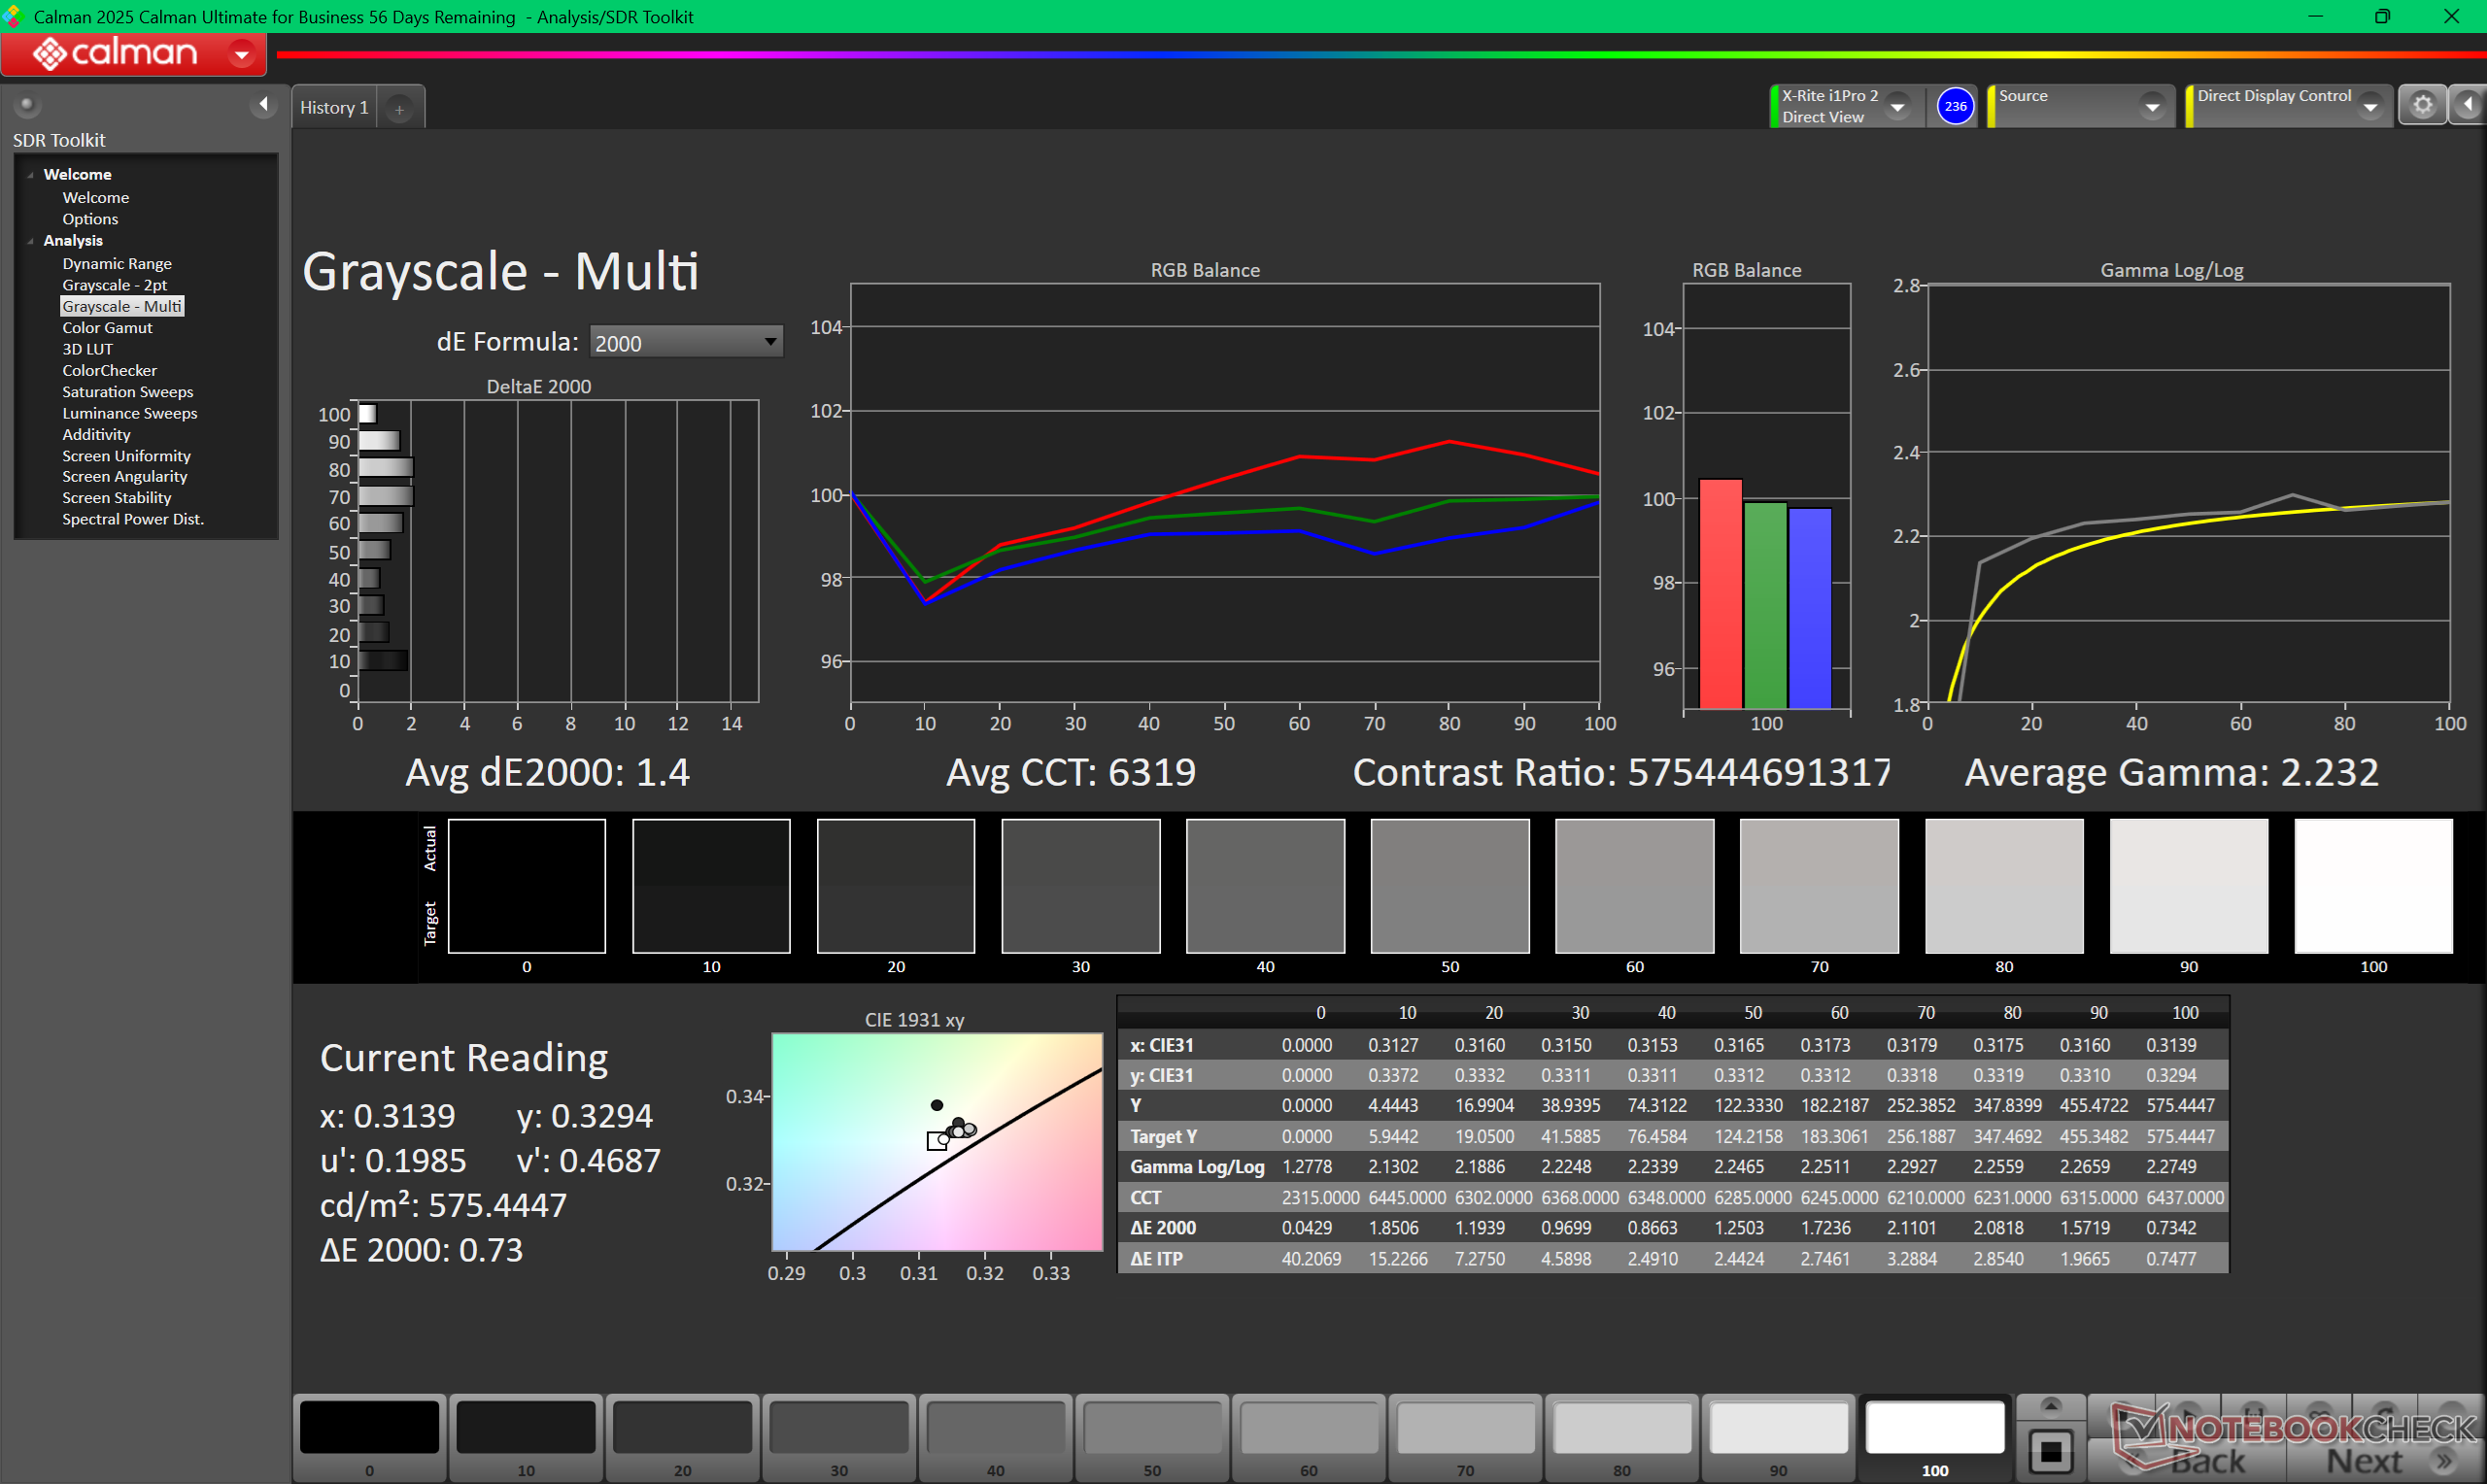
ΔE Greyscale Calman: 1.4 | ∀{0.09-98 Ø4.96}
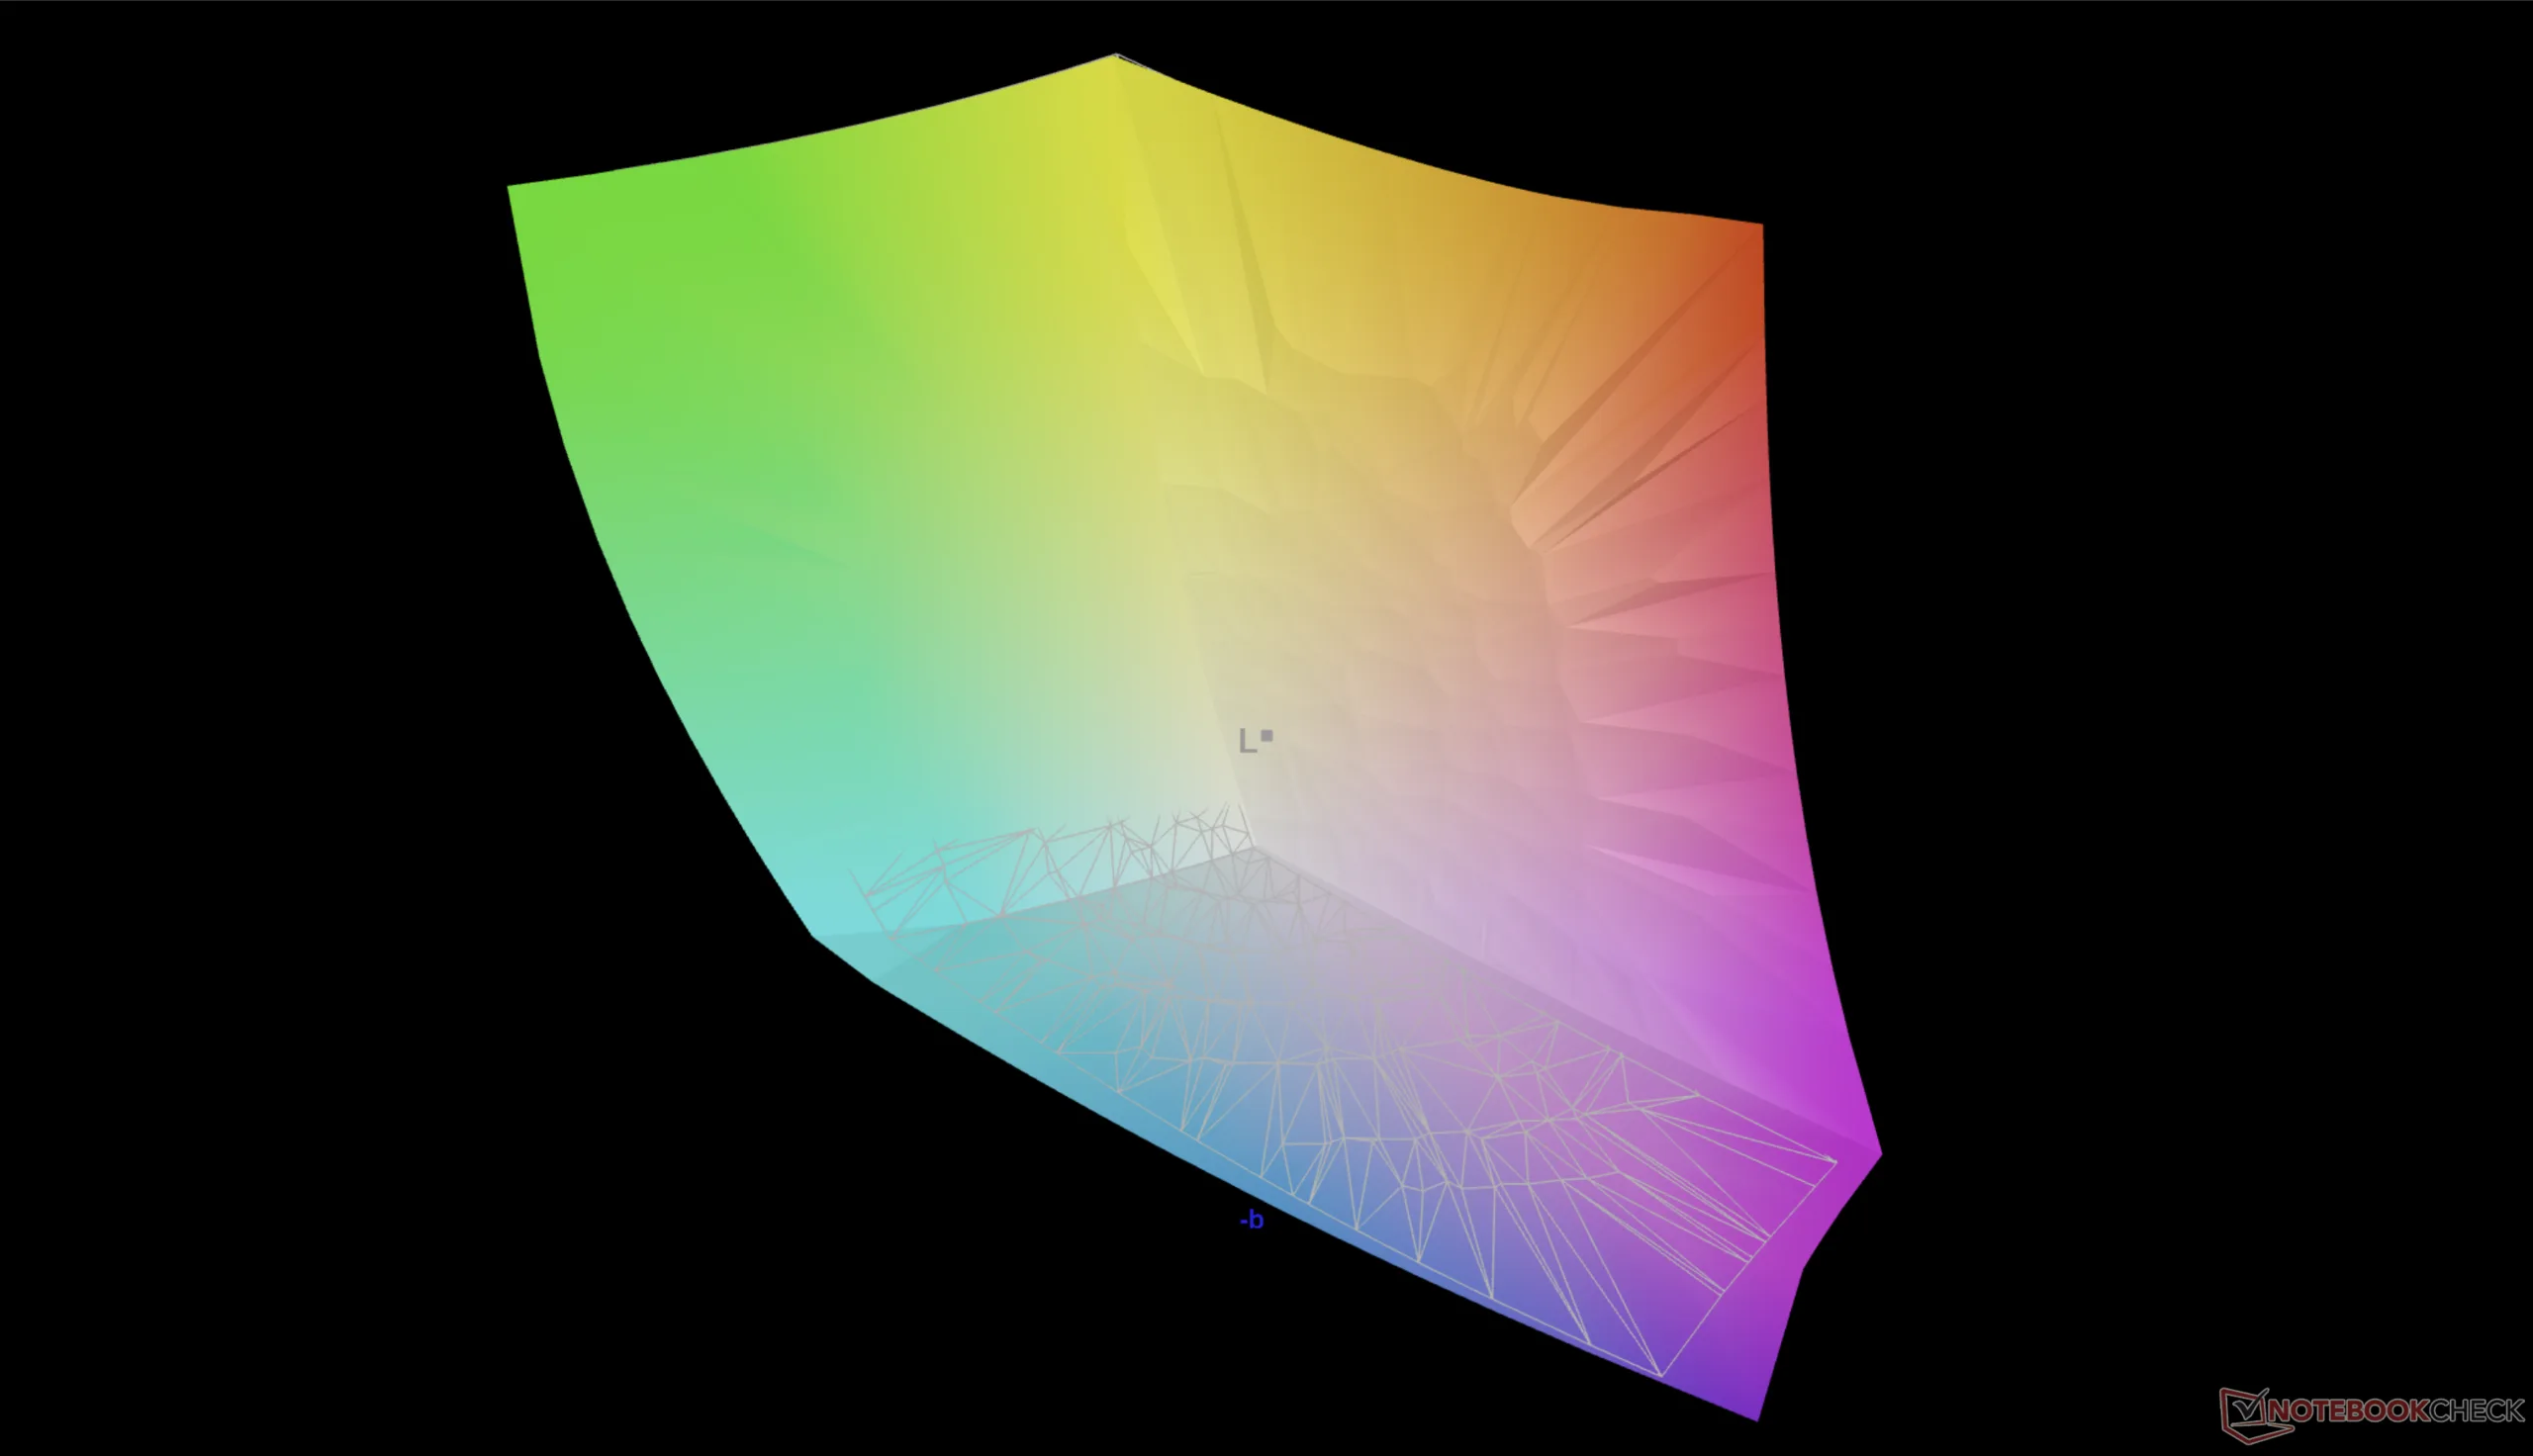
97.5% AdobeRGB 1998 (Argyll 3D)
100% sRGB (Argyll 3D)
98.8% Display P3 (Argyll 3D)
Gamma: 2.23
CCT: 6319 K
| Lenovo ThinkPad P1 Gen 8 Samsung ATNA60KA02-0, Tandem OLED, 3200x2000, 16", 120 Hz | Lenovo ThinkPad P16s Gen 4 21RX000YGE N160JCA-GT1, IPS LED, 1920x1200, 16", 60 Hz | Lenovo ThinkPad P1 Gen 7 21KV001SGE MNG007DA1-9 , IPS LED, 2560x1600, 16", 165 Hz | HP ZBook X G1i 16 LG Philips LGD07B3, IPS, 2560x1600, 16", 120 Hz | Dell Pro Max 16 Plus Samsung 160HC01, OLED, 3840x2400, 16", 120 Hz | Asus ExpertBook B6 Flip B6602FC2 AU Optronics Model: AUOE495, IPS, 2560x1600, 16", 120 Hz | |
|---|---|---|---|---|---|---|
| Display | -22% | -19% | 0% | -4% | -4% | |
| Display P3 Coverage (%) | 98.8 | 65.8 -33% | 69.4 -30% | 97.2 -2% | 97.3 -2% | 97.9 -1% |
| sRGB Coverage (%) | 100 | 96.8 -3% | 97.6 -2% | 100 0% | 100 0% | 99.89 0% |
| AdobeRGB 1998 Coverage (%) | 97.5 | 67.8 -30% | 71.8 -26% | 99.9 2% | 88.8 -9% | 85.52 -12% |
| Response Times | -4013% | -1609% | -3839% | -30% | -4223% | |
| Response Time Grey 50% / Grey 80% * (ms) | 0.57 ? | 29.4 ? -5058% | 11.2 ? -1865% | 45.5 ? -7882% | 0.63 ? -11% | 36 ? -6216% |
| Response Time Black / White * (ms) | 0.73 ? | 22.4 ? -2968% | 10.6 ? -1352% | 26.1 ? -3475% | 0.89 ? -22% | 17 ? -2229% |
| PWM Frequency (Hz) | 1199 | 26536 ? | 479.9 ? | |||
| PWM Amplitude * (%) | 18 | 47 -161% | 28 -56% | |||
| Screen | -72% | -106% | -84% | -20% | -68% | |
| Brightness middle (cd/m²) | 561.8 | 540 -4% | 516 -8% | 461.8 -18% | 530.9 -6% | 440 -22% |
| Brightness (cd/m²) | 566 | 516 -9% | 505 -11% | 427 -25% | 540 -5% | 418 -26% |
| Brightness Distribution (%) | 99 | 93 -6% | 89 -10% | 88 -11% | 95 -4% | 82 -17% |
| Black Level * (cd/m²) | 0.37 | 0.41 | 0.46 | 0.3 | ||
| Colorchecker dE 2000 * | 1.29 | 3.4 -164% | 3.5 -171% | 4.08 -216% | 2.42 -88% | 2.81 -118% |
| Colorchecker dE 2000 max. * | 2.96 | 5.6 -89% | 8.8 -197% | 8.1 -174% | 5.76 -95% | 4.62 -56% |
| Colorchecker dE 2000 calibrated * | 0.81 | 0.9 -11% | 1.2 -48% | 0.75 7% | 0.7 14% | 2.99 -269% |
| Greyscale dE 2000 * | 1.4 | 4.5 -221% | 5.6 -300% | 3.5 -150% | 0.8 43% | 0.91 35% |
| Gamma | 2.23 99% | 2.51 88% | 2.27 97% | 2.15 102% | 2.23 99% | 2.2 100% |
| CCT | 6319 103% | 6294 103% | 6071 107% | 6715 97% | 6488 100% | 6600 98% |
| Contrast (:1) | 1459 | 1259 | 1004 | 1467 | ||
| Totaal Gemiddelde (Programma / Instellingen) | -1369% /
-716% | -578% /
-335% | -1308% /
-931% | -18% /
-19% | -1432% /
-744% |
* ... kleiner is beter

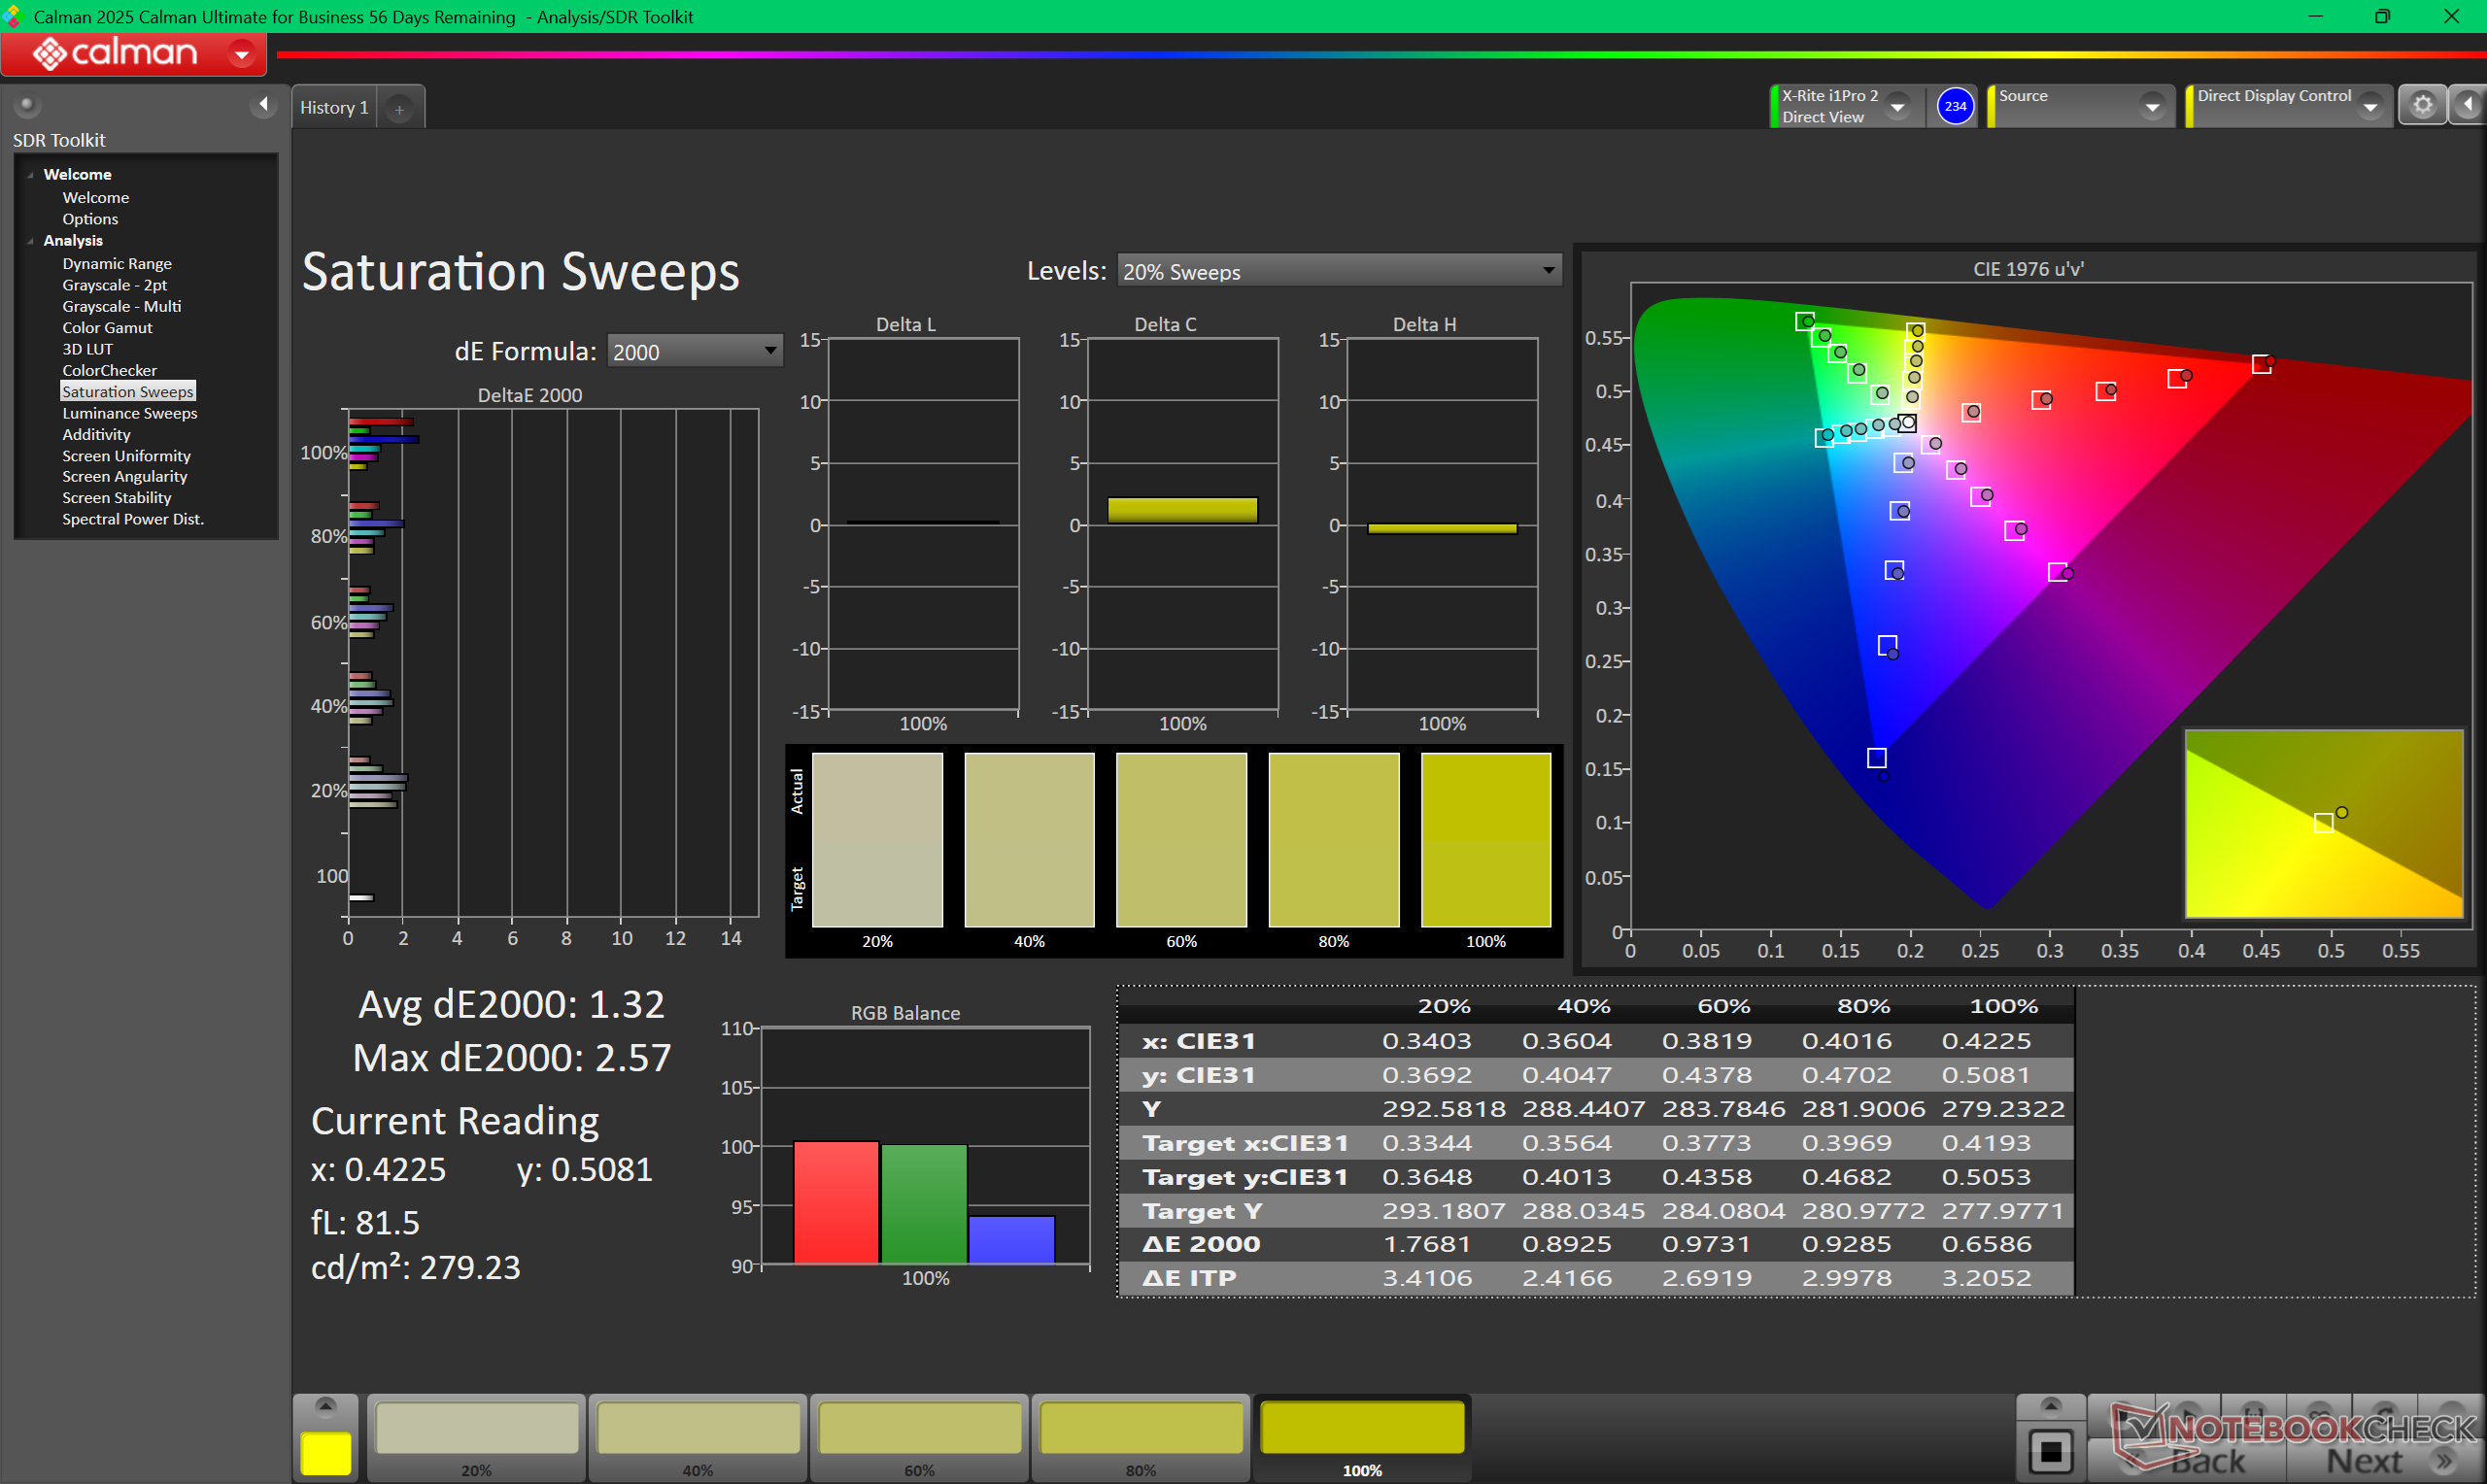
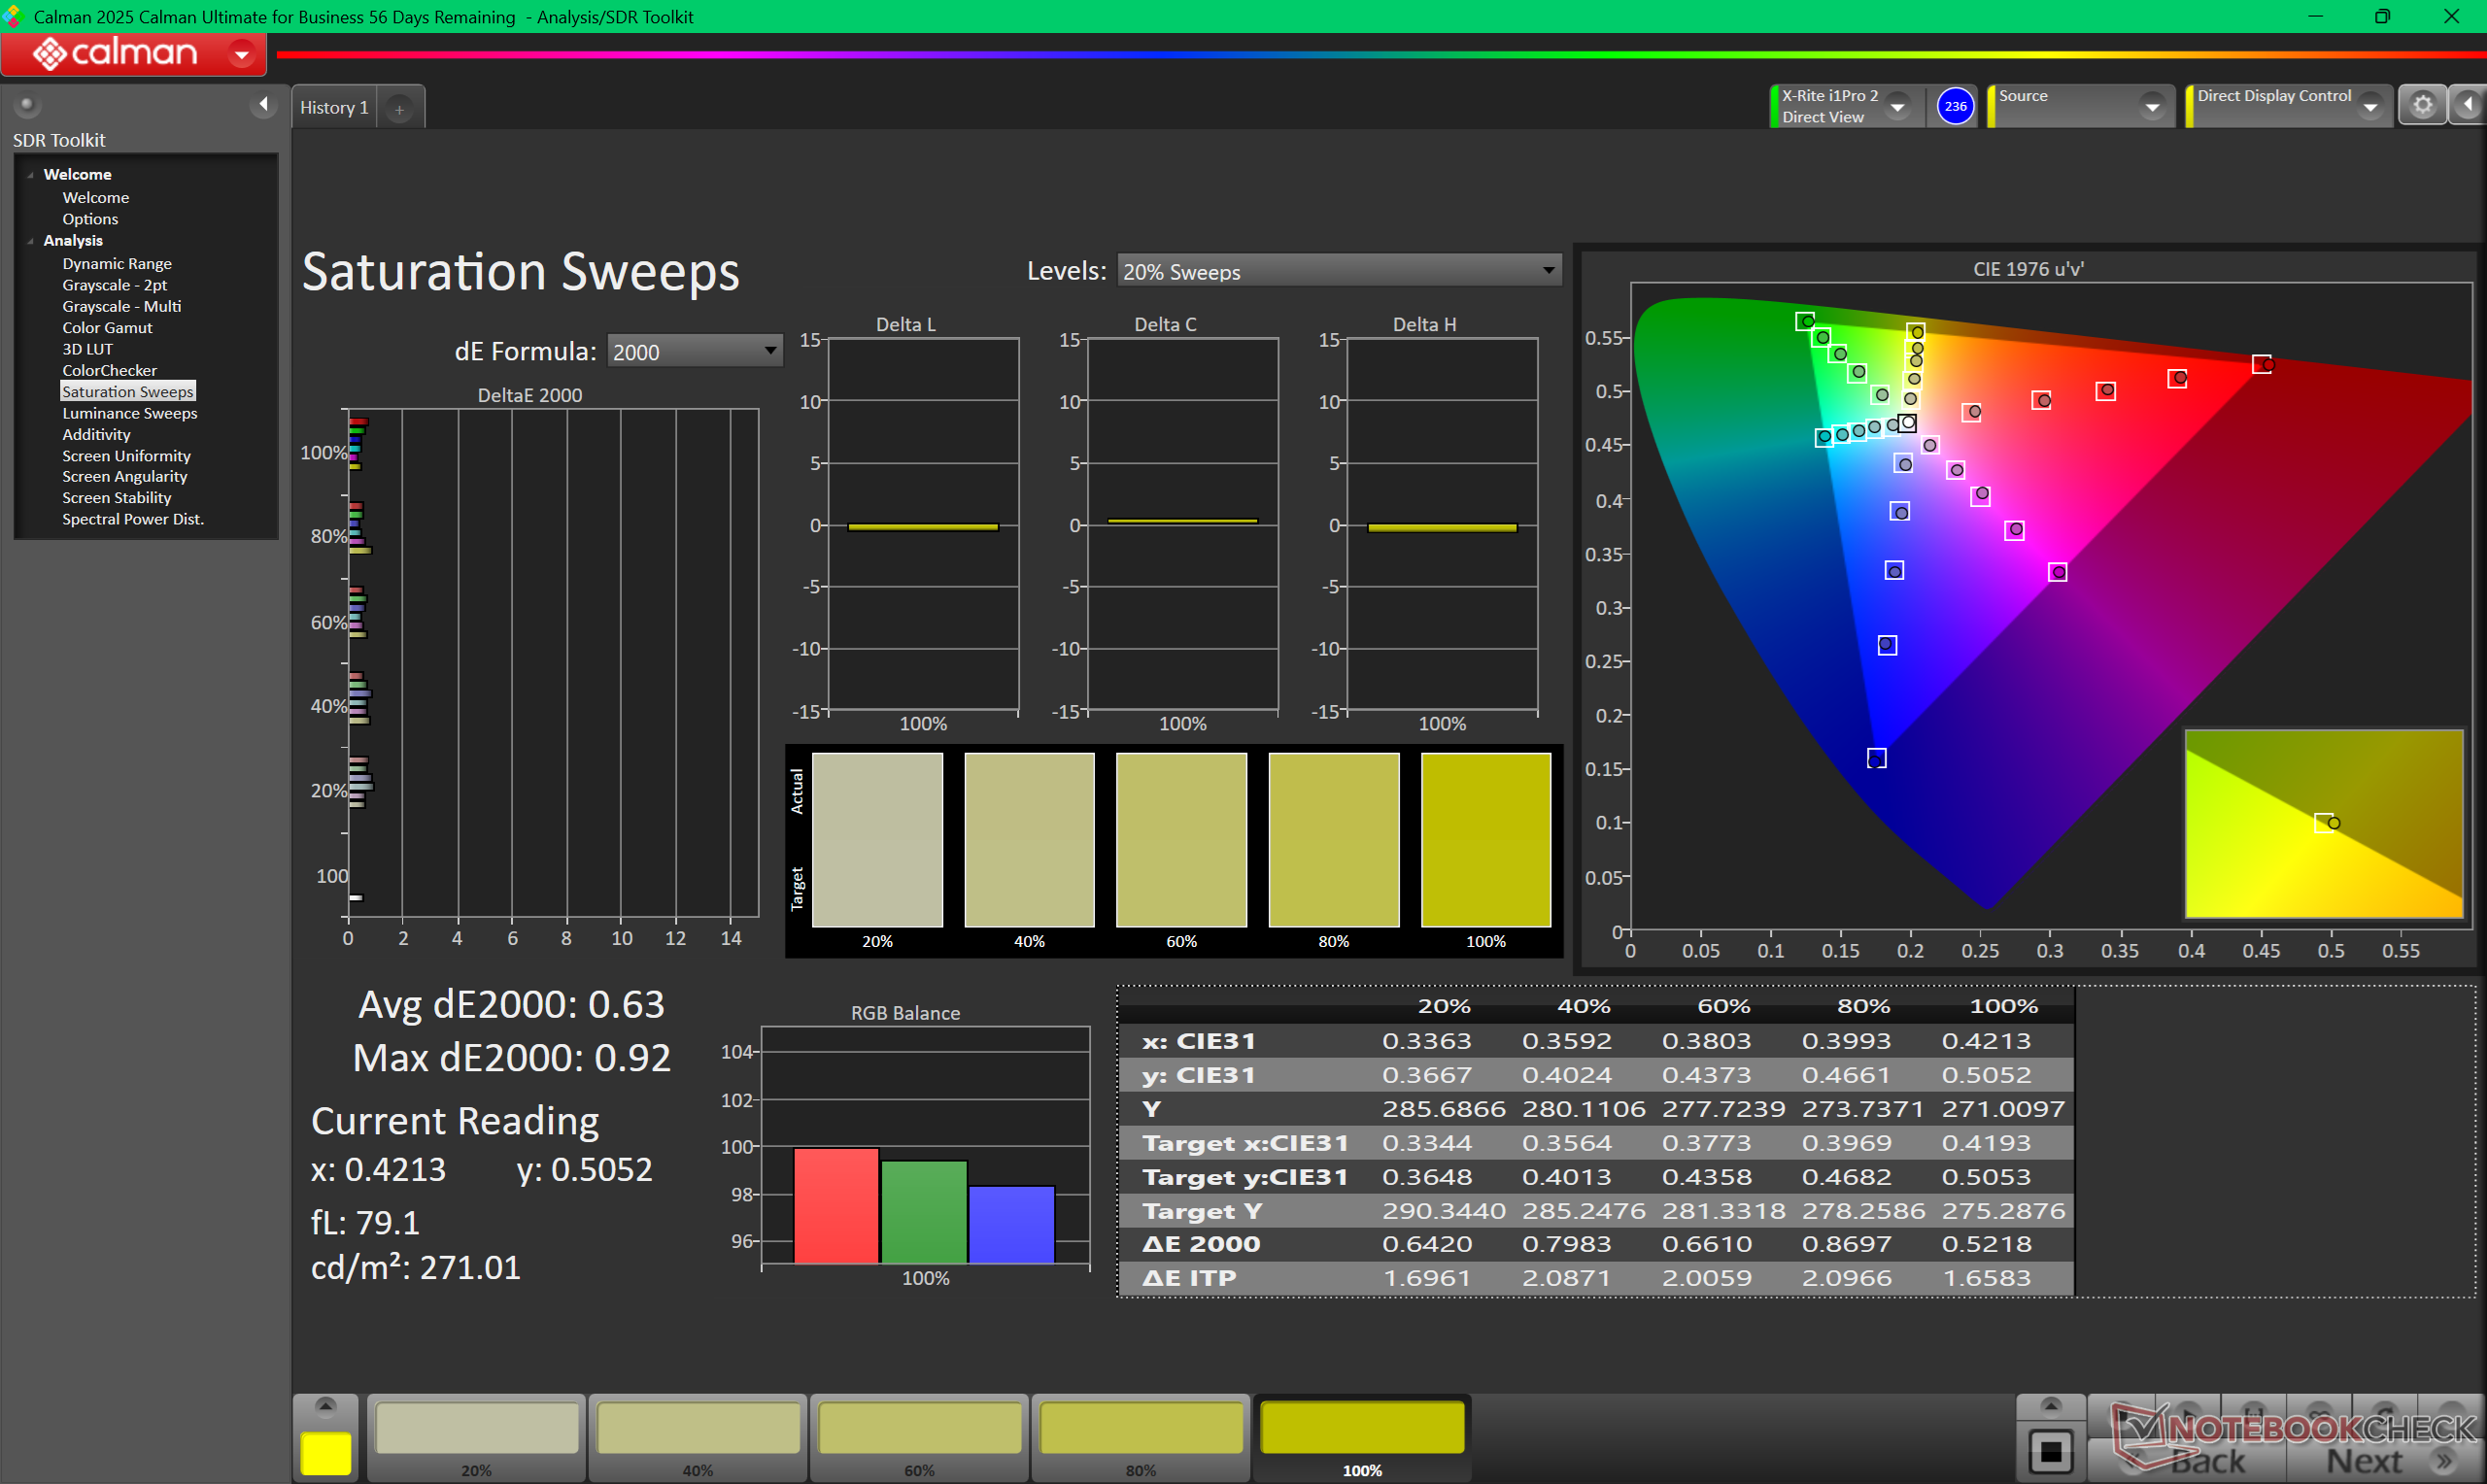
Het display wordt voorgekalibreerd geleverd en de gemiddelde deltaE-waarden zijn dus al vrij laag, zoals blijkt uit onze CalMAN-resultaten hieronder.
Responstijd Scherm
| ↔ Responstijd Zwart naar Wit | ||
|---|---|---|
| 0.73 ms ... stijging ↗ en daling ↘ gecombineerd | ↗ 0.34 ms stijging | 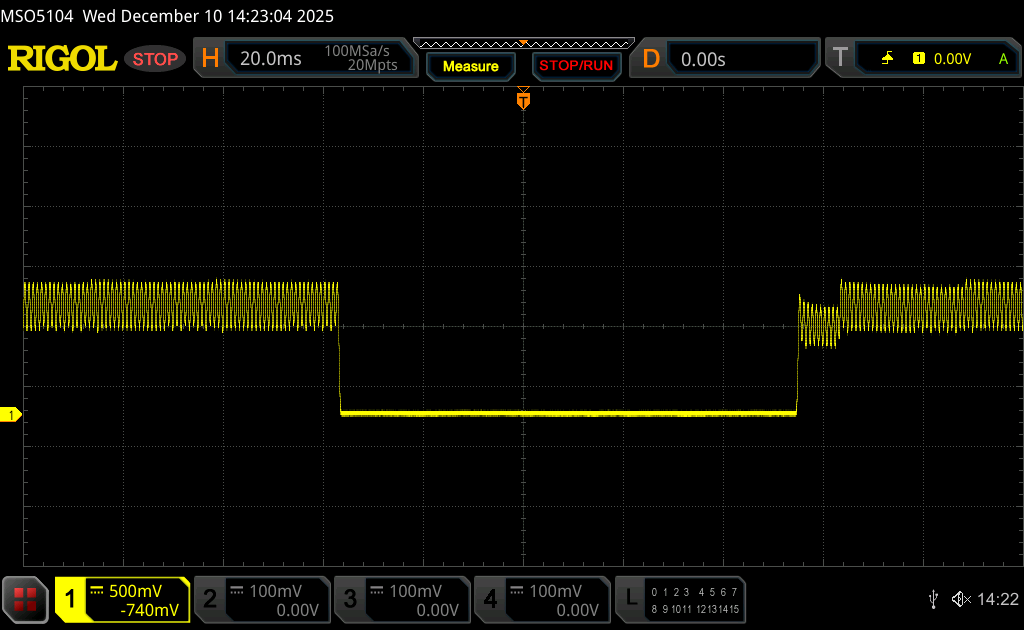 |
| ↘ 0.39 ms daling | ||
| Het scherm vertoonde erg snelle responstijden in onze tests en zou zeer geschikt moeten zijn voor snelle games. Ter vergelijking: alle testtoestellen variëren van 0.1 (minimum) tot 240 (maximum) ms. » 2 % van alle toestellen zijn beter. Dit betekent dat de gemeten responstijd beter is dan het gemiddelde (19.8 ms) van alle geteste toestellen. | ||
| ↔ Responstijd 50% Grijs naar 80% Grijs | ||
| 0.57 ms ... stijging ↗ en daling ↘ gecombineerd | ↗ 0.29 ms stijging | 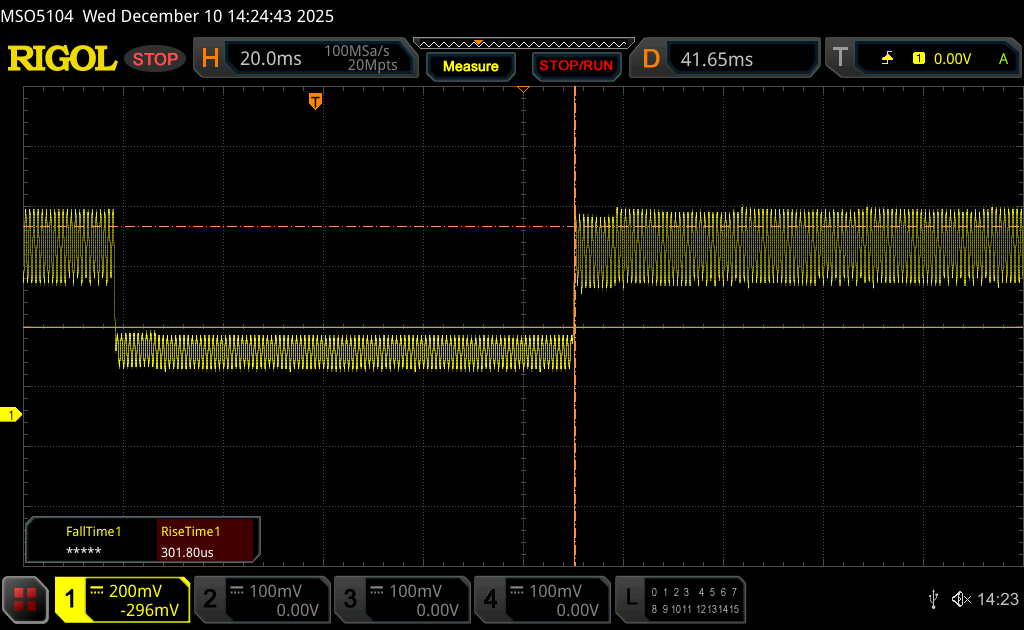 |
| ↘ 0.28 ms daling | ||
| Het scherm vertoonde erg snelle responstijden in onze tests en zou zeer geschikt moeten zijn voor snelle games. Ter vergelijking: alle testtoestellen variëren van 0.165 (minimum) tot 636 (maximum) ms. » 1 % van alle toestellen zijn beter. Dit betekent dat de gemeten responstijd beter is dan het gemiddelde (31 ms) van alle geteste toestellen. | ||
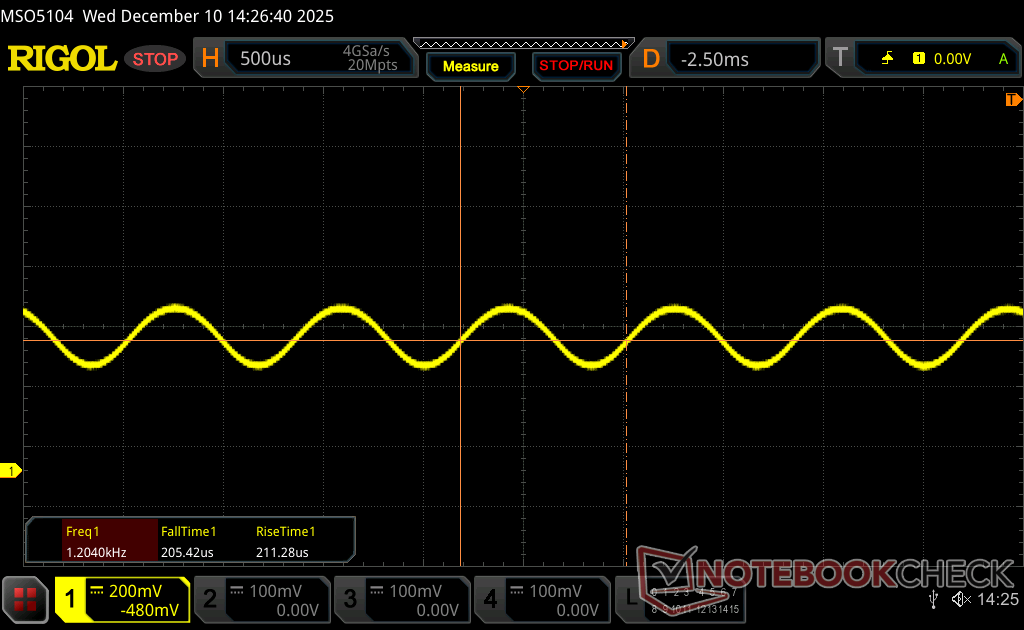
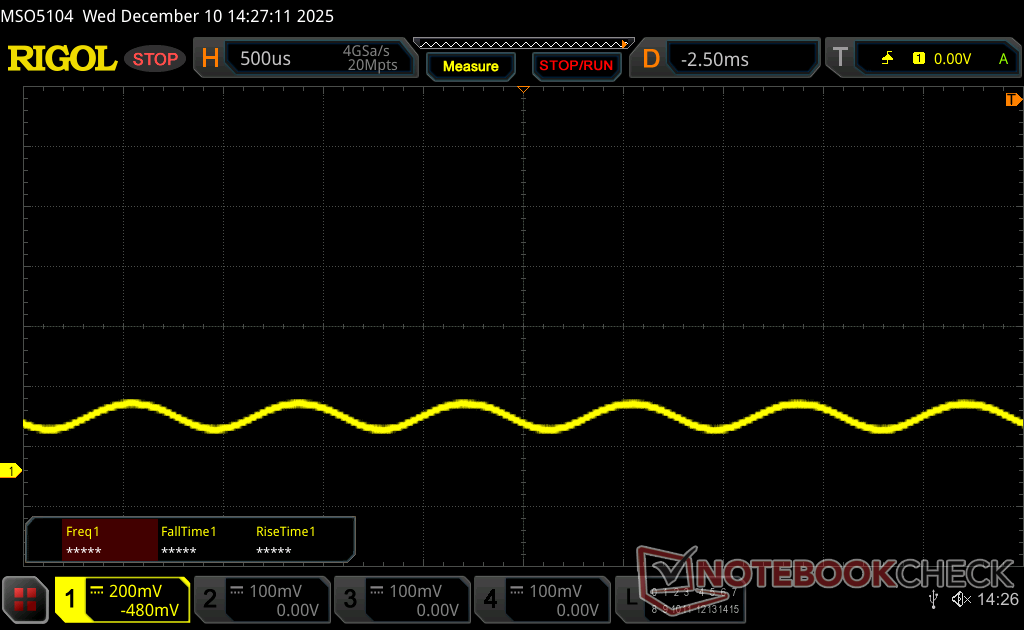
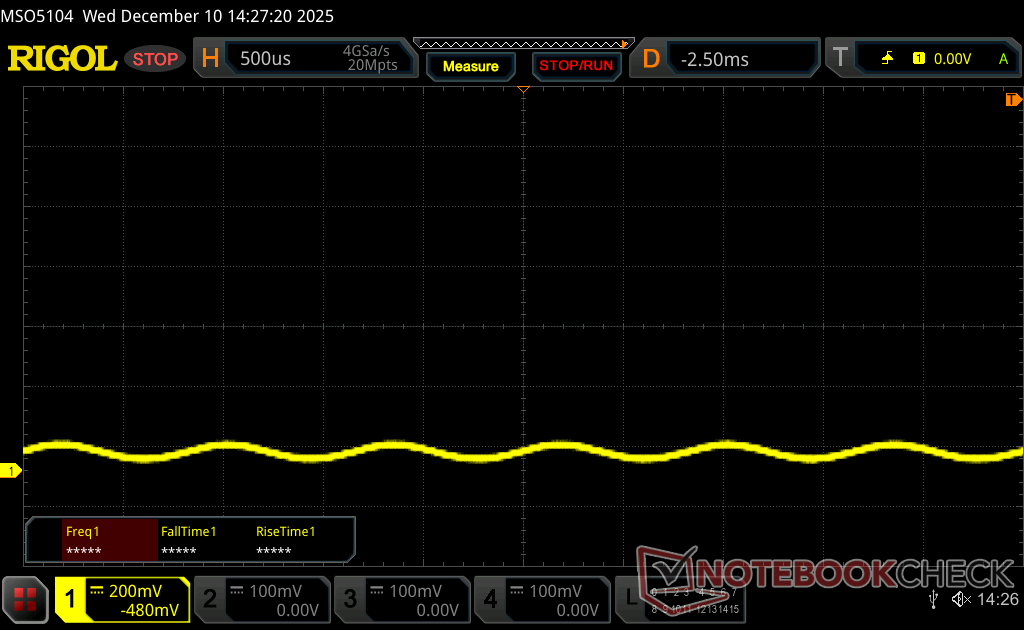
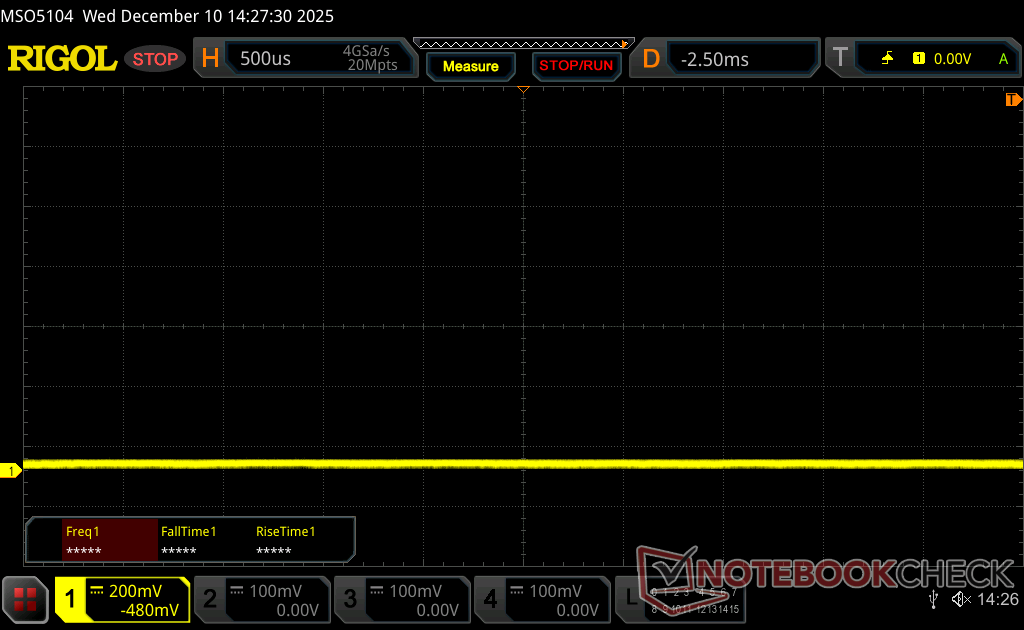
Screen Flickering / PWM (Pulse-Width Modulation)
| Screen flickering / PWM waargenomen | 1199 Hz Amplitude: 18 % | 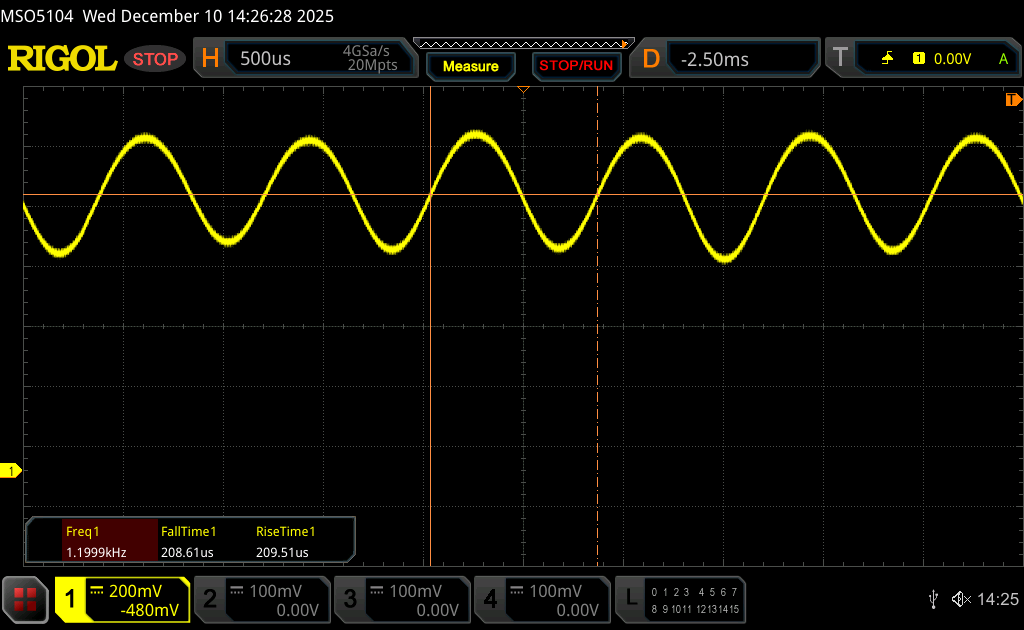 | |
De achtergrondverlichting van het scherm flikkert op 1199 Hz (in het slechtste geval, bijvoorbeeld bij gebruik van PWM) . De frequentie van 1199 Hz is redelijk hoog en de meeste mensen die gevoelig zijn aan flickering zouden dit dus niet mogen waarnemen of geïrriteerde ogen krijgen. Ter vergelijking: 52 % van alle geteste toestellen maakten geen gebruik van PWM om de schermhelderheid te verlagen. Als het wel werd gebruikt, werd een gemiddelde van 7757 (minimum: 5 - maximum: 343500) Hz waargenomen. | |||

Prestaties
Testomstandigheden
We hebben Windows en Nvidia in de modus Prestaties gezet voordat we de onderstaande benchmarks uitvoerden. Advanced Optimus en GPU ECC worden niet ondersteund.
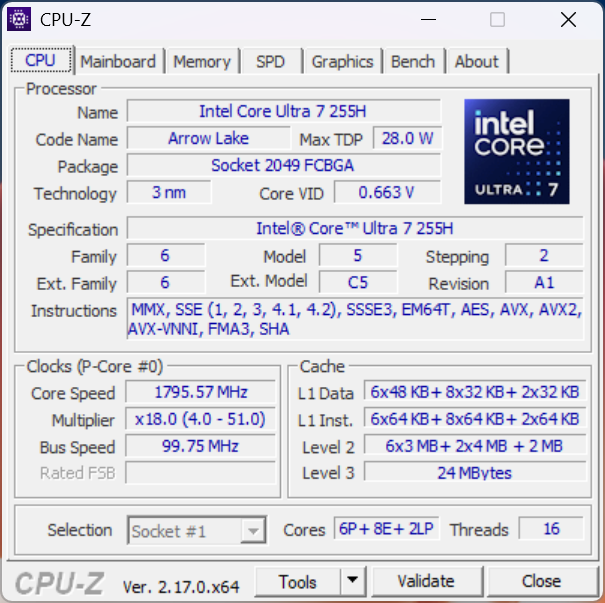
Processor
De Core Ultra 7 255H biedt 15 tot 20 procent snellere multi-thread prestaties dan de Core Ultra 7 155H in de ThinkPad P1 Gen 7 van vorig jaar. Upgraden naar de meest geavanceerde Core Ultra 9 285H configuratie zal de prestaties naar verwachting nog verder verhogen, zij het slechts marginaal met 5 tot 10 procent ten opzichte van de Core Ultra 7 255H.
De duurzaamheid van de prestaties is goed, maar niet perfect; wanneer CineBench R15 xT in een lus wordt uitgevoerd, daalt de oorspronkelijke score van 3388 punten met bijna 13 procent na slechts 4 of 5 cycli.
Cinebench R15 meervoudige lus
Cinebench R23: Multi Core | Single Core
Cinebench R20: CPU (Multi Core) | CPU (Single Core)
Cinebench R15: CPU Multi 64Bit | CPU Single 64Bit
Blender: v2.79 BMW27 CPU
7-Zip 18.03: 7z b 4 | 7z b 4 -mmt1
Geekbench 6.7: Multi-Core | Single-Core
Geekbench 5.5: Multi-Core | Single-Core
HWBOT x265 Benchmark v2.2: 4k Preset
LibreOffice : 20 Documents To PDF
R Benchmark 2.5: Overall mean
| CPU Performance rating | |
| Dell Pro Max 16 Plus | |
| HP ZBook Fury 16 G11 | |
| HP ZBook X G1i 16 | |
| Lenovo ThinkPad P1 Gen 8 | |
| Gemiddeld Intel Core Ultra 7 255H | |
| Lenovo ThinkPad P16s Gen 4 21RX000YGE | |
| Asus ExpertBook B6 Flip B6602FC2 -2! | |
| HP ZBook Studio 16 G11 | |
| Lenovo ThinkPad P1 Gen 7 21KV001SGE | |
| HP ZBook Power 16 G11 A | |
| HP ZBook Studio 16 G9 62U04EA -2! | |
| Lenovo ThinkPad P16s G2 21K9000CGE | |
| Lenovo ThinkPad P1 G4-20Y4Z9DVUS -2! | |
| Cinebench R23 / Multi Core | |
| Dell Pro Max 16 Plus | |
| HP ZBook Fury 16 G11 | |
| Lenovo ThinkPad P1 Gen 8 | |
| HP ZBook X G1i 16 | |
| Asus ExpertBook B6 Flip B6602FC2 | |
| Lenovo ThinkPad P1 Gen 7 21KV001SGE | |
| Gemiddeld Intel Core Ultra 7 255H (16105 - 22578, n=20) | |
| Lenovo ThinkPad P16s Gen 4 21RX000YGE | |
| HP ZBook Studio 16 G11 | |
| HP ZBook Studio 16 G9 62U04EA | |
| HP ZBook Power 16 G11 A | |
| Lenovo ThinkPad P16s G2 21K9000CGE | |
| Lenovo ThinkPad P1 G4-20Y4Z9DVUS | |
| Cinebench R23 / Single Core | |
| HP ZBook Fury 16 G11 | |
| Dell Pro Max 16 Plus | |
| Gemiddeld Intel Core Ultra 7 255H (1874 - 2152, n=20) | |
| HP ZBook X G1i 16 | |
| Lenovo ThinkPad P1 Gen 8 | |
| Lenovo ThinkPad P16s Gen 4 21RX000YGE | |
| Asus ExpertBook B6 Flip B6602FC2 | |
| HP ZBook Studio 16 G9 62U04EA | |
| Lenovo ThinkPad P1 Gen 7 21KV001SGE | |
| HP ZBook Studio 16 G11 | |
| HP ZBook Power 16 G11 A | |
| Lenovo ThinkPad P16s G2 21K9000CGE | |
| Lenovo ThinkPad P1 G4-20Y4Z9DVUS | |
| Cinebench R20 / CPU (Multi Core) | |
| Dell Pro Max 16 Plus | |
| HP ZBook Fury 16 G11 | |
| Lenovo ThinkPad P1 Gen 8 | |
| HP ZBook X G1i 16 | |
| Asus ExpertBook B6 Flip B6602FC2 | |
| Gemiddeld Intel Core Ultra 7 255H (6356 - 8860, n=19) | |
| Lenovo ThinkPad P1 Gen 7 21KV001SGE | |
| Lenovo ThinkPad P16s Gen 4 21RX000YGE | |
| HP ZBook Studio 16 G11 | |
| HP ZBook Studio 16 G9 62U04EA | |
| HP ZBook Power 16 G11 A | |
| Lenovo ThinkPad P16s G2 21K9000CGE | |
| Lenovo ThinkPad P1 G4-20Y4Z9DVUS | |
| Cinebench R20 / CPU (Single Core) | |
| HP ZBook Fury 16 G11 | |
| Dell Pro Max 16 Plus | |
| Lenovo ThinkPad P16s Gen 4 21RX000YGE | |
| Gemiddeld Intel Core Ultra 7 255H (743 - 826, n=19) | |
| HP ZBook X G1i 16 | |
| Lenovo ThinkPad P1 Gen 8 | |
| Asus ExpertBook B6 Flip B6602FC2 | |
| HP ZBook Studio 16 G9 62U04EA | |
| HP ZBook Studio 16 G11 | |
| Lenovo ThinkPad P1 Gen 7 21KV001SGE | |
| HP ZBook Power 16 G11 A | |
| Lenovo ThinkPad P16s G2 21K9000CGE | |
| Lenovo ThinkPad P1 G4-20Y4Z9DVUS | |
| Cinebench R15 / CPU Multi 64Bit | |
| Dell Pro Max 16 Plus | |
| HP ZBook Fury 16 G11 | |
| Asus ExpertBook B6 Flip B6602FC2 | |
| HP ZBook X G1i 16 | |
| Lenovo ThinkPad P1 Gen 8 | |
| Lenovo ThinkPad P16s Gen 4 21RX000YGE | |
| Lenovo ThinkPad P1 Gen 7 21KV001SGE | |
| Gemiddeld Intel Core Ultra 7 255H (2414 - 3444, n=19) | |
| HP ZBook Studio 16 G11 | |
| HP ZBook Power 16 G11 A | |
| HP ZBook Studio 16 G9 62U04EA | |
| Lenovo ThinkPad P16s G2 21K9000CGE | |
| Lenovo ThinkPad P1 G4-20Y4Z9DVUS | |
| Cinebench R15 / CPU Single 64Bit | |
| Lenovo ThinkPad P16s Gen 4 21RX000YGE | |
| Dell Pro Max 16 Plus | |
| HP ZBook X G1i 16 | |
| Gemiddeld Intel Core Ultra 7 255H (258 - 322, n=20) | |
| Lenovo ThinkPad P1 Gen 8 | |
| HP ZBook Fury 16 G11 | |
| HP ZBook Power 16 G11 A | |
| Asus ExpertBook B6 Flip B6602FC2 | |
| HP ZBook Studio 16 G9 62U04EA | |
| Lenovo ThinkPad P1 Gen 7 21KV001SGE | |
| Lenovo ThinkPad P16s G2 21K9000CGE | |
| HP ZBook Studio 16 G11 | |
| Lenovo ThinkPad P1 G4-20Y4Z9DVUS | |
| Blender / v2.79 BMW27 CPU | |
| Lenovo ThinkPad P1 G4-20Y4Z9DVUS | |
| Lenovo ThinkPad P16s G2 21K9000CGE | |
| HP ZBook Power 16 G11 A | |
| Gemiddeld Intel Core Ultra 7 255H (156 - 293, n=19) | |
| HP ZBook Studio 16 G9 62U04EA | |
| Asus ExpertBook B6 Flip B6602FC2 | |
| HP ZBook Studio 16 G11 | |
| Lenovo ThinkPad P1 Gen 7 21KV001SGE | |
| Lenovo ThinkPad P16s Gen 4 21RX000YGE | |
| Lenovo ThinkPad P1 Gen 8 | |
| HP ZBook X G1i 16 | |
| HP ZBook Fury 16 G11 | |
| Dell Pro Max 16 Plus | |
| 7-Zip 18.03 / 7z b 4 | |
| Dell Pro Max 16 Plus | |
| HP ZBook Fury 16 G11 | |
| HP ZBook Studio 16 G11 | |
| Lenovo ThinkPad P16s Gen 4 21RX000YGE | |
| Asus ExpertBook B6 Flip B6602FC2 | |
| Lenovo ThinkPad P1 Gen 7 21KV001SGE | |
| HP ZBook Studio 16 G9 62U04EA | |
| HP ZBook X G1i 16 | |
| HP ZBook Power 16 G11 A | |
| Lenovo ThinkPad P1 Gen 8 | |
| Lenovo ThinkPad P16s G2 21K9000CGE | |
| Gemiddeld Intel Core Ultra 7 255H (42155 - 70397, n=20) | |
| Lenovo ThinkPad P1 G4-20Y4Z9DVUS | |
| 7-Zip 18.03 / 7z b 4 -mmt1 | |
| HP ZBook Fury 16 G11 | |
| Dell Pro Max 16 Plus | |
| HP ZBook Power 16 G11 A | |
| Lenovo ThinkPad P16s Gen 4 21RX000YGE | |
| Asus ExpertBook B6 Flip B6602FC2 | |
| HP ZBook X G1i 16 | |
| HP ZBook Studio 16 G9 62U04EA | |
| Lenovo ThinkPad P16s G2 21K9000CGE | |
| Gemiddeld Intel Core Ultra 7 255H (4589 - 6385, n=20) | |
| Lenovo ThinkPad P1 G4-20Y4Z9DVUS | |
| Lenovo ThinkPad P1 Gen 7 21KV001SGE | |
| HP ZBook Studio 16 G11 | |
| Lenovo ThinkPad P1 Gen 8 | |
| Geekbench 6.7 / Multi-Core | |
| Dell Pro Max 16 Plus | |
| HP ZBook X G1i 16 | |
| Lenovo ThinkPad P1 Gen 8 | |
| Gemiddeld Intel Core Ultra 7 255H (11979 - 17489, n=20) | |
| HP ZBook Fury 16 G11 | |
| Lenovo ThinkPad P16s Gen 4 21RX000YGE | |
| HP ZBook Studio 16 G11 | |
| Lenovo ThinkPad P1 Gen 7 21KV001SGE | |
| HP ZBook Power 16 G11 A | |
| Lenovo ThinkPad P16s G2 21K9000CGE | |
| Geekbench 6.7 / Single-Core | |
| Lenovo ThinkPad P16s Gen 4 21RX000YGE | |
| HP ZBook Fury 16 G11 | |
| HP ZBook X G1i 16 | |
| Dell Pro Max 16 Plus | |
| Gemiddeld Intel Core Ultra 7 255H (2712 - 2939, n=20) | |
| Lenovo ThinkPad P1 Gen 8 | |
| HP ZBook Power 16 G11 A | |
| HP ZBook Studio 16 G11 | |
| Lenovo ThinkPad P16s G2 21K9000CGE | |
| Lenovo ThinkPad P1 Gen 7 21KV001SGE | |
| Geekbench 5.5 / Multi-Core | |
| Dell Pro Max 16 Plus | |
| HP ZBook Fury 16 G11 | |
| Lenovo ThinkPad P1 Gen 8 | |
| HP ZBook X G1i 16 | |
| Asus ExpertBook B6 Flip B6602FC2 | |
| Lenovo ThinkPad P16s Gen 4 21RX000YGE | |
| Gemiddeld Intel Core Ultra 7 255H (11348 - 17218, n=19) | |
| HP ZBook Studio 16 G11 | |
| Lenovo ThinkPad P1 Gen 7 21KV001SGE | |
| HP ZBook Studio 16 G9 62U04EA | |
| HP ZBook Power 16 G11 A | |
| Lenovo ThinkPad P16s G2 21K9000CGE | |
| Lenovo ThinkPad P1 G4-20Y4Z9DVUS | |
| Geekbench 5.5 / Single-Core | |
| Lenovo ThinkPad P16s Gen 4 21RX000YGE | |
| Dell Pro Max 16 Plus | |
| HP ZBook X G1i 16 | |
| Gemiddeld Intel Core Ultra 7 255H (1938 - 2121, n=19) | |
| HP ZBook Fury 16 G11 | |
| Lenovo ThinkPad P1 Gen 8 | |
| HP ZBook Power 16 G11 A | |
| Asus ExpertBook B6 Flip B6602FC2 | |
| HP ZBook Studio 16 G11 | |
| HP ZBook Studio 16 G9 62U04EA | |
| Lenovo ThinkPad P1 Gen 7 21KV001SGE | |
| Lenovo ThinkPad P16s G2 21K9000CGE | |
| Lenovo ThinkPad P1 G4-20Y4Z9DVUS | |
| HWBOT x265 Benchmark v2.2 / 4k Preset | |
| Dell Pro Max 16 Plus | |
| HP ZBook Fury 16 G11 | |
| Lenovo ThinkPad P1 Gen 8 | |
| HP ZBook X G1i 16 | |
| Lenovo ThinkPad P16s Gen 4 21RX000YGE | |
| Asus ExpertBook B6 Flip B6602FC2 | |
| Gemiddeld Intel Core Ultra 7 255H (13.7 - 26.5, n=19) | |
| Lenovo ThinkPad P1 Gen 7 21KV001SGE | |
| HP ZBook Studio 16 G11 | |
| HP ZBook Power 16 G11 A | |
| HP ZBook Studio 16 G9 62U04EA | |
| Lenovo ThinkPad P16s G2 21K9000CGE | |
| Lenovo ThinkPad P1 G4-20Y4Z9DVUS | |
| LibreOffice / 20 Documents To PDF | |
| Lenovo ThinkPad P16s Gen 4 21RX000YGE | |
| Lenovo ThinkPad P16s G2 21K9000CGE | |
| HP ZBook Power 16 G11 A | |
| Lenovo ThinkPad P1 G4-20Y4Z9DVUS | |
| HP ZBook Fury 16 G11 | |
| Gemiddeld Intel Core Ultra 7 255H (41.1 - 61.6, n=19) | |
| HP ZBook Studio 16 G11 | |
| Lenovo ThinkPad P1 Gen 7 21KV001SGE | |
| HP ZBook Studio 16 G9 62U04EA | |
| Dell Pro Max 16 Plus | |
| Asus ExpertBook B6 Flip B6602FC2 | |
| HP ZBook X G1i 16 | |
| Lenovo ThinkPad P1 Gen 8 | |
| R Benchmark 2.5 / Overall mean | |
| Lenovo ThinkPad P16s Gen 4 21RX000YGE | |
| Lenovo ThinkPad P1 G4-20Y4Z9DVUS | |
| Lenovo ThinkPad P16s G2 21K9000CGE | |
| Lenovo ThinkPad P1 Gen 7 21KV001SGE | |
| HP ZBook Studio 16 G11 | |
| Asus ExpertBook B6 Flip B6602FC2 | |
| HP ZBook Power 16 G11 A | |
| Gemiddeld Intel Core Ultra 7 255H (0.4233 - 0.515, n=19) | |
| HP ZBook Studio 16 G9 62U04EA | |
| Lenovo ThinkPad P1 Gen 8 | |
| Dell Pro Max 16 Plus | |
| HP ZBook X G1i 16 | |
| HP ZBook Fury 16 G11 | |
Cinebench R23: Multi Core | Single Core
Cinebench R20: CPU (Multi Core) | CPU (Single Core)
Cinebench R15: CPU Multi 64Bit | CPU Single 64Bit
Blender: v2.79 BMW27 CPU
7-Zip 18.03: 7z b 4 | 7z b 4 -mmt1
Geekbench 6.7: Multi-Core | Single-Core
Geekbench 5.5: Multi-Core | Single-Core
HWBOT x265 Benchmark v2.2: 4k Preset
LibreOffice : 20 Documents To PDF
R Benchmark 2.5: Overall mean
* ... kleiner is beter
AIDA64: FP32 Ray-Trace | FPU Julia | CPU SHA3 | CPU Queen | FPU SinJulia | FPU Mandel | CPU AES | CPU ZLib | FP64 Ray-Trace | CPU PhotoWorxx
| Performance rating | |
| Dell Pro Max 16 Plus | |
| Lenovo ThinkPad P16s Gen 4 21RX000YGE | |
| Lenovo ThinkPad P1 Gen 8 | |
| Lenovo ThinkPad P1 Gen 7 21KV001SGE | |
| Gemiddeld Intel Core Ultra 7 255H | |
| Asus ExpertBook B6 Flip B6602FC2 | |
| AIDA64 / FP32 Ray-Trace | |
| Dell Pro Max 16 Plus | |
| Lenovo ThinkPad P16s Gen 4 21RX000YGE | |
| Lenovo ThinkPad P1 Gen 8 | |
| Gemiddeld Intel Core Ultra 7 255H (13863 - 24741, n=17) | |
| Lenovo ThinkPad P1 Gen 7 21KV001SGE | |
| Asus ExpertBook B6 Flip B6602FC2 | |
| AIDA64 / FPU Julia | |
| Dell Pro Max 16 Plus | |
| Lenovo ThinkPad P1 Gen 8 | |
| Lenovo ThinkPad P16s Gen 4 21RX000YGE | |
| Gemiddeld Intel Core Ultra 7 255H (71030 - 119222, n=17) | |
| Lenovo ThinkPad P1 Gen 7 21KV001SGE | |
| Asus ExpertBook B6 Flip B6602FC2 | |
| AIDA64 / CPU SHA3 | |
| Dell Pro Max 16 Plus | |
| Lenovo ThinkPad P1 Gen 8 | |
| Lenovo ThinkPad P16s Gen 4 21RX000YGE | |
| Gemiddeld Intel Core Ultra 7 255H (3408 - 5548, n=17) | |
| Lenovo ThinkPad P1 Gen 7 21KV001SGE | |
| Asus ExpertBook B6 Flip B6602FC2 | |
| AIDA64 / CPU Queen | |
| Dell Pro Max 16 Plus | |
| Asus ExpertBook B6 Flip B6602FC2 | |
| Lenovo ThinkPad P16s Gen 4 21RX000YGE | |
| Lenovo ThinkPad P1 Gen 7 21KV001SGE | |
| Lenovo ThinkPad P1 Gen 8 | |
| Gemiddeld Intel Core Ultra 7 255H (59098 - 68460, n=16) | |
| AIDA64 / FPU SinJulia | |
| Lenovo ThinkPad P16s Gen 4 21RX000YGE | |
| Dell Pro Max 16 Plus | |
| Asus ExpertBook B6 Flip B6602FC2 | |
| Lenovo ThinkPad P1 Gen 7 21KV001SGE | |
| Lenovo ThinkPad P1 Gen 8 | |
| Gemiddeld Intel Core Ultra 7 255H (6716 - 9006, n=17) | |
| AIDA64 / FPU Mandel | |
| Dell Pro Max 16 Plus | |
| Lenovo ThinkPad P1 Gen 8 | |
| Lenovo ThinkPad P16s Gen 4 21RX000YGE | |
| Gemiddeld Intel Core Ultra 7 255H (37031 - 63347, n=17) | |
| Lenovo ThinkPad P1 Gen 7 21KV001SGE | |
| Asus ExpertBook B6 Flip B6602FC2 | |
| AIDA64 / CPU AES | |
| Dell Pro Max 16 Plus | |
| Lenovo ThinkPad P16s Gen 4 21RX000YGE | |
| Lenovo ThinkPad P1 Gen 7 21KV001SGE | |
| Lenovo ThinkPad P1 Gen 8 | |
| Asus ExpertBook B6 Flip B6602FC2 | |
| Gemiddeld Intel Core Ultra 7 255H (58402 - 83568, n=17) | |
| AIDA64 / CPU ZLib | |
| Dell Pro Max 16 Plus | |
| Lenovo ThinkPad P1 Gen 8 | |
| Lenovo ThinkPad P16s Gen 4 21RX000YGE | |
| Lenovo ThinkPad P1 Gen 7 21KV001SGE | |
| Gemiddeld Intel Core Ultra 7 255H (822 - 1316, n=17) | |
| Asus ExpertBook B6 Flip B6602FC2 | |
| AIDA64 / FP64 Ray-Trace | |
| Dell Pro Max 16 Plus | |
| Lenovo ThinkPad P16s Gen 4 21RX000YGE | |
| Lenovo ThinkPad P1 Gen 8 | |
| Gemiddeld Intel Core Ultra 7 255H (7384 - 13231, n=17) | |
| Lenovo ThinkPad P1 Gen 7 21KV001SGE | |
| Asus ExpertBook B6 Flip B6602FC2 | |
| AIDA64 / CPU PhotoWorxx | |
| Dell Pro Max 16 Plus | |
| Lenovo ThinkPad P1 Gen 8 | |
| Gemiddeld Intel Core Ultra 7 255H (23836 - 65787, n=17) | |
| Lenovo ThinkPad P16s Gen 4 21RX000YGE | |
| Lenovo ThinkPad P1 Gen 7 21KV001SGE | |
| Asus ExpertBook B6 Flip B6602FC2 | |
Systeemprestaties
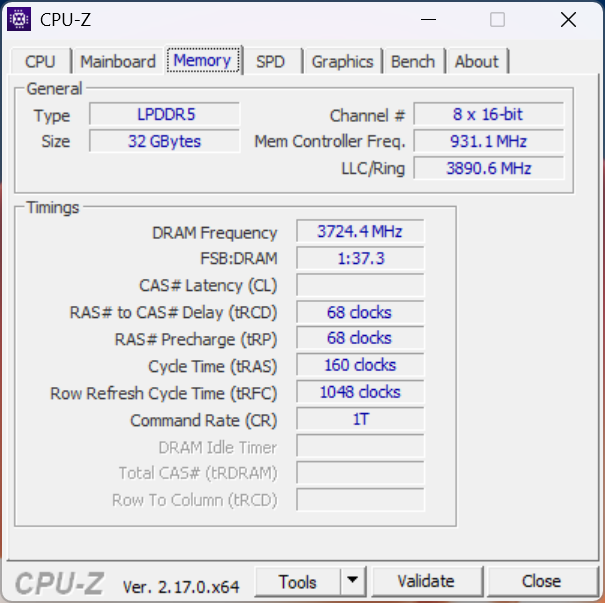
De RAM benchmarkscores van AIDA64 zijn opvallend goed voor een laptop met 32 GB verwisselbaar geheugen. Het model wordt standaard geleverd met LPDDR5x-7467 LPCAMM2, dat is ontworpen om veel van de beperkingen van SODIMM te overwinnen.
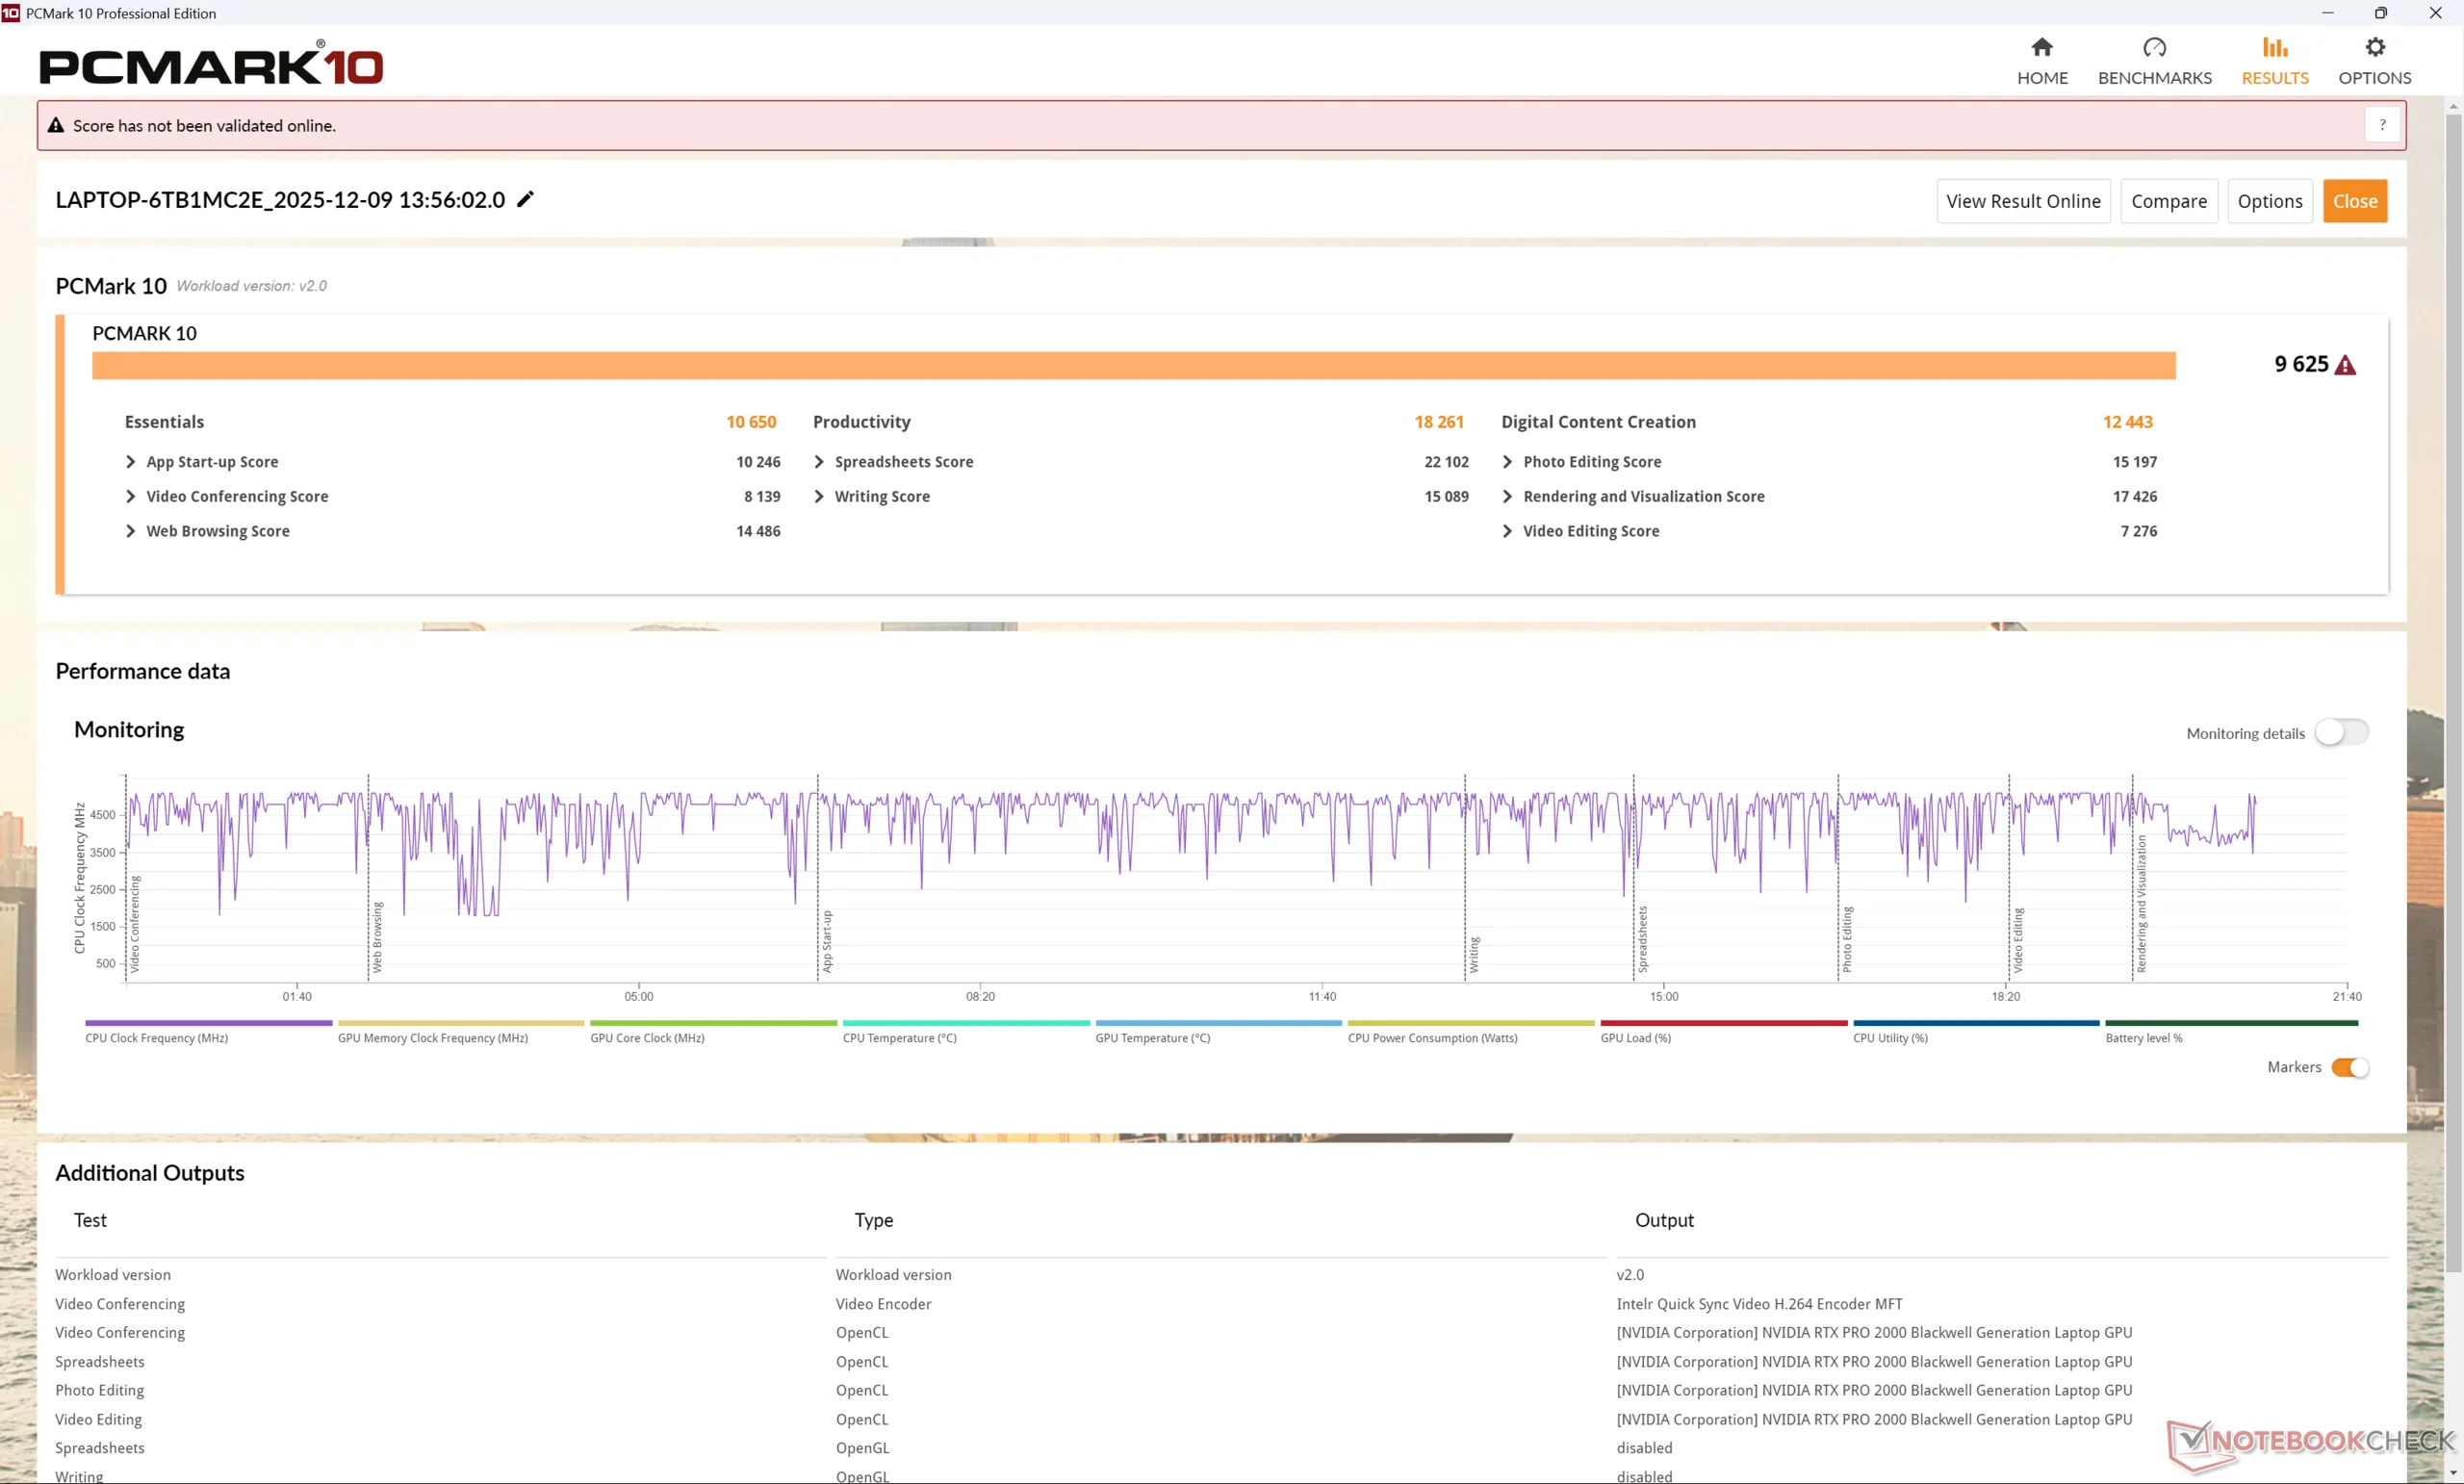
PCMark 10: Score | Essentials | Productivity | Digital Content Creation
CrossMark: Overall | Productivity | Creativity | Responsiveness
WebXPRT 3: Overall
WebXPRT 4: Overall
Mozilla Kraken 1.1: Total
| Performance rating | |
| Dell Pro Max 16 Plus -4! | |
| Lenovo ThinkPad P1 Gen 8 | |
| Gemiddeld Intel Core Ultra 7 255H, NVIDIA RTX PRO 2000 Blackwell Generation Laptop | |
| HP ZBook X G1i 16 -4! | |
| Asus ExpertBook B6 Flip B6602FC2 | |
| Lenovo ThinkPad P1 Gen 7 21KV001SGE | |
| Lenovo ThinkPad P16s Gen 4 21RX000YGE | |
| PCMark 10 / Score | |
| Gemiddeld Intel Core Ultra 7 255H, NVIDIA RTX PRO 2000 Blackwell Generation Laptop (9625 - 9723, n=2) | |
| Lenovo ThinkPad P1 Gen 8 | |
| Lenovo ThinkPad P16s Gen 4 21RX000YGE | |
| Lenovo ThinkPad P1 Gen 7 21KV001SGE | |
| Asus ExpertBook B6 Flip B6602FC2 | |
| PCMark 10 / Essentials | |
| Asus ExpertBook B6 Flip B6602FC2 | |
| Gemiddeld Intel Core Ultra 7 255H, NVIDIA RTX PRO 2000 Blackwell Generation Laptop (10650 - 10921, n=2) | |
| Lenovo ThinkPad P16s Gen 4 21RX000YGE | |
| Lenovo ThinkPad P1 Gen 8 | |
| Lenovo ThinkPad P1 Gen 7 21KV001SGE | |
| PCMark 10 / Productivity | |
| Lenovo ThinkPad P1 Gen 8 | |
| Gemiddeld Intel Core Ultra 7 255H, NVIDIA RTX PRO 2000 Blackwell Generation Laptop (18083 - 18261, n=2) | |
| Asus ExpertBook B6 Flip B6602FC2 | |
| Lenovo ThinkPad P16s Gen 4 21RX000YGE | |
| Lenovo ThinkPad P1 Gen 7 21KV001SGE | |
| PCMark 10 / Digital Content Creation | |
| Gemiddeld Intel Core Ultra 7 255H, NVIDIA RTX PRO 2000 Blackwell Generation Laptop (12443 - 12631, n=2) | |
| Lenovo ThinkPad P1 Gen 8 | |
| Lenovo ThinkPad P1 Gen 7 21KV001SGE | |
| Lenovo ThinkPad P16s Gen 4 21RX000YGE | |
| Asus ExpertBook B6 Flip B6602FC2 | |
| CrossMark / Overall | |
| Dell Pro Max 16 Plus | |
| HP ZBook X G1i 16 | |
| Asus ExpertBook B6 Flip B6602FC2 | |
| Lenovo ThinkPad P1 Gen 8 | |
| Gemiddeld Intel Core Ultra 7 255H, NVIDIA RTX PRO 2000 Blackwell Generation Laptop (1942 - 1953, n=2) | |
| Lenovo ThinkPad P1 Gen 7 21KV001SGE | |
| Lenovo ThinkPad P16s Gen 4 21RX000YGE | |
| CrossMark / Productivity | |
| Dell Pro Max 16 Plus | |
| HP ZBook X G1i 16 | |
| Asus ExpertBook B6 Flip B6602FC2 | |
| Lenovo ThinkPad P1 Gen 8 | |
| Gemiddeld Intel Core Ultra 7 255H, NVIDIA RTX PRO 2000 Blackwell Generation Laptop (1834 - 1836, n=2) | |
| Lenovo ThinkPad P1 Gen 7 21KV001SGE | |
| Lenovo ThinkPad P16s Gen 4 21RX000YGE | |
| CrossMark / Creativity | |
| Dell Pro Max 16 Plus | |
| HP ZBook X G1i 16 | |
| Gemiddeld Intel Core Ultra 7 255H, NVIDIA RTX PRO 2000 Blackwell Generation Laptop (2211 - 2232, n=2) | |
| Lenovo ThinkPad P1 Gen 8 | |
| Asus ExpertBook B6 Flip B6602FC2 | |
| Lenovo ThinkPad P1 Gen 7 21KV001SGE | |
| Lenovo ThinkPad P16s Gen 4 21RX000YGE | |
| CrossMark / Responsiveness | |
| Dell Pro Max 16 Plus | |
| Asus ExpertBook B6 Flip B6602FC2 | |
| Lenovo ThinkPad P1 Gen 8 | |
| Gemiddeld Intel Core Ultra 7 255H, NVIDIA RTX PRO 2000 Blackwell Generation Laptop (1520 - 1622, n=2) | |
| HP ZBook X G1i 16 | |
| Lenovo ThinkPad P1 Gen 7 21KV001SGE | |
| Lenovo ThinkPad P16s Gen 4 21RX000YGE | |
| WebXPRT 3 / Overall | |
| Lenovo ThinkPad P1 Gen 8 | |
| Dell Pro Max 16 Plus | |
| Gemiddeld Intel Core Ultra 7 255H, NVIDIA RTX PRO 2000 Blackwell Generation Laptop (322 - 330, n=2) | |
| HP ZBook X G1i 16 | |
| Lenovo ThinkPad P16s Gen 4 21RX000YGE | |
| Asus ExpertBook B6 Flip B6602FC2 | |
| Lenovo ThinkPad P1 Gen 7 21KV001SGE | |
| WebXPRT 4 / Overall | |
| Dell Pro Max 16 Plus | |
| Gemiddeld Intel Core Ultra 7 255H, NVIDIA RTX PRO 2000 Blackwell Generation Laptop (298 - 307, n=2) | |
| HP ZBook X G1i 16 | |
| Lenovo ThinkPad P1 Gen 8 | |
| Asus ExpertBook B6 Flip B6602FC2 | |
| Lenovo ThinkPad P1 Gen 7 21KV001SGE | |
| Lenovo ThinkPad P16s Gen 4 21RX000YGE | |
| Mozilla Kraken 1.1 / Total | |
| Lenovo ThinkPad P1 Gen 7 21KV001SGE | |
| Asus ExpertBook B6 Flip B6602FC2 | |
| Lenovo ThinkPad P16s Gen 4 21RX000YGE | |
| Lenovo ThinkPad P1 Gen 8 | |
| HP ZBook X G1i 16 | |
| Gemiddeld Intel Core Ultra 7 255H, NVIDIA RTX PRO 2000 Blackwell Generation Laptop (448 - 461, n=2) | |
| Dell Pro Max 16 Plus | |
* ... kleiner is beter
| PCMark 10 Score | 9625 punten | |
Help | ||
| AIDA64 / Memory Copy | |
| Lenovo ThinkPad P1 Gen 8 | |
| Dell Pro Max 16 Plus | |
| Gemiddeld Intel Core Ultra 7 255H (39188 - 110930, n=17) | |
| Lenovo ThinkPad P16s Gen 4 21RX000YGE | |
| Lenovo ThinkPad P1 Gen 7 21KV001SGE | |
| Asus ExpertBook B6 Flip B6602FC2 | |
| AIDA64 / Memory Read | |
| Dell Pro Max 16 Plus | |
| Lenovo ThinkPad P16s Gen 4 21RX000YGE | |
| Gemiddeld Intel Core Ultra 7 255H (43703 - 90552, n=17) | |
| Lenovo ThinkPad P1 Gen 8 | |
| Lenovo ThinkPad P1 Gen 7 21KV001SGE | |
| Asus ExpertBook B6 Flip B6602FC2 | |
| AIDA64 / Memory Write | |
| Dell Pro Max 16 Plus | |
| Lenovo ThinkPad P16s Gen 4 21RX000YGE | |
| Gemiddeld Intel Core Ultra 7 255H (36438 - 87199, n=17) | |
| Lenovo ThinkPad P1 Gen 7 21KV001SGE | |
| Lenovo ThinkPad P1 Gen 8 | |
| Asus ExpertBook B6 Flip B6602FC2 | |
| AIDA64 / Memory Latency | |
| Lenovo ThinkPad P1 Gen 8 | |
| Lenovo ThinkPad P1 Gen 7 21KV001SGE | |
| Gemiddeld Intel Core Ultra 7 255H (107.6 - 147.2, n=17) | |
| Dell Pro Max 16 Plus | |
| Lenovo ThinkPad P16s Gen 4 21RX000YGE | |
| Asus ExpertBook B6 Flip B6602FC2 | |
* ... kleiner is beter
DPC latentie
LatencyMon laat kleine DPC-problemen zien, maar verder geen dropped frames tijdens het afspelen van 4K60-video.
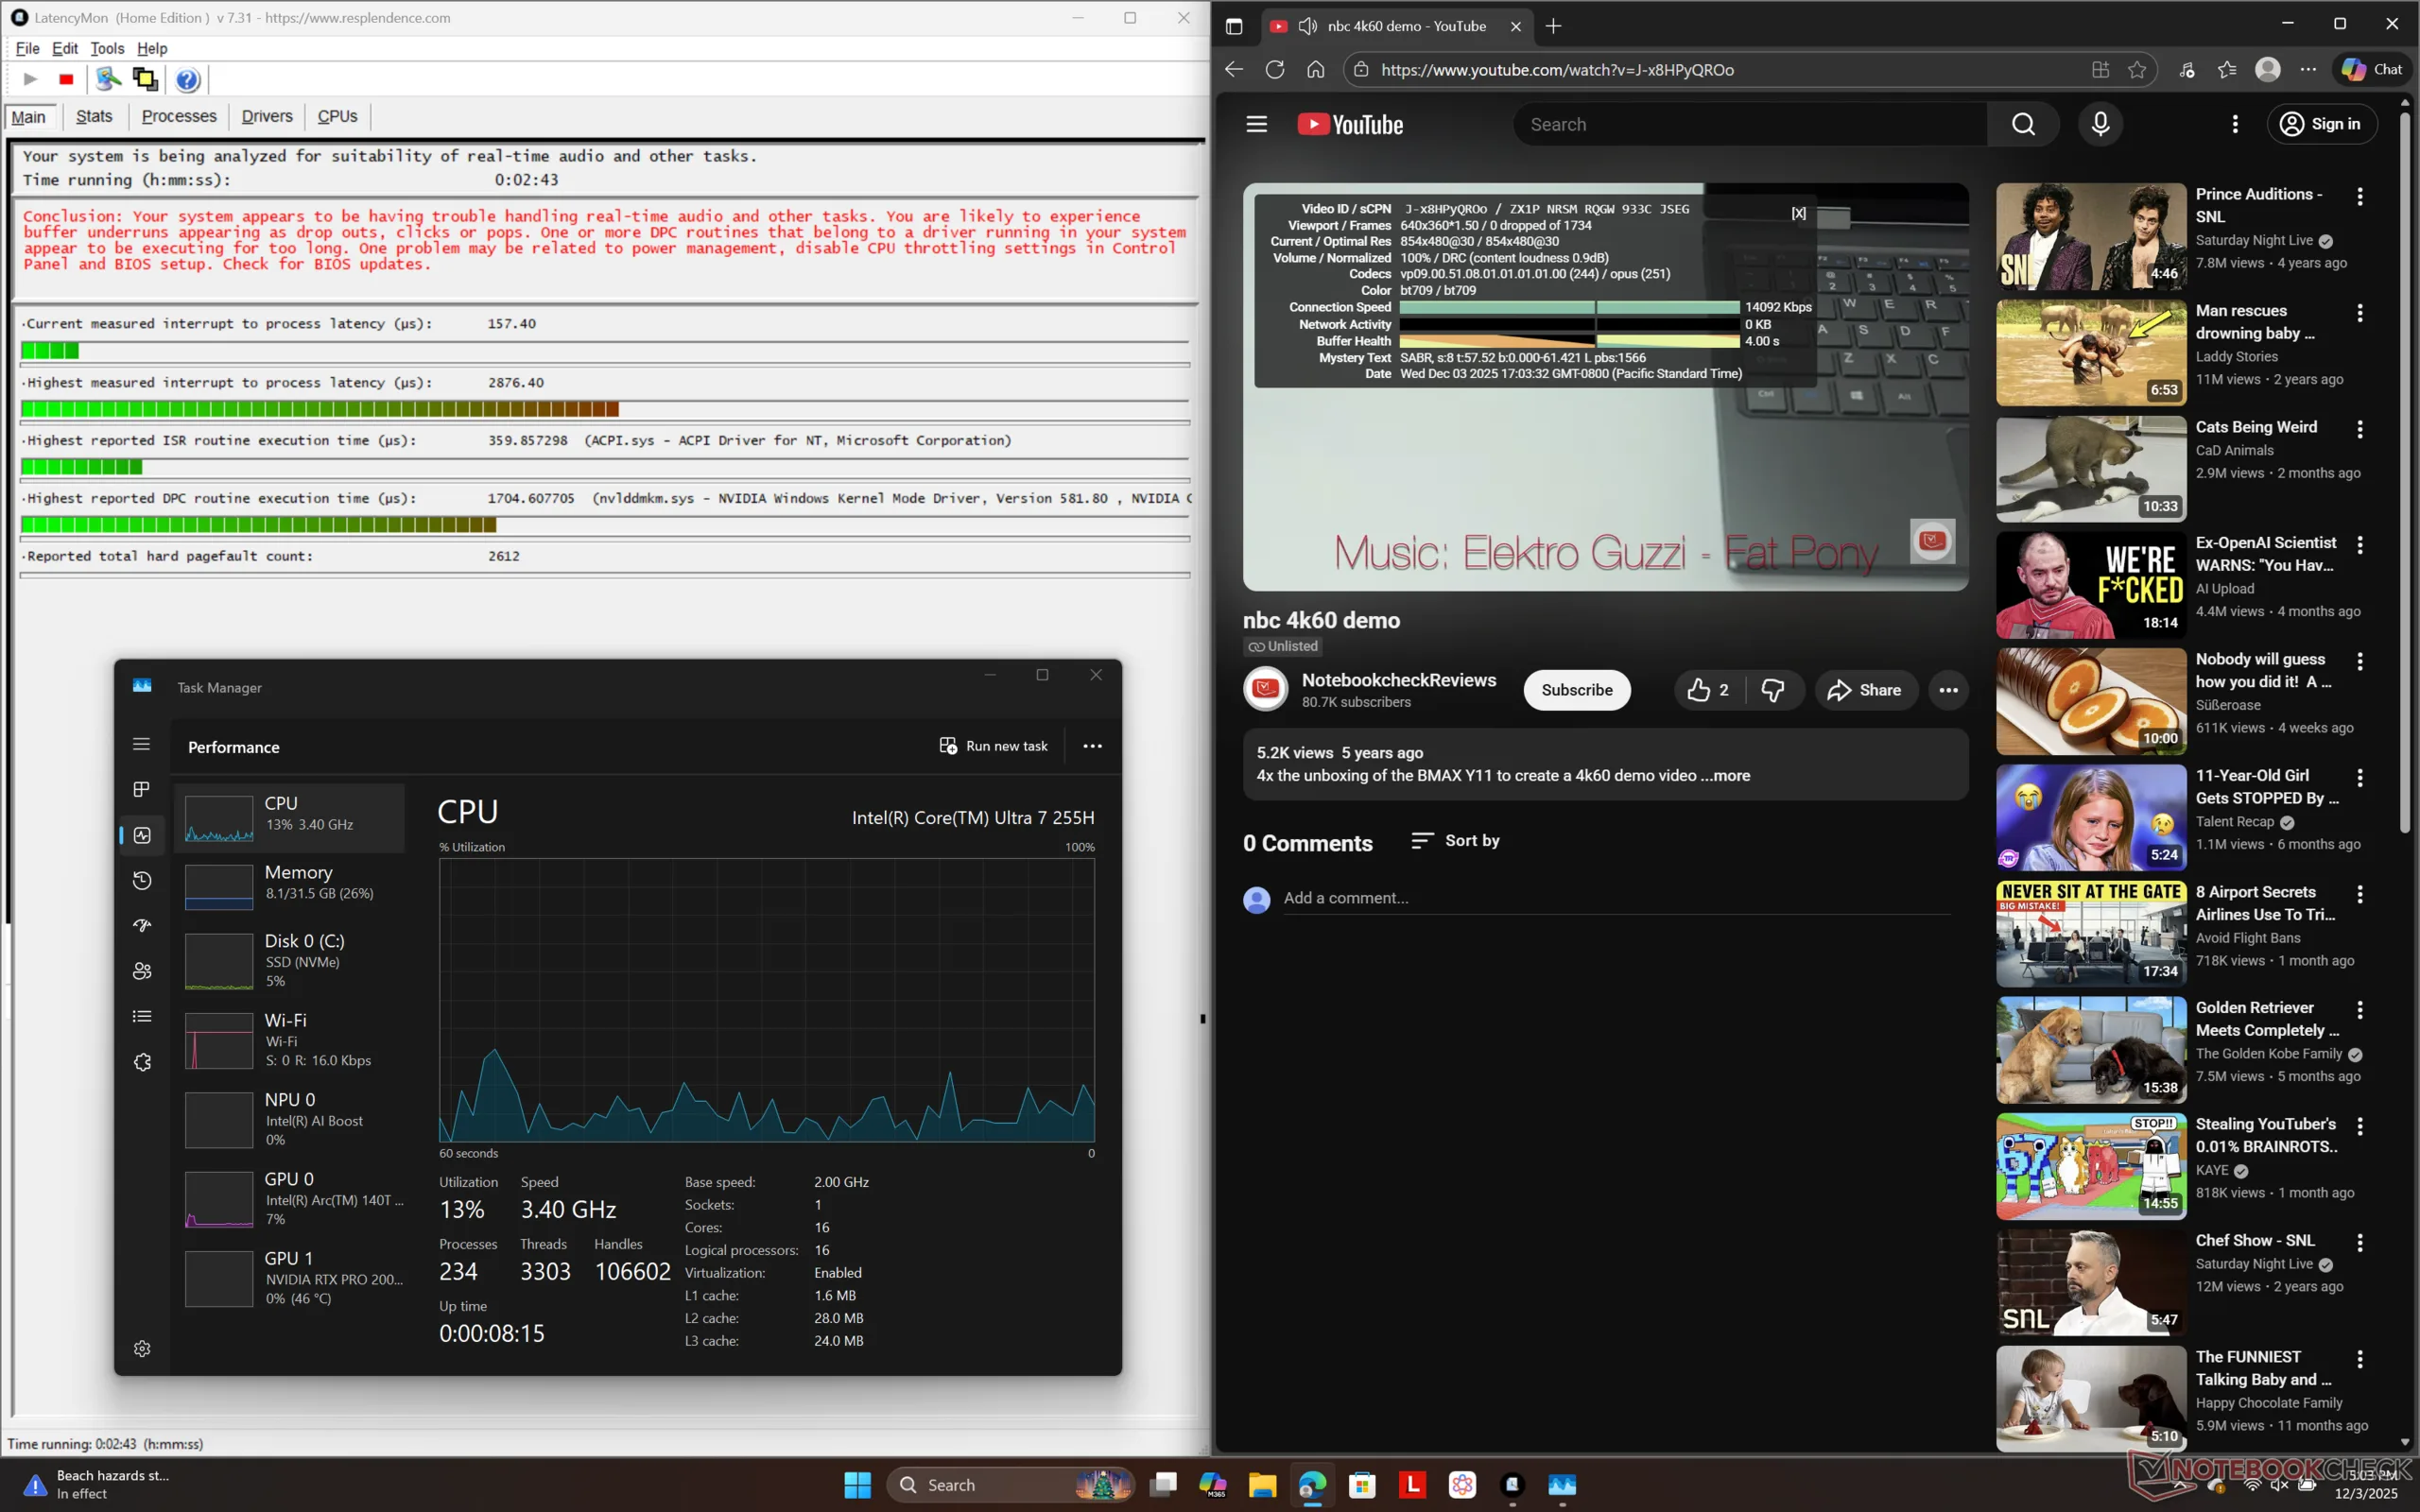
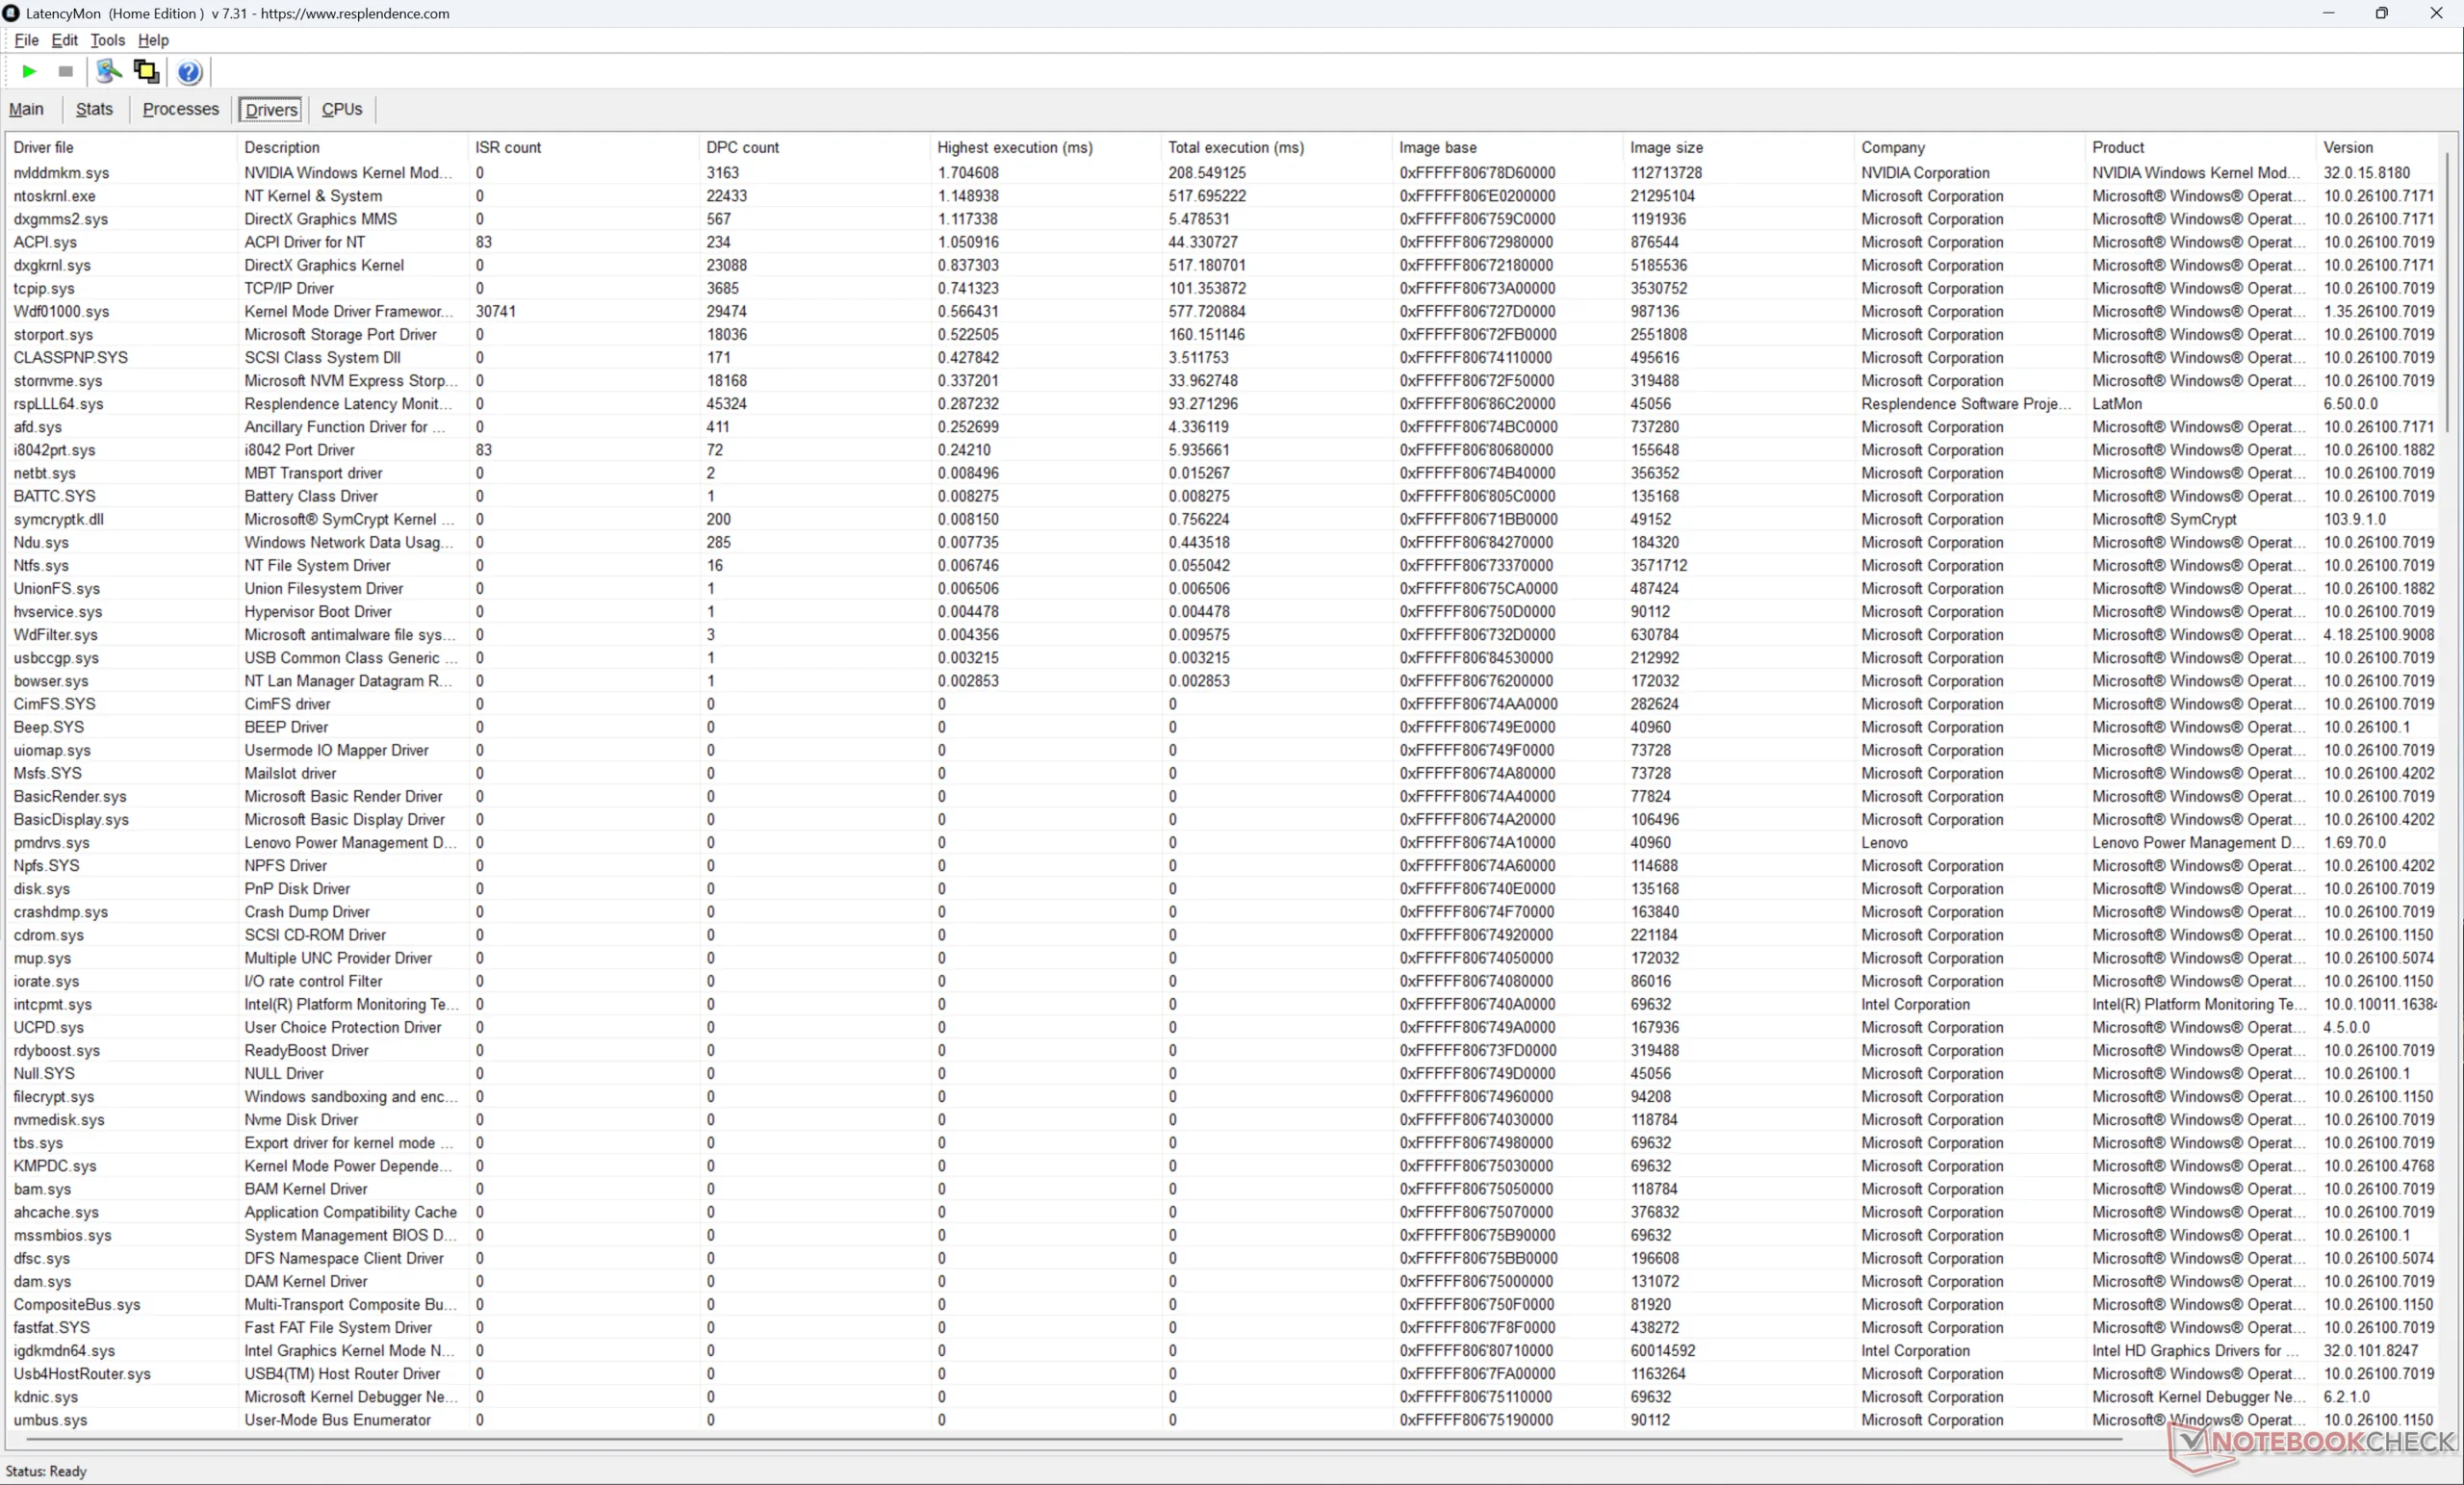
| DPC Latencies / LatencyMon - interrupt to process latency (max), Web, Youtube, Prime95 | |
| Lenovo ThinkPad P1 Gen 8 | |
| Dell Pro Max 16 Plus | |
| Asus ExpertBook B6 Flip B6602FC2 | |
| Lenovo ThinkPad P1 Gen 7 21KV001SGE | |
| Lenovo ThinkPad P16s Gen 4 21RX000YGE | |
| HP ZBook X G1i 16 | |
* ... kleiner is beter
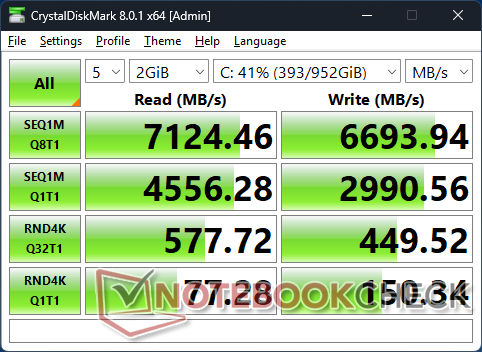
Opslagapparaten
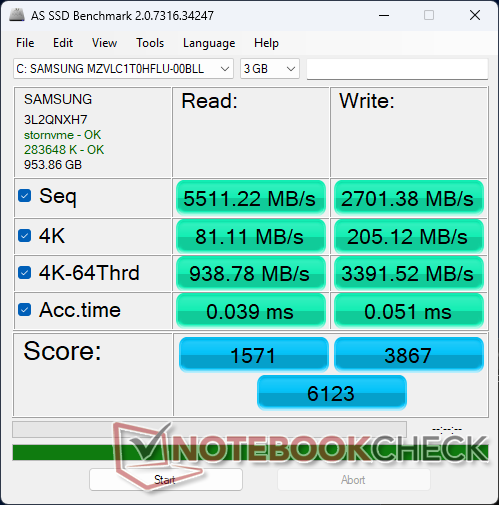
Ons testapparaat wordt geleverd met de Samsung PM9E1 PCIe5 NVMe SSD, terwijl de ThinkPad P1 Gen 7 van vorig jaar werd geleverd met de Kioxia XG8 KXG8AZNV1T02 PCIe4 NVMe SSD. De overdrachtsnelheden zijn hoger, tot een stabiele 7000 MB/s.

* ... kleiner is beter
Schijf onderdrukken: DiskSpd Leeslus, wachtrijdiepte 8
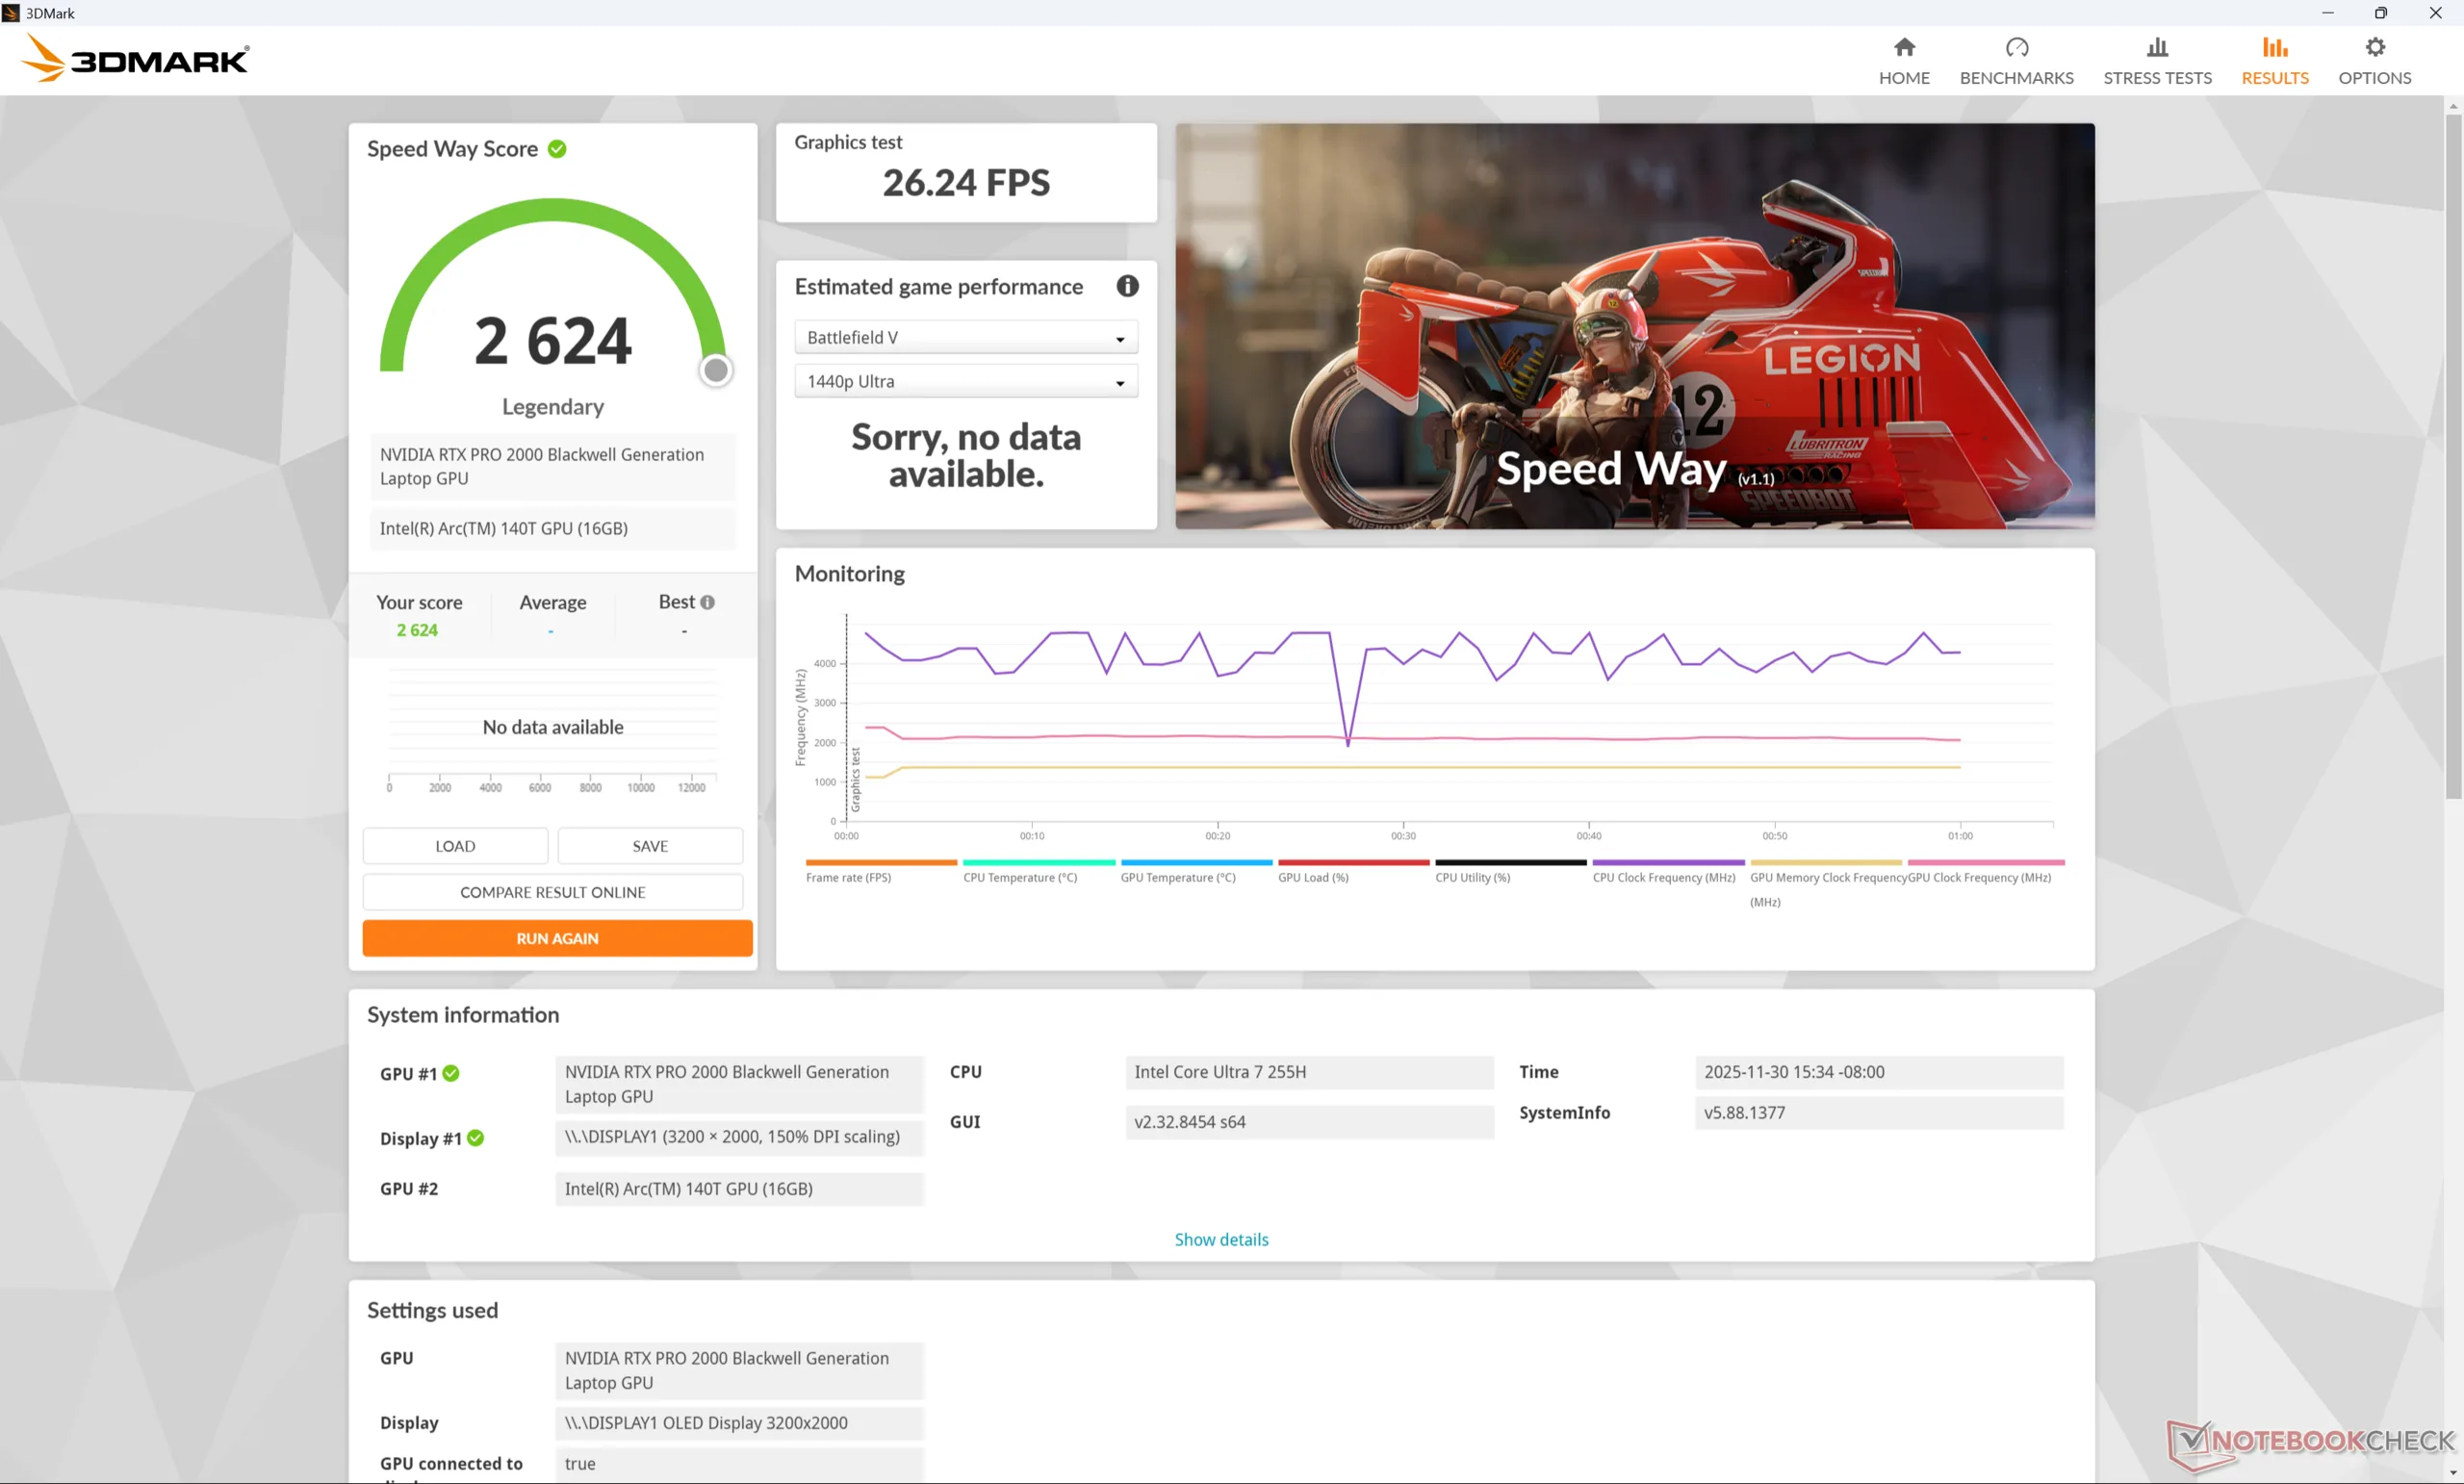
GPU-prestaties
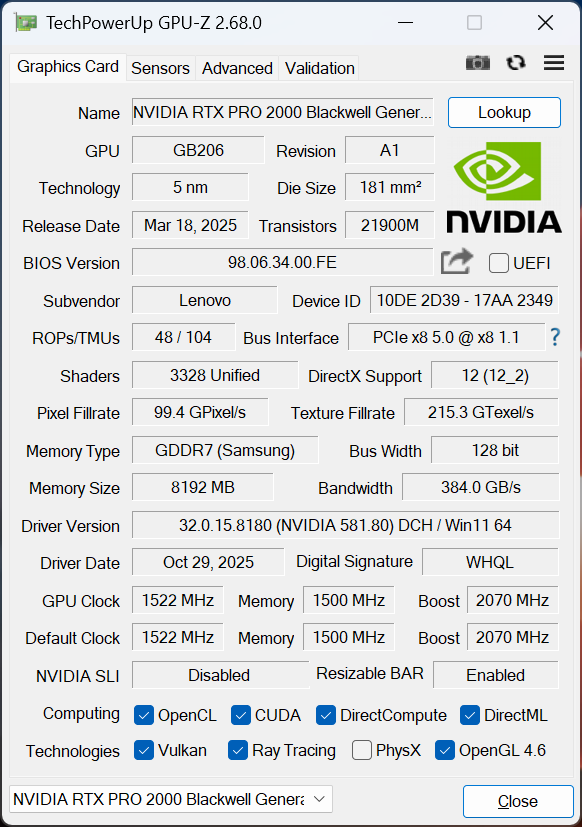
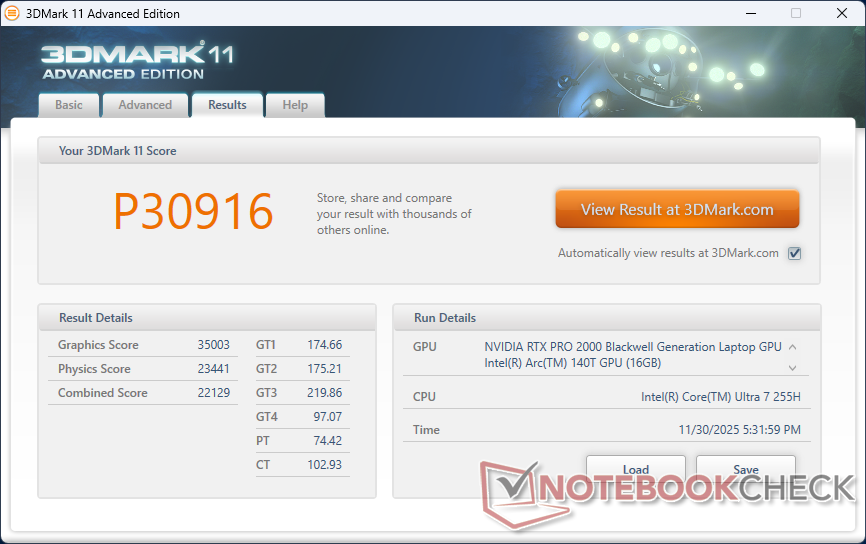
De mobiele RTX Pro 2000 Blackwell is afgeleid van de mobiele GeForce RTX 5060 en ze hebben dus allebei dezelfde kenmerken, waaronder het totale aantal unified pipelines, TMU's, tensor cores en geheugenbandbreedte. De prestaties zijn over het algemeen vergelijkbaar met die van de mobiele RTX Pro 3000 Ada voordat rekening wordt gehouden met Blackwell-specifieke verbeteringen zoals de 5e generatie tensor cores of 6e generatie NVDEC engines.
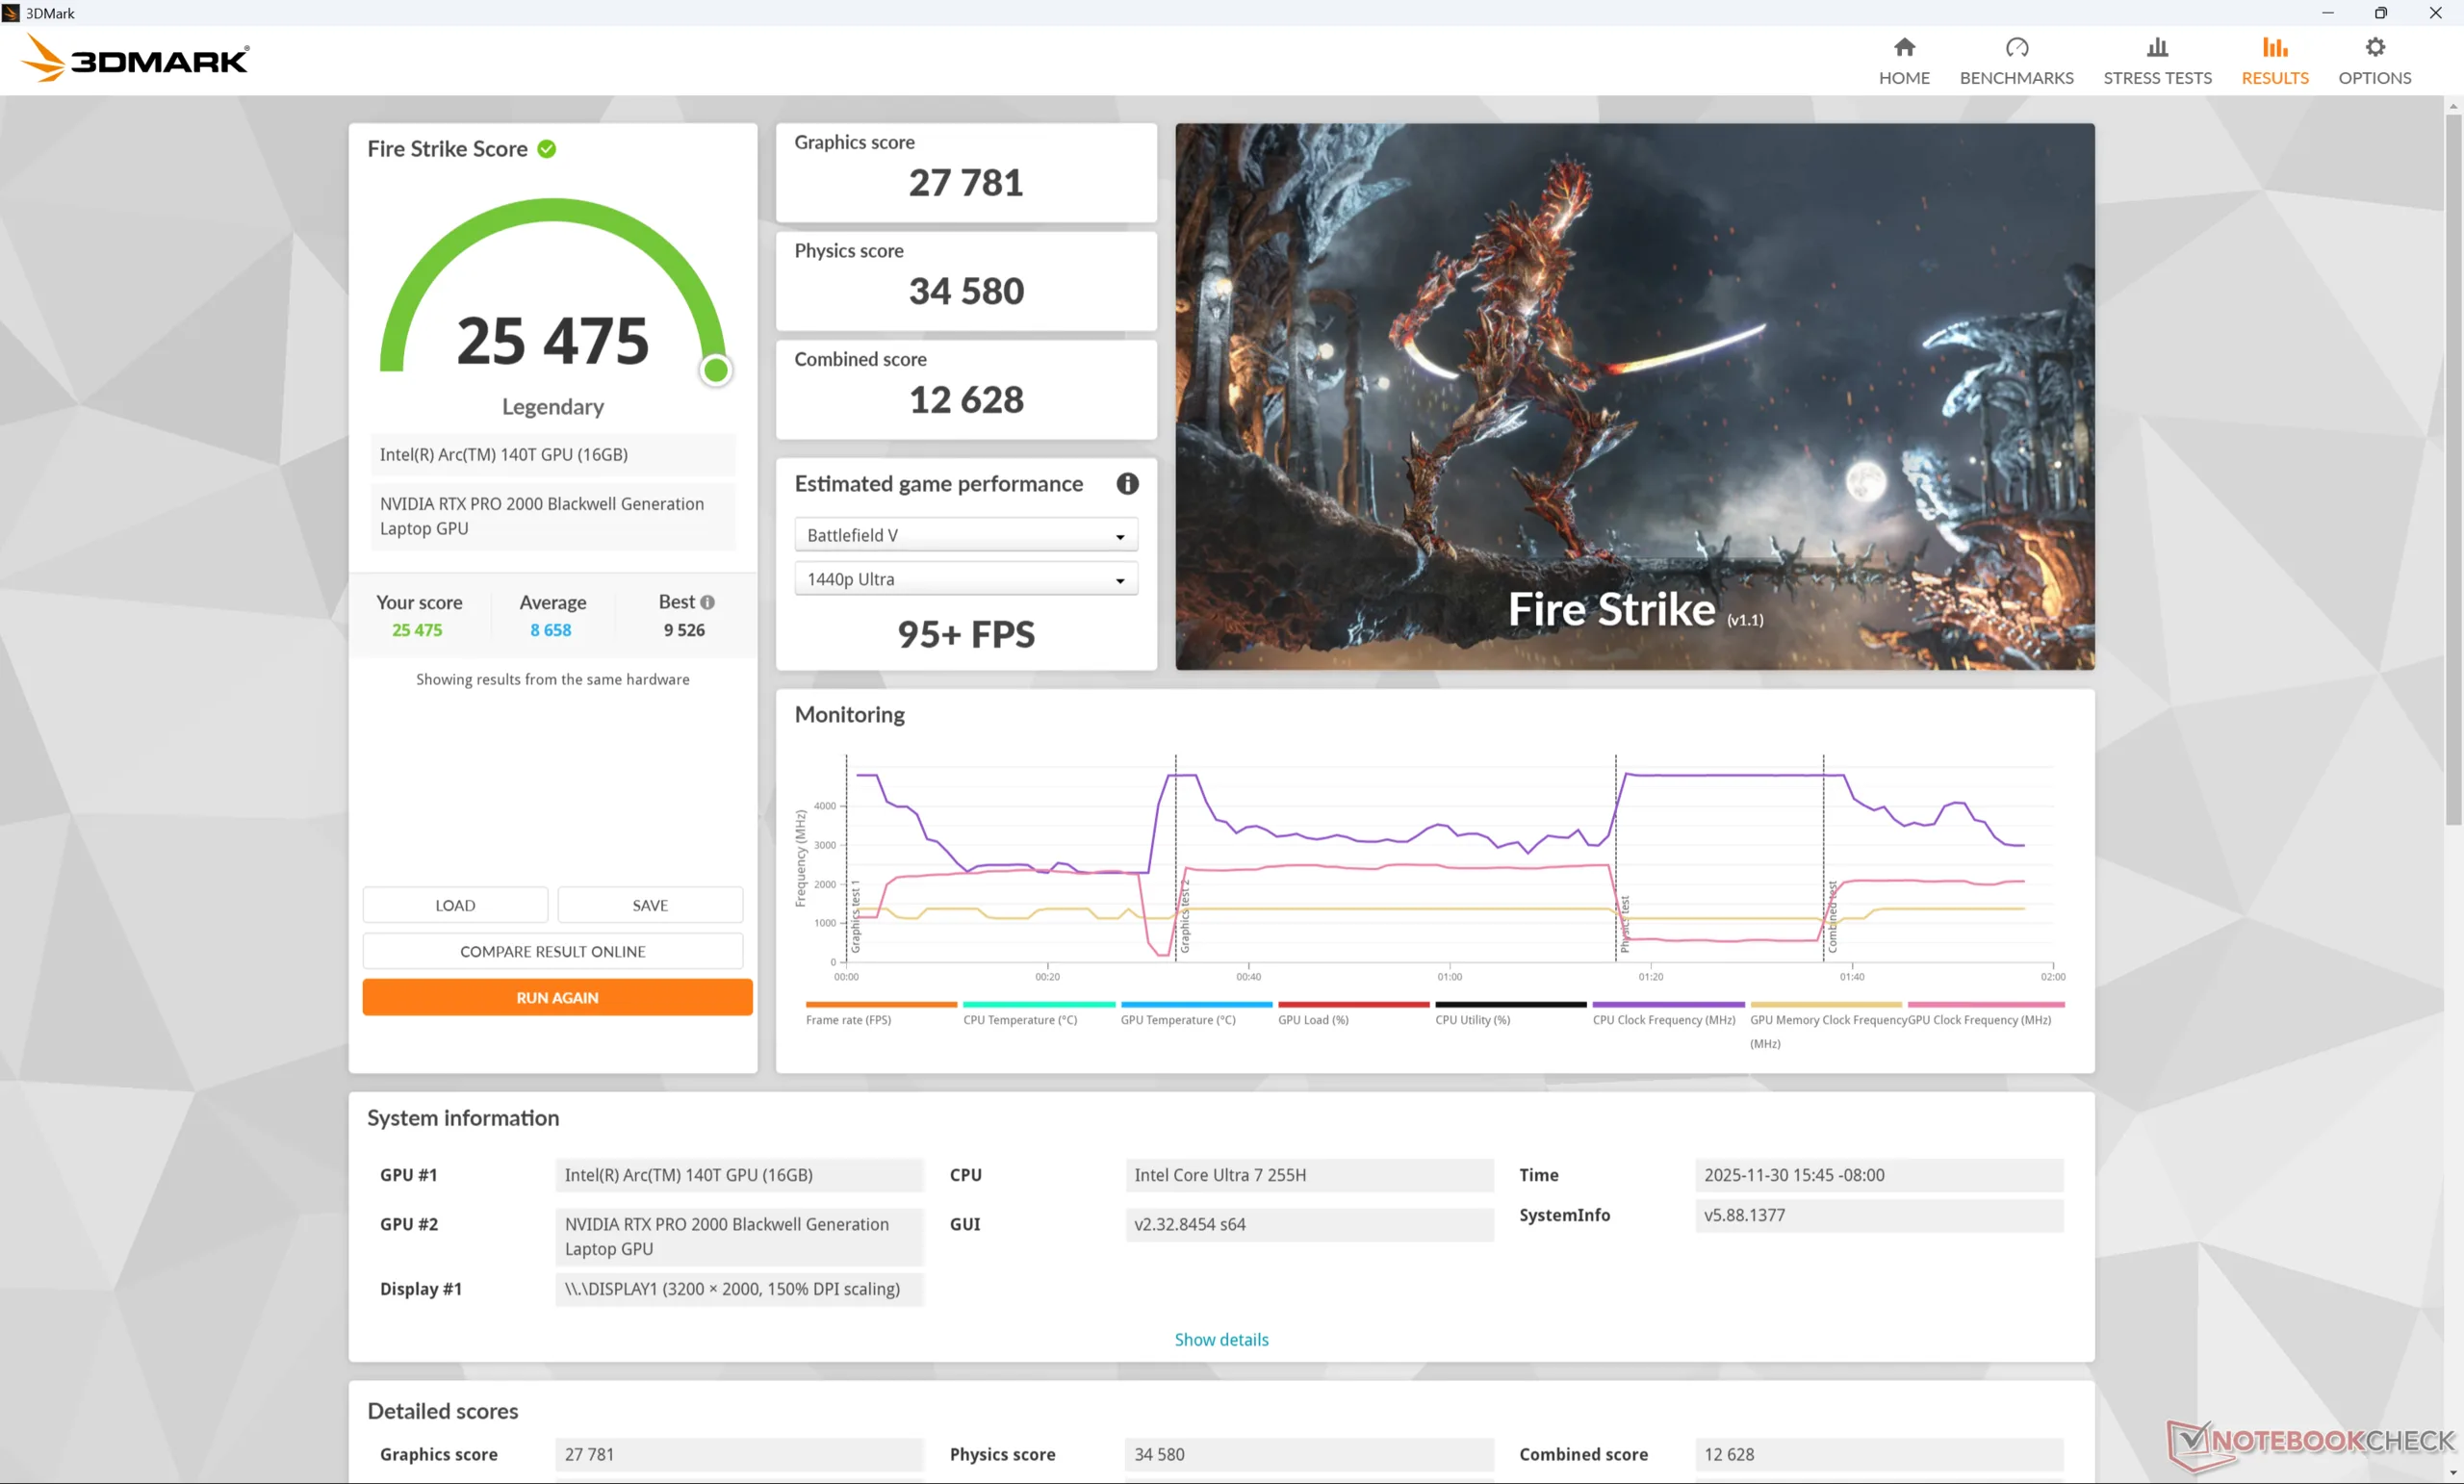
| Vermogen Profiel | Grafische Score | Fysica Score | Gecombineerde Score |
| Prestatiemodus | 27781 | 34580 | 12628 |
| Evenwichtige modus | 26859 (-3%) | 35322 (+2%) | 11593 (-8%) |
| Batterijvoeding | 25193 (-9%) | 26579 (-23%) | 10800 (-15%) |
| 3DMark Performance rating - Percent | |
| Dell Pro Max 16 Plus -10! | |
| Lenovo ThinkPad P1 Gen 8 -1! | |
| HP ZBook Fury 16 G11 -9! | |
| Gemiddeld NVIDIA RTX PRO 2000 Blackwell Generation Laptop -1! | |
| HP ZBook X G1i 16 -10! | |
| HP ZBook Studio 16 G11 -9! | |
| HP ZBook Power 16 G11 A -9! | |
| Lenovo ThinkPad P1 Gen 7 21KV001SGE -26! | |
| Asus ExpertBook B6 Flip B6602FC2 -18! | |
| HP ZBook Studio 16 G9 62U04EA -11! | |
| Lenovo ThinkPad P1 G4-20Y4Z9DVUS -18! | |
| Lenovo ThinkPad P16s Gen 4 21RX000YGE -26! | |
| Lenovo ThinkPad P16s G2 21K9000CGE -18! | |
| 3DMark 11 Performance | 30916 punten | |
| 3DMark Cloud Gate Standard Score | 62652 punten | |
| 3DMark Fire Strike Score | 25475 punten | |
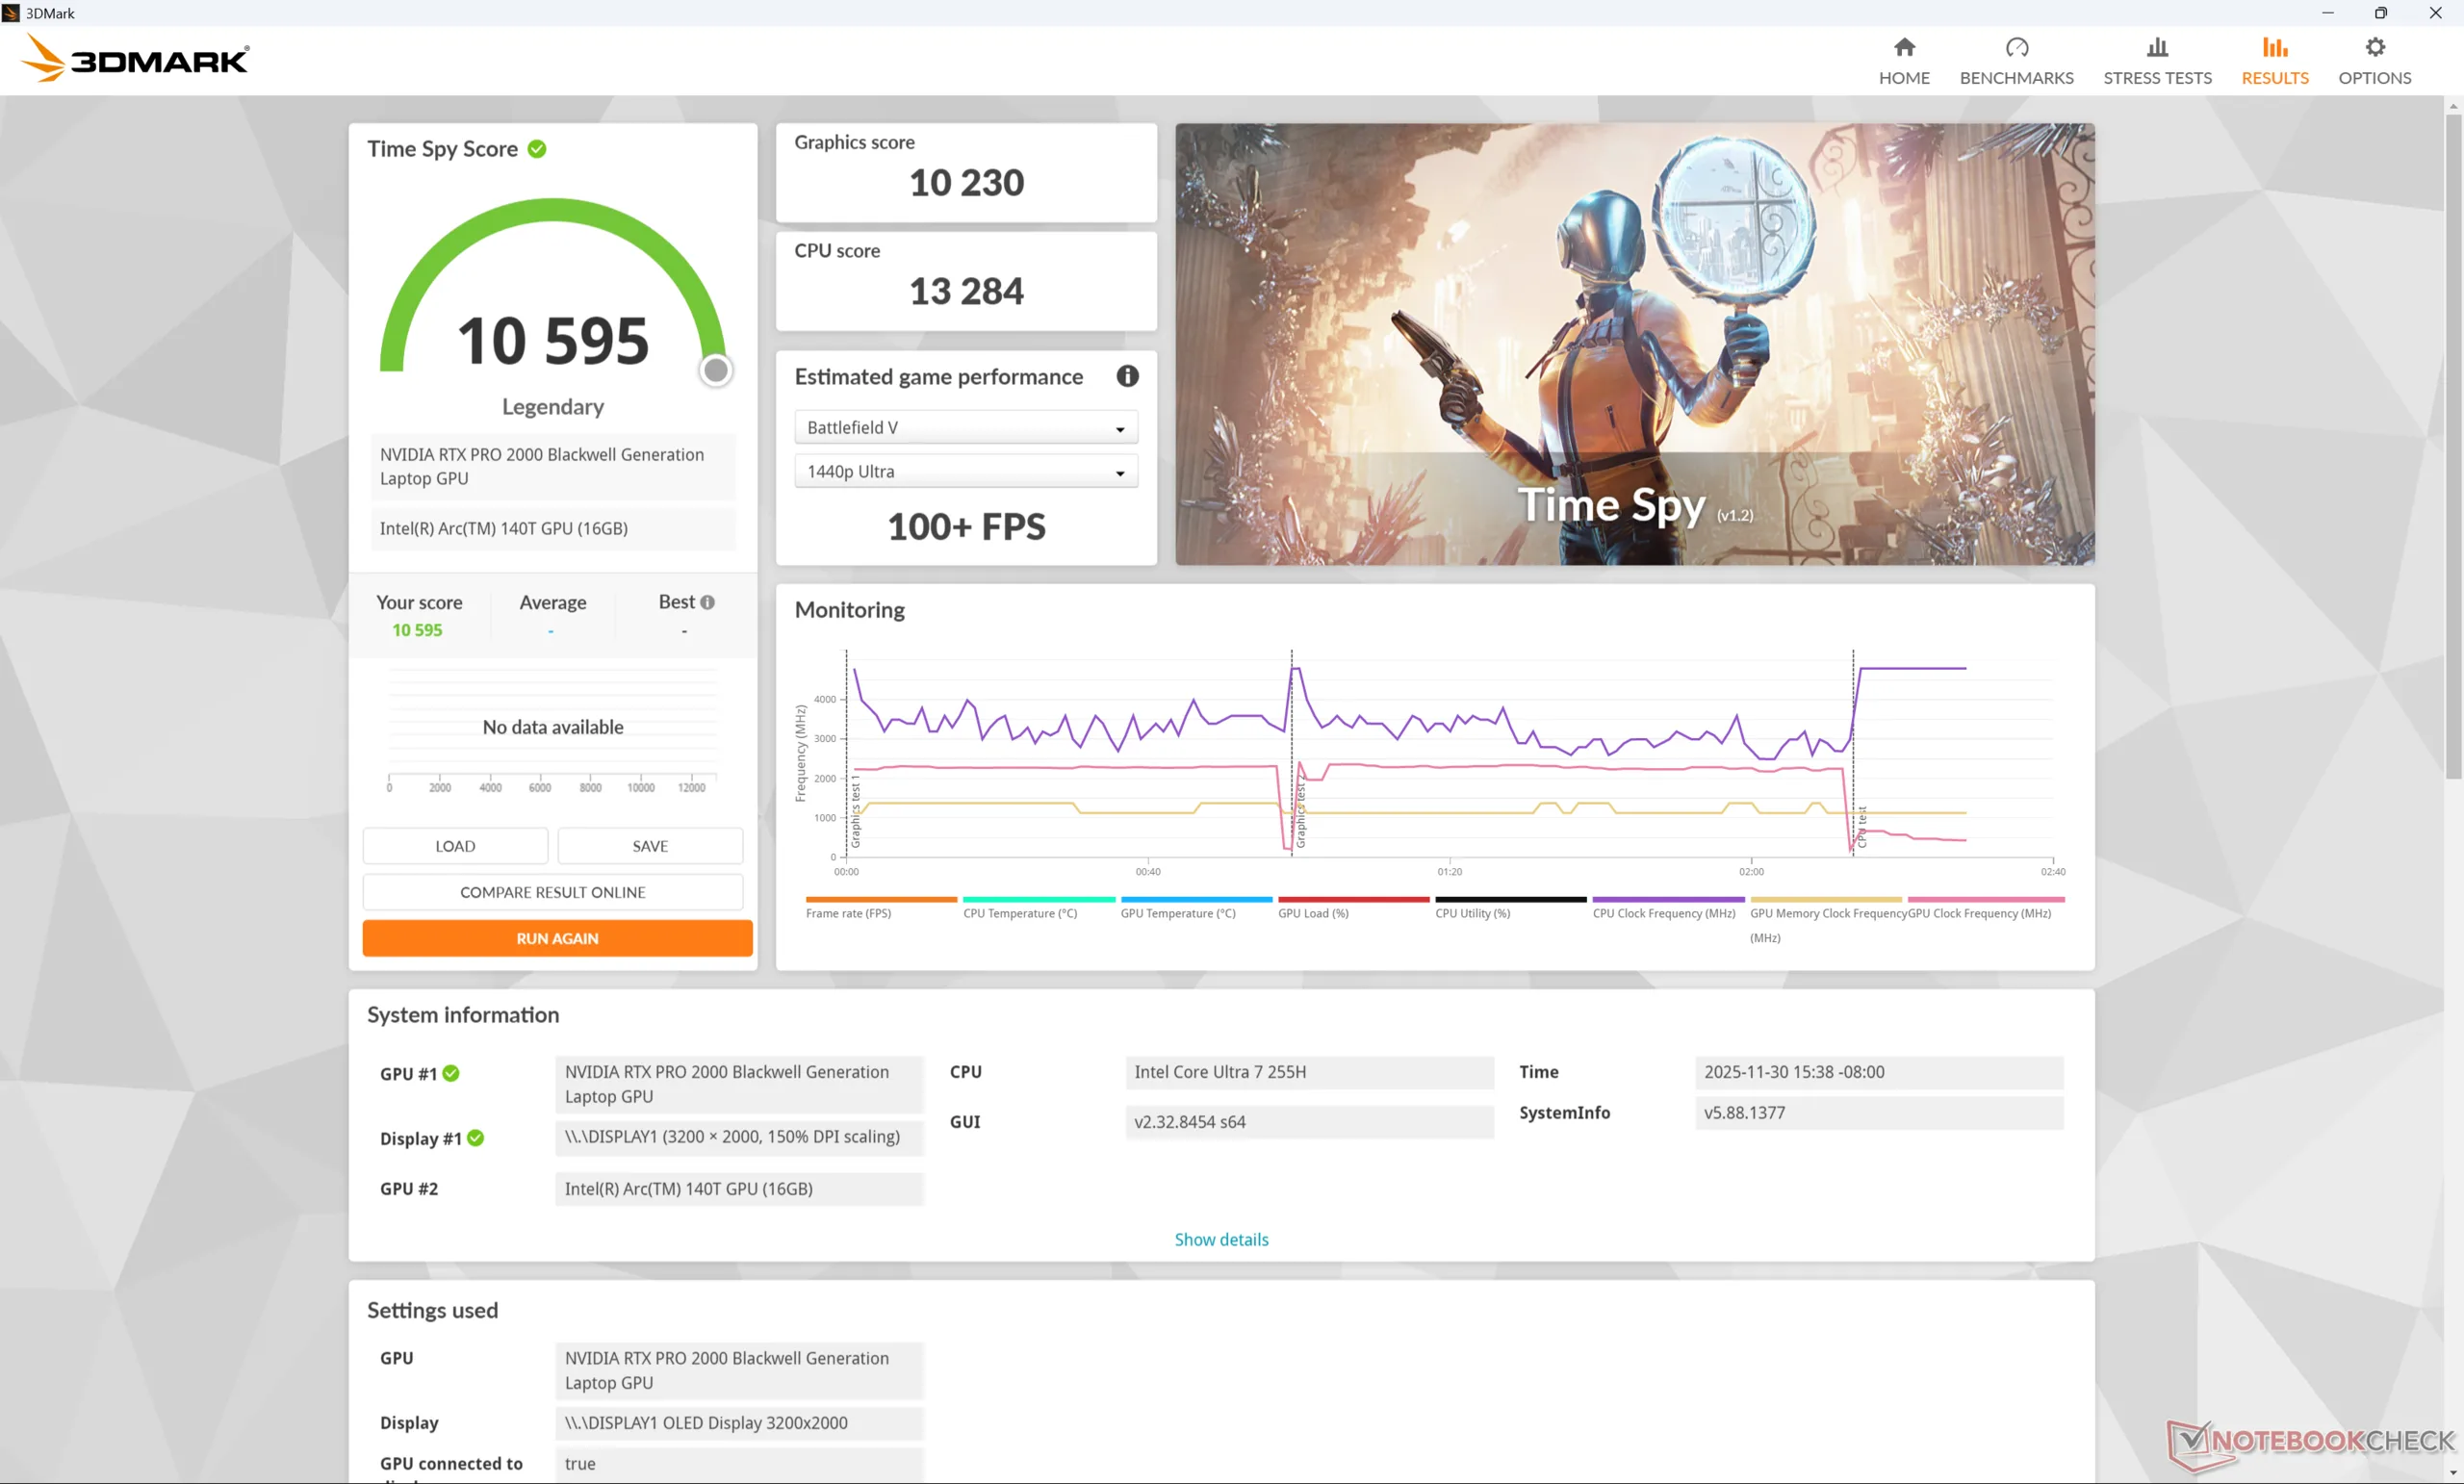
| 3DMark Time Spy Score | 10595 punten | |
Help | ||
* ... kleiner is beter
Gaming prestaties
Hoewel gaming niet zijn primaire functie is, is de ThinkPad P1 Gen 8 meer dan geschikt voor het uitvoeren van veeleisende games op 1080p tot 2K resoluties met prestatieniveaus die ruwweg 10 procent achterlopen op de HP Omen 16 aangedreven door de RTX 5060.
| Performance rating - Percent | |
| Dell Pro Max 16 Plus | |
| Lenovo ThinkPad P1 Gen 8 | |
| HP ZBook X G1i 16 | |
| Asus ExpertBook B6 Flip B6602FC2 -2! | |
| Lenovo ThinkPad P1 Gen 7 21KV001SGE -1! | |
| Lenovo ThinkPad P16s Gen 4 21RX000YGE -1! | |
| Cyberpunk 2077 - 1920x1080 Ultra Preset (FSR off) | |
| Dell Pro Max 16 Plus | |
| Lenovo ThinkPad P1 Gen 8 | |
| HP ZBook X G1i 16 | |
| Lenovo ThinkPad P1 Gen 7 21KV001SGE | |
| Lenovo ThinkPad P16s Gen 4 21RX000YGE | |
| Baldur's Gate 3 - 1920x1080 Ultra Preset AA:T | |
| Dell Pro Max 16 Plus | |
| Lenovo ThinkPad P1 Gen 8 | |
| HP ZBook X G1i 16 | |
| Lenovo ThinkPad P1 Gen 7 21KV001SGE | |
| Lenovo ThinkPad P16s Gen 4 21RX000YGE | |
| GTA V - 1920x1080 Highest AA:4xMSAA + FX AF:16x | |
| Dell Pro Max 16 Plus | |
| Lenovo ThinkPad P1 Gen 8 | |
| HP ZBook X G1i 16 | |
| Lenovo ThinkPad P1 Gen 7 21KV001SGE | |
| Asus ExpertBook B6 Flip B6602FC2 | |
| Lenovo ThinkPad P16s Gen 4 21RX000YGE | |
| Final Fantasy XV Benchmark - 1920x1080 High Quality | |
| Dell Pro Max 16 Plus | |
| Lenovo ThinkPad P1 Gen 8 | |
| HP ZBook X G1i 16 | |
| Lenovo ThinkPad P1 Gen 7 21KV001SGE | |
| Asus ExpertBook B6 Flip B6602FC2 | |
| Lenovo ThinkPad P16s Gen 4 21RX000YGE | |
| Strange Brigade - 1920x1080 ultra AA:ultra AF:16 | |
| Dell Pro Max 16 Plus | |
| Lenovo ThinkPad P1 Gen 8 | |
| HP ZBook X G1i 16 | |
| Asus ExpertBook B6 Flip B6602FC2 | |
| Dota 2 Reborn - 1920x1080 ultra (3/3) best looking | |
| Dell Pro Max 16 Plus | |
| Asus ExpertBook B6 Flip B6602FC2 | |
| HP ZBook X G1i 16 | |
| Lenovo ThinkPad P1 Gen 7 21KV001SGE | |
| Lenovo ThinkPad P1 Gen 8 | |
| Lenovo ThinkPad P16s Gen 4 21RX000YGE | |
| X-Plane 11.11 - 1920x1080 high (fps_test=3) | |
| Asus ExpertBook B6 Flip B6602FC2 | |
| Dell Pro Max 16 Plus | |
| Lenovo ThinkPad P1 Gen 7 21KV001SGE | |
| HP ZBook X G1i 16 | |
| Lenovo ThinkPad P1 Gen 8 | |
| Lenovo ThinkPad P16s Gen 4 21RX000YGE | |
| F1 24 | |
| 1920x1080 High Preset AA:T AF:16x | |
| Dell Pro Max 16 Plus | |
| Lenovo ThinkPad P1 Gen 8 | |
| Gemiddeld NVIDIA RTX PRO 2000 Blackwell Generation Laptop (161.4 - 185.2, n=3) | |
| HP ZBook X G1i 16 | |
| Lenovo ThinkPad P1 Gen 7 21KV001SGE | |
| 1920x1080 Ultra High Preset AA:T AF:16x | |
| Dell Pro Max 16 Plus | |
| Lenovo ThinkPad P1 Gen 8 | |
| Gemiddeld NVIDIA RTX PRO 2000 Blackwell Generation Laptop (48.2 - 57.2, n=3) | |
| HP ZBook X G1i 16 | |
| Lenovo ThinkPad P1 Gen 7 21KV001SGE | |
| 2560x1440 Ultra High Preset AA:T AF:16x | |
| Dell Pro Max 16 Plus | |
| Lenovo ThinkPad P1 Gen 8 | |
| Gemiddeld NVIDIA RTX PRO 2000 Blackwell Generation Laptop (32.2 - 36.5, n=2) | |
| HP ZBook X G1i 16 | |
| Lenovo ThinkPad P1 Gen 7 21KV001SGE | |
| 2560x1440 Ultra High Preset + Quality DLSS AF:16x | |
| Dell Pro Max 16 Plus | |
| HP ZBook X G1i 16 | |
| Gemiddeld NVIDIA RTX PRO 2000 Blackwell Generation Laptop (n=1) | |
| Lenovo ThinkPad P1 Gen 7 21KV001SGE | |
Cyberpunk 2077 ultra FPS Grafiek
| lage | gem. | hoge | ultra | QHD DLSS | QHD | 4K | |
|---|---|---|---|---|---|---|---|
| GTA V (2015) | 184.4 | 179.9 | 175 | 119.3 | 97.2 | ||
| Dota 2 Reborn (2015) | 149.2 | 137.2 | 132.5 | 125.7 | 103.5 | ||
| Final Fantasy XV Benchmark (2018) | 204 | 142.7 | 106.5 | 79.4 | |||
| X-Plane 11.11 (2018) | 108.6 | 91 | 76.3 | 58.7 | |||
| Strange Brigade (2018) | 502 | 281 | 229 | 199.8 | 142.4 | ||
| Baldur's Gate 3 (2023) | 132.2 | 116.4 | 101.4 | 102 | 101.3 | 69.9 | |
| Cyberpunk 2077 (2023) | 124 | 101.5 | 86.4 | 77.8 | 57.9 | 48.9 | |
| F1 24 (2024) | 250 | 229 | 185.2 | 57.2 | 36.5 |
Uitstoot
Systeemgeluid
De ventilatoren zijn stil tijdens het browsen of het uitvoeren van niet-veeleisende belastingen en ze blijven stil met slechts 27 dB(A) tijdens het streamen, zelfs wanneer ze op de modus Prestaties zijn ingesteld. Het maximum van 48 dB(A) kan worden bereikt tijdens het gamen of wanneer de CPU en GPU langere tijd worden belast.
Geluidsniveau
| Onbelast |
| 23.1 / 23.1 / 23.1 dB (A) |
| Belasting |
| 27.3 / 47.9 dB (A) |
 | ||
30 dB stil 40 dB(A) hoorbaar 50 dB(A) luid |
||
min: | ||
| Lenovo ThinkPad P1 Gen 8 Ultra 7 255H, RTX PRO 2000 Blackwell Generation Laptop | Lenovo ThinkPad P16s Gen 4 21RX000YGE Ryzen AI 9 HX PRO 370, Radeon 890M | Lenovo ThinkPad P1 Gen 7 21KV001SGE Ultra 7 155H, GeForce RTX 4060 Laptop GPU | HP ZBook X G1i 16 Ultra 7 265H, RTX PRO 2000 Blackwell Generation Laptop | Dell Pro Max 16 Plus Ultra 9 285HX, RTX PRO 5000 Blackwell Generation Laptop | Asus ExpertBook B6 Flip B6602FC2 i9-12950HX, RTX A2000 Laptop GPU | |
|---|---|---|---|---|---|---|
| Noise | -20% | -17% | -5% | -26% | -39% | |
| uit / omgeving * (dB) | 23.1 | 25.9 -12% | 24.7 -7% | 23.7 -3% | 23.2 -0% | 26 -13% |
| Idle Minimum * (dB) | 23.1 | 25.9 -12% | 24.7 -7% | 23.7 -3% | 26.7 -16% | 32.4 -40% |
| Idle Average * (dB) | 23.1 | 25.9 -12% | 24.7 -7% | 23.7 -3% | 30.5 -32% | 32.4 -40% |
| Idle Maximum * (dB) | 23.1 | 28.5 -23% | 24.7 -7% | 23.7 -3% | 34 -47% | 32.4 -40% |
| Load Average * (dB) | 27.3 | 42.9 -57% | 43.7 -60% | 32.7 -20% | 39.8 -46% | 51.9 -90% |
| Load Maximum * (dB) | 47.9 | 48.5 -1% | 53.3 -11% | 48 -0% | 54.3 -13% | 52.1 -9% |
| Cyberpunk 2077 ultra * (dB) | 48.7 | 53.2 | 50.9 | 54.3 |
* ... kleiner is beter
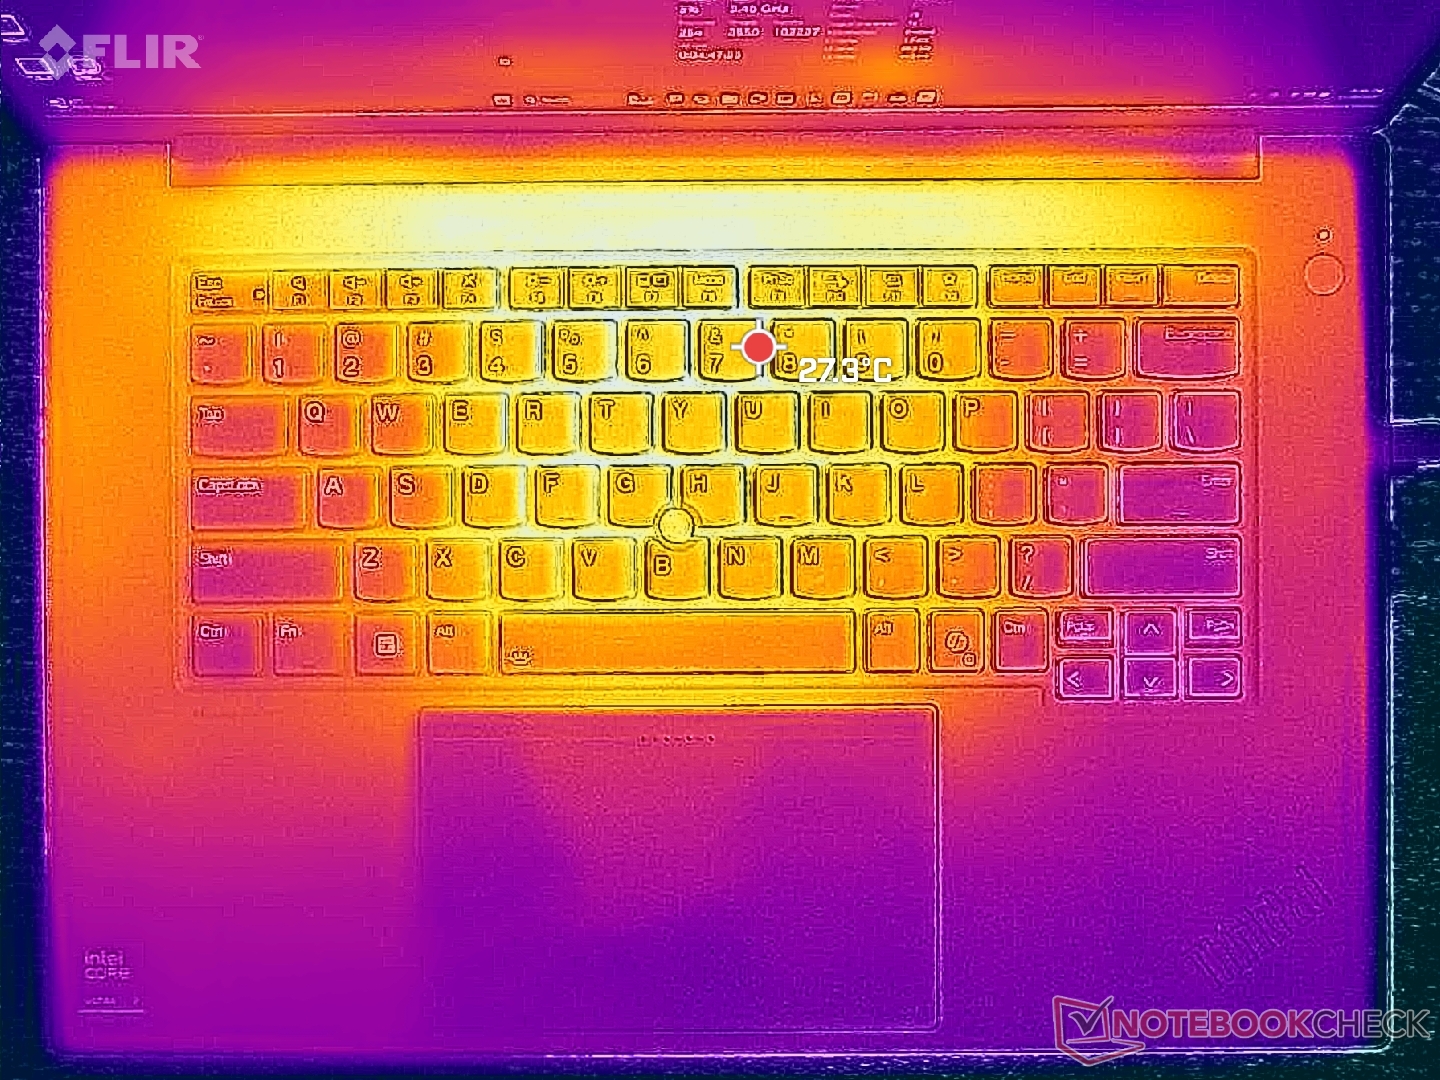
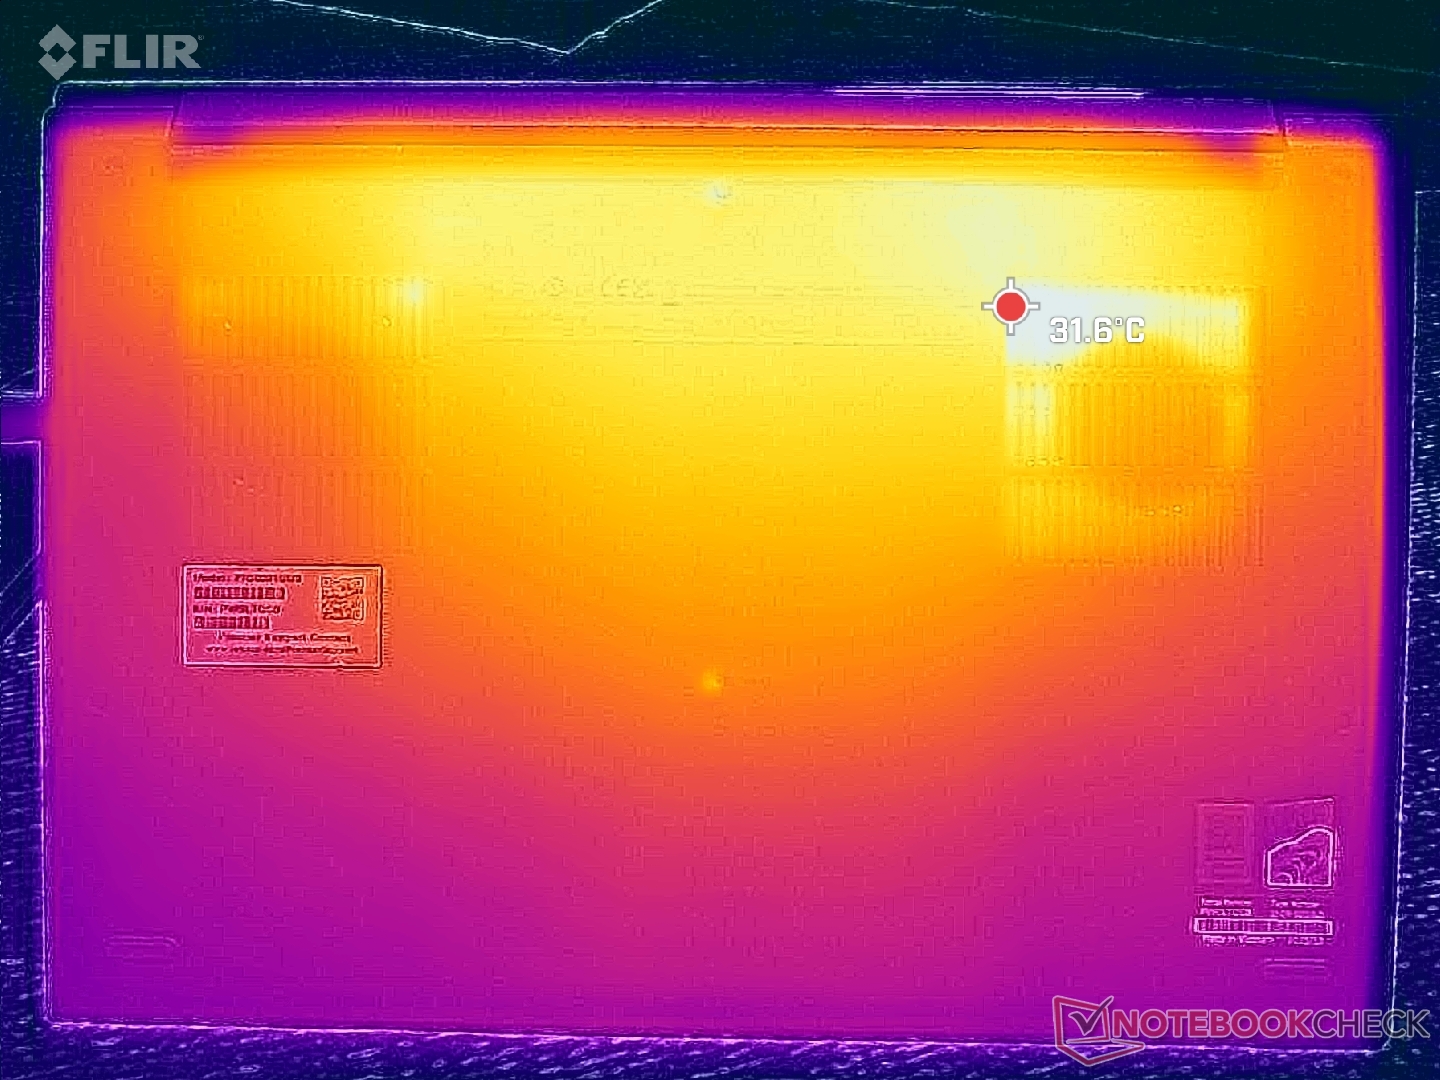
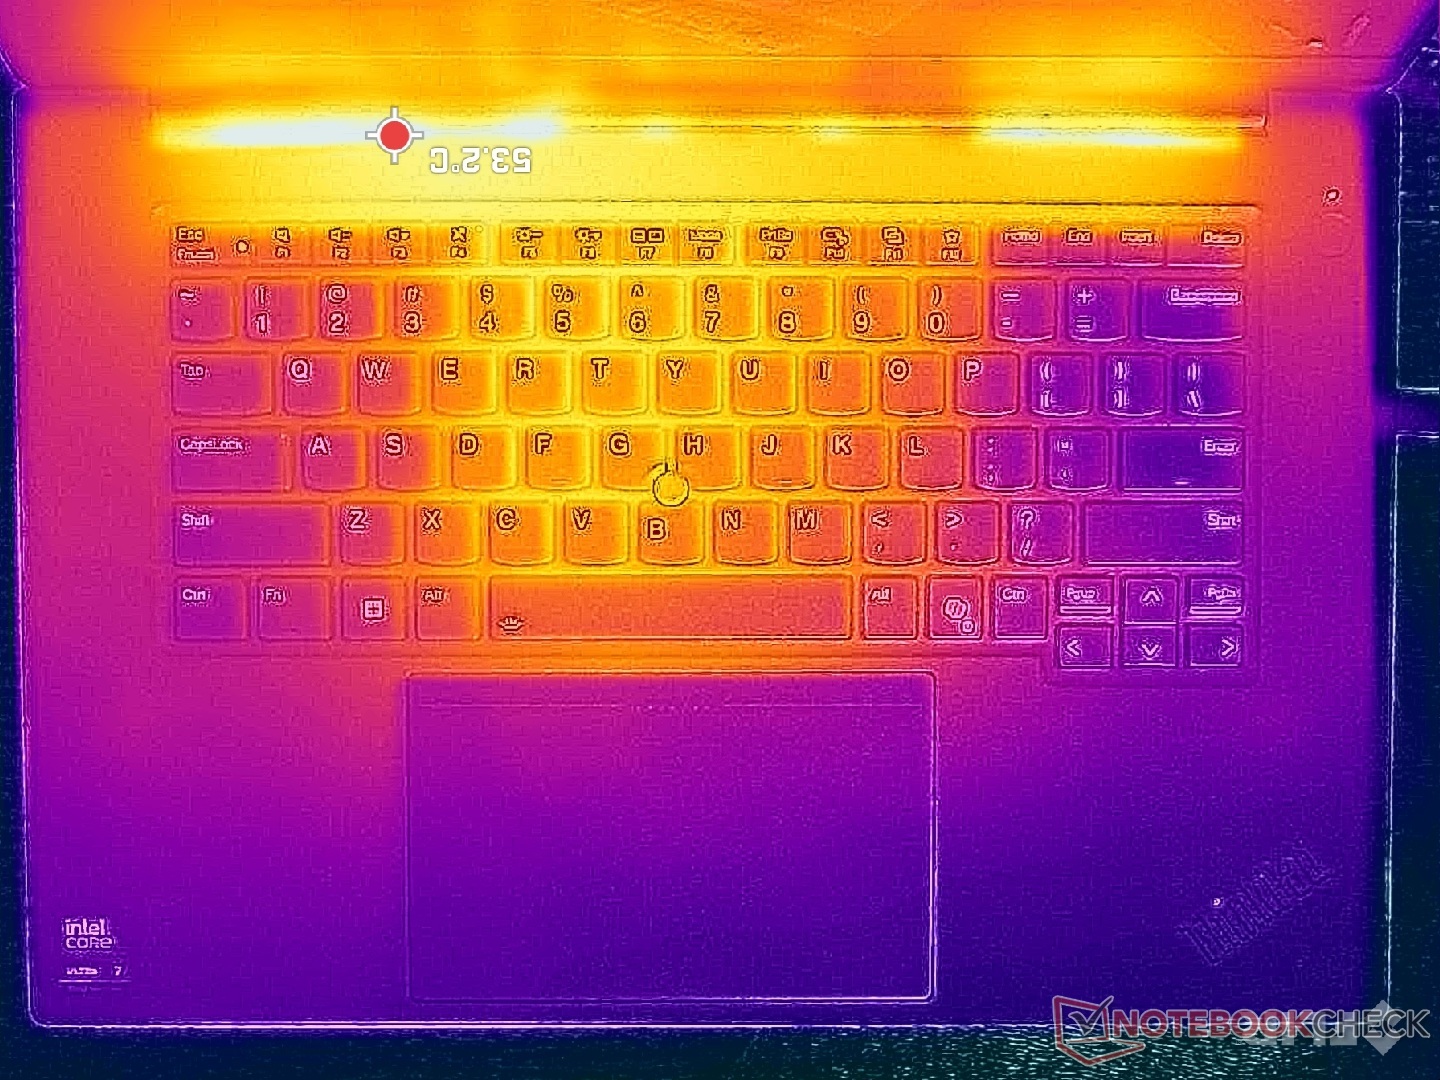
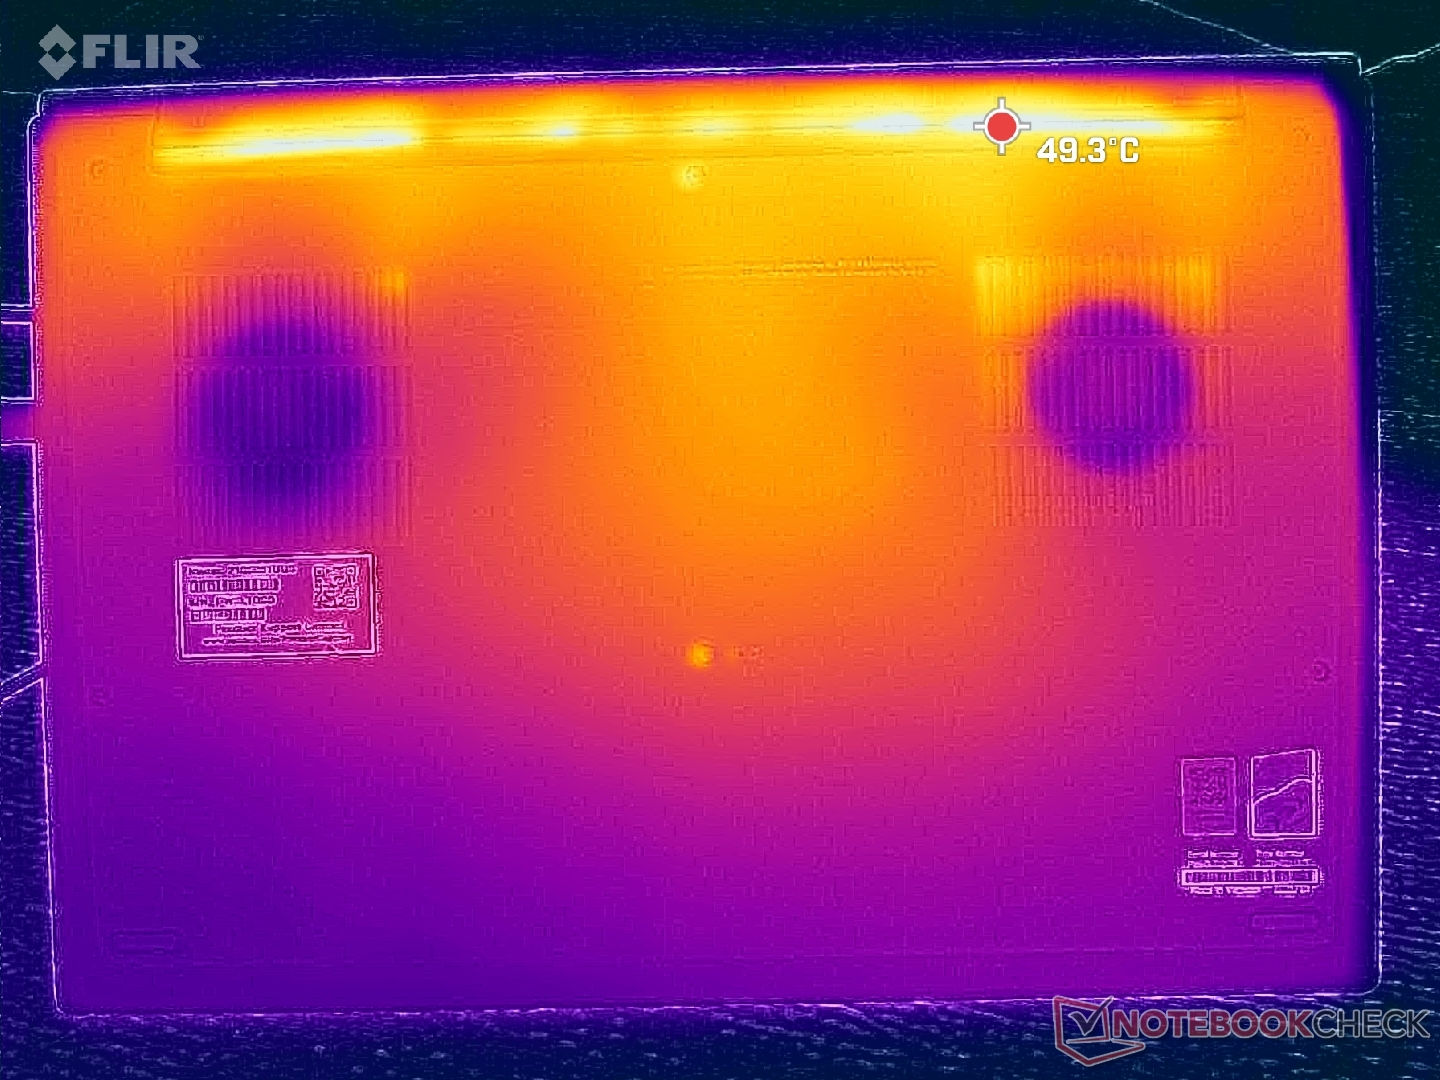
Temperatuur
De ontwikkeling van de oppervlaktetemperatuur is symmetrisch, met hete plekken in de buurt van het midden van het toetsenbord die 40 C tot 45 C bereiken bij zeer veeleisende belastingen zoals Prime95 of FurMark. De resultaten zijn koeler dan verwacht gezien het dunne ontwerp van de behuizing. De ThinkPad P1 Gen 7 zou in vergelijking warmere oppervlaktetemperaturen bereiken, waarschijnlijk als gevolg van de hogere 170 W-energie-enveloppe.
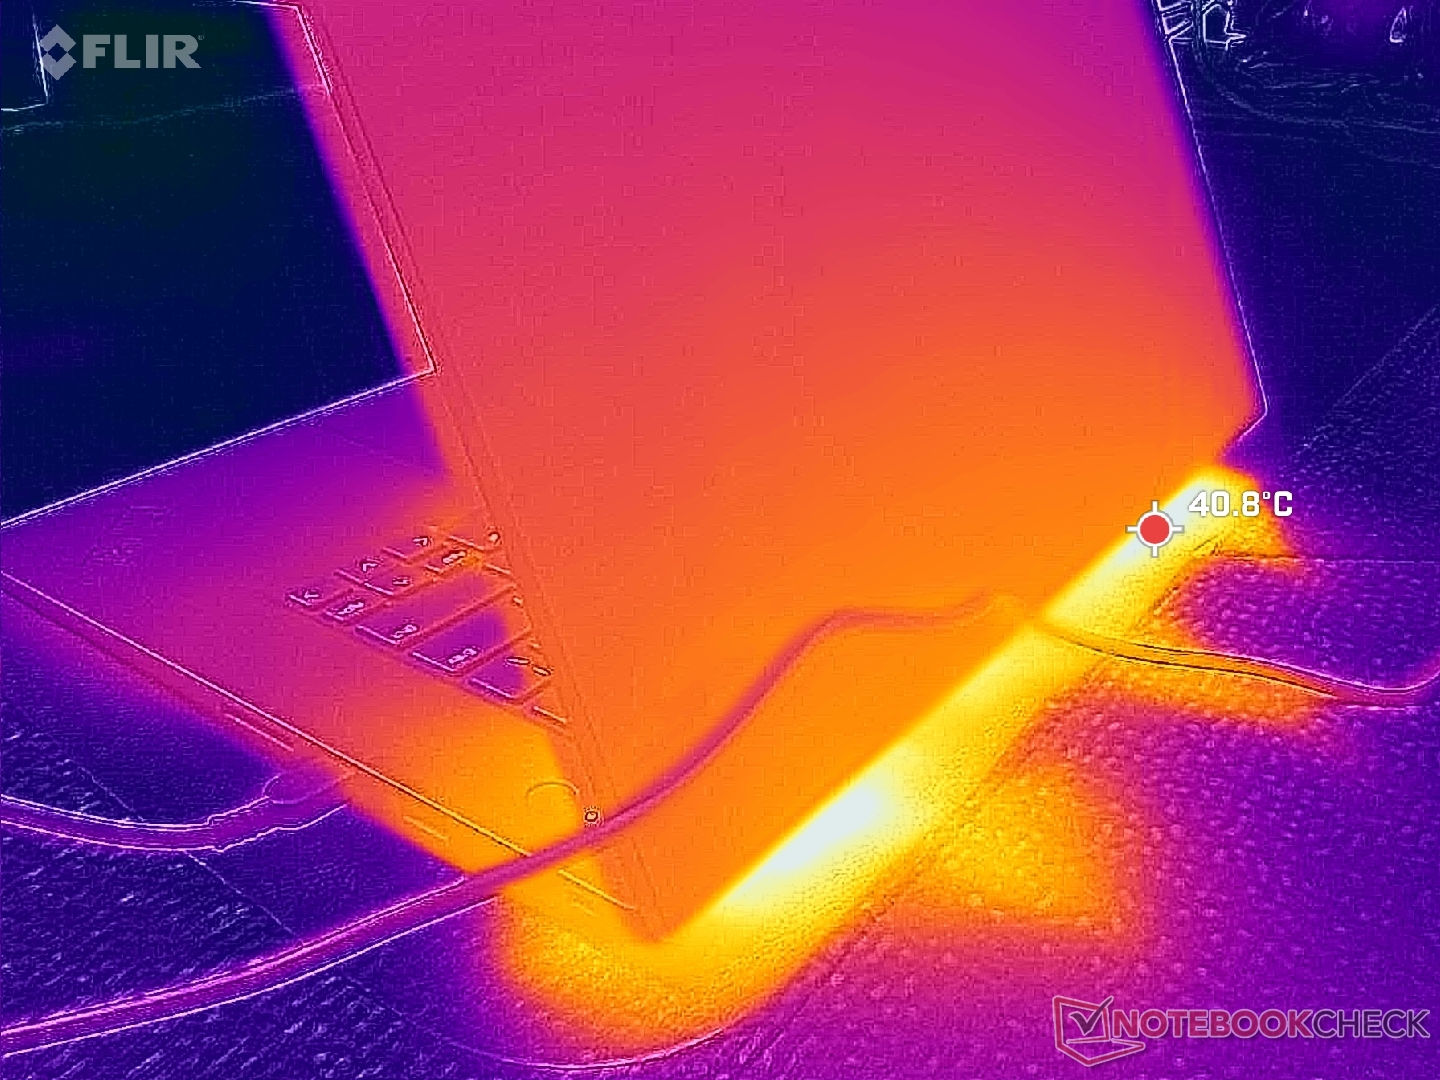
(±) De maximumtemperatuur aan de bovenzijde bedraagt 45 °C / 113 F, vergeleken met het gemiddelde van 38.2 °C / 101 F, variërend van 22.2 tot 69.8 °C voor de klasse Workstation.
(+) De bodem warmt op tot een maximum van 33 °C / 91 F, vergeleken met een gemiddelde van 41.1 °C / 106 F
(+) Bij onbelast gebruik bedraagt de gemiddelde temperatuur voor de bovenzijde 26 °C / 79 F, vergeleken met het apparaatgemiddelde van 32 °C / 90 F.
(+) De palmsteunen en het touchpad zijn met een maximum van ###max## °C / 73.8 F koeler dan de huidtemperatuur en voelen daarom koel aan.
(+) De gemiddelde temperatuur van de handpalmsteun van soortgelijke toestellen bedroeg 27.8 °C / 82 F (+4.6 °C / 8.2 F).
| Lenovo ThinkPad P1 Gen 8 Ultra 7 255H, RTX PRO 2000 Blackwell Generation Laptop | Lenovo ThinkPad P16s Gen 4 21RX000YGE Ryzen AI 9 HX PRO 370, Radeon 890M | Lenovo ThinkPad P1 Gen 7 21KV001SGE Ultra 7 155H, GeForce RTX 4060 Laptop GPU | HP ZBook X G1i 16 Ultra 7 265H, RTX PRO 2000 Blackwell Generation Laptop | Dell Pro Max 16 Plus Ultra 9 285HX, RTX PRO 5000 Blackwell Generation Laptop | Asus ExpertBook B6 Flip B6602FC2 i9-12950HX, RTX A2000 Laptop GPU | |
|---|---|---|---|---|---|---|
| Heat | -29% | -1% | 0% | -10% | -13% | |
| Maximum Upper Side * (°C) | 45 | 50.6 -12% | 50.3 -12% | 36 20% | 40.4 10% | 48.4 -8% |
| Maximum Bottom * (°C) | 33 | 54.3 -65% | 38 -15% | 39.4 -19% | 45.6 -38% | 52.3 -58% |
| Idle Upper Side * (°C) | 30.6 | 35.3 -15% | 28.3 8% | 30.4 1% | 32.8 -7% | 27.8 9% |
| Idle Bottom * (°C) | 31.6 | 38.5 -22% | 27.3 14% | 31.8 -1% | 33 -4% | 30.3 4% |
* ... kleiner is beter
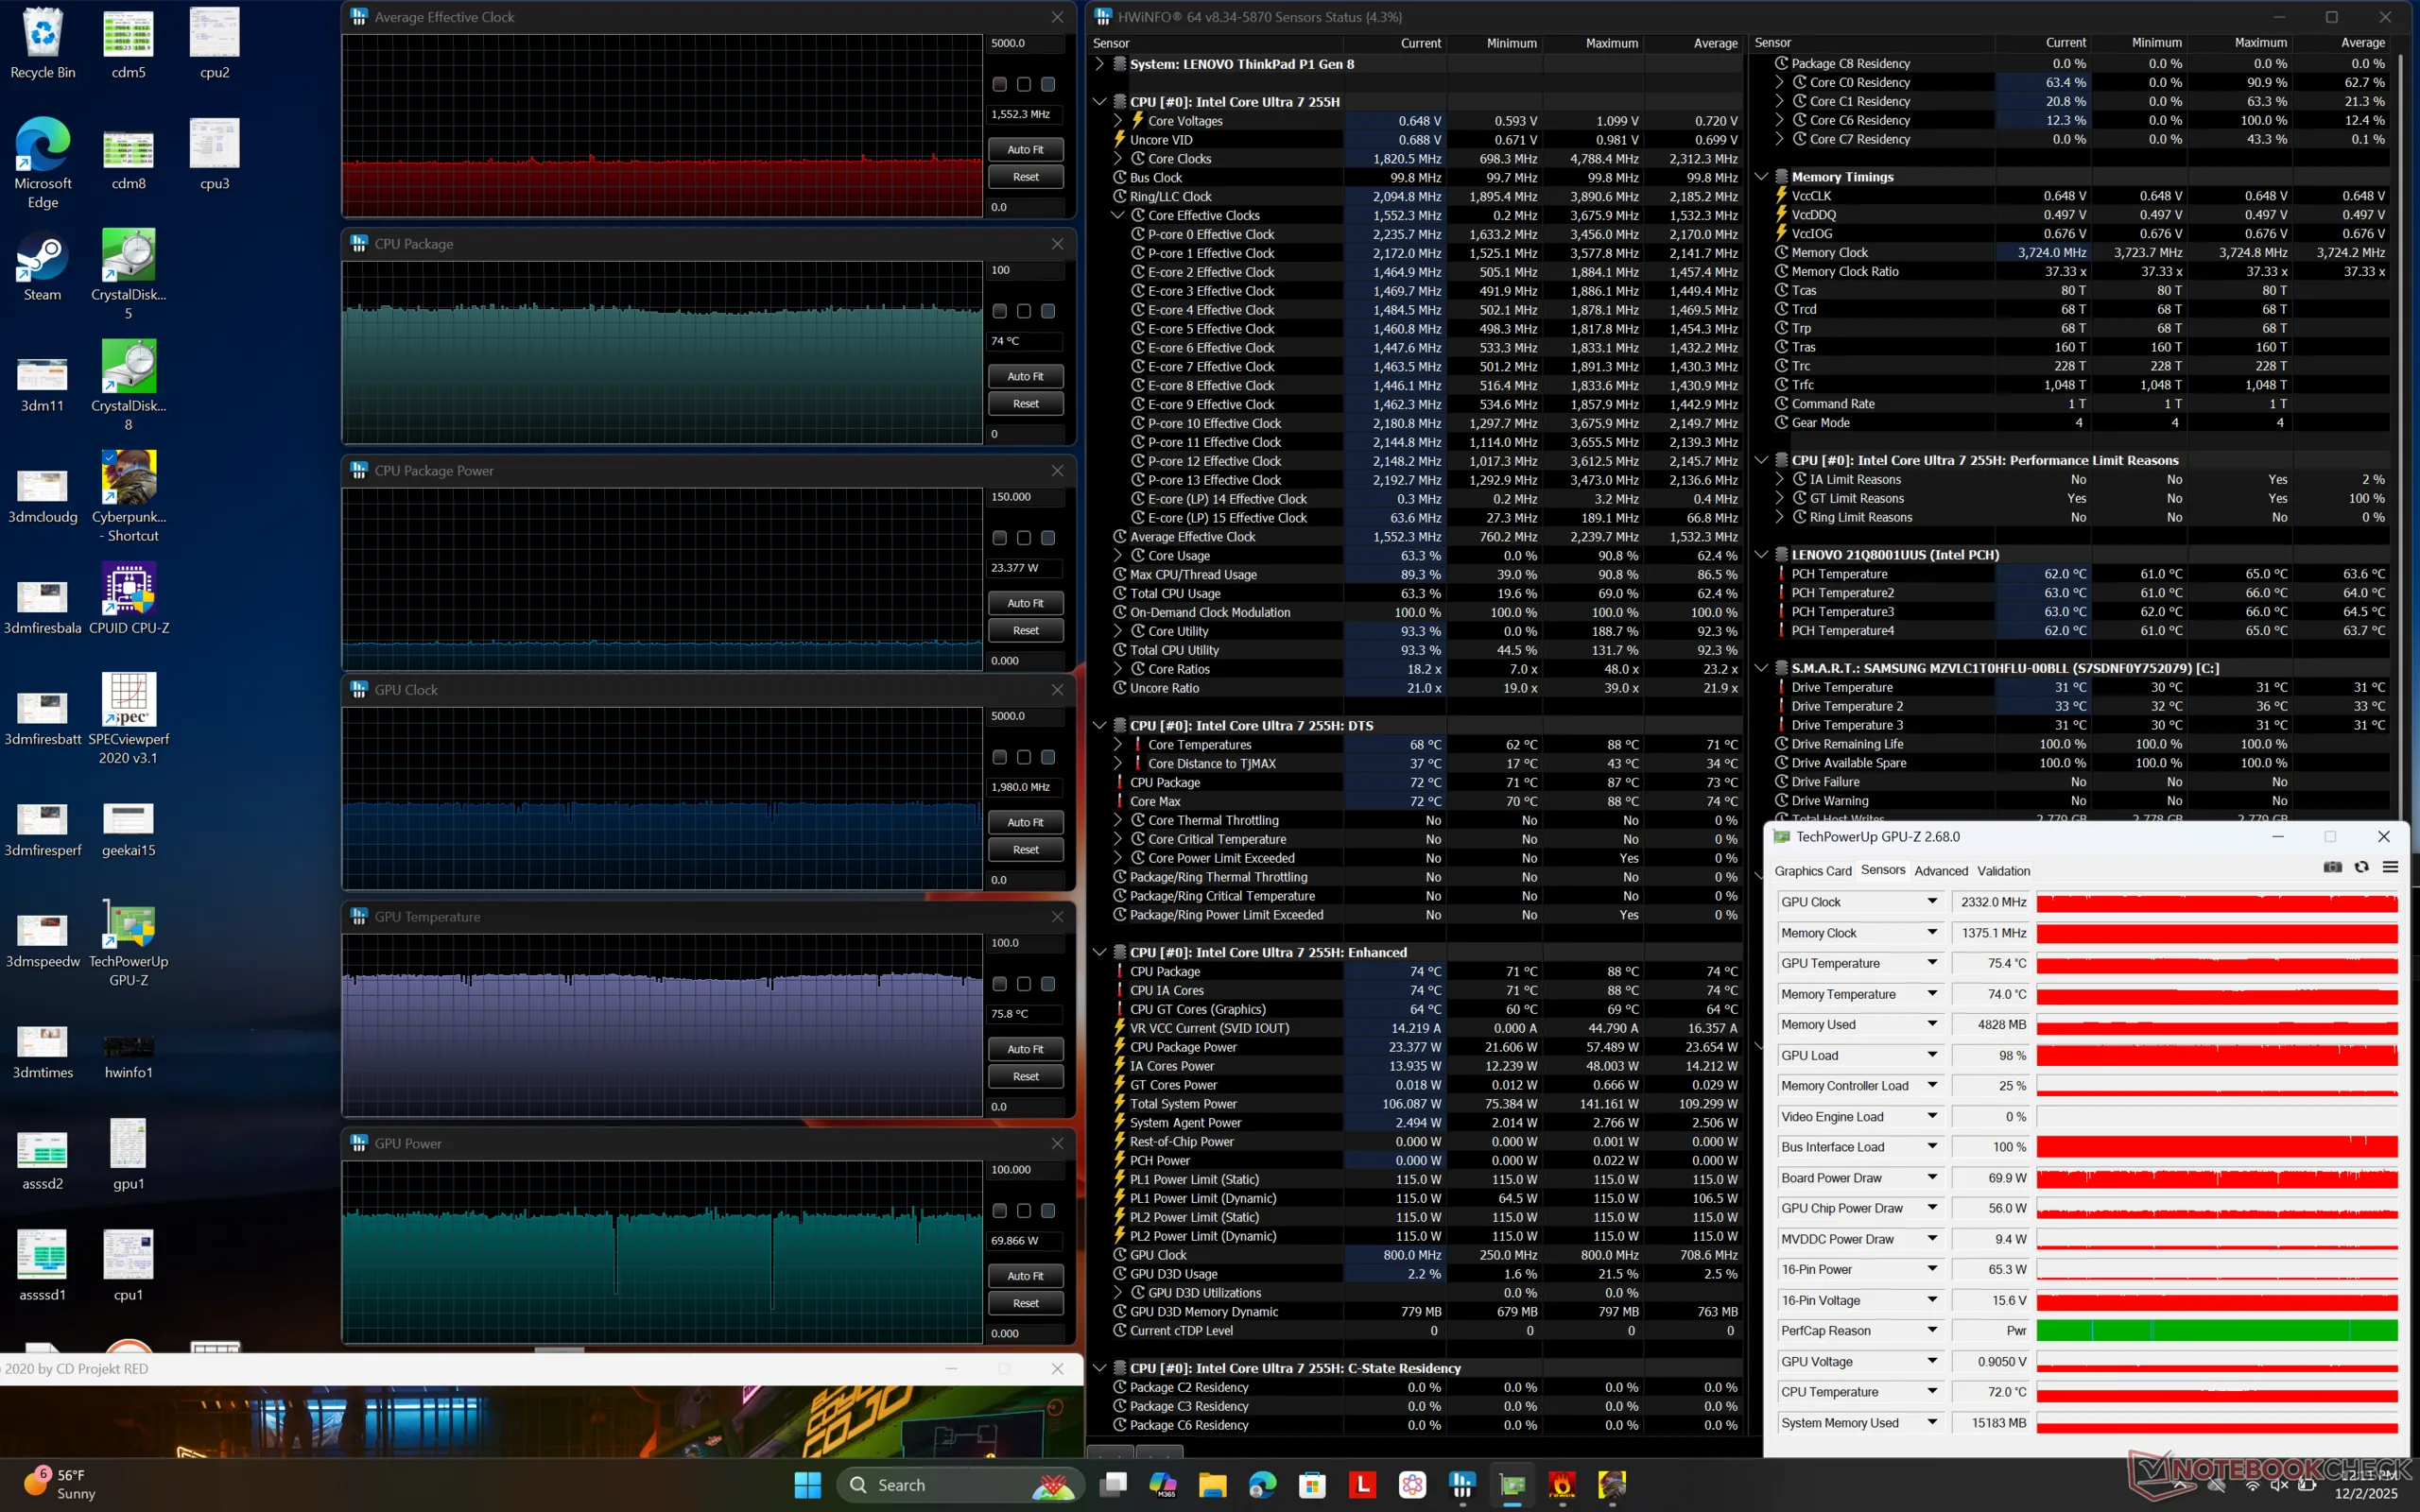
Stresstest
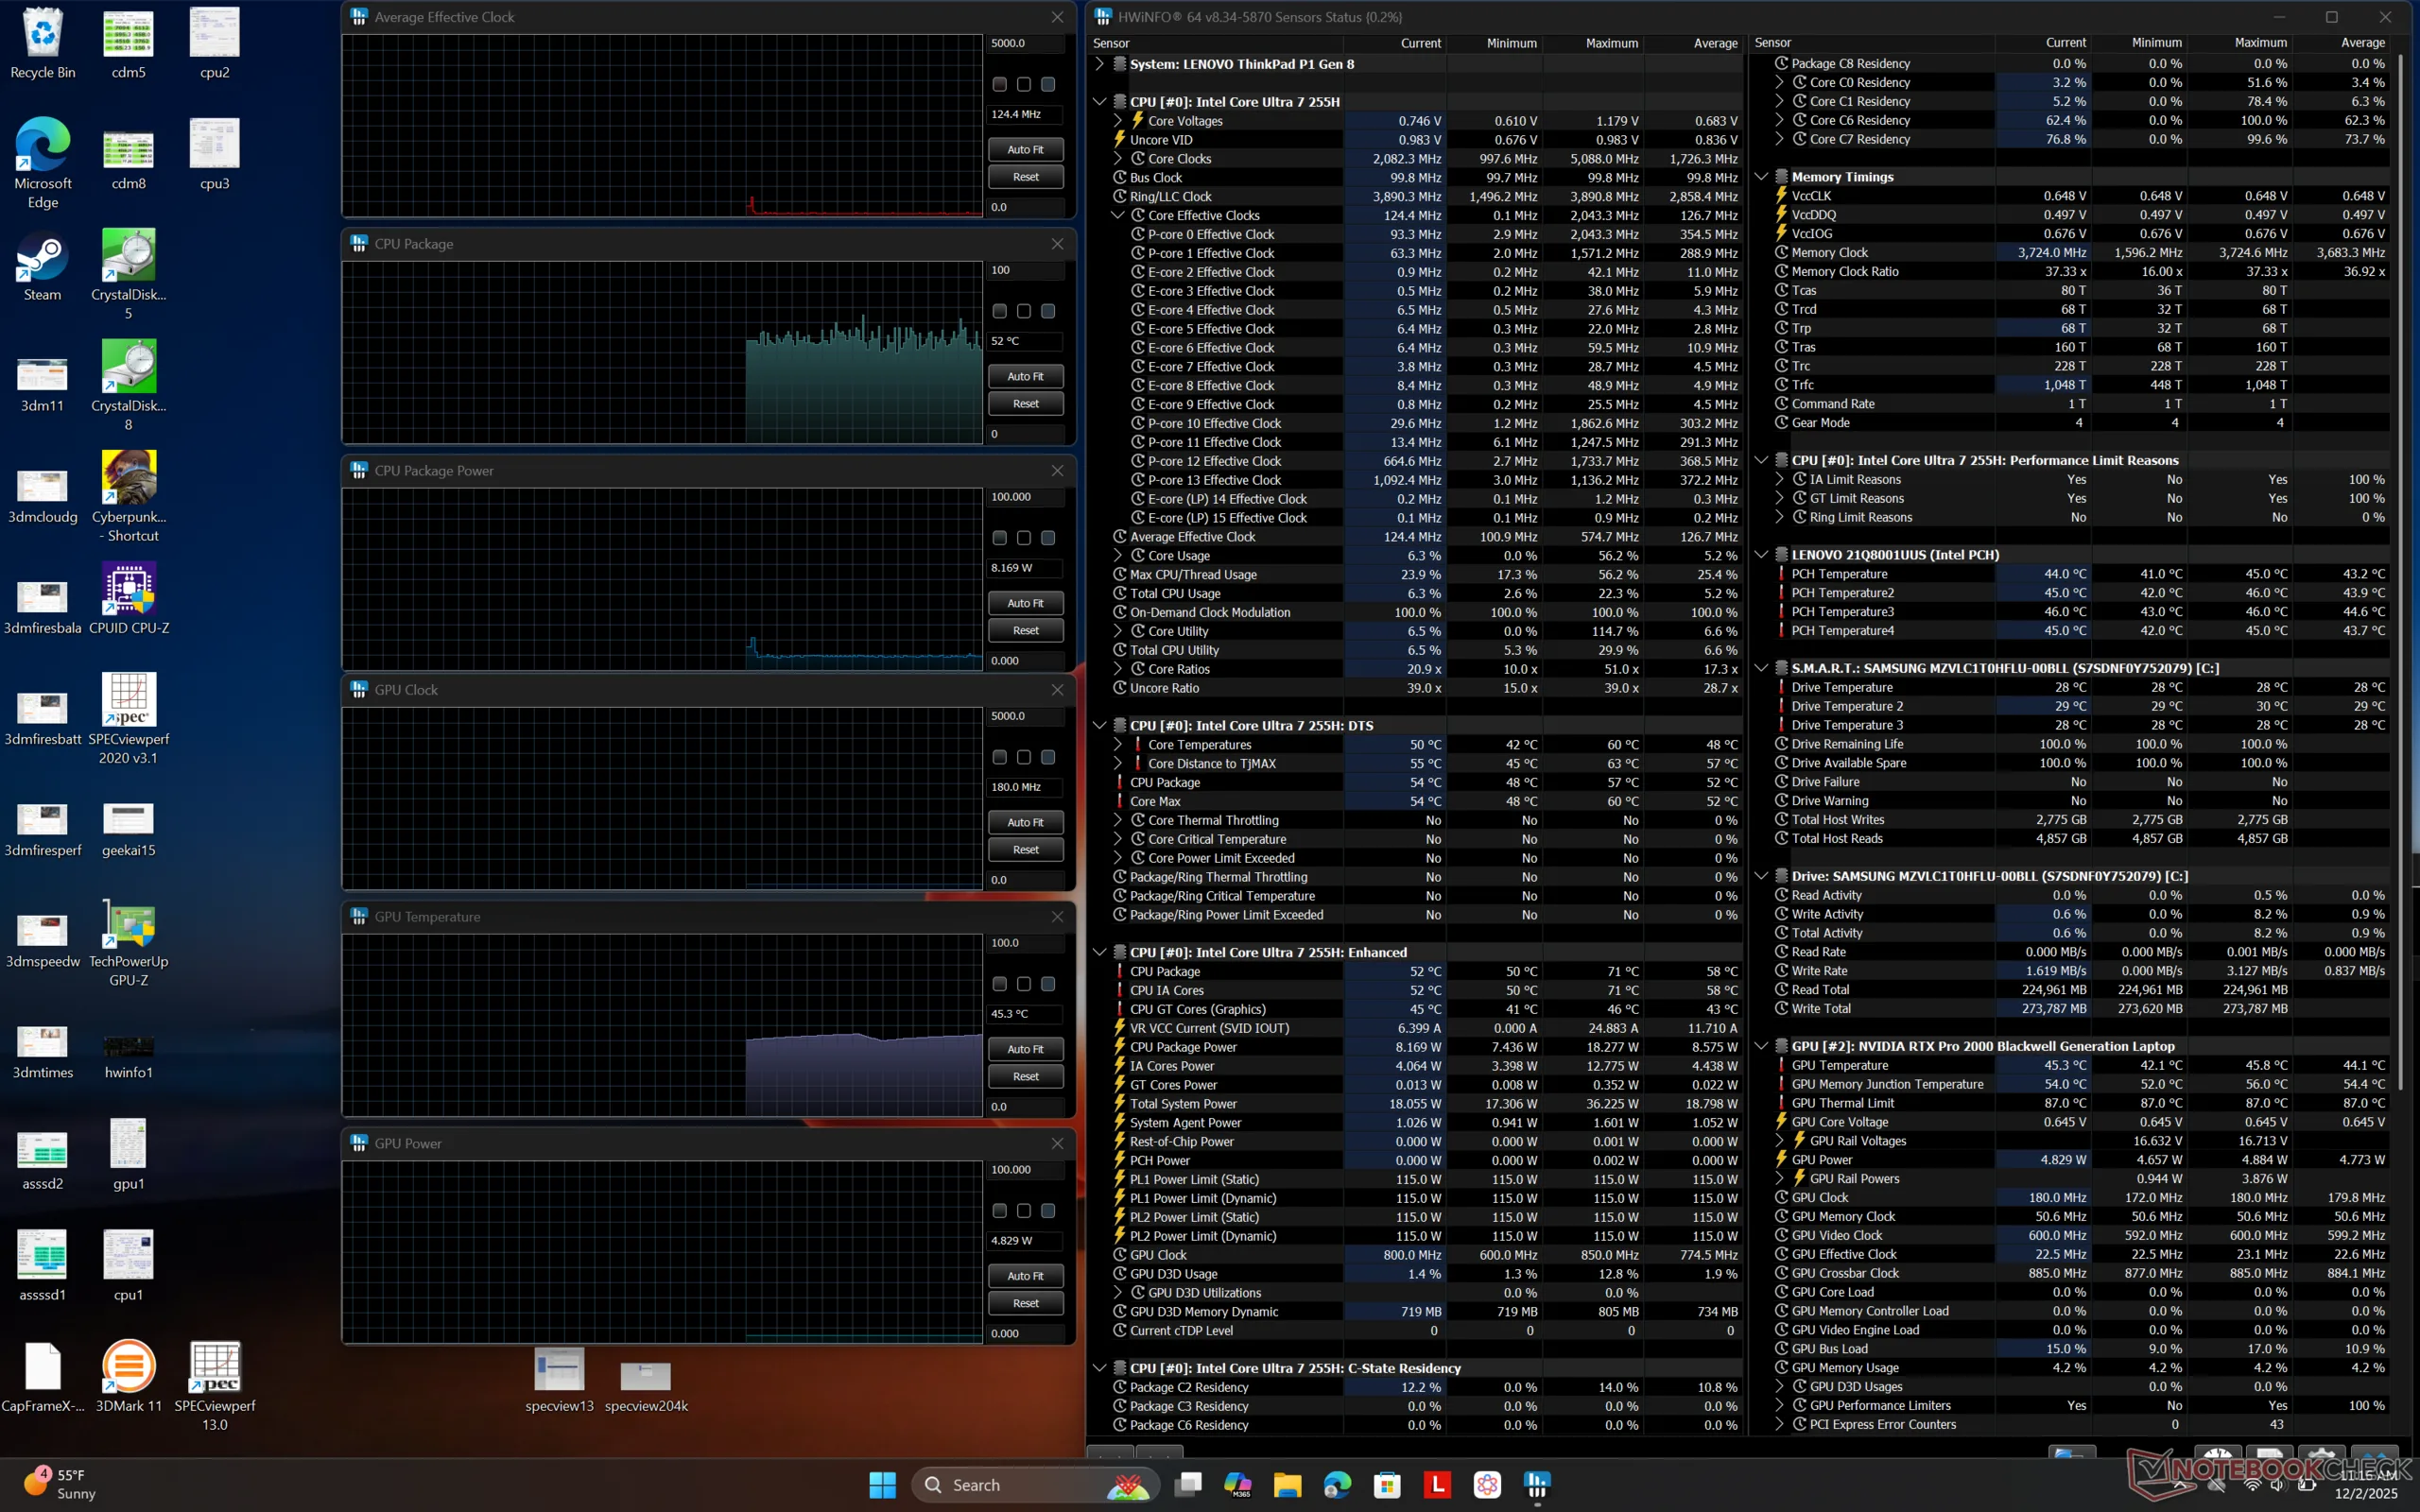
De CPU steeg naar 3,8 GHz, 120 W en 100 C bij het starten van Prime95 stress, voordat hij iets daalde en zich stabiliseerde op 3,6 GHz en 101 W om een beter beheersbare kerntemperatuur van 91 C te handhaven. De stroomopname van de GPU-kaart springt van 63 W naar bijna 70 W bij het overschakelen van de Gebalanceerde modus naar de Prestatiemodus en daarom raden we aan om de Prestatiemodus te gebruiken, ondanks de iets hogere kerntemperaturen van ~75 C. De GPU-geheugenklok springt in het bijzonder van 1125 MHz naar 1375 MHz bij het overschakelen naar de Prestatiemodus.
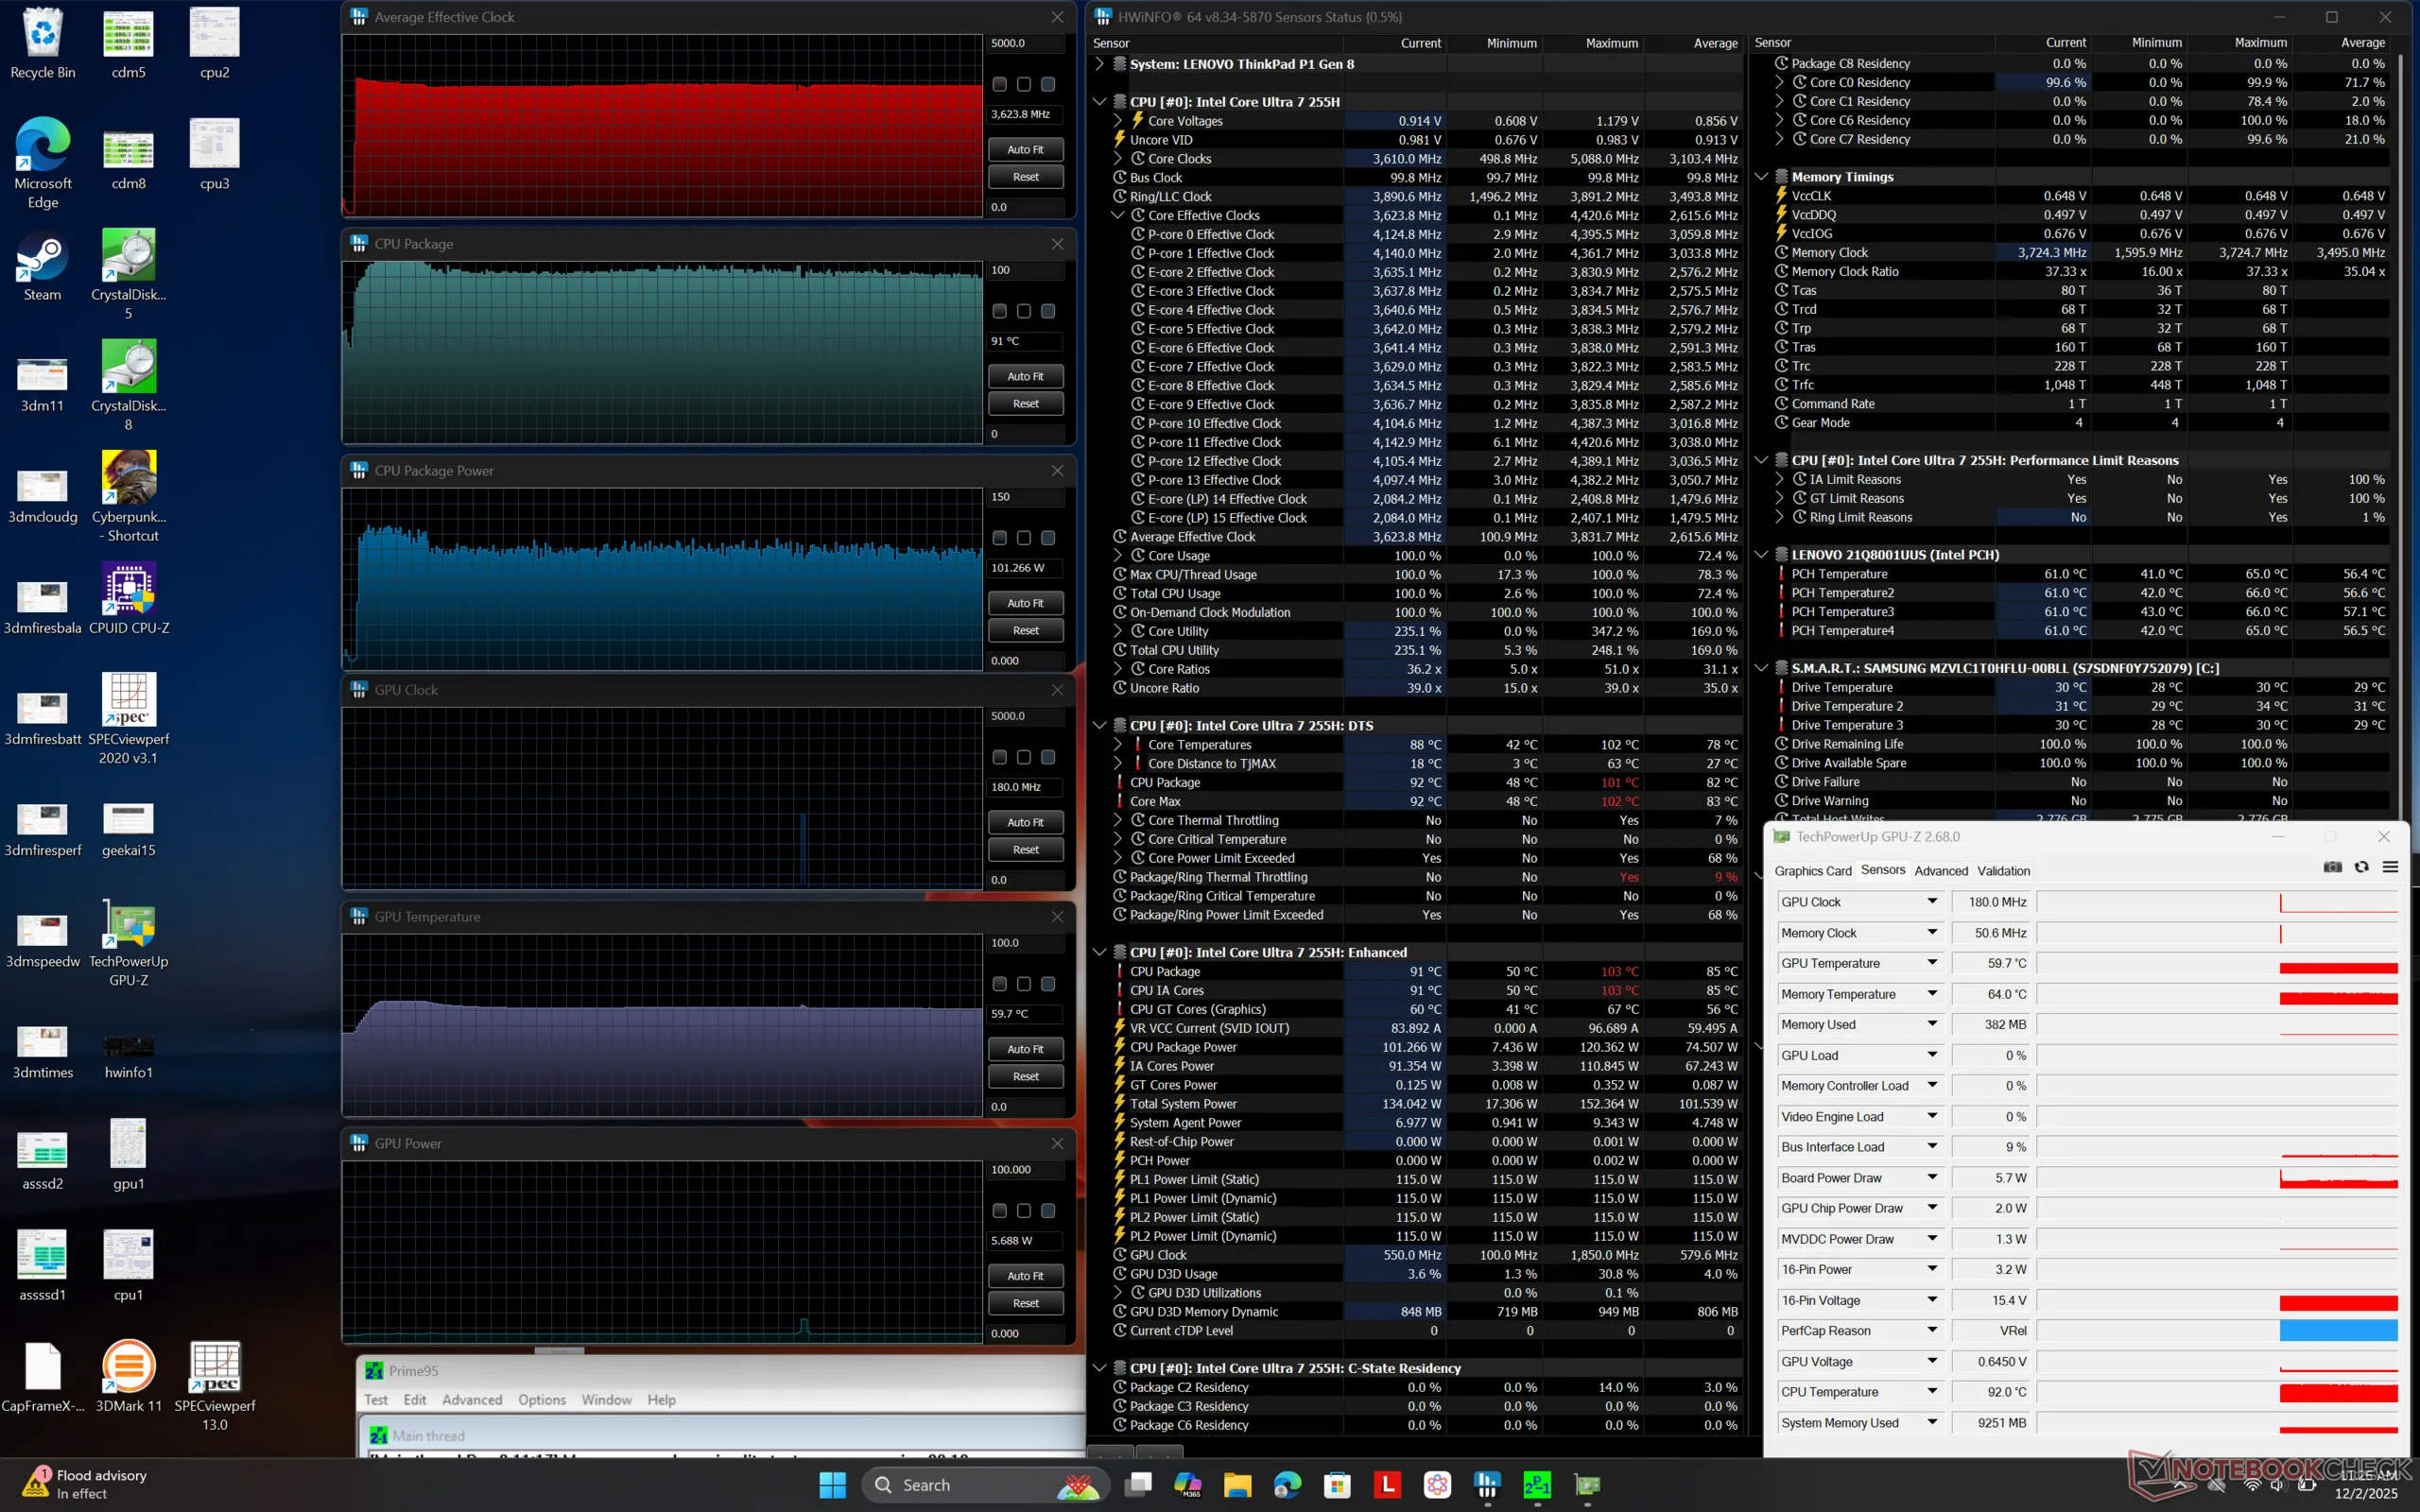
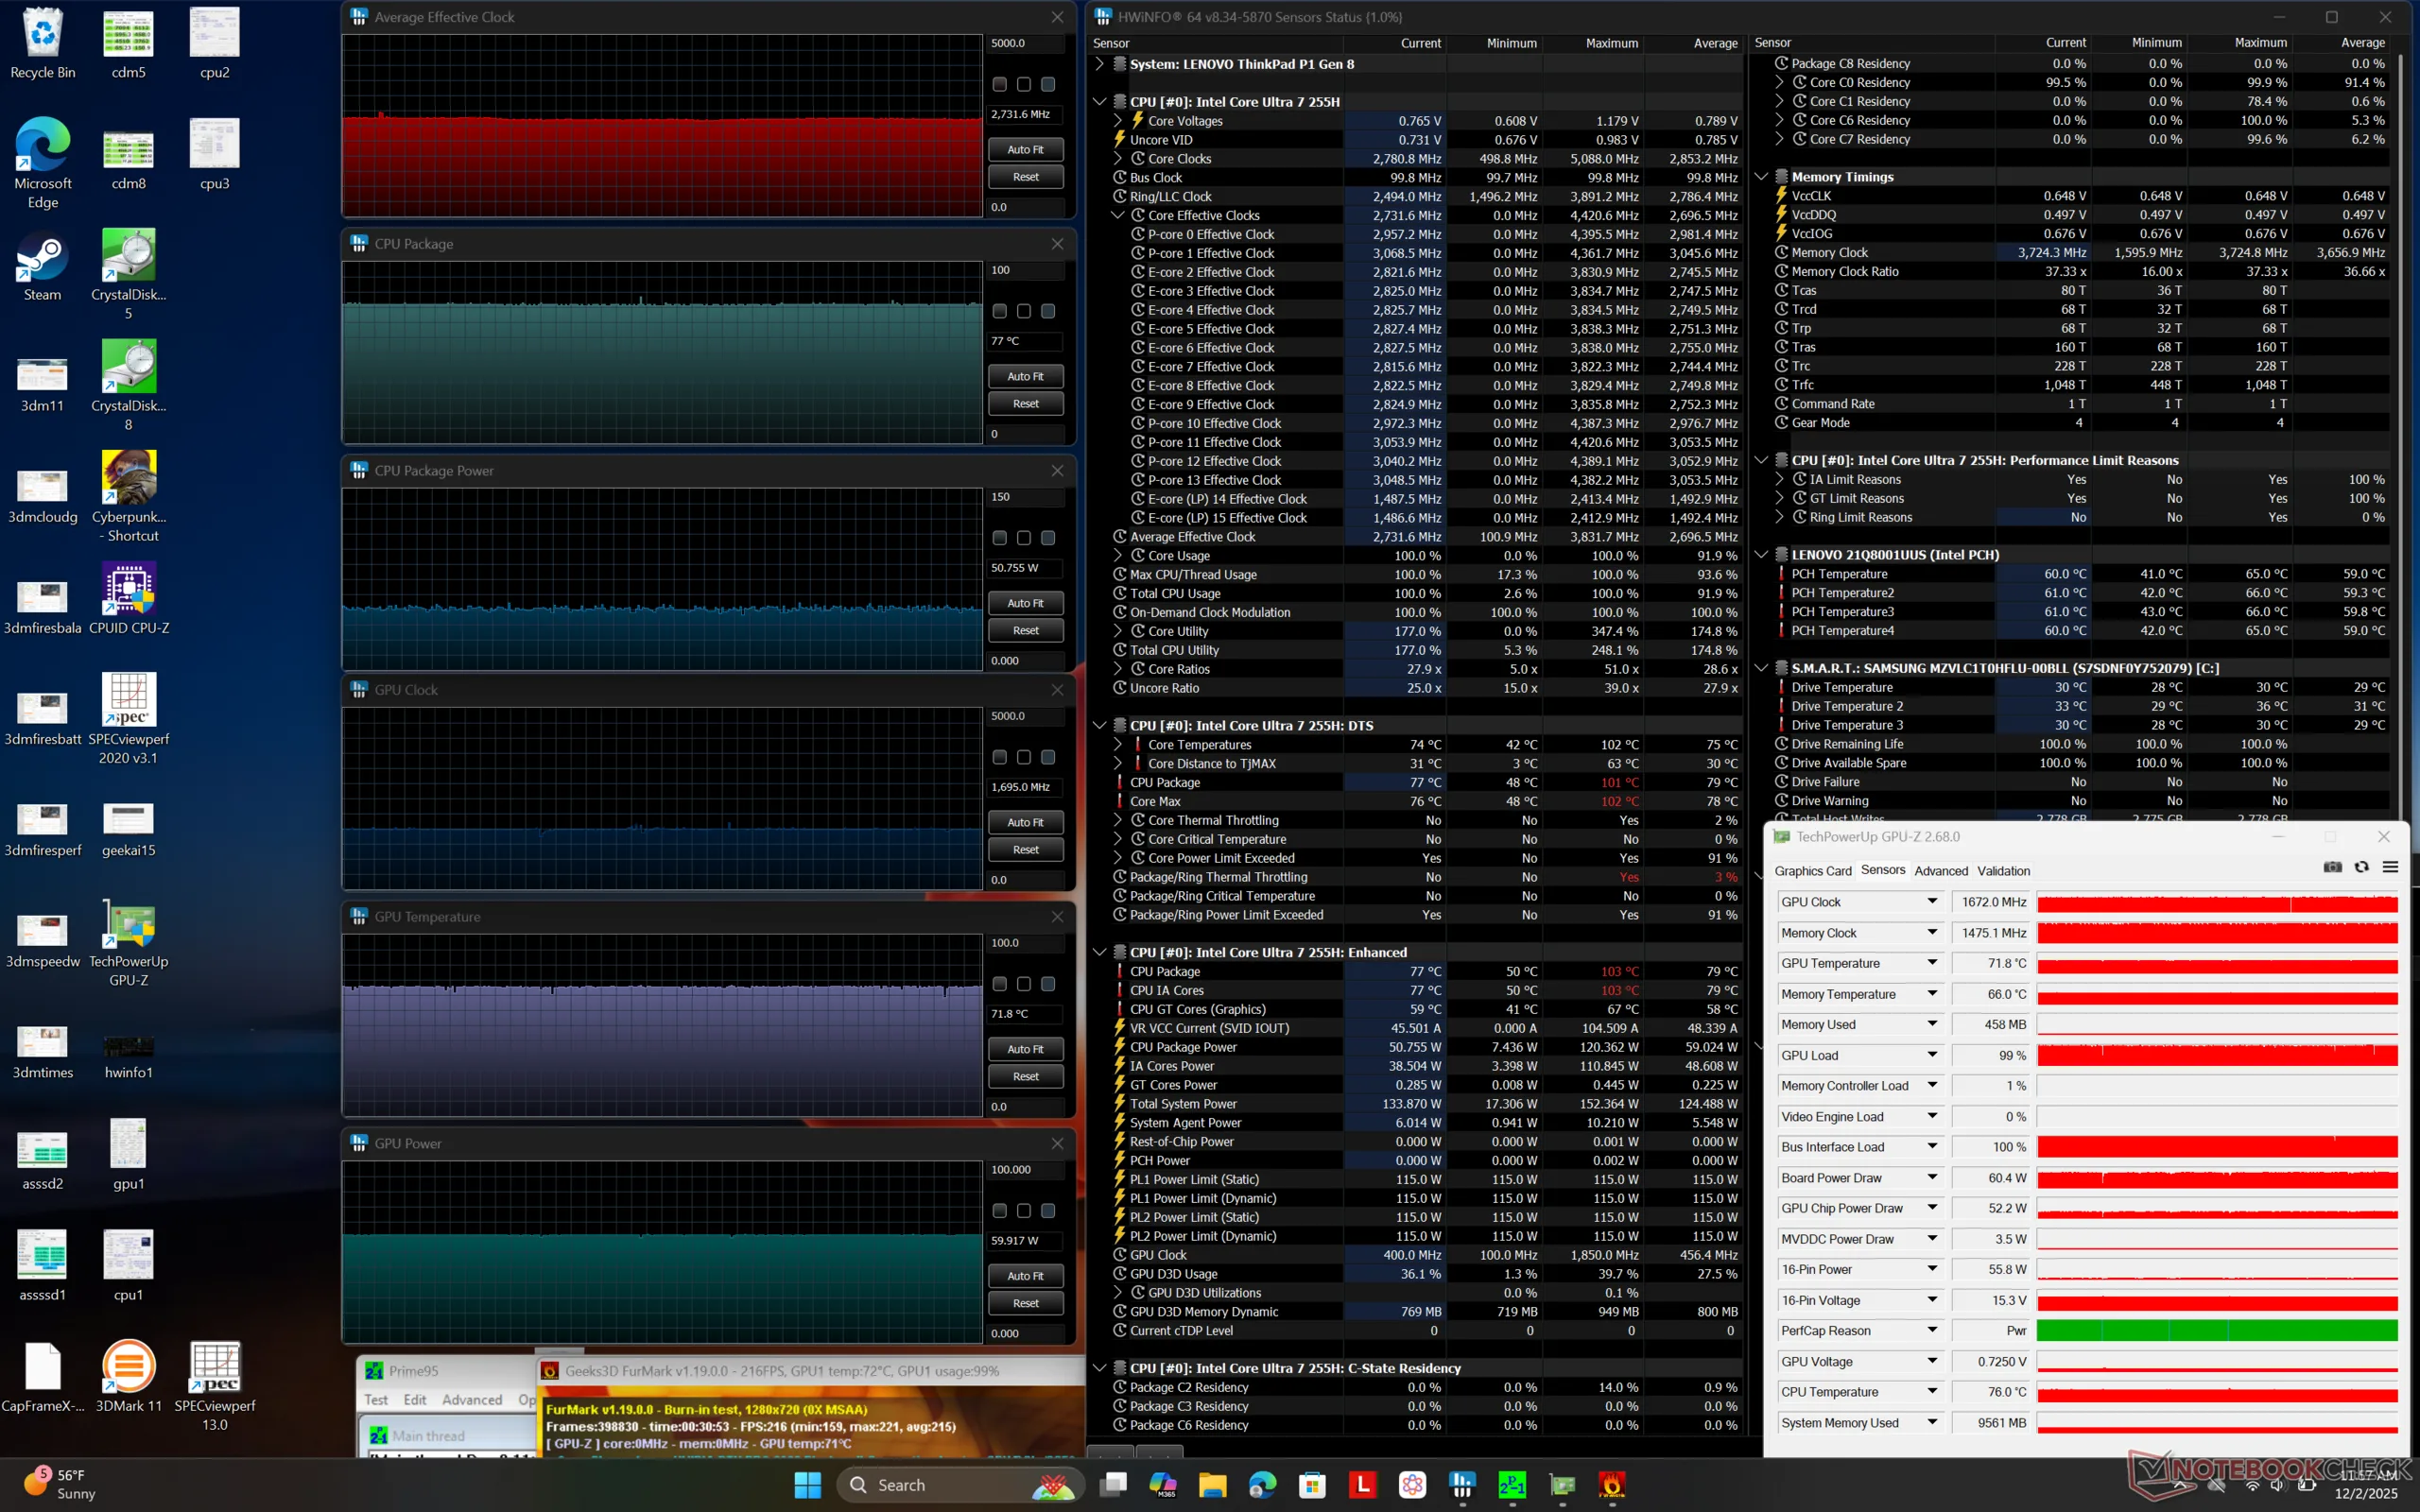
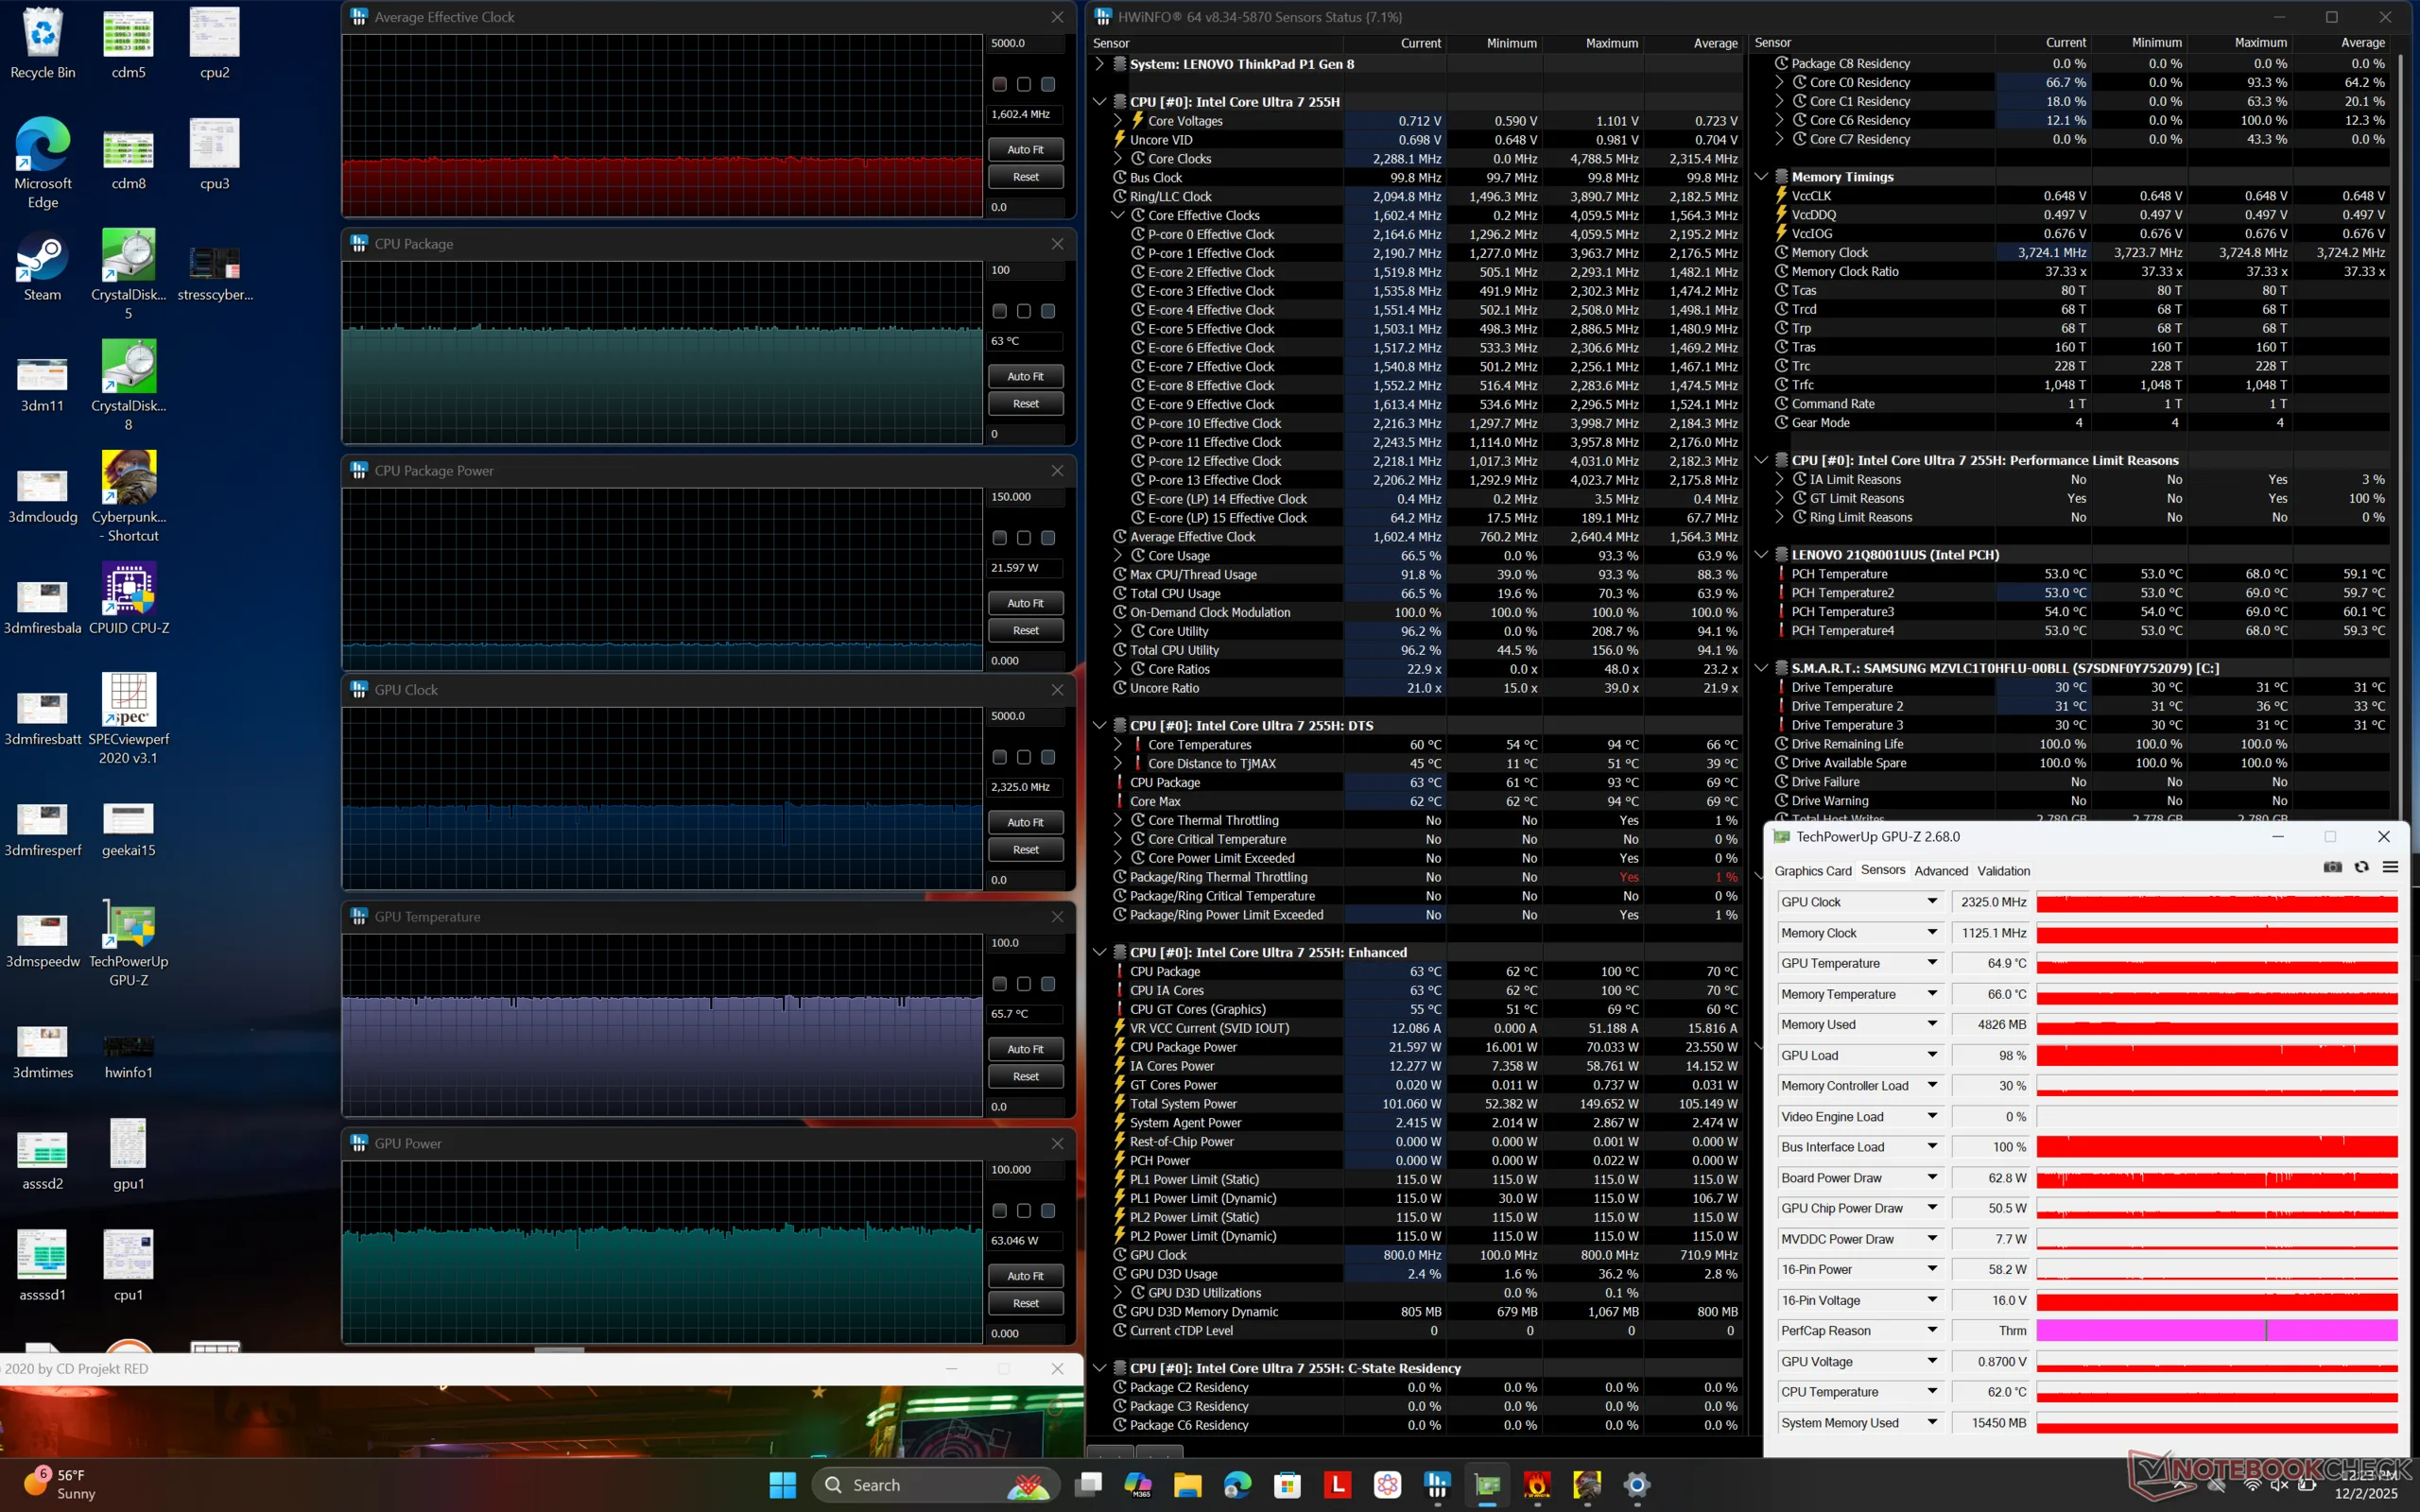
| CPU-klok (GHz) | GPU-klok (MHz) | Gemiddelde CPU-temperatuur (°C) | Gemiddelde GPU-temperatuur (°C) | |
| Systeem inactief | -- | -- | 52 | 45 |
| Prime95 Stress | 3.6 | -- | 91 | 60 |
| Prime95 + FurMark Stress | 2.7 | 1672 | 77 | 72 |
| Cyberpunk 2077 Stress (evenwichtige modus) | 1.6 | 2325 | 63 | 66 |
| Cyberpunk 2077 Stress (prestatiemodus) | 1.6 | 2332 | 74 | 76 |
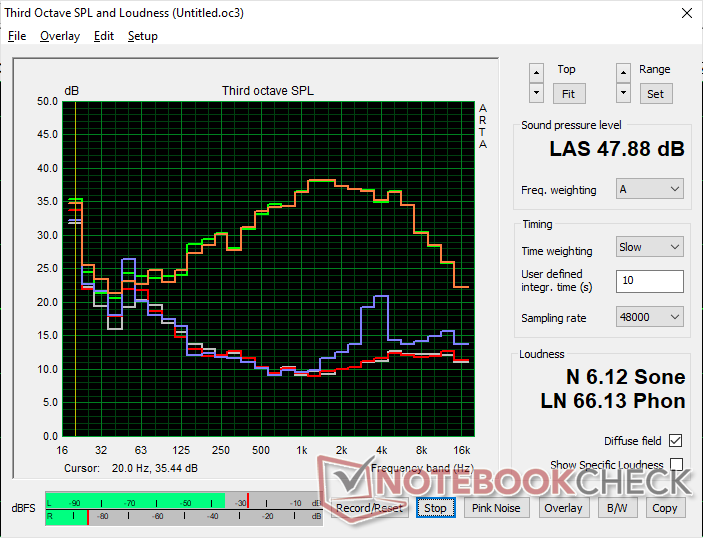
Luidsprekers
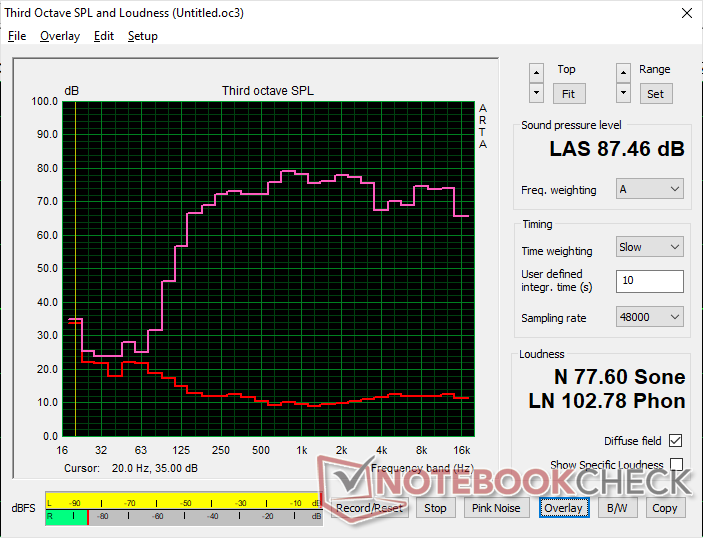
Lenovo ThinkPad P1 Gen 8 audioanalyse
(+) | luidsprekers kunnen relatief luid spelen (87.5 dB)
Bas 100 - 315 Hz
(±) | verminderde zeebaars - gemiddeld 9.8% lager dan de mediaan
(±) | lineariteit van de lage tonen is gemiddeld (11.2% delta ten opzichte van de vorige frequentie)
Midden 400 - 2000 Hz
(+) | evenwichtige middens - slechts 2.9% verwijderd van de mediaan
(+) | de middentonen zijn lineair (2.8% delta ten opzichte van de vorige frequentie)
Hoog 2 - 16 kHz
(+) | evenwichtige hoogtepunten - slechts 3% verwijderd van de mediaan
(+) | de hoge tonen zijn lineair (4.7% delta naar de vorige frequentie)
Algemeen 100 - 16.000 Hz
(+) | het totale geluid is lineair (8.3% verschil met de mediaan)
Vergeleken met dezelfde klasse
» 1% van alle geteste apparaten in deze klasse waren beter, 1% vergelijkbaar, 97% slechter
» De beste had een delta van 7%, het gemiddelde was 17%, de slechtste was 35%
Vergeleken met alle geteste toestellen
» 2% van alle geteste apparaten waren beter, 1% gelijk, 97% slechter
» De beste had een delta van 4%, het gemiddelde was 23%, de slechtste was 134%
Apple MacBook Pro 16 2021 M1 Pro audioanalyse
(+) | luidsprekers kunnen relatief luid spelen (84.7 dB)
Bas 100 - 315 Hz
(+) | goede baars - slechts 3.8% verwijderd van de mediaan
(+) | de lage tonen zijn lineair (5.2% delta naar de vorige frequentie)
Midden 400 - 2000 Hz
(+) | evenwichtige middens - slechts 1.3% verwijderd van de mediaan
(+) | de middentonen zijn lineair (2.1% delta ten opzichte van de vorige frequentie)
Hoog 2 - 16 kHz
(+) | evenwichtige hoogtepunten - slechts 1.9% verwijderd van de mediaan
(+) | de hoge tonen zijn lineair (2.7% delta naar de vorige frequentie)
Algemeen 100 - 16.000 Hz
(+) | het totale geluid is lineair (4.6% verschil met de mediaan)
Vergeleken met dezelfde klasse
» 0% van alle geteste apparaten in deze klasse waren beter, 0% vergelijkbaar, 100% slechter
» De beste had een delta van 5%, het gemiddelde was 17%, de slechtste was 45%
Vergeleken met alle geteste toestellen
» 0% van alle geteste apparaten waren beter, 0% gelijk, 100% slechter
» De beste had een delta van 4%, het gemiddelde was 23%, de slechtste was 134%
Energiebeheer
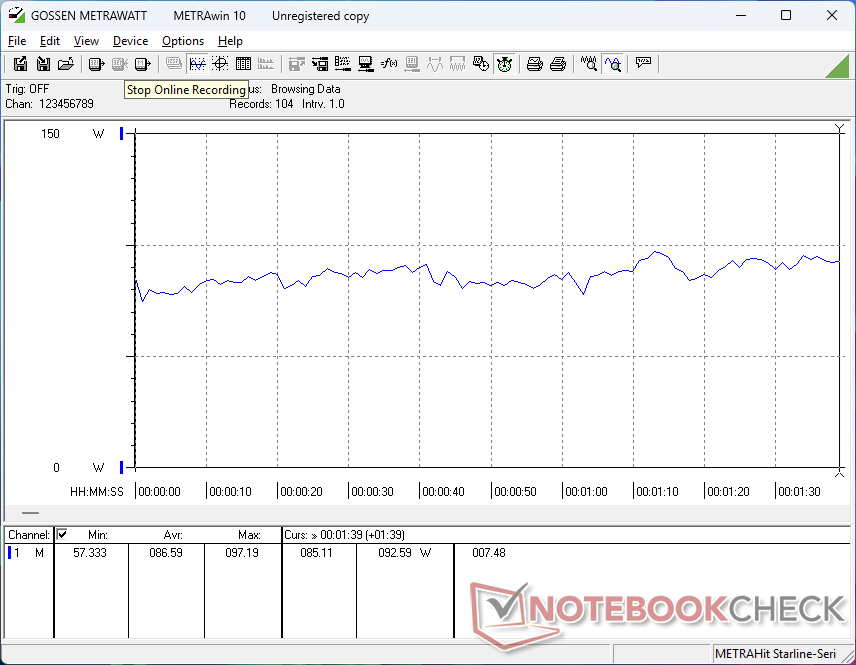
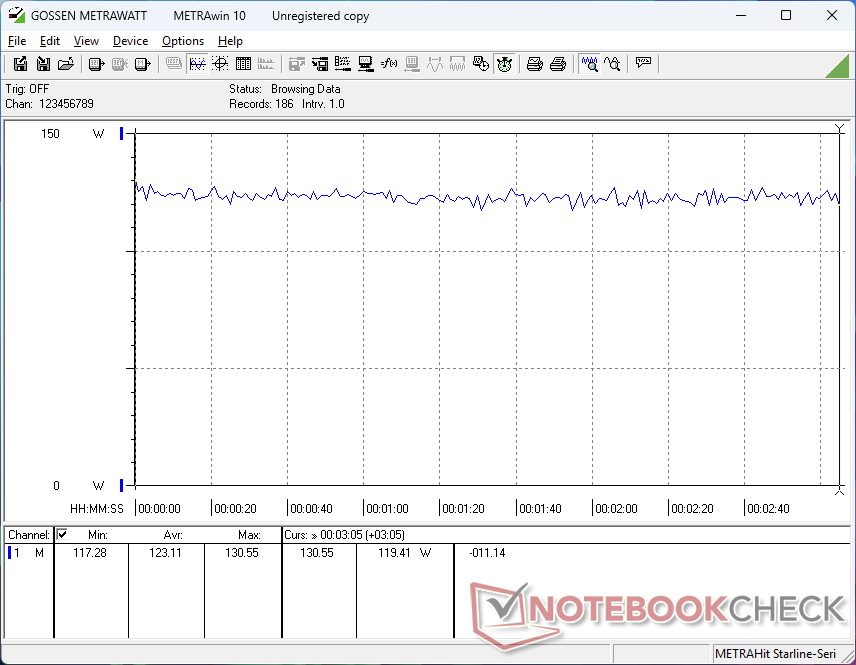
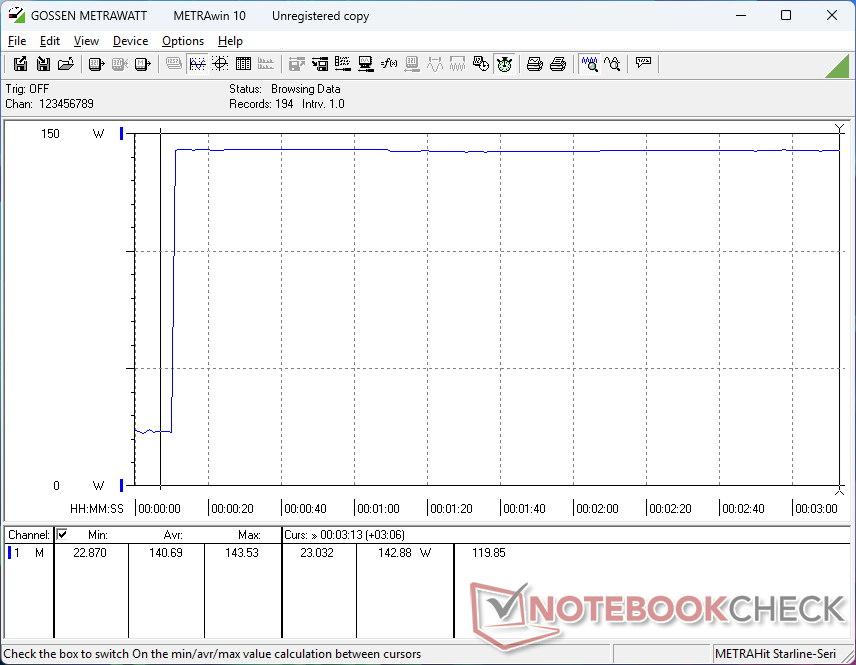
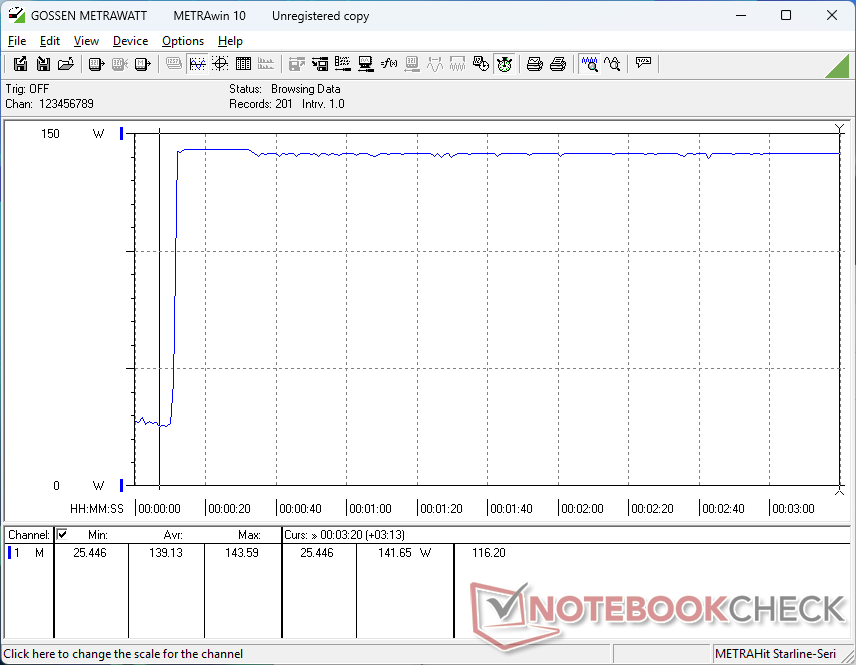
Stroomverbruik
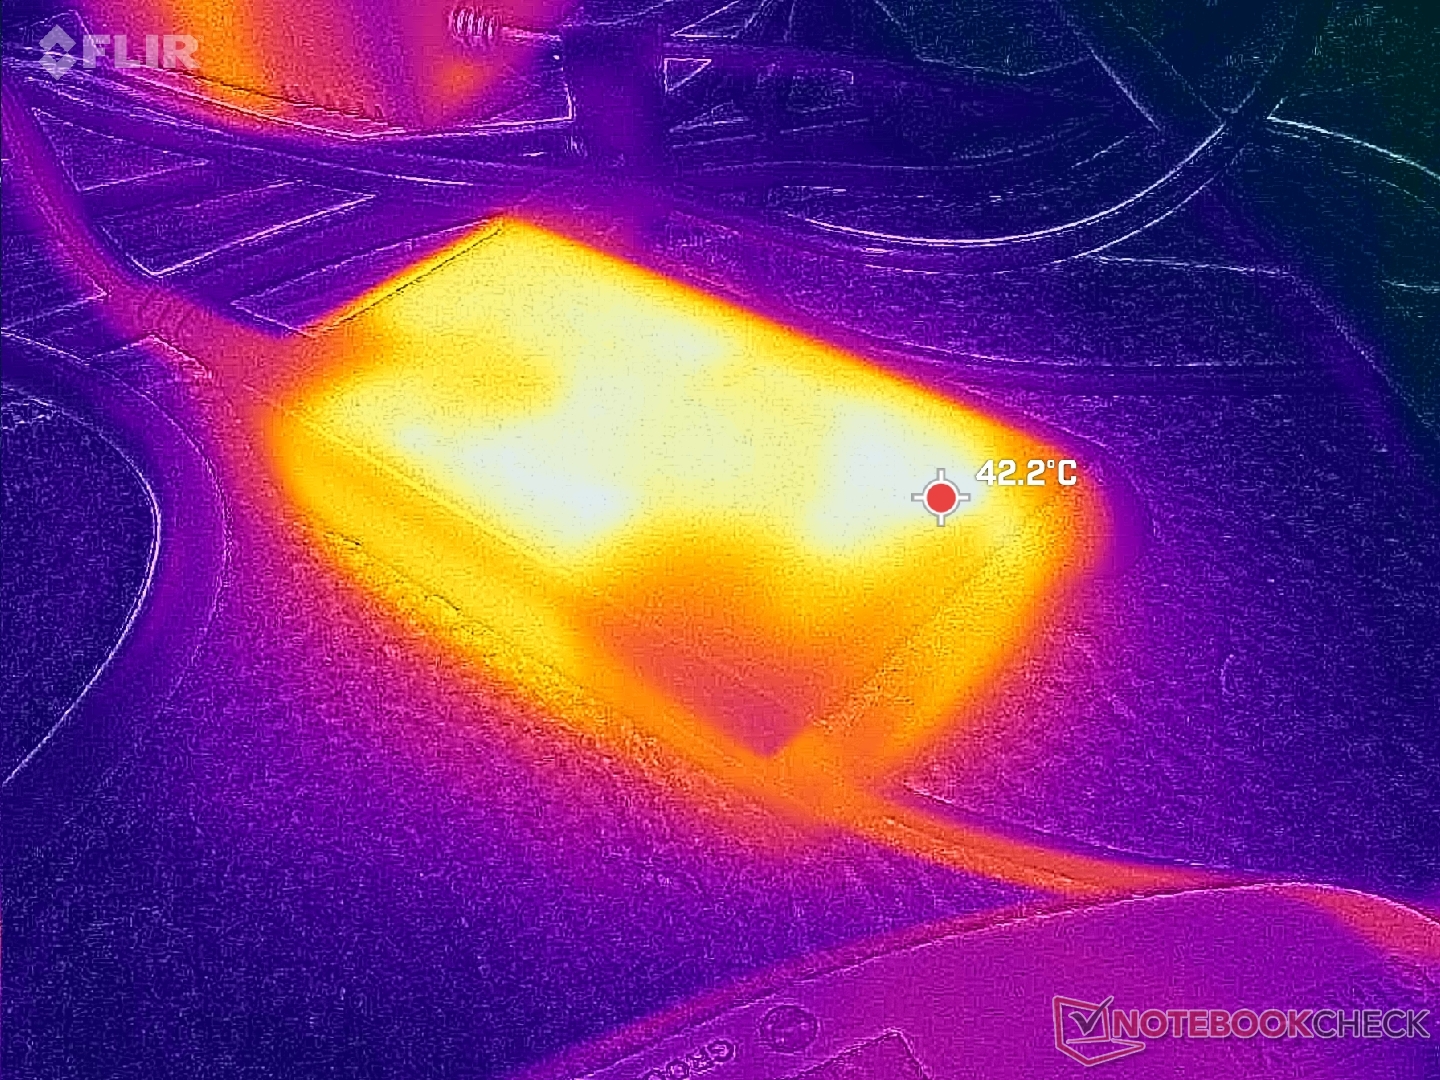
Het verbruik bij stationair draaien is over het algemeen hoger dan wat we registreerden bij het IPS-model van vorig jaar, wat leidt tot kortere looptijden. Het verbruik van de twee modellen is verder zeer vergelijkbaar bij zwaardere belastingen, ondanks de hogere prestaties van het Gen 8-model voor betere prestaties per watt.
Merk op dat de ThinkPad P1 Gen 8 wordt geleverd met een kleinere 140 W USB-C wisselstroomadapter (~12,8 x 6,2 x 2,3 cm), terwijl de ThinkPad P1 Gen 7 wordt geleverd met een 170 W adapter.
| Uit / Standby | |
| Inactief | |
| Belasting |
|
Key:
min: | |
| Lenovo ThinkPad P1 Gen 8 Ultra 7 255H, RTX PRO 2000 Blackwell Generation Laptop, Samsung PM9E1 1 TB MZVLC1T0HFLU, Tandem OLED, 3200x2000, 16" | Lenovo ThinkPad P16s Gen 4 21RX000YGE Ryzen AI 9 HX PRO 370, Radeon 890M, Micron 3500 1TB MTFDKBA1T0TGD, IPS LED, 1920x1200, 16" | Lenovo ThinkPad P1 Gen 7 21KV001SGE Ultra 7 155H, GeForce RTX 4060 Laptop GPU, Kioxia XG8 KXG8AZNV1T02, IPS LED, 2560x1600, 16" | HP ZBook X G1i 16 Ultra 7 265H, RTX PRO 2000 Blackwell Generation Laptop, Samsung PM9A1 MZVL22T0HBLB, IPS, 2560x1600, 16" | Dell Pro Max 16 Plus Ultra 9 285HX, RTX PRO 5000 Blackwell Generation Laptop, SK hynix PCB01 HFS001TFM9X186N, OLED, 3840x2400, 16" | Asus ExpertBook B6 Flip B6602FC2 i9-12950HX, RTX A2000 Laptop GPU, Samsung PM9A1 MZVL21T0HCLR, IPS, 2560x1600, 16" | |
|---|---|---|---|---|---|---|
| Power Consumption | 56% | 14% | 29% | -103% | -17% | |
| Idle Minimum * (Watt) | 15.4 | 3.9 75% | 7.3 53% | 4.1 73% | 35.1 -128% | 10.5 32% |
| Idle Average * (Watt) | 16.5 | 8.3 50% | 12.3 25% | 9 45% | 39.2 -138% | 11.9 28% |
| Idle Maximum * (Watt) | 23.1 | 8.7 62% | 17.9 23% | 9.4 59% | 56 -142% | 18 22% |
| Load Average * (Watt) | 86.6 | 51.6 40% | 78.2 10% | 86.7 -0% | 130.2 -50% | 182 -110% |
| Cyberpunk 2077 ultra external monitor * (Watt) | 121.8 | 54.6 55% | 117.7 3% | 102 16% | 213 -75% | |
| Cyberpunk 2077 ultra * (Watt) | 123.1 | 55.4 55% | 123.5 -0% | 106.1 14% | 229 -86% | |
| Load Maximum * (Watt) | 143.6 | 63.7 56% | 167.5 -17% | 152.9 -6% | 285.2 -99% | 229 -59% |
| Witcher 3 ultra * (Watt) | 177.5 |
* ... kleiner is beter
Stroomverbruik Cyberpunk / Stresstest
Stroomverbruik externe monitor
Levensduur batterij
De brandduur is merkbaar korter dan bij de IPS-configuratie van vorig jaar, zelfs als deze is ingesteld op de gebalanceerde modus en hetzelfde helderheidsniveau van ~150 nit.
| Lenovo ThinkPad P1 Gen 8 Ultra 7 255H, RTX PRO 2000 Blackwell Generation Laptop, 90 Wh | Lenovo ThinkPad P1 Gen 7 21KV001SGE Ultra 7 155H, GeForce RTX 4060 Laptop GPU, 90 Wh | HP ZBook X G1i 16 Ultra 7 265H, RTX PRO 2000 Blackwell Generation Laptop, 83 Wh | Dell Pro Max 16 Plus Ultra 9 285HX, RTX PRO 5000 Blackwell Generation Laptop, 96 Wh | Asus ExpertBook B6 Flip B6602FC2 i9-12950HX, RTX A2000 Laptop GPU, 90 Wh | |
|---|---|---|---|---|---|
| Batterijduur | 80% | 127% | -35% | 58% | |
| WiFi v1.3 (h) | 5.5 | 9.9 80% | 12.5 127% | 3.6 -35% | 8.7 58% |
| Load (h) | 1.9 | 1.7 | |||
| Reader / Idle (h) | 12.5 | ||||
| H.264 (h) | 5.8 |
Notebookcheck Beoordeling
De ThinkPad P1 Gen 8 blinkt uit als een superdun 16-inch workstation met midrange Core H-serie CPU's en discrete Nvidia Pro RTX graphics.
Lenovo ThinkPad P1 Gen 8
- 10-12-2025 v8
Allen Ngo
 Total Sustainability Score:
 Potentiële concurrenten in vergelijking
Afbeelding | Model / recensie | prijs | Gewicht | Hoogte | Scherm |
|---|---|---|---|---|---|
1. 91.6%  | Lenovo ThinkPad P1 Gen 8 Intel Core Ultra 7 255H ⎘ NVIDIA RTX PRO 2000 Blackwell Generation Laptop ⎘ 32 GB Geheugen, 1024 GB SSD | Amazon: Catalogusprijs: 2000 USD | 1.9 kg | 20.6 mm | 16.00" 3200x2000 236 PPI Tandem OLED |
2. 82%  | Lenovo ThinkPad P16s Gen 4 21RX000YGE AMD Ryzen AI 9 HX PRO 370 ⎘ AMD Radeon 890M ⎘ 64 GB Geheugen, 1024 GB SSD | Amazon: Catalogusprijs: 2440 Euro | 2 kg | 23 mm | 16.00" 1920x1200 142 PPI IPS LED |
3. 83.5%  | Lenovo ThinkPad P1 Gen 7 21KV001SGE Intel Core Ultra 7 155H ⎘ NVIDIA GeForce RTX 4060 Laptop GPU ⎘ 32 GB Geheugen, 1024 GB SSD | Amazon: Catalogusprijs: 3239 Euro | 2 kg | 20.5 mm | 16.00" 2560x1600 189 PPI IPS LED |
4. 87.4%  | HP ZBook X G1i 16 Intel Core Ultra 7 265H ⎘ NVIDIA RTX PRO 2000 Blackwell Generation Laptop ⎘ 64 GB Geheugen, 2048 GB SSD | Amazon: Catalogusprijs: 2700 USD | 2.2 kg | 23 mm | 16.00" 2560x1600 189 PPI IPS |
5. 88.4%  | Dell Pro Max 16 Plus Intel Core Ultra 9 285HX ⎘ NVIDIA RTX PRO 5000 Blackwell Generation Laptop ⎘ 128 GB Geheugen, SSD | Amazon: Catalogusprijs: 5000 USD | 2.8 kg | 30.9 mm | 16.00" 3840x2400 283 PPI OLED |
6. 89.6% v7 (old)  | Asus ExpertBook B6 Flip B6602FC2 Intel Core i9-12950HX ⎘ NVIDIA RTX A2000 Laptop GPU ⎘ 32 GB Geheugen, 1024 GB SSD | Amazon: 1. $265.00 for ASUS ExpertBook B6 Flip ... 2. $198.00 for ASUS ExpertBook B6 Flip ... 3. $1,519.99 ASUS ExpertBook B5 Thin & Li... | 2.8 kg | 27.2 mm | 16.00" 2560x1600 189 PPI IPS |
Transparantie
De selectie van te beoordelen apparaten wordt gemaakt door onze redactie. Het testexemplaar werd ten behoeve van deze beoordeling door de fabrikant of detailhandelaar in bruikleen aan de auteur verstrekt. De kredietverstrekker had geen invloed op deze recensie, noch ontving de fabrikant vóór publicatie een exemplaar van deze recensie. Er bestond geen verplichting om deze recensie te publiceren. Als onafhankelijk mediabedrijf is Notebookcheck niet onderworpen aan het gezag van fabrikanten, detailhandelaren of uitgevers.
[transparency_disclaimer]Dit is hoe Notebookcheck test
Elk jaar beoordeelt Notebookcheck onafhankelijk honderden laptops en smartphones met behulp van gestandaardiseerde procedures om ervoor te zorgen dat alle resultaten vergelijkbaar zijn. We hebben onze testmethoden al zo'n 20 jaar voortdurend ontwikkeld en daarbij de industriestandaard bepaald. In onze testlaboratoria wordt gebruik gemaakt van hoogwaardige meetapparatuur door ervaren technici en redacteuren. Deze tests omvatten een validatieproces in meerdere fasen. Ons complexe beoordelingssysteem is gebaseerd op honderden goed onderbouwde metingen en benchmarks, waardoor de objectiviteit behouden blijft. Meer informatie over onze testmethoden kunt u hier vinden.

