Kort testrapport Acer TravelMate P2 TMP215-52 Laptop: Betaalbare business
Evaluatie | Datum | Model | Gewicht | Hoogte | Formaat | Resolutie | Beste prijs |
|---|---|---|---|---|---|---|---|
| 82 % v7 (old) | 08-2020 | Acer TravelMate P215-52 i7-10510U, UHD Graphics 620 | 1.8 kg | 19.9 mm | 15.60" | 1920x1080 | |
| 81.4 % v7 (old) | 08-2020 | HP ProBook 450 G7 8WC04UT i7-10510U, GeForce MX250 | 1.9 kg | 19 mm | 15.60" | 1920x1080 | |
| 76.6 % v7 (old) | 03-2020 | Acer Extensa 15 EX215-51-56UX i5-10210U, UHD Graphics 620 | 1.9 kg | 19.9 mm | 15.60" | 1920x1080 | |
| 78.5 % v7 (old) | 02-2020 | HP 15s-fq1556ng i5-1035G1, UHD Graphics G1 (Ice Lake 32 EU) | 1.7 kg | 18 mm | 15.60" | 1920x1080 | |
| 83.2 % v7 (old) | 10-2019 | Lenovo ThinkPad L590-20Q70019GE i5-8265U, UHD Graphics 620 | 2 kg | 23 mm | 15.60" | 1920x1080 | |
| 79.6 % v6 (old) | 07-2019 | Dell Latitude 15 3590 i5-8250U, UHD Graphics 620 | 2.1 kg | 22 mm | 15.60" | 1920x1080 |
| SD Card Reader | |
| average JPG Copy Test (av. of 3 runs) | |
| HP ProBook 450 G7 8WC04UT (Toshiba Exceria Pro SDXC 64 GB UHS-II) | |
| Lenovo ThinkPad L590-20Q70019GE (Toshiba Exceria Pro M501 64 GB UHS-II) | |
| Dell Latitude 15 3590 (Toshiba Exceria Pro SDXC 64 GB UHS-II) | |
| Acer TravelMate P215-52 (Toshiba Exceria Pro SDXC 64 GB UHS-II) | |
| maximum AS SSD Seq Read Test (1GB) | |
| Lenovo ThinkPad L590-20Q70019GE (Toshiba Exceria Pro M501 64 GB UHS-II) | |
| HP ProBook 450 G7 8WC04UT (Toshiba Exceria Pro SDXC 64 GB UHS-II) | |
| Dell Latitude 15 3590 (Toshiba Exceria Pro SDXC 64 GB UHS-II) | |
| Acer TravelMate P215-52 (Toshiba Exceria Pro SDXC 64 GB UHS-II) | |


| |||||||||||||||||||||||||
Helderheidsverdeling: 78 %
Helderheid in Batterij-modus: 255.9 cd/m²
Contrast: 556:1 (Zwart: 0.46 cd/m²)
ΔE ColorChecker Calman: 5.02 | ∀{0.5-29.43 Ø4.71}
calibrated: 4.17
ΔE Greyscale Calman: 4.2 | ∀{0.09-98 Ø4.96}
60.4% sRGB (Argyll 1.6.3 3D)
38.6% AdobeRGB 1998 (Argyll 1.6.3 3D)
42.01% AdobeRGB 1998 (Argyll 3D)
60.6% sRGB (Argyll 3D)
40.66% Display P3 (Argyll 3D)
Gamma: 2.07
CCT: 6975 K
| Acer TravelMate P215-52 BOE CQ NV156FHM-N48, IPS, 15.6", 1920x1080 | HP ProBook 450 G7 8WC04UT LG Philips LGD062E, IPS, 15.6", 1920x1080 | Acer Extensa 15 EX215-51-56UX BOE CQ NT156FHM-N61, TN LED, 15.6", 1920x1080 | HP 15s-fq1556ng AU Optronics B156HW02, IPS, 15.6", 1920x1080 | Lenovo ThinkPad L590-20Q70019GE N156HCE-EAA, IPS, 15.6", 1920x1080 | Dell Latitude 15 3590 BOE0802 / NT15N41 / Dell: M9P74, TN LED, 15.6", 1920x1080 | |
|---|---|---|---|---|---|---|
| Display | -7% | -6% | -7% | 6% | -2% | |
| Display P3 Coverage (%) | 40.66 | 37.9 -7% | 38.17 -6% | 37.66 -7% | 43.3 6% | 39.67 -2% |
| sRGB Coverage (%) | 60.6 | 56.5 -7% | 57.5 -5% | 56.4 -7% | 64.4 6% | 59.7 -1% |
| AdobeRGB 1998 Coverage (%) | 42.01 | 39.08 -7% | 39.44 -6% | 38.91 -7% | 44.81 7% | 40.99 -2% |
| Response Times | -24% | -10% | -60% | -40% | -5% | |
| Response Time Grey 50% / Grey 80% * (ms) | 24.4 ? | 35.2 ? -44% | 41 ? -68% | 51 ? -109% | 42.8 ? -75% | 41 ? -68% |
| Response Time Black / White * (ms) | 29.2 ? | 30.4 ? -4% | 15 ? 49% | 32 ? -10% | 30.8 ? -5% | 12 ? 59% |
| PWM Frequency (Hz) | 1000 ? | 24510 ? | 250 ? | |||
| Screen | 1% | -44% | 20% | 13% | -26% | |
| Brightness middle (cd/m²) | 255.9 | 259.8 2% | 203 -21% | 254 -1% | 247 -3% | 215 -16% |
| Brightness (cd/m²) | 234 | 251 7% | 188 -20% | 234 0% | 228 -3% | 214 -9% |
| Brightness Distribution (%) | 78 | 91 17% | 87 12% | 86 10% | 81 4% | 91 17% |
| Black Level * (cd/m²) | 0.46 | 0.42 9% | 0.635 -38% | 0.18 61% | 0.18 61% | 0.385 16% |
| Contrast (:1) | 556 | 619 11% | 320 -42% | 1411 154% | 1372 147% | 558 0% |
| Colorchecker dE 2000 * | 5.02 | 6.09 -21% | 10.84 -116% | 5.58 -11% | 5.9 -18% | 10.31 -105% |
| Colorchecker dE 2000 max. * | 18.26 | 16.33 11% | 22.18 -21% | 9.83 46% | 22.9 -25% | 20.44 -12% |
| Colorchecker dE 2000 calibrated * | 4.17 | 5.2 -25% | 5.09 -22% | 4.53 -9% | 4.7 -13% | 3.88 7% |
| Greyscale dE 2000 * | 4.2 | 3.7 12% | 12.87 -206% | 5.02 -20% | 5.1 -21% | 11.84 -182% |
| Gamma | 2.07 106% | 2.56 86% | 2.58 85% | 2.83 78% | 2.21 100% | 2.67 82% |
| CCT | 6975 93% | 6759 96% | 15854 41% | 6570 99% | 6398 102% | 13398 49% |
| Color Space (Percent of AdobeRGB 1998) (%) | 38.6 | 35.7 -8% | 36.4 -6% | 36 -7% | 41.2 7% | 39 1% |
| Color Space (Percent of sRGB) (%) | 60.4 | 56.2 -7% | 57.4 -5% | 56 -7% | 64.1 6% | 61 1% |
| Totaal Gemiddelde (Programma / Instellingen) | -10% /
-4% | -20% /
-33% | -16% /
5% | -7% /
5% | -11% /
-19% |
* ... kleiner is beter
Responstijd Scherm
| ↔ Responstijd Zwart naar Wit | ||
|---|---|---|
| 29.2 ms ... stijging ↗ en daling ↘ gecombineerd | ↗ 15.2 ms stijging | 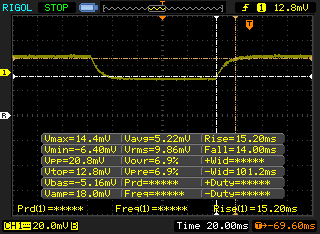 |
| ↘ 14 ms daling | ||
| Het scherm vertoonde relatief trage responstijden in onze tests en is misschien te traag voor games. Ter vergelijking: alle testtoestellen variëren van 0.1 (minimum) tot 240 (maximum) ms. » 78 % van alle toestellen zijn beter. Dit betekent dat de gemeten responstijd slechter is dan het gemiddelde (19.8 ms) van alle geteste toestellen. | ||
| ↔ Responstijd 50% Grijs naar 80% Grijs | ||
| 24.4 ms ... stijging ↗ en daling ↘ gecombineerd | ↗ 14 ms stijging | 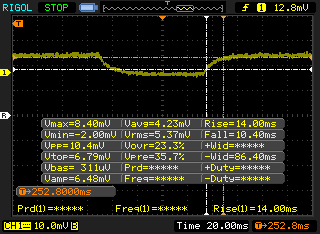 |
| ↘ 10.4 ms daling | ||
| Het scherm vertoonde prima responstijden in onze tests maar is misschien wat te traag voor competitieve games. Ter vergelijking: alle testtoestellen variëren van 0.165 (minimum) tot 636 (maximum) ms. » 35 % van alle toestellen zijn beter. Dit betekent dat de gemeten responstijd beter is dan het gemiddelde (30.9 ms) van alle geteste toestellen. | ||
Screen Flickering / PWM (Pulse-Width Modulation)
| Screen flickering / PWM waargenomen | 1000 Hz | ≤ 99 % helderheid instelling | 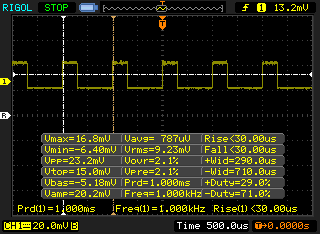 |
De achtergrondverlichting van het scherm flikkert op 1000 Hz (in het slechtste geval, bijvoorbeeld bij gebruik van PWM) aan een helderheid van 99 % en lager. Boven deze helderheid zou er geen flickering / PWM mogen optreden. De frequentie van 1000 Hz is redelijk hoog en de meeste mensen die gevoelig zijn aan flickering zouden dit dus niet mogen waarnemen of geïrriteerde ogen krijgen. Ter vergelijking: 52 % van alle geteste toestellen maakten geen gebruik van PWM om de schermhelderheid te verlagen. Als het wel werd gebruikt, werd een gemiddelde van 7741 (minimum: 5 - maximum: 343500) Hz waargenomen. | |||
Cinebench R15: CPU Multi 64Bit | CPU Single 64Bit
Blender: v2.79 BMW27 CPU
7-Zip 18.03: 7z b 4 -mmt1 | 7z b 4
Geekbench 5.5: Single-Core | Multi-Core
HWBOT x265 Benchmark v2.2: 4k Preset
LibreOffice : 20 Documents To PDF
R Benchmark 2.5: Overall mean
| Geekbench 5.5 / Single-Core | |
| HP 15s-fq1440ng | |
| Gemiddeld Intel Core i7-10510U (977 - 1287, n=31) | |
| Lenovo IdeaPad 3 14IIL05 | |
| HP ProBook 455 G7-175W8EA | |
| Acer TravelMate P215-52 | |
| HP ProBook 445 G7 175W4EA | |
| Lenovo ThinkPad T14s-20T00044GE | |
| Acer Swift 3 SF314-42-R27B | |
| Geekbench 5.5 / Multi-Core | |
| HP ProBook 455 G7-175W8EA | |
| HP ProBook 445 G7 175W4EA | |
| HP 15s-fq1440ng | |
| Lenovo ThinkPad T14s-20T00044GE | |
| Gemiddeld Intel Core i7-10510U (2474 - 4484, n=31) | |
| Acer Swift 3 SF314-42-R27B | |
| Acer TravelMate P215-52 | |
| Lenovo IdeaPad 3 14IIL05 | |
| HWBOT x265 Benchmark v2.2 / 4k Preset | |
| HP ProBook 455 G7-175W8EA | |
| Dell XPS 13 7390 Core i7-10710U | |
| Lenovo ThinkPad T590-20N4002VGE | |
| Gemiddeld Intel Core i7-10510U (3.41 - 6.04, n=31) | |
| Lenovo ThinkPad T14s-20T00044GE | |
| Acer Swift 3 SF314-42-R27B | |
| HP 15s-fq1440ng | |
| Acer TravelMate P215-52 | |
| Lenovo ThinkPad L590-20Q70019GE | |
| Lenovo IdeaPad 3 14IIL05 | |
| LibreOffice / 20 Documents To PDF | |
| HP ProBook 455 G7-175W8EA | |
| HP ProBook 445 G7 175W4EA | |
| Acer Swift 3 SF314-42-R27B | |
| Gemiddeld Intel Core i7-10510U (50.7 - 77.8, n=27) | |
| Lenovo IdeaPad 3 14IIL05 | |
| Acer TravelMate P215-52 | |
| Lenovo ThinkPad T14s-20T00044GE | |
| HP 15s-fq1440ng | |
| R Benchmark 2.5 / Overall mean | |
| Lenovo IdeaPad 3 14IIL05 | |
| Lenovo ThinkPad T14s-20T00044GE | |
| Acer TravelMate P215-52 | |
| Acer Swift 3 SF314-42-R27B | |
| Gemiddeld Intel Core i7-10510U (0.637 - 0.81, n=28) | |
| HP 15s-fq1440ng | |
| HP ProBook 455 G7-175W8EA | |
* ... kleiner is beter
| PCMark 8 Home Score Accelerated v2 | 3157 punten | |
| PCMark 8 Work Score Accelerated v2 | 4823 punten | |
| PCMark 10 Score | 3797 punten | |
Help | ||
| DPC Latencies / LatencyMon - interrupt to process latency (max), Web, Youtube, Prime95 | |
| Dell XPS 15 9500 Core i7 4K UHD | |
| HP ProBook 450 G7 8WC04UT | |
| Acer TravelMate P215-52 | |
| HP 470 G7 8VU24EA | |
| Lenovo ThinkPad T14s-20T00044GE | |
| HP ProBook 455 G7-175W8EA | |
| HP ProBook 445 G7 175W4EA | |
| Acer Swift 3 SF314-42-R27B | |
| HP 15s-fq1440ng | |
| Lenovo IdeaPad 3 14IIL05 | |
| Lenovo ThinkPad E14 Gen2-20T7S00W00 | |
* ... kleiner is beter
| Acer TravelMate P215-52 SK hynix BC511 HFM256GDJTNI-82A0 | HP ProBook 450 G7 8WC04UT Crucial P1 SSD CT1000P1SSD8 | Acer Extensa 15 EX215-51-56UX WDC PC SN520 SDAPNUW-512G | HP 15s-fq1556ng Intel SSD 660p SSDPEKNW512G8 | Lenovo ThinkPad L590-20Q70019GE Toshiba XG6 KXG6AZNV512G | Dell Latitude 15 3590 Samsung SSD PM871b MZ7LN256HAJQ | |
|---|---|---|---|---|---|---|
| AS SSD | 84% | 147% | 106% | 170% | 4% | |
| Seq Read (MB/s) | 1770 | 1155 -35% | 1542 -13% | 1705 -4% | 1383 -22% | 498.7 -72% |
| Seq Write (MB/s) | 354.5 | 984 178% | 1249 252% | 904 155% | 852 140% | 361.7 2% |
| 4K Read (MB/s) | 38.18 | 48.85 28% | 38.79 2% | 58.5 53% | 45.72 20% | 34.65 -9% |
| 4K Write (MB/s) | 95.9 | 96.6 1% | 89.3 -7% | 165.4 72% | 120.2 25% | 79.8 -17% |
| 4K-64 Read (MB/s) | 423.4 | 581 37% | 966 128% | 323.1 -24% | 1344 217% | 372.5 -12% |
| 4K-64 Write (MB/s) | 141.1 | 658 366% | 885 527% | 827 486% | 926 556% | 247.7 76% |
| Access Time Read * (ms) | 0.071 | 0.066 7% | 0.056 21% | 0.063 11% | 0.06 15% | |
| Access Time Write * (ms) | 0.117 | 0.207 -77% | 0.044 62% | 0.044 62% | 0.036 69% | 0.042 64% |
| Score Read (Points) | 639 | 745 17% | 1159 81% | 522 -18% | 1528 139% | 457 -28% |
| Score Write (Points) | 272 | 853 214% | 1099 304% | 1083 298% | 1132 316% | 364 34% |
| Score Total (Points) | 1178 | 1986 69% | 2842 141% | 1901 61% | 3420 190% | 1060 -10% |
| Copy ISO MB/s (MB/s) | 634 | 2635 316% | 894 41% | 1147 81% | ||
| Copy Program MB/s (MB/s) | 96.2 | 95.1 -1% | 304.9 217% | 419.8 336% | ||
| Copy Game MB/s (MB/s) | 228.9 | 361.9 58% | 642 180% | 928 305% | ||
| CrystalDiskMark 5.2 / 6 | 30% | 62% | 45% | 51% | -30% | |
| Write 4K (MB/s) | 153.7 | 111.1 -28% | 176.1 15% | 203.1 32% | 115.3 -25% | 79.5 -48% |
| Read 4K (MB/s) | 60.4 | 56.3 -7% | 50.4 -17% | 65.3 8% | 43.34 -28% | 32.72 -46% |
| Write Seq (MB/s) | 431 | 559 30% | 1457 238% | 973 126% | 1014 135% | 472.5 10% |
| Read Seq (MB/s) | 1199 | 1348 12% | 1424 19% | 1651 38% | 1481 24% | 504 -58% |
| Write 4K Q32T1 (MB/s) | 374.5 | 277.1 -26% | 381 2% | 526 40% | 495.4 32% | 322.6 -14% |
| Read 4K Q32T1 (MB/s) | 445.5 | 312.1 -30% | 436.5 -2% | 345.2 -23% | 332.6 -25% | 249.9 -44% |
| Write Seq Q32T1 (MB/s) | 408.4 | 1652 305% | 1455 256% | 980 140% | 1654 305% | 531 30% |
| Read Seq Q32T1 (MB/s) | 1966 | 1588 -19% | 1725 -12% | 1883 -4% | 1746 -11% | 544 -72% |
| Write 4K Q8T8 (MB/s) | 1033 | |||||
| Read 4K Q8T8 (MB/s) | 892 | |||||
| Totaal Gemiddelde (Programma / Instellingen) | 57% /
64% | 105% /
115% | 76% /
80% | 111% /
127% | -13% /
-10% |
* ... kleiner is beter

Disk Throttling: DiskSpd Read Loop, Queue Depth 8
| 3DMark 11 Performance | 1960 punten | |
| 3DMark Cloud Gate Standard Score | 7963 punten | |
| 3DMark Fire Strike Score | 1071 punten | |
| 3DMark Time Spy Score | 431 punten | |
Help | ||
| lage | gem. | hoge | ultra | |
|---|---|---|---|---|
| Dota 2 Reborn (2015) | 68 | 43 | 20.4 | 18.1 |
| X-Plane 11.11 (2018) | 21.4 | 14.5 | 13.1 |
| Acer TravelMate P215-52 UHD Graphics 620, i7-10510U, SK hynix BC511 HFM256GDJTNI-82A0 | HP ProBook 450 G7 8WC04UT GeForce MX250, i7-10510U, Crucial P1 SSD CT1000P1SSD8 | Acer Extensa 15 EX215-51-56UX UHD Graphics 620, i5-10210U, WDC PC SN520 SDAPNUW-512G | HP 15s-fq1556ng UHD Graphics G1 (Ice Lake 32 EU), i5-1035G1, Intel SSD 660p SSDPEKNW512G8 | Lenovo ThinkPad L590-20Q70019GE UHD Graphics 620, i5-8265U, Toshiba XG6 KXG6AZNV512G | Dell Latitude 15 3590 UHD Graphics 620, i5-8250U, Samsung SSD PM871b MZ7LN256HAJQ | |
|---|---|---|---|---|---|---|
| Noise | -8% | -10% | -15% | -5% | -18% | |
| uit / omgeving * (dB) | 25.7 | 26.2 -2% | 30.3 -18% | 30.3 -18% | 29 -13% | 30.6 -19% |
| Idle Minimum * (dB) | 25.7 | 26.2 -2% | 30.3 -18% | 30.3 -18% | 29 -13% | 30.6 -19% |
| Idle Average * (dB) | 25.7 | 26.2 -2% | 30.3 -18% | 30.3 -18% | 29 -13% | 31.9 -24% |
| Idle Maximum * (dB) | 25.7 | 26.2 -2% | 30.3 -18% | 30.3 -18% | 29 -13% | 31.9 -24% |
| Load Average * (dB) | 33.8 | 38.1 -13% | 32.7 3% | 34 -1% | 29 14% | 39 -15% |
| Load Maximum * (dB) | 36.3 | 47 -29% | 32.8 10% | 41.3 -14% | 33.8 7% | 39.1 -8% |
| Witcher 3 ultra * (dB) | 37.5 |
* ... kleiner is beter
Geluidsniveau
| Onbelast |
| 25.7 / 25.7 / 25.7 dB (A) |
| Belasting |
| 33.8 / 36.3 dB (A) |
 | ||
30 dB stil 40 dB(A) hoorbaar 50 dB(A) luid |
||
min: | ||
(-) De maximumtemperatuur aan de bovenzijde bedraagt 49 °C / 120 F, vergeleken met het gemiddelde van 34.3 °C / 94 F, variërend van 21.2 tot 62.5 °C voor de klasse Office.
(±) De bodem warmt op tot een maximum van 41.2 °C / 106 F, vergeleken met een gemiddelde van 36.8 °C / 98 F
(+) Bij onbelast gebruik bedraagt de gemiddelde temperatuur voor de bovenzijde 29.6 °C / 85 F, vergeleken met het apparaatgemiddelde van 29.5 °C / 85 F.
(+) De handpalmsteunen en het touchpad bereiken maximaal de huidtemperatuur (32 °C / 89.6 F) en zijn dus niet heet.
(-) De gemiddelde temperatuur van de handpalmsteun van soortgelijke toestellen bedroeg 27.6 °C / 81.7 F (-4.4 °C / -7.9 F).
Acer TravelMate P215-52 audioanalyse
(±) | luidspreker luidheid is gemiddeld maar goed (75 dB)
Bas 100 - 315 Hz
(-) | bijna geen lage tonen - gemiddeld 27.6% lager dan de mediaan
(-) | de lage tonen zijn niet lineair (15% delta naar de vorige frequentie)
Midden 400 - 2000 Hz
(+) | evenwichtige middens - slechts 3.4% verwijderd van de mediaan
(+) | de middentonen zijn lineair (5.2% delta ten opzichte van de vorige frequentie)
Hoog 2 - 16 kHz
(+) | evenwichtige hoogtepunten - slechts 2.9% verwijderd van de mediaan
(+) | de hoge tonen zijn lineair (4.5% delta naar de vorige frequentie)
Algemeen 100 - 16.000 Hz
(±) | lineariteit van het totale geluid is gemiddeld (25.8% verschil met de mediaan)
Vergeleken met dezelfde klasse
» 79% van alle geteste apparaten in deze klasse waren beter, 7% vergelijkbaar, 14% slechter
» De beste had een delta van 7%, het gemiddelde was 21%, de slechtste was 53%
Vergeleken met alle geteste toestellen
» 79% van alle geteste apparaten waren beter, 4% gelijk, 17% slechter
» De beste had een delta van 4%, het gemiddelde was 23%, de slechtste was 134%
Apple MacBook 12 (Early 2016) 1.1 GHz audioanalyse
(+) | luidsprekers kunnen relatief luid spelen (83.6 dB)
Bas 100 - 315 Hz
(±) | verminderde zeebaars - gemiddeld 11.3% lager dan de mediaan
(±) | lineariteit van de lage tonen is gemiddeld (14.2% delta ten opzichte van de vorige frequentie)
Midden 400 - 2000 Hz
(+) | evenwichtige middens - slechts 2.4% verwijderd van de mediaan
(+) | de middentonen zijn lineair (5.5% delta ten opzichte van de vorige frequentie)
Hoog 2 - 16 kHz
(+) | evenwichtige hoogtepunten - slechts 2% verwijderd van de mediaan
(+) | de hoge tonen zijn lineair (4.5% delta naar de vorige frequentie)
Algemeen 100 - 16.000 Hz
(+) | het totale geluid is lineair (10.2% verschil met de mediaan)
Vergeleken met dezelfde klasse
» 7% van alle geteste apparaten in deze klasse waren beter, 2% vergelijkbaar, 90% slechter
» De beste had een delta van 5%, het gemiddelde was 18%, de slechtste was 53%
Vergeleken met alle geteste toestellen
» 5% van alle geteste apparaten waren beter, 1% gelijk, 94% slechter
» De beste had een delta van 4%, het gemiddelde was 23%, de slechtste was 134%
| Uit / Standby | |
| Inactief | |
| Belasting |
|
Key:
min: | |
| Acer TravelMate P215-52 i7-10510U, UHD Graphics 620, SK hynix BC511 HFM256GDJTNI-82A0, IPS, 1920x1080, 15.6" | HP ProBook 450 G7 8WC04UT i7-10510U, GeForce MX250, Crucial P1 SSD CT1000P1SSD8, IPS, 1920x1080, 15.6" | HP 15s-fq1556ng i5-1035G1, UHD Graphics G1 (Ice Lake 32 EU), Intel SSD 660p SSDPEKNW512G8, IPS, 1920x1080, 15.6" | Lenovo ThinkPad L590-20Q70019GE i5-8265U, UHD Graphics 620, Toshiba XG6 KXG6AZNV512G, IPS, 1920x1080, 15.6" | Dell Latitude 15 3590 i5-8250U, UHD Graphics 620, Samsung SSD PM871b MZ7LN256HAJQ, TN LED, 1920x1080, 15.6" | Lenovo ThinkPad E15 20RD0011GE i7-10510U, Radeon RX 640, Samsung PM991 MZALQ512HALU, IPS LED, 1920x1080, 15.6" | |
|---|---|---|---|---|---|---|
| Power Consumption | -61% | 1% | -14% | -12% | -27% | |
| Idle Minimum * (Watt) | 3.5 | 4.8 -37% | 3.3 6% | 3.96 -13% | 4.3 -23% | 3.2 9% |
| Idle Average * (Watt) | 6.2 | 9.5 -53% | 6.4 -3% | 6.9 -11% | 7.2 -16% | 6.8 -10% |
| Idle Maximum * (Watt) | 6.9 | 10.7 -55% | 6.8 1% | 9.8 -42% | 9.8 -42% | 9.5 -38% |
| Load Average * (Watt) | 31 | 61.8 -99% | 29 6% | 31.4 -1% | 38 -23% | 44 -42% |
| Load Maximum * (Watt) | 43.3 | 69 -59% | 46 -6% | 45.4 -5% | 24 45% | 66.4 -53% |
| Witcher 3 ultra * (Watt) | 50 |
* ... kleiner is beter
| Acer TravelMate P215-52 i7-10510U, UHD Graphics 620, 48 Wh | HP ProBook 450 G7 8WC04UT i7-10510U, GeForce MX250, 45 Wh | Acer Extensa 15 EX215-51-56UX i5-10210U, UHD Graphics 620, 37 Wh | HP 15s-fq1556ng i5-1035G1, UHD Graphics G1 (Ice Lake 32 EU), 41 Wh | Lenovo ThinkPad L590-20Q70019GE i5-8265U, UHD Graphics 620, 45 Wh | Dell Latitude 15 3590 i5-8250U, UHD Graphics 620, 56 Wh | |
|---|---|---|---|---|---|---|
| Batterijduur | -15% | -21% | -28% | 2% | 4% | |
| Reader / Idle (h) | 25.1 | 14.8 -41% | 17.4 -31% | 13.1 -48% | 17.4 -31% | 20.2 -20% |
| WiFi v1.3 (h) | 7.9 | 7.2 -9% | 6.7 -15% | 6 -24% | 7.2 -9% | 9.1 15% |
| Load (h) | 1.9 | 2 5% | 1.6 -16% | 1.7 -11% | 2.8 47% | 2.2 16% |
Pro
Contra
Dit is de verkorte versie van het originele artikel. Het volledige, Engelse testrapport vind je hier.
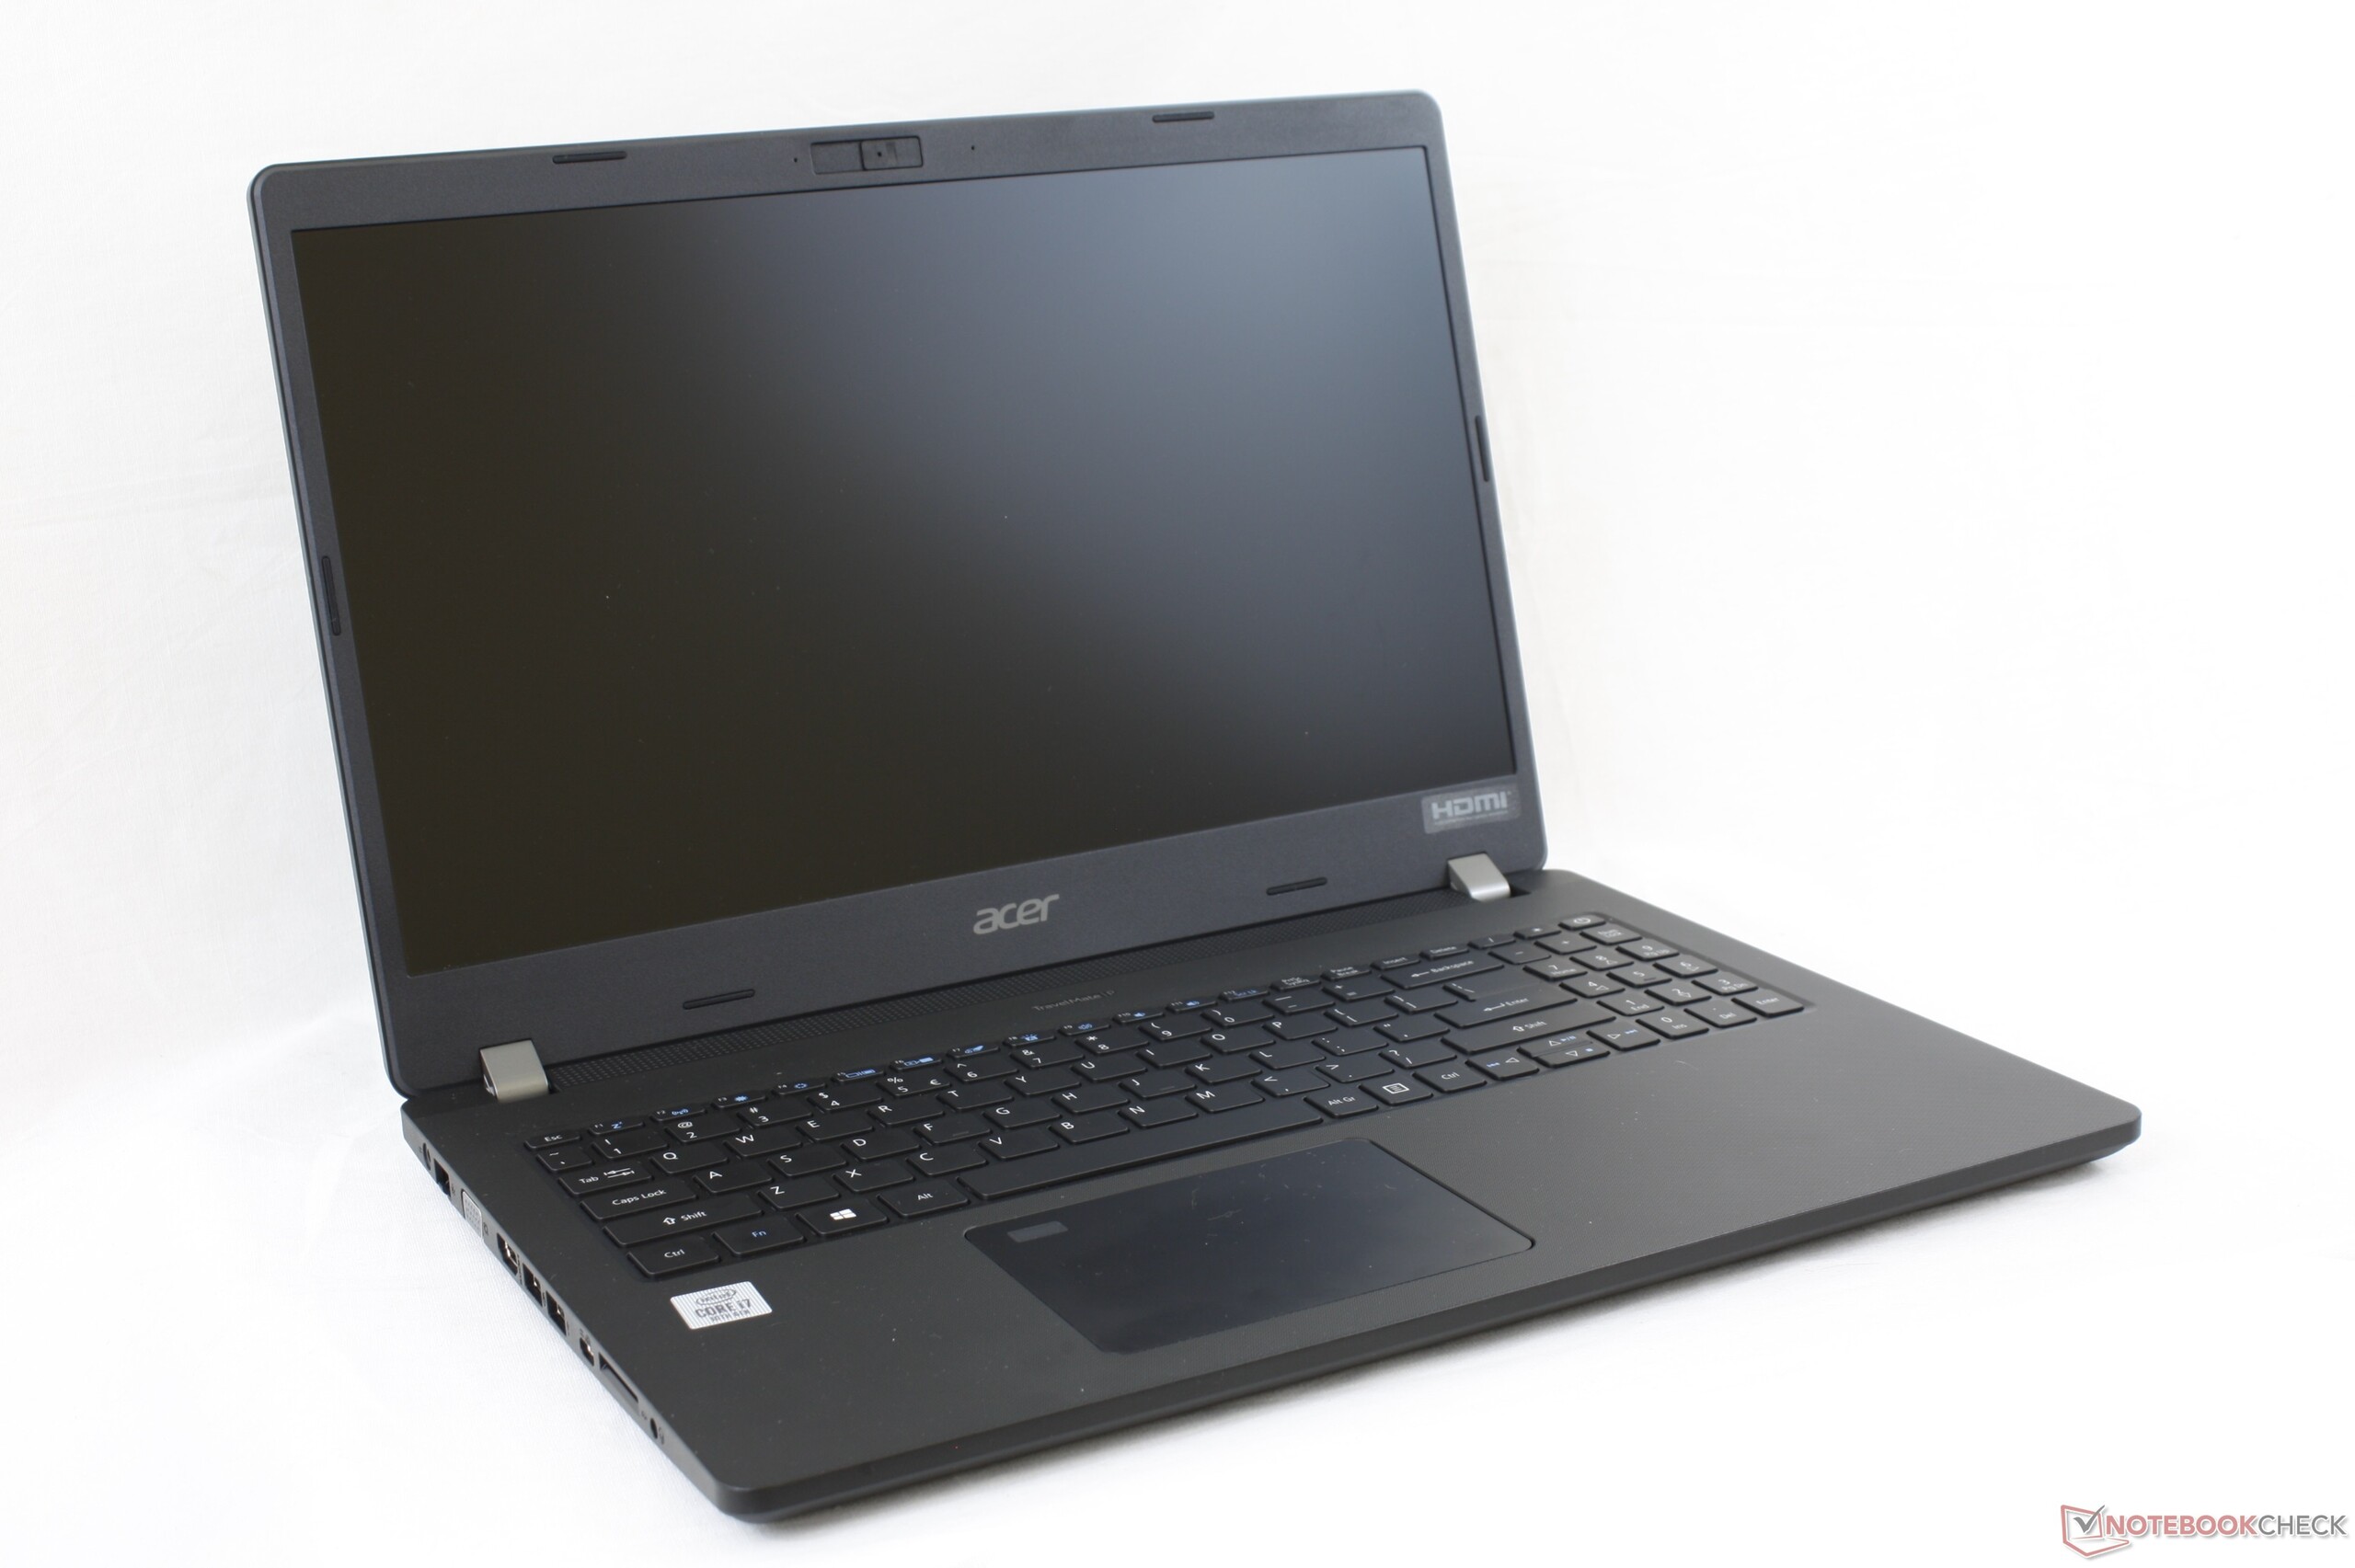
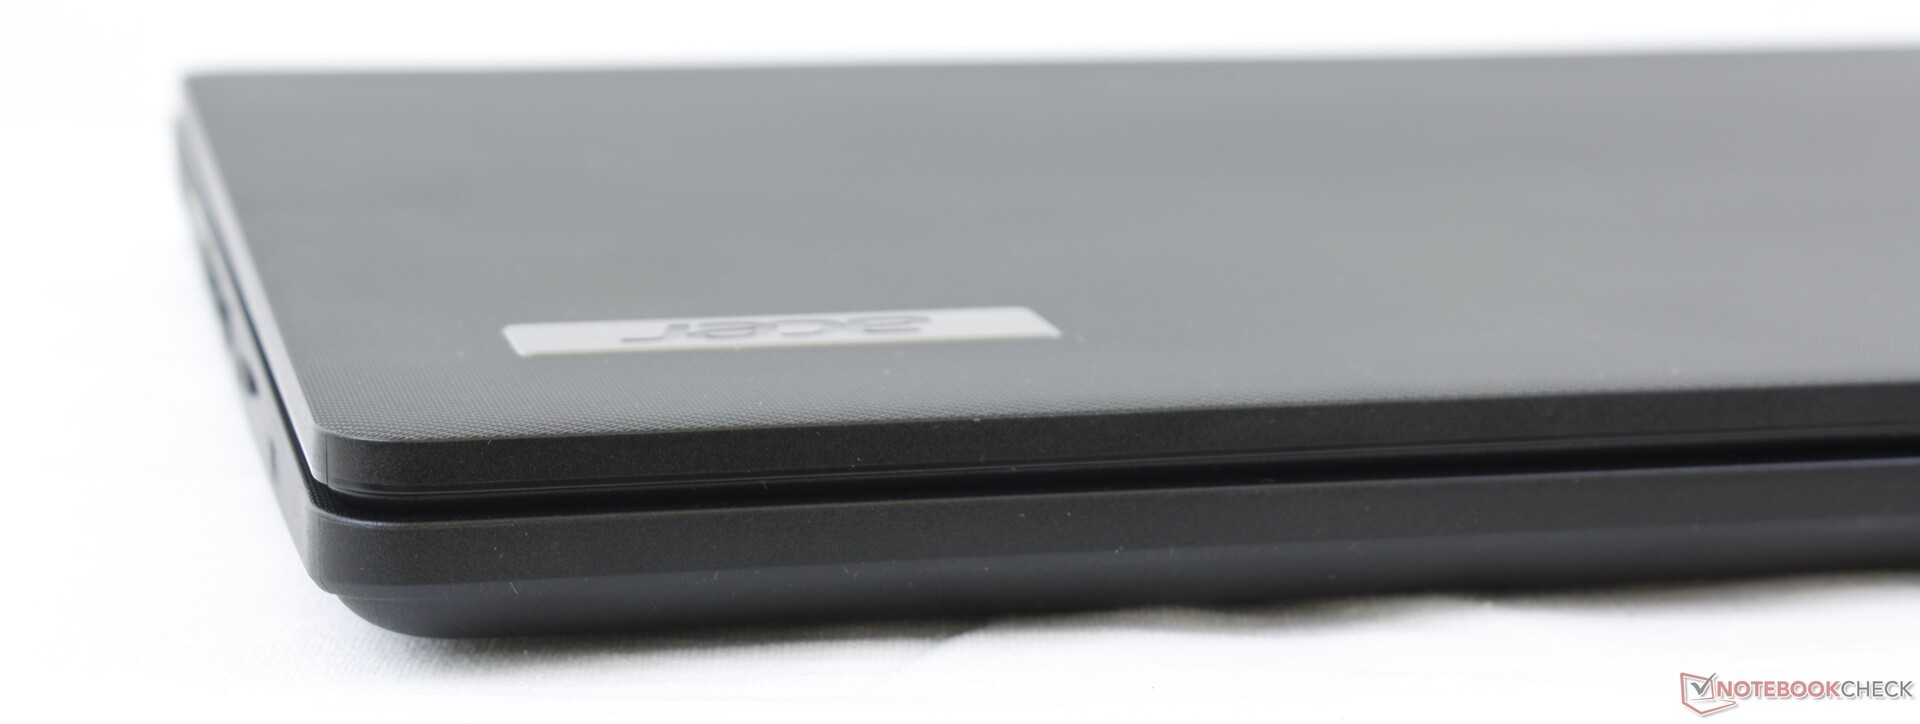
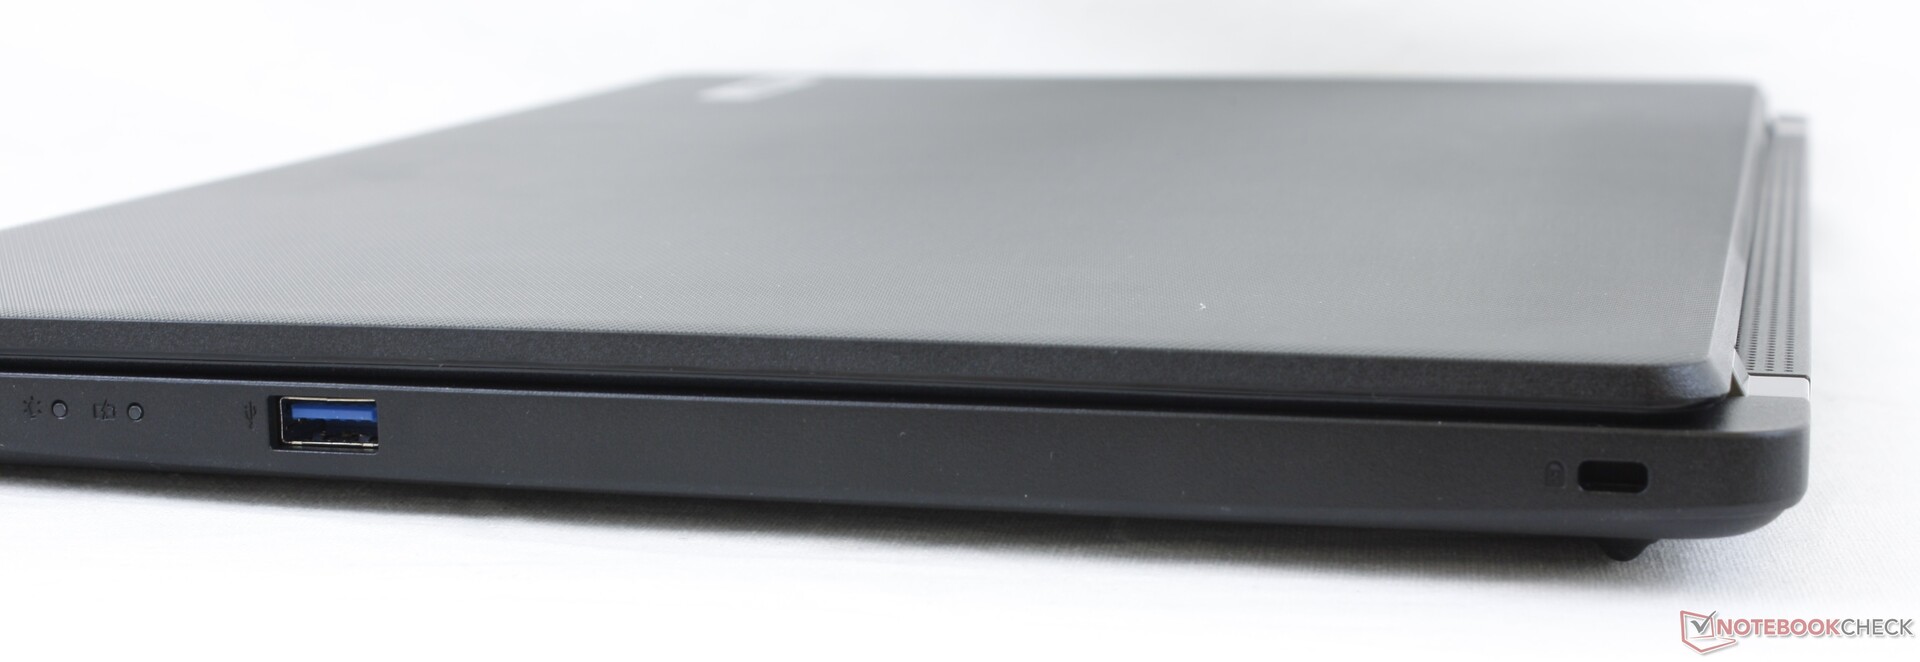
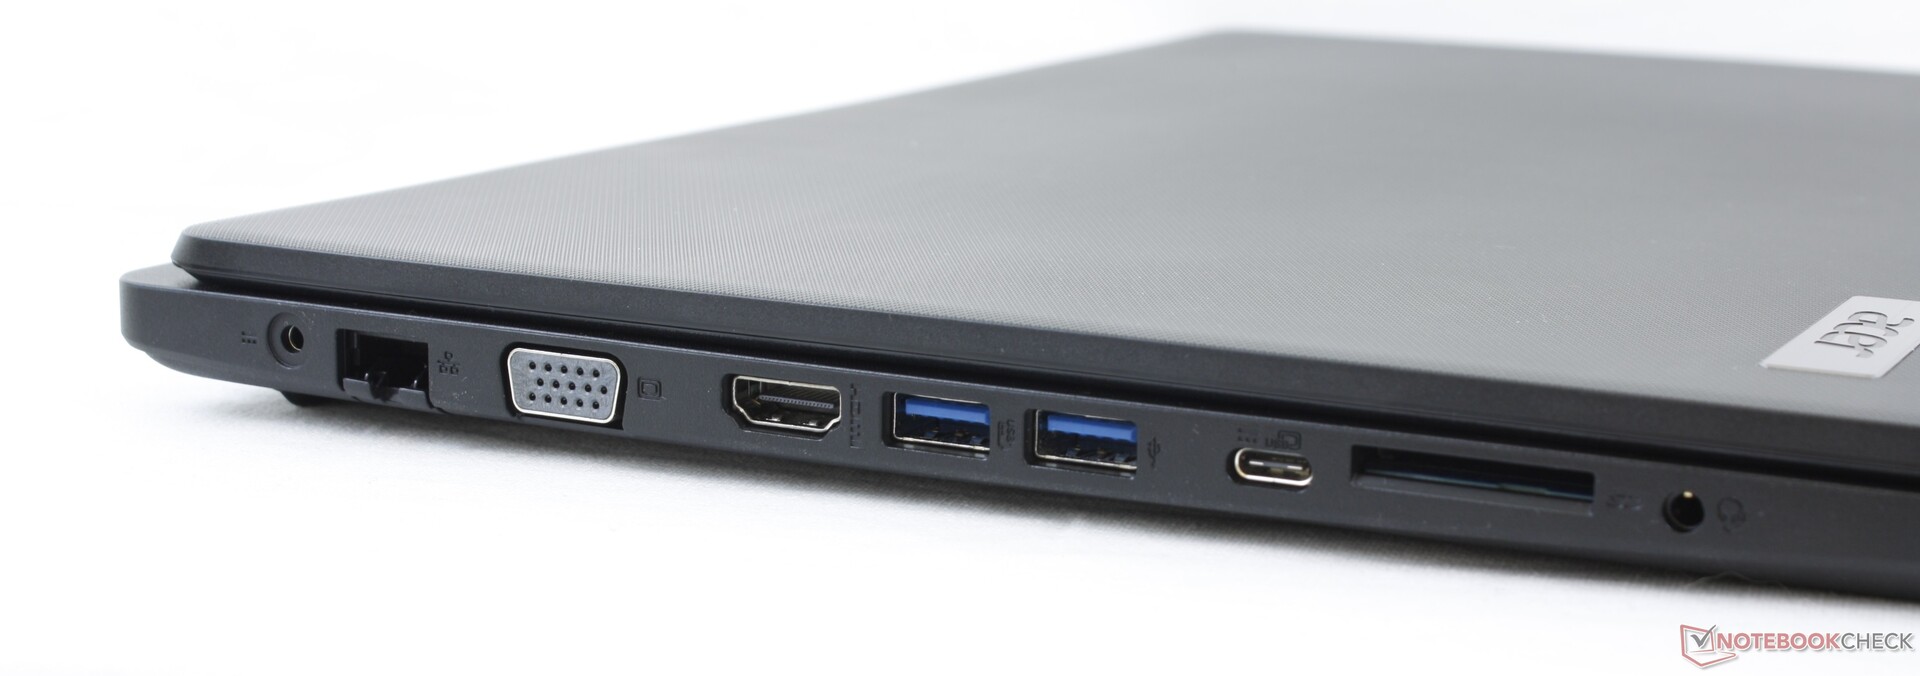
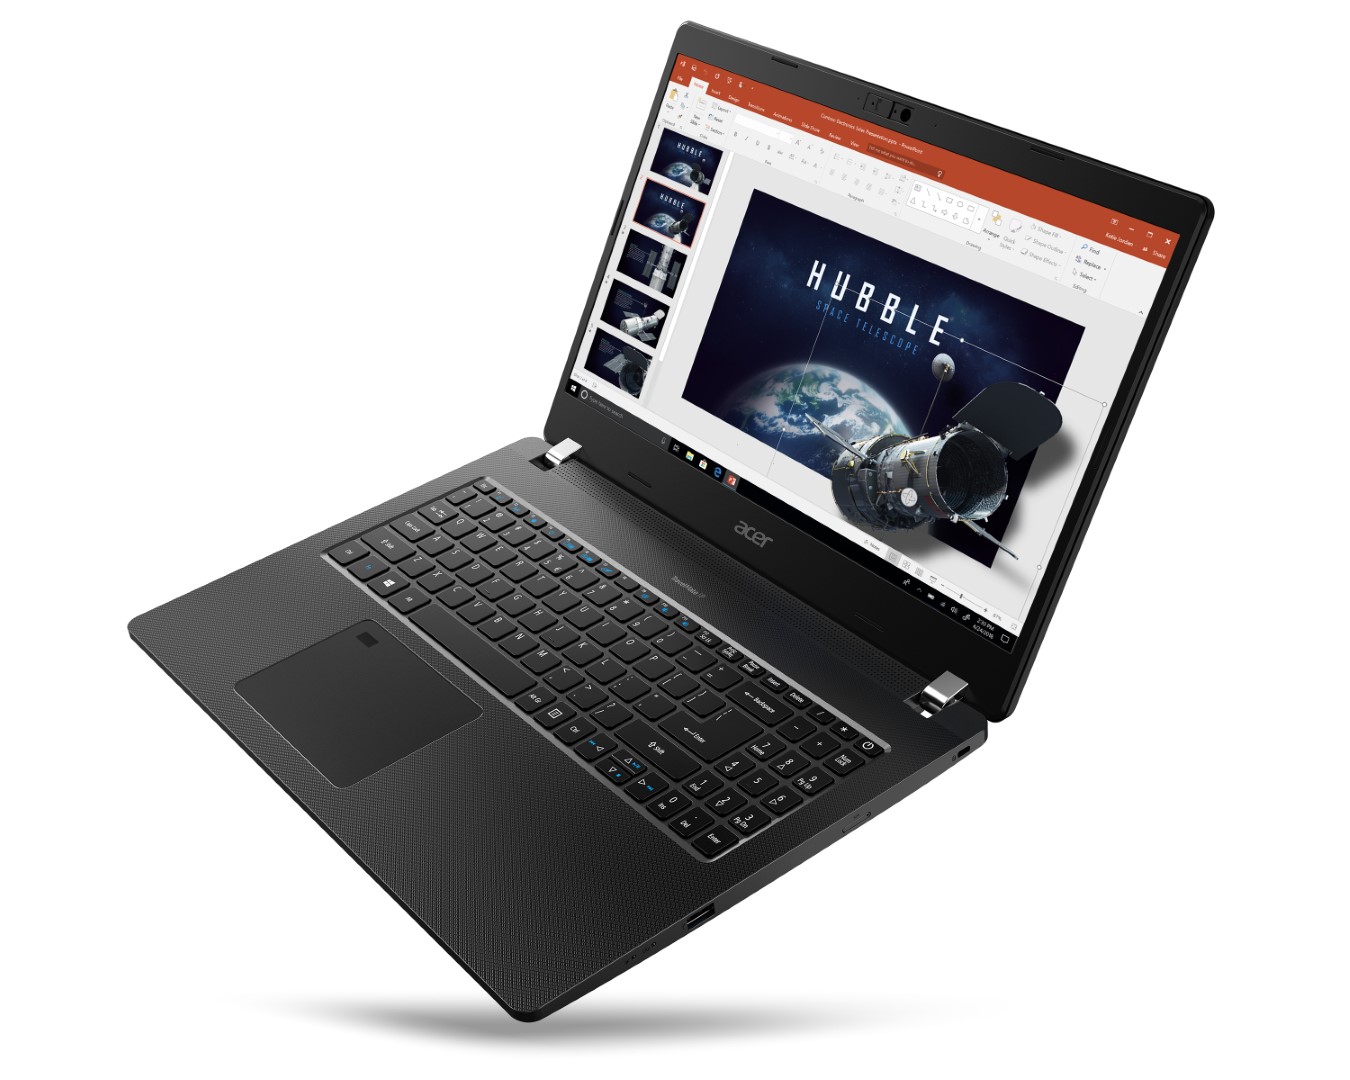
Als je waarde hecht aan een lichtgewicht zakelijke laptop met een geïntegreerde VGA-poort, dan is de relatief goedkope TravelMate P2 TMP215 wellicht wat je zoekt. Het is een eenvoudige machine zonder franjes, net als zijn voorganger, maar in een kleinere en draagbaardere behuizing met veel poorten.
Het systeem wordt echter ontsierd door een aantal minpunten. PWM is aanwezig op bijna alle helderheidsniveaus en de CPU-prestaties zijn slechter dan verwacht. De NumPad-toetsen zijn klein en oncomfortabel in gebruik en sommige gebruikers zullen het weglaten van de aparte muisknoppen betreuren. Hoewel het een goedkope zakelijke laptop zou moeten zijn, denken we dat deze aspecten beter hadden gekund zonder de prijs van het model te beïnvloeden. Het middelmatige scherm zal veel gebruikers afschrikken die misschien ook video's willen streamen op hun werklaptops.
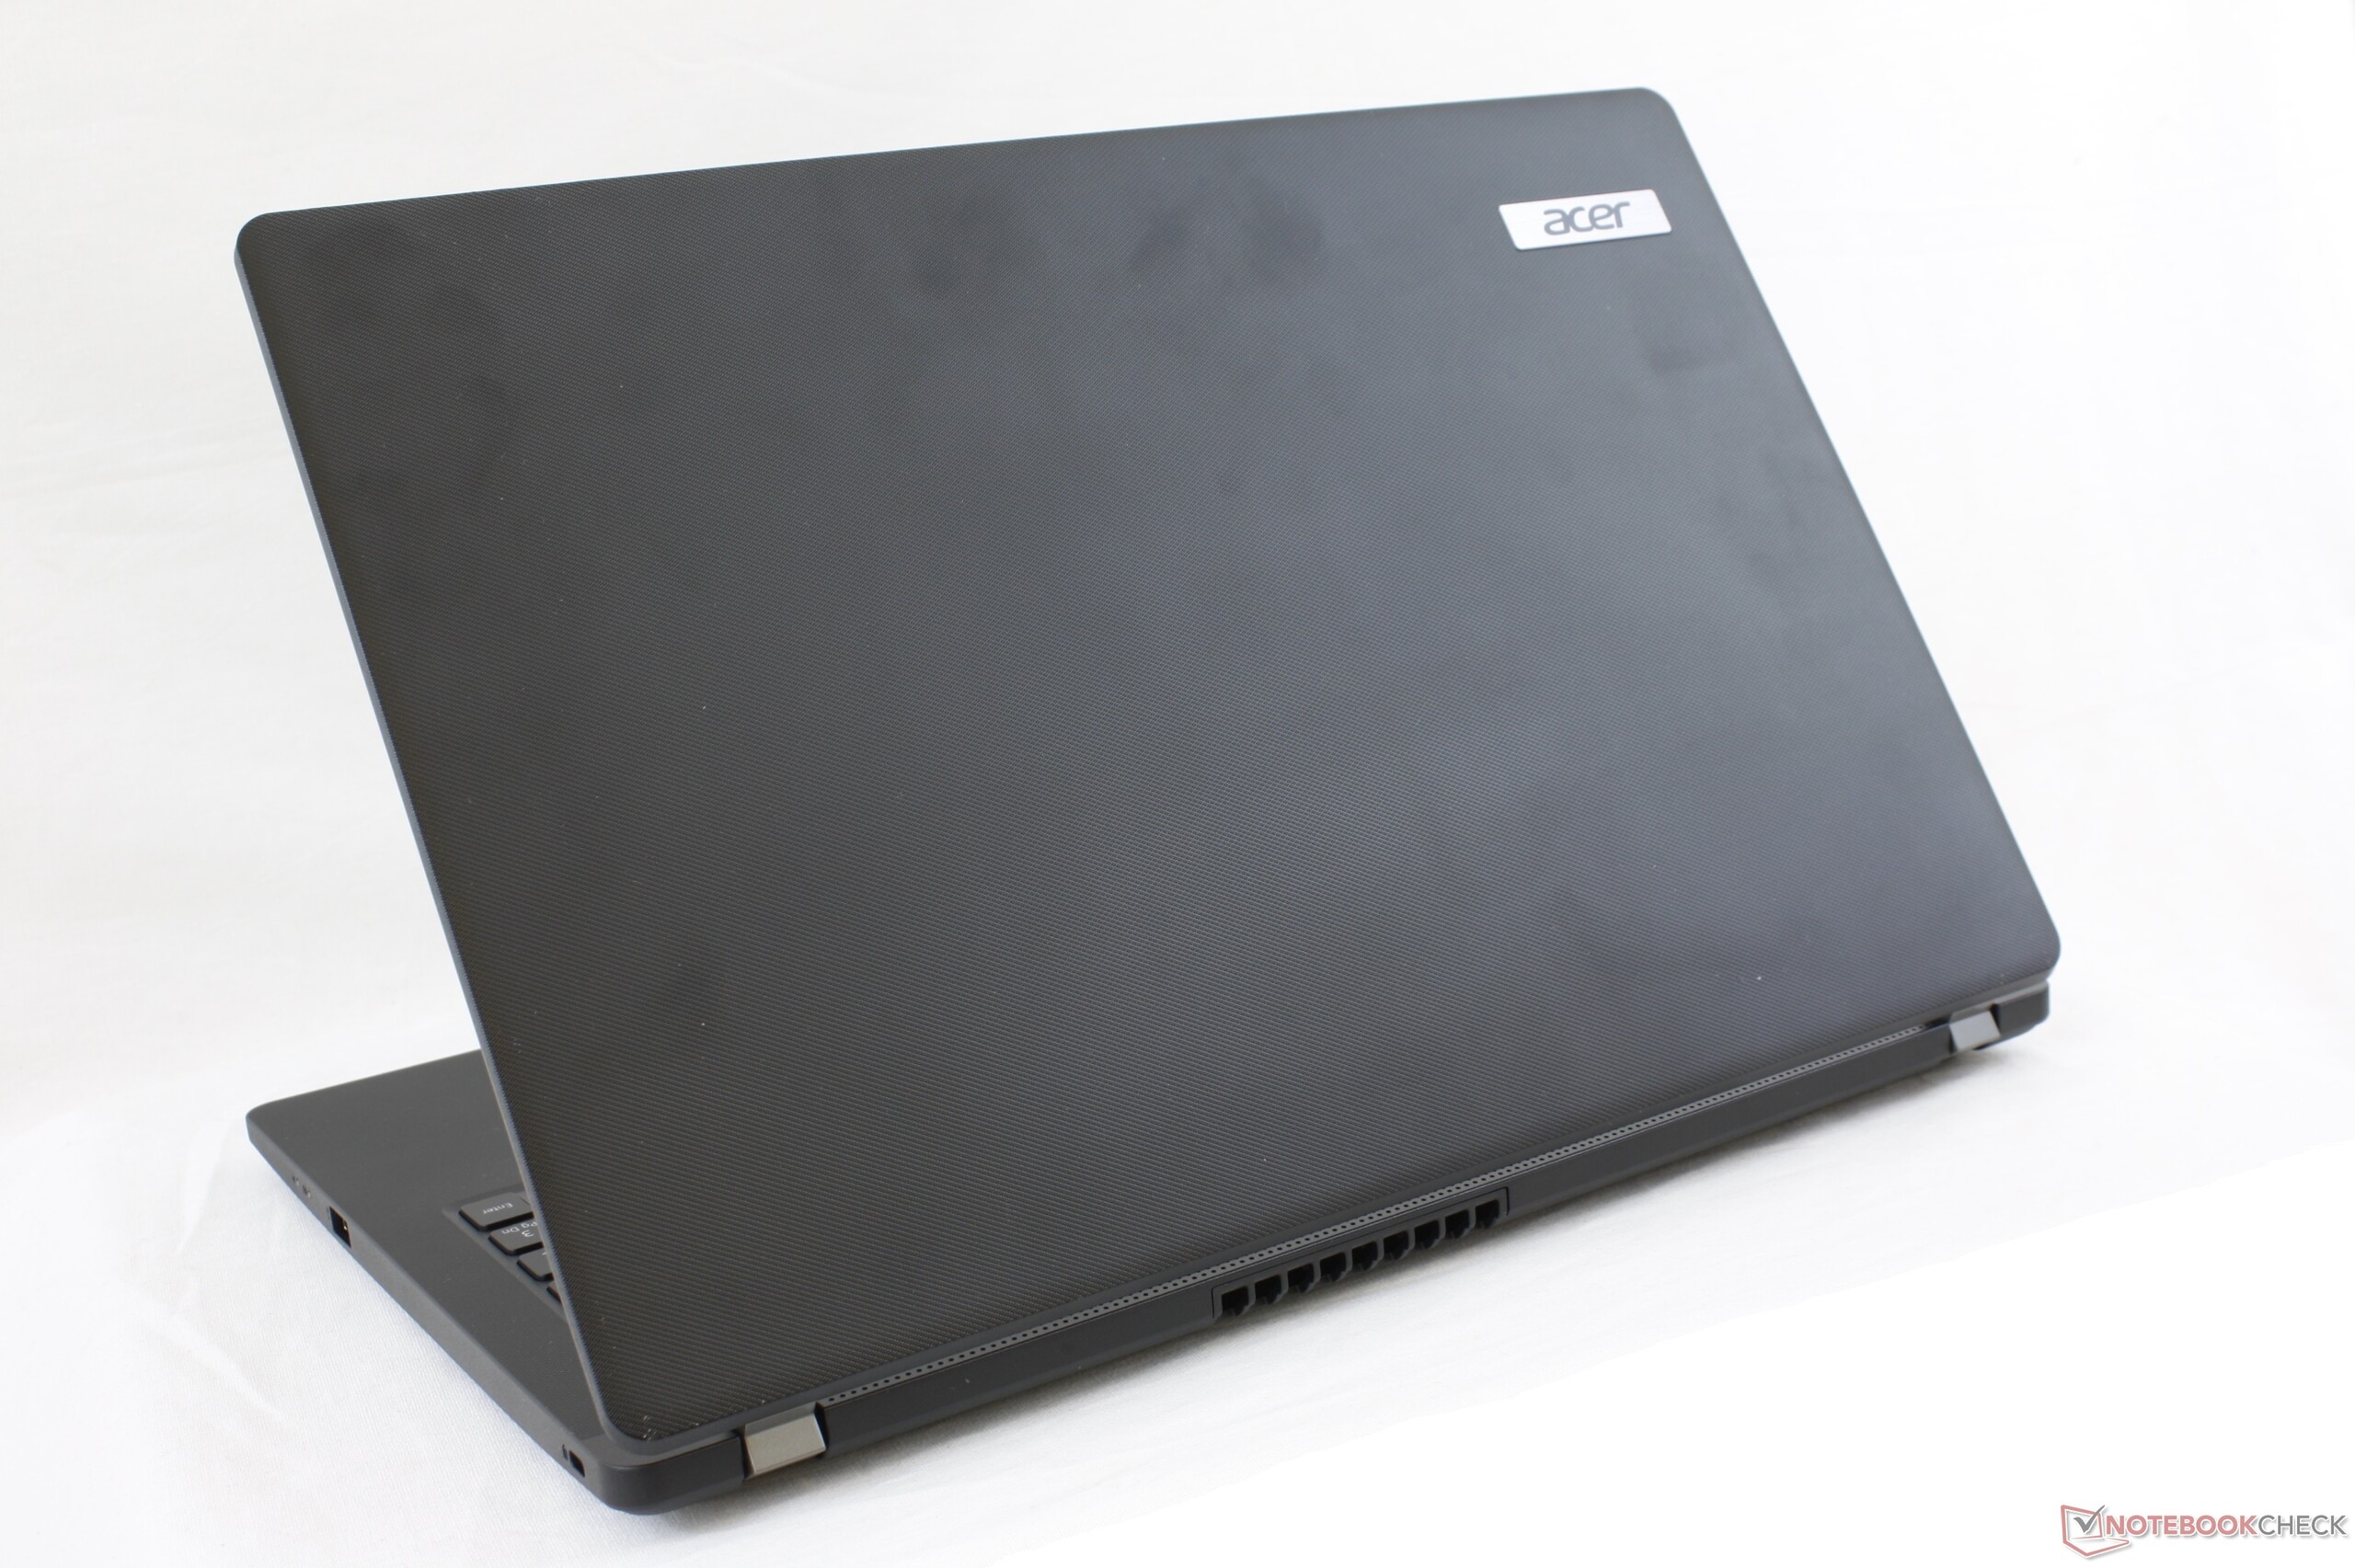
De Acer TravelMate P2 TMP215 valt op omdat hij relatief licht en goedkoop is, terwijl hij toch een brede selectie aan poorten biedt. De concurrerende HP ProBook 450 G7 maakt over het algemeen een betere indruk als je een iets groter en zwaarder systeem niet erg vindt.
Acer TravelMate P215-52
- 21-08-2020 v7 (old)
Allen Ngo
Price comparison
