GPD Win Max 2 handheld gaming PC review: Intel Core i7-1260P of AMD Ryzen 7 6800U?
GPD heeft het nieuws gehaald met zijn groeiende line-up van handheld PC's uitgerust met hardware die snel genoeg is voor gaming doeleinden. Vorig jaar alleen al werden drie van dergelijke modellen gelanceerd: de Win 3, Win Max, en Pocket 3 elk met hun eigen unieke ontwerpen en twists op hoe gaming-on-the-go kan zijn.
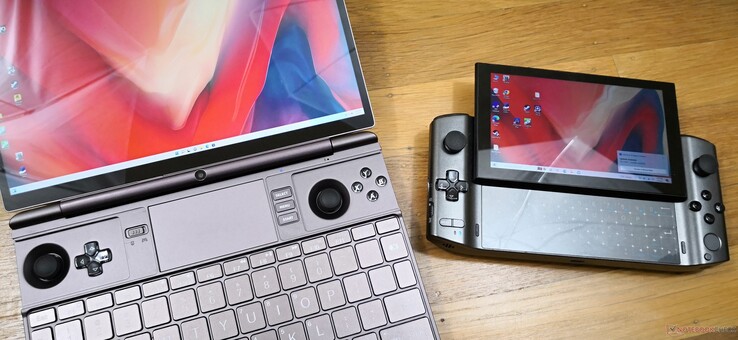
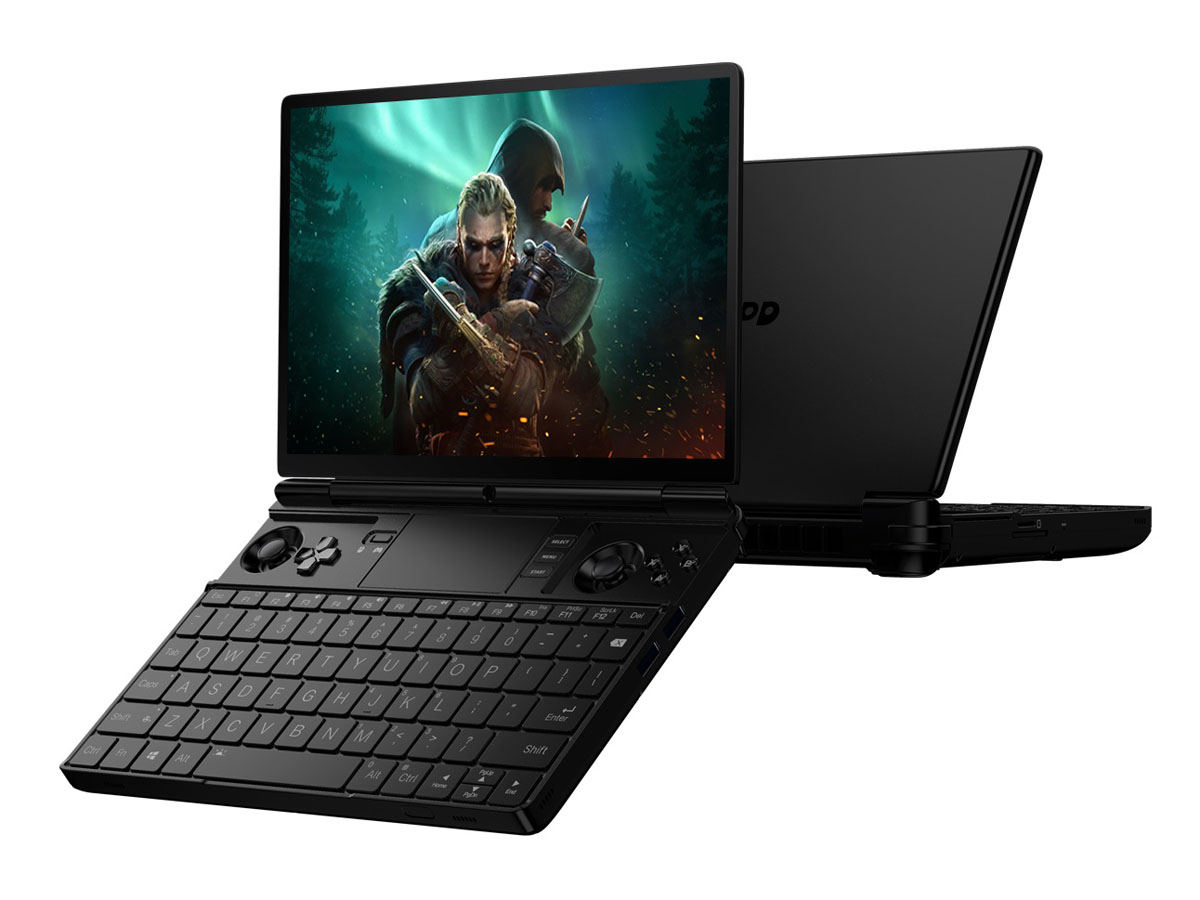
Voor 2022 heeft GPD de Win Max 2 geïntroduceerd als directe vervanger van de eerste generatie 2021 Win Max. Dit nieuwste model is een compleet herontwerp van het eerste model met nog meer extra functies en snellere hardware. Gebruikers kunnen kiezen tussen de Intel 12e gen Core i7-1260P of AMD Ryzen 7 6800U met geïntegreerde Iris Xe of Radeon 680M graphics, respectievelijk. Elke versie zal naar verwachting verkocht worden voor $1000 USD
De Win Max 2 is uniek in zijn ruimte, want het is een van de enige 10,1-inch laptops die wordt geleverd met een Intel Alder Lake-P CPU voor een zeer hoog prestatieniveau in verhouding tot zijn grootte categorie. Meer informatie en specificaties zijn te vinden op de officiële productpagina hier. Deze review richt zich op de Intel-versie van het model.
Meer GPD beoordelingen:
Potentiële concurrenten in vergelijking
Evaluatie | Datum | Model | Gewicht | Hoogte | Formaat | Resolutie | Beste prijs |
|---|---|---|---|---|---|---|---|
| 84.5 % v7 (old) | 07-2022 | GPD Win Max 2 i7-1260P, Iris Xe G7 96EUs | 1 kg | 23 mm | 10.10" | 2560x1600 | |
| 86.3 % v7 (old) | 11-2021 | GPD Pocket 3 i7-1195G7, Iris Xe G7 96EUs | 730 g | 20 mm | 8.00" | 1920x1200 | |
| 79.3 % v7 (old) | 08-2021 | GPD Win Max 2021 R7 4800U, Vega 8 | 850 g | 26 mm | 8.00" | 1280x800 | |
v (old) | 01-2021 | GPD Win 3 i5-1135G7, Iris Xe G7 80EUs | 553 g | 27 mm | 5.50" | 1280x720 | |
| 85.3 % v7 (old) | 10-2021 | Microsoft Surface Go 3 Core i3 i3-10100Y, UHD Graphics 615 | 783 g | 8.3 mm | 10.50" | 1920x1280 | |
| 78.1 % v7 (old) | 02-2021 | Lenovo IdeaPad Flex 3 11IGL05 Celeron N4020, UHD Graphics 600 | 1.1 kg | 17.5 mm | 11.60" | 1366x768 |
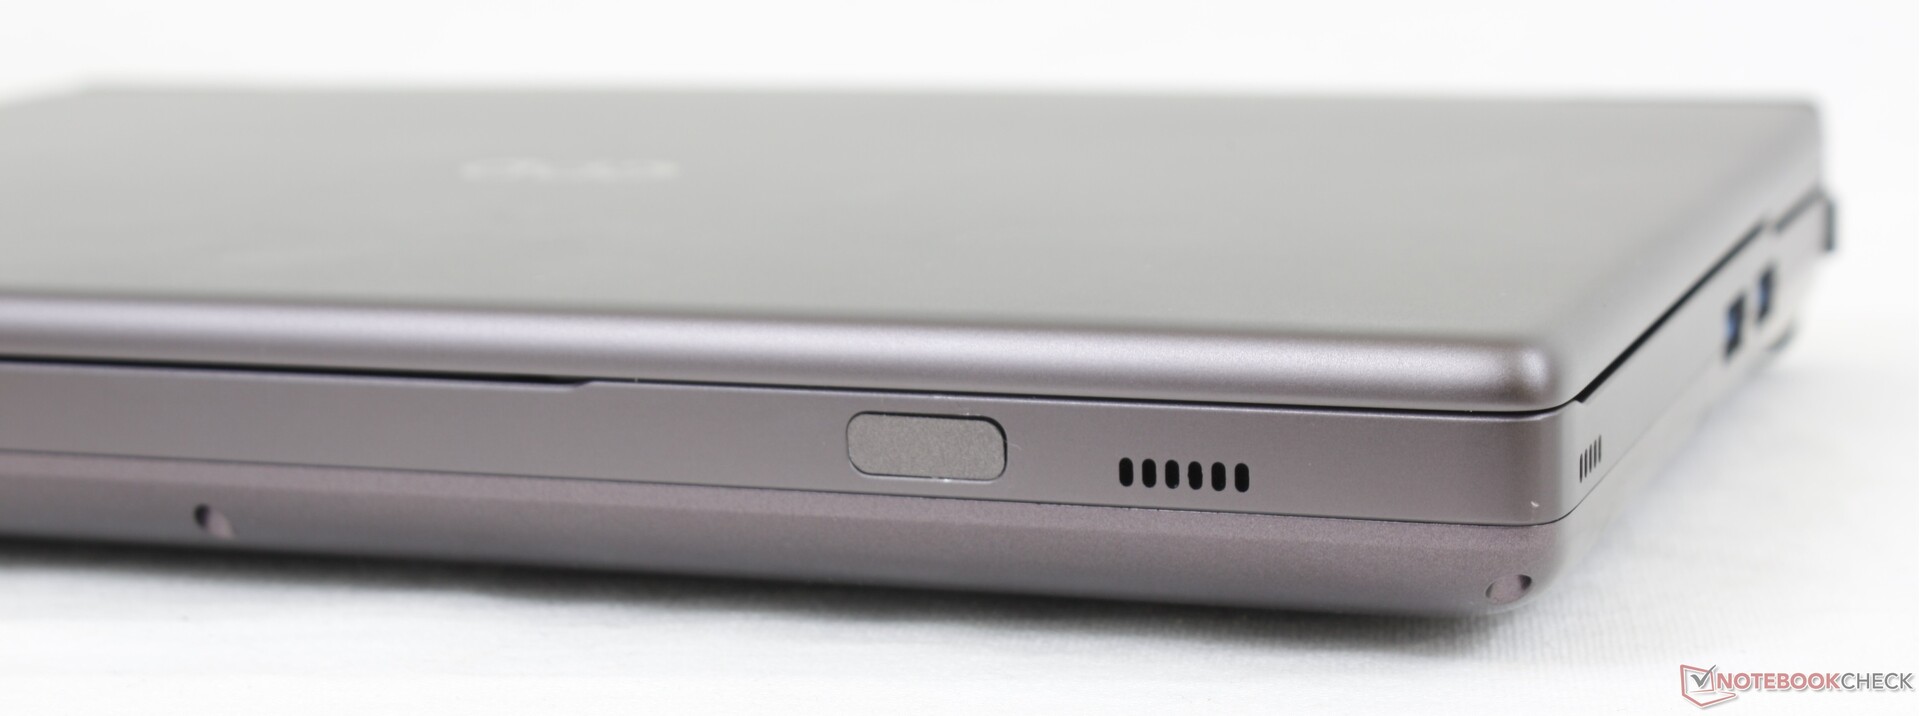
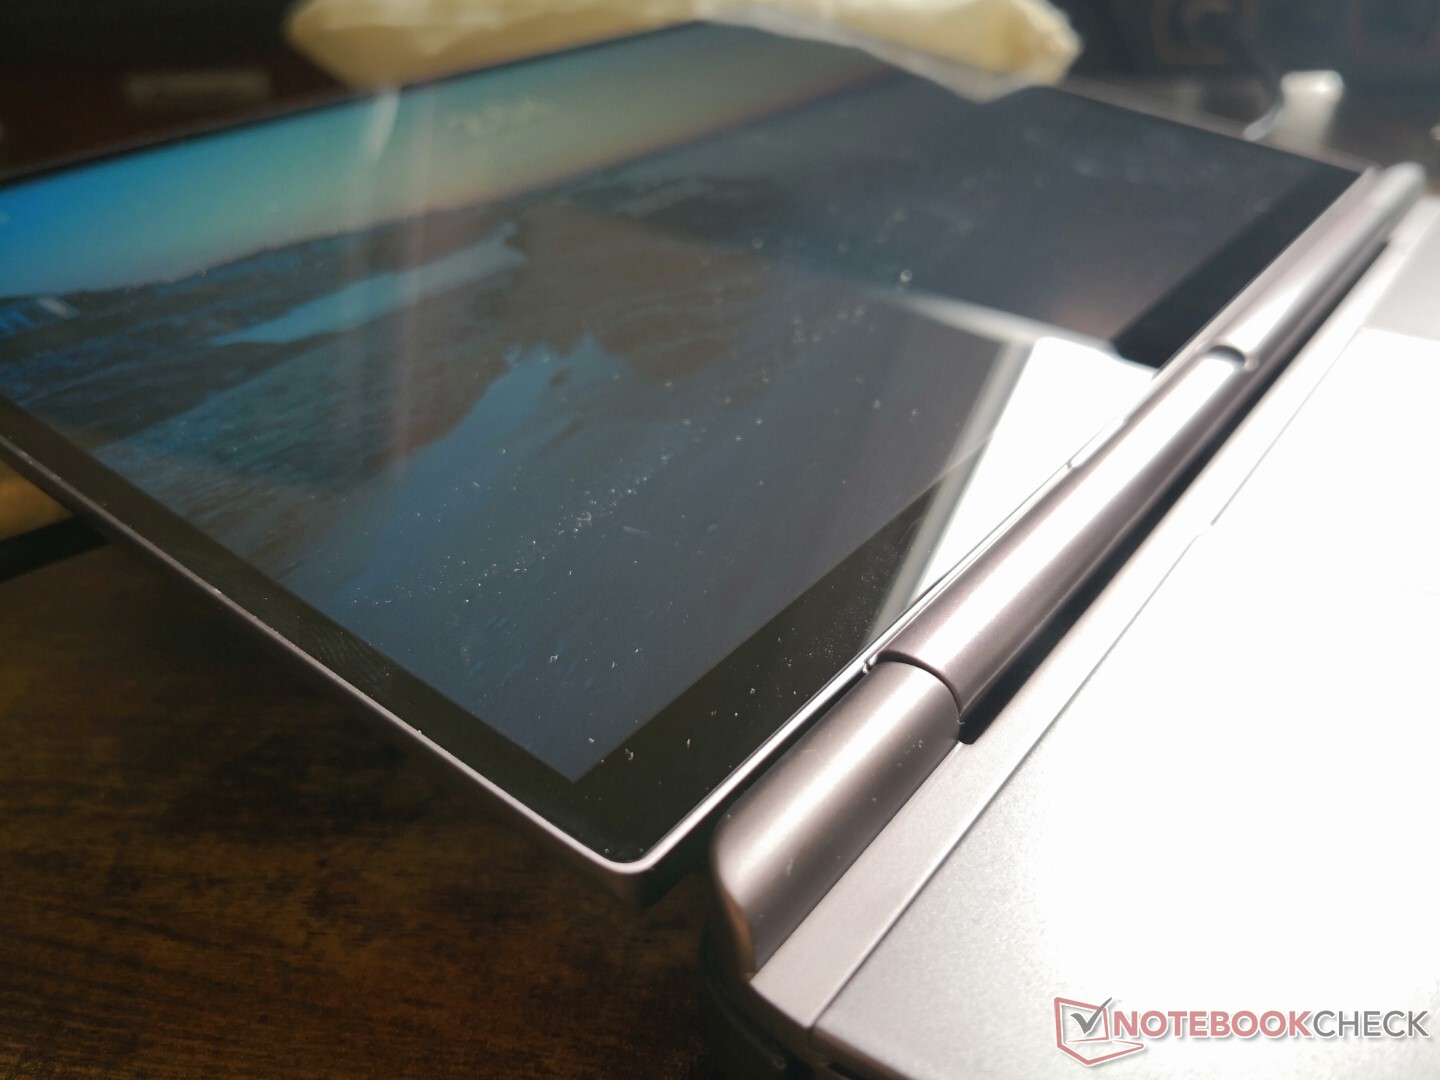
Zaak - Vertrouwd gevoel
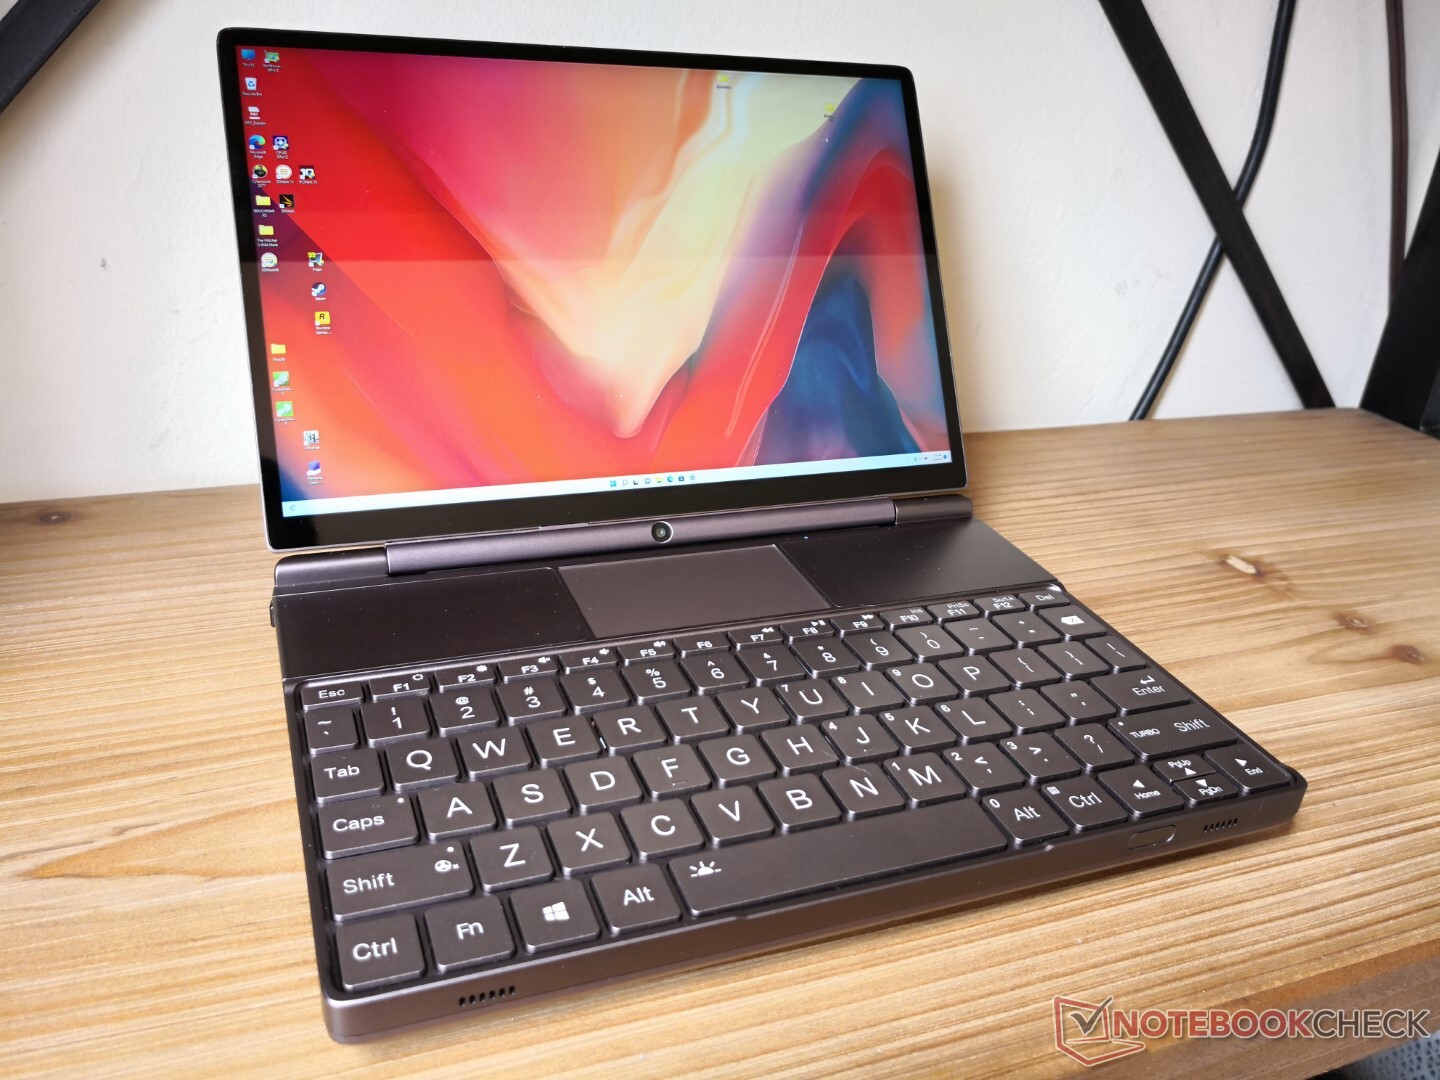
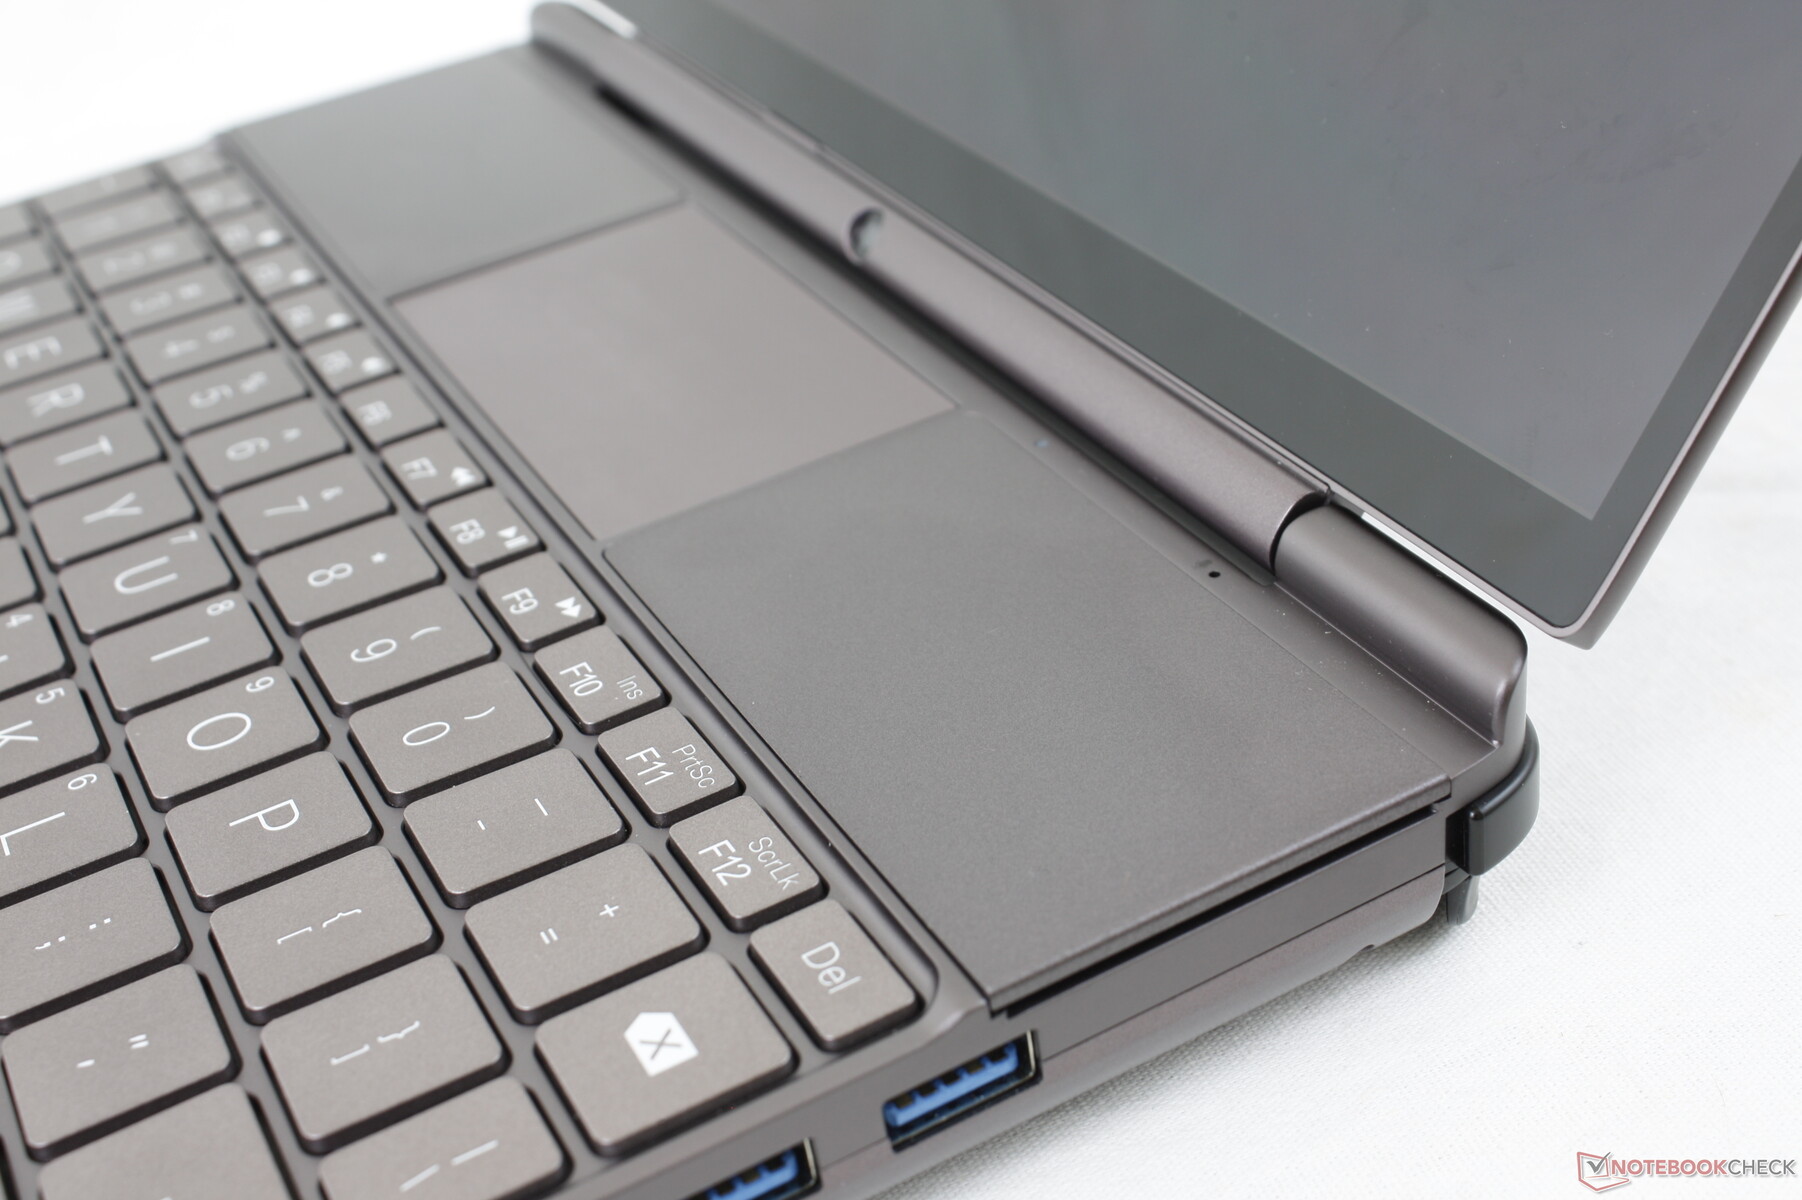
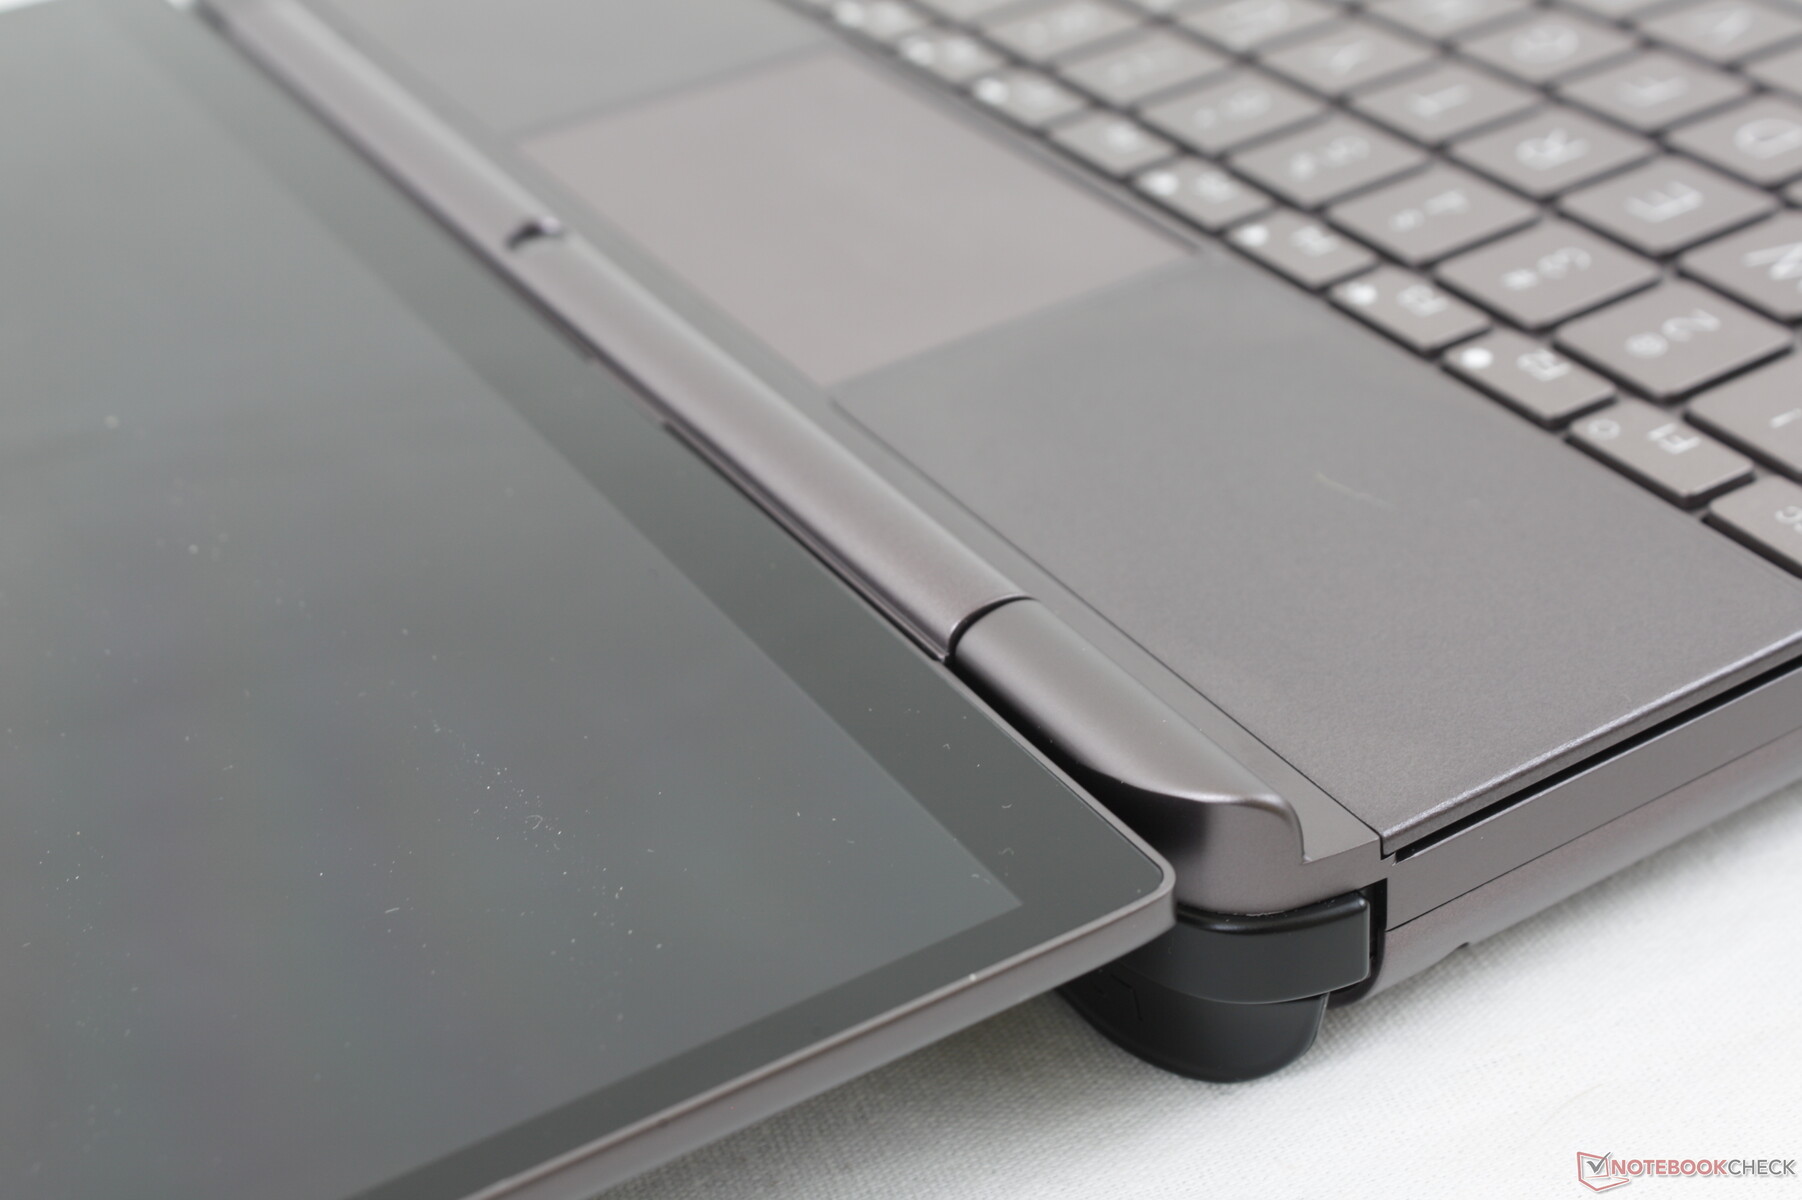
GPD gebruikt soortgelijke metalen materialen voor al zijn producten, zodat ze allemaal dezelfde textuur, gevoel en uitstraling hebben. Toch is de bouwkwaliteit beter dan bij de originele Win Max, aangezien zowel de basis als het deksel slechts minimale buigingen vertonen en bijna niet kraken. Het is ook een verbetering ten opzichte van de Win 3 die we enigszins kwetsbaar vonden met betrekking tot het schuifmechanisme
Nieuw in de serie zijn de twee afneembare magnetische covers voor de joysticks. Het nut ervan is vooral oppervlakkig voor gebruikers die de controller knoppen willen bedekken tijdens colleges of vergaderingen.
De veel grotere schermgrootte van de Win Max 2 ten opzichte van de oorspronkelijke Win Max betekent dat het nieuwere model zowel zwaarder als groter is dan zijn voorganger, zelfs als rekening wordt gehouden met de smallere schermranden. Desondanks is hij met iets meer dan 1 kg nog steeds lichter dan de meeste laptops en zijn draagbaarheid kan niet worden onderschat.
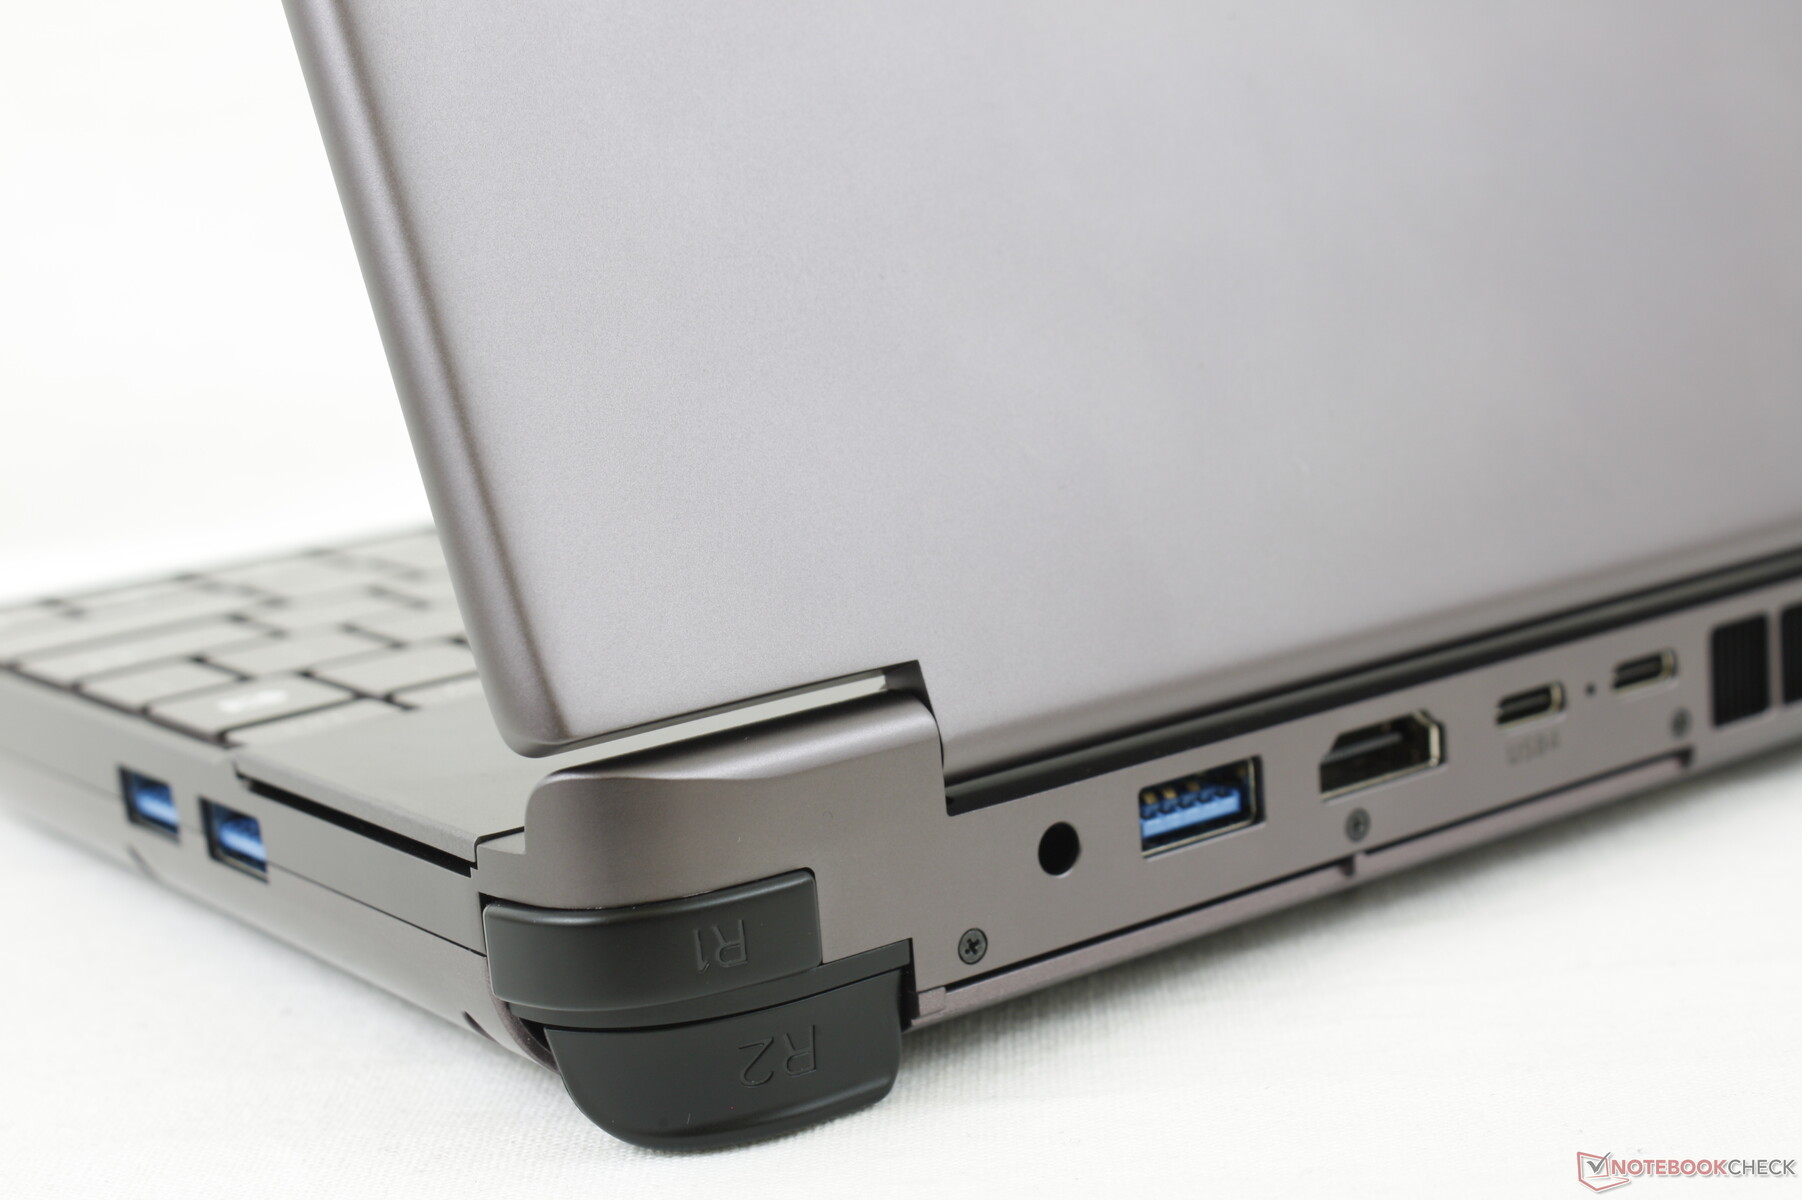
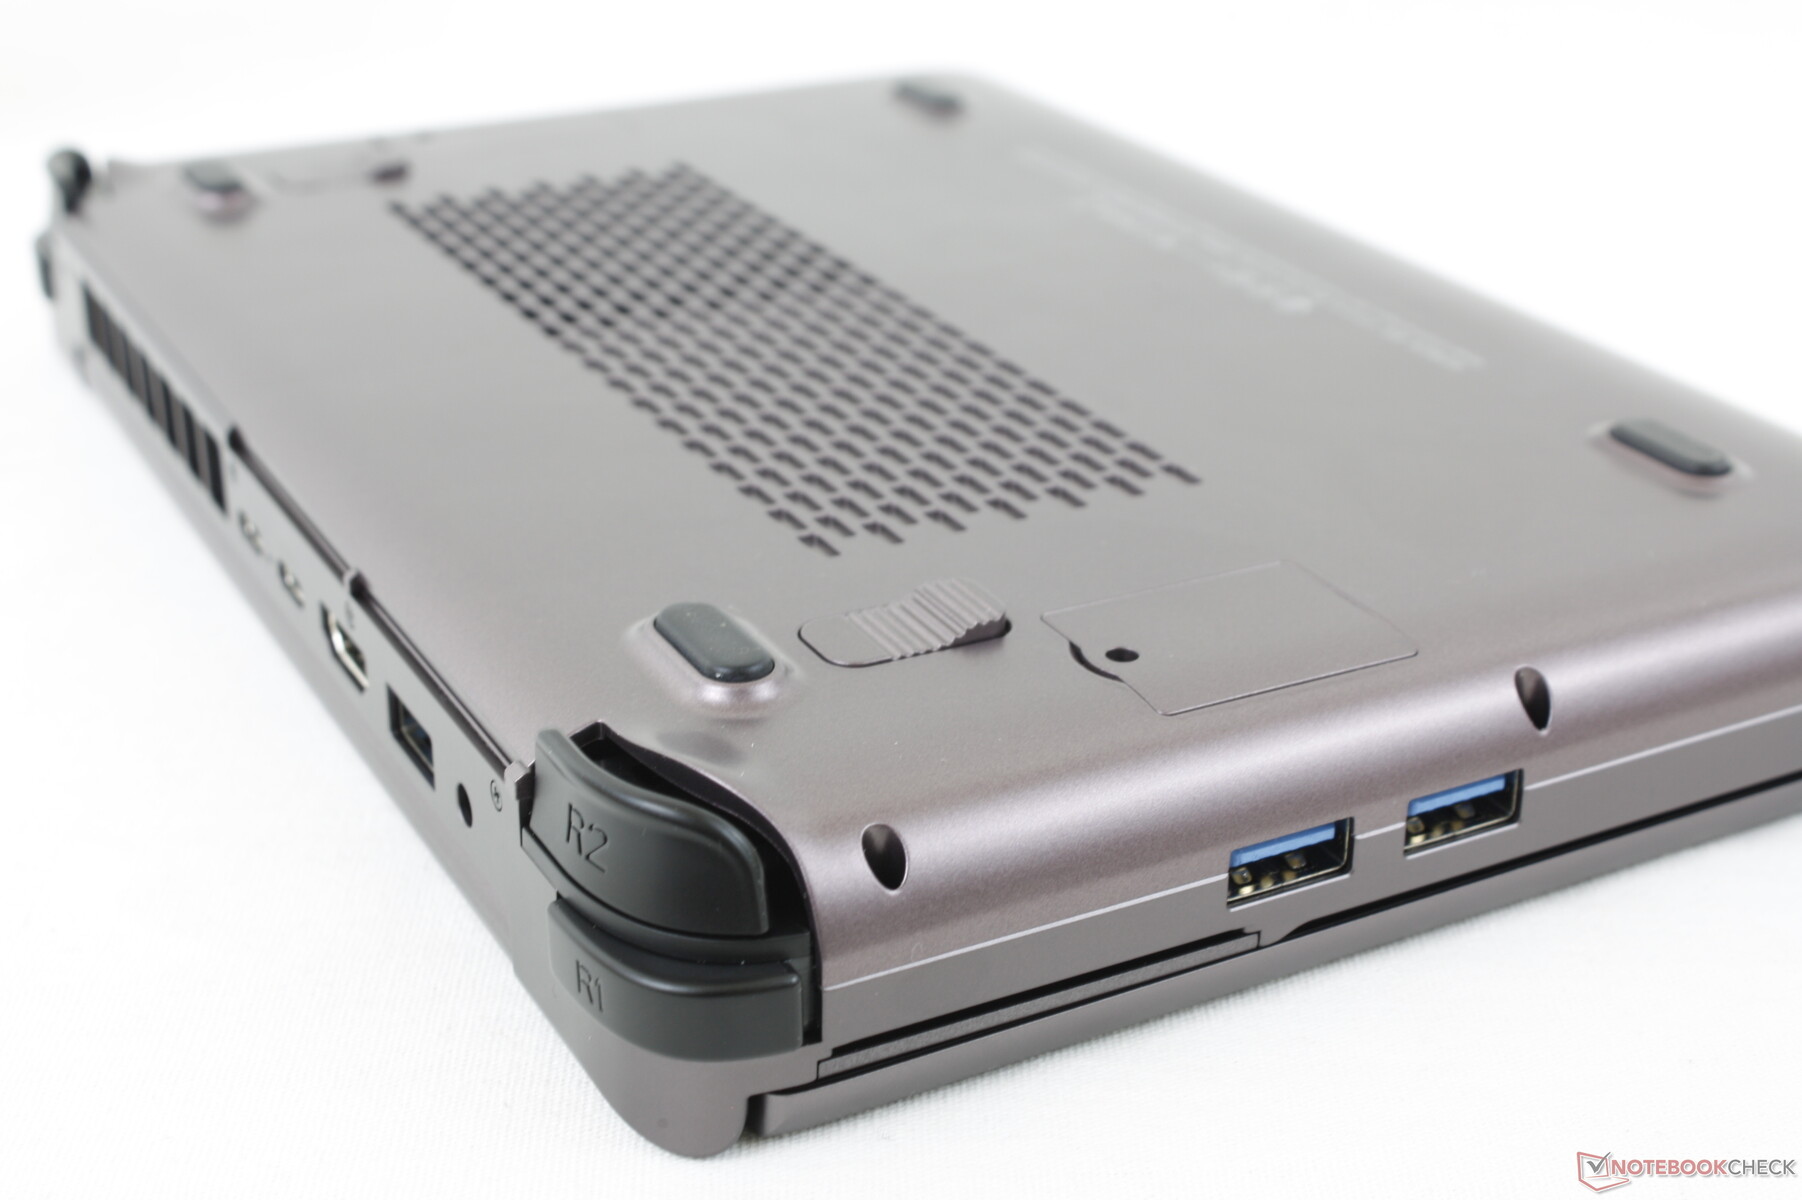
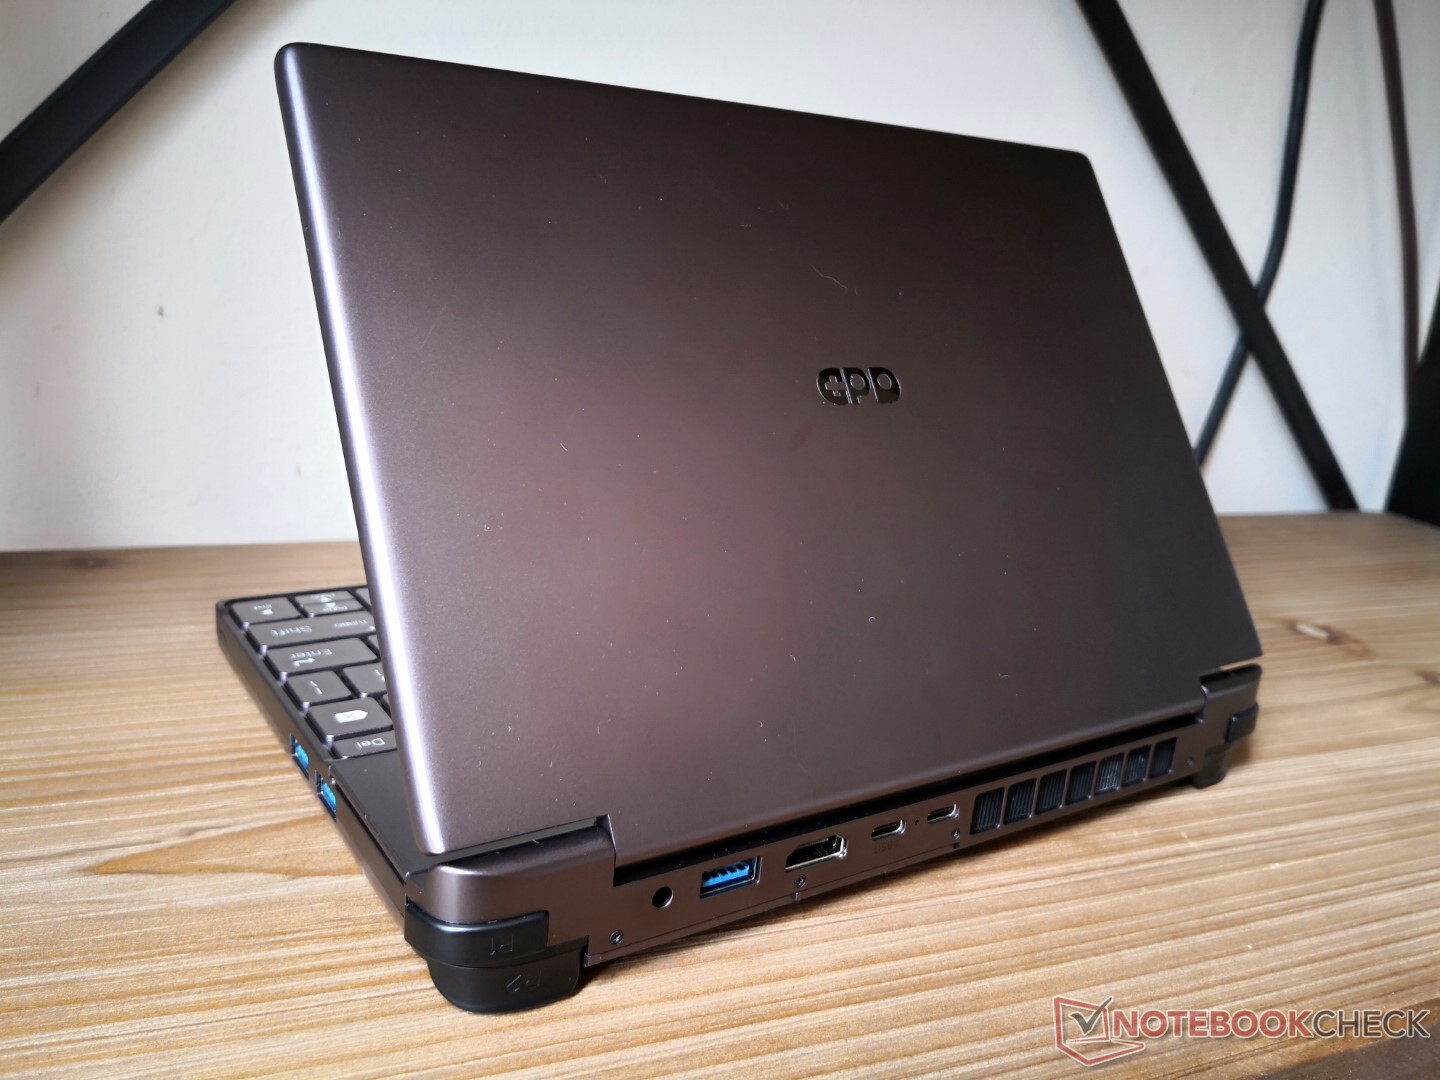
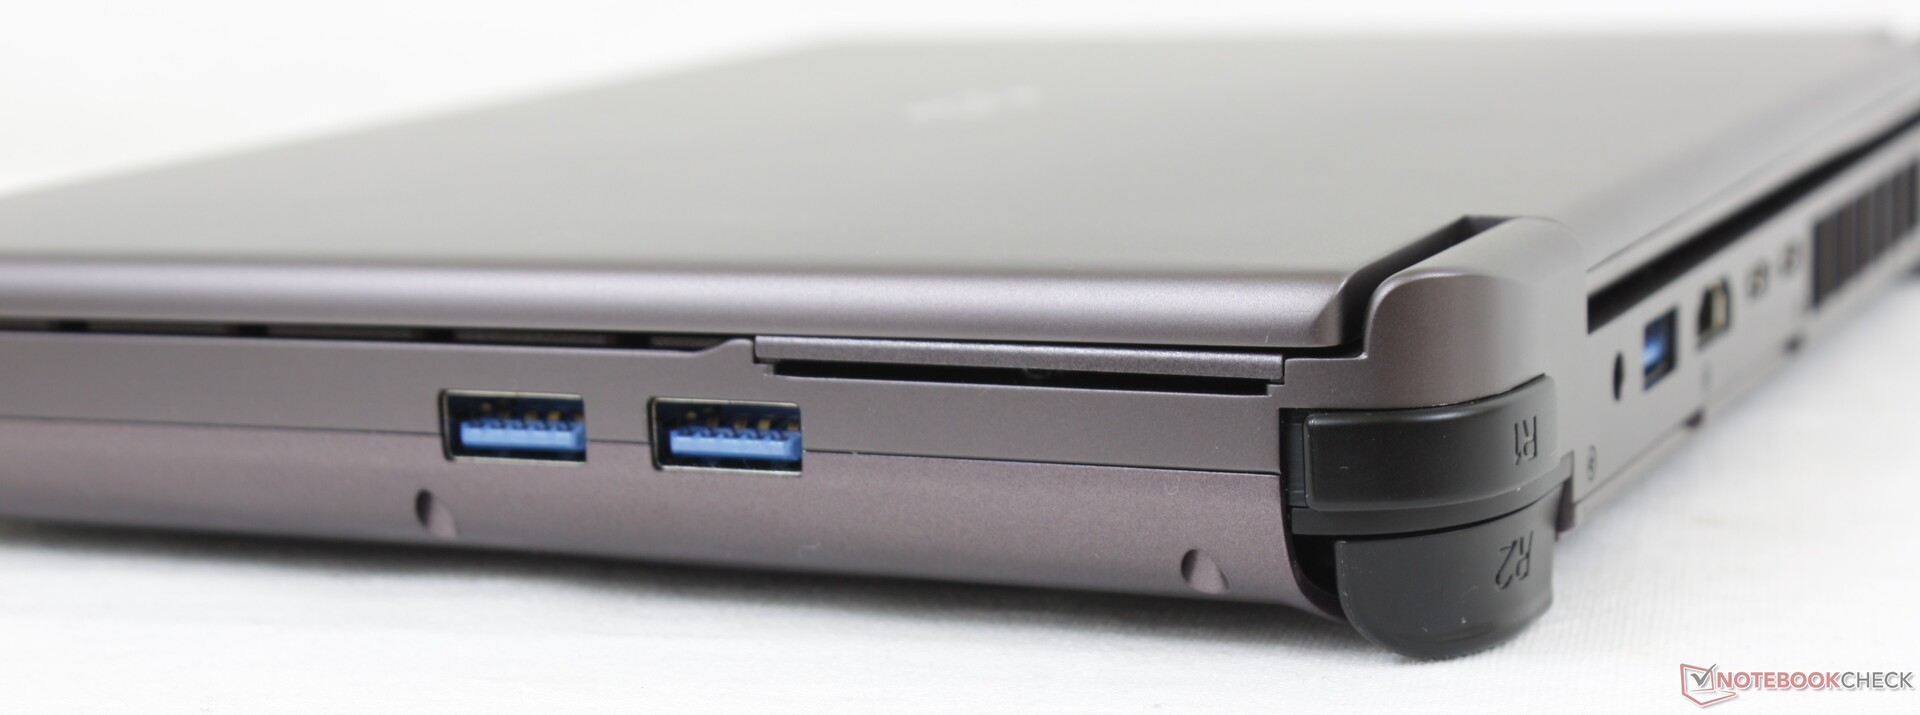
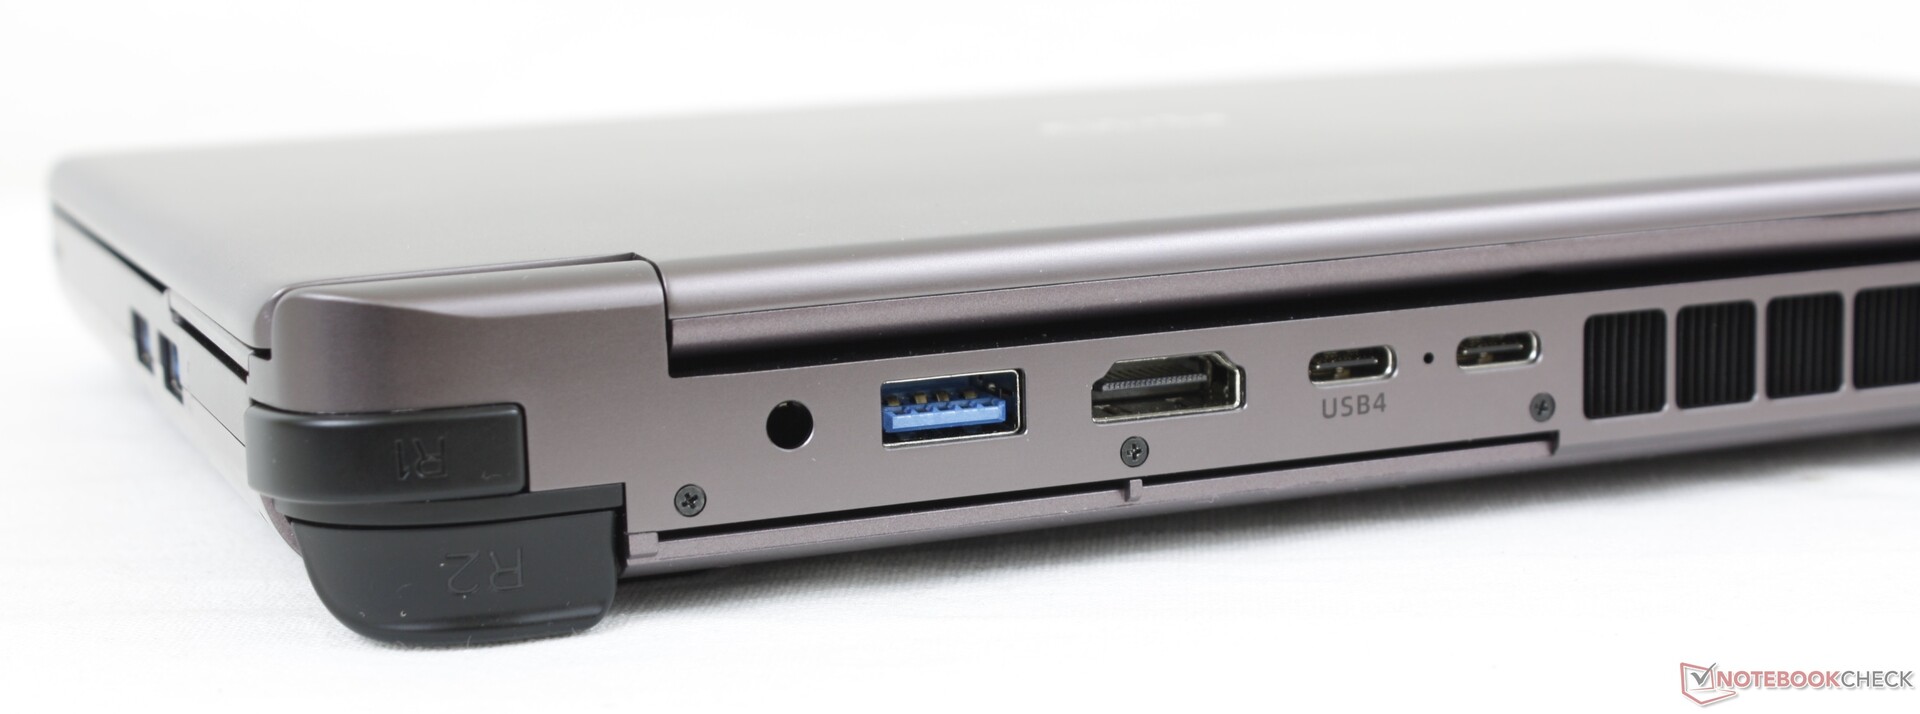
Connectiviteit - Geen Thunderbolt voor AMD-versie
De Win Max 2 heeft de RJ-45-poort van de originele Win Max laten vallen voor een extra USB-A-poort en een full-size SD-kaartlezer. Thunderbolt 4 wordt alleen ondersteund voor de Intel SKU.
Merk op dat de HDMI- en USB-A-poorten ondersteboven zitten, wat een beetje vervelend kan zijn omdat ze bijna altijd rechtop zitten op laptops.
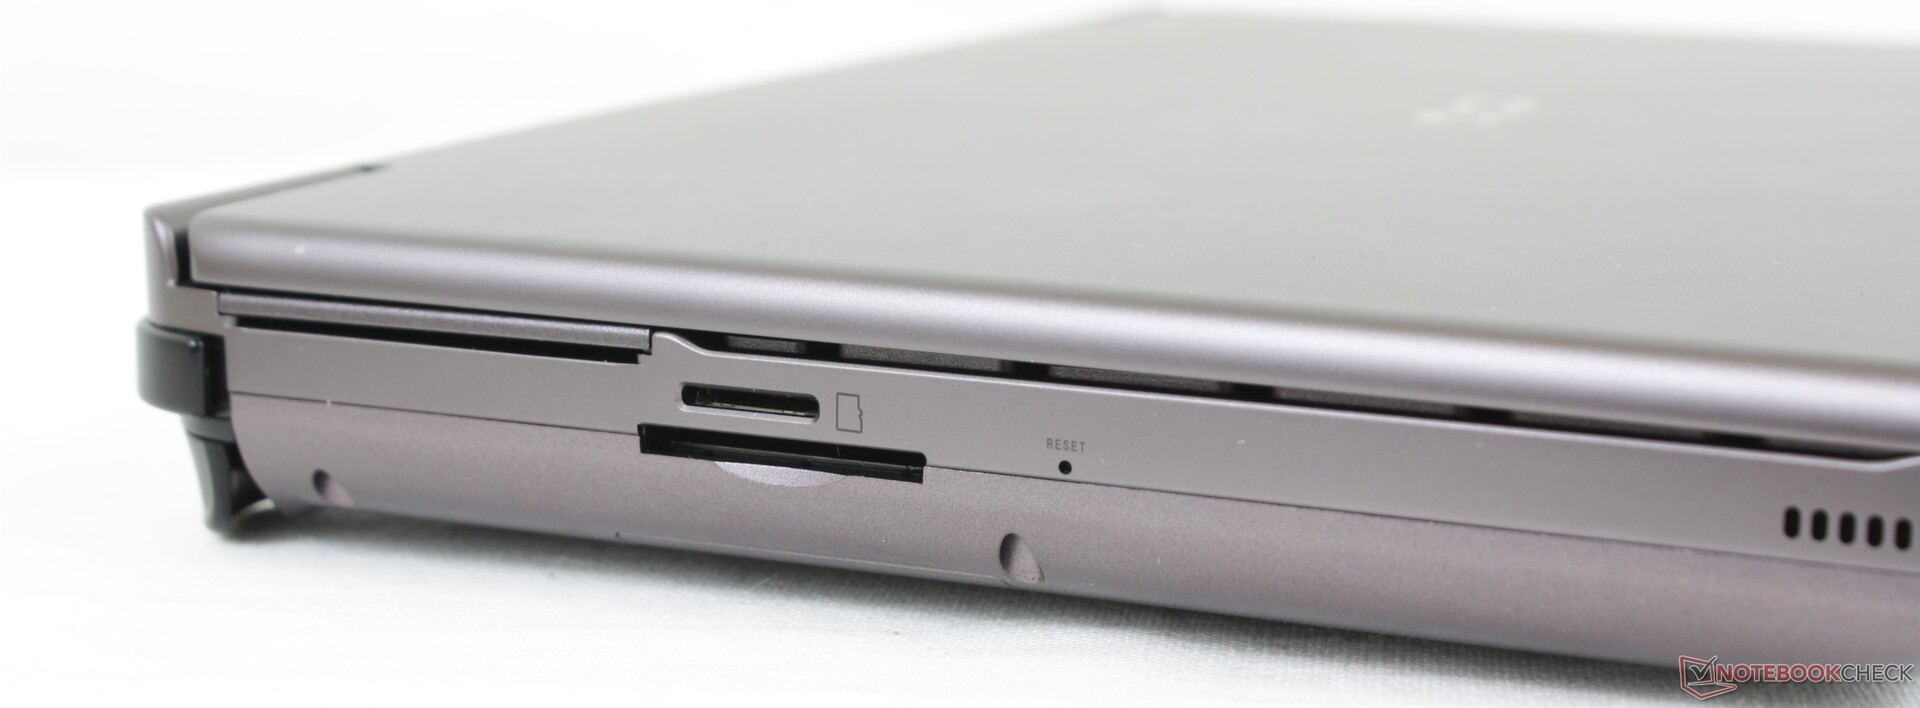
SD-kaartlezer - twee om uit te kiezen
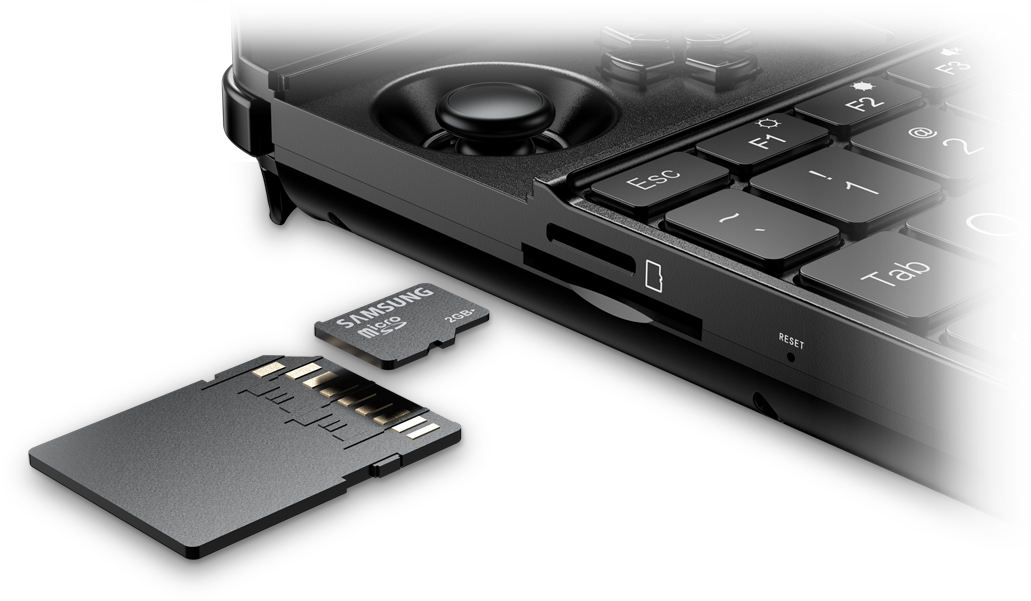
De Win Max 2 is een van de weinige apparaten met zowel MicroSD- als standaardformaat SD-lezers. Niet alleen dat, maar hun overdrachtsnelheden verschillen ook van elkaar. Onze UHS-II testkaart op de full-size lezer zou overdrachtsnelheden van 239 MB / s laten zien in vergelijking met slechts 91 MB / s op de MicroSD-lezer. U zult dus de full-size SD-sleuf moeten gebruiken voor het overzetten van grote bestanden.
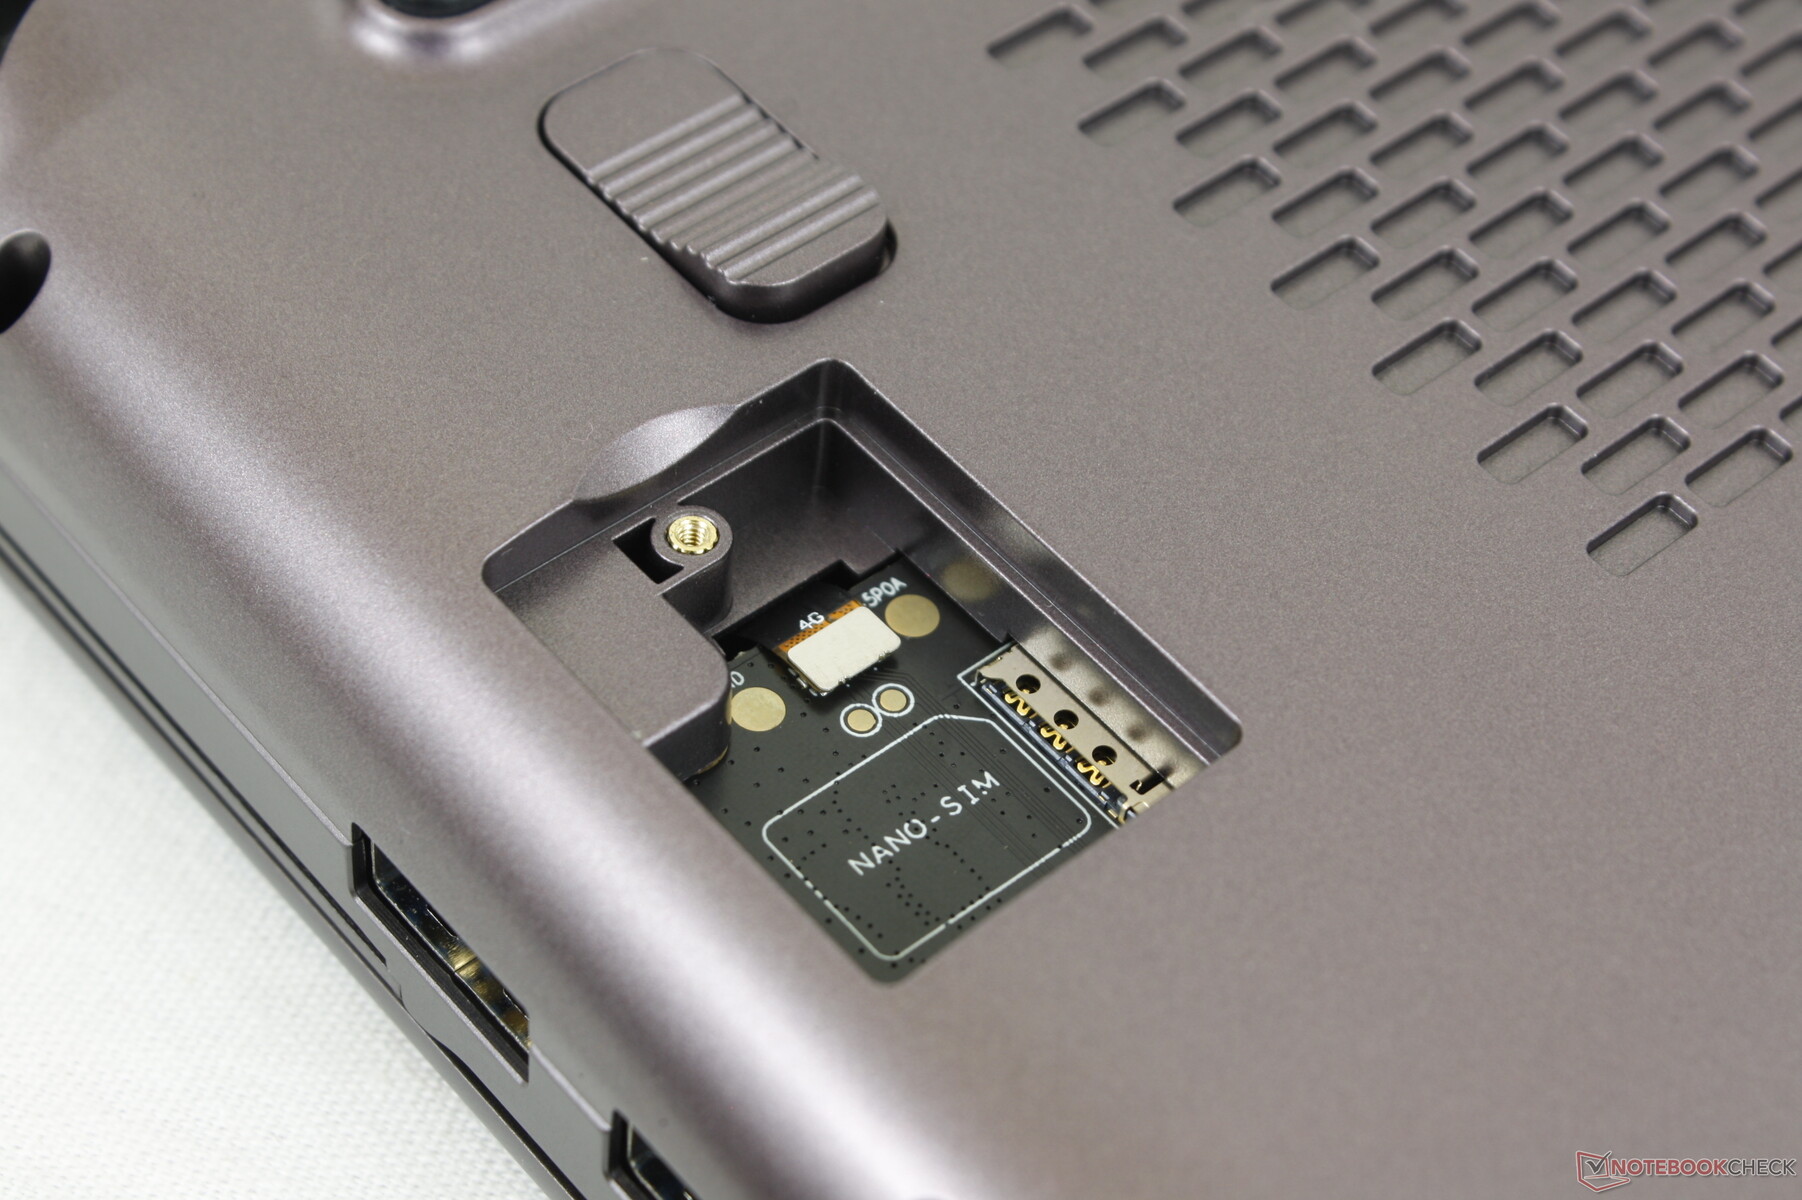
Houd er rekening mee dat de full-size SD-kaart ondersteboven moet worden geplaatst, terwijl de MicroSD-kaart rechtop moet worden geplaatst, zoals te zien is op de officiële GPD-afbeelding.
| SD Card Reader | |
| average JPG Copy Test (av. of 3 runs) | |
| GPD Win Max 2 (Toshiba Exceria Pro SDXC 64 GB UHS-II) | |
| GPD Win 3 (Toshiba Exceria Pro M501 32 GB UHS-II) | |
| Microsoft Surface Go 3 Core i3 (AV Pro V60) | |
| Lenovo IdeaPad Flex 3 11IGL05 (Toshiba Exceria Pro SDXC 64 GB UHS-II) | |
| maximum AS SSD Seq Read Test (1GB) | |
| GPD Win Max 2 (Toshiba Exceria Pro SDXC 64 GB UHS-II) | |
| GPD Win 3 (Toshiba Exceria Pro M501 32 GB UHS-II) | |
| Lenovo IdeaPad Flex 3 11IGL05 (Toshiba Exceria Pro SDXC 64 GB UHS-II) | |
| Microsoft Surface Go 3 Core i3 (AV Pro V60) | |
Communicatie - Wi-Fi 6E Standaard
We hebben geen prestatieproblemen ondervonden toen we verbonden waren met ons 6 GHz netwerk. De AX210 is een enorme upgrade ten opzichte van de Intel 7265 in de Win Max van vorig jaar, die beperkt was tot slechts Wi-Fi 5 snelheden.
| Networking | |
| iperf3 transmit AX12 | |
| Microsoft Surface Go 3 Core i3 | |
| GPD Win 3 | |
| GPD Pocket 3 | |
| Lenovo IdeaPad Flex 3 11IGL05 | |
| GPD Win Max 2021 | |
| iperf3 receive AX12 | |
| GPD Win 3 | |
| Microsoft Surface Go 3 Core i3 | |
| GPD Pocket 3 | |
| Lenovo IdeaPad Flex 3 11IGL05 | |
| GPD Win Max 2021 | |
| iperf3 receive AXE11000 6GHz | |
| GPD Win Max 2 | |
| iperf3 transmit AXE11000 6GHz | |
| GPD Win Max 2 | |
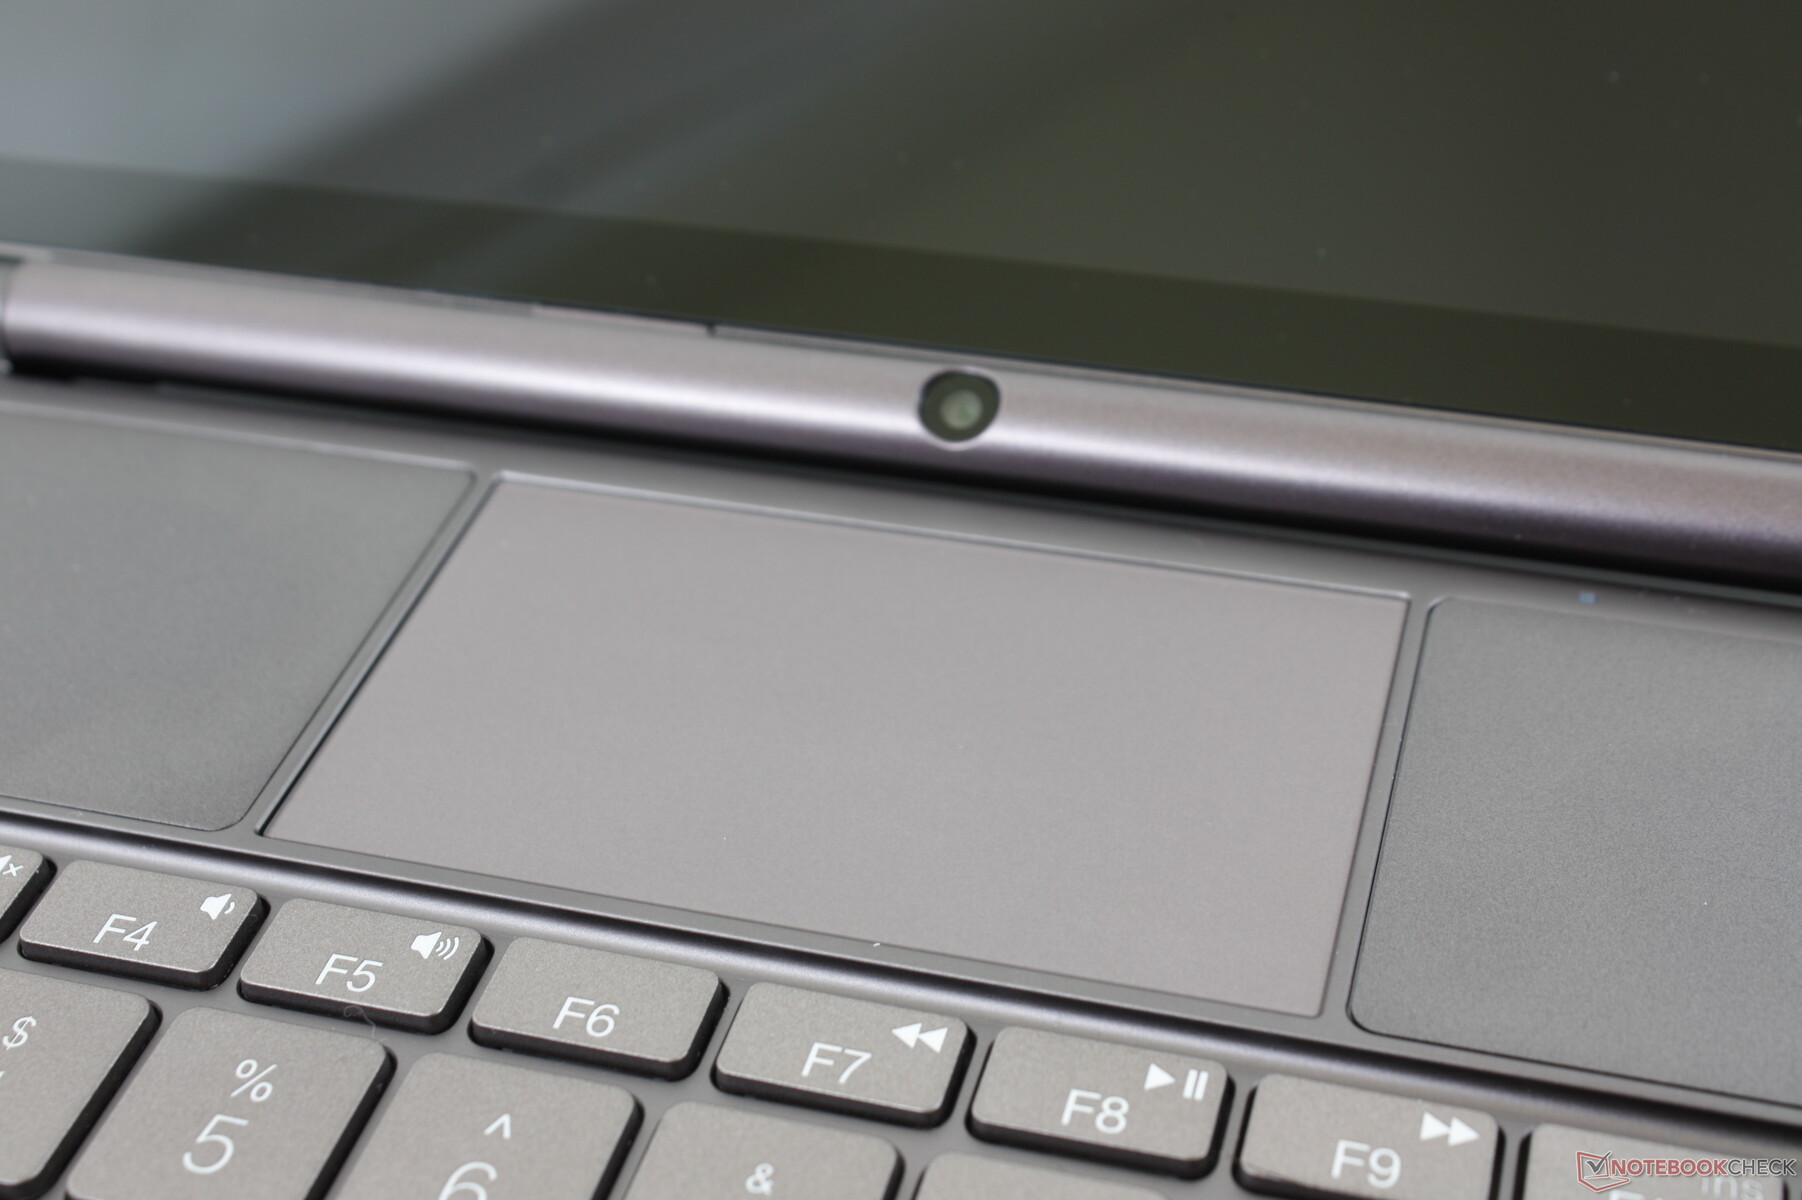
Webcam
De 2 MP camera is teleurstellend, zowel vanwege de modderige beeldkwaliteit als de suboptimale plaatsing aan de onderrand van het scherm in plaats van aan de bovenrand. Het is in wezen de "neus camera" helemaal opnieuw. Bovendien is er geen privacy shutter of Windows Hello IR-ondersteuning.


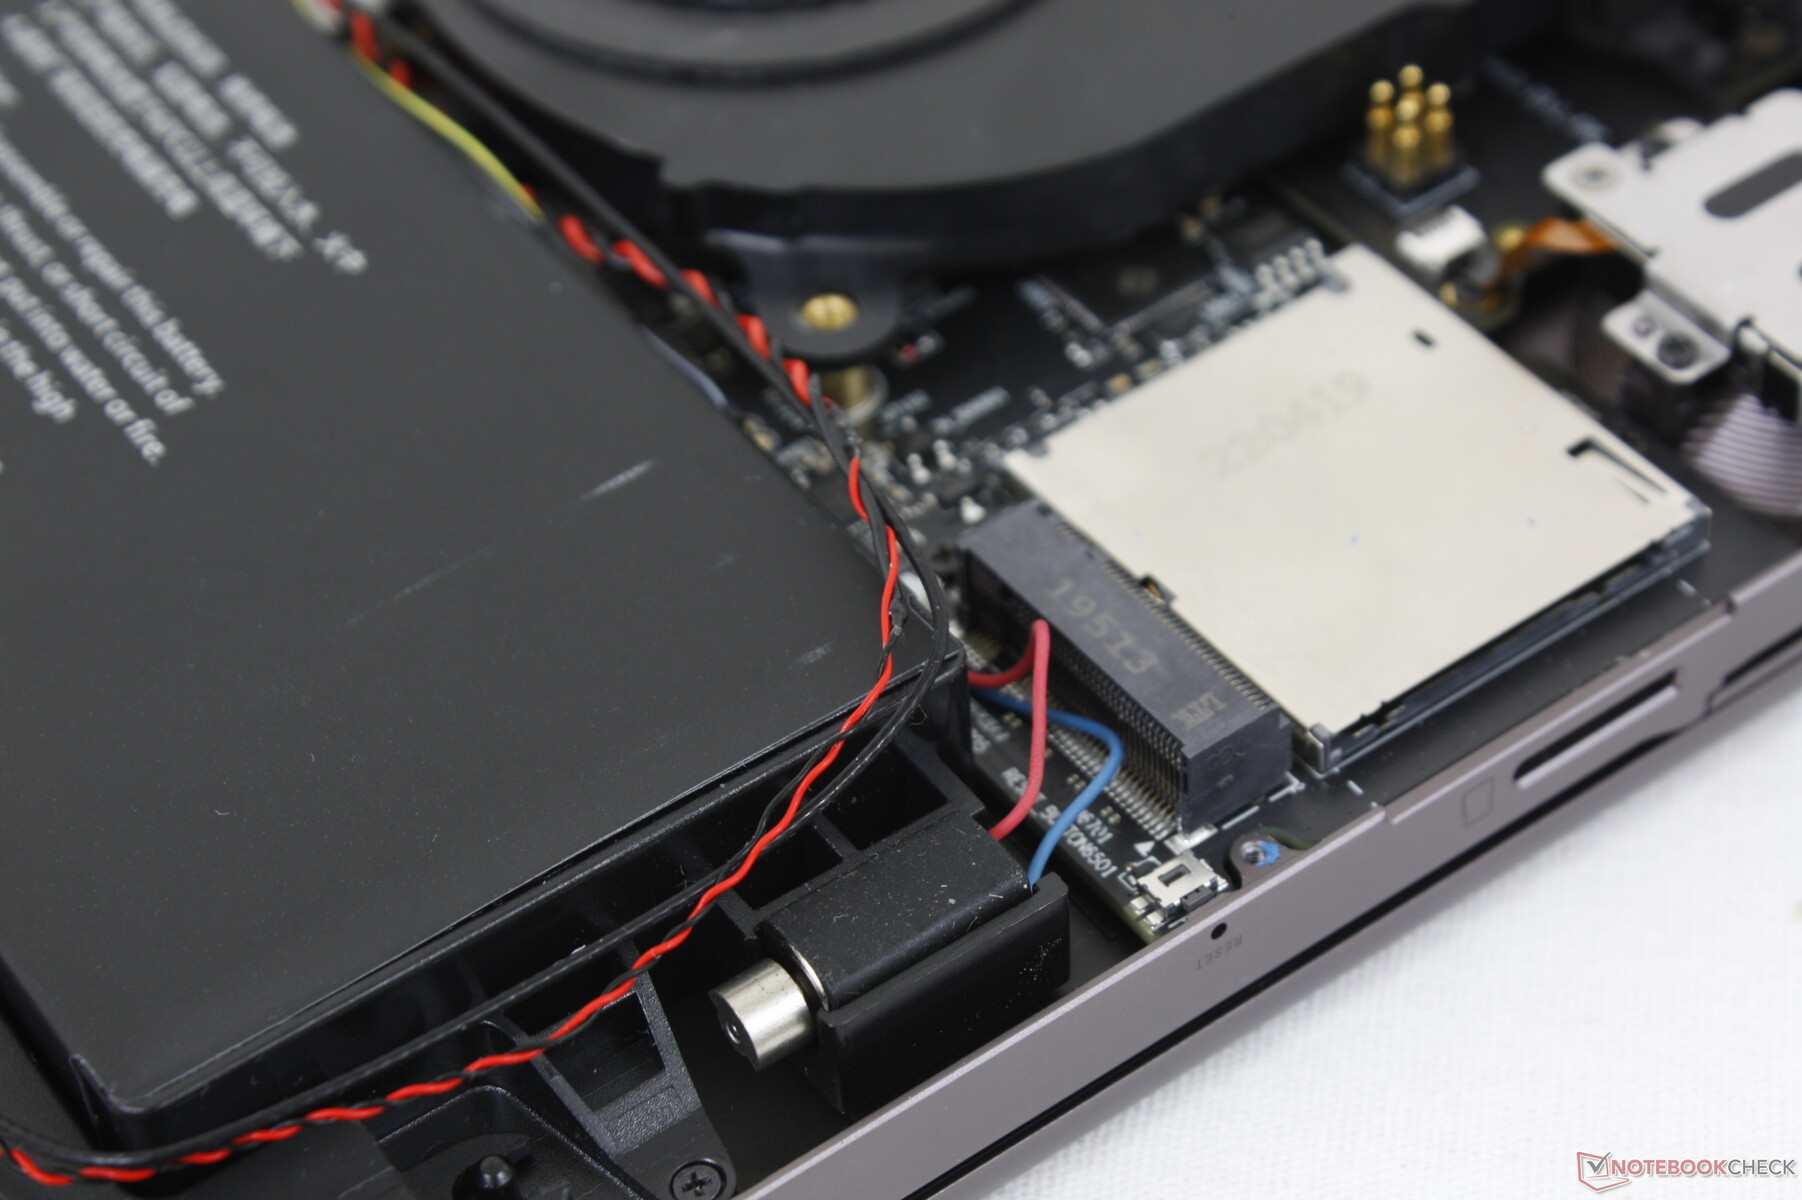
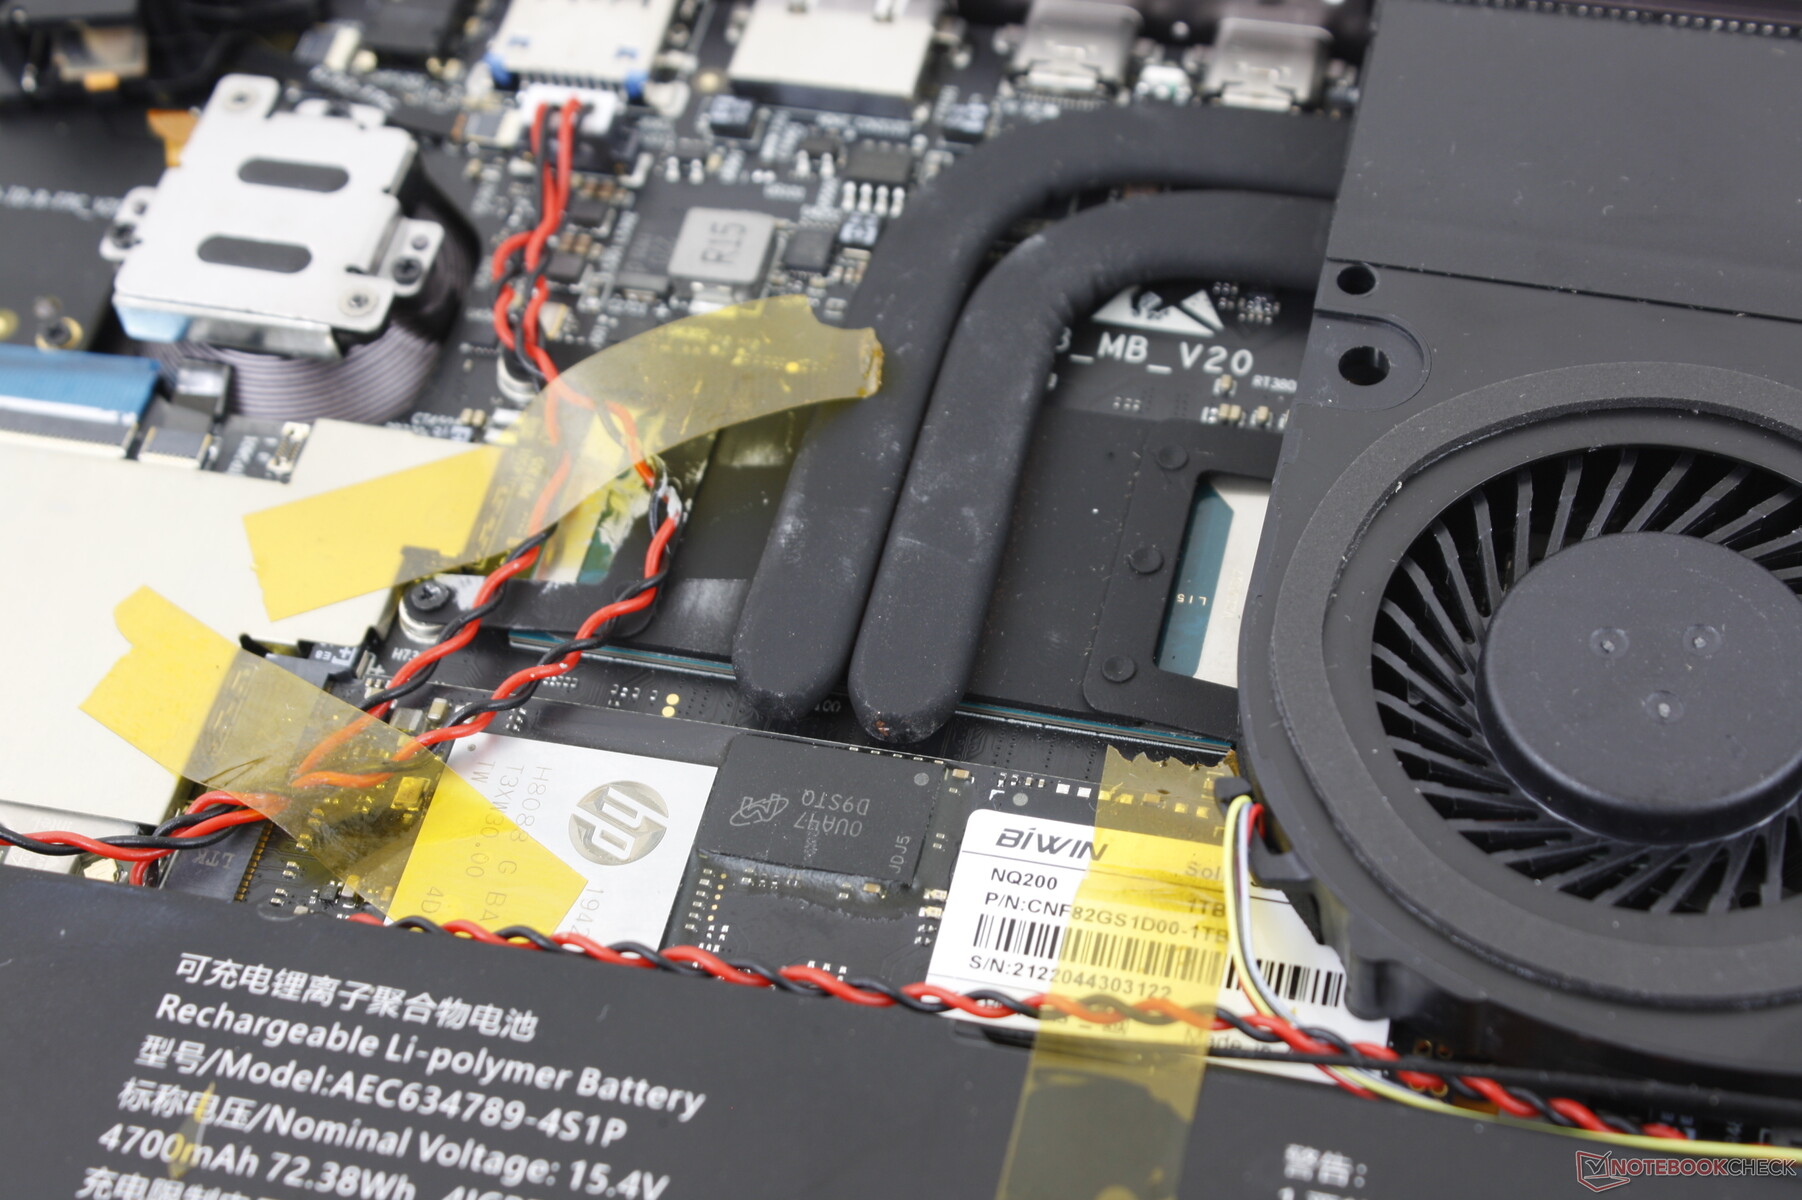
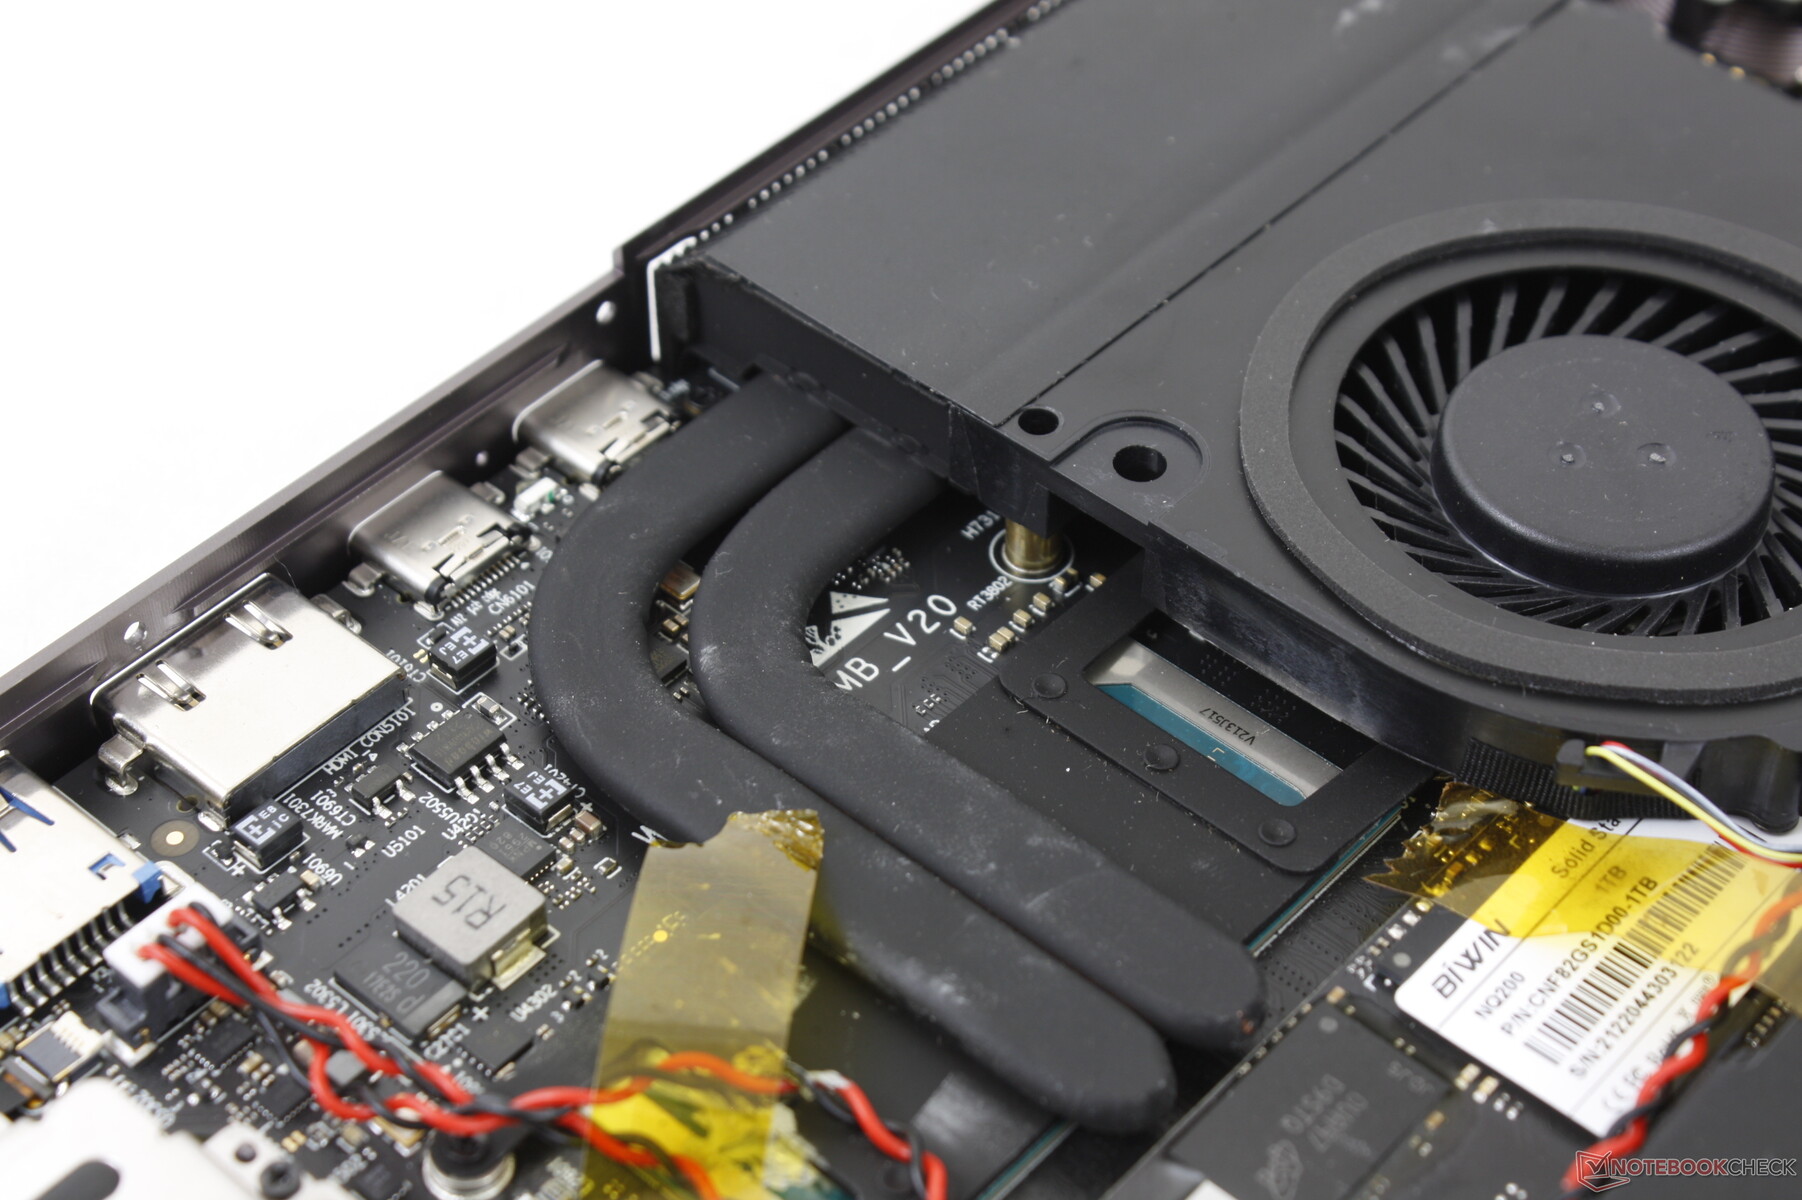
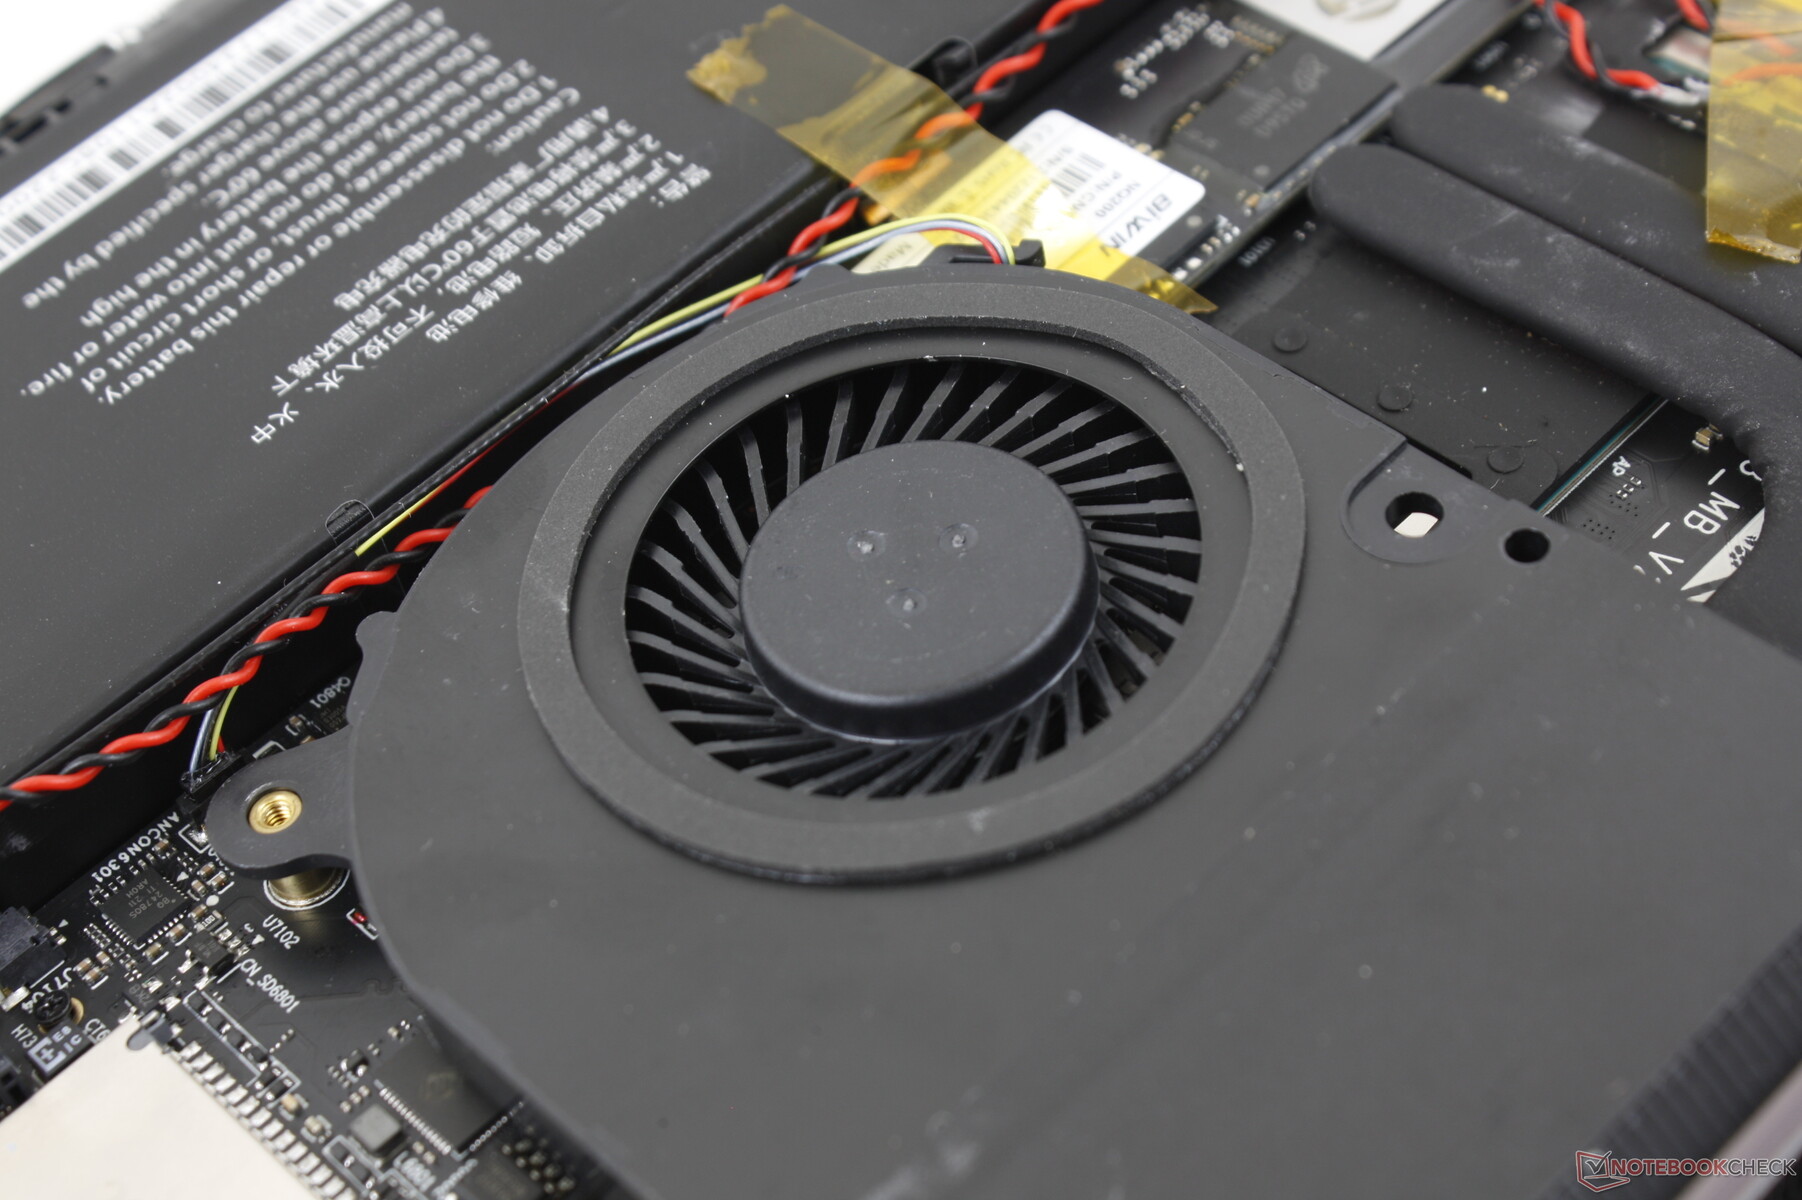
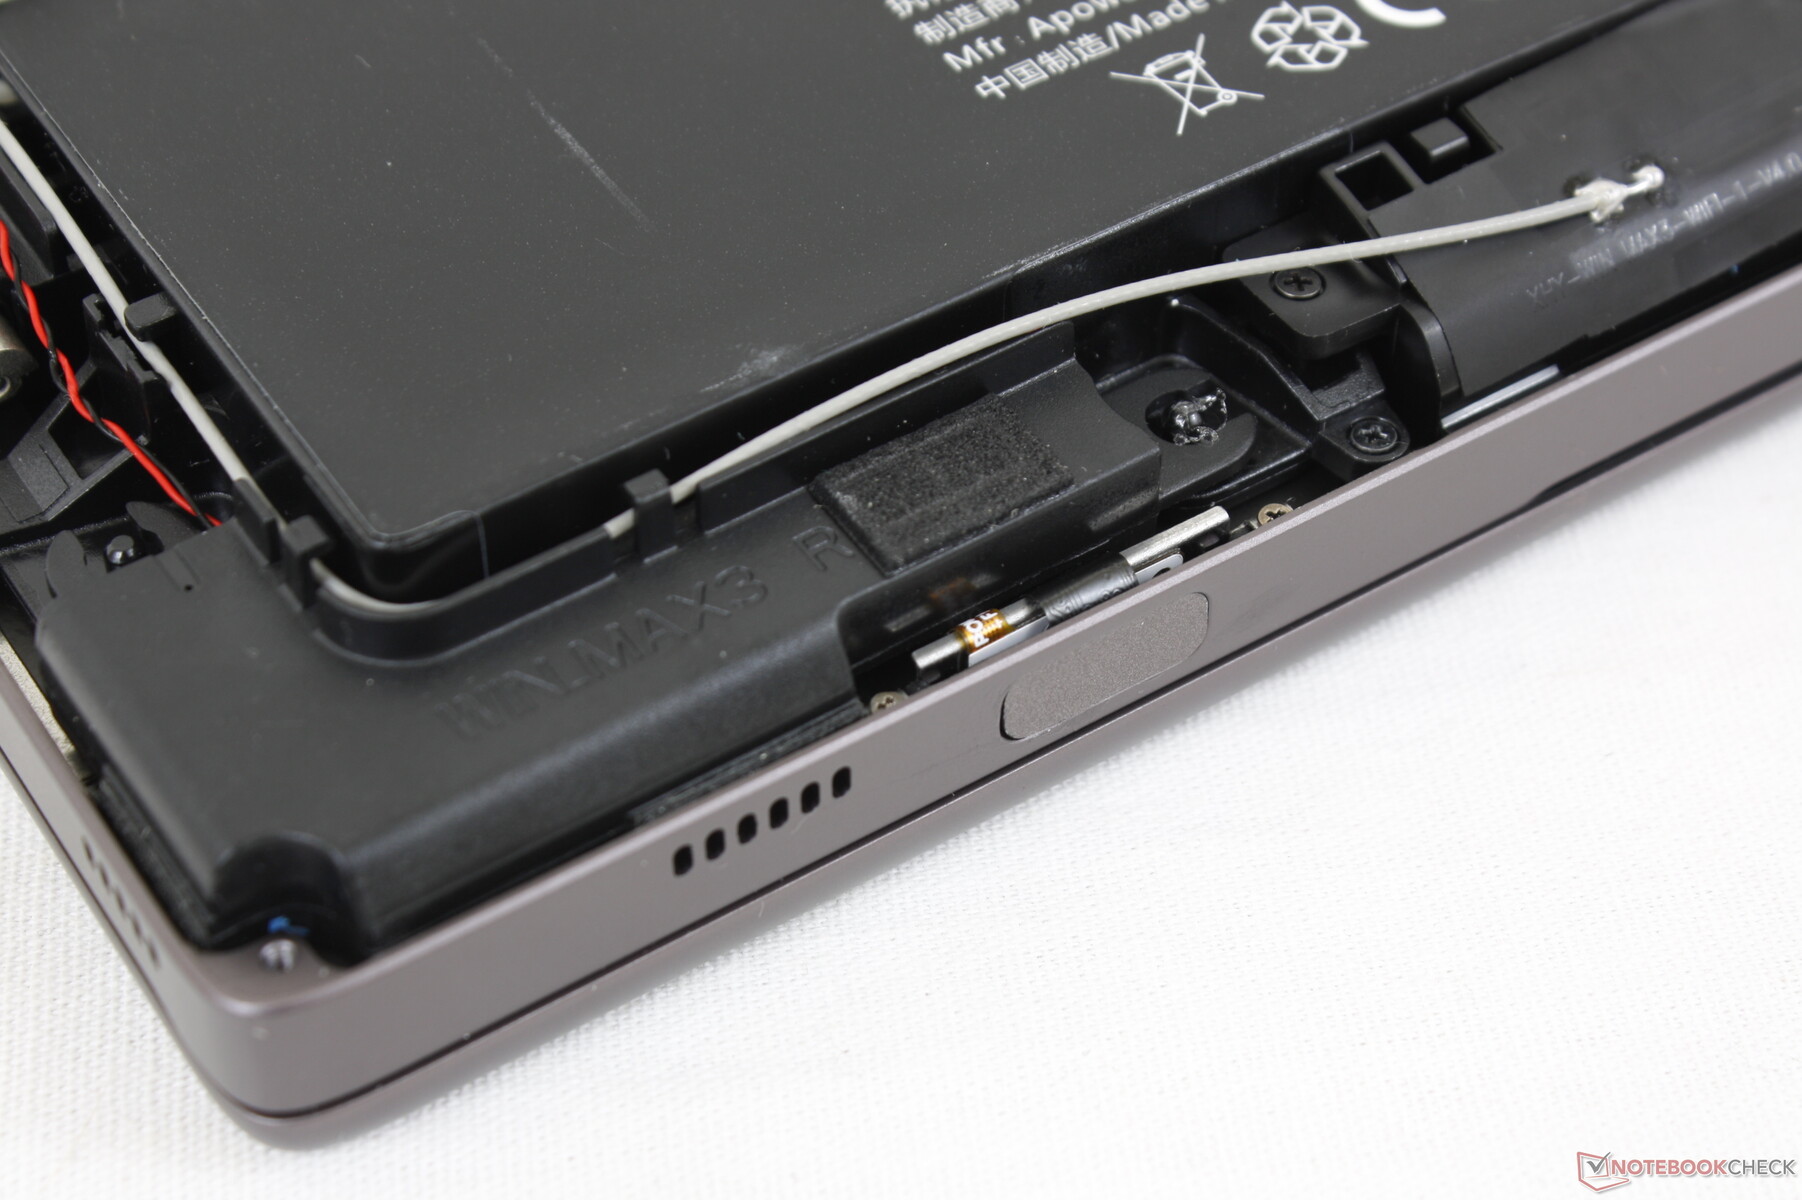
Onderhoud
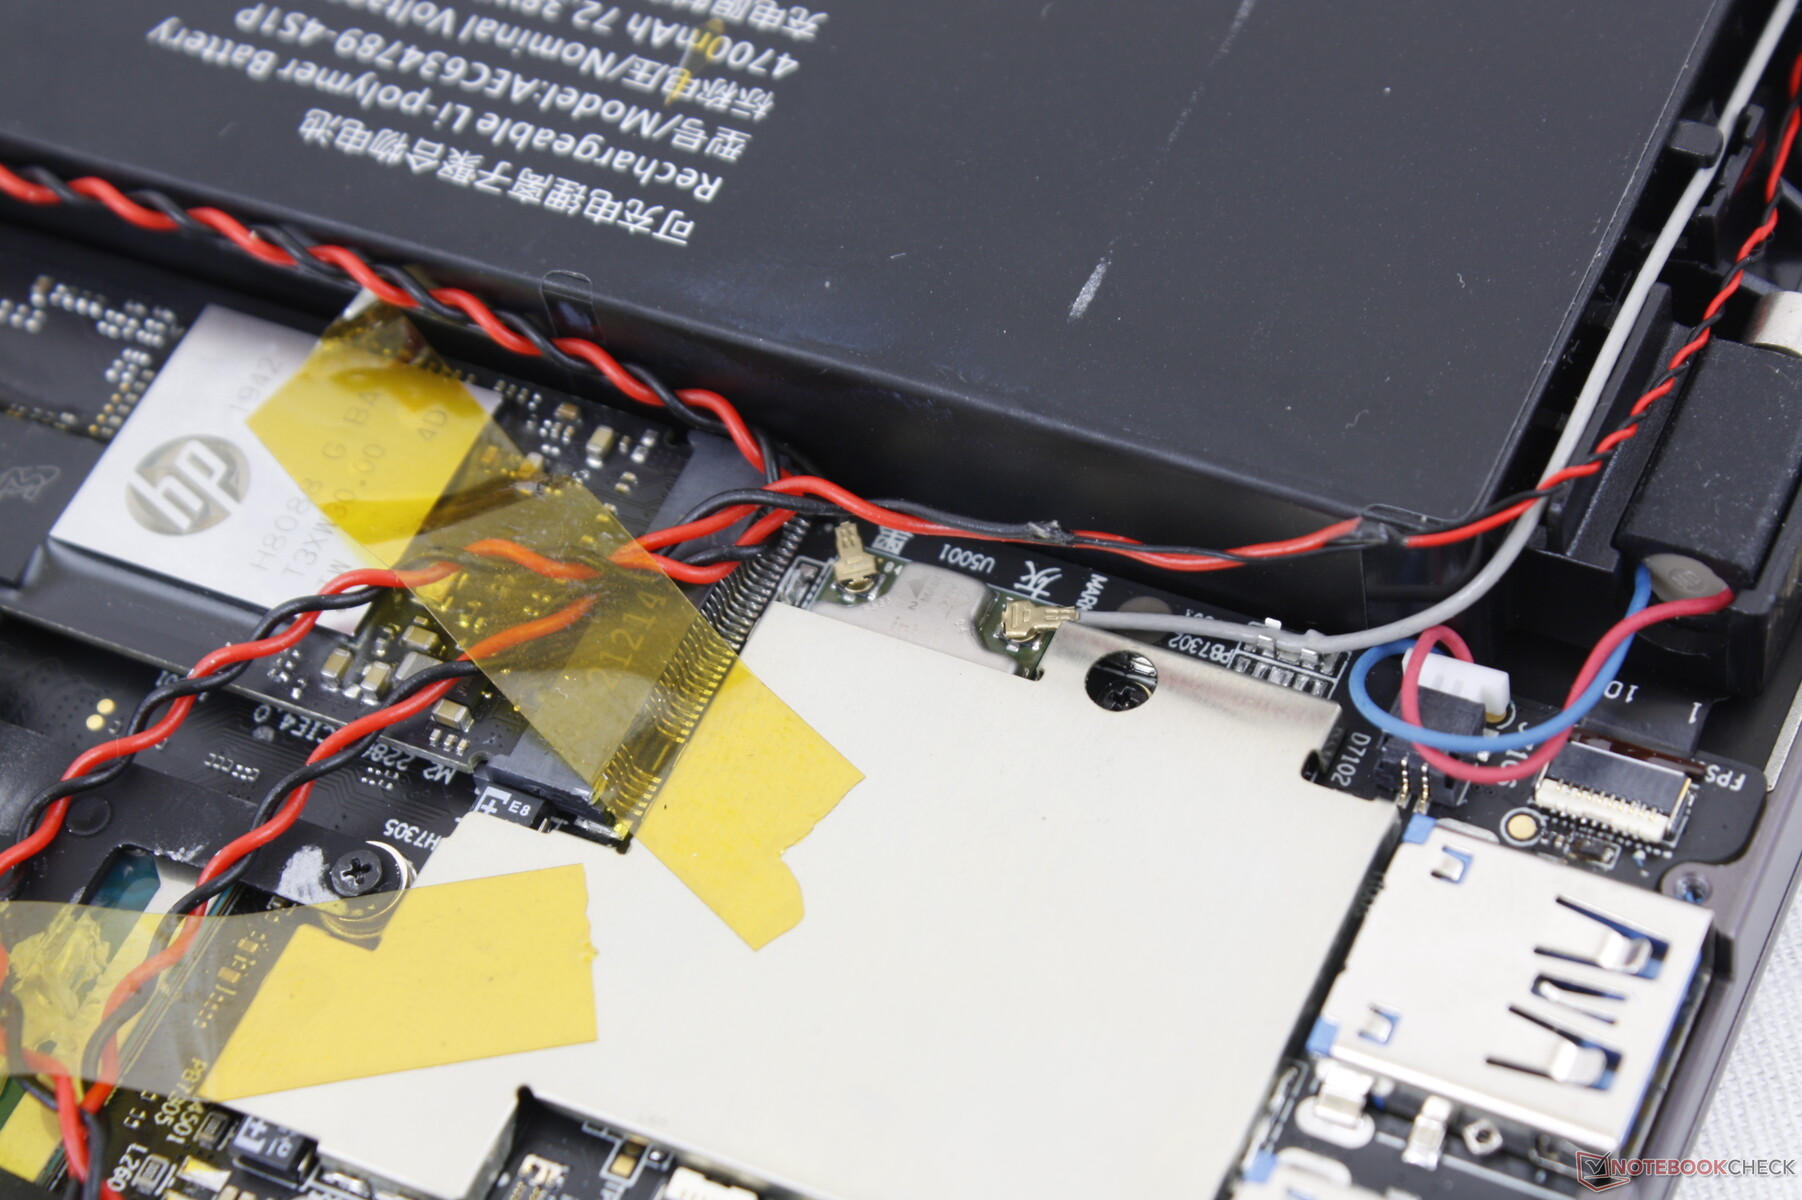
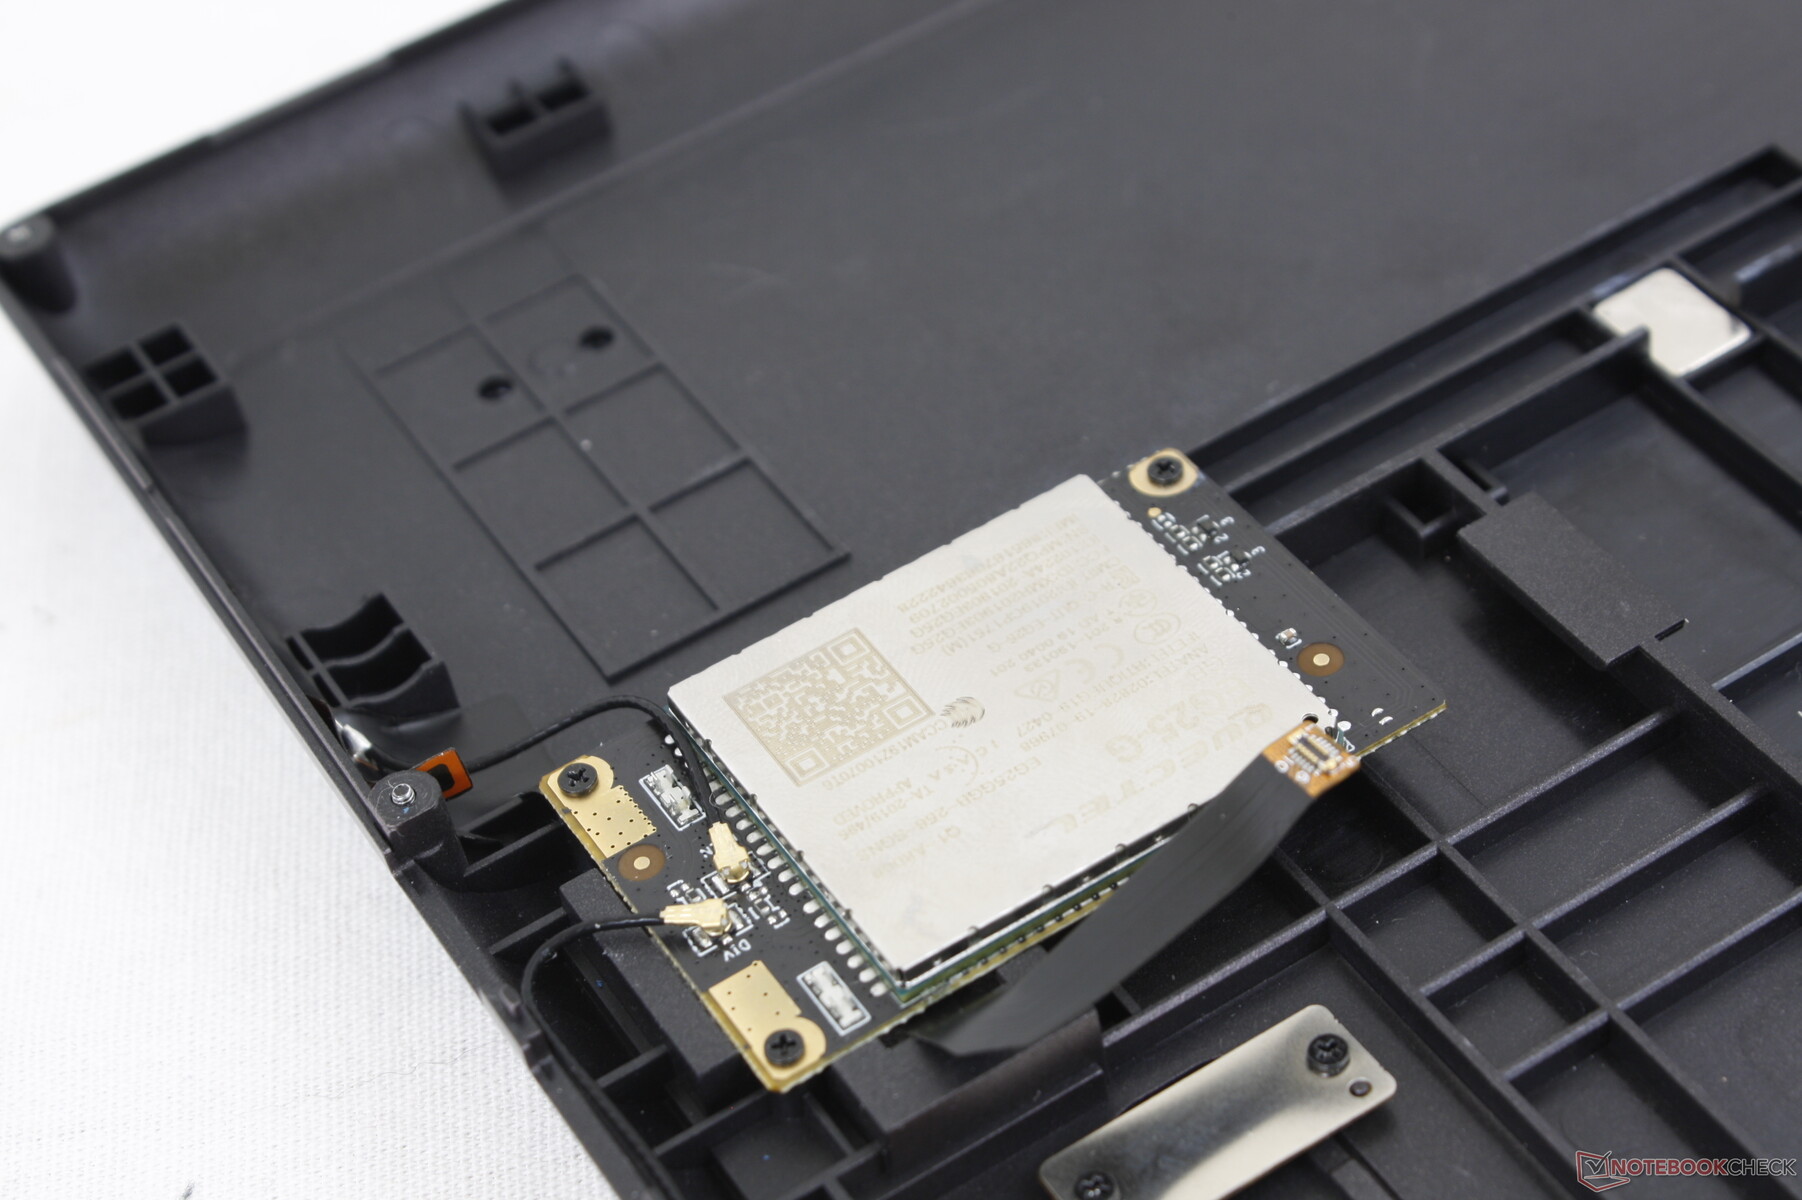
Het bodempaneel is bevestigd met 13 zeer kleine Philips schroeven die relatief gemakkelijk te verwijderen zijn. Het belangrijkste probleem is echter dat de WAN-module op het bodempaneel rust in plaats van op het moederbord. De lintkabel die de WAN-module met het moederbord verbindt, moet daarom worden losgemaakt wanneer het bodempaneel wordt verwijderd. Het opnieuw bevestigen van deze kabel aan het moederbord tijdens de hermontage is uiterst moeilijk vanwege de korte lengte ervan.
Accessoires en garantie
Er zitten geen extra's in de doos, behalve de wisselstroomadapter en de papieren. Bij aankoop in de VS geldt een beperkte garantie van één jaar, maar GPD zegt dat de kosten voor retourzending niet worden gedekt.
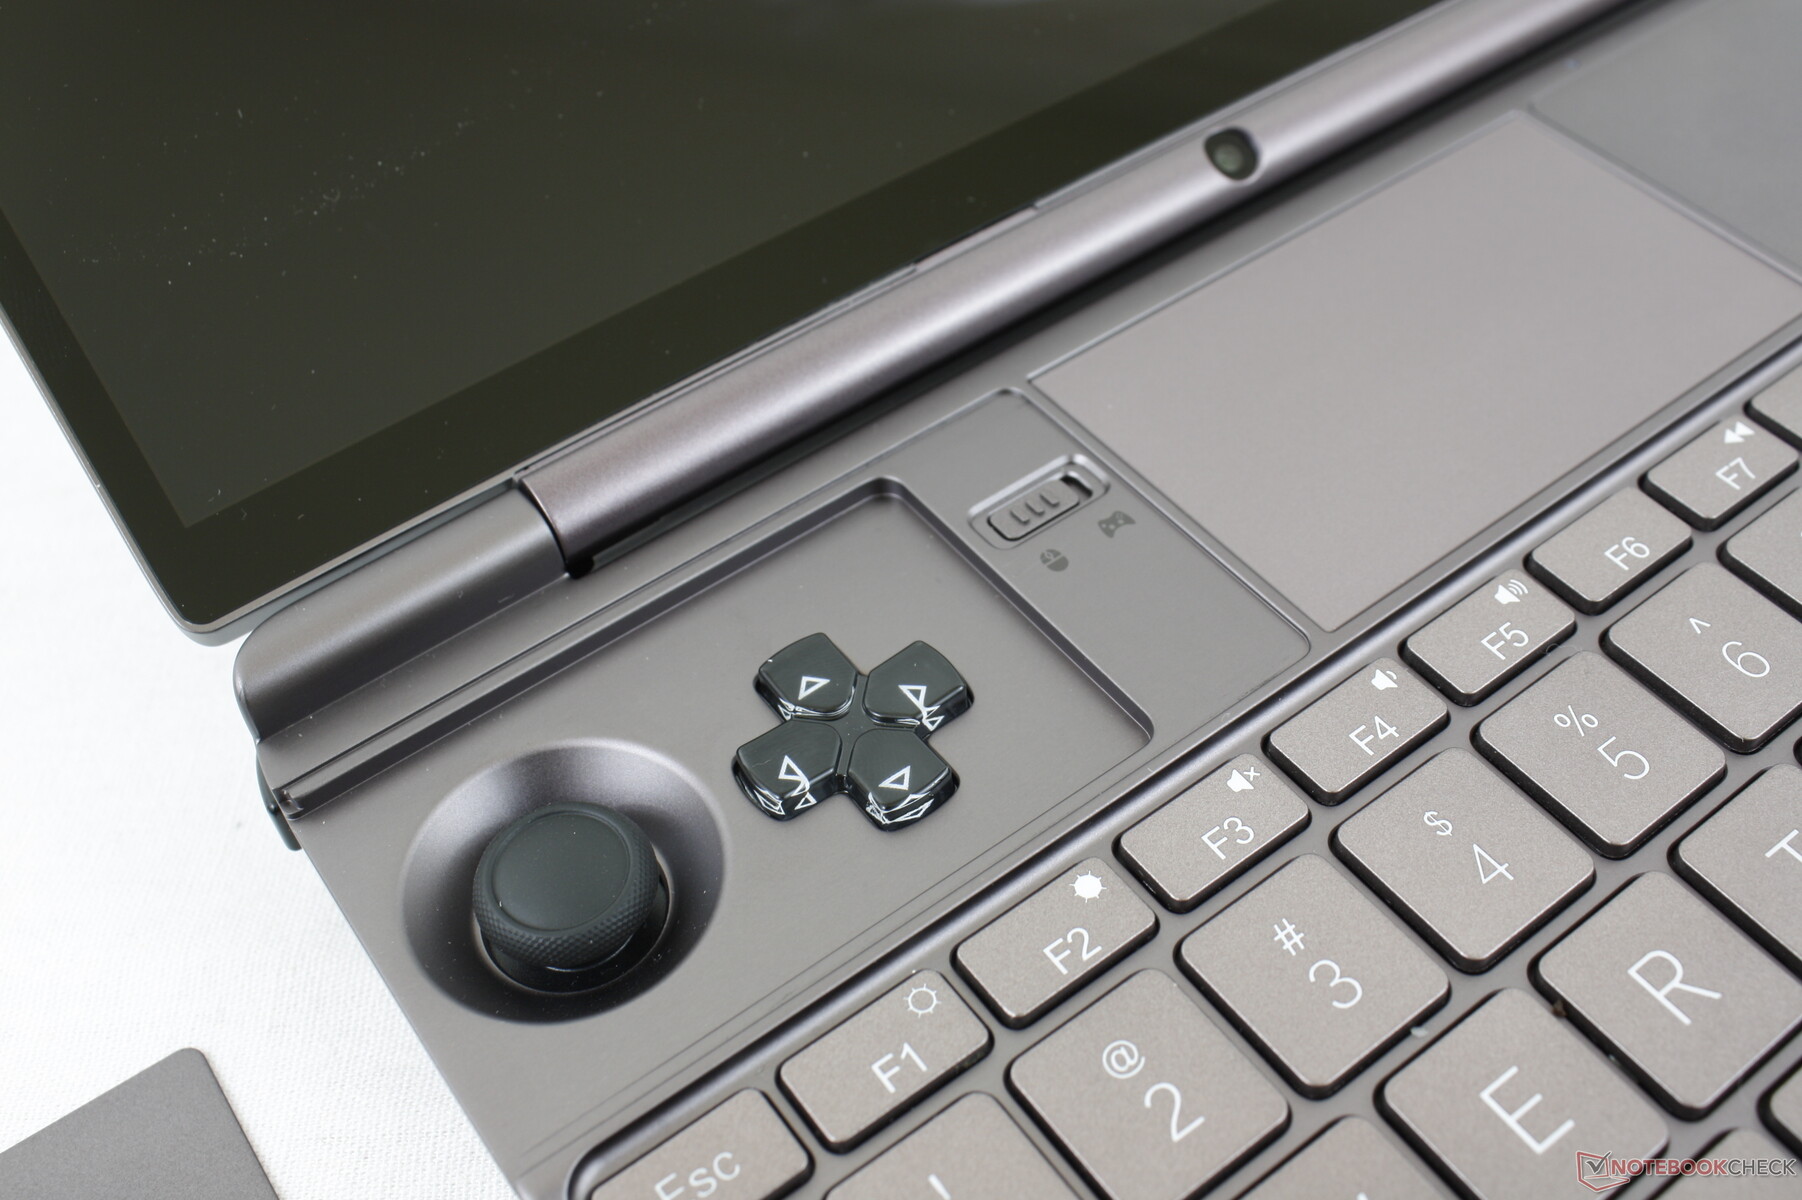
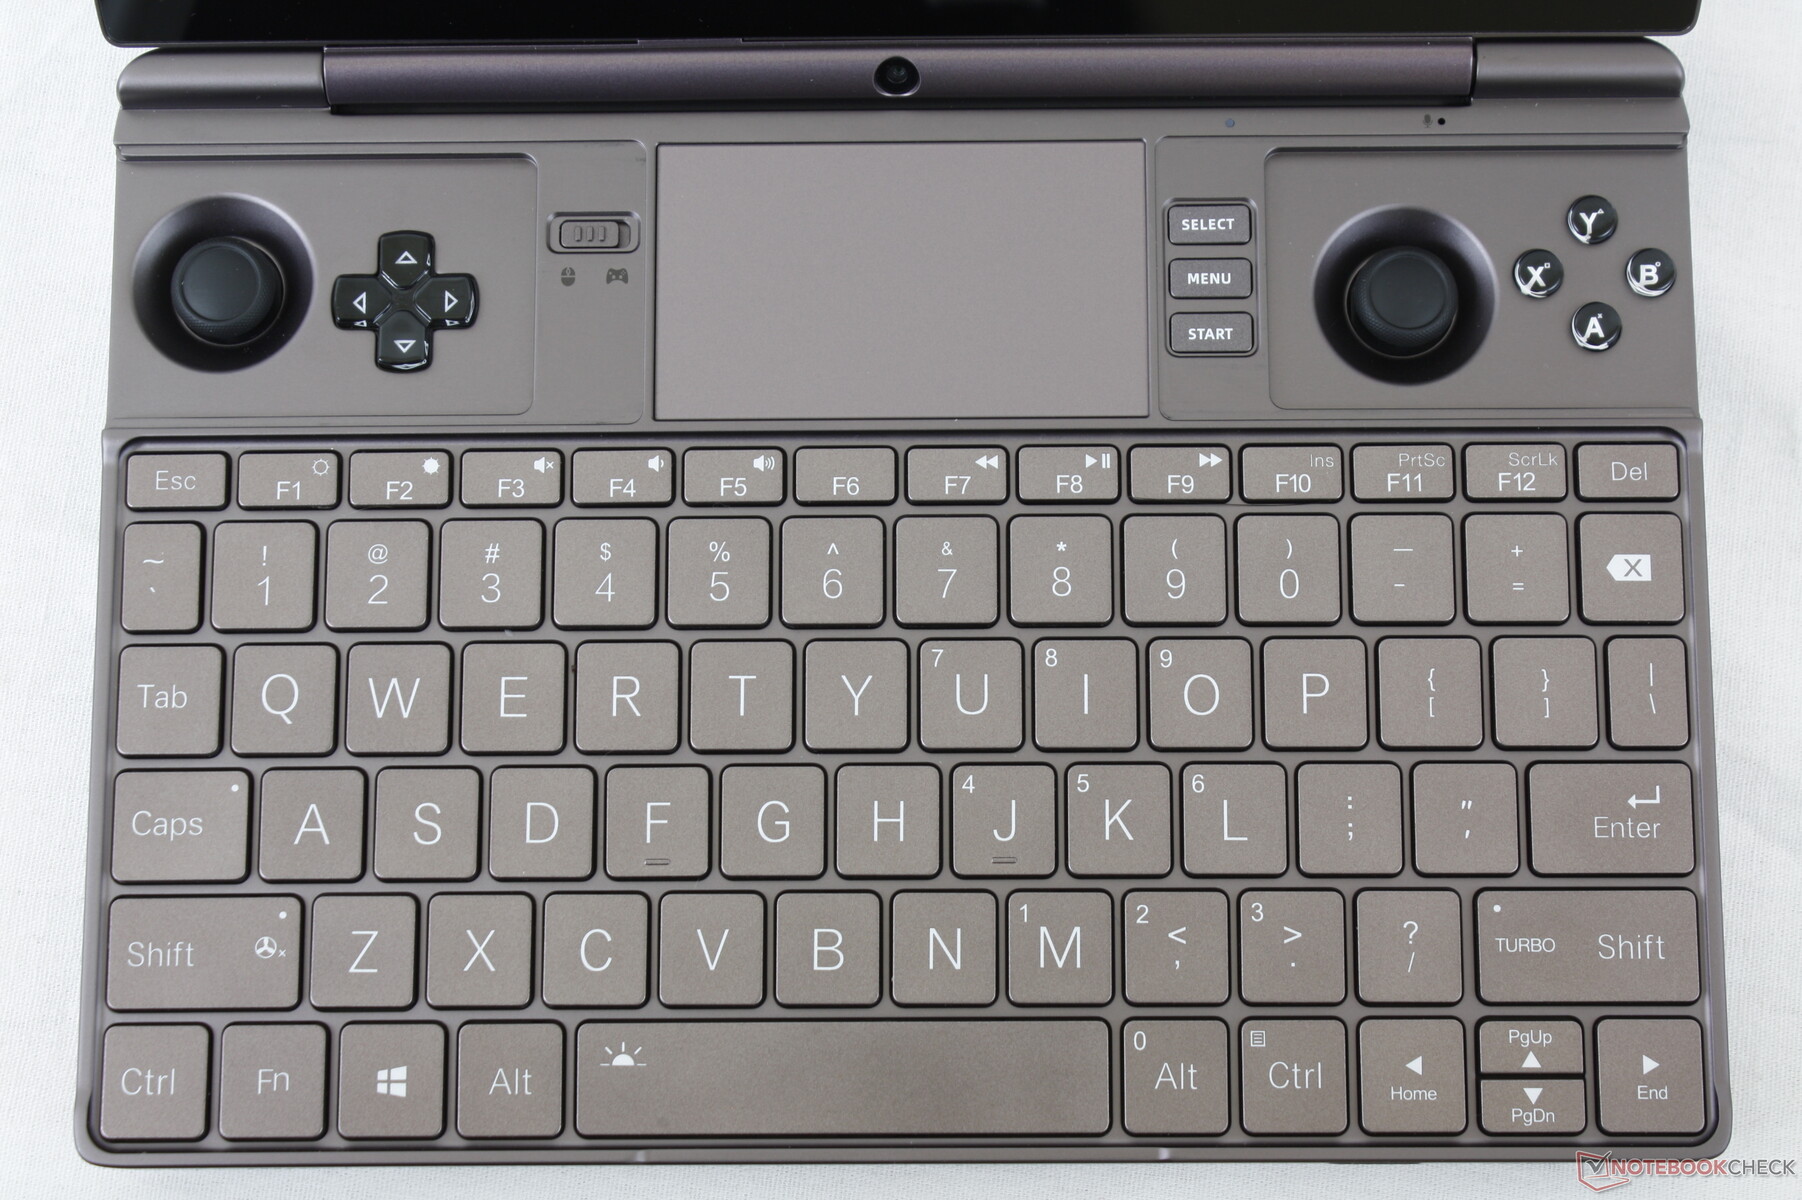
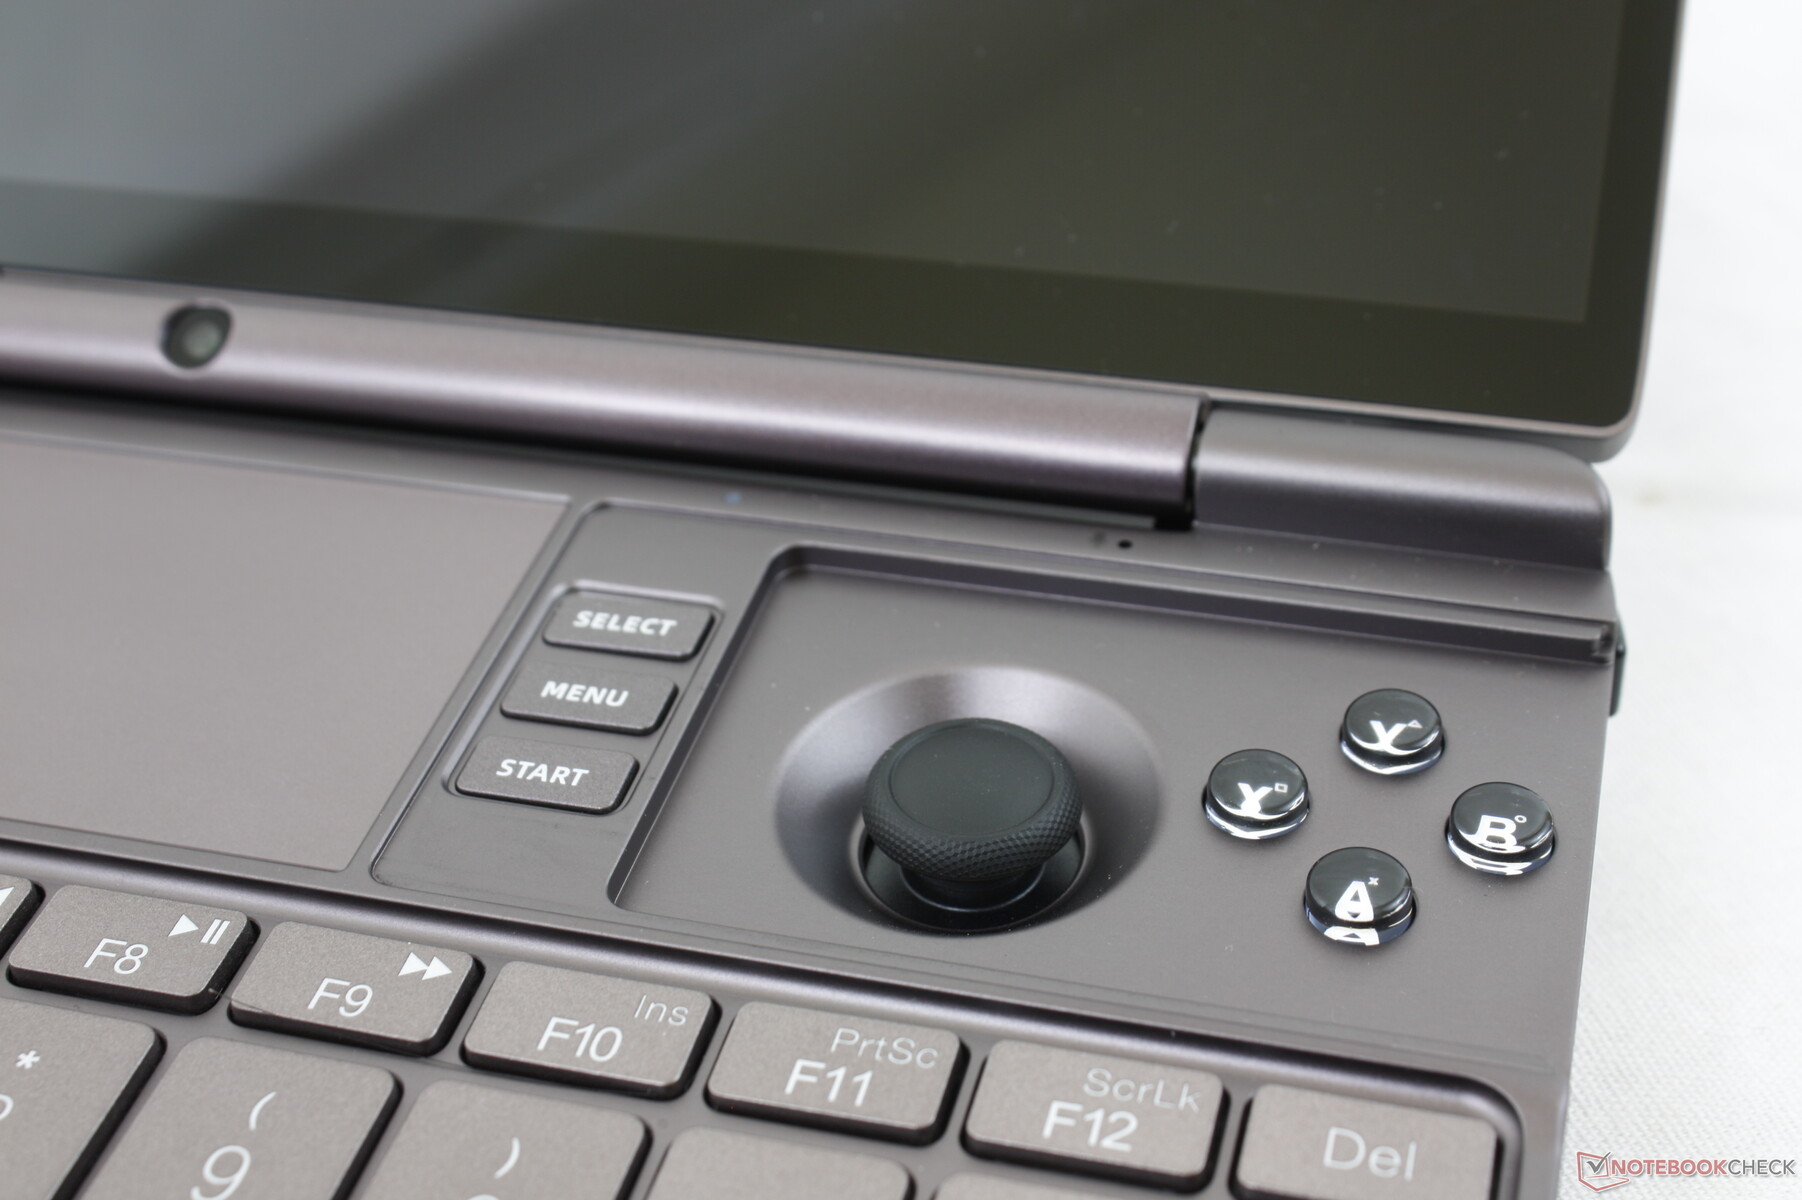
Invoerapparaten - vermoeiend om lang vast te houden
Controller
De controller kan via een schakelaar tussen twee modi schakelen: Standaard en Gaming. In de standaardmodus zijn de knoppen standaard als volgt ingesteld:
- Linker joystick: W, A, S, D
- Rechter joystick: Cursorbesturing
- Linker richtingspad: Home
- Rechter richtingspad: Einde
- Bovenrand van de richtingsknop en Y-knoppen: Omhoog
- Neerwaartse richtingstoets en A-knoppen: Omlaag
- X-knop: Links
- B-knop: Rechts
De schouderknoppen hebben ook hun eigen functies, waaronder Ctrl+Alt+Del voor de rechter trigger. Het probleem hier is dat het gemakkelijk is om per ongeluk op een schouderknop te drukken en iets onbedoeld in te voeren. Er is geen speciale voorgeïnstalleerde software om de knoppen gemakkelijk opnieuw in te stellen of uit te schakelen. Een derde modus om de controller volledig uit te schakelen zou handig zijn geweest
In de Gaming mode worden de toetsen door Windows herkend als een generieke XBox controller en dus ook als zodanig behandeld en in kaart gebracht. De knoppen en joysticks hier zijn dichter bij het gevoel, de grootte, en de feedback van de Nintendo Joy-cons in plaats van de meer comfortabele PS of XBox-controllers.
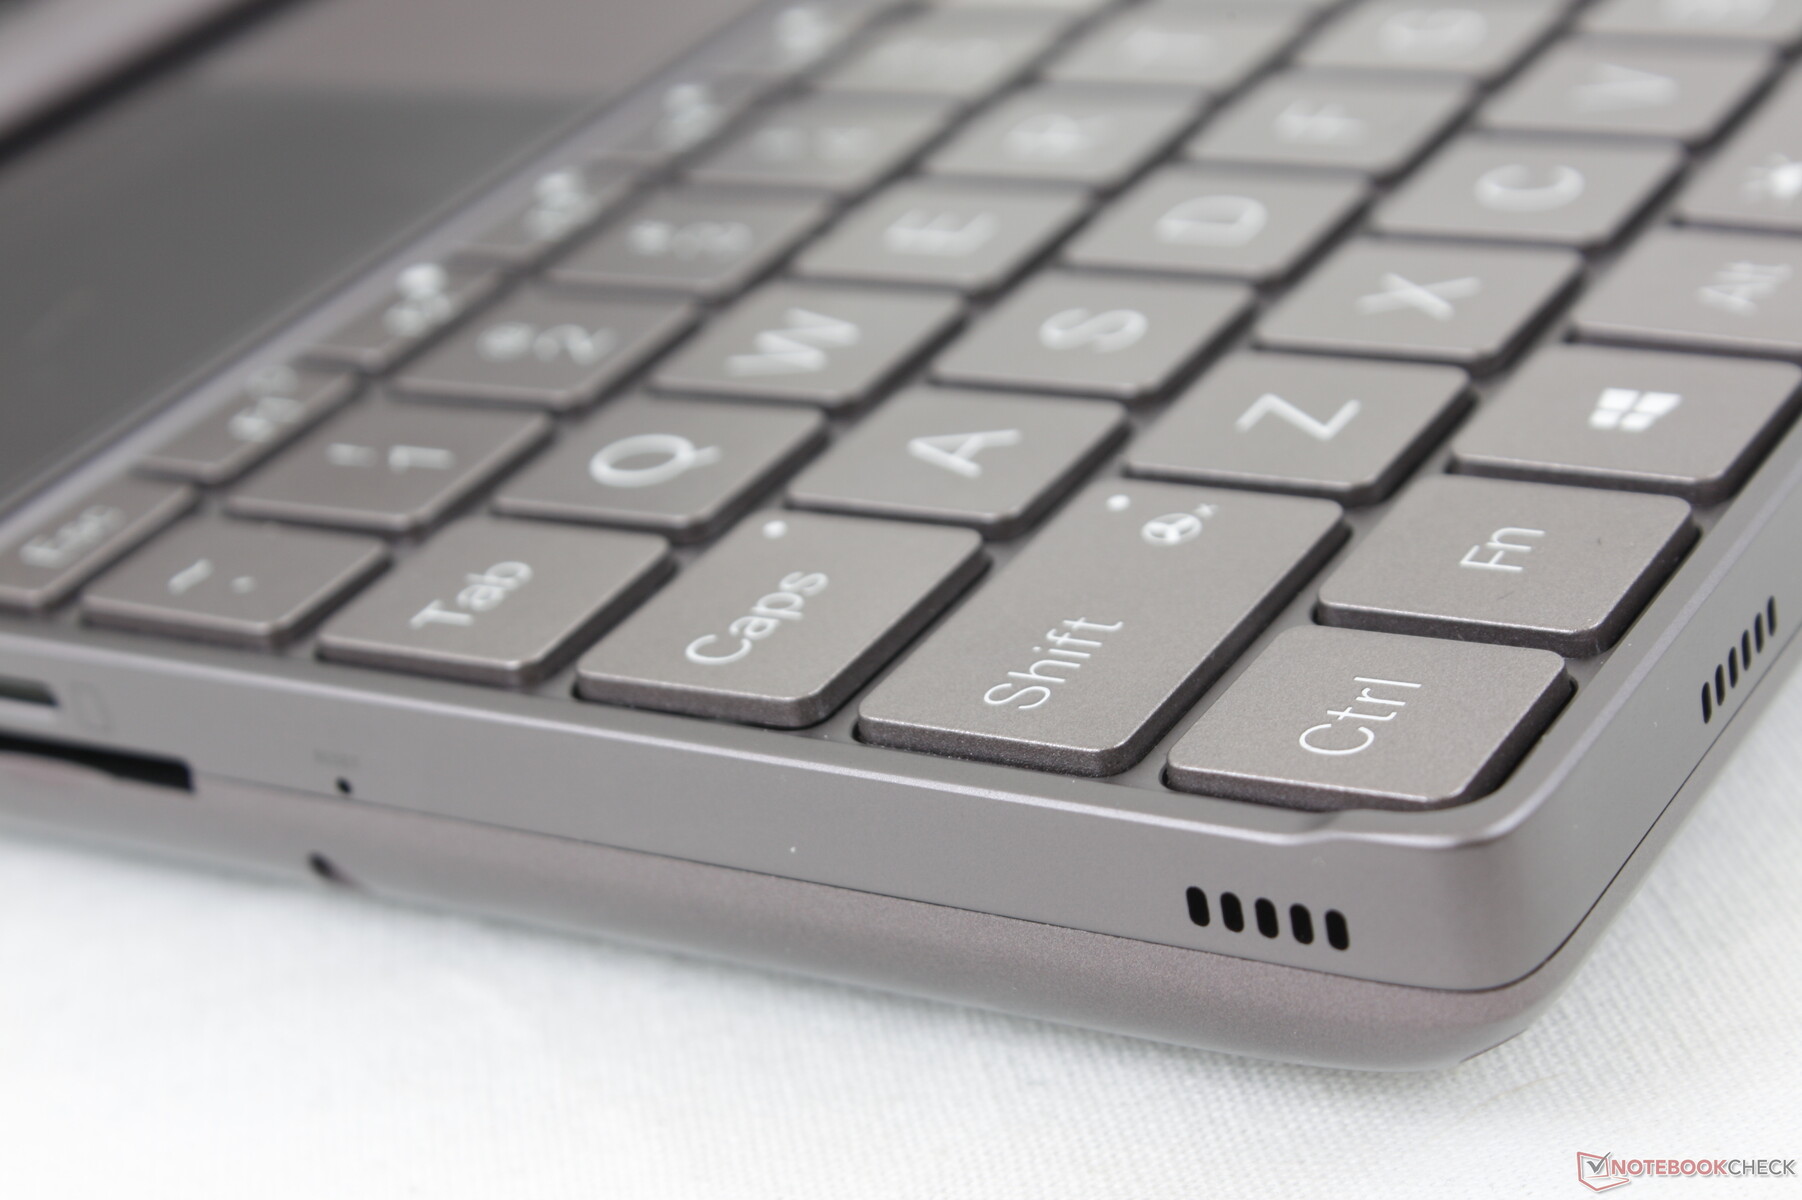
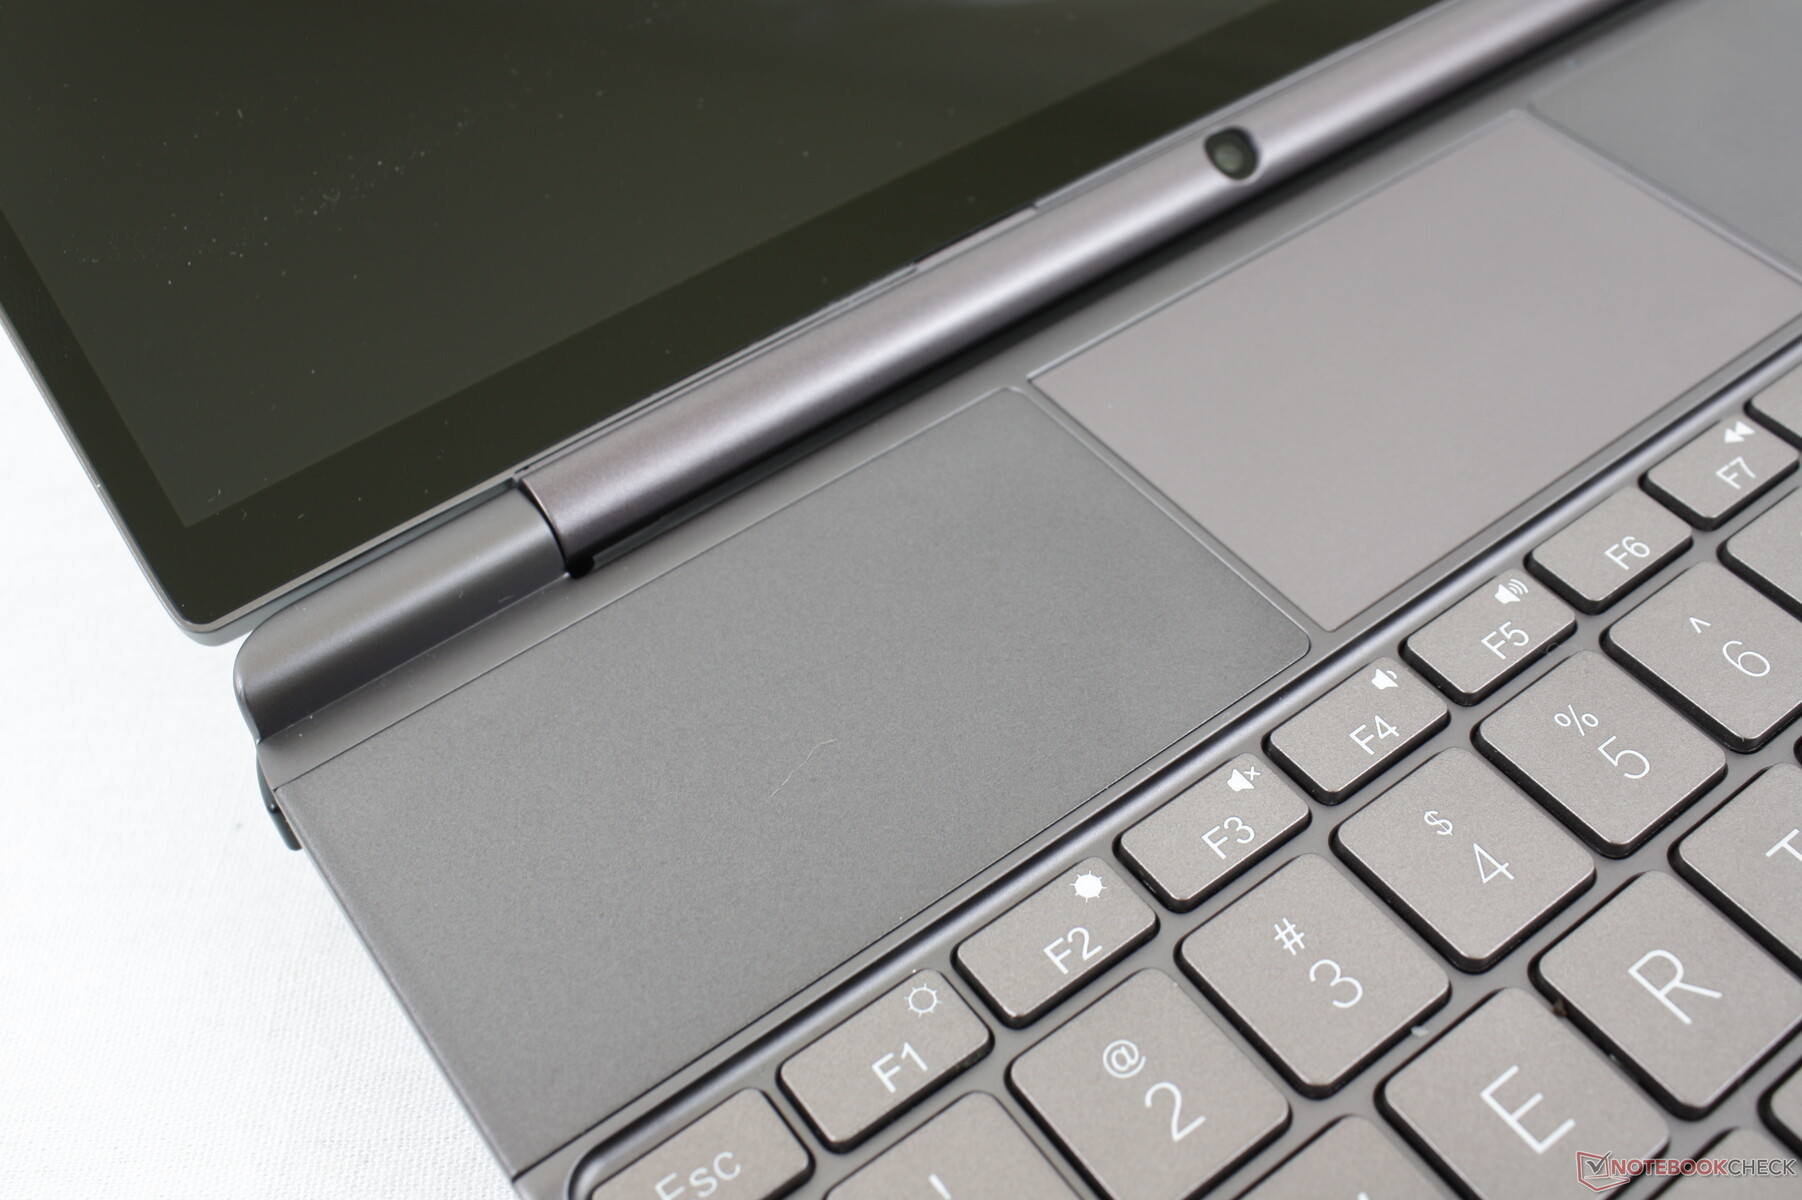
Toetsenbord
Het toetsenbord is een verbetering ten opzichte van het origineel Win Max in termen van grootte en lay-out. De cijfertoetsen, Caps Lock en Shift-toets, bijvoorbeeld, zijn nu groter en dichter bij wat gebruikers zijn gaan verwachten van een QWERTY-indeling. De feedback is vergelijkbaar met die van de meeste grotere Ultrabooks, zij het natuurlijk krampachtiger
Het toetsenbord lijkt problemen te hebben met het herkennen van meer dan 2 toetsen tegelijk. Fn+Alt+PrtSc, bijvoorbeeld, werd niet geregistreerd op ons toestel.
Touchpad
Het clickpad is met slechts 7,0 x 4,1 cm naar verwachting klein, maar nog altijd groter dan het clickpad van 5,8 x 3,3 cm op de 2021 Win Max. De tractie is soepel bij het glijden op gemiddelde of hogere snelheden, terwijl er een beetje kleven is bij lagere snelheden voor meer nauwkeurige klikken. Klikken op het clickpad is verrassend stevig en met sterke feedback ook, maar het is luid als gevolg daarvan.

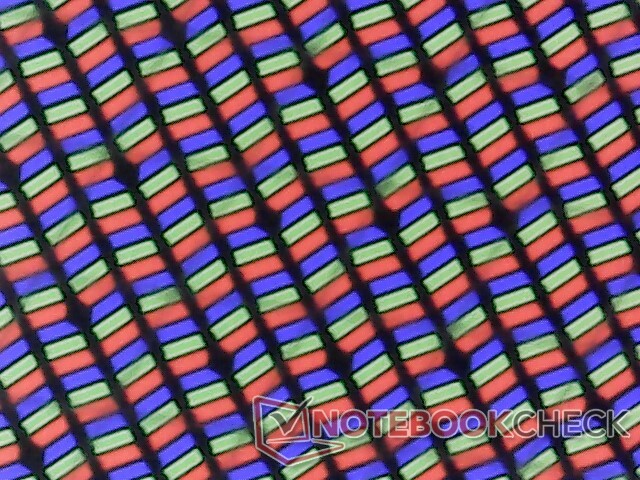
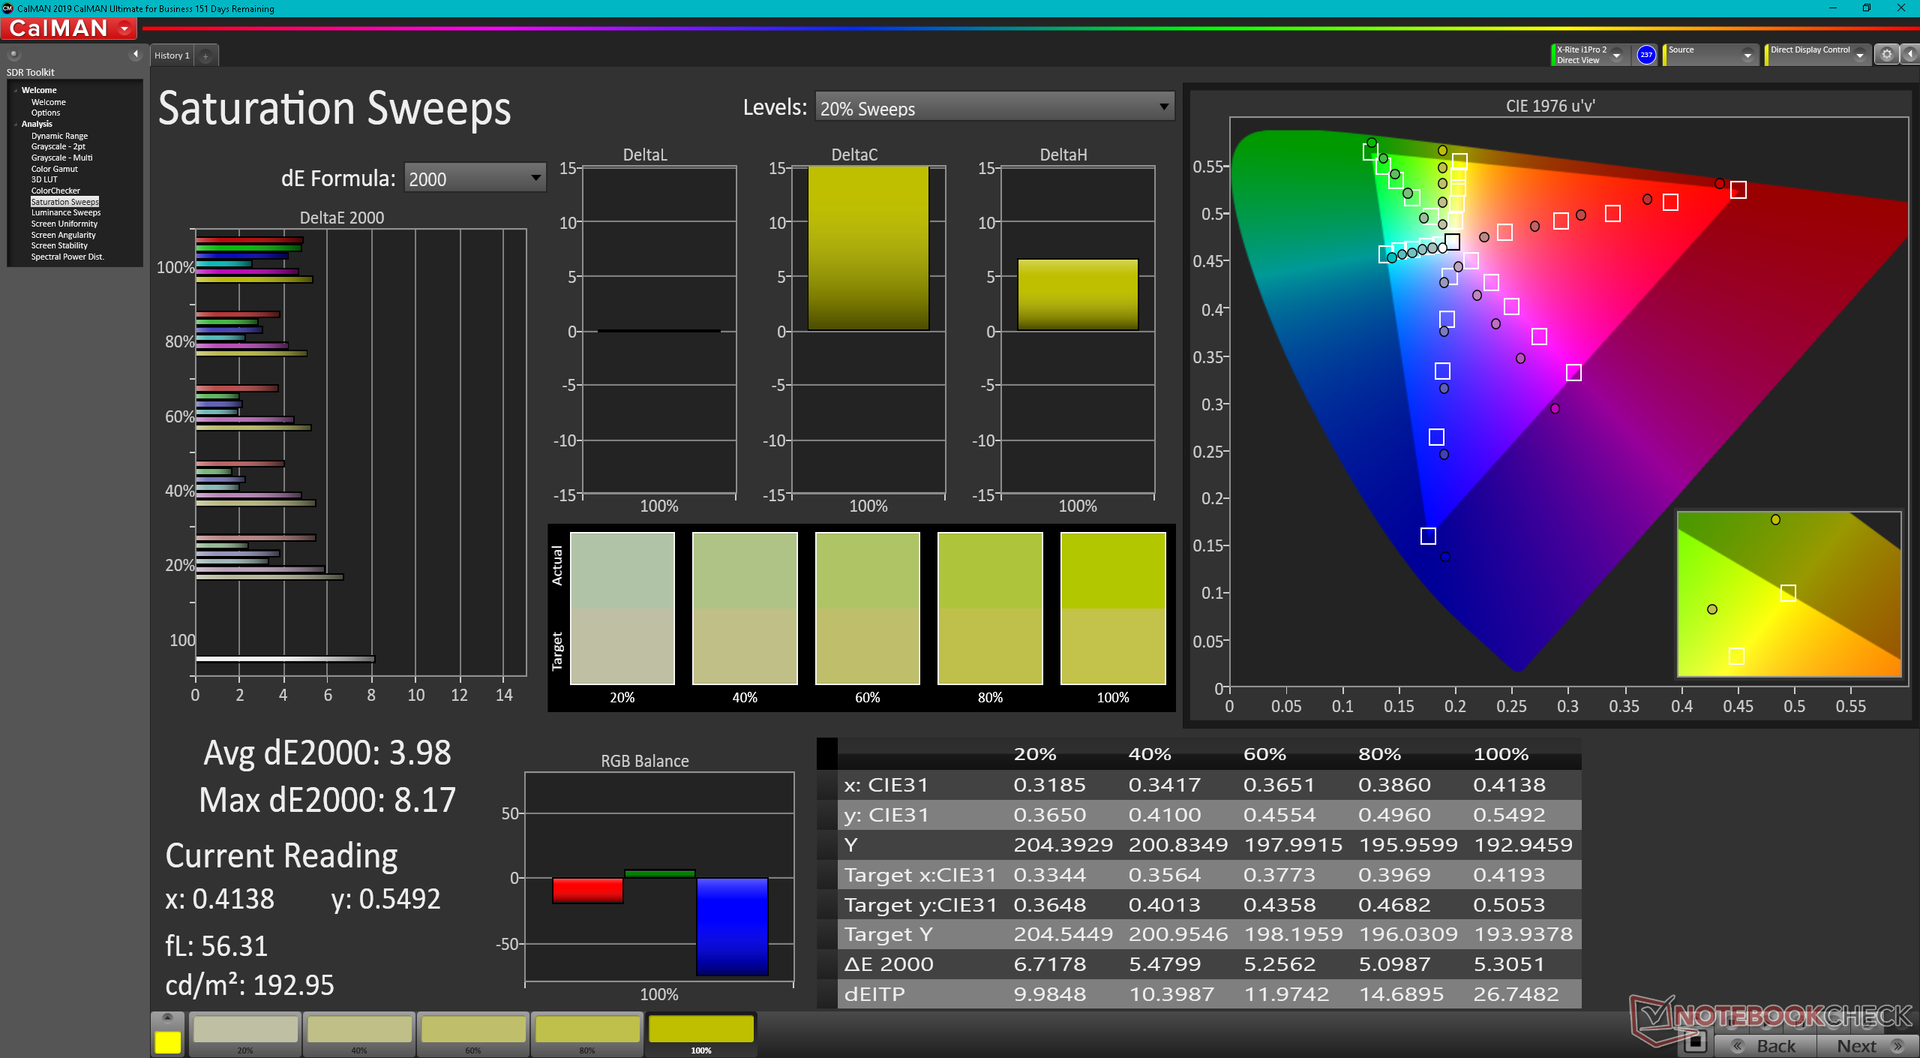
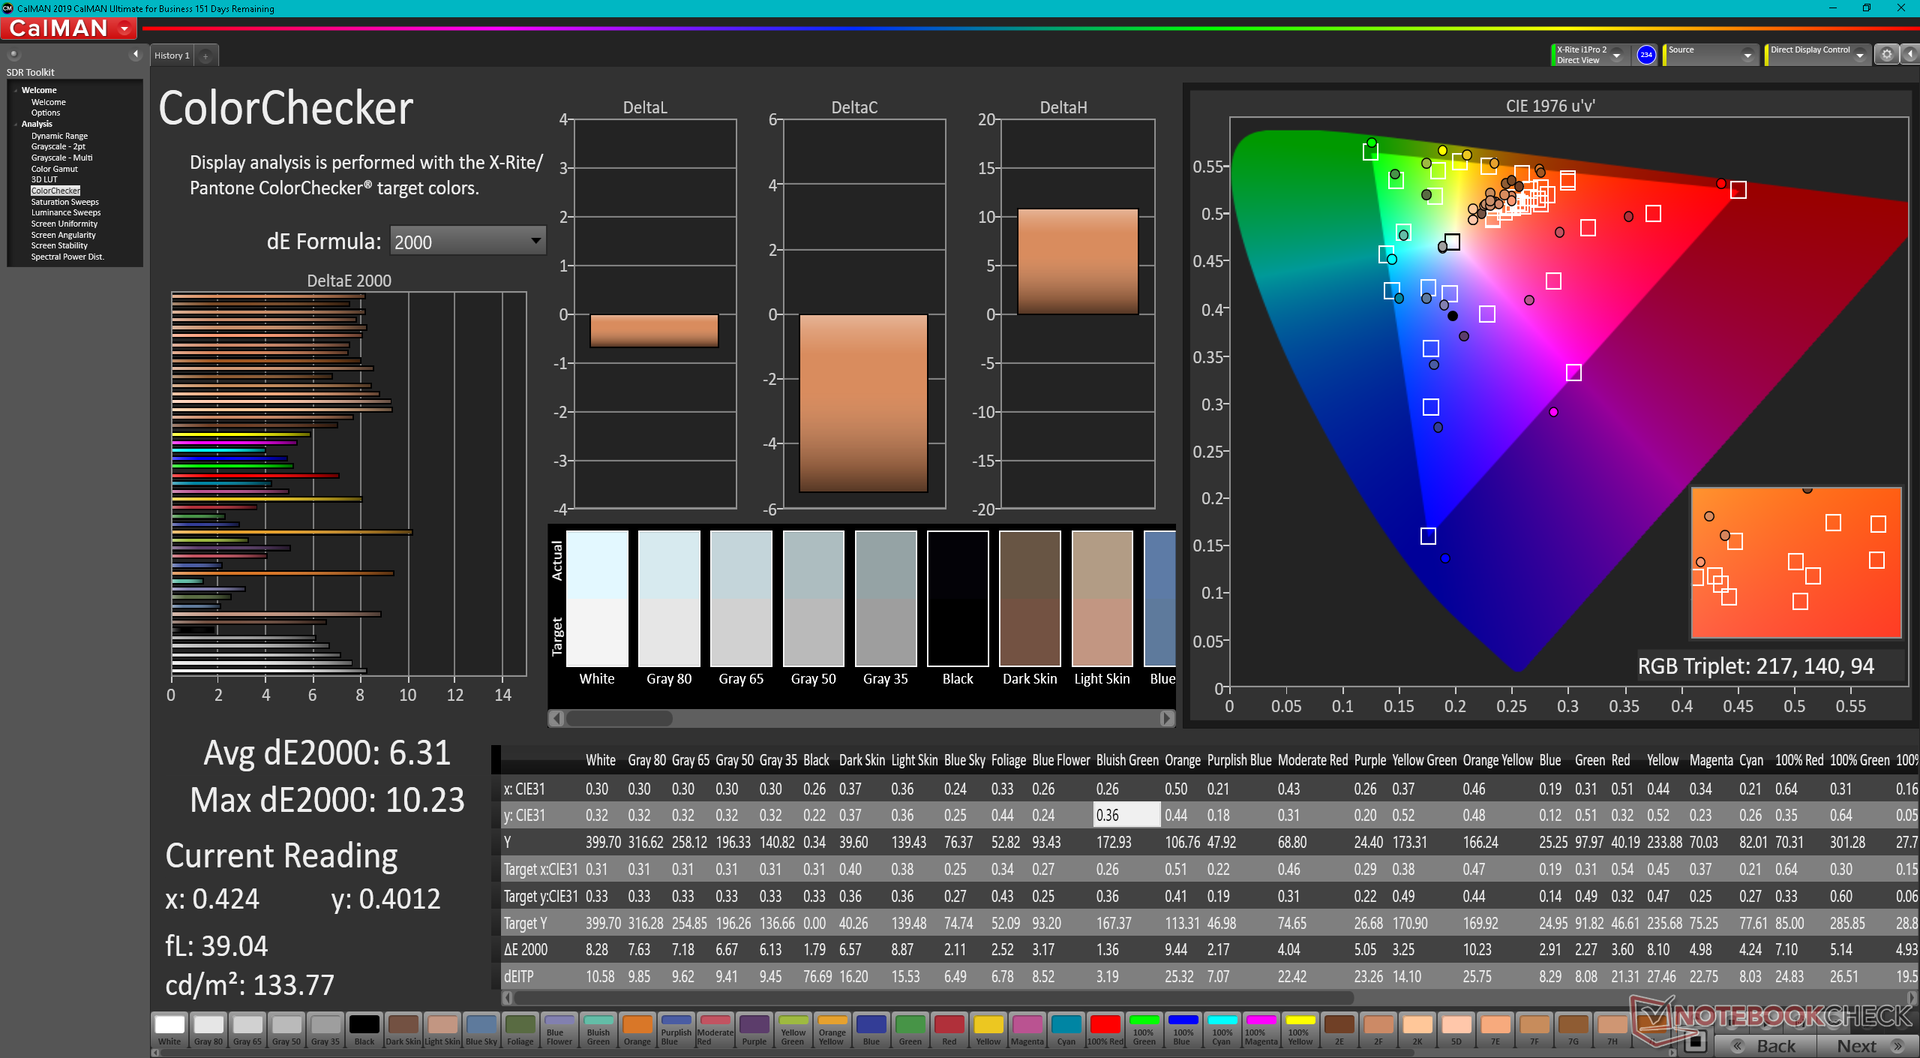
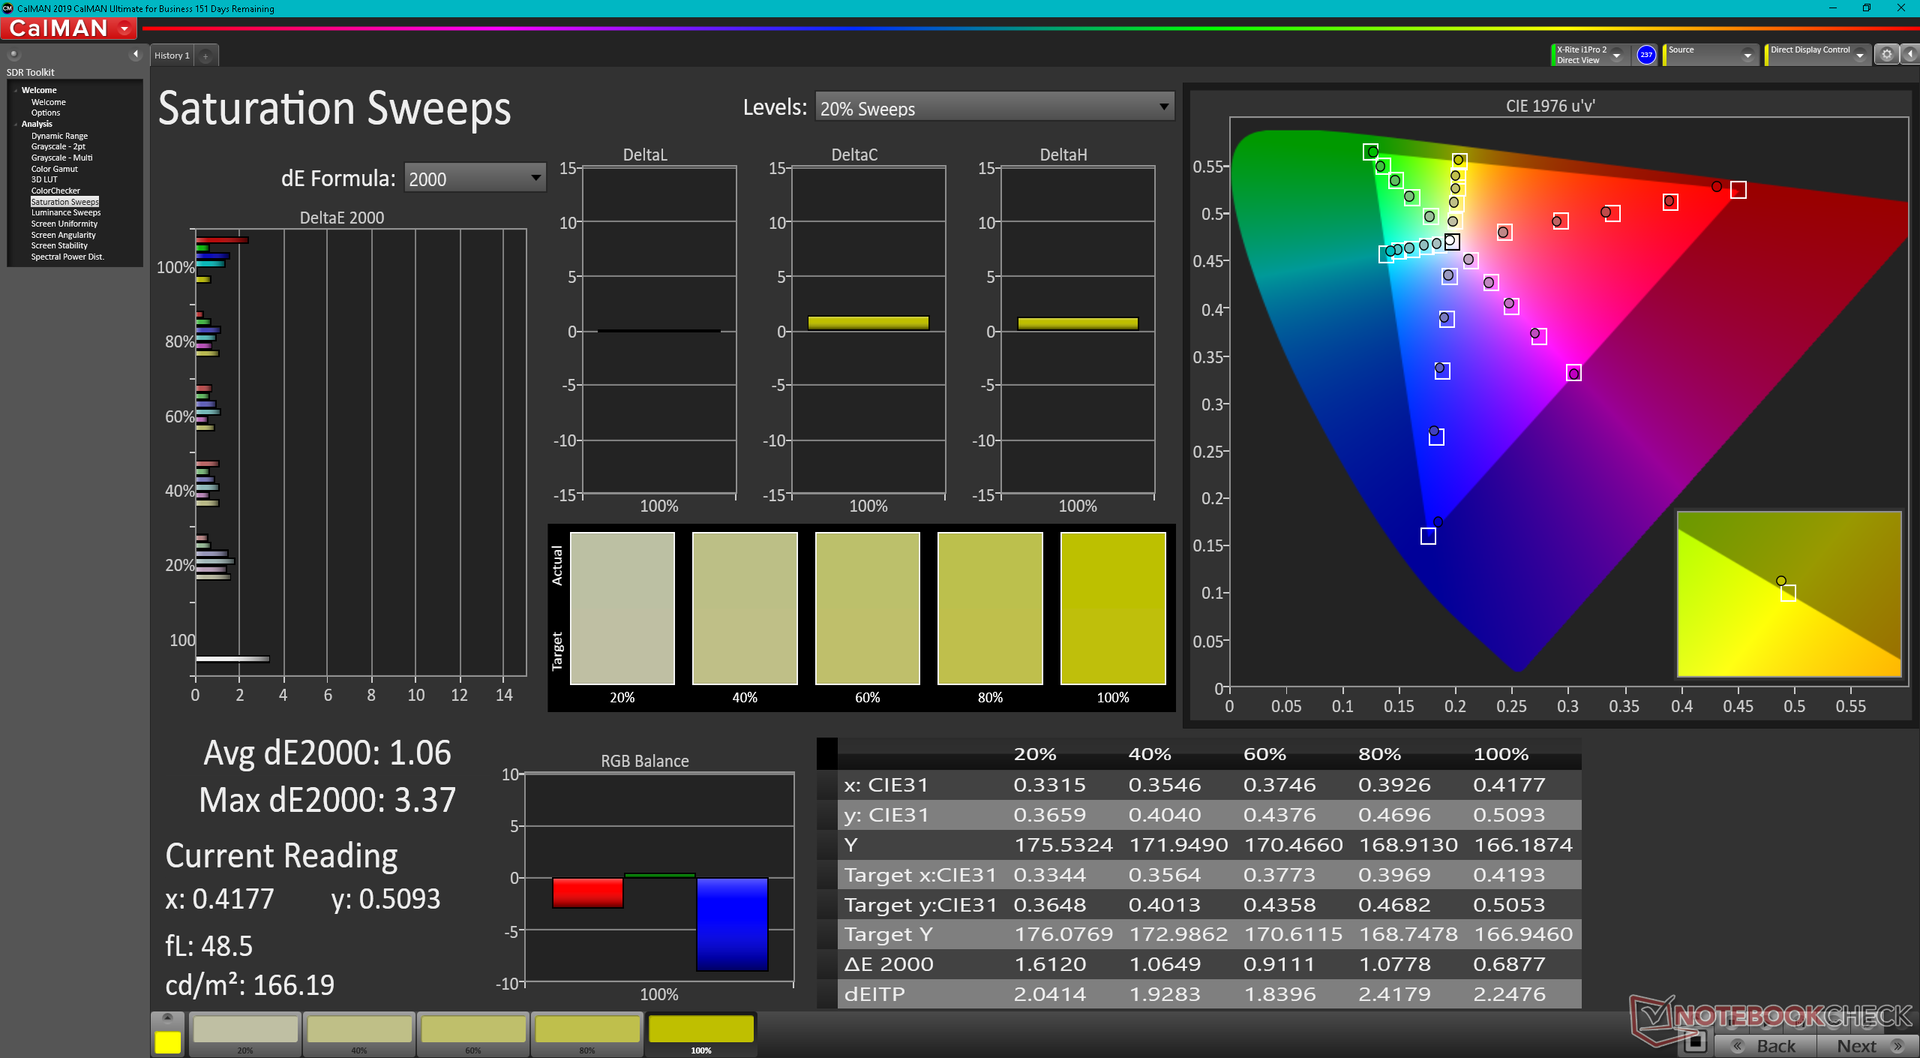
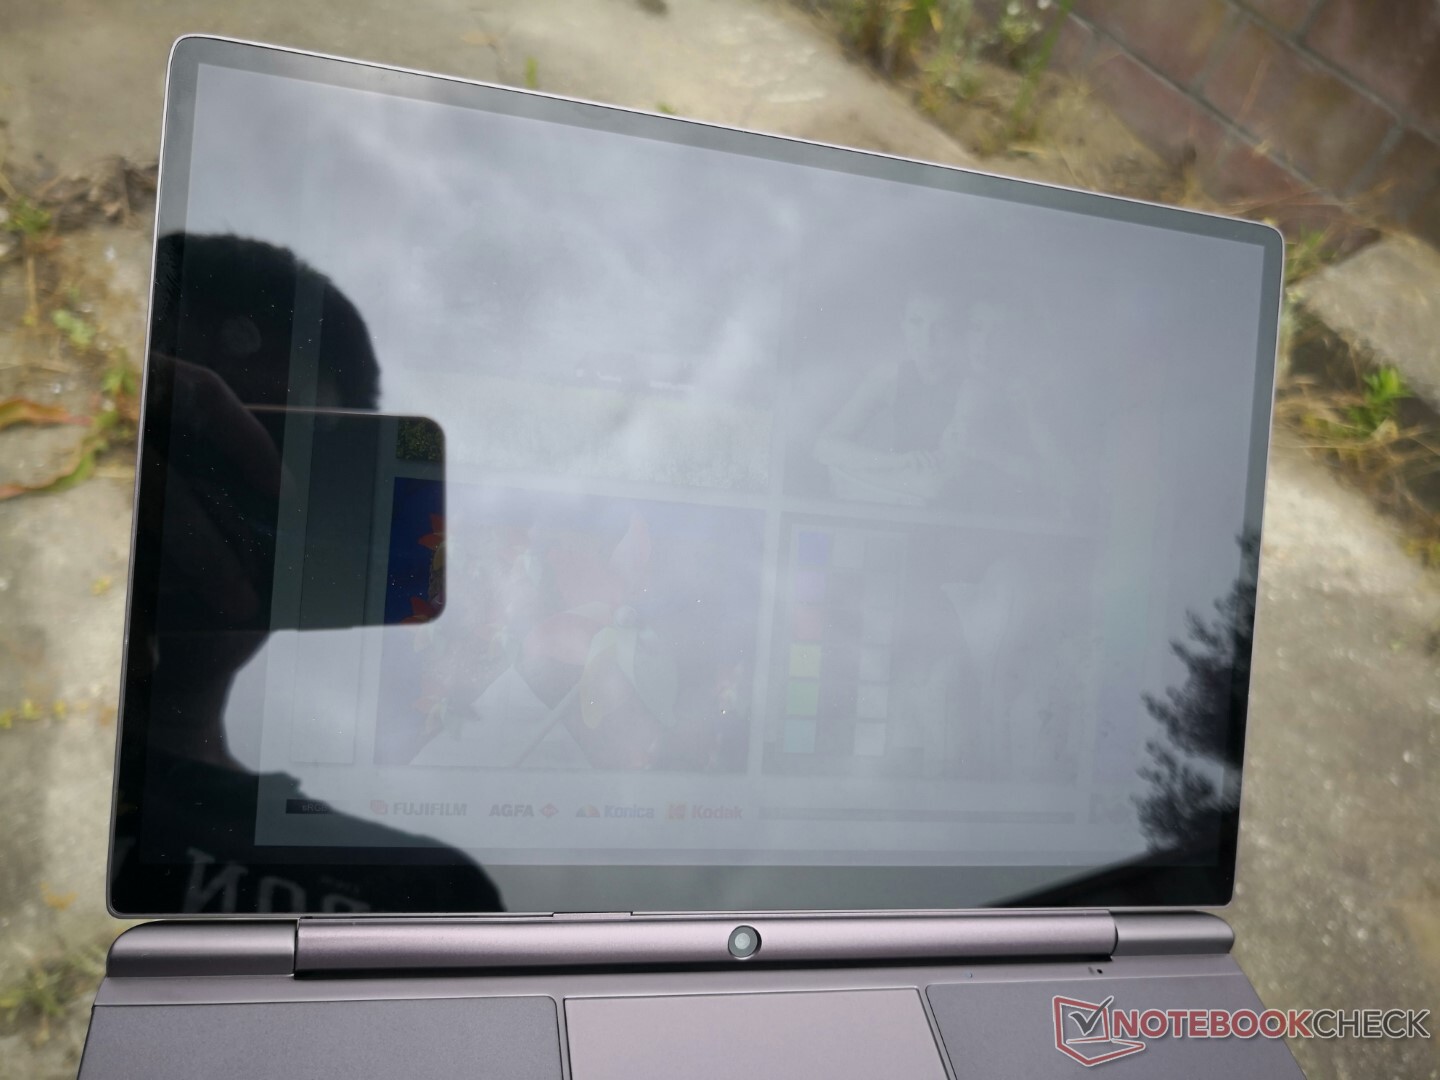
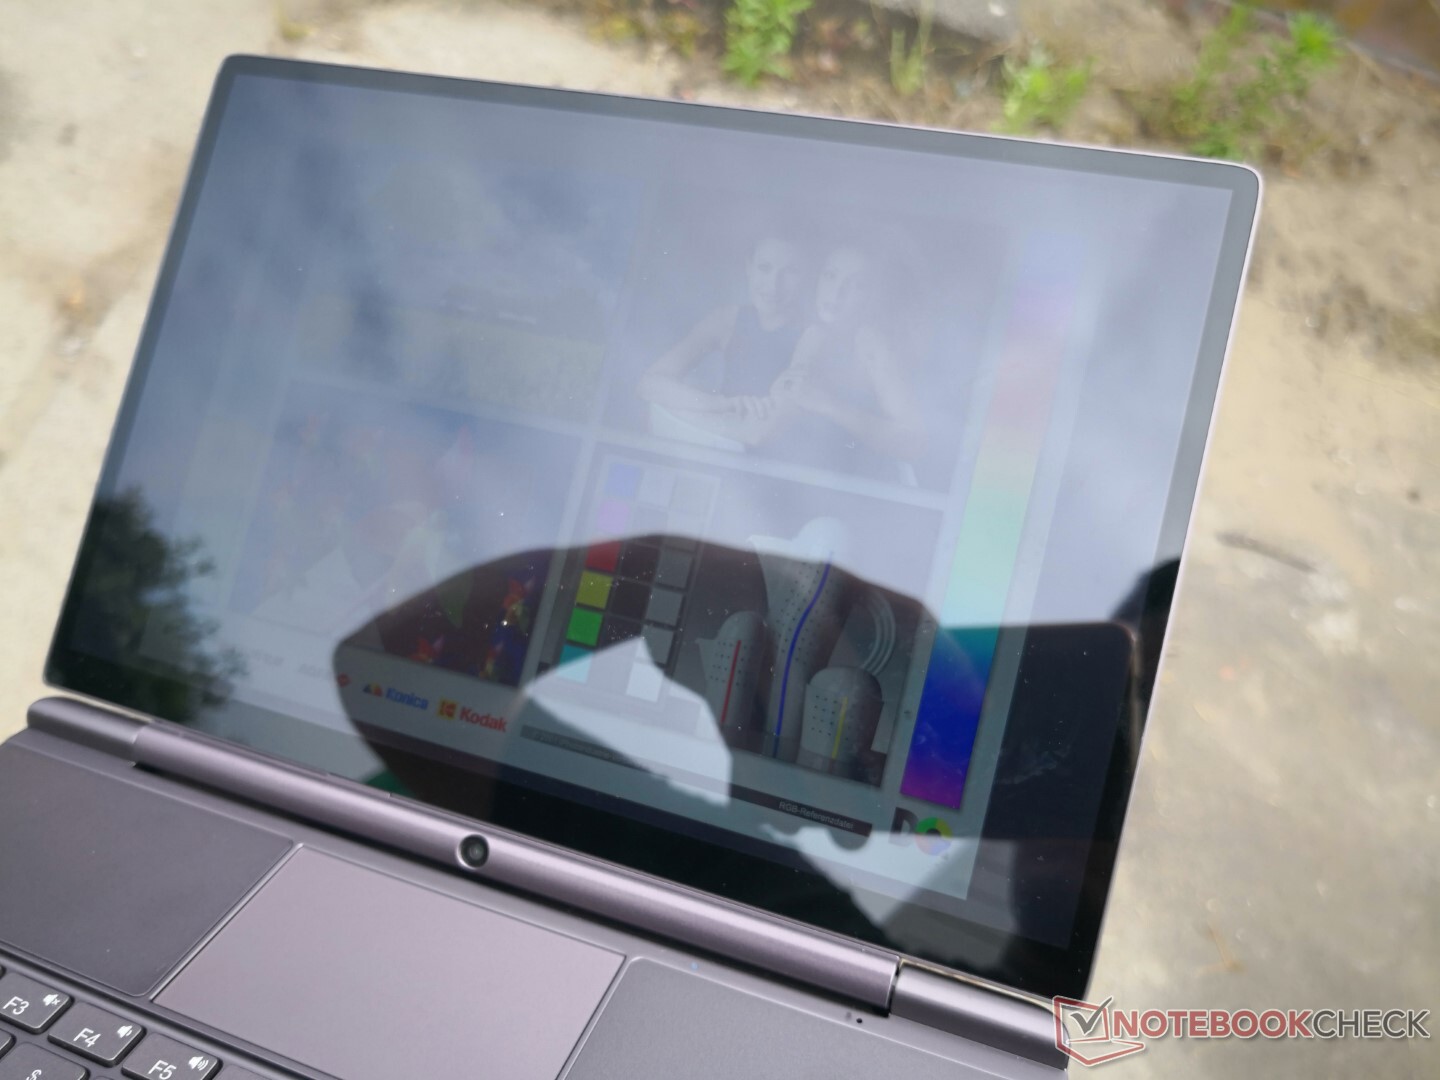
Beeldscherm - Hoge resolutie met sRGB-kleuren
Het 10,1-inch aanraakscherm is opnieuw een enorme verbetering ten opzichte van het 8-inch scherm op de 2021 Win Max. Niet alleen zijn de randen smaller, maar het paneel biedt zowel betere kleuren als snellere zwart-wit responstijden voor een kijkervaring van hogere kwaliteit. Contrast en verversingssnelheid zijn echter niet veranderd. Het zou geweldig zijn om 90 Hz of 120 Hz opties te zien naast adaptieve synchronisatie ondersteuning op toekomstige modellen
Hoewel het beeldscherm zeer scherp is in de eigen resolutie van 2560 x 1600, moet je er rekening mee houden dat de geïntegreerde GPU niet krachtig genoeg is om de meeste titels in dergelijke hoge resoluties vloeiend uit te voeren.


| |||||||||||||||||||||||||
Helderheidsverdeling: 89 %
Helderheid in Batterij-modus: 396.7 cd/m²
Contrast: 1102:1 (Zwart: 0.36 cd/m²)
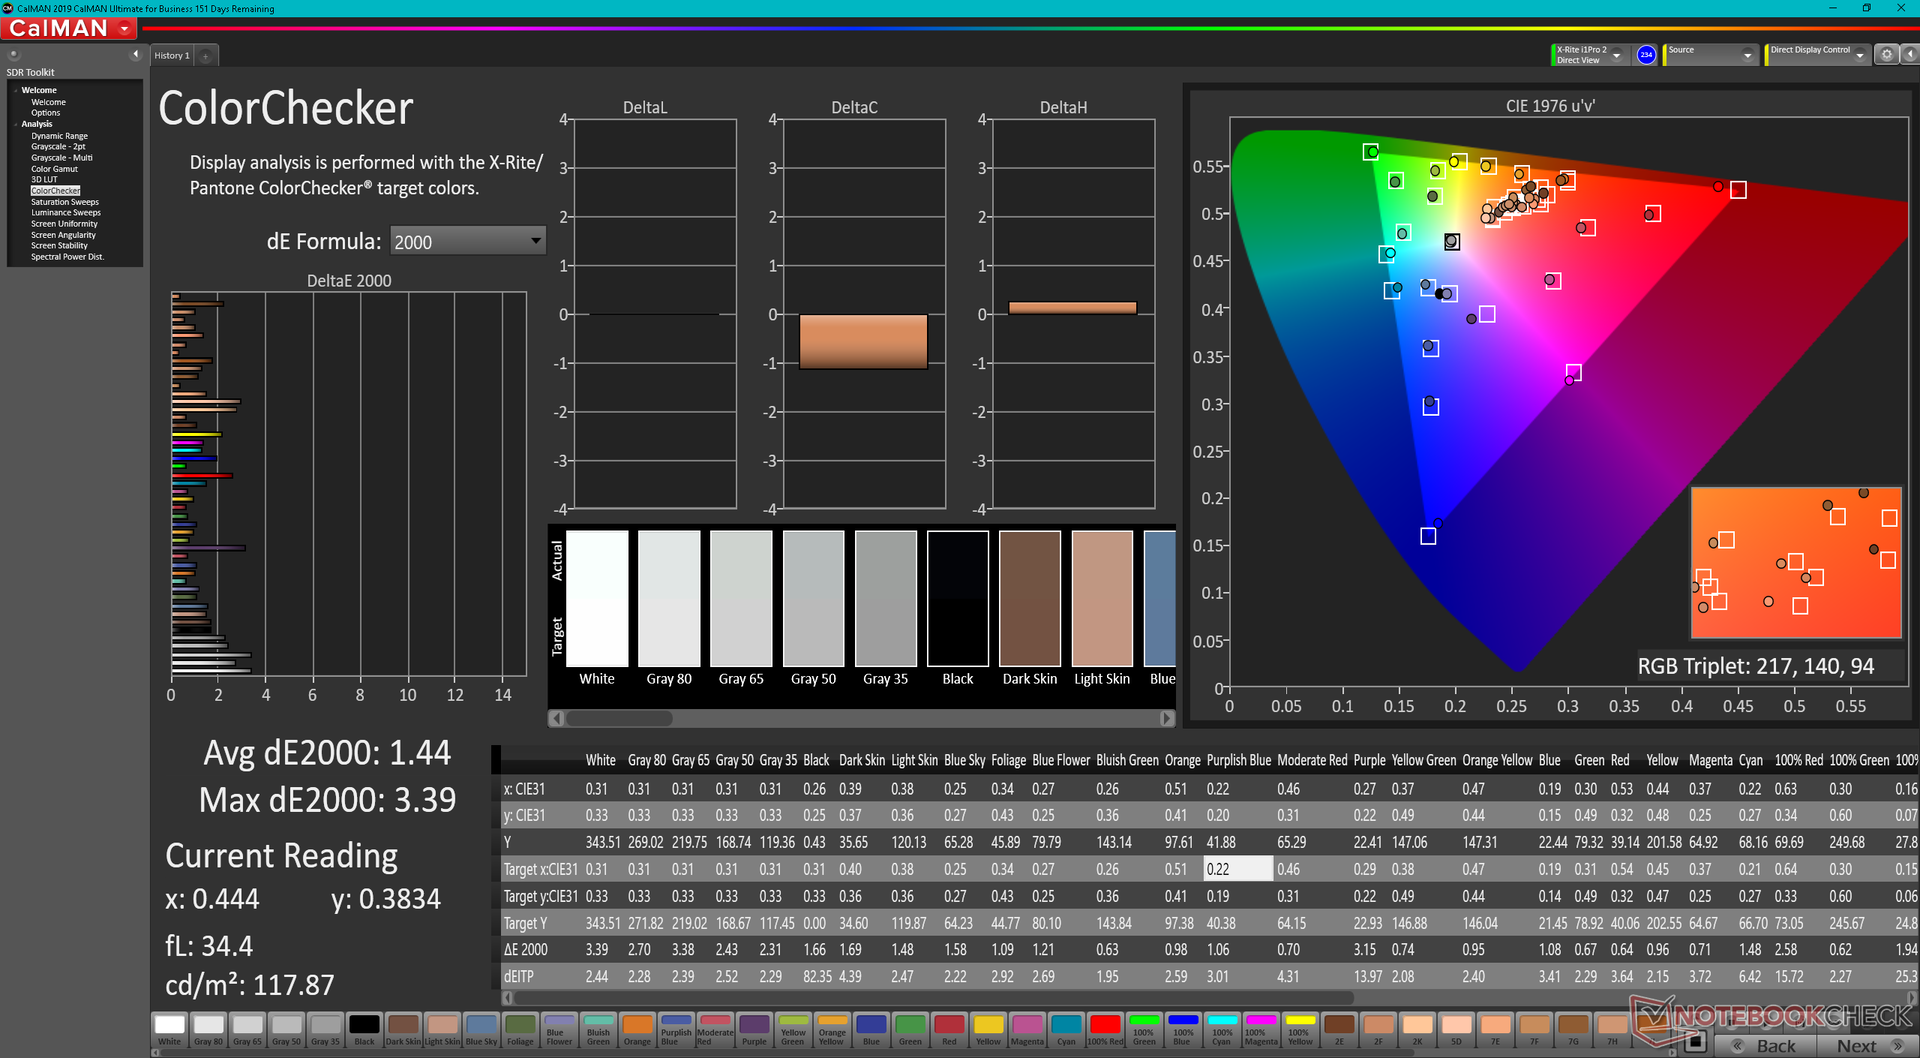
ΔE ColorChecker Calman: 6.31 | ∀{0.5-29.43 Ø4.71}
calibrated: 1.44
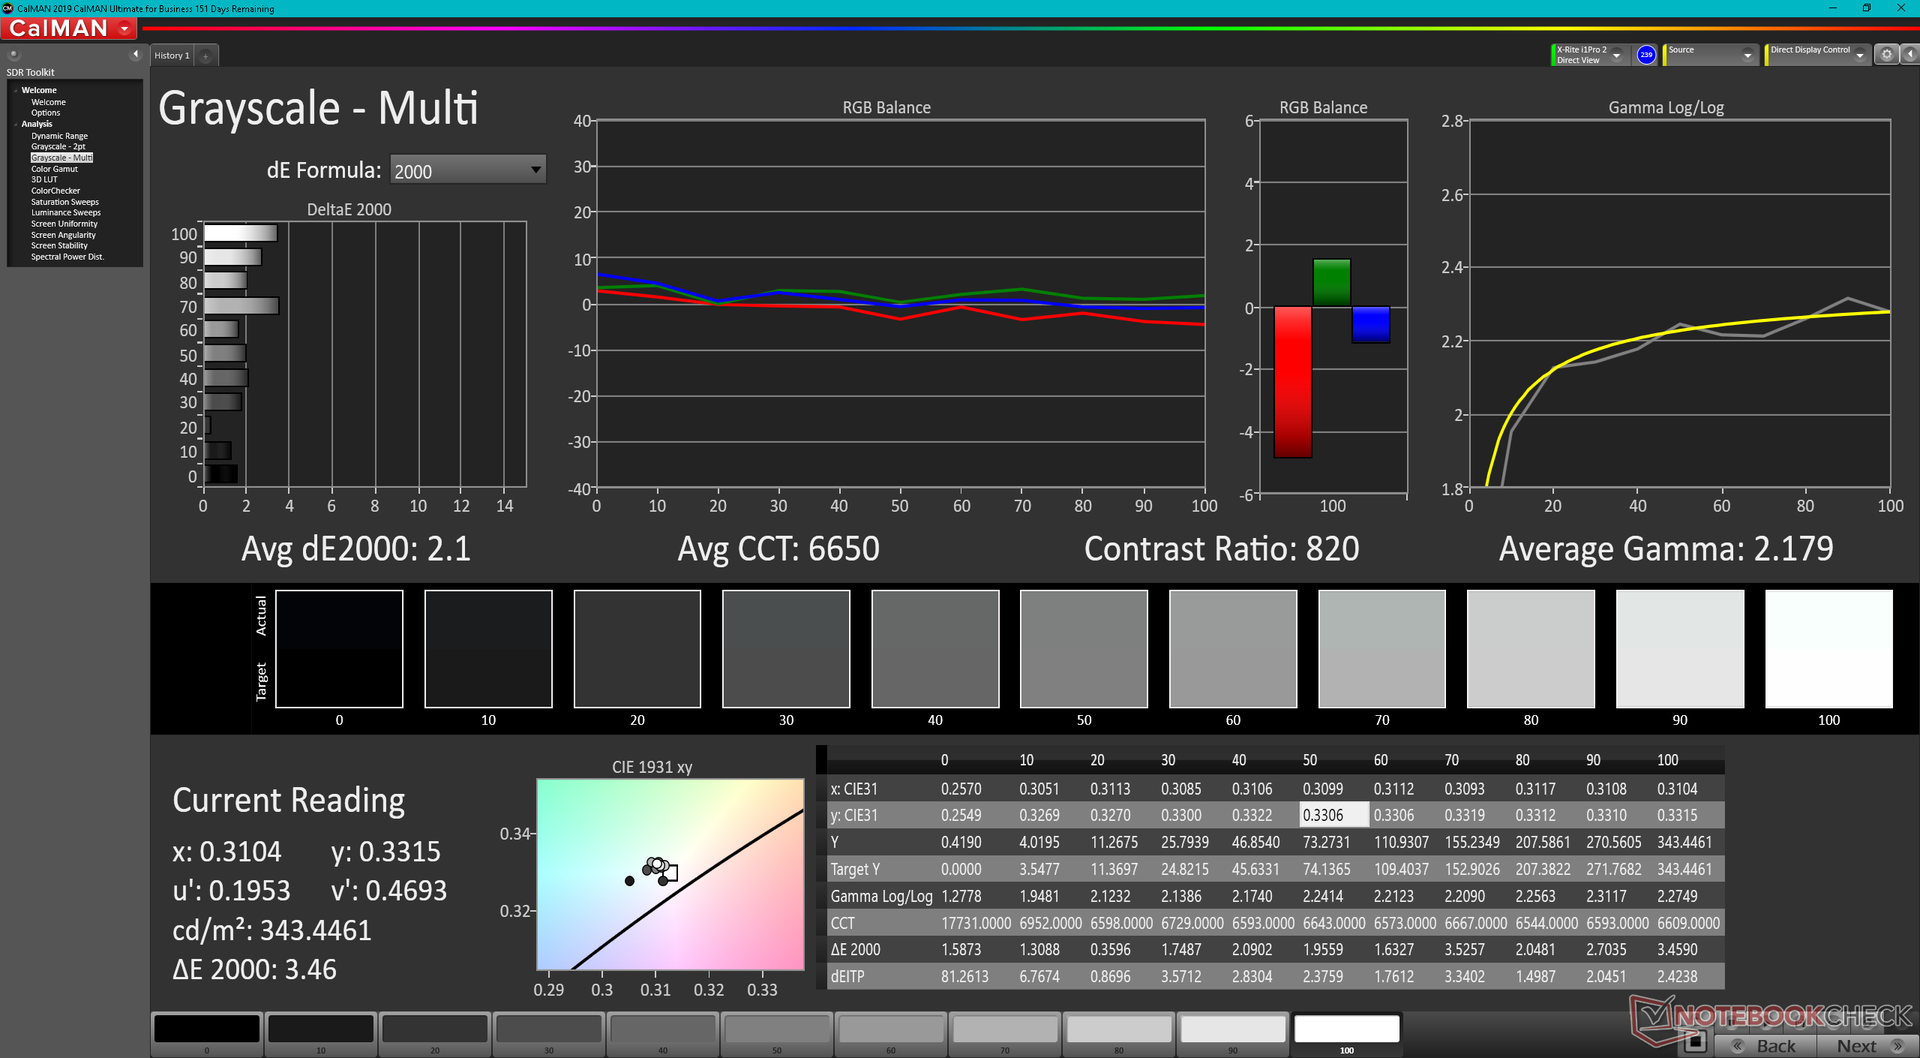
ΔE Greyscale Calman: 5.5 | ∀{0.09-98 Ø4.96}
66.6% AdobeRGB 1998 (Argyll 3D)
91% sRGB (Argyll 3D)
69.8% Display P3 (Argyll 3D)
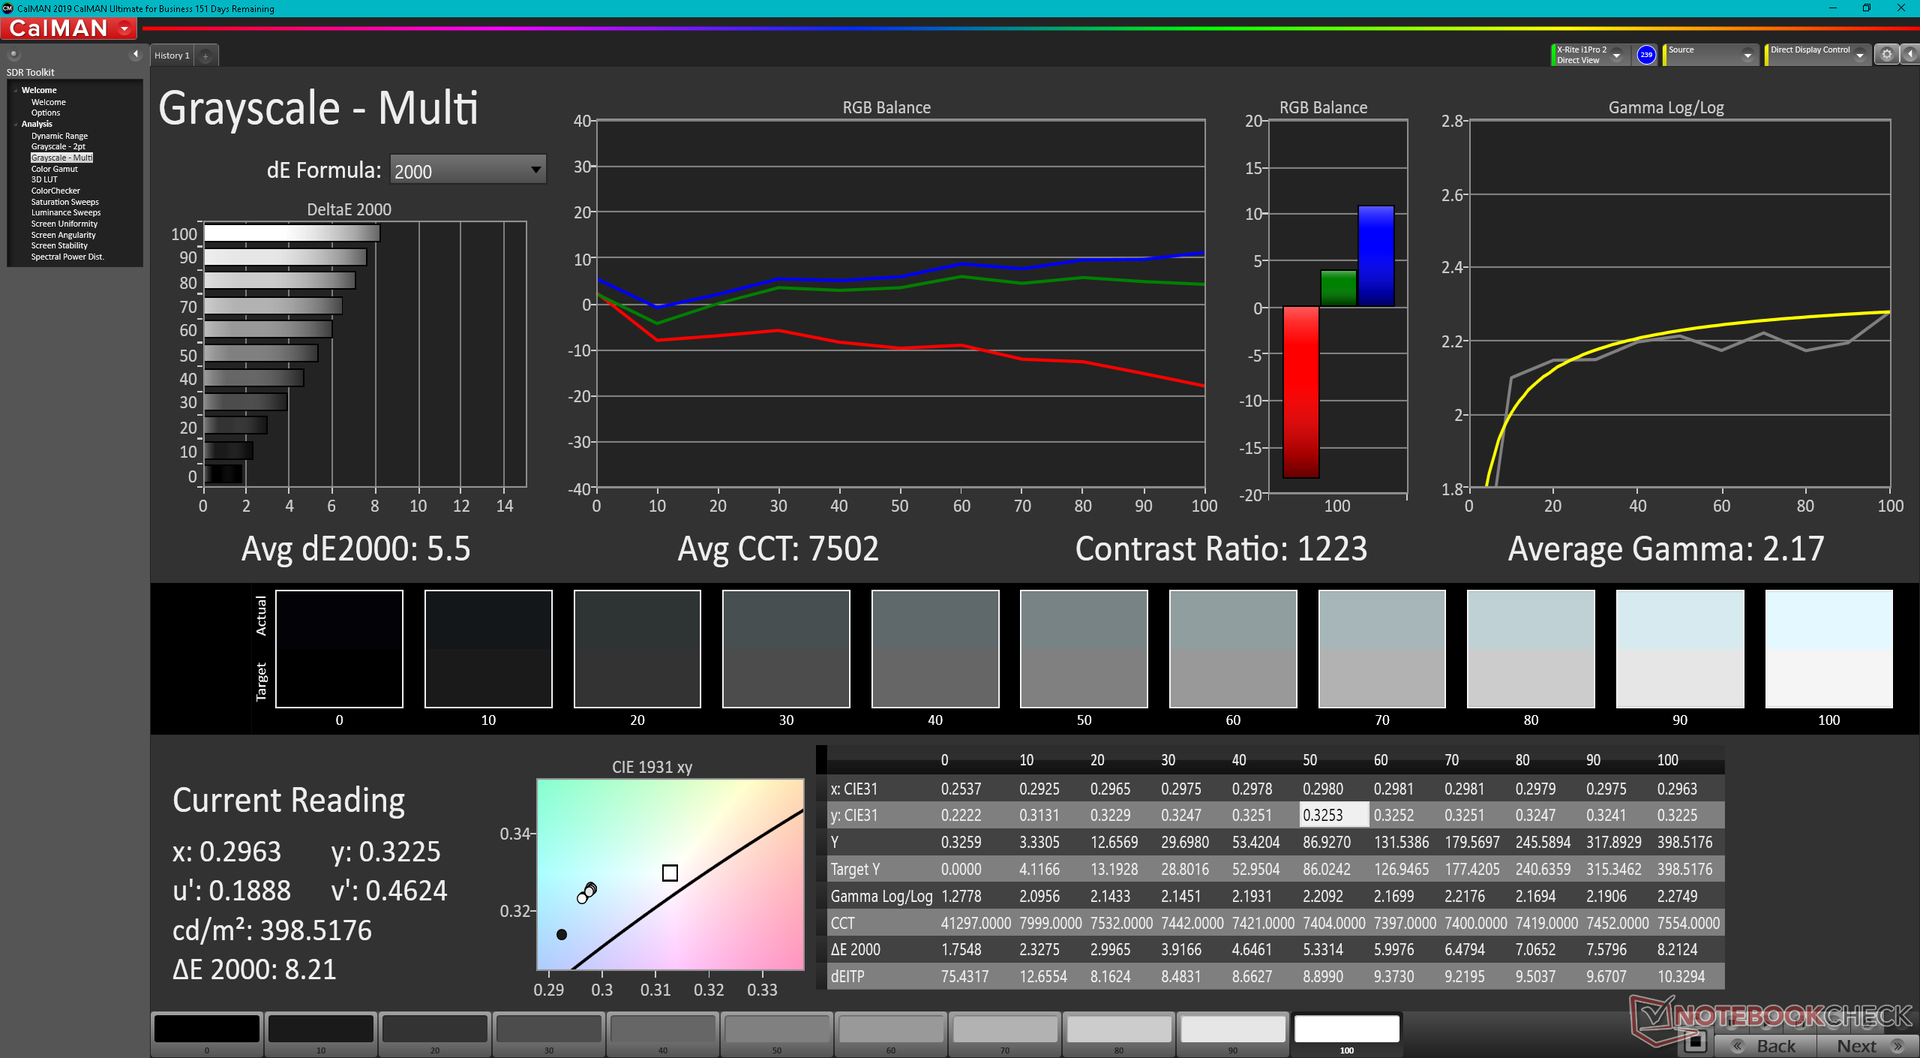
Gamma: 2.17
CCT: 7502 K
| GPD Win Max 2 Toshiba HX_10.1_LCD, IPS, 2560x1600, 10.1" | GPD Pocket 3 Digital Flat Panel, IPS, 1920x1200, 8" | GPD Win Max 2021 LT7911D, IPS, 1280x800, 8" | GPD Win 3 IPS, 1280x720, 5.5" | Microsoft Surface Go 3 Core i3 NV105WAM-N31, IPS , 1920x1280, 10.5" | Lenovo IdeaPad Flex 3 11IGL05 N116BCA-EA1, IPS LED, 1366x768, 11.6" | |
|---|---|---|---|---|---|---|
| Display | -22% | -30% | -8% | 4% | -30% | |
| Display P3 Coverage (%) | 69.8 | 51.1 -27% | 47.2 -32% | 59.5 -15% | 69 -1% | 45.35 -35% |
| sRGB Coverage (%) | 91 | 74.7 -18% | 65.2 -28% | 89.6 -2% | 99.1 9% | 67.7 -26% |
| AdobeRGB 1998 Coverage (%) | 66.6 | 52.8 -21% | 47.6 -29% | 61.4 -8% | 69.8 5% | 46.93 -30% |
| Response Times | -71% | -135% | -63% | -49% | -57% | |
| Response Time Grey 50% / Grey 80% * (ms) | 21.2 ? | 37.2 ? -75% | 56.8 ? -168% | 40 ? -89% | 37.2 ? -75% | 38 ? -79% |
| Response Time Black / White * (ms) | 18.7 ? | 31.2 ? -67% | 37.6 ? -101% | 25.6 ? -37% | 22.8 ? -22% | 25 ? -34% |
| PWM Frequency (Hz) | 201.6 ? | 962 ? | 250 ? | |||
| Screen | -13% | -34% | -24% | 36% | -9% | |
| Brightness middle (cd/m²) | 396.7 | 438.4 11% | 374.6 -6% | 468.8 18% | 418 5% | 270 -32% |
| Brightness (cd/m²) | 381 | 421 10% | 361 -5% | 460 21% | 415 9% | 259 -32% |
| Brightness Distribution (%) | 89 | 92 3% | 92 3% | 93 4% | 90 1% | 76 -15% |
| Black Level * (cd/m²) | 0.36 | 0.4 -11% | 0.45 -25% | 0.45 -25% | 0.28 22% | 0.195 46% |
| Contrast (:1) | 1102 | 1096 -1% | 832 -25% | 1042 -5% | 1493 35% | 1385 26% |
| Colorchecker dE 2000 * | 6.31 | 5.02 20% | 6.21 2% | 9 -43% | 1.2 81% | 3.98 37% |
| Colorchecker dE 2000 max. * | 10.23 | 9.59 6% | 9.89 3% | 15.5 -52% | 2.6 75% | 8.46 17% |
| Colorchecker dE 2000 calibrated * | 1.44 | 4.05 -181% | 5.4 -275% | 1.91 -33% | 1 31% | 4 -178% |
| Greyscale dE 2000 * | 5.5 | 4 27% | 4.5 18% | 10.9 -98% | 1.8 67% | 2.57 53% |
| Gamma | 2.17 101% | 2.29 96% | 2.49 88% | 2.13 103% | 2.21 100% | 2.3 96% |
| CCT | 7502 87% | 7087 92% | 6726 97% | 10972 59% | 6225 104% | 6332 103% |
| Color Space (Percent of AdobeRGB 1998) (%) | 56.6 | 43 | ||||
| Color Space (Percent of sRGB) (%) | 89.2 | 67 | ||||
| Totaal Gemiddelde (Programma / Instellingen) | -35% /
-23% | -66% /
-48% | -32% /
-26% | -3% /
17% | -32% /
-20% |
* ... kleiner is beter
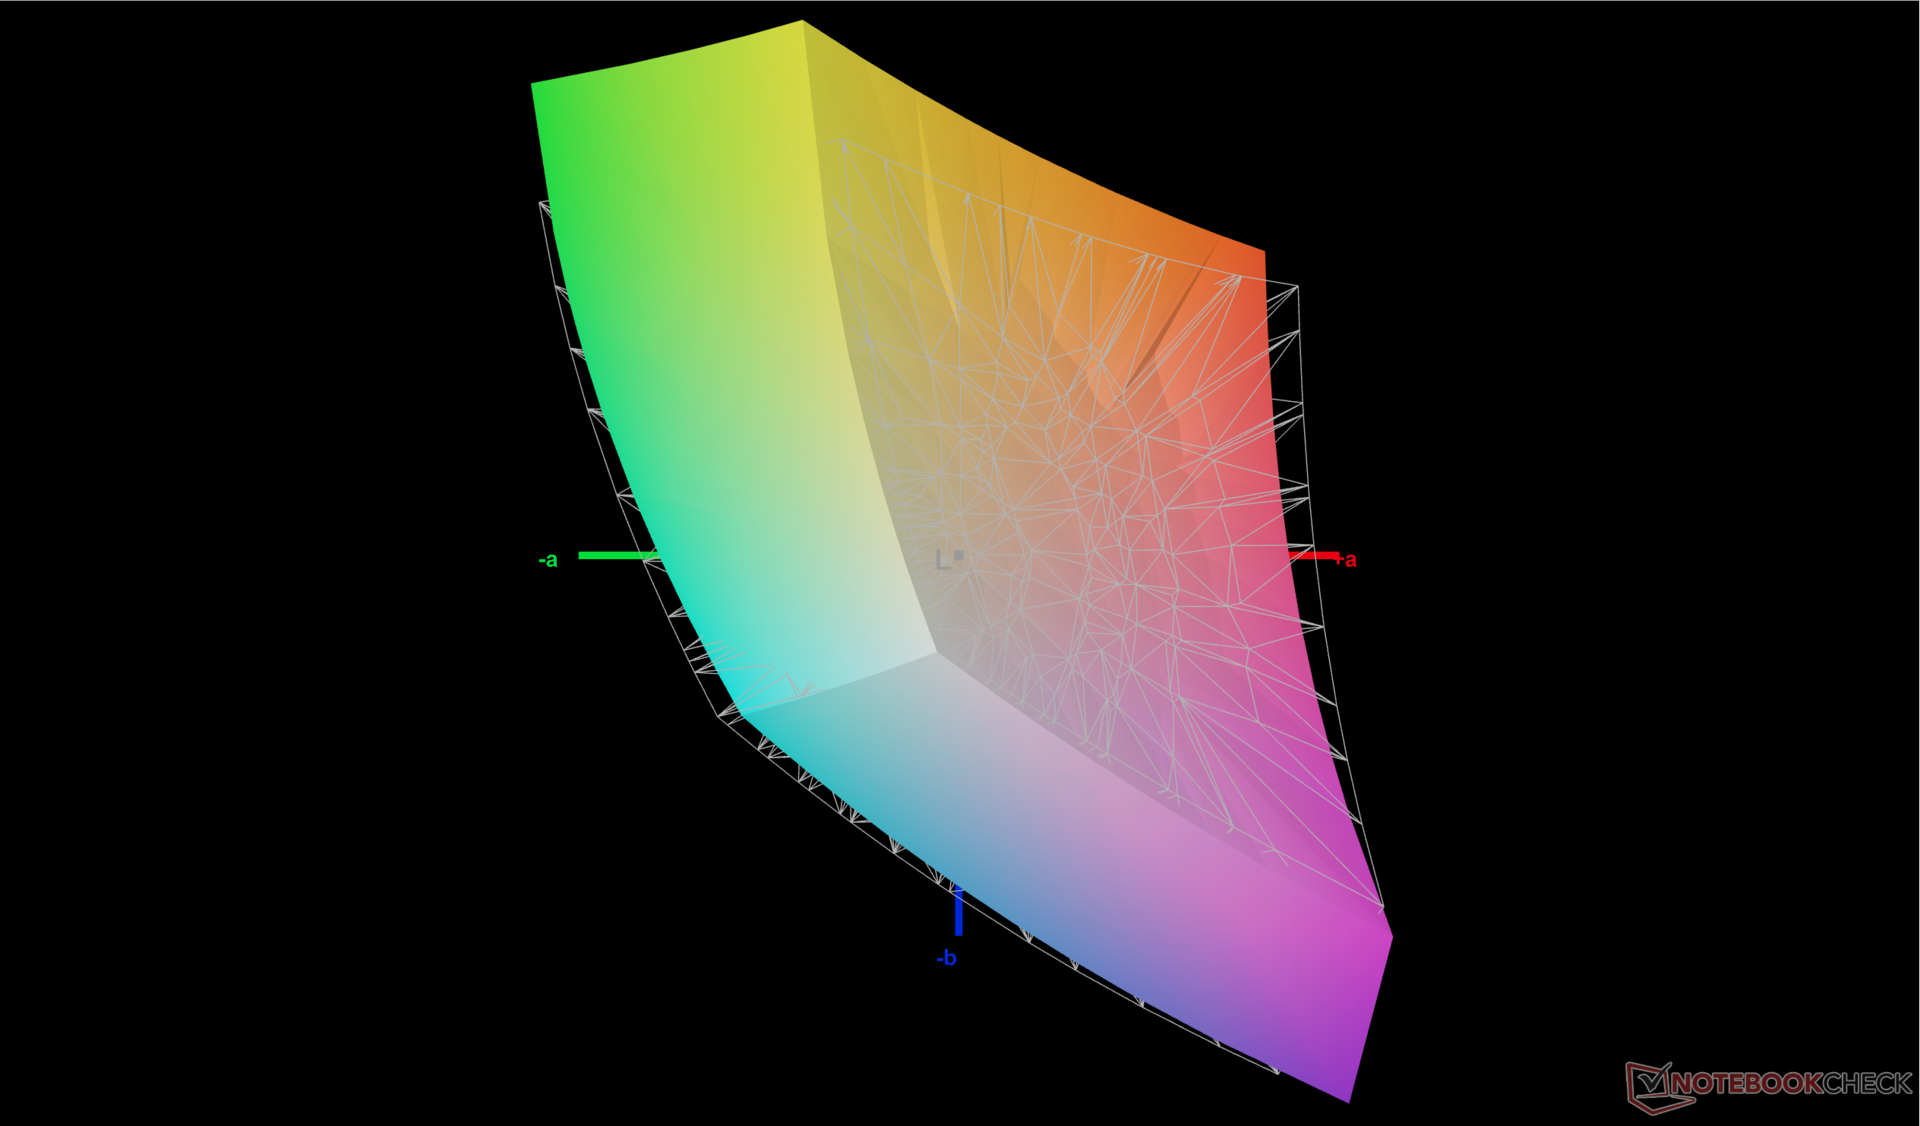
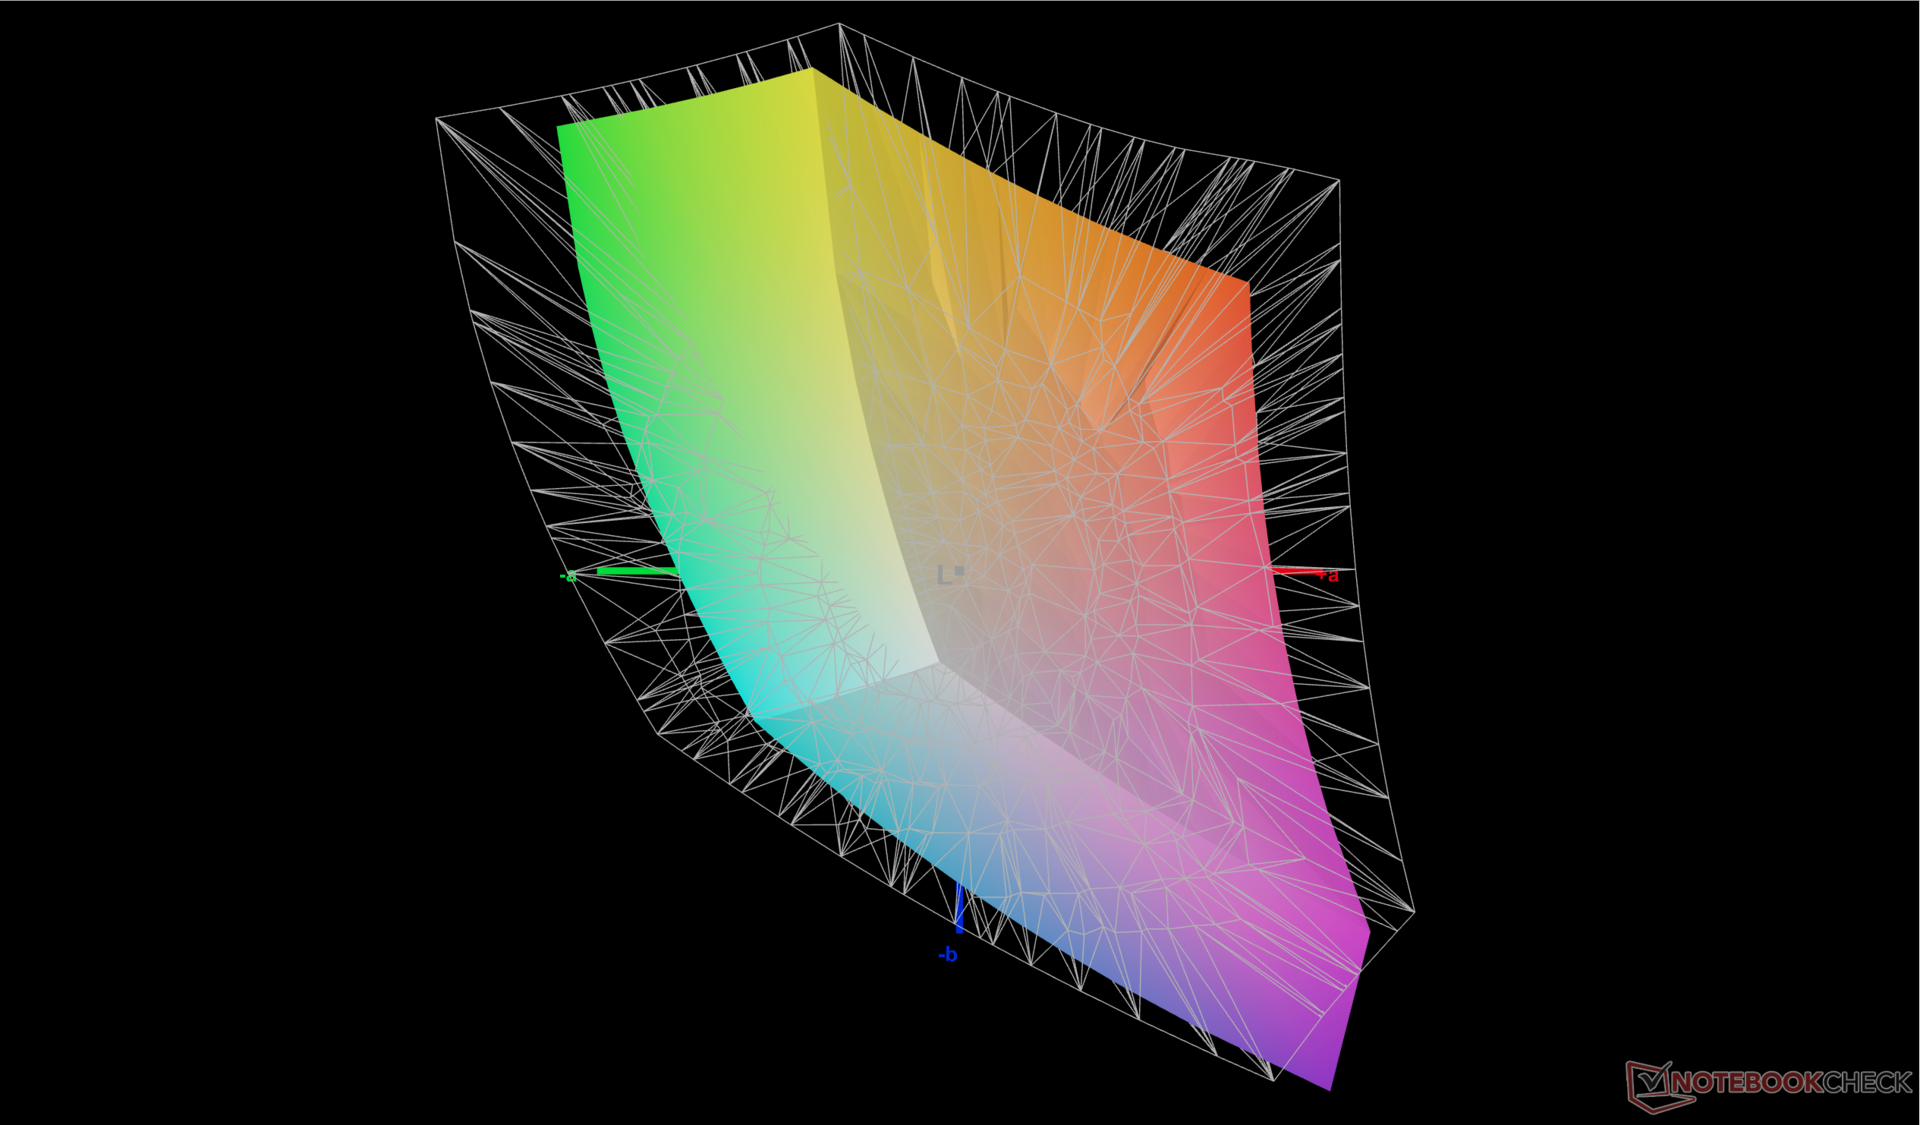
Het scherm is niet erg goed gekalibreerd uit de doos, wat jammer is gezien de relatief brede >90 procent sRGB-dekking. De standaard gemiddelde grijswaarden en kleuren DeltaE-waarden van 5,5 en 6,31 zouden verbeteren tot slechts 2,1 en 1,44, respectievelijk, nadat we het paneel zelf hadden gekalibreerd. Wij raden aan ons gekalibreerde ICM-profiel hierboven toe te passen om nauwkeurigere kleuren uit het beeldscherm te halen.
Responstijd Scherm
| ↔ Responstijd Zwart naar Wit | ||
|---|---|---|
| 18.7 ms ... stijging ↗ en daling ↘ gecombineerd | ↗ 9.1 ms stijging | 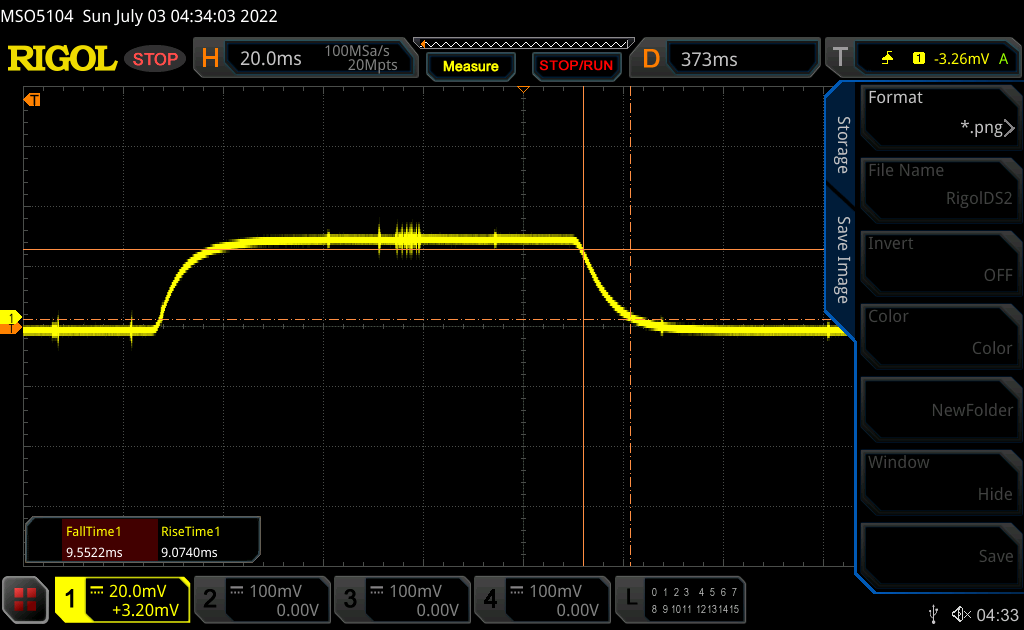 |
| ↘ 9.6 ms daling | ||
| Het scherm vertoonde prima responstijden in onze tests maar is misschien wat te traag voor competitieve games. Ter vergelijking: alle testtoestellen variëren van 0.1 (minimum) tot 240 (maximum) ms. » 42 % van alle toestellen zijn beter. Dit betekent dat de gemeten responstijd vergelijkbaar is met het gemiddelde (19.8 ms) van alle geteste toestellen. | ||
| ↔ Responstijd 50% Grijs naar 80% Grijs | ||
| 21.2 ms ... stijging ↗ en daling ↘ gecombineerd | ↗ 9.5 ms stijging | 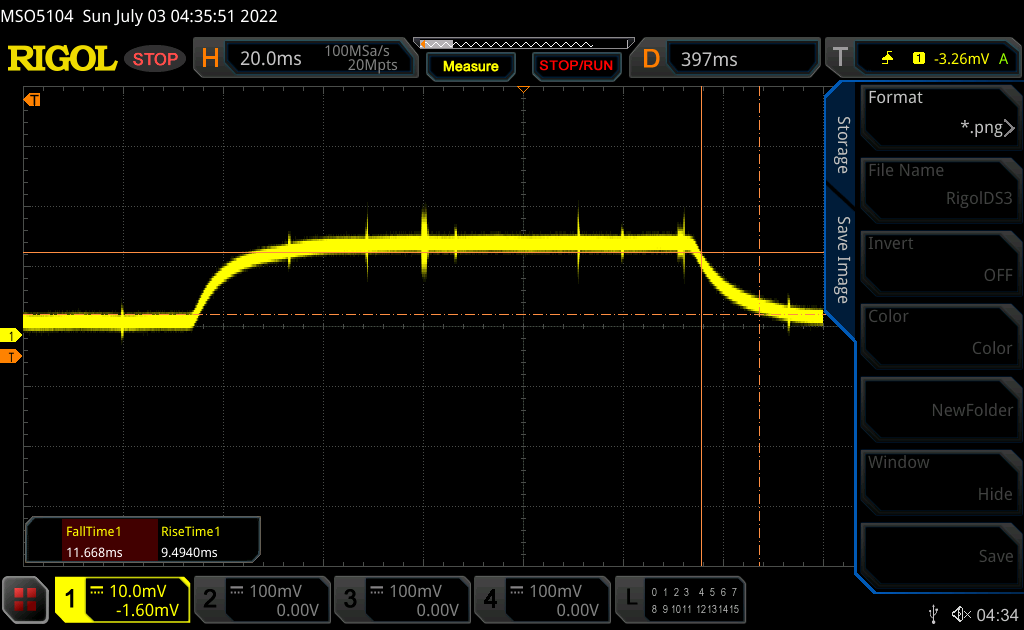 |
| ↘ 11.7 ms daling | ||
| Het scherm vertoonde prima responstijden in onze tests maar is misschien wat te traag voor competitieve games. Ter vergelijking: alle testtoestellen variëren van 0.165 (minimum) tot 636 (maximum) ms. » 33 % van alle toestellen zijn beter. Dit betekent dat de gemeten responstijd beter is dan het gemiddelde (31 ms) van alle geteste toestellen. | ||
Screen Flickering / PWM (Pulse-Width Modulation)
| Screen flickering / PWM niet waargenomen | 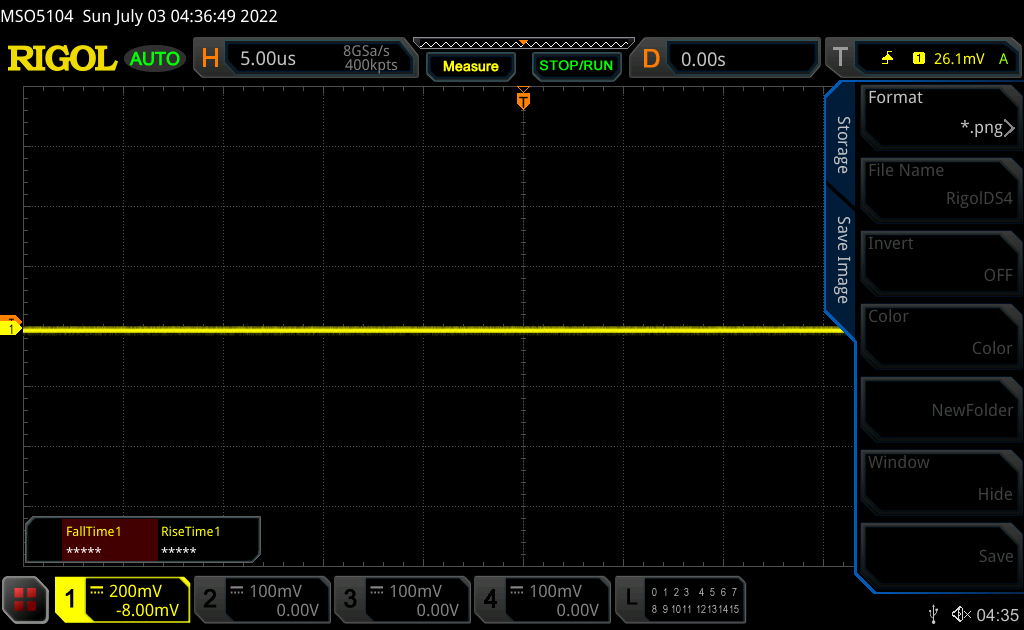 | ||
Ter vergelijking: 52 % van alle geteste toestellen maakten geen gebruik van PWM om de schermhelderheid te verlagen. Als het wel werd gebruikt, werd een gemiddelde van 7754 (minimum: 5 - maximum: 343500) Hz waargenomen. | |||
Met maximaal 400 nits is het scherm helder genoeg om comfortabel te bekijken in de schaduw. Feller omgevingslicht doet de kleuren vervagen of veroorzaakt een te sterke schittering op het glanzende aanraakscherm.


Prestaties - Rood of Blauw?
Testomstandigheden
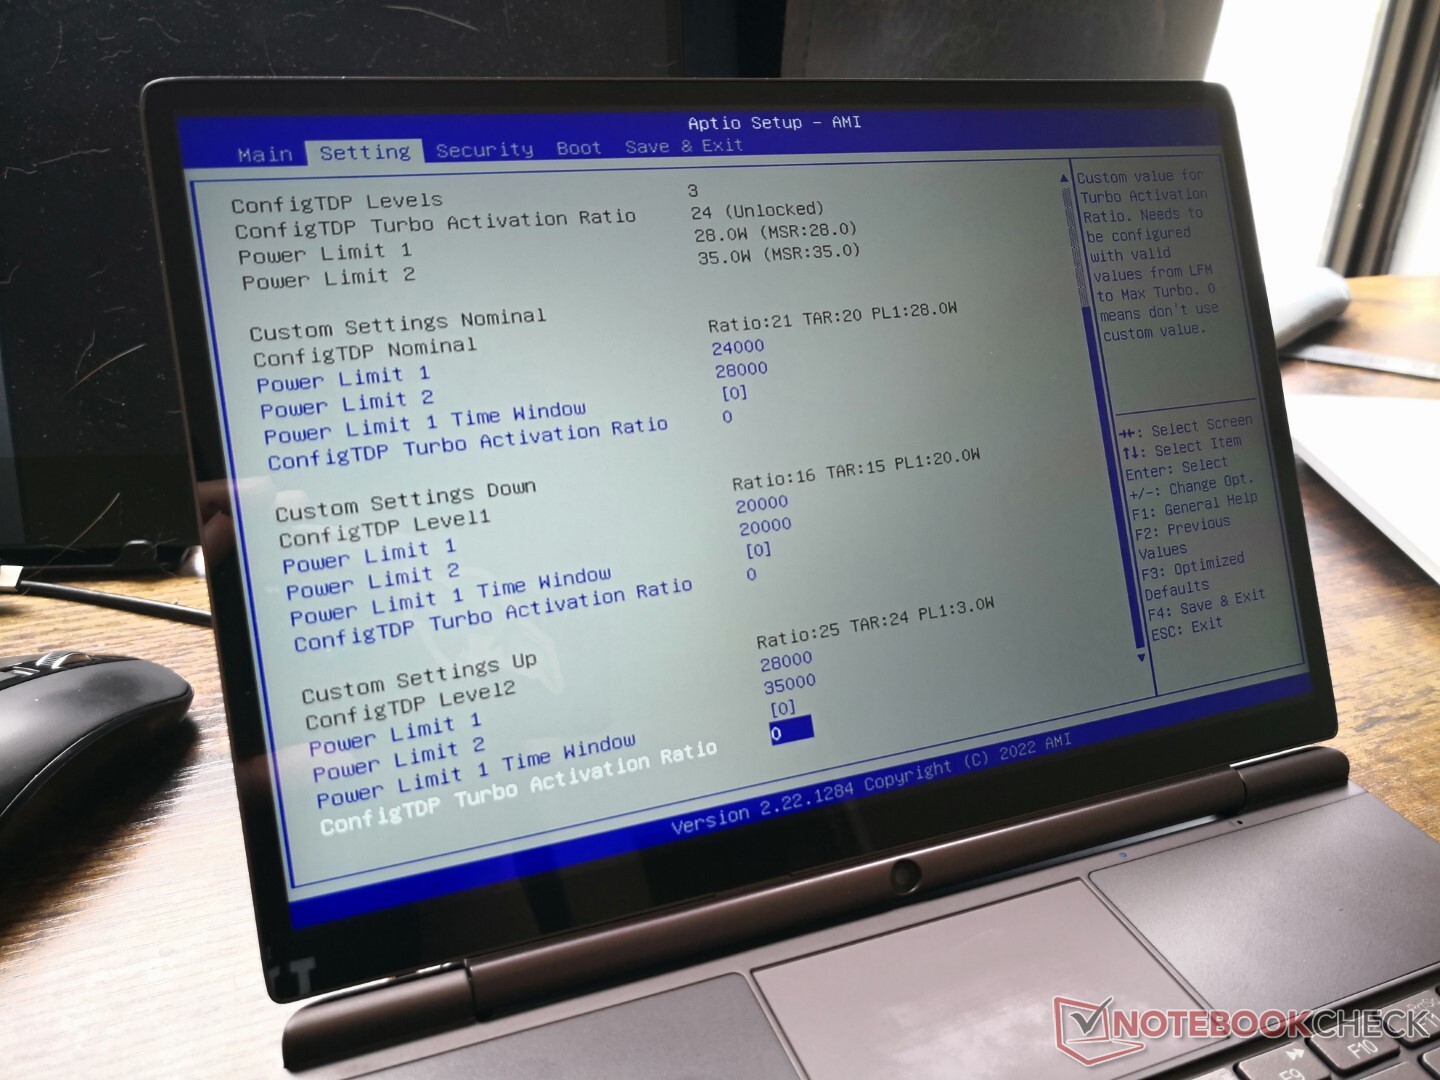
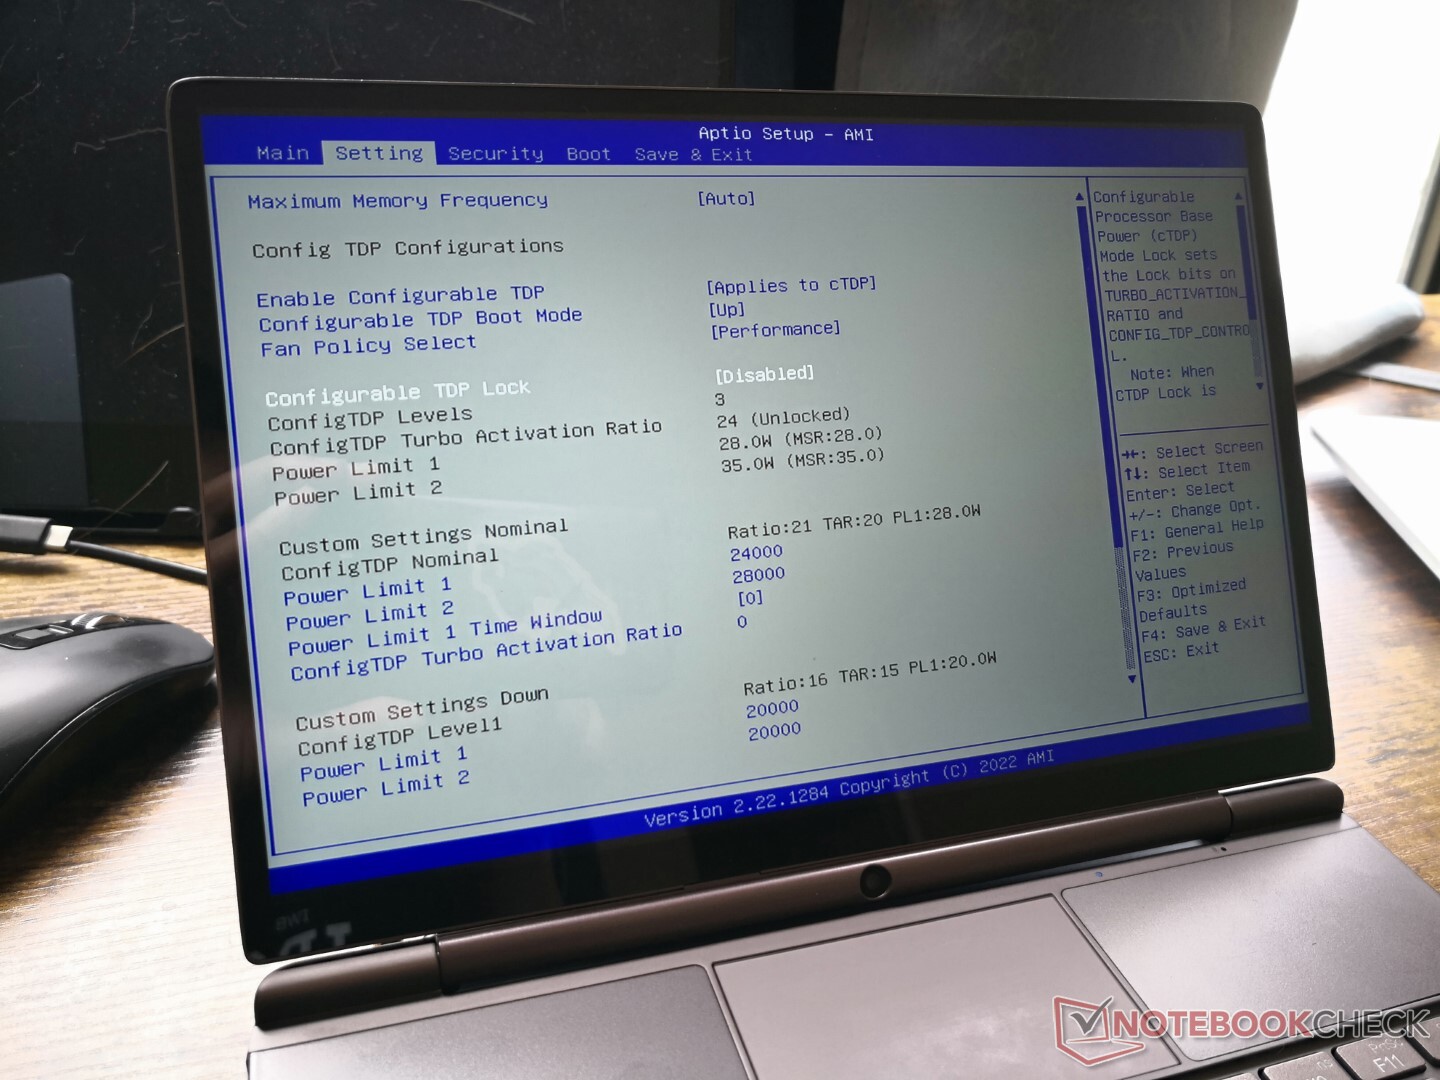
Net als bij andere GPD producten, biedt het BIOS scherm configureerbare TDP instellingen. De drie vooringestelde modi zijn Nominaal, Omlaag en Omhoog, elk met verschillende niveaus van PL1 en PL2 doelen zoals hieronder beschreven
- Nominaal: PL1=24 W, PL2=28 W
- Neer: PL1=20 W, PL2=20 W
- Omhoog: PL1=28 W, PL2=35 W
We hebben onze unit ingesteld op de Up voorinstelling en de Fan Policy op Performance voordat we onderstaande prestatiebenchmarks gingen uitvoeren. We hebben ook de "Turbo" instelling op het toetsenbord ingeschakeld en ervoor gezorgd dat Windows ook op Prestatiemodus stond.
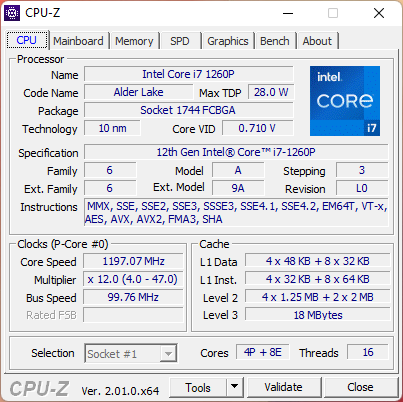
Processor
Multi-thread CPU-prestaties zijn ruwweg 15 procent langzamer dan de gemiddelde laptop in onze database die is uitgerust met dezelfde Core i7-1260P processor. Omgekeerd zijn de single-thread prestaties ruwweg 10 tot 15 sneller dan het gemiddelde. Er is zeker een gevoel dat de Win Max 2 niet volledig gebruik maakt van de mogelijkheden van Intel's nieuwe 12e gen CPU in dit opzicht, maar het is nog steeds aanzienlijk sneller dan de oudere 11e gen CPU-opties zoals te vinden op de GPD Win 3 of Pocket 3 met 50 procent of meer. Als u wilt dat het beste dat de Core i7-1260P te bieden heeft, echter, dan wilt u misschien in plaats daarvan kijken naar volwaardige laptops zoals de Dell Inspiron 16 7620 2-in-1 waarop dezelfde CPU tot 40 procent sneller kan draaien.
Veel AMD Zen 3 CPU's bieden iets snellere multi-thread prestaties, maar langzamere single-thread prestaties dan onze Core i7-1260P in de Win Max 2, waaronder deRyzen 5 5500U, Ryzen 7 5700U, of zelfs de oudere Zen 2 Ryzen 7 4800U. Kiezen voor de Ryzen 7 6800U SKU zal de multi-thread prestaties met 50 procent verhogen, terwijl de single-thread prestaties met bijna 20 procent zullen dalen.
Cinebench R15 Multi Loop
Cinebench R23: Multi Core | Single Core
Cinebench R15: CPU Multi 64Bit | CPU Single 64Bit
Blender: v2.79 BMW27 CPU
7-Zip 18.03: 7z b 4 | 7z b 4 -mmt1
Geekbench 5.5: Multi-Core | Single-Core
HWBOT x265 Benchmark v2.2: 4k Preset
LibreOffice : 20 Documents To PDF
R Benchmark 2.5: Overall mean
Cinebench R23: Multi Core | Single Core
Cinebench R15: CPU Multi 64Bit | CPU Single 64Bit
Blender: v2.79 BMW27 CPU
7-Zip 18.03: 7z b 4 | 7z b 4 -mmt1
Geekbench 5.5: Multi-Core | Single-Core
HWBOT x265 Benchmark v2.2: 4k Preset
LibreOffice : 20 Documents To PDF
R Benchmark 2.5: Overall mean
* ... kleiner is beter
AIDA64: FP32 Ray-Trace | FPU Julia | CPU SHA3 | CPU Queen | FPU SinJulia | FPU Mandel | CPU AES | CPU ZLib | FP64 Ray-Trace | CPU PhotoWorxx
| Performance rating | |
| GPD Win Max 2021 | |
| Gemiddeld Intel Core i7-1260P | |
| Lenovo Yoga 9 14IAP7 82LU0001US | |
| GPD Win Max 2 | |
| GPD Pocket 3 | |
| AIDA64 / FP32 Ray-Trace | |
| GPD Win Max 2021 | |
| Gemiddeld Intel Core i7-1260P (2176 - 10898, n=26) | |
| Lenovo Yoga 9 14IAP7 82LU0001US | |
| GPD Pocket 3 | |
| GPD Win Max 2 | |
| AIDA64 / FPU Julia | |
| GPD Win Max 2021 | |
| Gemiddeld Intel Core i7-1260P (11015 - 56906, n=26) | |
| Lenovo Yoga 9 14IAP7 82LU0001US | |
| GPD Pocket 3 | |
| GPD Win Max 2 | |
| AIDA64 / CPU SHA3 | |
| Lenovo Yoga 9 14IAP7 82LU0001US | |
| Gemiddeld Intel Core i7-1260P (669 - 2709, n=26) | |
| GPD Win Max 2021 | |
| GPD Pocket 3 | |
| GPD Win Max 2 | |
| AIDA64 / CPU Queen | |
| GPD Win Max 2021 | |
| Lenovo Yoga 9 14IAP7 82LU0001US | |
| Gemiddeld Intel Core i7-1260P (42571 - 82493, n=26) | |
| GPD Win Max 2 | |
| GPD Pocket 3 | |
| AIDA64 / FPU SinJulia | |
| GPD Win Max 2021 | |
| Lenovo Yoga 9 14IAP7 82LU0001US | |
| GPD Win Max 2 | |
| Gemiddeld Intel Core i7-1260P (2901 - 6975, n=26) | |
| GPD Pocket 3 | |
| AIDA64 / FPU Mandel | |
| GPD Win Max 2021 | |
| Gemiddeld Intel Core i7-1260P (5950 - 26376, n=26) | |
| Lenovo Yoga 9 14IAP7 82LU0001US | |
| GPD Pocket 3 | |
| GPD Win Max 2 | |
| AIDA64 / CPU AES | |
| GPD Pocket 3 | |
| GPD Win Max 2021 | |
| GPD Win Max 2 | |
| Gemiddeld Intel Core i7-1260P (16041 - 92356, n=26) | |
| Lenovo Yoga 9 14IAP7 82LU0001US | |
| AIDA64 / CPU ZLib | |
| Lenovo Yoga 9 14IAP7 82LU0001US | |
| Gemiddeld Intel Core i7-1260P (259 - 771, n=26) | |
| GPD Win Max 2021 | |
| GPD Win Max 2 | |
| GPD Pocket 3 | |
| AIDA64 / FP64 Ray-Trace | |
| GPD Win Max 2021 | |
| Gemiddeld Intel Core i7-1260P (1237 - 5858, n=26) | |
| Lenovo Yoga 9 14IAP7 82LU0001US | |
| GPD Pocket 3 | |
| GPD Win Max 2 | |
| AIDA64 / CPU PhotoWorxx | |
| Lenovo Yoga 9 14IAP7 82LU0001US | |
| GPD Win Max 2 | |
| GPD Pocket 3 | |
| Gemiddeld Intel Core i7-1260P (13261 - 43652, n=26) | |
| GPD Win Max 2021 | |
Systeemprestaties
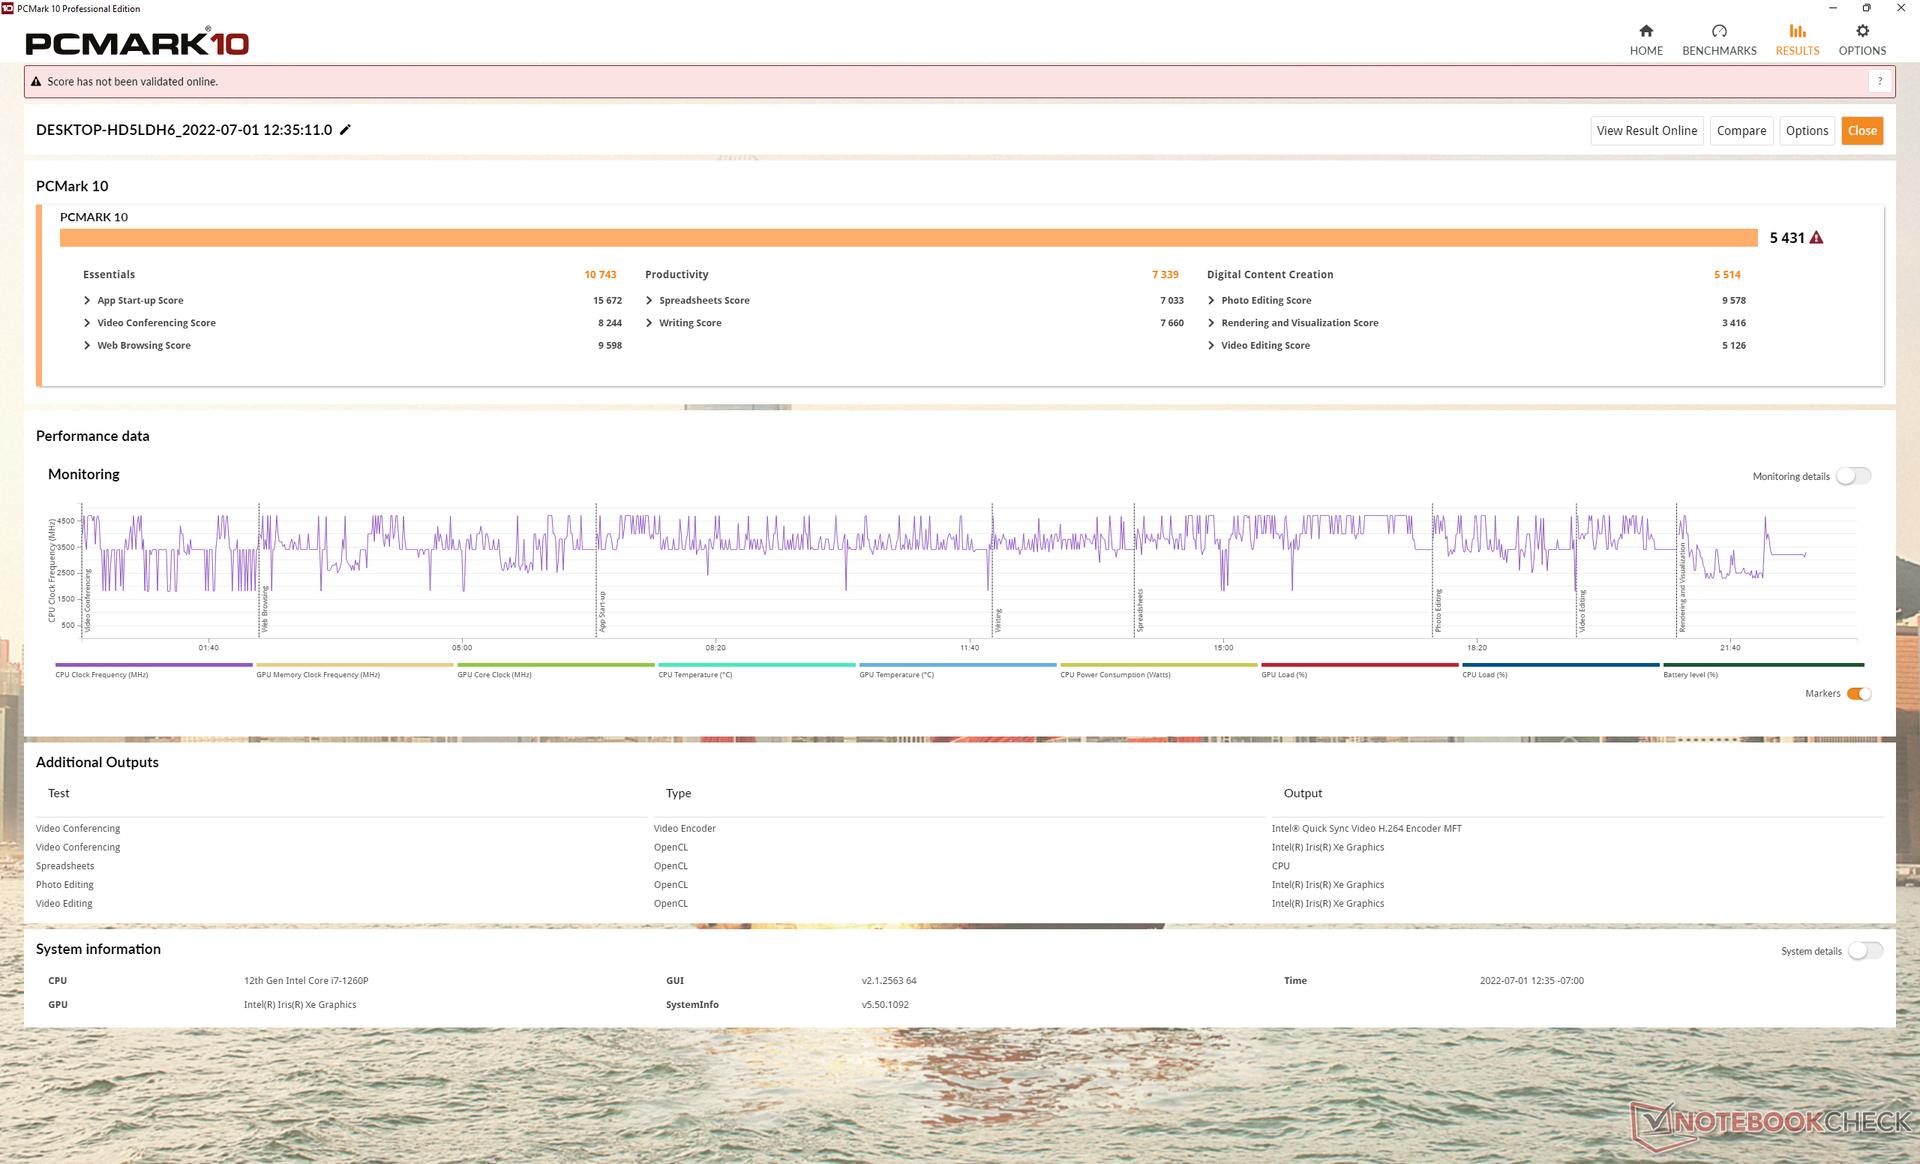
PCMark 10 scores zijn over het algemeen hoger dan alle GPD producten die voor onze Win Max 2 kwamen om in wezen op gelijke voet met full-size laptops zoals de Dell Inspiron 16 7620 2-in-1 te staan. Interessant is dat de originele AMD-aangedreven Win Max een hogere Productiviteit subscore heeft, waarschijnlijk als gevolg van zijn snellere multi-thread CPU prestaties.
CrossMark: Overall | Productivity | Creativity | Responsiveness
| PCMark 10 / Score | |
| Gemiddeld Intel Core i7-1260P, Intel Iris Xe Graphics G7 96EUs (4796 - 6068, n=17) | |
| GPD Win Max 2 | |
| GPD Win Max 2021 | |
| GPD Pocket 3 | |
| GPD Win 3 | |
| Microsoft Surface Go 3 Core i3 | |
| Lenovo IdeaPad Flex 3 11IGL05 | |
| PCMark 10 / Essentials | |
| GPD Win Max 2 | |
| GPD Pocket 3 | |
| Gemiddeld Intel Core i7-1260P, Intel Iris Xe Graphics G7 96EUs (9260 - 11251, n=17) | |
| GPD Win 3 | |
| GPD Win Max 2021 | |
| Microsoft Surface Go 3 Core i3 | |
| Lenovo IdeaPad Flex 3 11IGL05 | |
| PCMark 10 / Productivity | |
| GPD Win Max 2021 | |
| GPD Pocket 3 | |
| GPD Win Max 2 | |
| Gemiddeld Intel Core i7-1260P, Intel Iris Xe Graphics G7 96EUs (6167 - 8629, n=17) | |
| GPD Win 3 | |
| Microsoft Surface Go 3 Core i3 | |
| Lenovo IdeaPad Flex 3 11IGL05 | |
| PCMark 10 / Digital Content Creation | |
| Gemiddeld Intel Core i7-1260P, Intel Iris Xe Graphics G7 96EUs (5231 - 6908, n=17) | |
| GPD Win Max 2 | |
| GPD Win Max 2021 | |
| GPD Pocket 3 | |
| GPD Win 3 | |
| Microsoft Surface Go 3 Core i3 | |
| Lenovo IdeaPad Flex 3 11IGL05 | |
| CrossMark / Overall | |
| GPD Win Max 2 | |
| Gemiddeld Intel Core i7-1260P, Intel Iris Xe Graphics G7 96EUs (1484 - 1811, n=16) | |
| CrossMark / Productivity | |
| GPD Win Max 2 | |
| Gemiddeld Intel Core i7-1260P, Intel Iris Xe Graphics G7 96EUs (1486 - 1755, n=16) | |
| CrossMark / Creativity | |
| Gemiddeld Intel Core i7-1260P, Intel Iris Xe Graphics G7 96EUs (1451 - 1872, n=16) | |
| GPD Win Max 2 | |
| CrossMark / Responsiveness | |
| GPD Win Max 2 | |
| Gemiddeld Intel Core i7-1260P, Intel Iris Xe Graphics G7 96EUs (1253 - 1807, n=16) | |
| PCMark 10 Score | 5431 punten | |
Help | ||
| AIDA64 / Memory Copy | |
| GPD Win Max 2 | |
| GPD Pocket 3 | |
| Gemiddeld Intel Core i7-1260P (25125 - 71544, n=25) | |
| GPD Win Max 2021 | |
| AIDA64 / Memory Read | |
| GPD Win Max 2 | |
| Gemiddeld Intel Core i7-1260P (24983 - 72065, n=25) | |
| GPD Pocket 3 | |
| GPD Win Max 2021 | |
| AIDA64 / Memory Write | |
| GPD Win Max 2 | |
| GPD Pocket 3 | |
| Gemiddeld Intel Core i7-1260P (23512 - 66799, n=25) | |
| GPD Win Max 2021 | |
| AIDA64 / Memory Latency | |
| GPD Win Max 2021 | |
| GPD Win Max 2 | |
| GPD Pocket 3 | |
| Gemiddeld Intel Core i7-1260P (77.9 - 118.4, n=21) | |
| Microsoft Surface Go 3 Core i3 | |
* ... kleiner is beter
DPC latentie
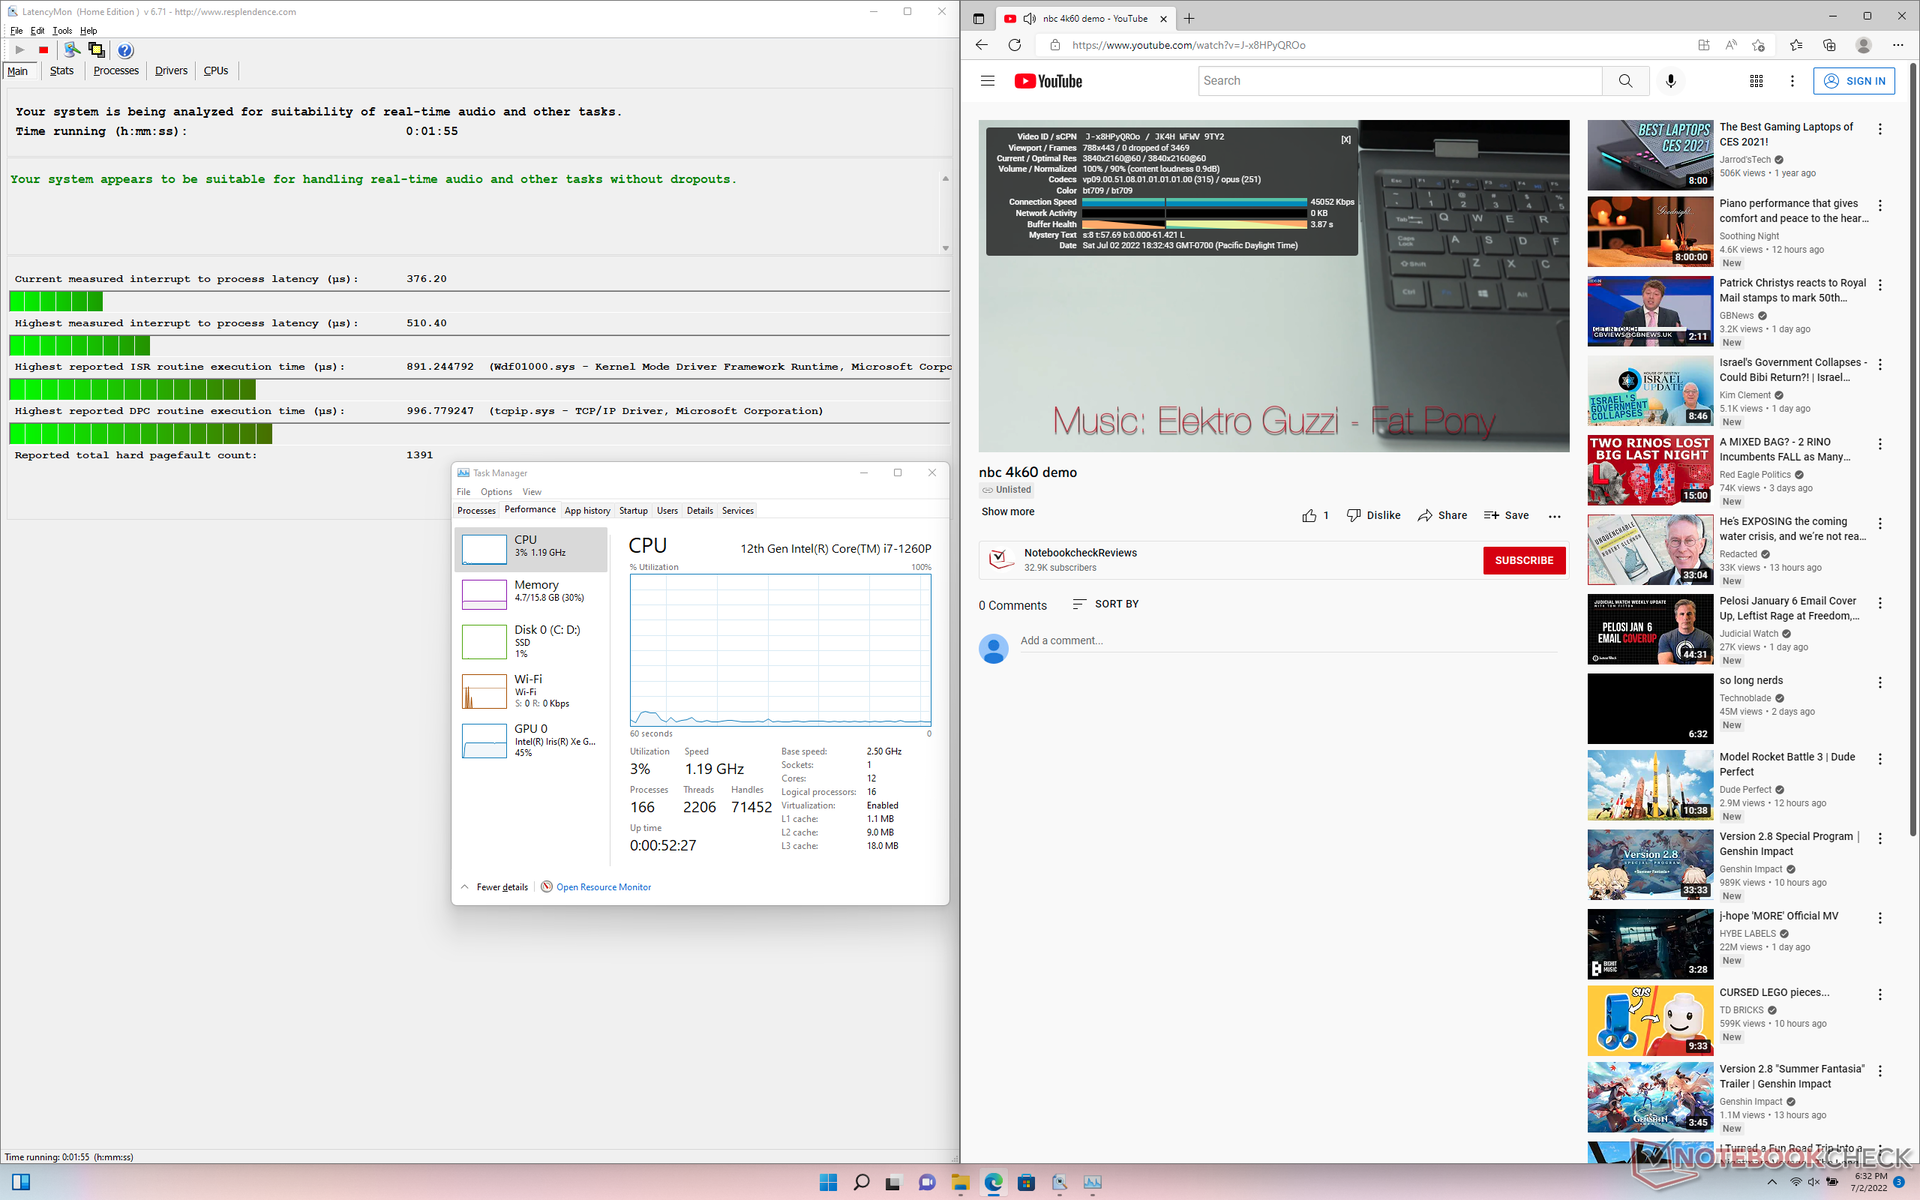
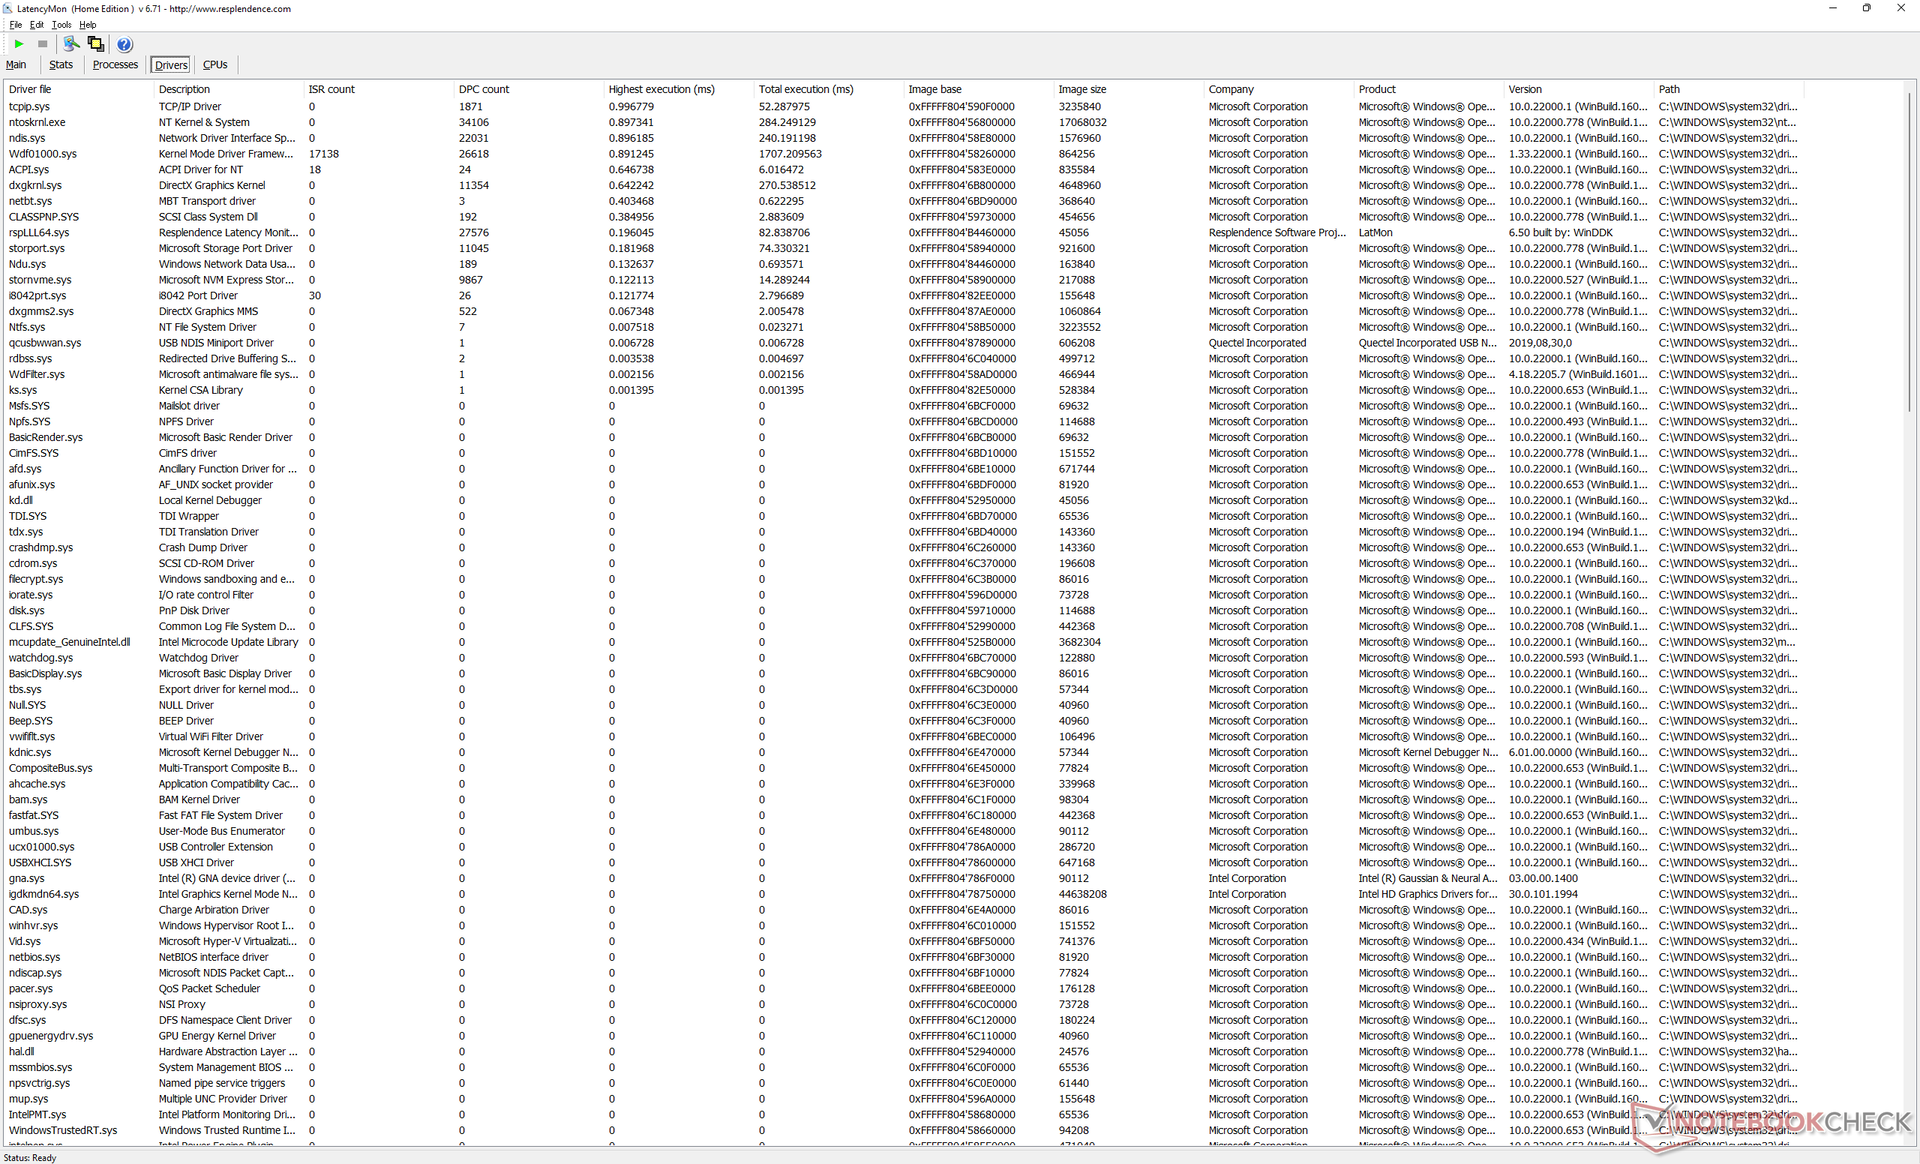
LatencyMon toont geen DPC-problemen bij het openen van meerdere browsertabbladen op onze homepage of bij het draaien van Prime95. het afspelen van 4K-video's met 60 FPS verloopt ook soepel, zonder wegvallende frames.
| DPC Latencies / LatencyMon - interrupt to process latency (max), Web, Youtube, Prime95 | |
| Microsoft Surface Go 3 Core i3 | |
| GPD Win Max 2021 | |
| Lenovo IdeaPad Flex 3 11IGL05 | |
| GPD Win 3 | |
| GPD Pocket 3 | |
| GPD Win Max 2 | |
* ... kleiner is beter
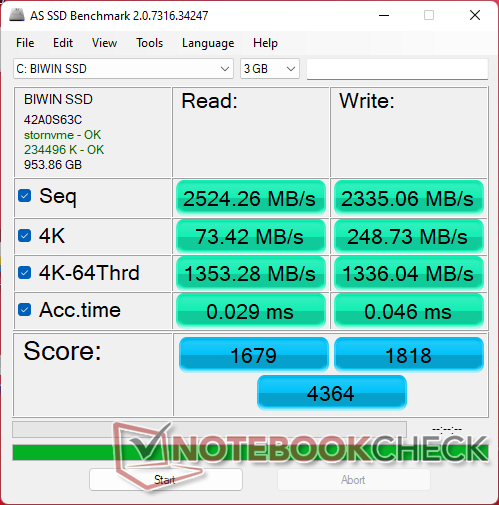
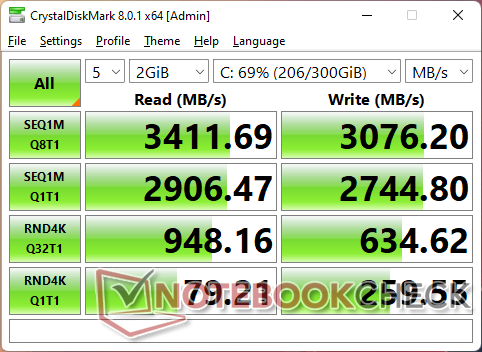
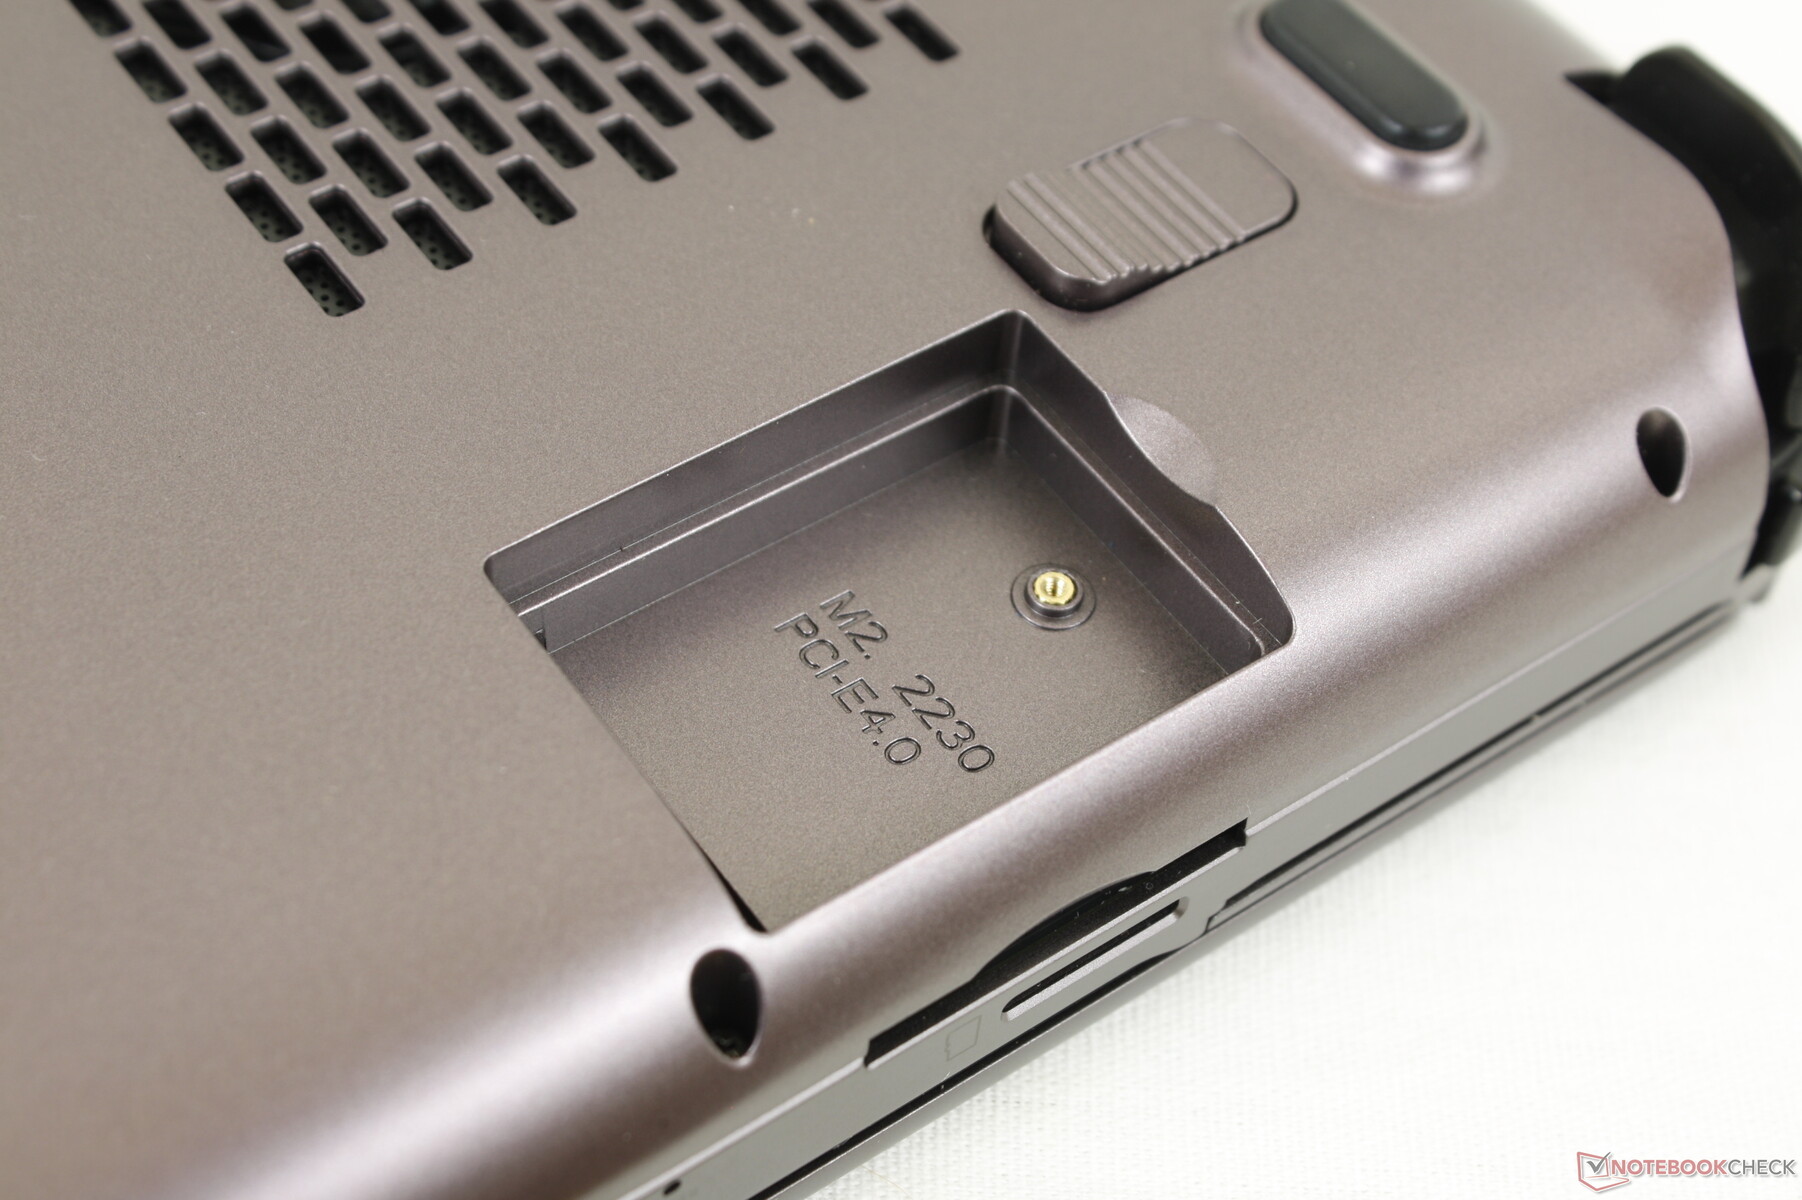
Opslagapparatuur - PCIe3- en PCIe4-ondersteuning
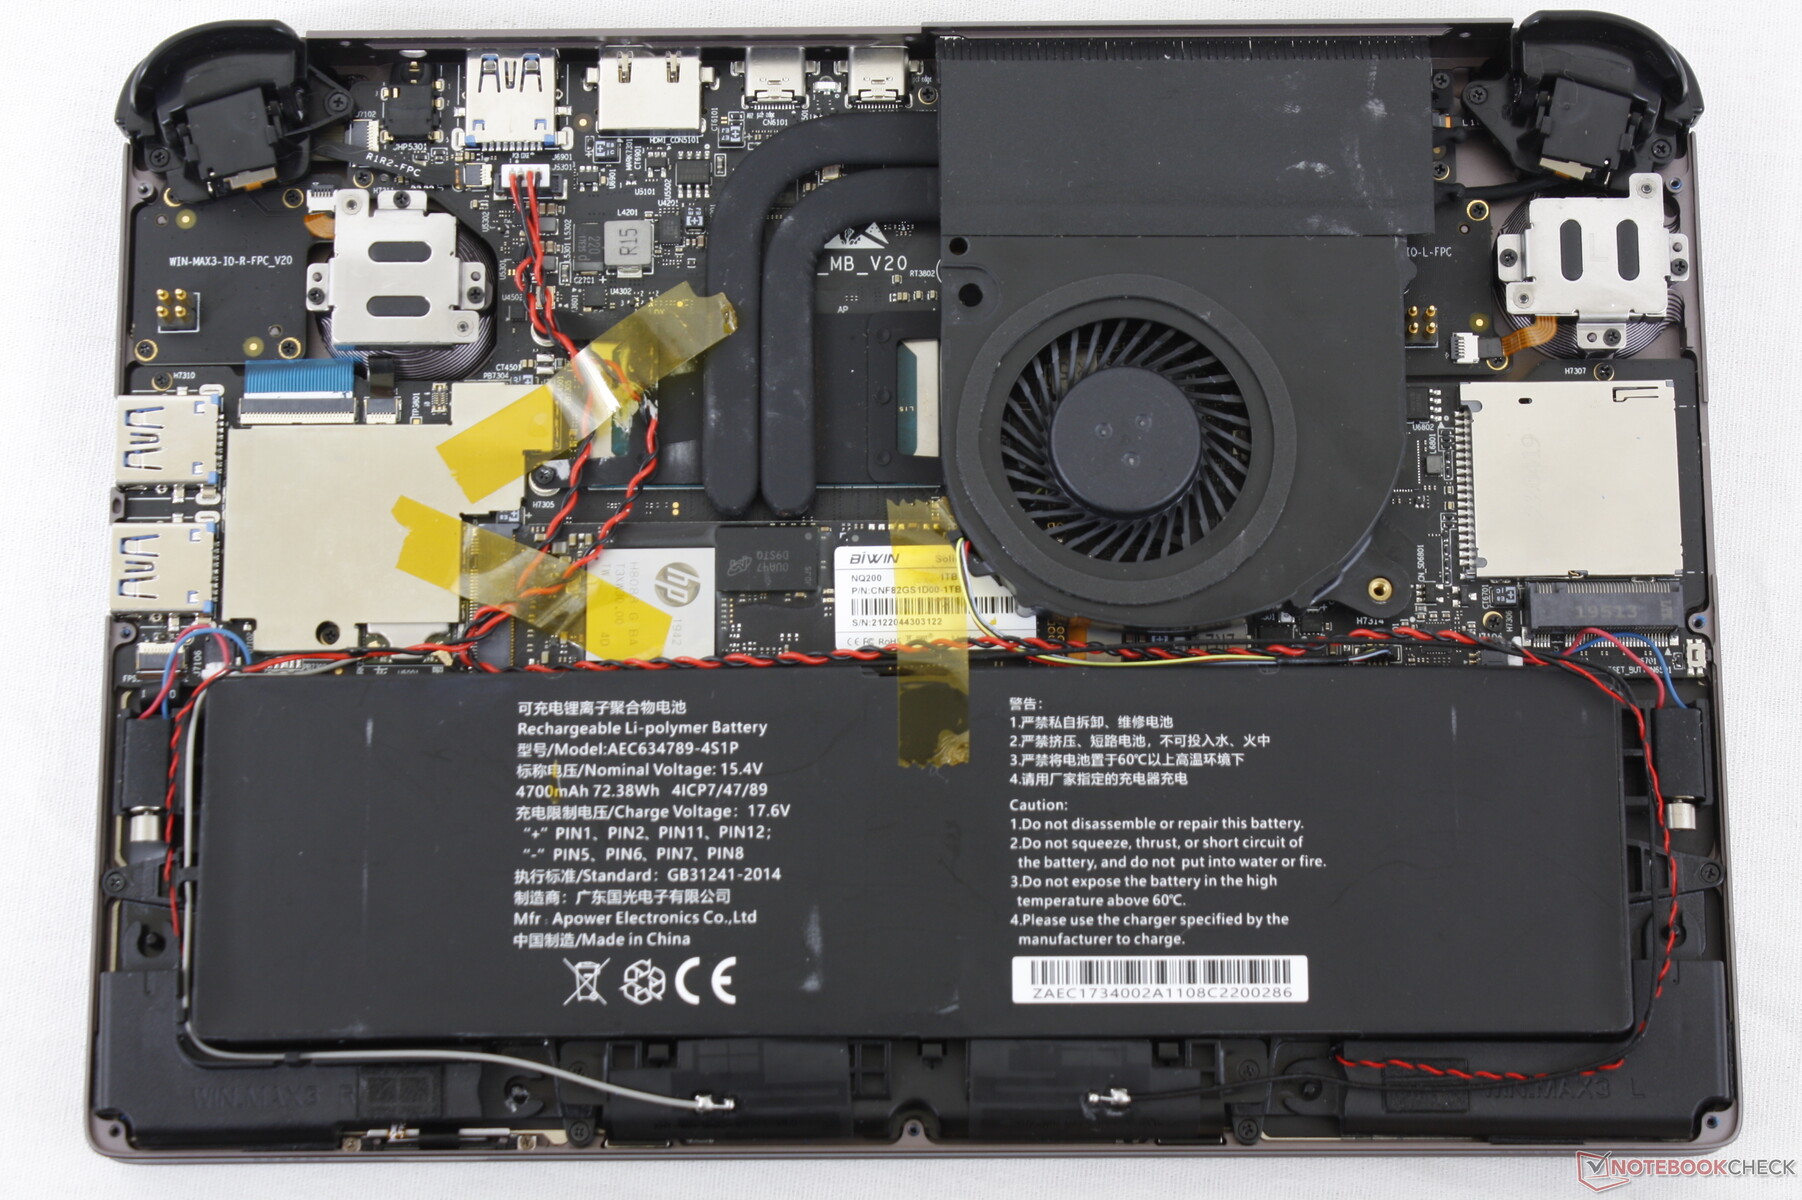
Het model kan tot twee PCIe4 x4 SSD's ondersteunen, hoewel onze unit werd geleverd met een 1 TB BiWin NQ200 PCIe3 x4 schijf. Desondanks zou onze PCIe3 schijf vanwege thermische beperkingen moeite hebben om overdrachtssnelheden van meer dan 3300 MB/s aan te houden, zoals blijkt uit onze DiskSpd loop test hieronder. Als u besluit een PCIe4 x4 schijf te installeren, verwacht dan niet dat deze gedurende lange perioden op de geadverteerde maximale specificaties draait.

| Drive Performance rating - Percent | |
| GPD Win Max 2 | |
| Gemiddeld BiWin NQ200 1TB CNF82GS1D00-1TB | |
| GPD Pocket 3 | |
| GPD Win 3 | |
| GPD Win Max 2021 | |
| Microsoft Surface Go 3 Core i3 | |
| Lenovo IdeaPad Flex 3 11IGL05 | |
* ... kleiner is beter
Disk Throttling: DiskSpd Read Loop, Queue Depth 8
GPU-prestaties - Iris Xe is langzamer dan de Radeon 680M
Ondanks de trager dan verwachte CPU prestaties, blijven de grafische prestaties uitstekend. 3DMark resultaten zijn 15 tot 20 procent hoger dan de gemiddelde laptop in onze database, uitgerust met dezelfde geïntegreerde Iris Xe 96 EUs GPU. Dit is goed genoeg om een aantal oudere 3D games te kunnen draaien op 1080p en 30 FPS op gemiddelde tot hoge instellingen, inclusief Witcher 3, maar we raden aan de instellingen te verlagen en vsync in te schakelen om de spelervaring vloeiender te maken. Het is jammer dat het scherm geen adaptieve synchronisatie ondersteunt, want zo'n functie zou enorm geholpen hebben bij het gamen.
In vergelijking met de GPD Win 3 die draait op de Iris Xe 80 EUs, kan onze Win Max 2 15 tot 30 procent snellere grafische prestaties bieden. Kiezen voor de AMD Radeon 680M SKU zal de grafische prestaties met 20 tot 30 procent verhogen ten opzichte van onze Intel SKU.
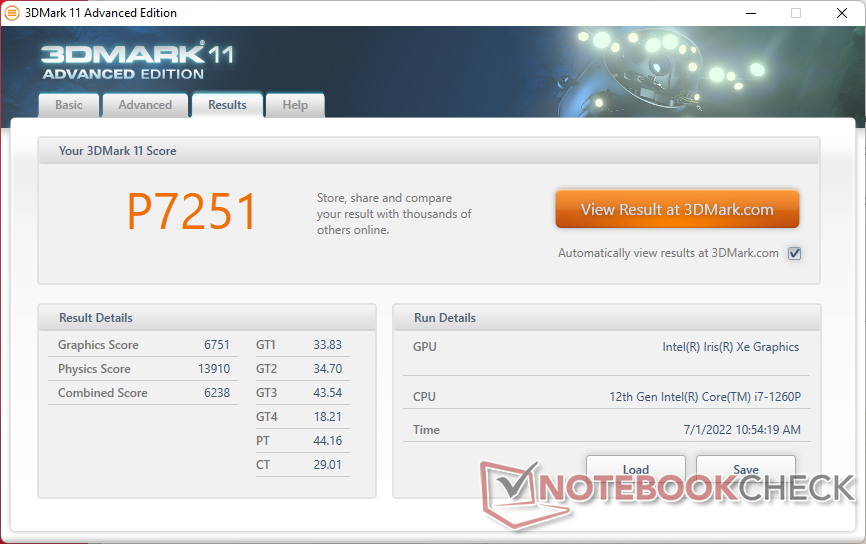
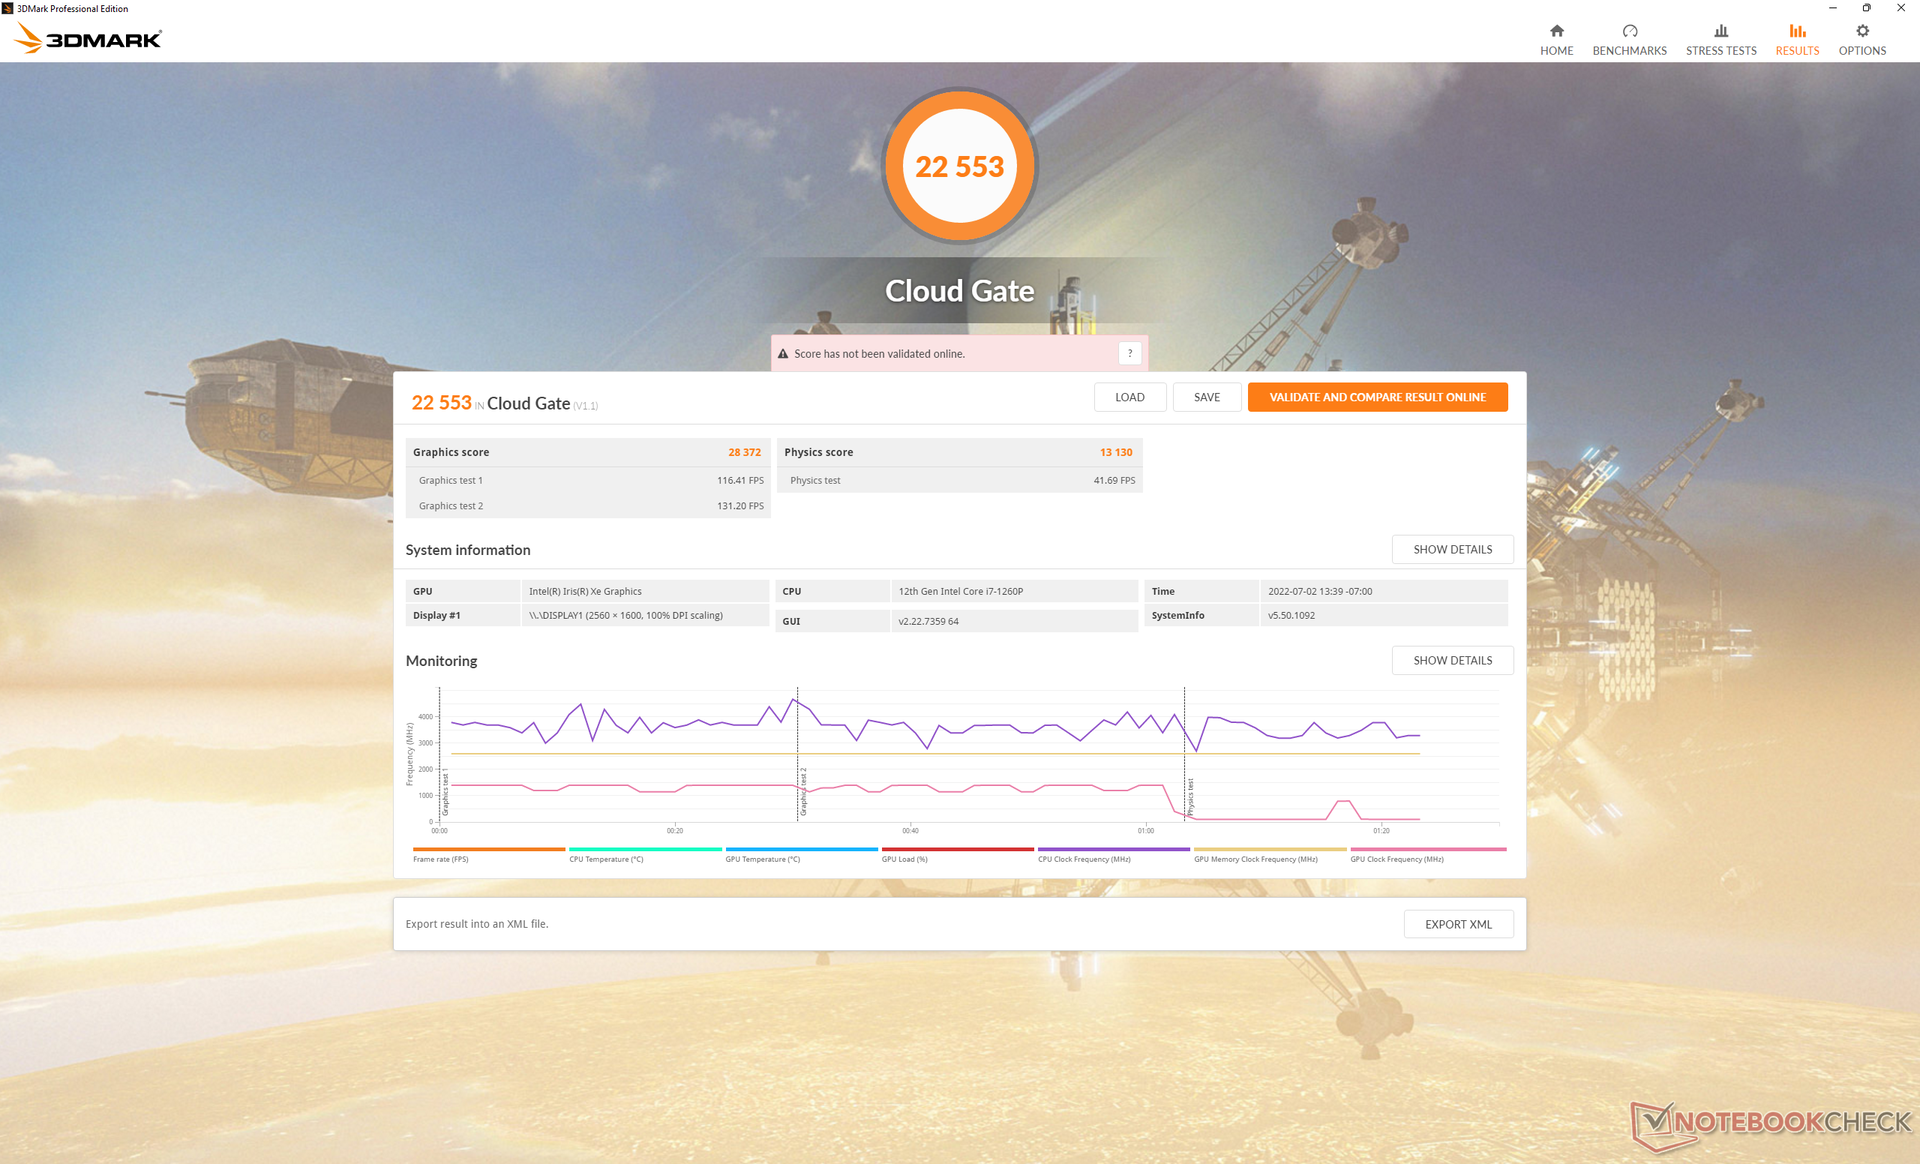
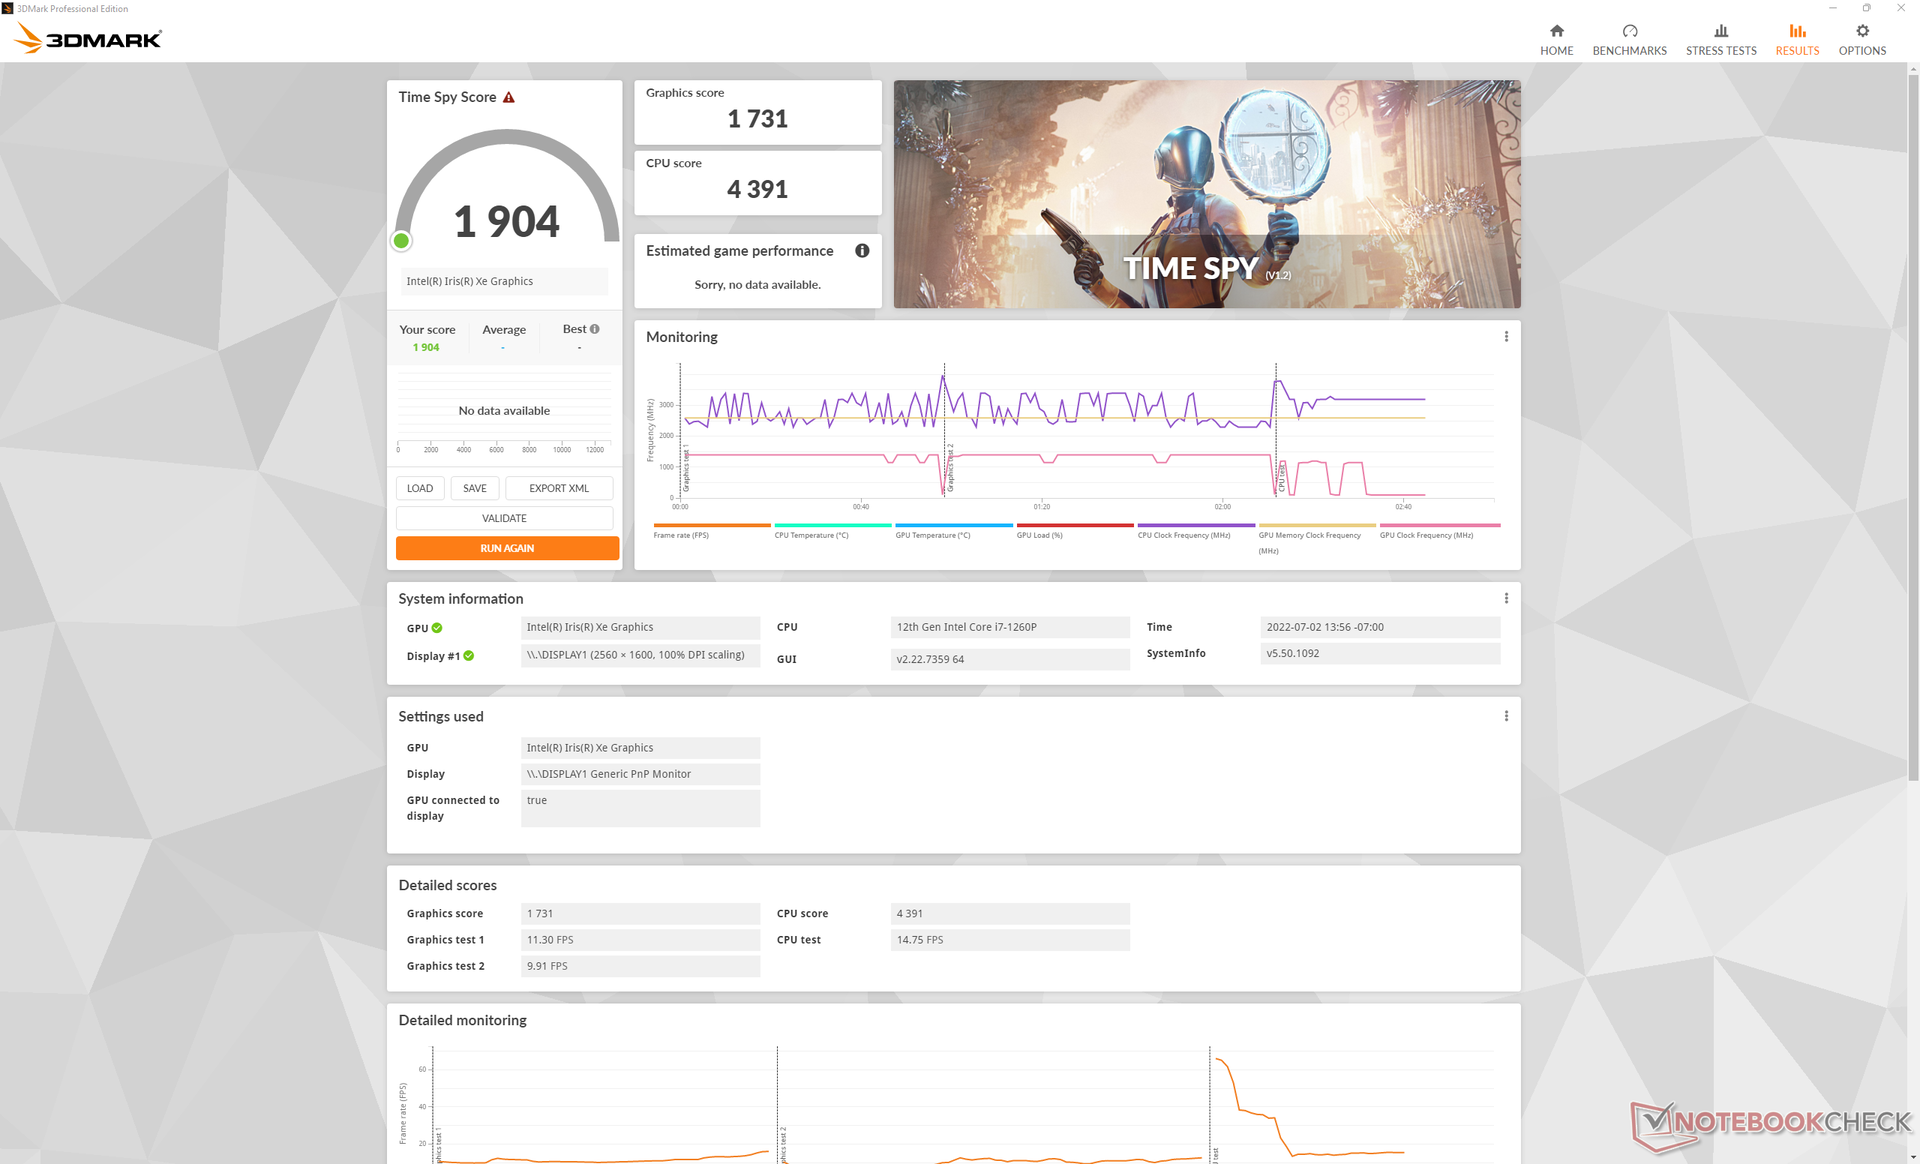
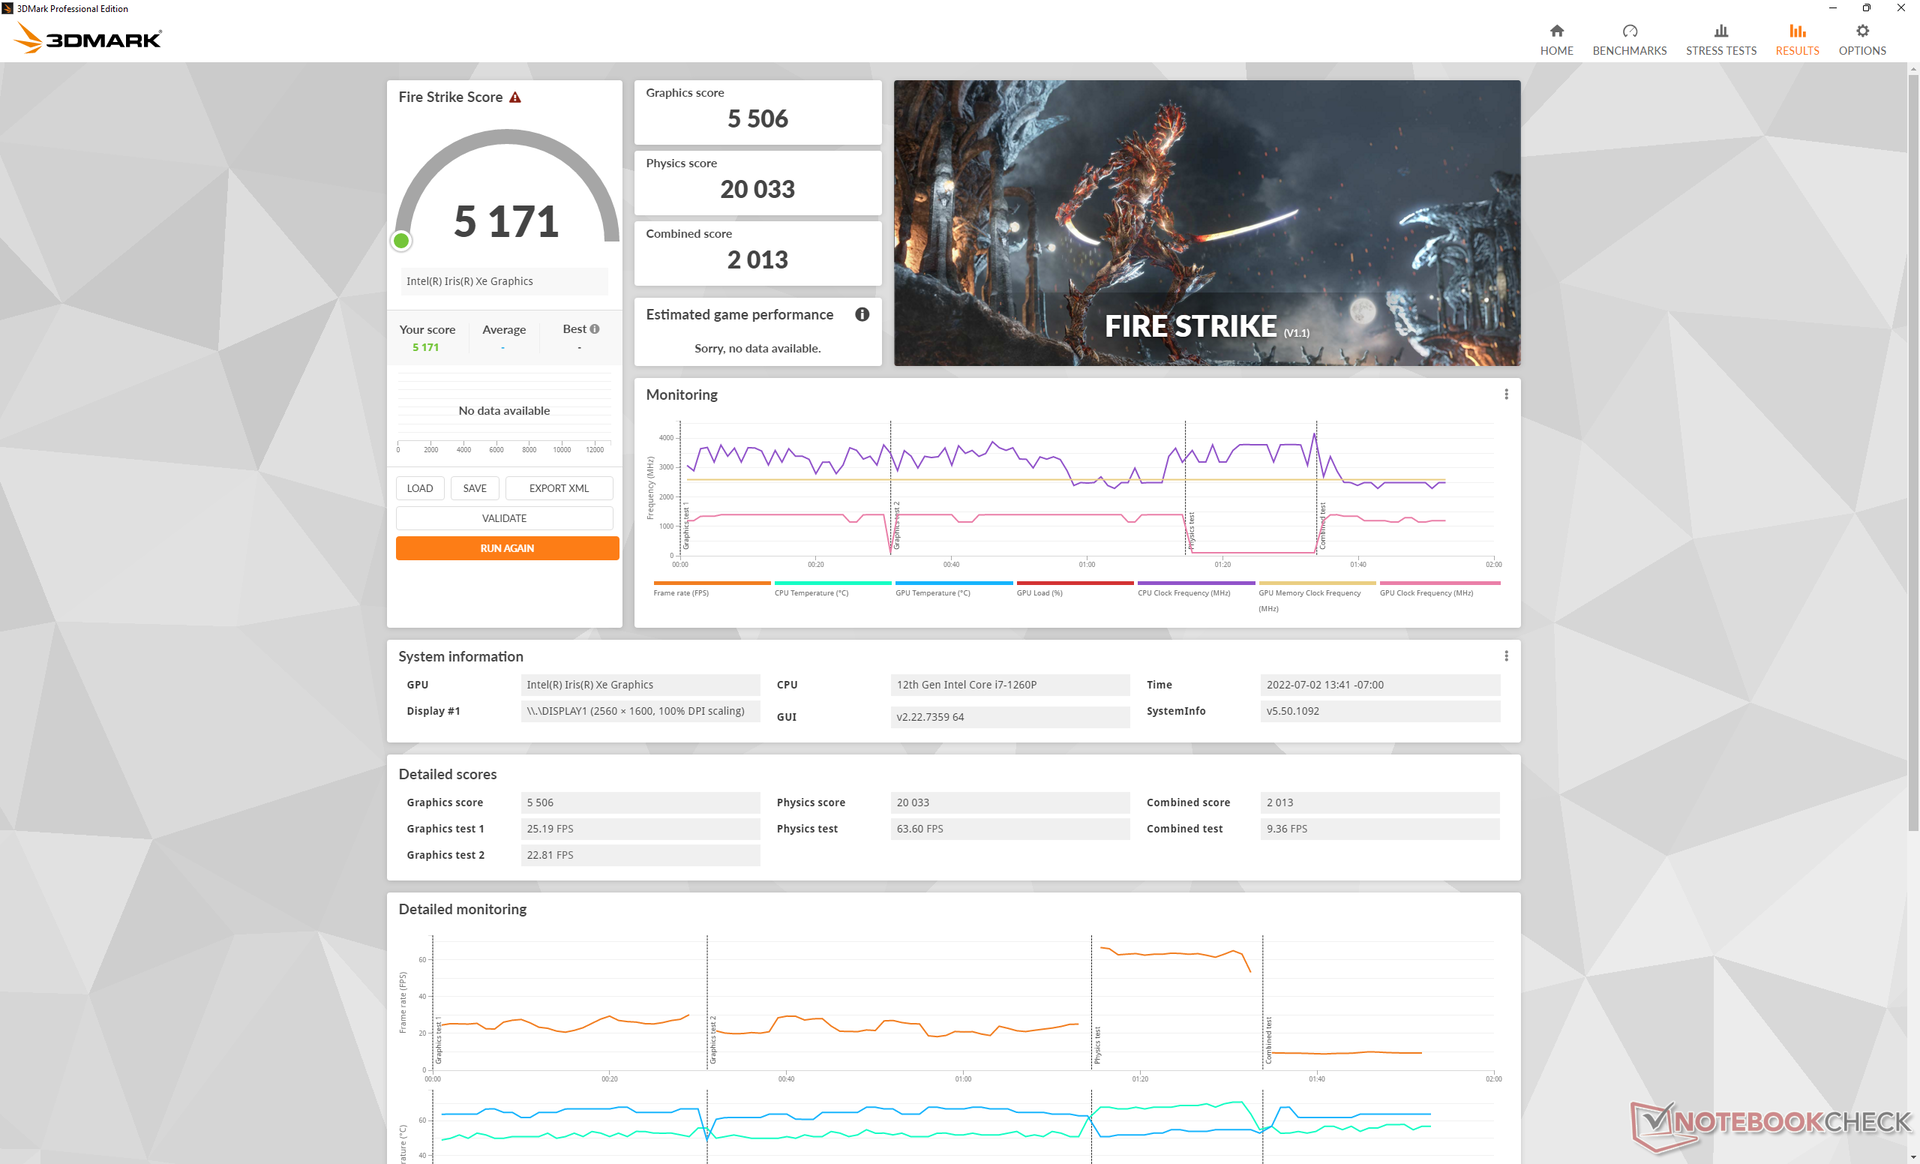
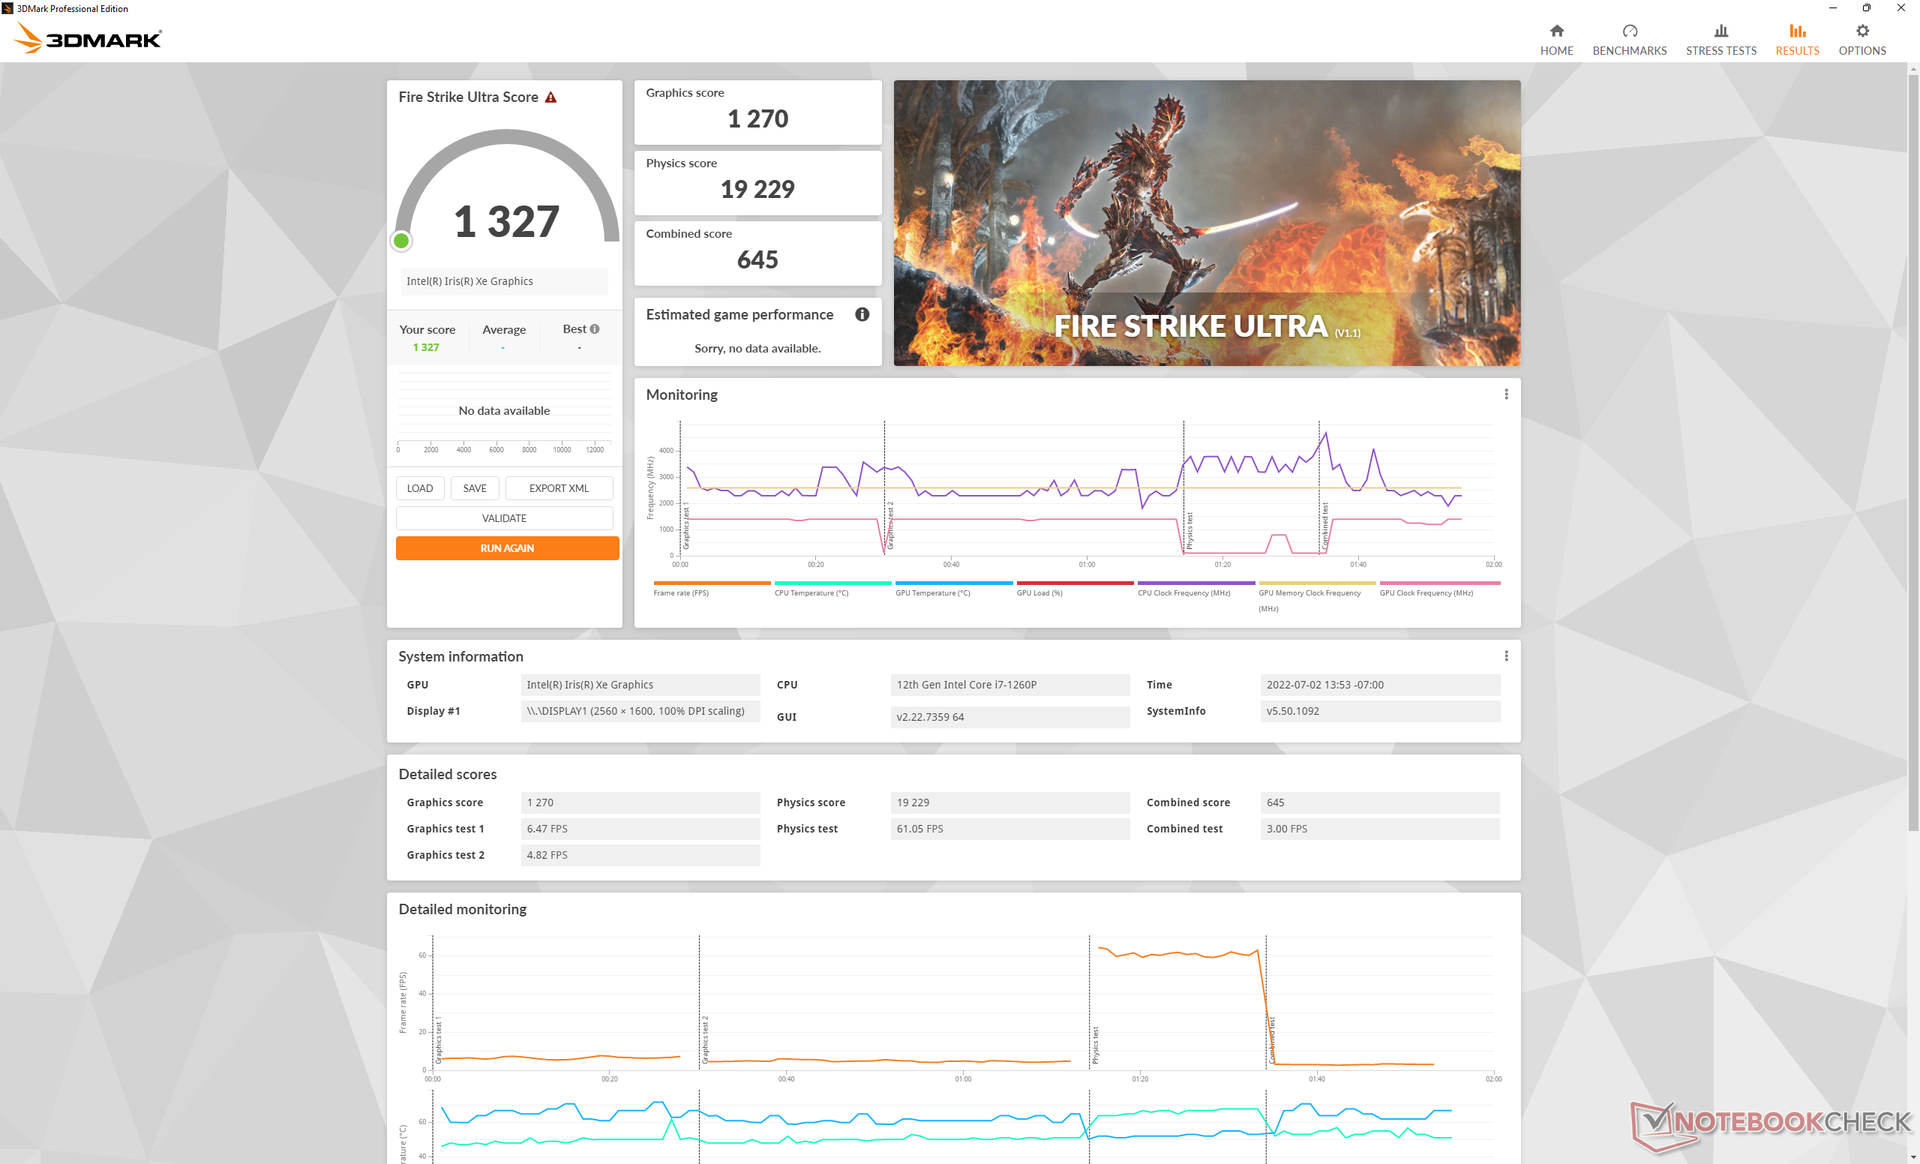
| 3DMark 11 Performance | 7251 punten | |
| 3DMark Cloud Gate Standard Score | 22553 punten | |
| 3DMark Fire Strike Score | 5171 punten | |
| 3DMark Time Spy Score | 1904 punten | |
Help | ||
| Cyberpunk 2077 1.6 | |
| 1280x720 Low Preset | |
| Asus Zenbook S 13 OLED | |
| GPD Win Max 2 | |
| Gemiddeld Intel Iris Xe Graphics G7 96EUs (20.6 - 44.7, n=17) | |
| 1920x1080 Low Preset | |
| Asus Zenbook S 13 OLED | |
| GPD Win Max 2 | |
| Gemiddeld Intel Iris Xe Graphics G7 96EUs (13 - 25.9, n=42) | |
| 1920x1080 Medium Preset | |
| Asus Zenbook S 13 OLED | |
| GPD Win Max 2 | |
| Gemiddeld Intel Iris Xe Graphics G7 96EUs (10.8 - 21.7, n=37) | |
| 1920x1080 High Preset | |
| Asus Zenbook S 13 OLED | |
| GPD Win Max 2 | |
| Gemiddeld Intel Iris Xe Graphics G7 96EUs (9.8 - 16.9, n=34) | |
| 1920x1080 Ultra Preset | |
| Asus Zenbook S 13 OLED | |
| GPD Win Max 2 | |
| Gemiddeld Intel Iris Xe Graphics G7 96EUs (7.4 - 16.8, n=32) | |
Witcher 3 FPS Chart
| lage | gem. | hoge | ultra | QHD | |
|---|---|---|---|---|---|
| GTA V (2015) | 107.9 | 95.2 | 23 | 9.96 | 6.6 |
| The Witcher 3 (2015) | 84.7 | 57 | 31.4 | 14.6 | |
| Dota 2 Reborn (2015) | 105.9 | 80.8 | 63.5 | 58.2 | |
| Final Fantasy XV Benchmark (2018) | 43.1 | 24.3 | 17.5 | ||
| X-Plane 11.11 (2018) | 47.7 | 35 | 32.2 | ||
| Strange Brigade (2018) | 85.1 | 42.1 | 33.8 | 27.3 | 20.1 |
| Cyberpunk 2077 1.6 (2022) | 20.4 | 17.3 | 13.3 | 10.7 |
Emissies
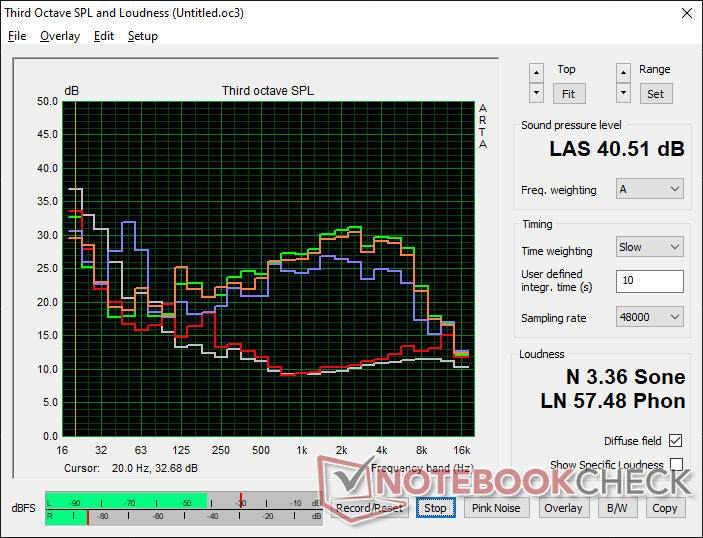
Systeemgeluid - zeker luider dan de Nintendo Switch
Het ventilatorgeluid blijft tussen 22,7 dB(A) en 28,5 dB(A) tegen een achtergrond van 22,6 dB(A) tijdens het browsen of video streamen. Hoewel het niet luid is of bijzonder storend, kunnen de toerentalveranderingen plotseling en merkbaar zijn.
Wanneer de ventilator Witcher 3 in de Turbo ventilatorstand is het geluid van de ventilator maximaal slechts 40 dB(A), wat veel stiller is dan wat we hebben ervaren bij de 2021 Win Max, waar het geluid van de ventilator 49 dB(A) kon bereiken. Het lage 40 dB(A) bereik is typerend voor veel laptops met een U-serie als ze zware belastingen uitvoeren, maar het geluid is weer beter merkbaar op de Win Max 2 vanwege de hoge frequentie van de ventilator met kleine diameter en het feit dat het apparaat dichter bij de gebruiker wordt gehouden tijdens het gamen. We vinden het geluidsniveau acceptabel in openbare ruimtes zoals treinen.
Geluidsniveau
| Onbelast |
| 23.7 / 23.7 / 28.5 dB (A) |
| Belasting |
| 36.5 / 40.5 dB (A) |
 | ||
30 dB stil 40 dB(A) hoorbaar 50 dB(A) luid |
||
min: | ||
| GPD Win Max 2 Iris Xe G7 96EUs, i7-1260P, BiWin NQ200 1TB CNF82GS1D00-1TB | GPD Pocket 3 Iris Xe G7 96EUs, i7-1195G7, BiWin NQ200 1TB CNF82GS1D00-1TB | GPD Win Max 2021 Vega 8, R7 4800U, BIWIN NS200 512GB CNF82GS1G00-512 | GPD Win 3 Iris Xe G7 80EUs, i5-1135G7, BIWIN NS200 1TB CNF82GS1G02-1TB | Lenovo Yoga 9 14IAP7 82LU0001US Iris Xe G7 96EUs, i7-1260P, Samsung PM9A1 MZVL2512HCJQ | |
|---|---|---|---|---|---|
| Noise | -2% | -13% | -15% | 1% | |
| uit / omgeving * (dB) | 22.6 | 23.4 -4% | 23.3 -3% | 27.4 -21% | 22.9 -1% |
| Idle Minimum * (dB) | 23.7 | 24.3 -3% | 26.6 -12% | 29.1 -23% | 23.3 2% |
| Idle Average * (dB) | 23.7 | 25.6 -8% | 26.6 -12% | 29.1 -23% | 23.5 1% |
| Idle Maximum * (dB) | 28.5 | 25.6 10% | 26.6 7% | 29.1 -2% | 23.5 18% |
| Load Average * (dB) | 36.5 | 38.3 -5% | 46.9 -28% | 40.7 -12% | 33.2 9% |
| Witcher 3 ultra * (dB) | 39.8 | 40.7 -2% | 49 -23% | 42.8 -8% | 44.9 -13% |
| Load Maximum * (dB) | 40.5 | 40.7 -0% | 49.2 -21% | 46.3 -14% | 44.6 -10% |
* ... kleiner is beter
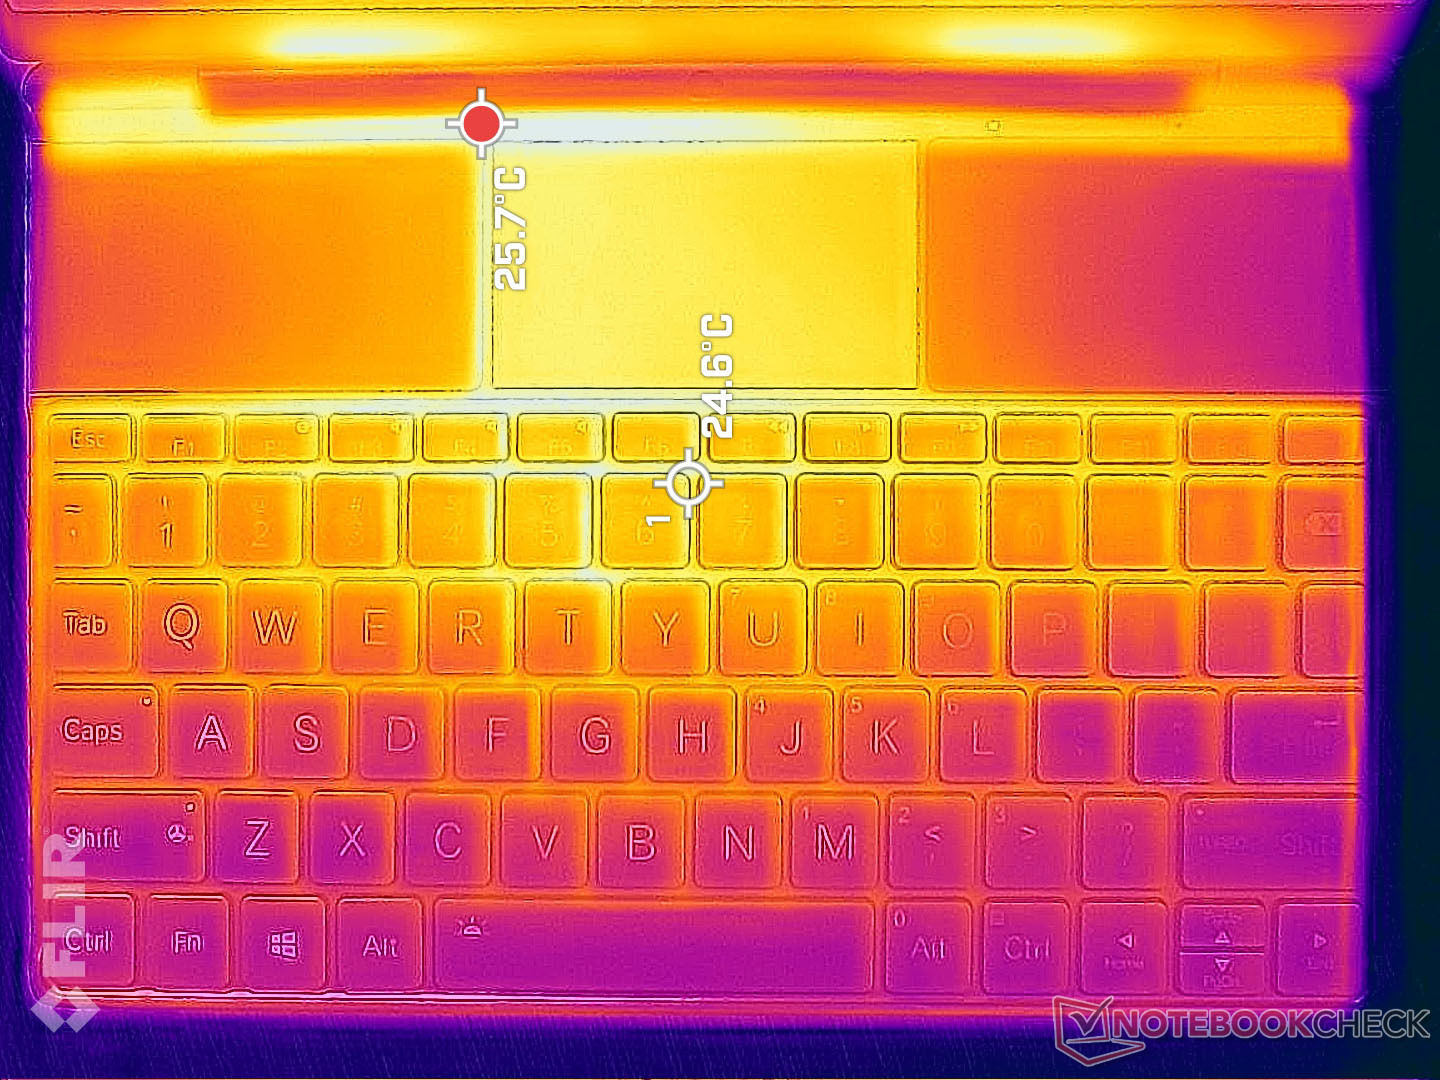
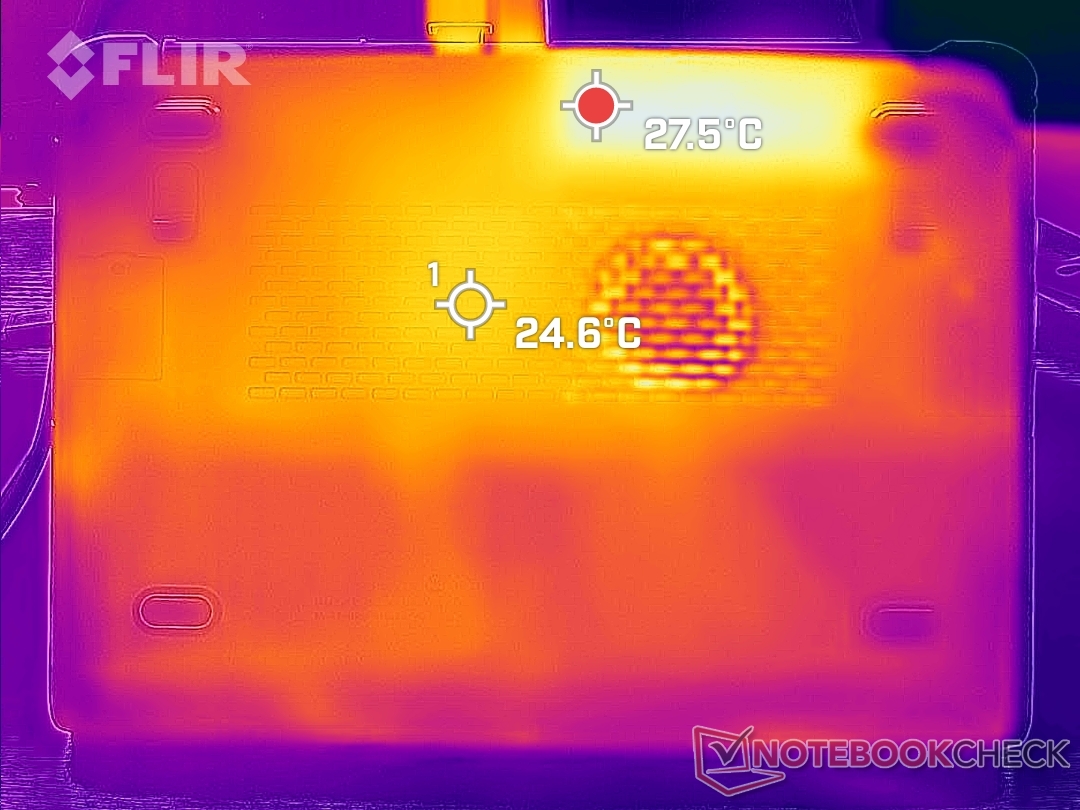
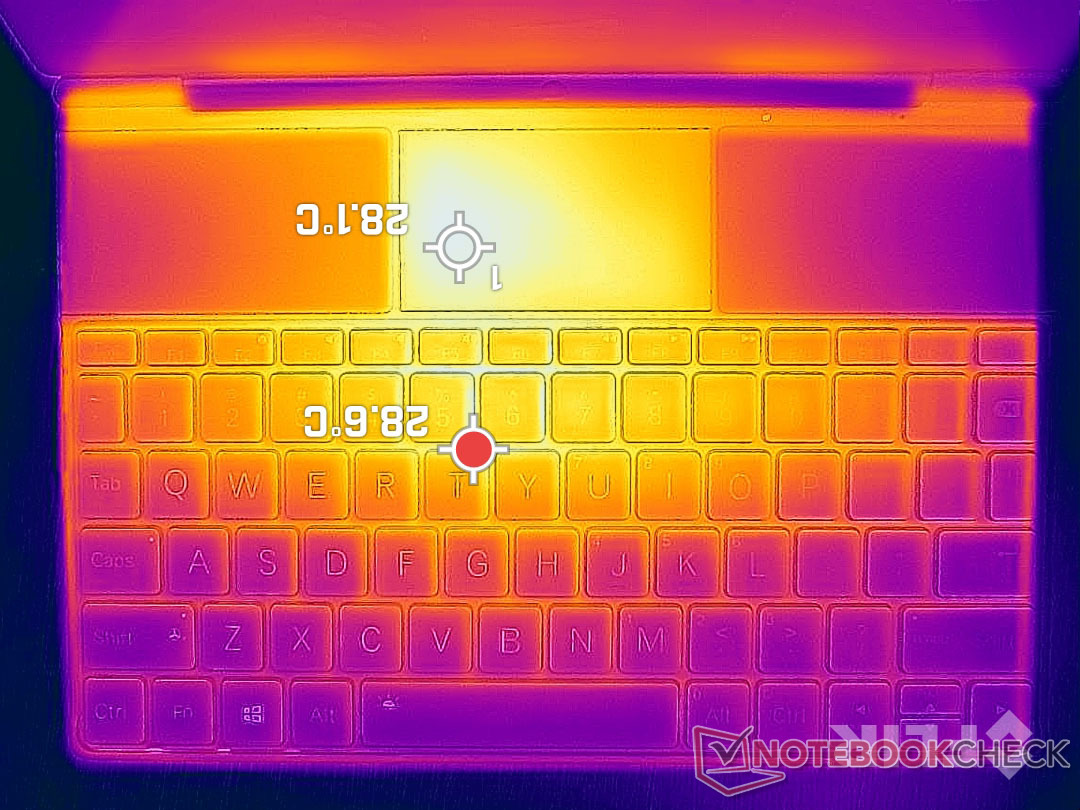
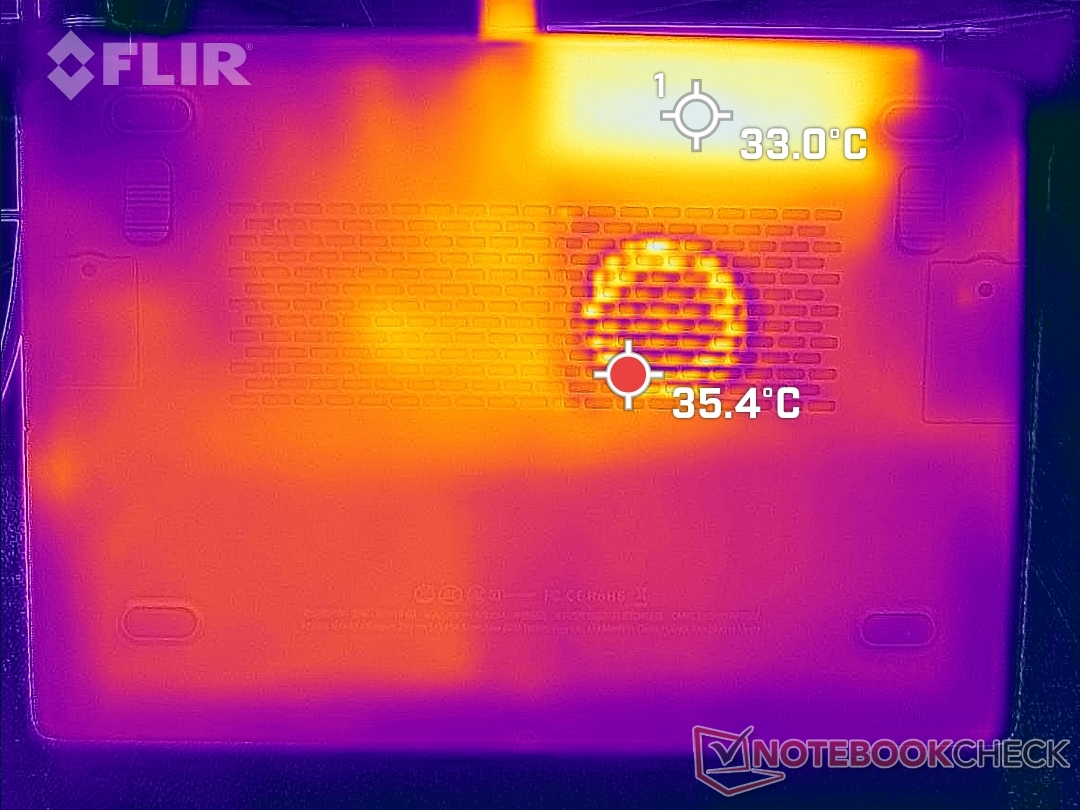
Temperatuur - Nooit te warm
Net als wat we waarnamen bij de 2021 Win Max, werkt de 2022 Win Max 2 verrassend koel in verhouding tot zijn kleine formaat en 12e generatie Core-P serie CPU. Tijdens het gamen bereiken de hotspots aan de achterzijde van het apparaat slechts 28 C en 33 C aan de boven- en onderzijde, respectievelijk. We zijn in staat om de geïntegreerde joysticks en knoppen te hanteren zonder dat ze oncomfortabel warm aanvoelen.
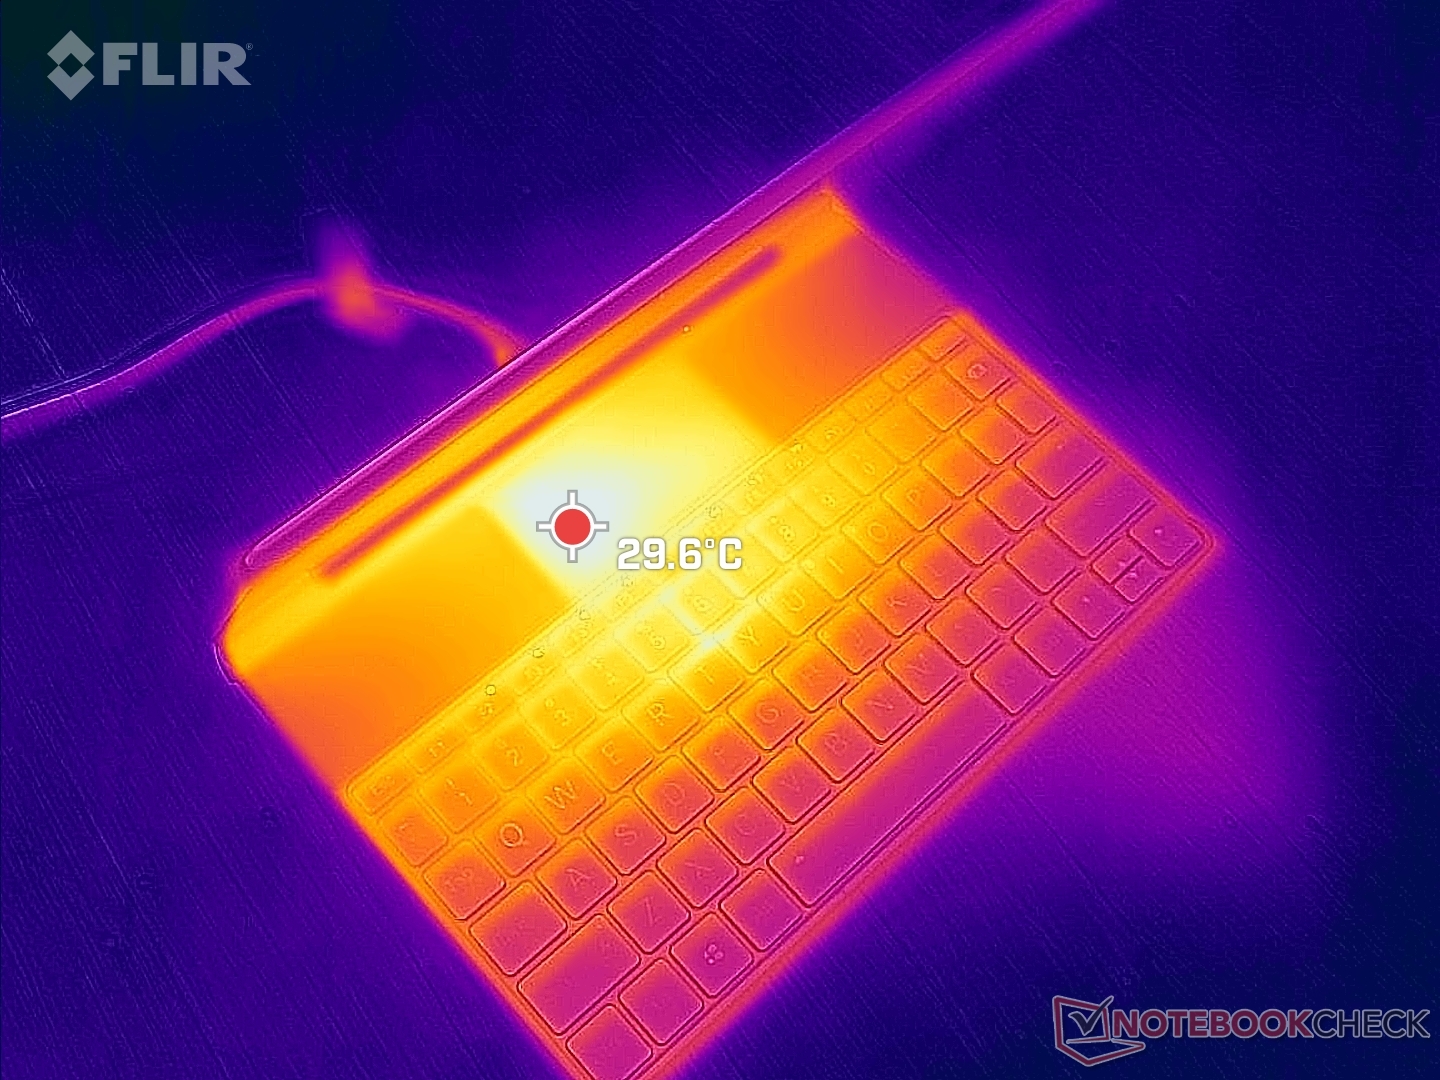
(+) De maximumtemperatuur aan de bovenzijde bedraagt 28.6 °C / 83 F, vergeleken met het gemiddelde van 35.9 °C / 97 F, variërend van 21.4 tot 59 °C voor de klasse Subnotebook.
(+) De bodem warmt op tot een maximum van 33 °C / 91 F, vergeleken met een gemiddelde van 39.2 °C / 103 F
(+) Bij onbelast gebruik bedraagt de gemiddelde temperatuur voor de bovenzijde 22.3 °C / 72 F, vergeleken met het apparaatgemiddelde van 30.8 °C / 87 F.
(+) De palmsteunen en het touchpad zijn met een maximum van ###max## °C / 70.5 F koeler dan de huidtemperatuur en voelen daarom koel aan.
(+) De gemiddelde temperatuur van de handpalmsteun van soortgelijke toestellen bedroeg 28.2 °C / 82.8 F (+6.8 °C / 12.3 F).
| GPD Win Max 2 Intel Core i7-1260P, Intel Iris Xe Graphics G7 96EUs | GPD Pocket 3 Intel Core i7-1195G7, Intel Iris Xe Graphics G7 96EUs | GPD Win Max 2021 AMD Ryzen 7 4800U, AMD Radeon RX Vega 8 (Ryzen 4000/5000) | Microsoft Surface Go 3 Core i3 Intel Core i3-10100Y, Intel UHD Graphics 615 | Lenovo IdeaPad Flex 3 11IGL05 Intel Celeron N4020, Intel UHD Graphics 600 | |
|---|---|---|---|---|---|
| Heat | -30% | -17% | -21% | -16% | |
| Maximum Upper Side * (°C) | 28.6 | 40.4 -41% | 38 -33% | 46.1 -61% | 37.4 -31% |
| Maximum Bottom * (°C) | 33 | 39.4 -19% | 36.4 -10% | 42.7 -29% | 41.4 -25% |
| Idle Upper Side * (°C) | 24.6 | 32.6 -33% | 30 -22% | 25 -2% | 27.2 -11% |
| Idle Bottom * (°C) | 27.6 | 34.4 -25% | 28 -1% | 25 9% | 27 2% |
* ... kleiner is beter
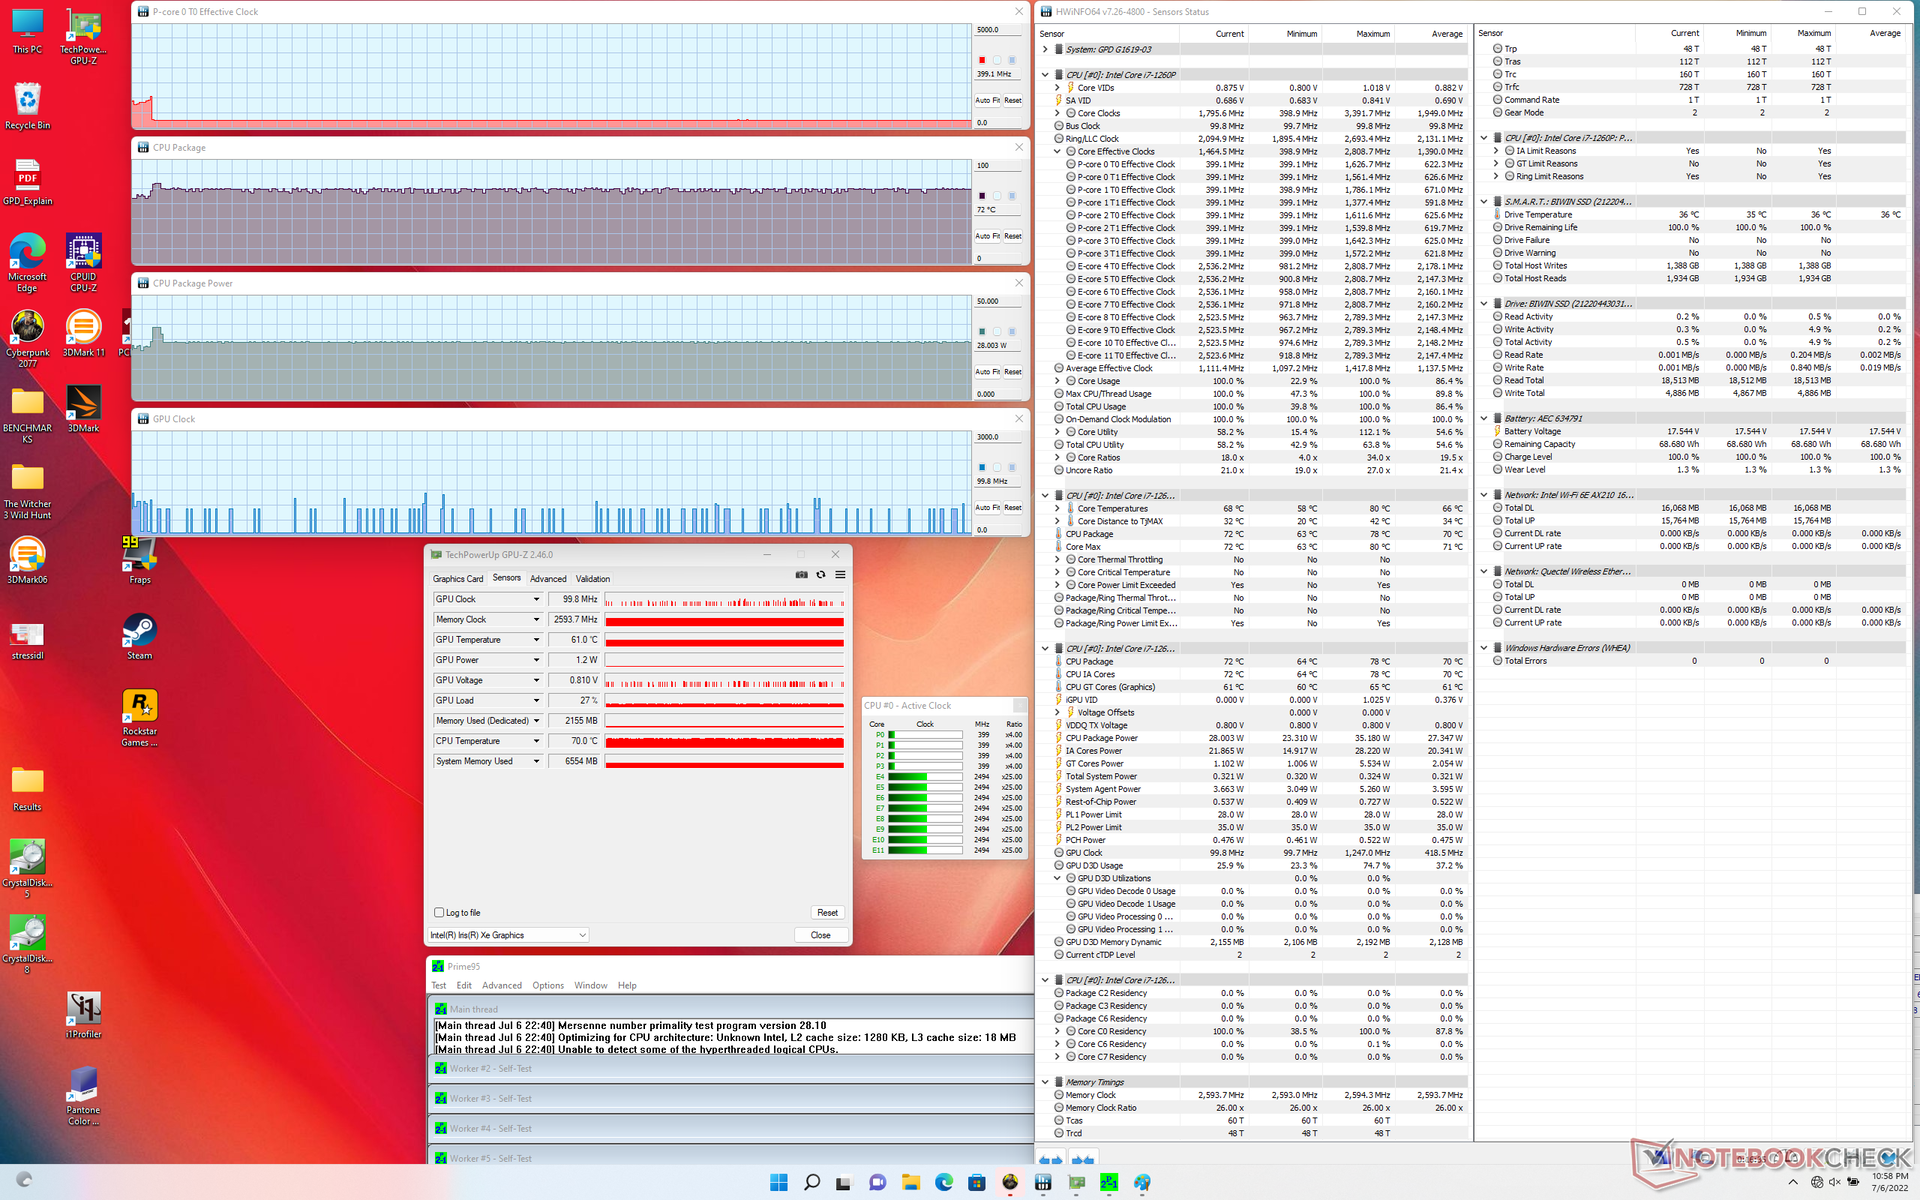
Stresstest
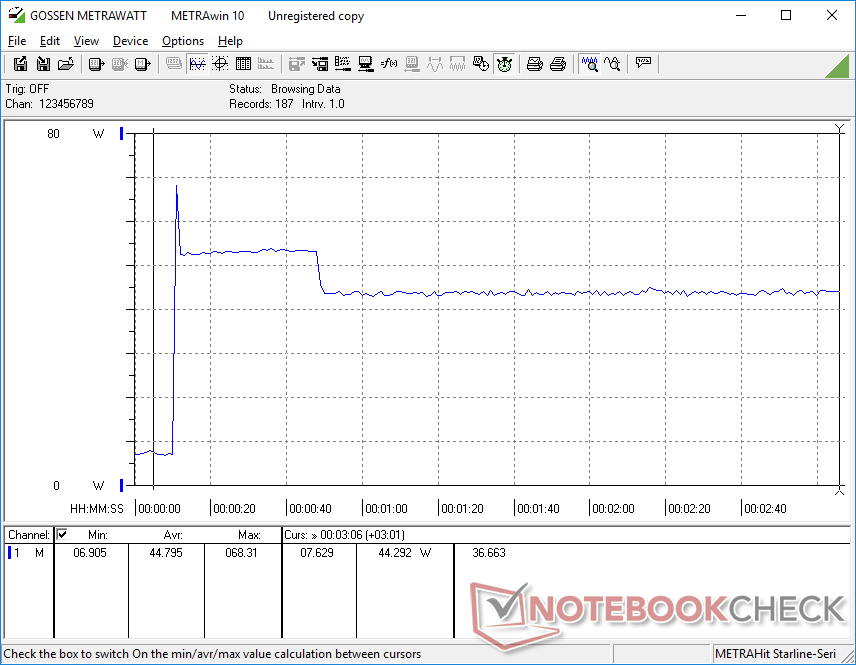
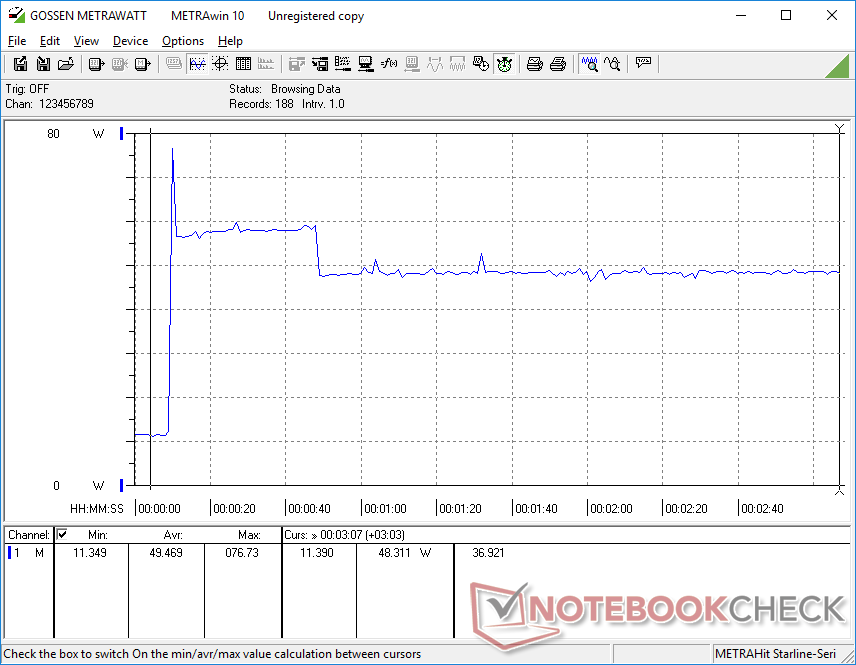
Het starten van Prime95 om de CPU te belasten onthult iets ongewoons: de prestatie P-cores zouden downclocken naar slechts 400 MHz, terwijl de efficiënte E-cores zouden draaien op 2,5 GHz. Ter vergelijking, het uitvoeren van deze zelfde test op de Lenovo Yoga 9 14 uitgerust met dezelfde CPU, zouden alle P- en E-cores op 1,7 tot 1,9 GHz draaien. Dit gedrag is de waarschijnlijke oorzaak van de trager dan gemiddelde multi-thread prestaties die hierboven zijn geregistreerd.
De vermogensopname van het CPU-pakket liep op tot 35 W tijdens de eerste paar seconden en stabiliseerde zich daarna op 28 W, wat overeenkomt met de vooraf ingestelde BIOS-instellingen. Ter vergelijking, dezelfde CPU in het eerder genoemde Lenovo systeem zou hoger oplopen tot 64 W alvorens te stabiliseren op 28 W.
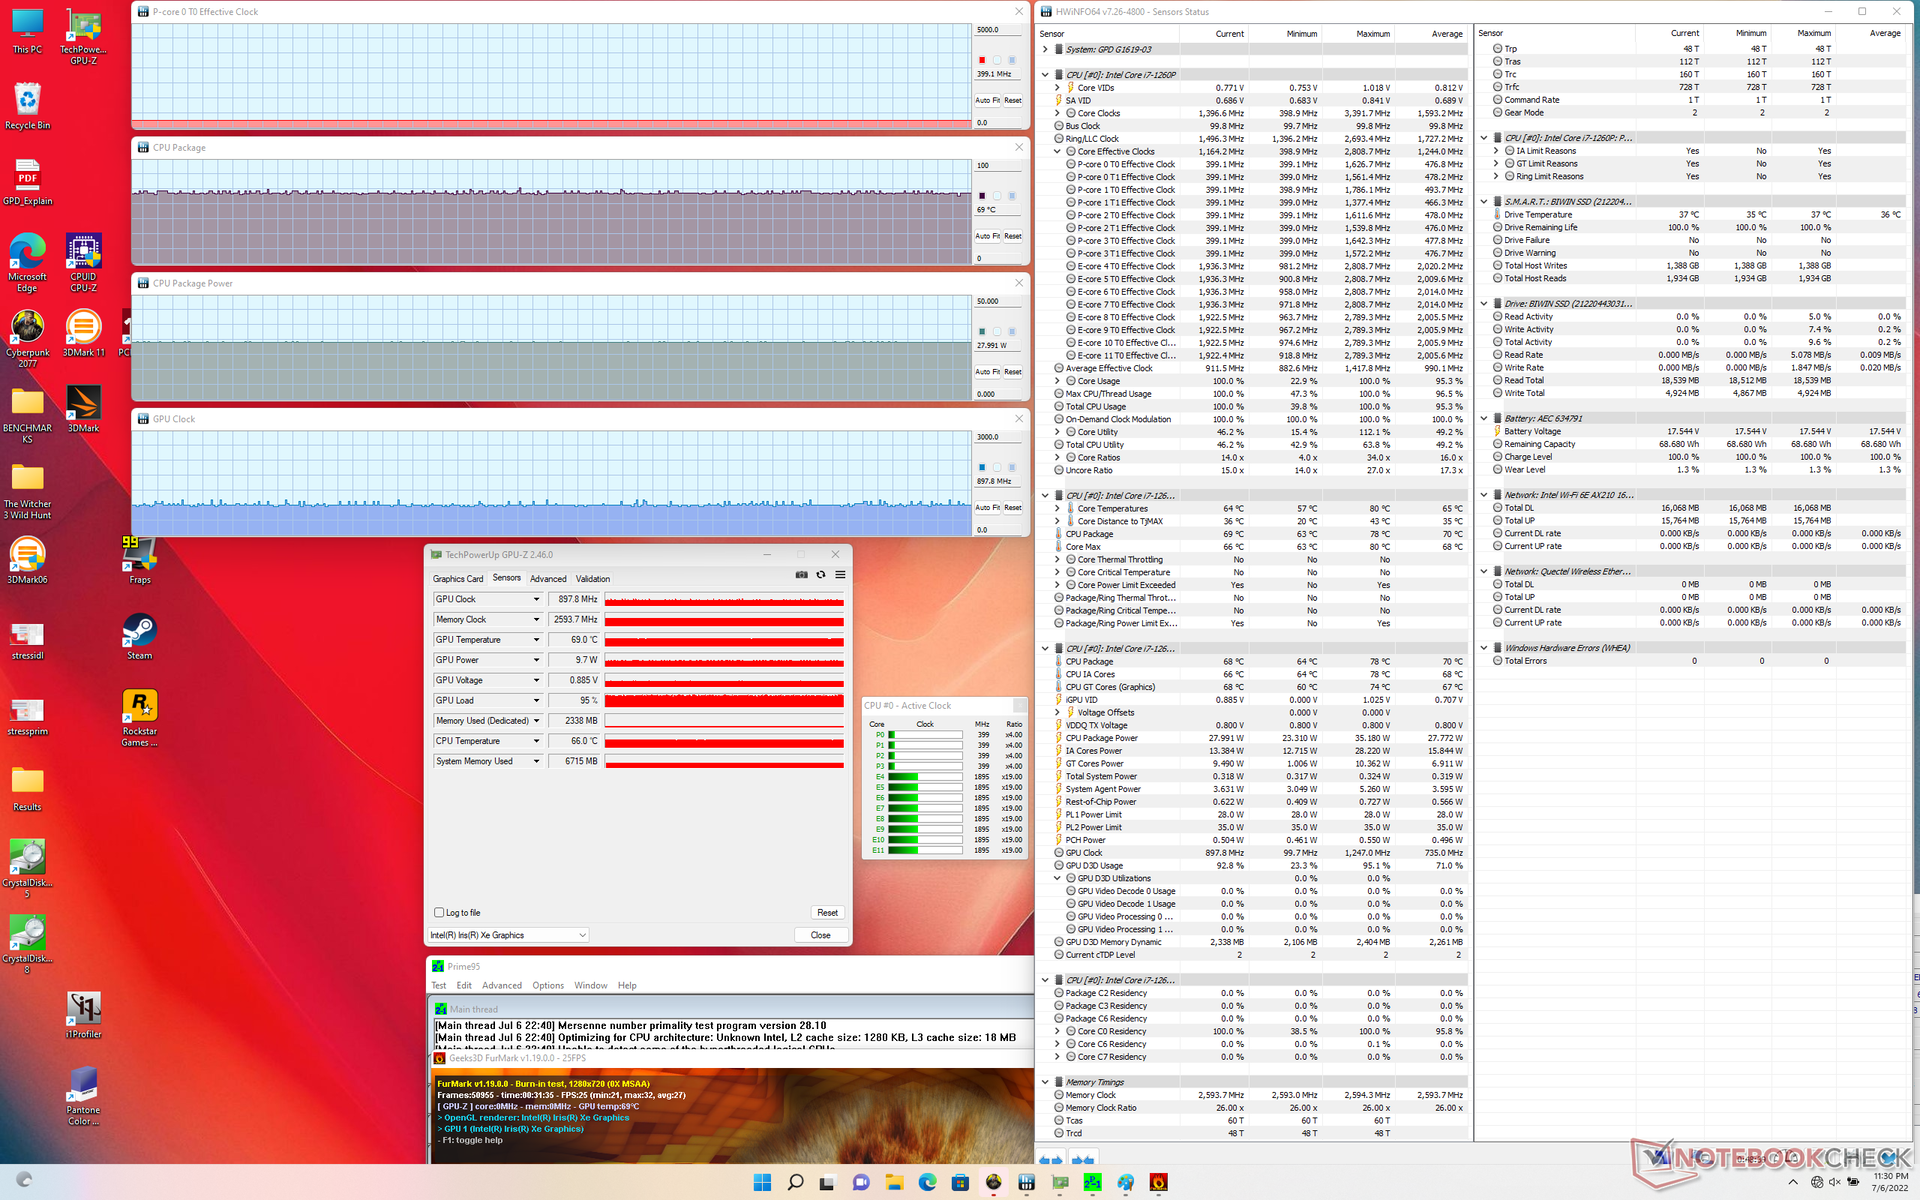
Wanneer Witcher 3stabiliseren de GPU kloksnelheden en de temperatuur zich op respectievelijk 898 MHz en 71 C, vergeleken met 1147 MHz en 65 C op de Lenovo. Bijgevolg is de Lenovo ook in staat om 3 tot 5 procent hogere 3DMark resultaten te bieden dan onze GPD.
Draaien op batterijvoeding zal de CPU of GPU prestaties niet verminderen. Onze 3DMark 11 scores zouden in essentie gelijk blijven tussen batterij en netstroom.
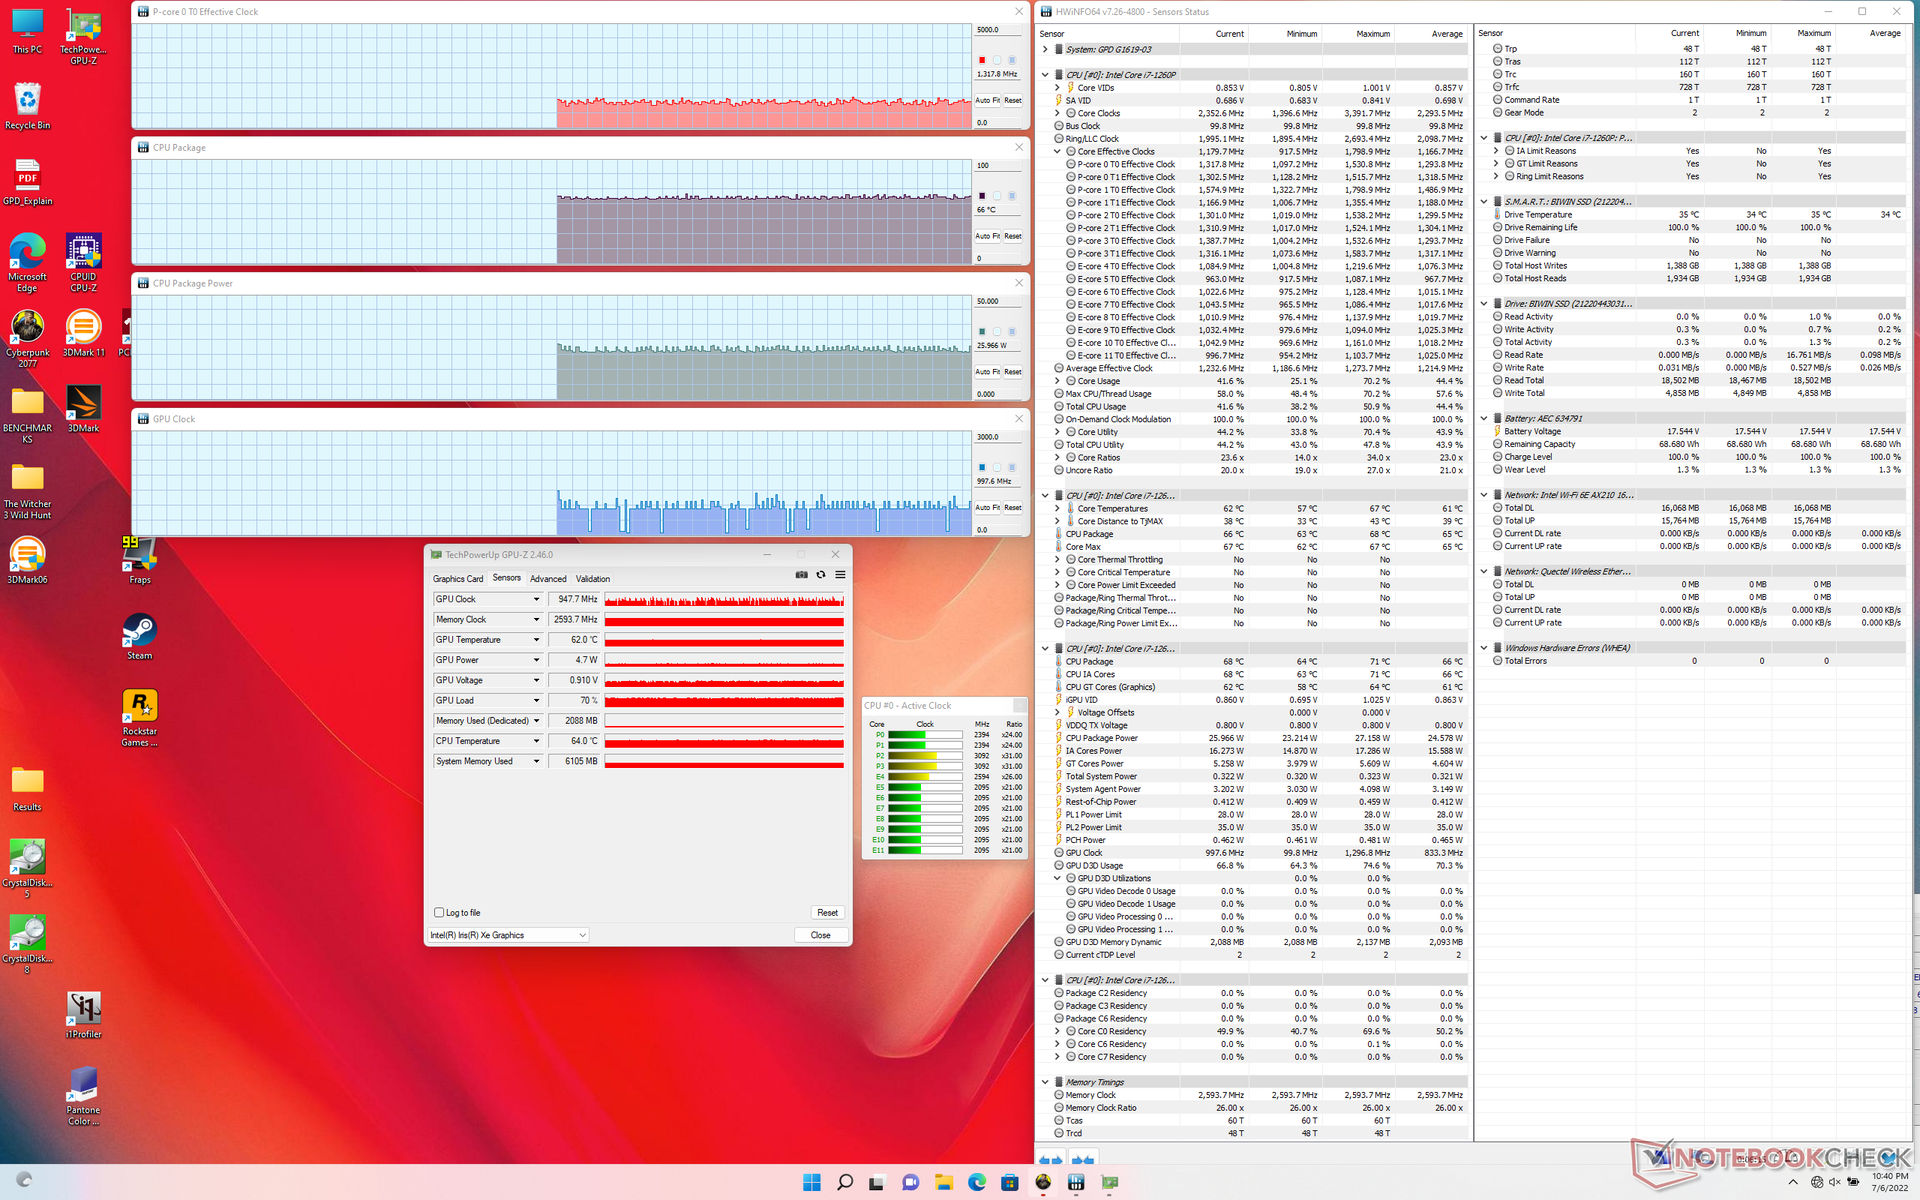
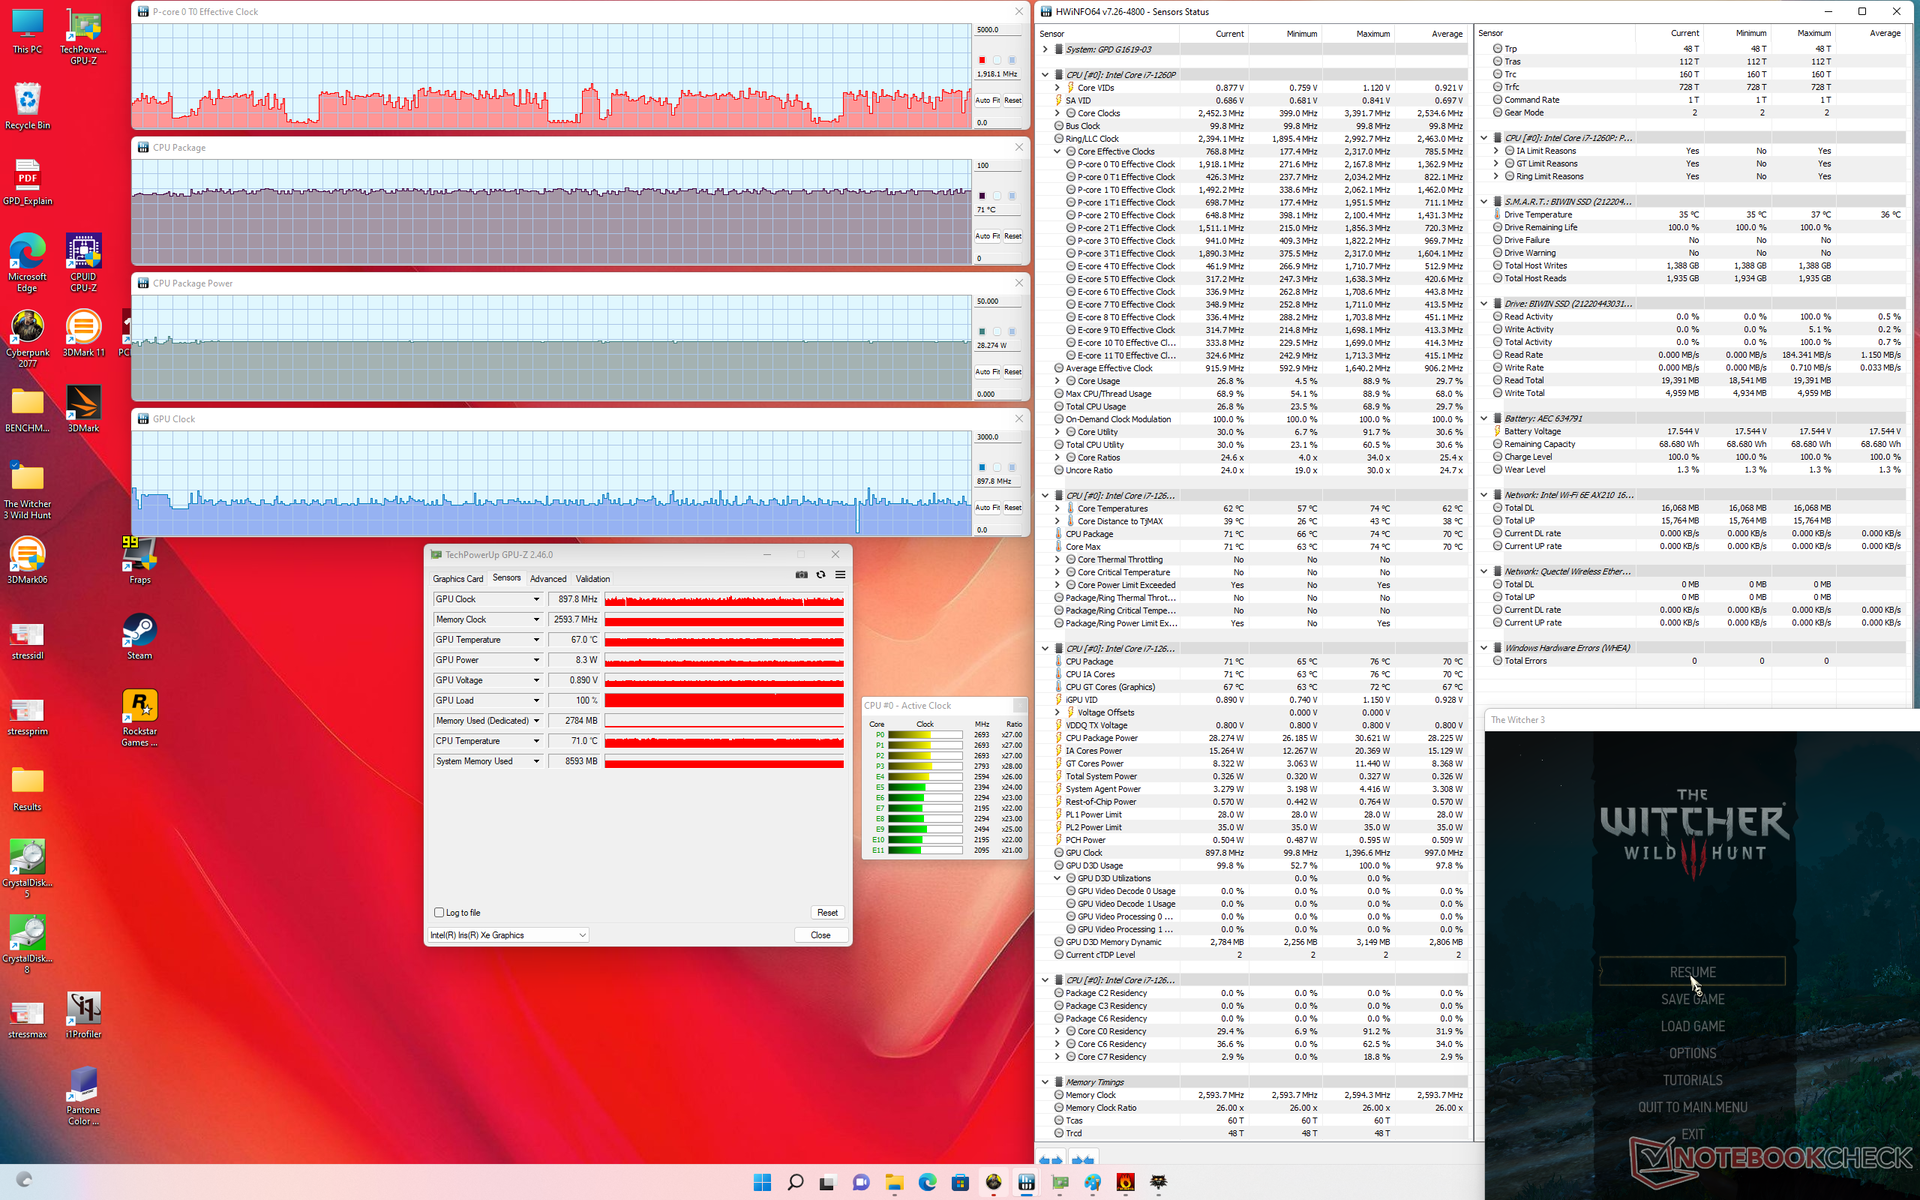
| CPU Klok (GHz) | GPU Klok (MHz) | Gemiddelde CPU Temperatuur (°C) | |
| Systeem in rusttoestand | -- | -- | 66 |
| Prime95 Stress | 0.4 | -- | 72 |
| Prime95 + FurMark Stress | 0.4 | 898 | 69 |
| Witcher 3 Stress | ~0.4 - 2.0 | 898 | 71 |
Sprekers
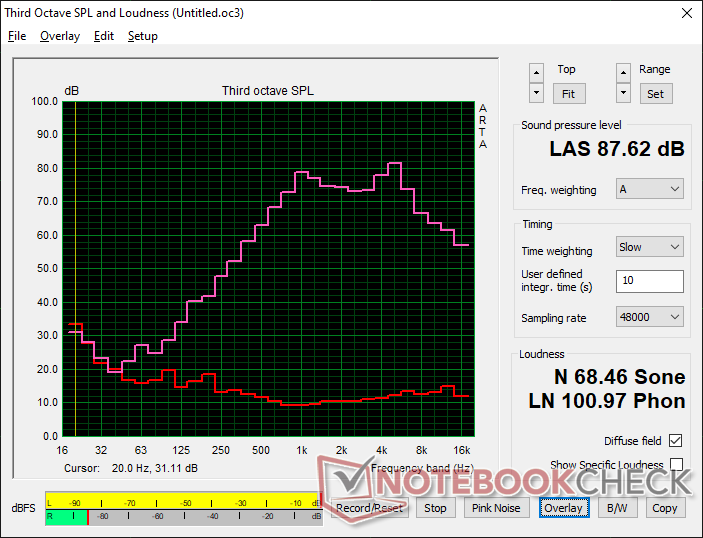
GPD Win Max 2 audioanalyse
(+) | luidsprekers kunnen relatief luid spelen (87.6 dB)
Bas 100 - 315 Hz
(-) | bijna geen lage tonen - gemiddeld 27.6% lager dan de mediaan
(±) | lineariteit van de lage tonen is gemiddeld (8.2% delta ten opzichte van de vorige frequentie)
Midden 400 - 2000 Hz
(±) | hogere middens - gemiddeld 6.4% hoger dan de mediaan
(+) | de middentonen zijn lineair (6.9% delta ten opzichte van de vorige frequentie)
Hoog 2 - 16 kHz
(±) | higher highs - on average 6.4% higher than median
(±) | lineariteit van de hoogtepunten is gemiddeld (7% delta ten opzichte van de vorige frequentie)
Algemeen 100 - 16.000 Hz
(±) | lineariteit van het totale geluid is gemiddeld (21.3% verschil met de mediaan)
Vergeleken met dezelfde klasse
» 72% van alle geteste apparaten in deze klasse waren beter, 5% vergelijkbaar, 23% slechter
» De beste had een delta van 5%, het gemiddelde was 18%, de slechtste was 53%
Vergeleken met alle geteste toestellen
» 59% van alle geteste apparaten waren beter, 7% gelijk, 33% slechter
» De beste had een delta van 4%, het gemiddelde was 23%, de slechtste was 134%
Apple MacBook Pro 16 2021 M1 Pro audioanalyse
(+) | luidsprekers kunnen relatief luid spelen (84.7 dB)
Bas 100 - 315 Hz
(+) | goede baars - slechts 3.8% verwijderd van de mediaan
(+) | de lage tonen zijn lineair (5.2% delta naar de vorige frequentie)
Midden 400 - 2000 Hz
(+) | evenwichtige middens - slechts 1.3% verwijderd van de mediaan
(+) | de middentonen zijn lineair (2.1% delta ten opzichte van de vorige frequentie)
Hoog 2 - 16 kHz
(+) | evenwichtige hoogtepunten - slechts 1.9% verwijderd van de mediaan
(+) | de hoge tonen zijn lineair (2.7% delta naar de vorige frequentie)
Algemeen 100 - 16.000 Hz
(+) | het totale geluid is lineair (4.6% verschil met de mediaan)
Vergeleken met dezelfde klasse
» 0% van alle geteste apparaten in deze klasse waren beter, 0% vergelijkbaar, 100% slechter
» De beste had een delta van 5%, het gemiddelde was 17%, de slechtste was 45%
Vergeleken met alle geteste toestellen
» 0% van alle geteste apparaten waren beter, 0% gelijk, 100% slechter
» De beste had een delta van 4%, het gemiddelde was 23%, de slechtste was 134%
Energiebeheer
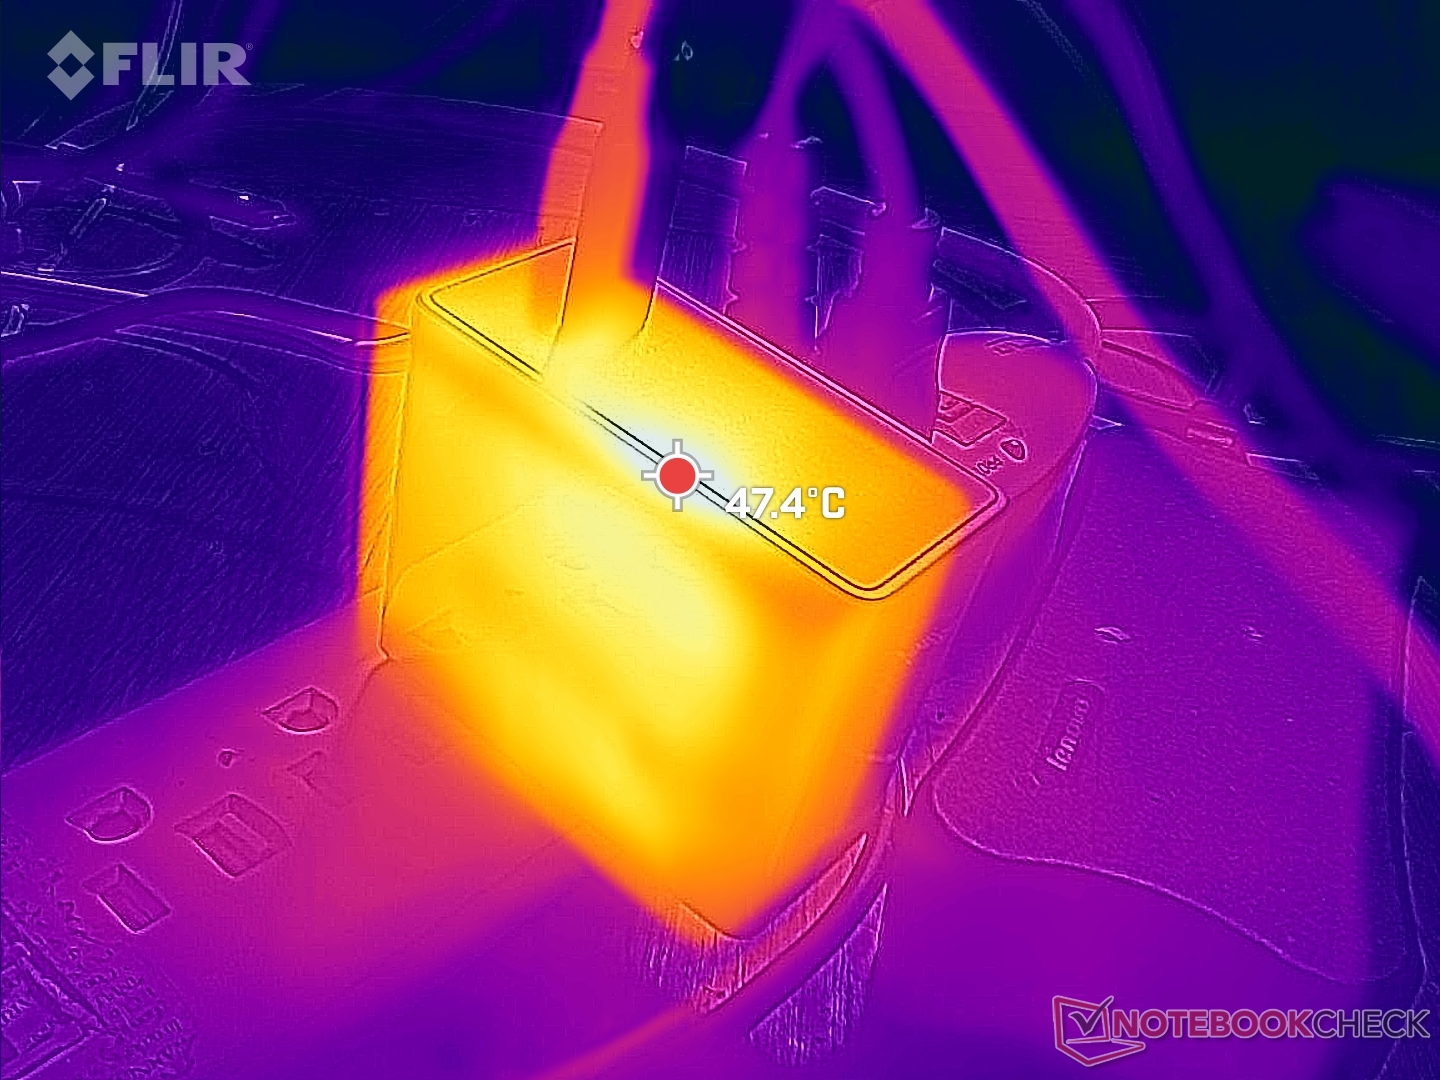
Stroomverbruik - Hoge prestaties, hoge stroomkosten
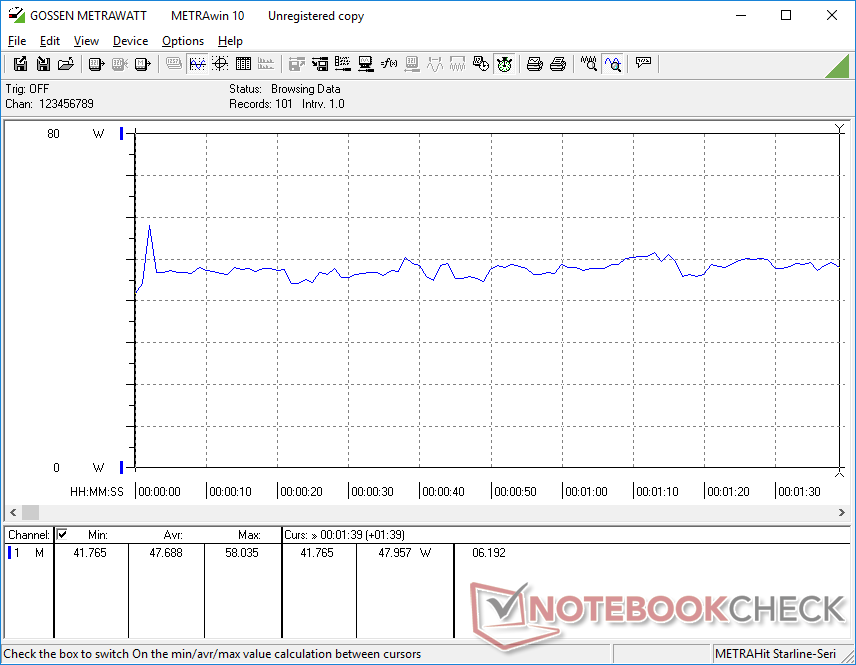
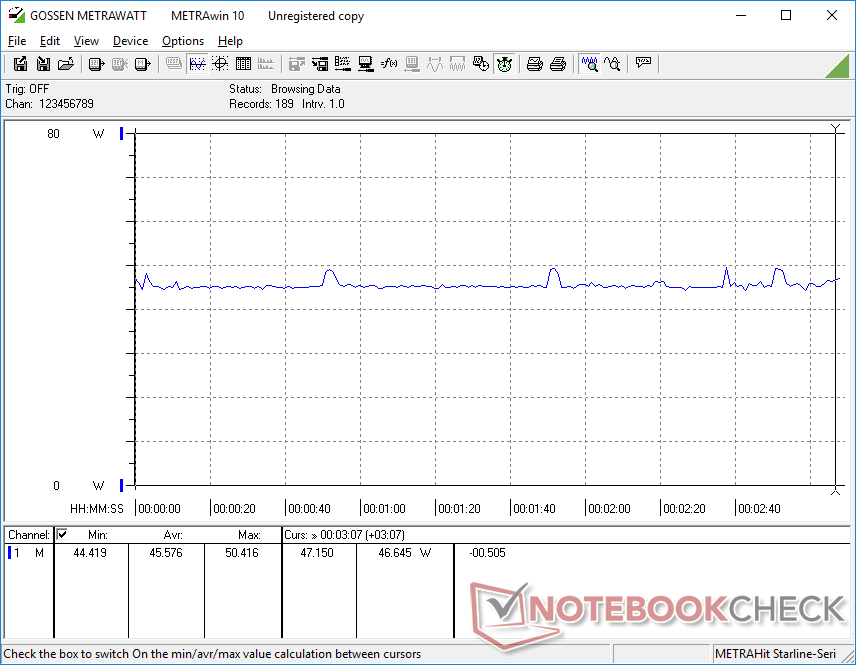
Het energieverbruik is over de hele linie hoger in vergelijking met de GPD-producten van vorig jaar, dankzij het grotere schermformaat, de hogere native resolutie en de veeleisendere Intel 12e generatie processor. Met Witcher 3 zou ongeveer 46 W trekken, bijna 60 procent meer dan op de Win 3 met een 11e gen Tiger Lake-U CPU. Gelukkig heeft de fabrikant rekening gehouden met het hogere stroomverbruik door een grotere batterij te installeren in de Win Max 2, zoals blijkt uit de volgende sectie hieronder
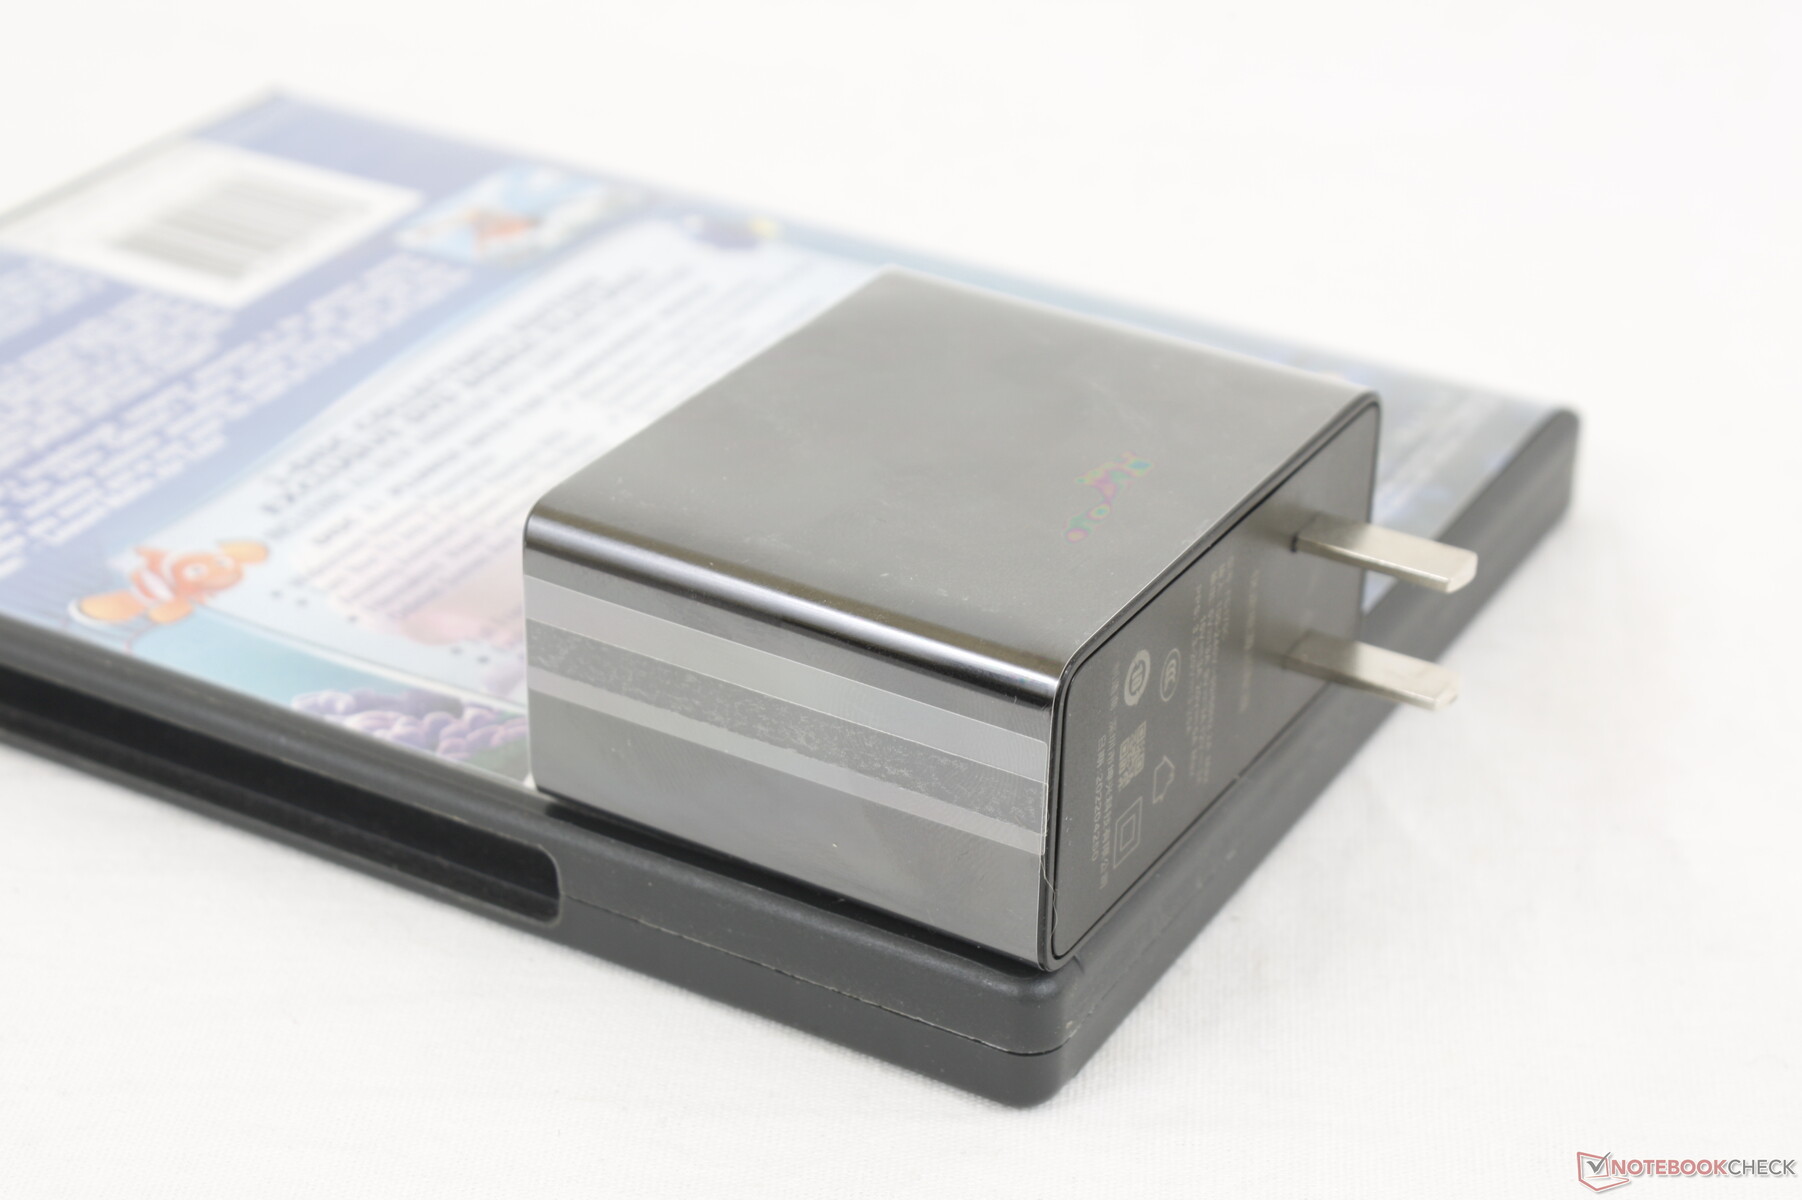
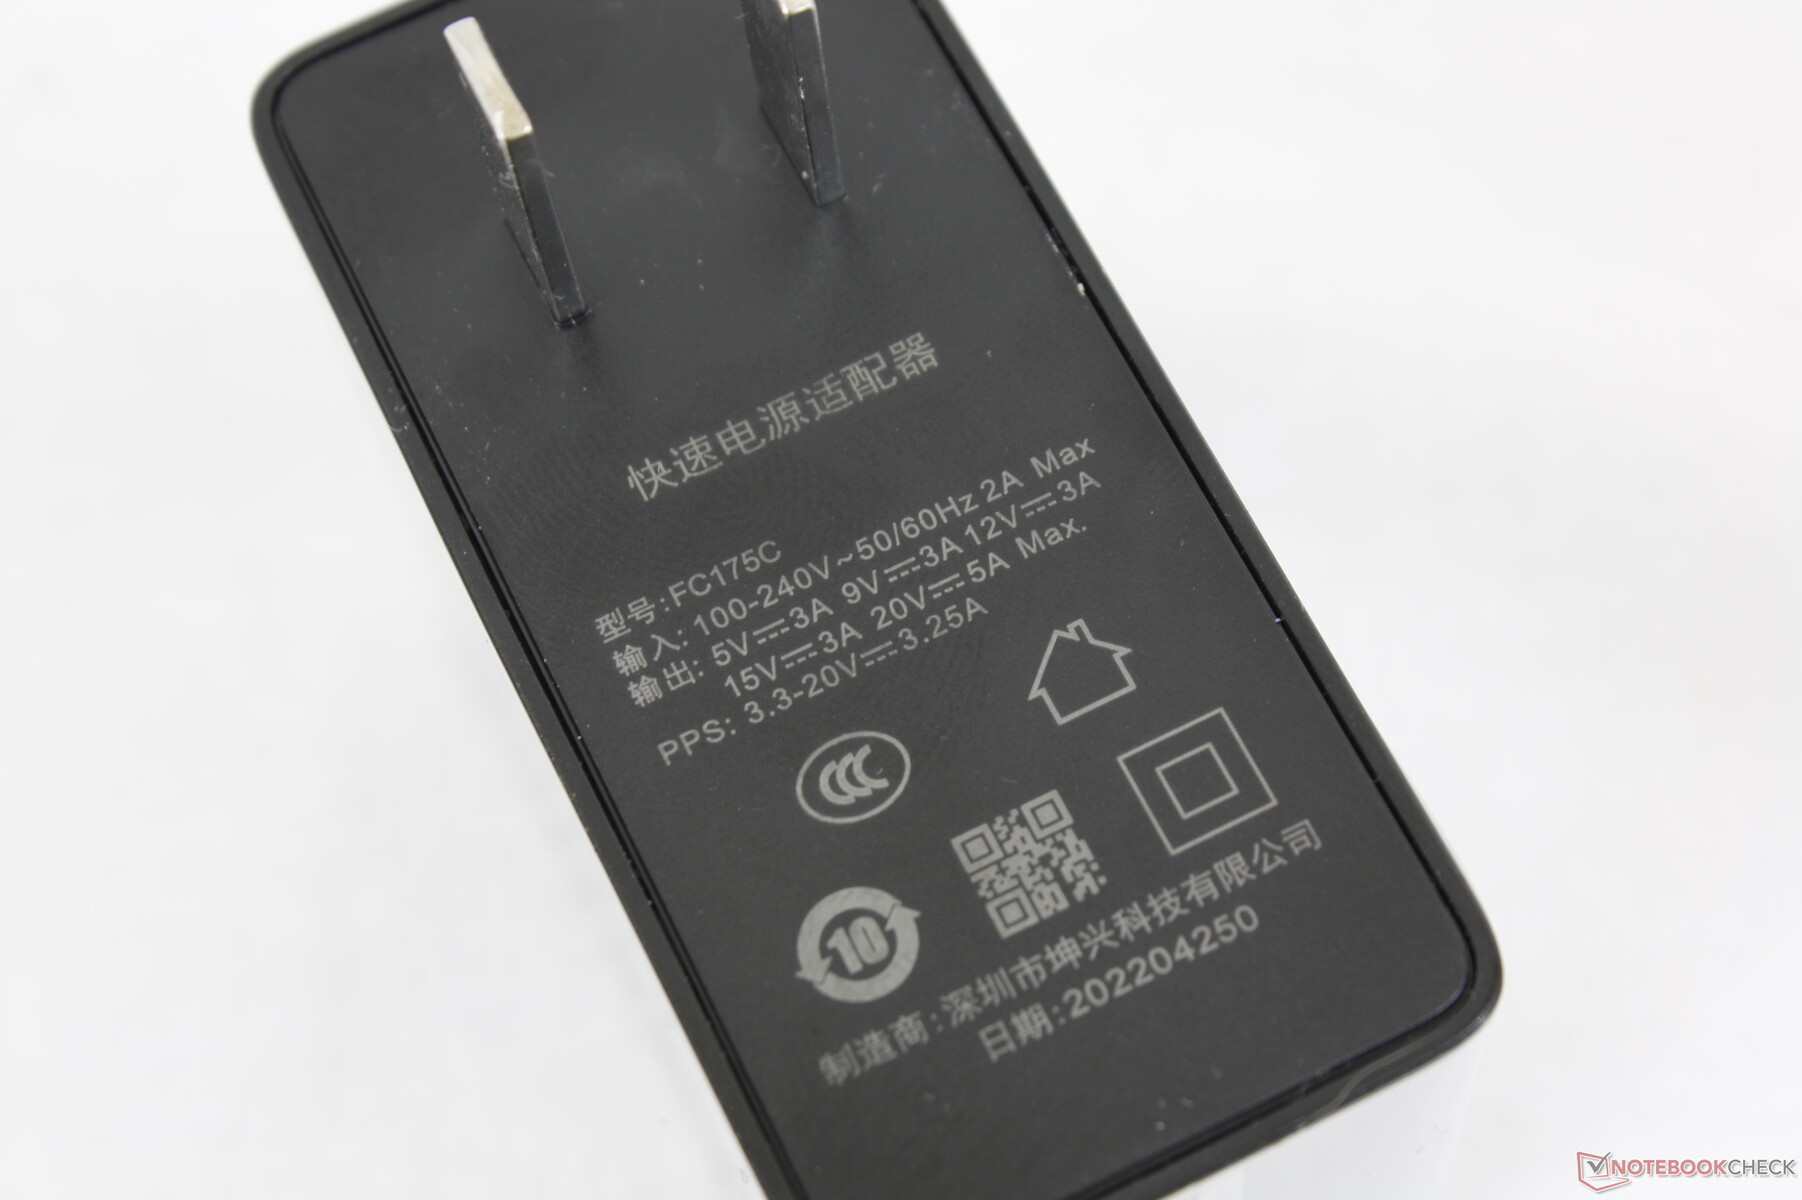
We zijn in staat om een tijdelijke maximale trek van 76 W te registreren van de kleine (~6,6 x 5,3 x 3,2 cm) 100 W USB-C AC-adapter. De adapter kan ook worden gebruikt om de meeste andere USB-C apparaten snel op te laden.
| Uit / Standby | |
| Inactief | |
| Belasting |
|
Key:
min: | |
| GPD Win Max 2 i7-1260P, Iris Xe G7 96EUs, BiWin NQ200 1TB CNF82GS1D00-1TB, IPS, 2560x1600, 10.1" | GPD Pocket 3 i7-1195G7, Iris Xe G7 96EUs, BiWin NQ200 1TB CNF82GS1D00-1TB, IPS, 1920x1200, 8" | GPD Win Max 2021 R7 4800U, Vega 8, BIWIN NS200 512GB CNF82GS1G00-512, IPS, 1280x800, 8" | GPD Win 3 i5-1135G7, Iris Xe G7 80EUs, BIWIN NS200 1TB CNF82GS1G02-1TB, IPS, 1280x720, 5.5" | Microsoft Surface Go 3 Core i3 i3-10100Y, UHD Graphics 615, SK hynix HFB1M8MQ331C0MR, IPS , 1920x1280, 10.5" | Lenovo IdeaPad Flex 3 11IGL05 Celeron N4020, UHD Graphics 600, SanDisk DA4064, IPS LED, 1366x768, 11.6" | |
|---|---|---|---|---|---|---|
| Power Consumption | 1% | 28% | 45% | 55% | 66% | |
| Idle Minimum * (Watt) | 5.8 | 9.6 -66% | 5.2 10% | 2.9 50% | 2.6 55% | 2.4 59% |
| Idle Average * (Watt) | 10.2 | 11 -8% | 6.5 36% | 4.5 56% | 5.1 50% | 4.5 56% |
| Idle Maximum * (Watt) | 11.5 | 11.8 -3% | 7.4 36% | 4.5 61% | 5.9 49% | 4.6 60% |
| Load Average * (Watt) | 47.7 | 39 18% | 37.2 22% | 38.5 19% | 22.9 52% | 12.8 73% |
| Witcher 3 ultra * (Watt) | 45.6 | 36.4 20% | 38.1 16% | 28.9 37% | ||
| Load Maximum * (Watt) | 76.8 | 42 45% | 39 49% | 41.4 46% | 24.6 68% | 14.3 81% |
* ... kleiner is beter
Power Consumption Witcher 3 / Stresstest
Power Consumption external Monitor
Batterijlevensduur - Geweldig voor de grootte
De batterij van 70 Wh is groot voor zo'n kleine vormfactor. Ter vergelijking, de originele 2021 Win Max of 11,6-inch Lenovo IdeaPad Flex 3 11 laptop worden geleverd met kleinere batterijen van respectievelijk 57 Wh en 37 Wh
Gebruikers kunnen bijna 9 uur real-world browsen verwachten, net zo lang of zelfs langer dan de meeste huidige Ultrabooks onder vergelijkbare belasting. De gametijd is echter veel korter, met slechts ongeveer 2 tot 3 uur
Het opladen van leeg naar vol met de meegeleverde AC-adapter duurt ongeveer 1,5 uur.
| GPD Win Max 2 i7-1260P, Iris Xe G7 96EUs, 70 Wh | GPD Pocket 3 i7-1195G7, Iris Xe G7 96EUs, 39 Wh | GPD Win Max 2021 R7 4800U, Vega 8, 57 Wh | GPD Win 3 i5-1135G7, Iris Xe G7 80EUs, 44 Wh | Microsoft Surface Go 3 Core i3 i3-10100Y, UHD Graphics 615, 28 Wh | Lenovo IdeaPad Flex 3 11IGL05 Celeron N4020, UHD Graphics 600, 37.5 Wh | |
|---|---|---|---|---|---|---|
| Batterijduur | -31% | 7% | 3% | -20% | 7% | |
| Reader / Idle (h) | 15.4 | |||||
| WiFi v1.3 (h) | 8.7 | 6 -31% | 9.3 7% | 11.3 30% | 7 -20% | 9.3 7% |
| Load (h) | 1.7 | 1.3 -24% |
Pro
Contra
Verdict - Goed met Intel, beter met AMD
We waren niet erg onder de indruk van de de originele 2021 Win Max. Hoewel het leuk was om op te spelen, was het ook moeilijk om voorbij het smalle kleurenspectrum, merkbare ghosting, onhandige toetsenbordindeling, krakend chassisontwerp, trage Wi-Fi en het ontbreken van een geïntegreerde webcam te kijken. De 2022 Win Max 2 heeft al deze zorgen weggenomen voor een ervaring die zijn vraagprijs waardig aanvoelt. Gebruikers krijgen veel meer uit zo'n klein chassis in termen van prestaties, beeldschermkwaliteit en connectiviteit. Zelfs als je niet van plan bent om veel te gamen op de Win Max 2, zijn hoge resolutie touchscreen, 4G LTE, uitstekende docking mogelijkheden, en compacte formaat kan zeker van pas komen voor andere gebruiksscenario's
De GPD Win Max 2 doet veel dingen goed door zowel Intel als AMD opties aan te bieden en een chassis van hogere kwaliteit met een levendig 1600p IPS touchscreen.
Als je gaat gamen, zul je echter in gedachten willen houden dat de AMD SKU snellere prestaties kan bieden voor dezelfde prijs, ten koste van het laten vallen van Thunderbolt ondersteuning. Het relatief zware systeem en de suboptimale plaatsing van de joysticks maken de bediening vermoeiender dan op een lichtere Nintendo Switch of Win 3. Een paar vreemde ontwerpkeuzes, zoals de omgekeerde USB- en HDMI-poorten, moeilijk aan te sluiten WAN-lintkabel en het onvermogen om de schouderknoppen gemakkelijk uit te schakelen, zijn enkele kleine ergernissen om mee om te gaan. We zouden graag 120 Hz OLED zien in de toekomst en misschien zelfs een lichter ontwerp voor comfortabeler handheld gaming.
Prijs en beschikbaarheid
GPD is op dit moment bezig met een Indiegogo voor de Win Max 2. Zowel de Intel als AMD SKU's worden in september verwacht voor $1000 USD per stuk.
GPD Win Max 2
- 09-07-2022 v7 (old)
Allen Ngo
Price comparison

