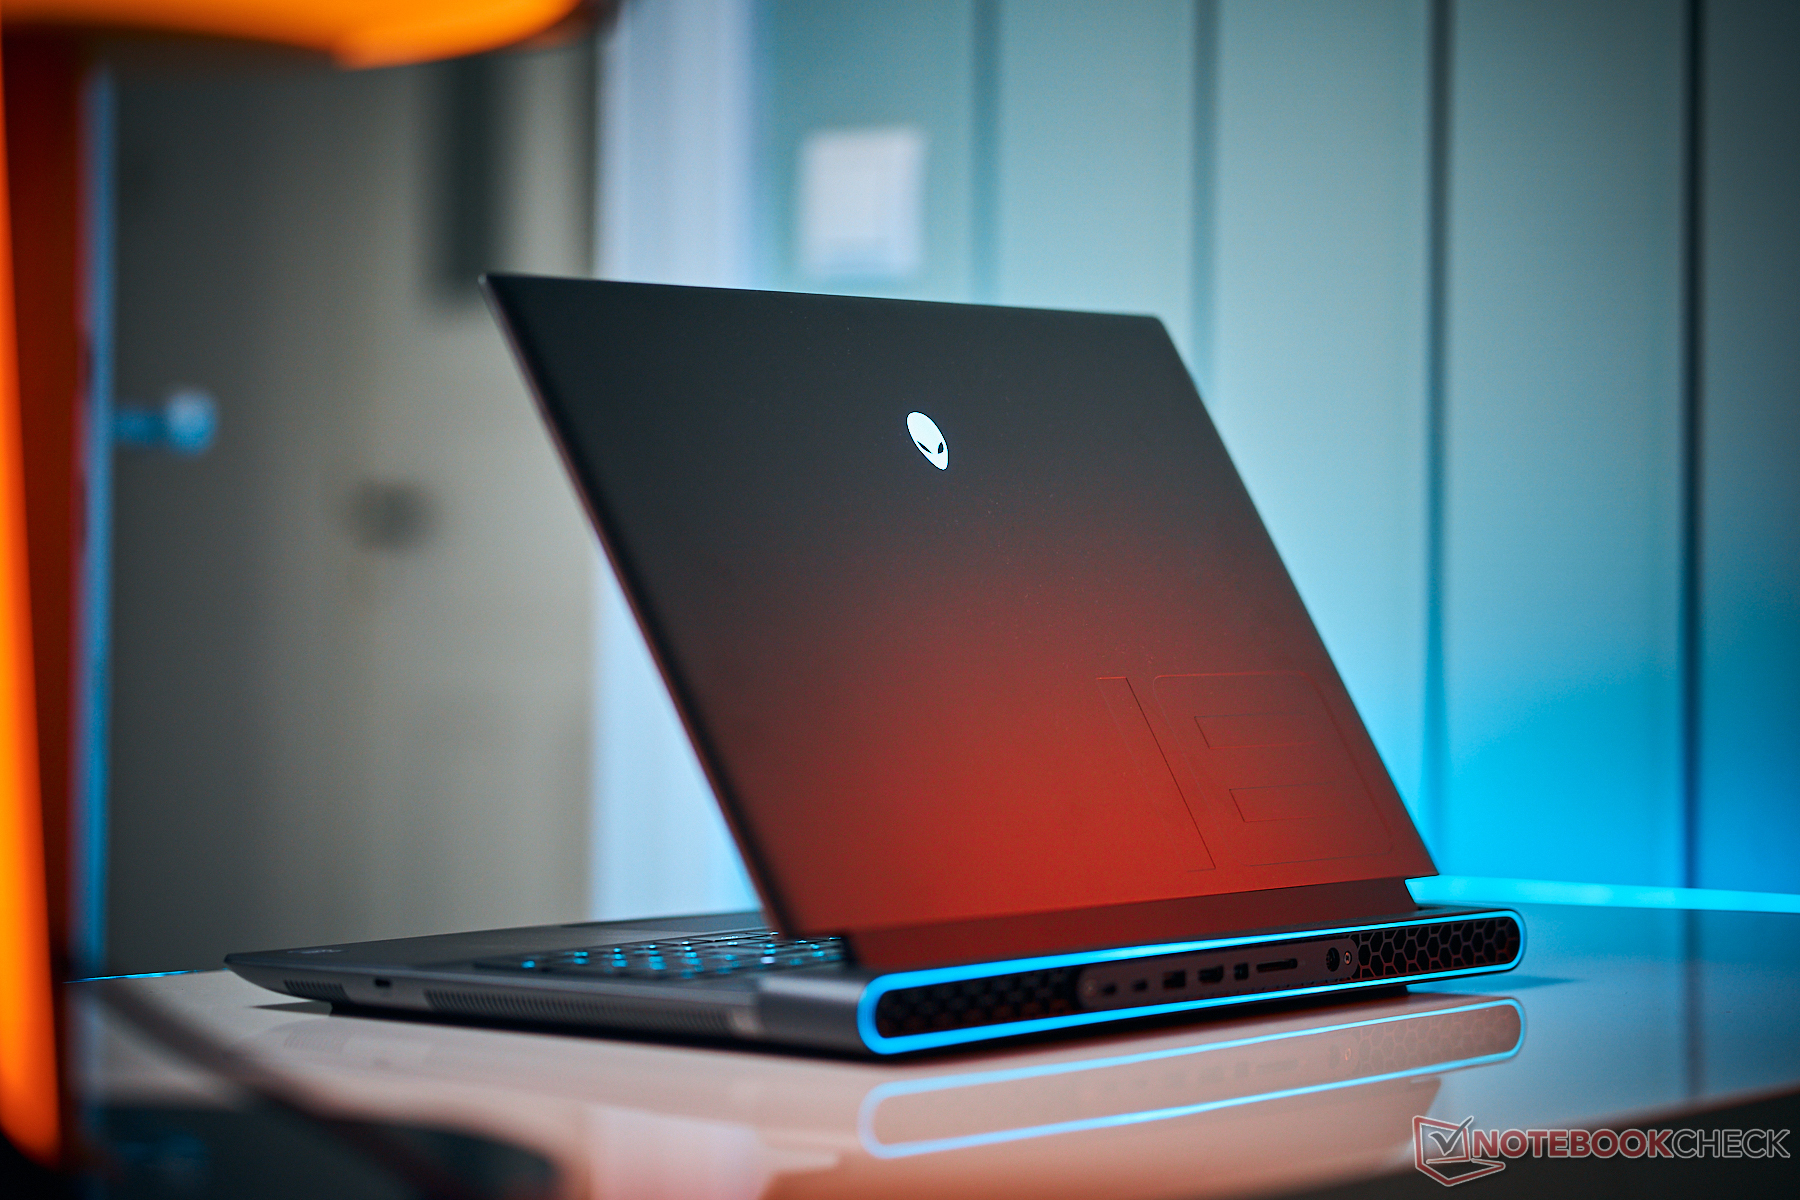
Alienware m18 R2 laptop test: Springen van Core i9-13980HX naar i9-14900HX

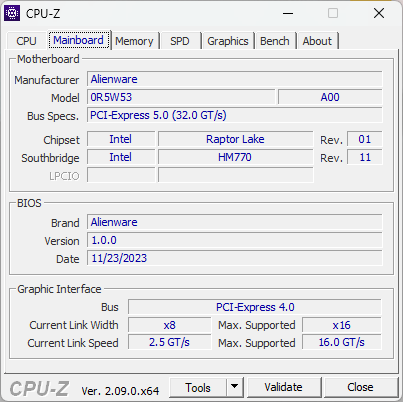
Dell heeft zijn Alienware m18 serie dit jaar opgefrist met de nieuwe m18 R2. In tegenstelling tot de sprong van de m16 R1 naar de m16 R2maakt de m18 R2 gebruik van hetzelfde chassisontwerp als zijn voorganger, maar met nieuwe Raptor Lake-HX Core ix-14000HX CPU's ter vervanging van de oudere Core ix-13000HX opties. Bijna al het andere blijft ongewijzigd, dus we raden u aan om onze bestaande reviews over de m18 R1 en m18 R1 AMD configuraties om meer te weten te komen over de fysieke kenmerken van de m18 r2.
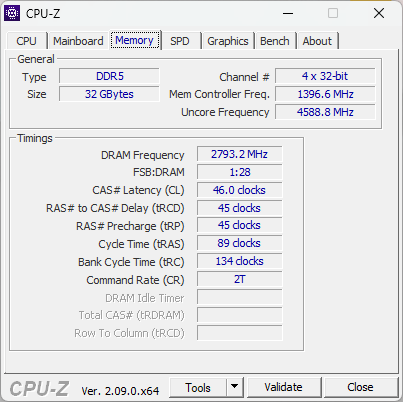
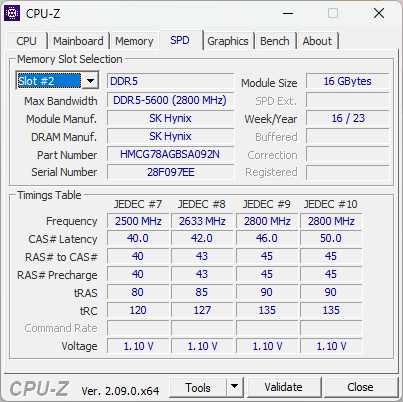
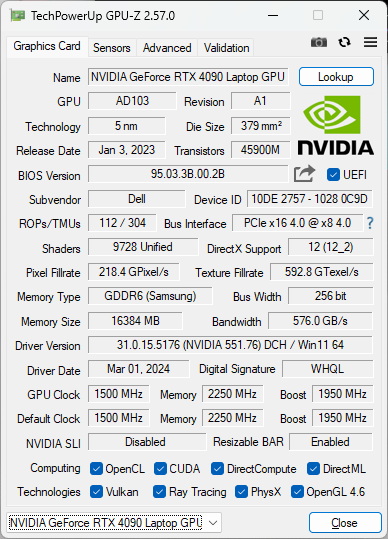
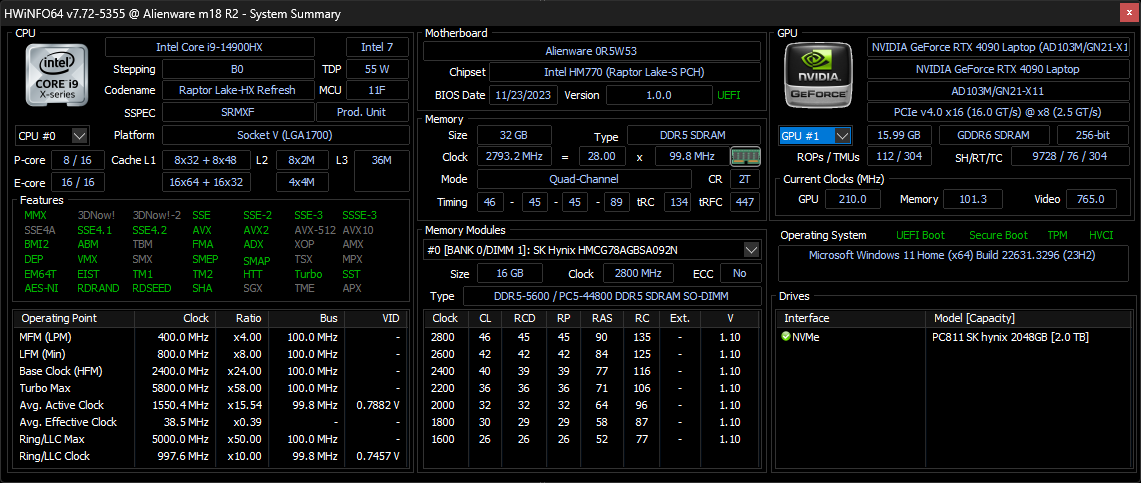
Ons apparaat in deze review is de meest geavanceerde configuratie met de Core i9-14900HX CPU, 175 W GeForce RTX 4090 GPU, 1600p 165 Hz IPS-beeldscherm en CherryMX ultra low-profile mechanisch toetsenbord voor ongeveer $3200. Andere SKU's zijn mogelijk de Core i7-14650HX, RTX 4060, 1200p 480 Hz beeldscherm en standaard membraantoetsenbord vanaf net onder de $2000.
Meer Alienware beoordelingen:
Potentiële concurrenten in vergelijking
Evaluatie | Datum | Model | Gewicht | Hoogte | Formaat | Resolutie | Beste prijs |
|---|---|---|---|---|---|---|---|
| 89.5 % v7 (old) | 03-2024 | Alienware m18 R2 i9-14900HX, GeForce RTX 4090 Laptop GPU | 4 kg | 26.7 mm | 18.00" | 2560x1600 | |
| 89.2 % v7 (old) | 11-2023 | Alienware m18 R1 AMD R9 7945HX, Radeon RX 7900M | 3.9 kg | 26.7 mm | 18.00" | 1920x1200 | |
| 90.7 % v7 (old) | 04-2023 | Alienware m18 R1 i9-13980HX, GeForce RTX 4090 Laptop GPU | 3.9 kg | 26.7 mm | 18.00" | 1920x1200 | |
| 88.8 % v7 (old) | 01-2024 | MSI Titan 18 HX A14VIG i9-14900HX, GeForce RTX 4090 Laptop GPU | 3.6 kg | 32.1 mm | 18.00" | 3840x2400 | |
| 87.4 % v7 (old) | 03-2023 | Asus ROG Strix G18 G814JI i7-13650HX, GeForce RTX 4070 Laptop GPU | 3 kg | 31 mm | 18.00" | 2560x1600 | |
| 88.3 % v7 (old) | 10-2023 | Acer Predator Helios 18 N23Q2 i9-13900HX, GeForce RTX 4080 Laptop GPU | 3.2 kg | 29.15 mm | 18.00" | 2560x1600 |
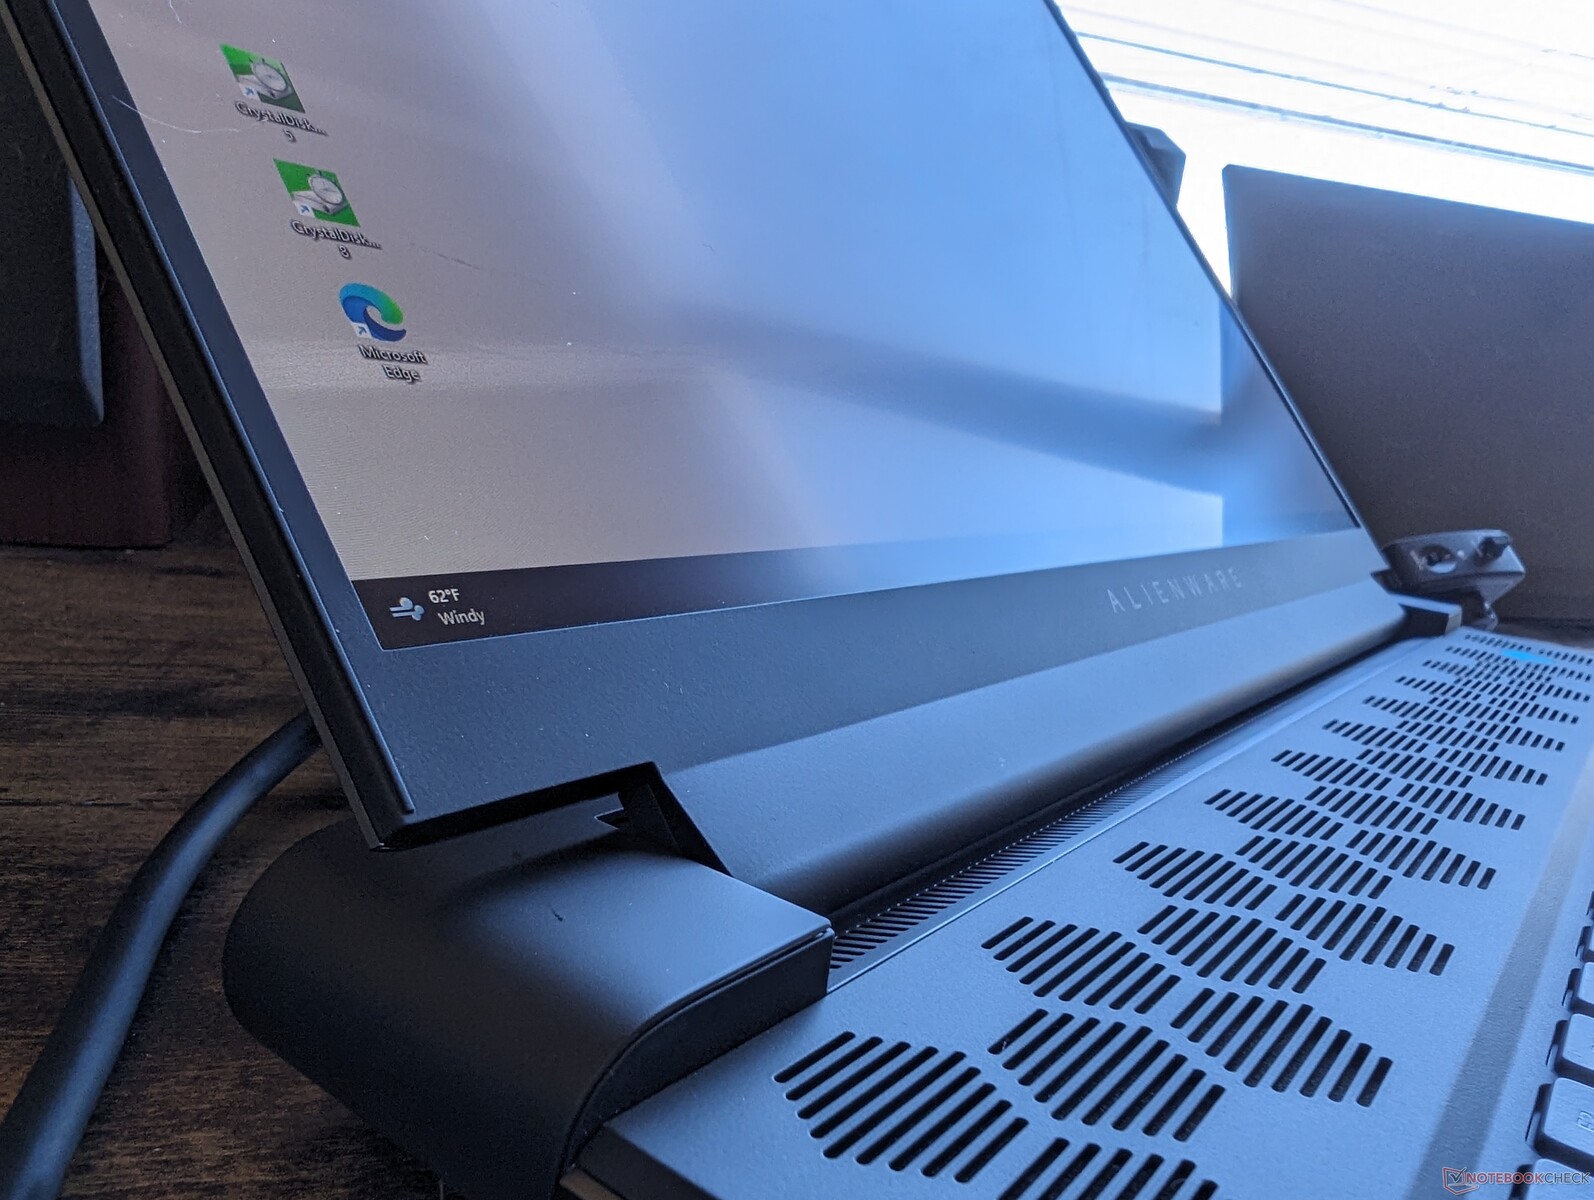
Case - Nog steeds groot met een thermisch achterdek
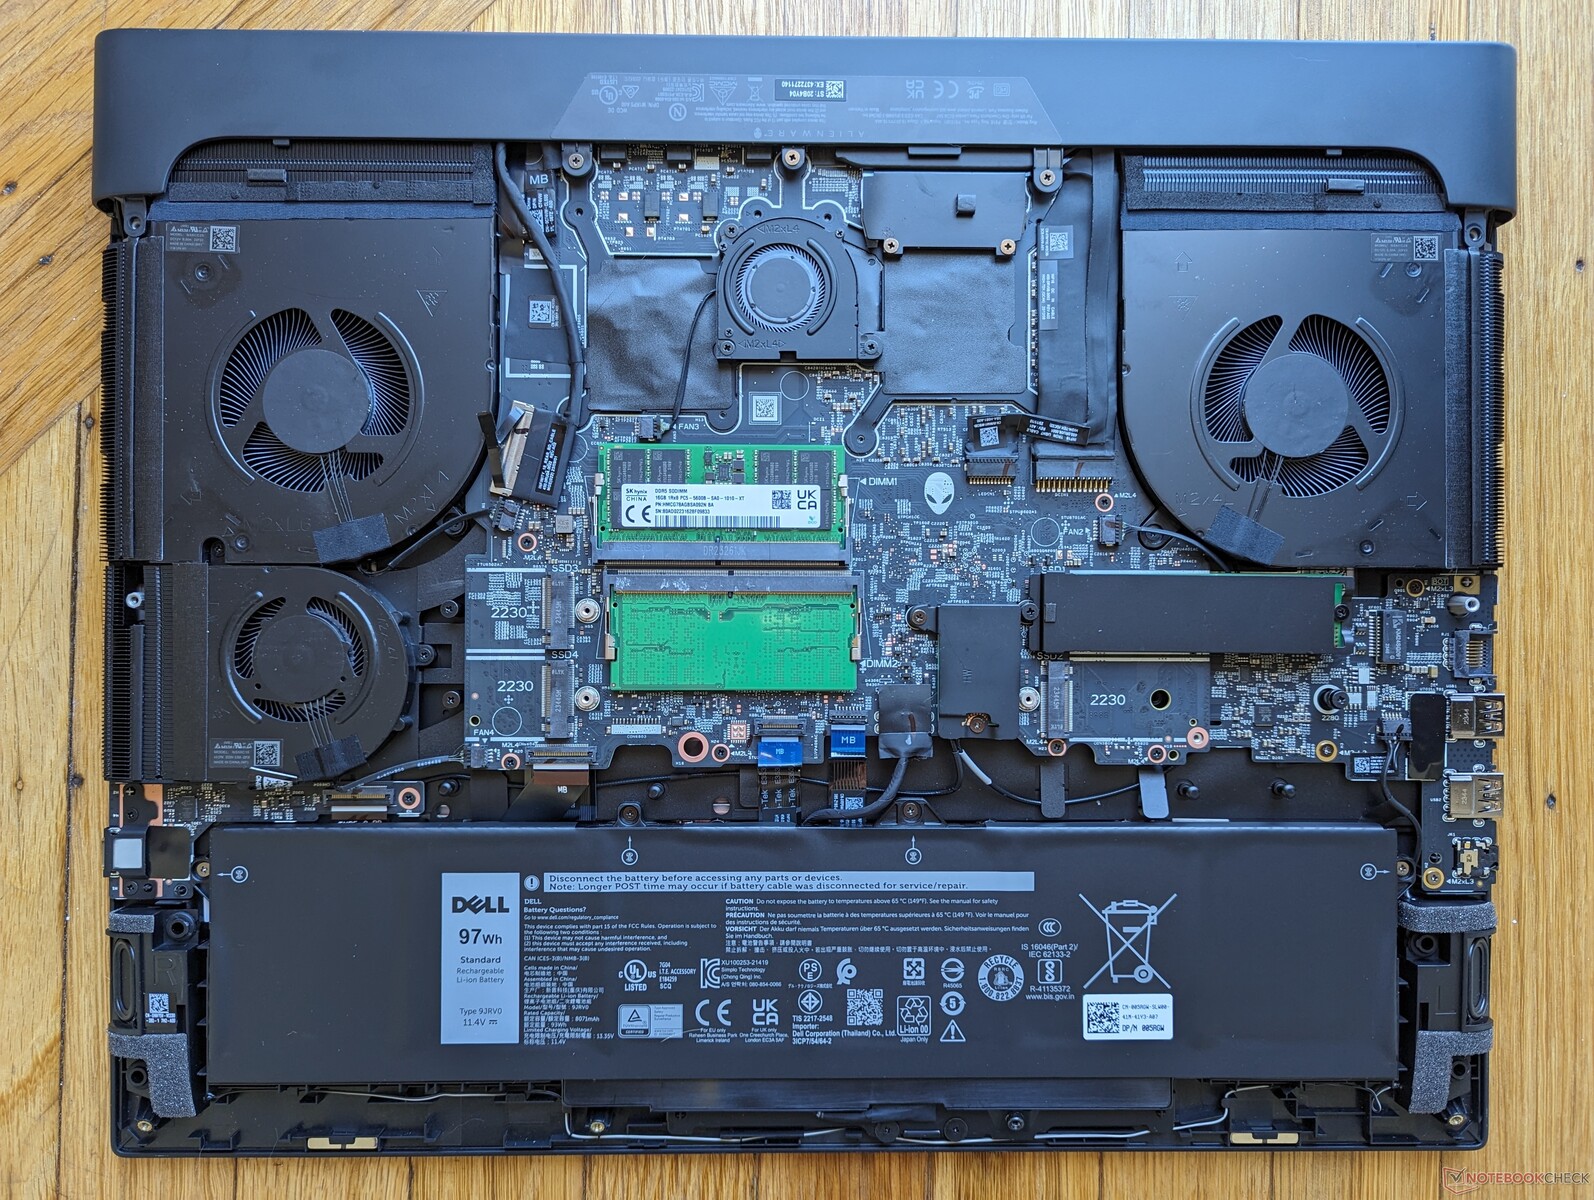
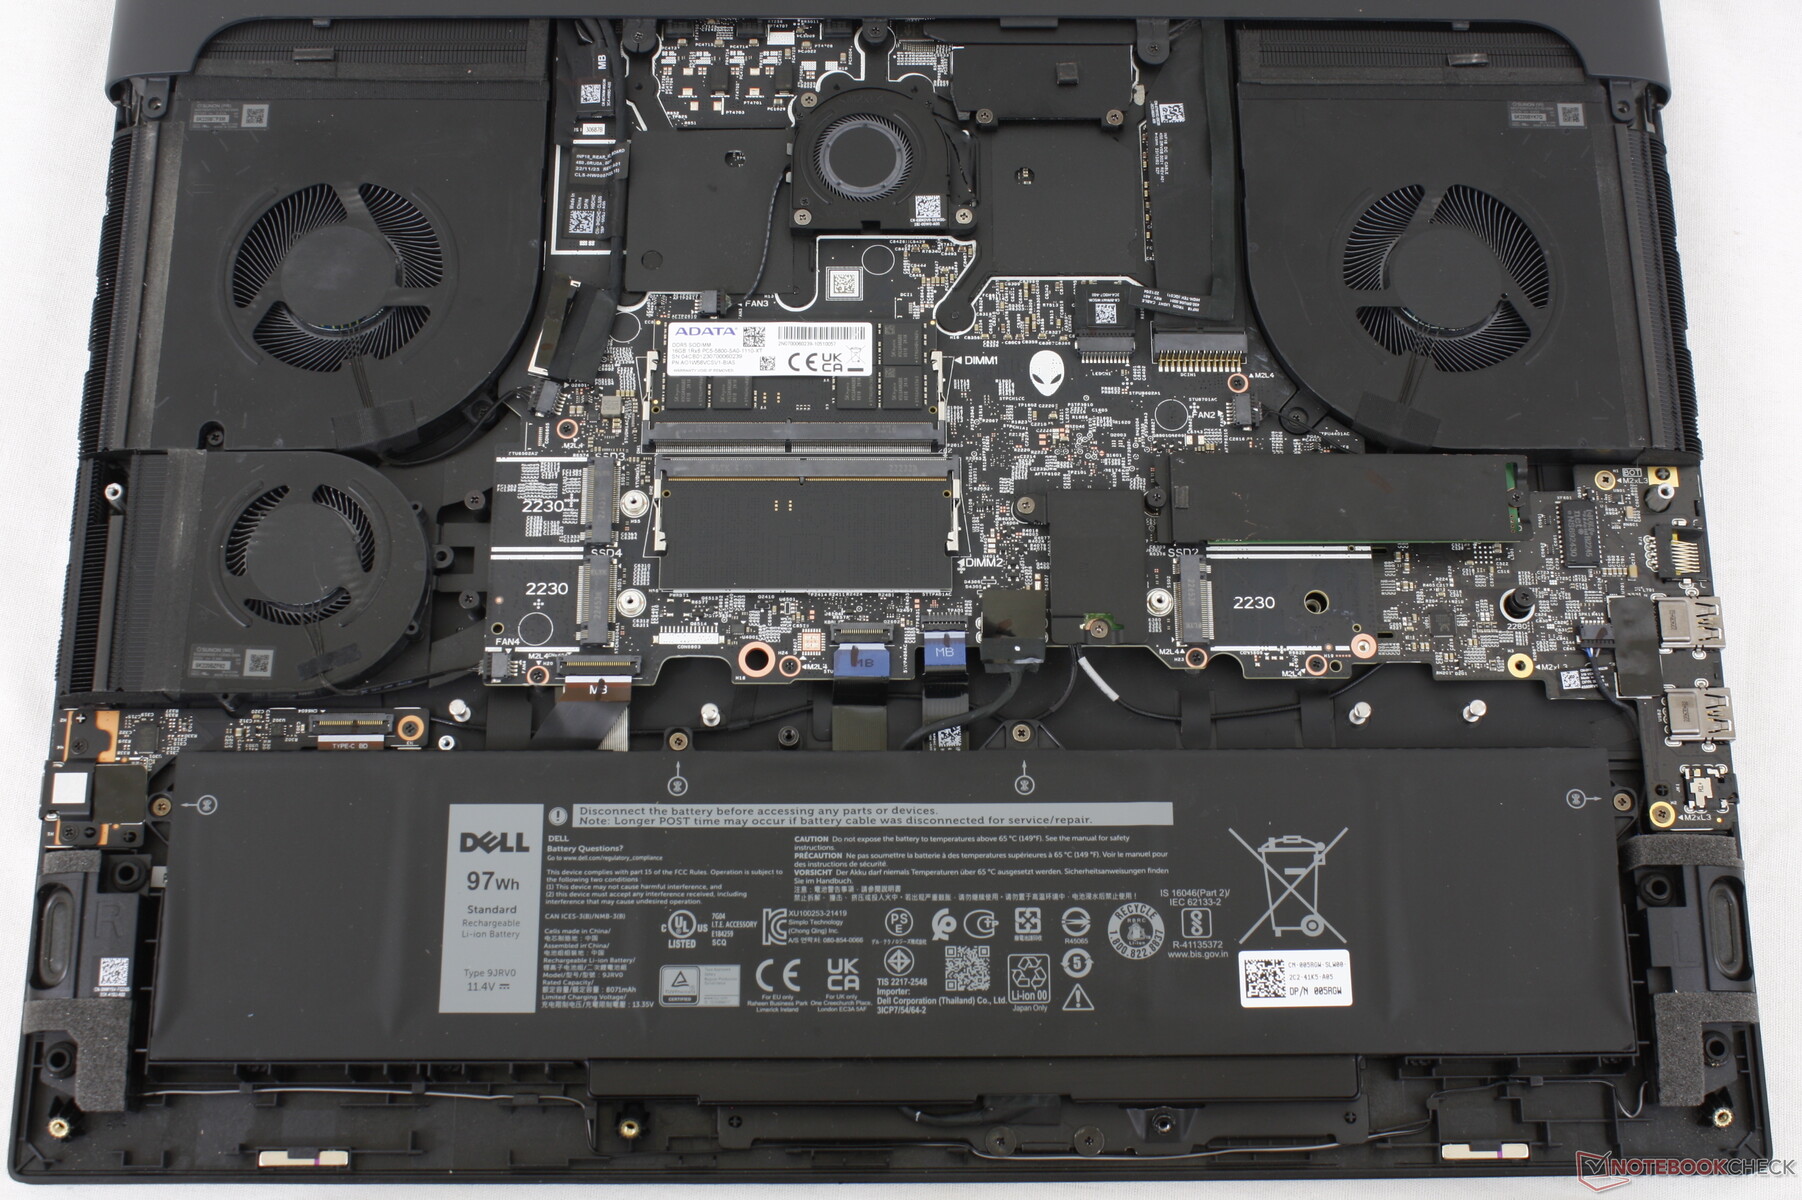
De RJ-45 poort is dit jaar geüpgraded van de Killer E3000 naar de Killer E5000 voor 2x zo veel doorvoer (2,5 Gbps vs. 5 Gbps). Voor de rest is het externe ontwerp hetzelfde gebleven.
SD-kaartlezer
| SD Card Reader | |
| average JPG Copy Test (av. of 3 runs) | |
| Alienware m18 R1 (Angelibird AV Pro V60) | |
| Alienware m18 R2 (Toshiba Exceria Pro SDXC 64 GB UHS-II) | |
| Alienware m18 R1 AMD (Toshiba Exceria Pro SDXC 64 GB UHS-II) | |
| MSI Titan 18 HX A14VIG (Toshiba Exceria Pro SDXC 64 GB UHS-II) | |
| Acer Predator Helios 18 N23Q2 | |
| maximum AS SSD Seq Read Test (1GB) | |
| Alienware m18 R1 AMD (Toshiba Exceria Pro SDXC 64 GB UHS-II) | |
| Alienware m18 R2 (Toshiba Exceria Pro SDXC 64 GB UHS-II) | |
| Alienware m18 R1 (Angelibird AV Pro V60) | |
| MSI Titan 18 HX A14VIG (Toshiba Exceria Pro SDXC 64 GB UHS-II) | |
| Acer Predator Helios 18 N23Q2 | |
Communicatie
| Networking | |
| iperf3 transmit AXE11000 | |
| Asus ROG Strix G18 G814JI | |
| Alienware m18 R1 AMD | |
| Alienware m18 R1 | |
| MSI Titan 18 HX A14VIG | |
| Acer Predator Helios 18 N23Q2 | |
| Alienware m18 R2 | |
| iperf3 receive AXE11000 | |
| Asus ROG Strix G18 G814JI | |
| Alienware m18 R1 AMD | |
| Alienware m18 R2 | |
| Alienware m18 R1 | |
| MSI Titan 18 HX A14VIG | |
| Acer Predator Helios 18 N23Q2 | |
| iperf3 transmit AXE11000 6GHz | |
| Alienware m18 R1 AMD | |
| Acer Predator Helios 18 N23Q2 | |
| Alienware m18 R1 | |
| MSI Titan 18 HX A14VIG | |
| Alienware m18 R2 | |
| iperf3 receive AXE11000 6GHz | |
| Alienware m18 R1 AMD | |
| Acer Predator Helios 18 N23Q2 | |
| MSI Titan 18 HX A14VIG | |
| Alienware m18 R1 | |
| Alienware m18 R2 | |
Webcam


Onderhoud
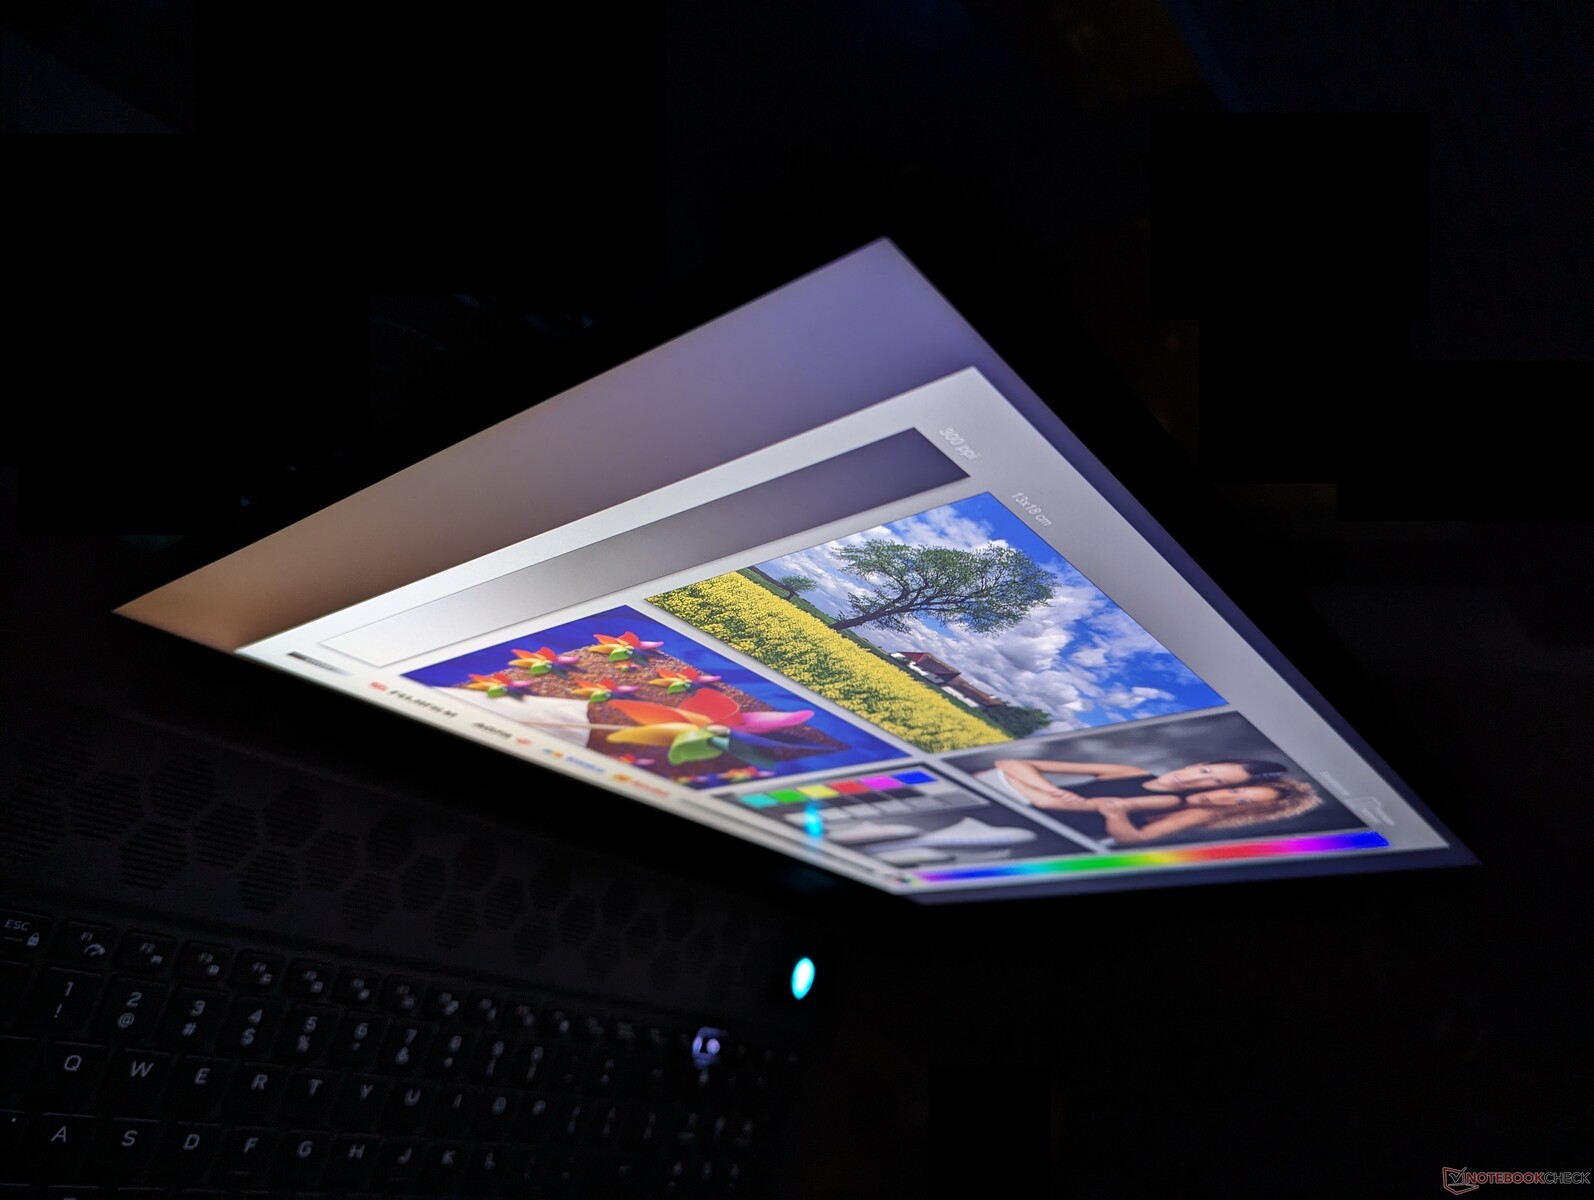
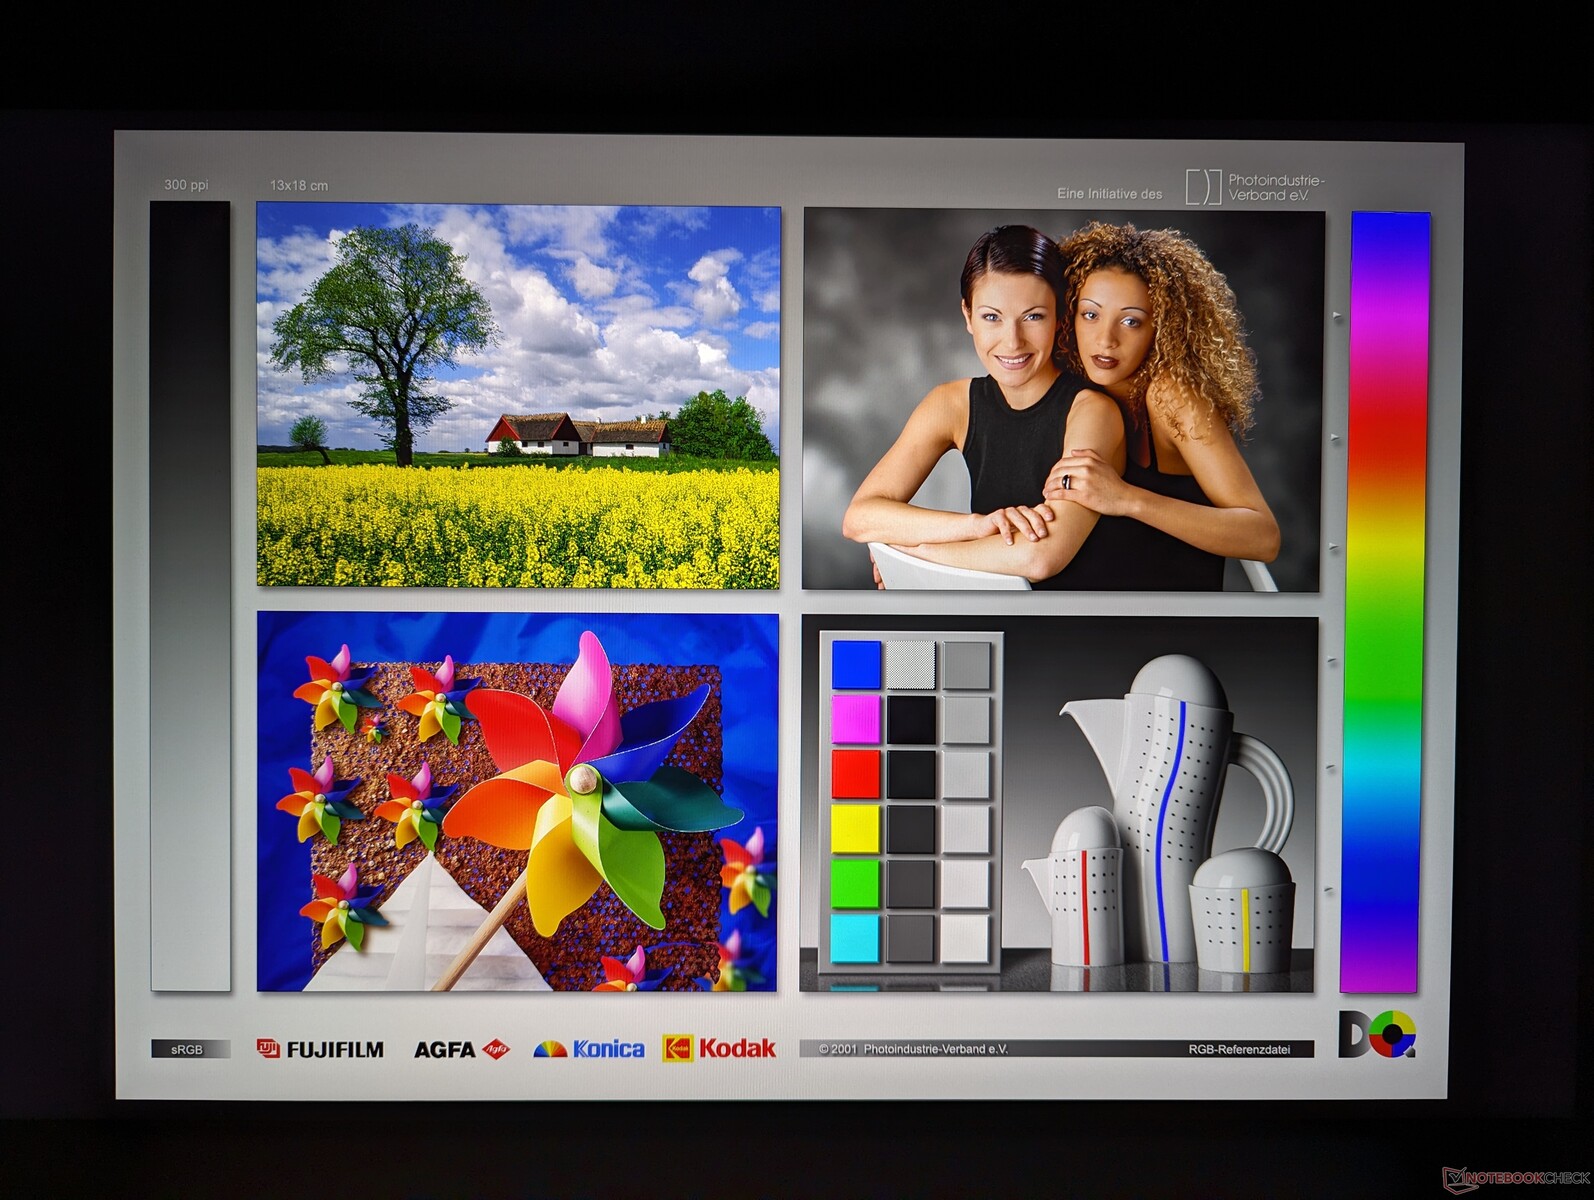
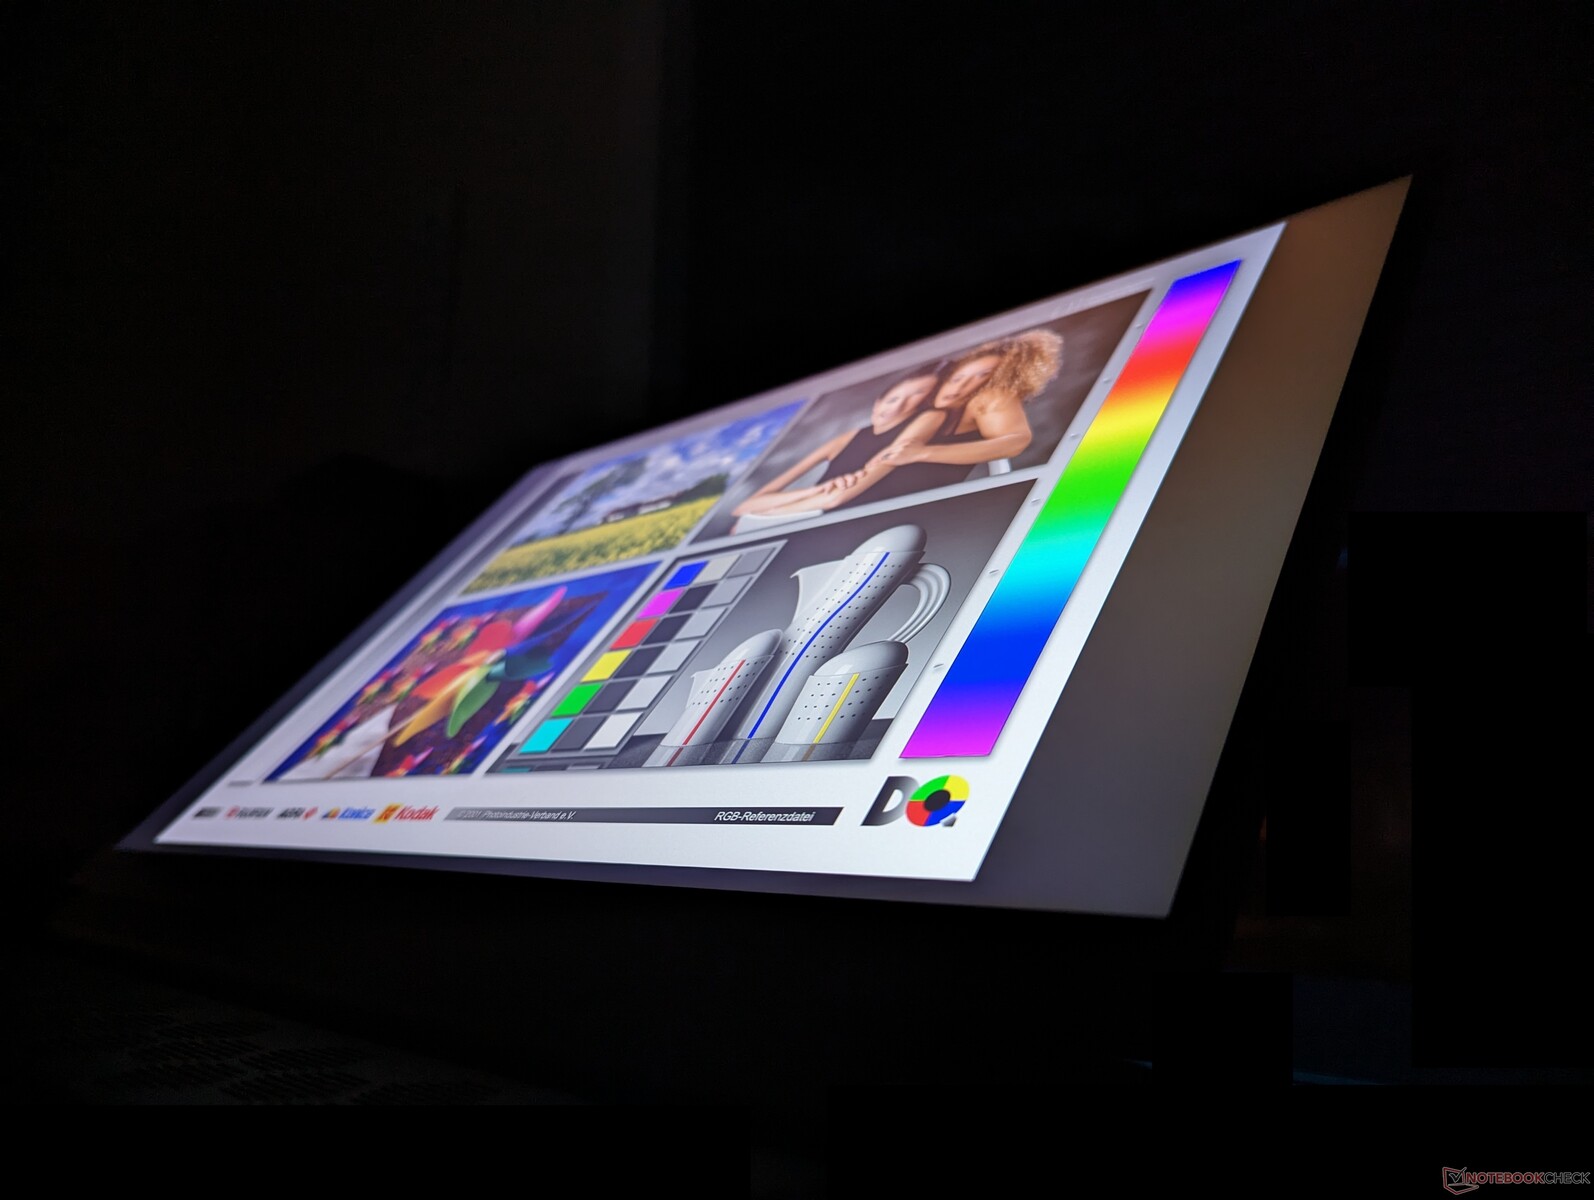
Beeldscherm - 1200p of 1600p?
Interessant is dat de paneelnaam op onze m18 R2-configuratie hetzelfde is als op onze m18 R1-configuratie, ook al hebben ze verschillende native resoluties (1600p vs. 1200p) en verversingsfrequenties (165 Hz vs. 480 Hz). Beide panelen bieden verder vergelijkbare P3-kleuren, snelle responstijden en fatsoenlijke contrastverhoudingen van ~1000:1.
Na het bekijken van beide panelen raden wij de 1600p optie aan, omdat 1200p op een 18 inch scherm niet erg scherp is, terwijl de 480 Hz verversingssnelheid slechts marginale voordelen biedt ten opzichte van 165 Hz voor de overgrote meerderheid van de gebruikssituaties.
Windows Dynamische Resolutie wordt niet ondersteund en dus ligt de vernieuwingsfrequentie vast op 165 Hz of 60 Hz op het besturingssysteem. G-Sync wordt echter nog steeds ondersteund bij het uitvoeren van games in dGPU-modus. HDR wordt niet ondersteund omdat de achtergrondverlichting niet helder genoeg is om aan de HDR-vereisten te voldoen. In feite is ons 1600p beeldscherm gemiddeld zelfs iets minder helder dan de 1200p configuratie.
| |||||||||||||||||||||||||
Helderheidsverdeling: 78 %
Helderheid in Batterij-modus: 271.8 cd/m²
Contrast: 1007:1 (Zwart: 0.27 cd/m²)
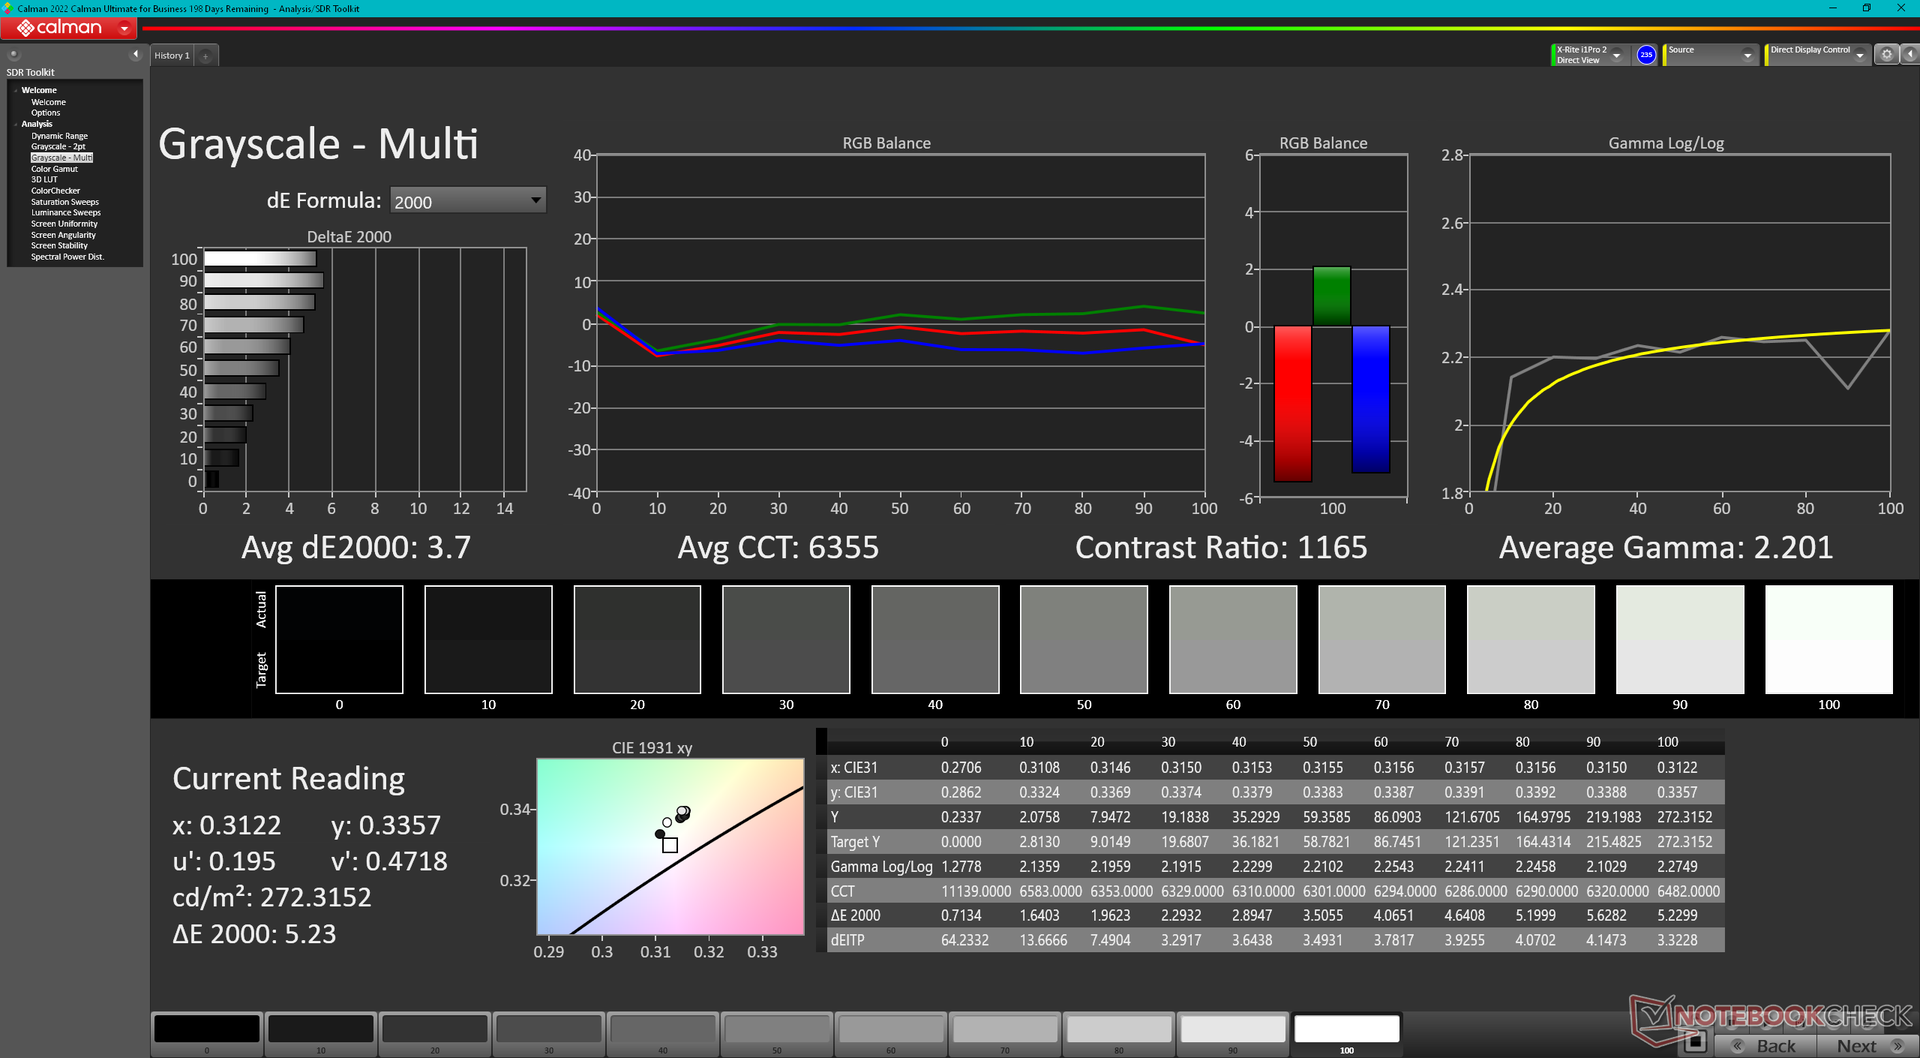
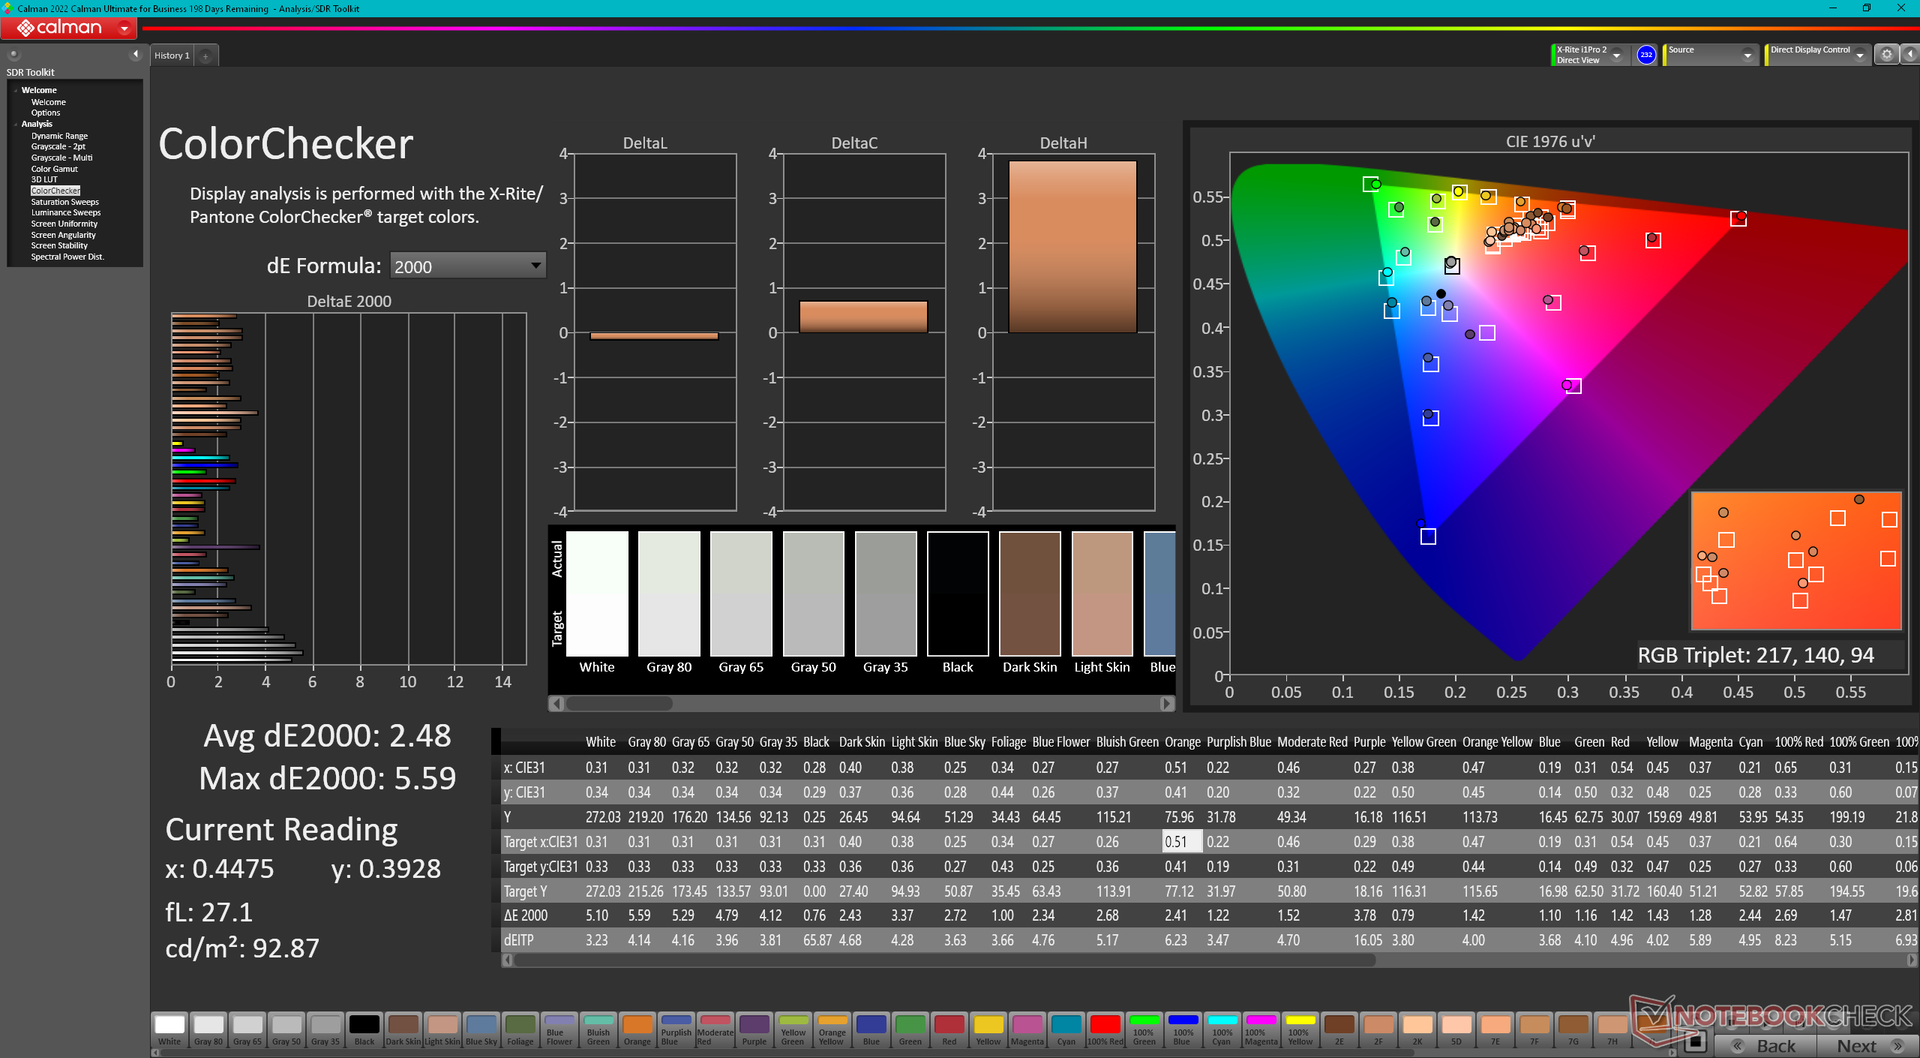
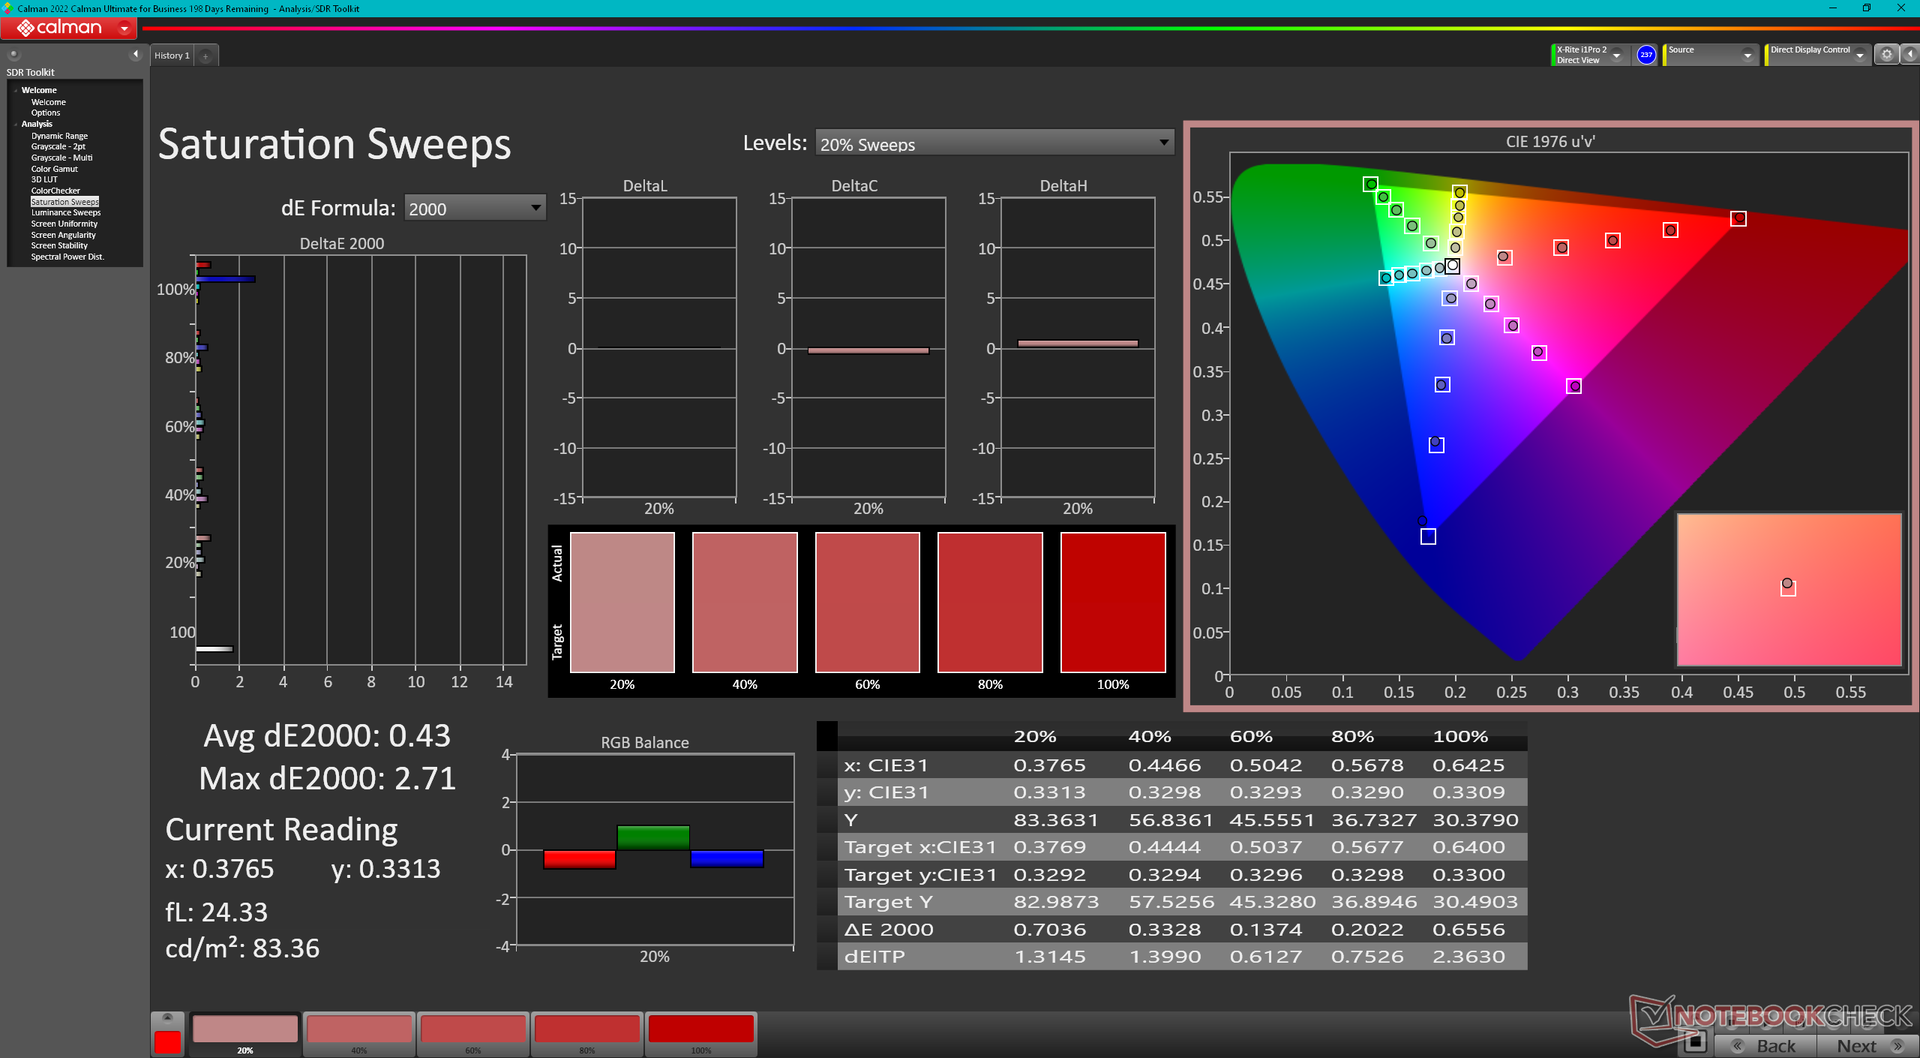
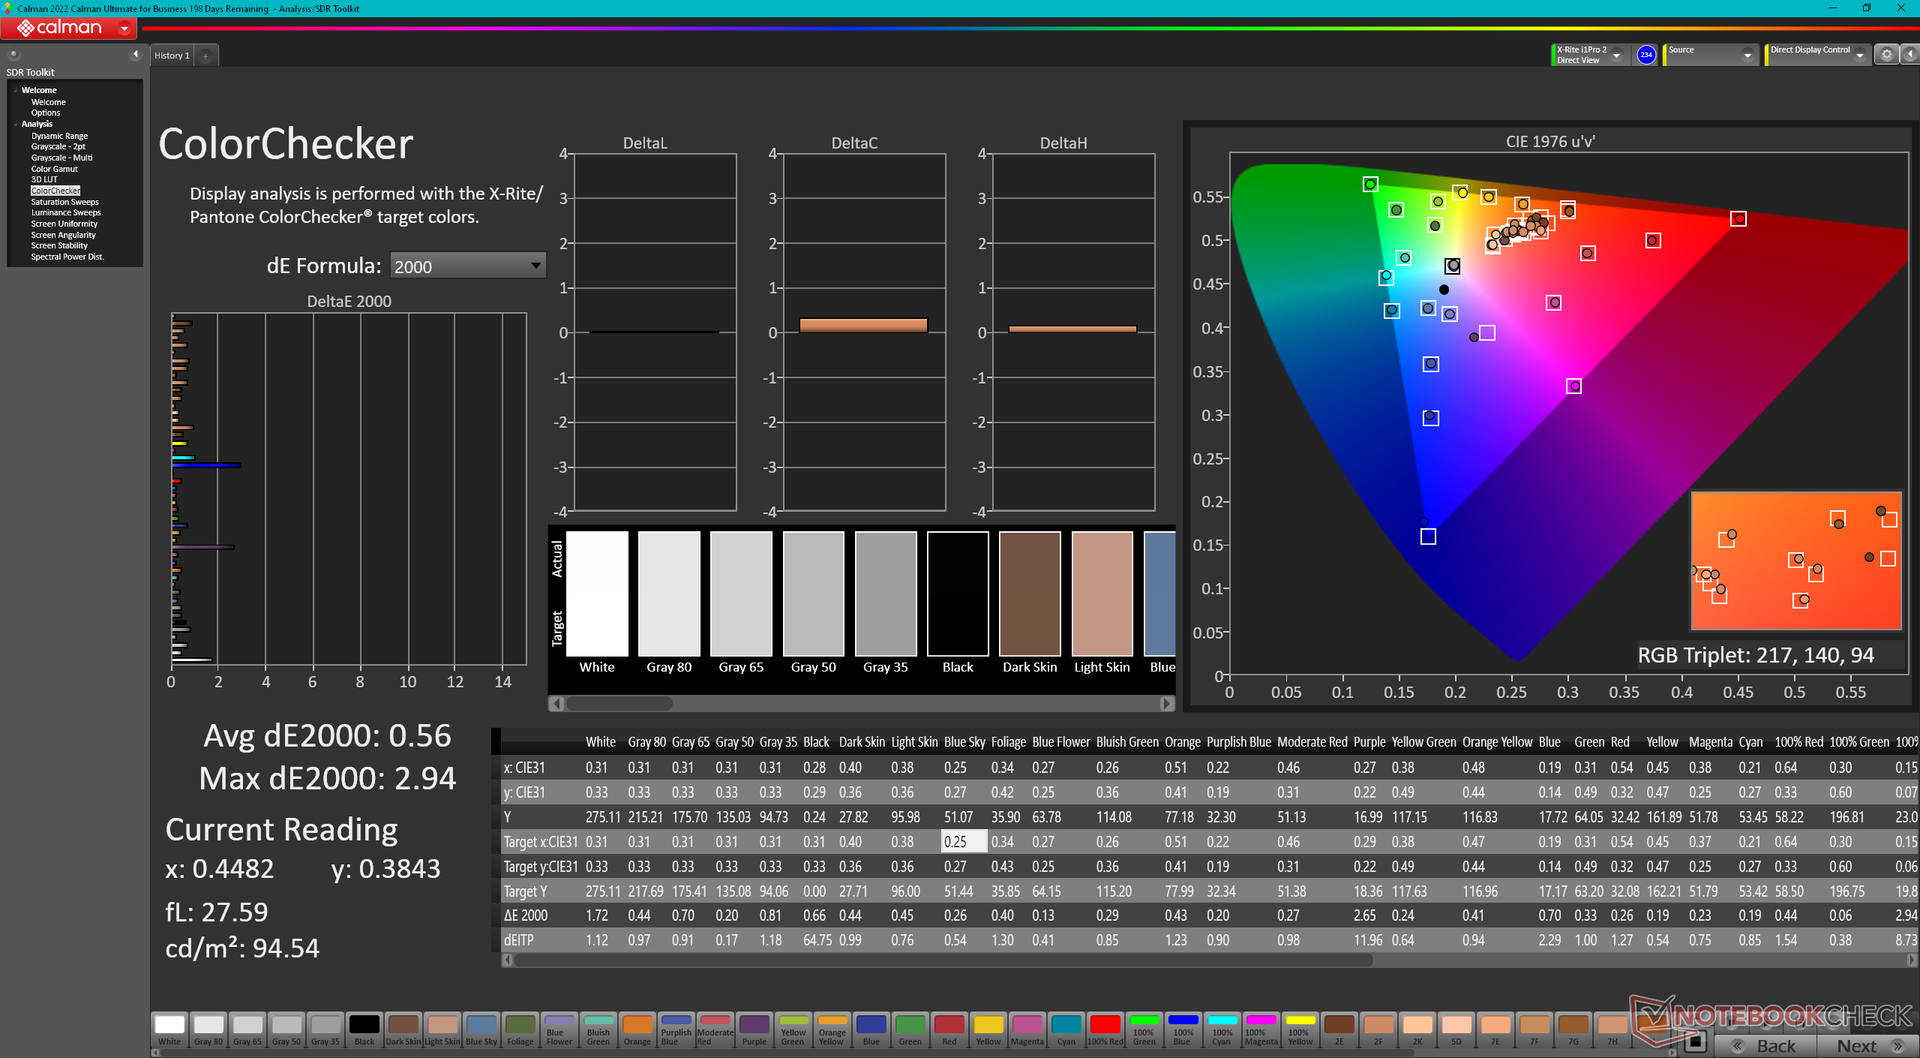
ΔE ColorChecker Calman: 2.48 | ∀{0.5-29.43 Ø4.71}
calibrated: 0.56
ΔE Greyscale Calman: 3.7 | ∀{0.09-98 Ø4.96}
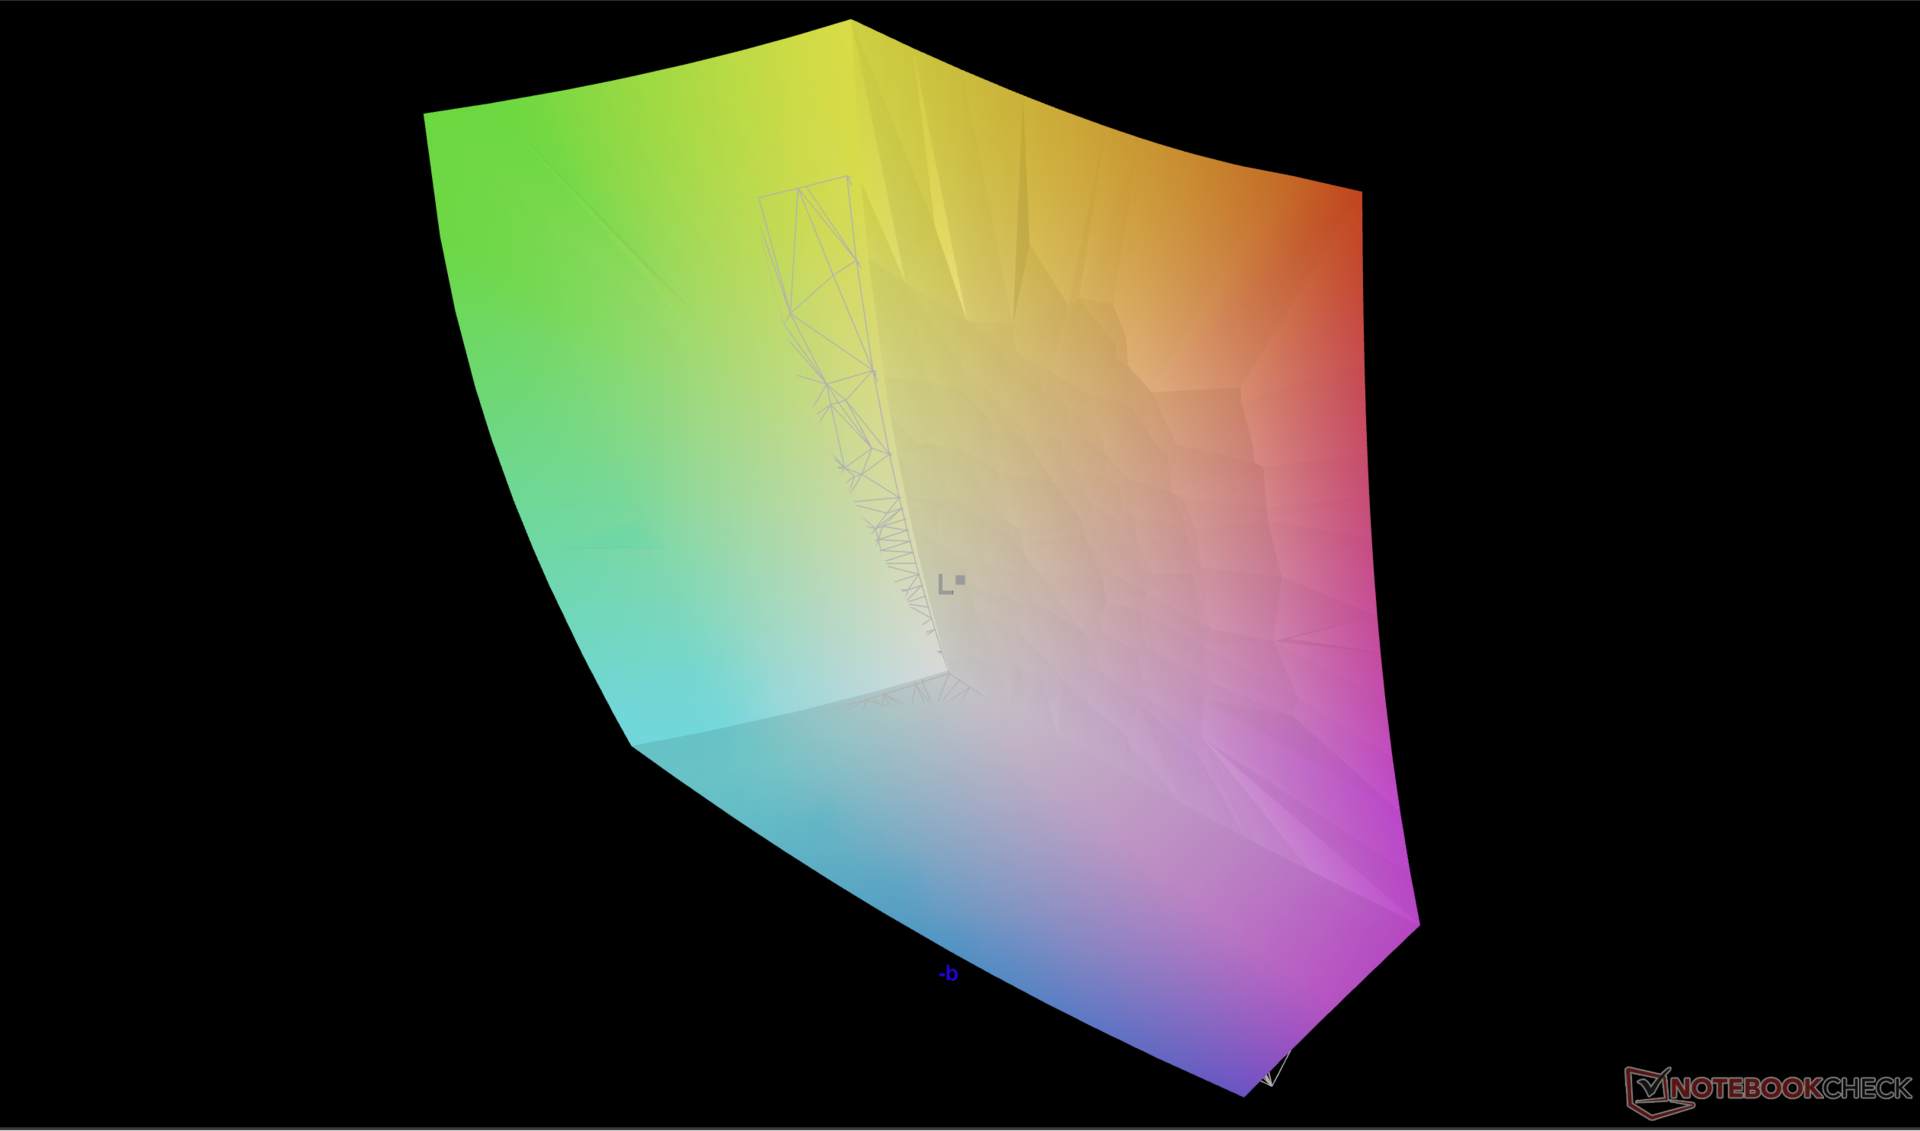
88.9% AdobeRGB 1998 (Argyll 3D)
99.5% sRGB (Argyll 3D)
97.8% Display P3 (Argyll 3D)
Gamma: 2.2
CCT: 6355 K
| Alienware m18 R2 BOE NE18NZ1, IPS, 2560x1600, 18" | Alienware m18 R1 AMD BOE NE18NZ1, IPS, 1920x1200, 18" | Alienware m18 R1 Chi Mei 180JME, IPS, 1920x1200, 18" | MSI Titan 18 HX A14VIG AU Optronics B180ZAN01.0, Mini-LED, 3840x2400, 18" | Asus ROG Strix G18 G814JI NE180QDM-NZ2 (BOE0B35), IPS, 2560x1600, 18" | Acer Predator Helios 18 N23Q2 AUO45A8 (B180QAN01.2), IPS, 2560x1600, 18" | |
|---|---|---|---|---|---|---|
| Display | 0% | 1% | -1% | -1% | 2% | |
| Display P3 Coverage (%) | 97.8 | 98.5 1% | 97.7 0% | 98.1 0% | 98.1 0% | 99.8 2% |
| sRGB Coverage (%) | 99.5 | 99.7 0% | 100 1% | 99.8 0% | 99.9 0% | 100 1% |
| AdobeRGB 1998 Coverage (%) | 88.9 | 88.7 0% | 89.8 1% | 86.2 -3% | 85.6 -4% | 91.8 3% |
| Response Times | 28% | 24% | -375% | 4% | -57% | |
| Response Time Grey 50% / Grey 80% * (ms) | 5.3 ? | 2.8 ? 47% | 3 ? 43% | 8.6 ? -62% | 5.6 ? -6% | 7.6 ? -43% |
| Response Time Black / White * (ms) | 10.4 ? | 9.6 ? 8% | 9.9 ? 5% | 81.8 ? -687% | 9 ? 13% | 17.8 ? -71% |
| PWM Frequency (Hz) | 2592 ? | 2509 | ||||
| Screen | 29% | 24% | -45% | 9% | -28% | |
| Brightness middle (cd/m²) | 271.8 | 319.6 18% | 372.8 37% | 467.5 72% | 471 73% | 360 32% |
| Brightness (cd/m²) | 275 | 304 11% | 367 33% | 459 67% | 422 53% | 355 29% |
| Brightness Distribution (%) | 78 | 87 12% | 97 24% | 90 15% | 83 6% | 92 18% |
| Black Level * (cd/m²) | 0.27 | 0.25 7% | 0.32 -19% | 0.47 -74% | 0.21 22% | |
| Contrast (:1) | 1007 | 1278 27% | 1165 16% | 1002 0% | 1714 70% | |
| Colorchecker dE 2000 * | 2.48 | 1.22 51% | 1.92 23% | 3.77 -52% | 2.05 17% | 3.82 -54% |
| Colorchecker dE 2000 max. * | 5.59 | 3.1 45% | 3.65 35% | 6.12 -9% | 4.15 26% | 7.38 -32% |
| Colorchecker dE 2000 calibrated * | 0.56 | 0.47 16% | 0.51 9% | 2.94 -425% | 0.8 -43% | 2.24 -300% |
| Greyscale dE 2000 * | 3.7 | 0.8 78% | 1.5 59% | 3.2 14% | 2.8 24% | 5.06 -37% |
| Gamma | 2.2 100% | 2.23 99% | 2.34 94% | 2.43 91% | 2.204 100% | 2.52 87% |
| CCT | 6355 102% | 6471 100% | 6607 98% | 6478 100% | 7122 91% | 5657 115% |
| Totaal Gemiddelde (Programma / Instellingen) | 19% /
23% | 16% /
19% | -140% /
-89% | 4% /
6% | -28% /
-26% |
* ... kleiner is beter
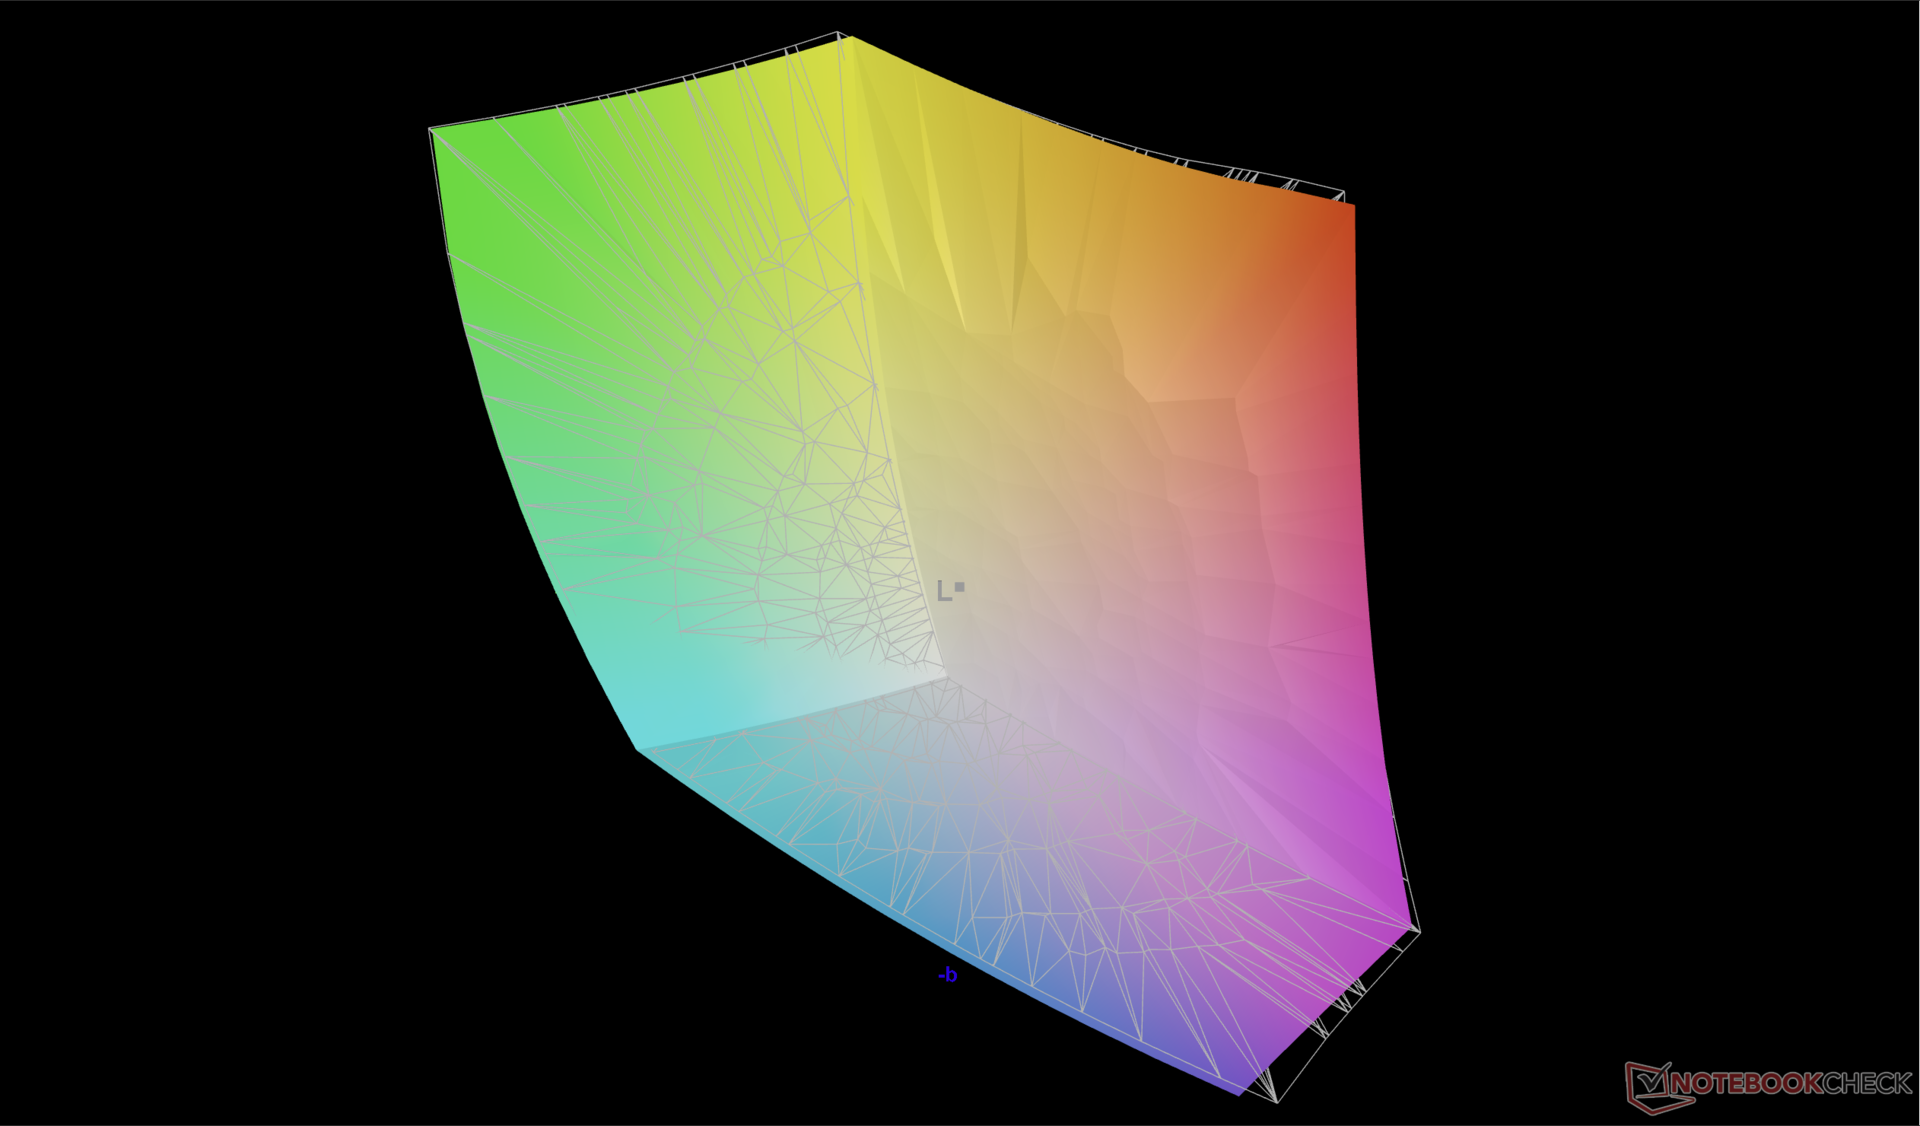
Grijstinten en kleuren zijn redelijk nauwkeurig uit de doos, ook al is het scherm niet voorgekalibreerd. Door het paneel zelf te kalibreren zouden de gemiddelde deltaE-waarden naar <1 kunnen worden verbeterd, zodat de volledige P3-kleuren beter worden benut. Ons gekalibreerde ICM-profiel kunt u hierboven gratis downloaden.
Responstijd Scherm
| ↔ Responstijd Zwart naar Wit | ||
|---|---|---|
| 10.4 ms ... stijging ↗ en daling ↘ gecombineerd | ↗ 4.8 ms stijging | 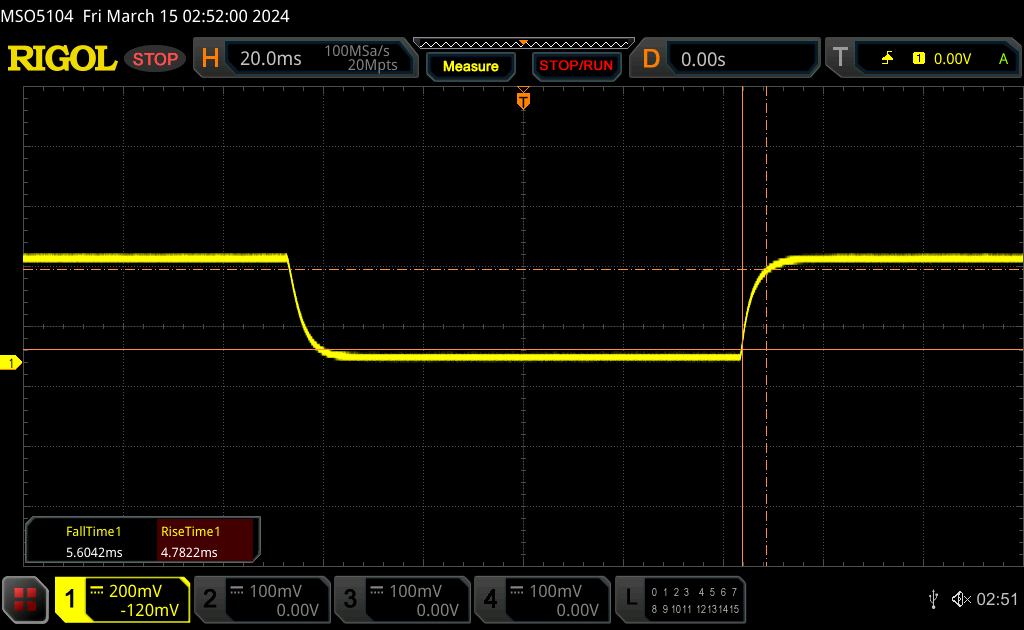 |
| ↘ 5.6 ms daling | ||
| Het scherm vertoonde prima responstijden in onze tests maar is misschien wat te traag voor competitieve games. Ter vergelijking: alle testtoestellen variëren van 0.1 (minimum) tot 240 (maximum) ms. » 28 % van alle toestellen zijn beter. Dit betekent dat de gemeten responstijd beter is dan het gemiddelde (19.8 ms) van alle geteste toestellen. | ||
| ↔ Responstijd 50% Grijs naar 80% Grijs | ||
| 5.3 ms ... stijging ↗ en daling ↘ gecombineerd | ↗ 2.2 ms stijging | 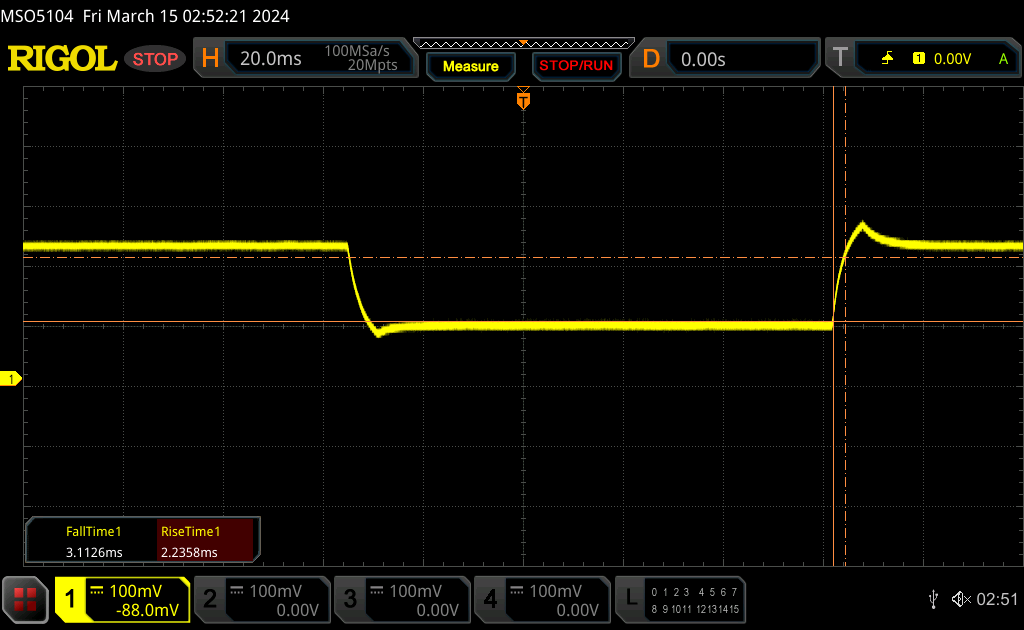 |
| ↘ 3.1 ms daling | ||
| Het scherm vertoonde erg snelle responstijden in onze tests en zou zeer geschikt moeten zijn voor snelle games. Ter vergelijking: alle testtoestellen variëren van 0.165 (minimum) tot 636 (maximum) ms. » 18 % van alle toestellen zijn beter. Dit betekent dat de gemeten responstijd beter is dan het gemiddelde (31 ms) van alle geteste toestellen. | ||
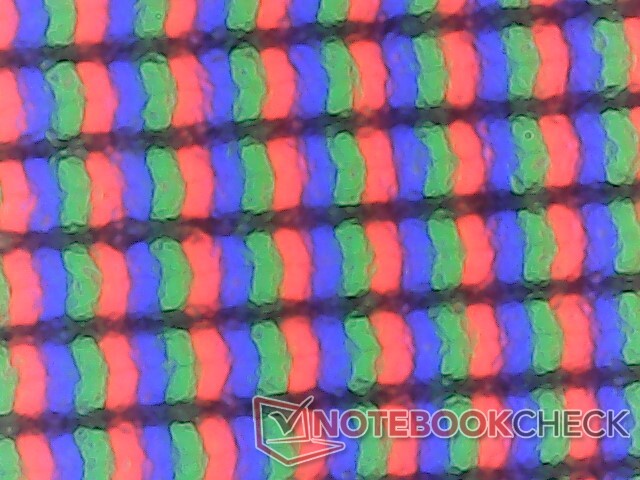
Screen Flickering / PWM (Pulse-Width Modulation)
| Screen flickering / PWM niet waargenomen |  | ||
Ter vergelijking: 52 % van alle geteste toestellen maakten geen gebruik van PWM om de schermhelderheid te verlagen. Als het wel werd gebruikt, werd een gemiddelde van 7747 (minimum: 5 - maximum: 343500) Hz waargenomen. | |||
Prestaties - Raptor Lake-HX Vernieuwen
Testomstandigheden
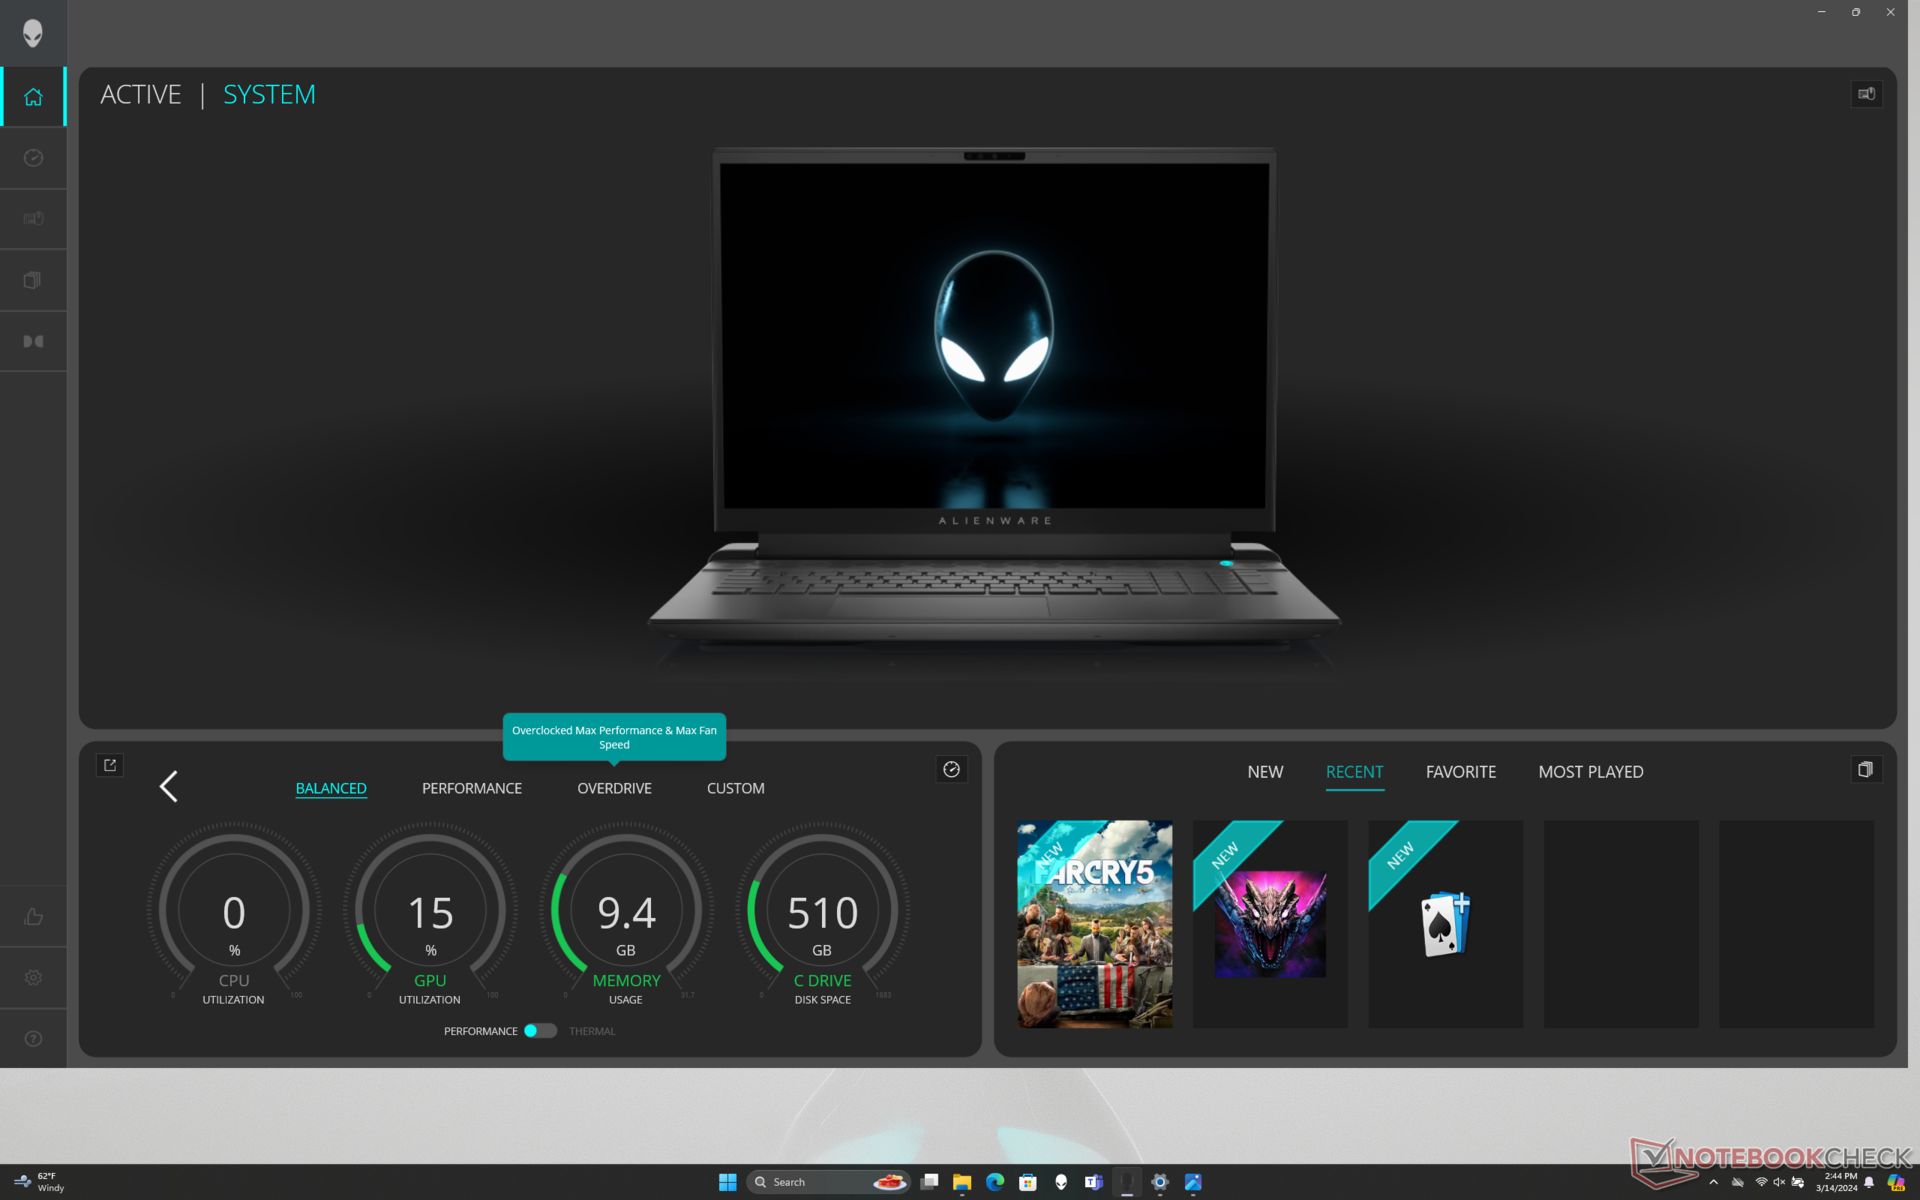
We hebben Alienware Command Center ingesteld op de modus Overdrive en Windows op de modus Prestaties voordat we de onderstaande benchmarks uitvoerden. We hebben het systeem ook ingesteld op de dGPU-modus via het Nvidia Configuratiescherm. Advanced Optimus en MUX worden ondersteund, wat betekent dat er niet opnieuw hoeft te worden opgestart bij het schakelen tussen de iGPU en dGPU.
Het is de moeite waard om op te merken dat we een paar bugs op ons apparaat hebben ervaren die allemaal te maken hadden met de slaapstand. Het systeem ging soms niet correct naar de slaapstand wanneer het deksel werd gesloten, waardoor het zonder reden erg warm werd. Als dit tijdens het reizen gebeurt, kan de batterij zonder waarschuwing leeg raken. Bovendien bevroor het scherm soms een paar seconden wanneer u uit de slaapstand ontwaakte. We vermoeden dat dit een probleem is dat te maken heeft met de MUX of automatische GPU-schakeling.
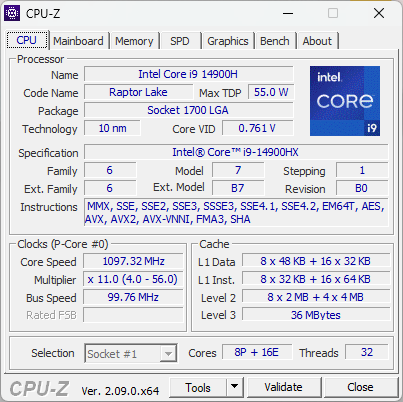
Processor
De Core i9-14900HX is een rebranding van de Core i9-13900HX en dus zijn eventuele prestatieverschillen op zijn best klein. De Core i9-13980HX in de m18 R1 van vorig jaar presteerde consequent een paar procentpunten beter dan onze i9-14900HX in multi-threaded workloads.
Downgraden naar de Core i7-14700HX of Core i7-14650HX zal de processorprestaties naar verwachting met respectievelijk ongeveer 25 tot 30 procent en 30 tot 35 procent verminderen. Deze mindere CPU's zijn ook rebrands van de oudere Core i7-13700HX en Core i7-14750HX.
Cinebench R15 Multi Loop
Cinebench R23: Multi Core | Single Core
Cinebench R20: CPU (Multi Core) | CPU (Single Core)
Cinebench R15: CPU Multi 64Bit | CPU Single 64Bit
Blender: v2.79 BMW27 CPU
7-Zip 18.03: 7z b 4 | 7z b 4 -mmt1
Geekbench 6.7: Multi-Core | Single-Core
Geekbench 5.5: Multi-Core | Single-Core
HWBOT x265 Benchmark v2.2: 4k Preset
LibreOffice : 20 Documents To PDF
R Benchmark 2.5: Overall mean
| CPU Performance rating | |
| Alienware m18 R1 AMD | |
| Alienware m18 R2 | |
| Alienware m18 R1 -2! | |
| MSI Titan 18 HX A14VIG | |
| Acer Predator Helios 18 N23Q2 | |
| Gemiddeld Intel Core i9-14900HX | |
| Razer Blade 18 RTX 4070 -2! | |
| Asus TUF Gaming A17 FA707XI-NS94 | |
| Asus ROG Strix G18 G814JI -2! | |
| Schenker XMG Apex 17 (Late 23) | |
| Acer Nitro 17 AN17-51-71ER -2! | |
| Acer Nitro 17 AN17-41-R9LN | |
| Geekbench 6.7 / Multi-Core | |
| Alienware m18 R2 | |
| Acer Predator Helios 18 N23Q2 | |
| Gemiddeld Intel Core i9-14900HX (13158 - 19665, n=37) | |
| MSI Titan 18 HX A14VIG | |
| Alienware m18 R1 AMD | |
| Schenker XMG Apex 17 (Late 23) | |
| Asus TUF Gaming A17 FA707XI-NS94 | |
| Acer Nitro 17 AN17-41-R9LN | |
| Geekbench 6.7 / Single-Core | |
| Alienware m18 R2 | |
| Gemiddeld Intel Core i9-14900HX (2419 - 3129, n=37) | |
| Acer Predator Helios 18 N23Q2 | |
| Alienware m18 R1 AMD | |
| MSI Titan 18 HX A14VIG | |
| Asus TUF Gaming A17 FA707XI-NS94 | |
| Schenker XMG Apex 17 (Late 23) | |
| Acer Nitro 17 AN17-41-R9LN | |
| HWBOT x265 Benchmark v2.2 / 4k Preset | |
| Alienware m18 R1 AMD | |
| Alienware m18 R1 | |
| Alienware m18 R2 | |
| Razer Blade 18 RTX 4070 | |
| MSI Titan 18 HX A14VIG | |
| Acer Predator Helios 18 N23Q2 | |
| Gemiddeld Intel Core i9-14900HX (16.8 - 38.9, n=37) | |
| Asus ROG Strix G18 G814JI | |
| Asus TUF Gaming A17 FA707XI-NS94 | |
| Schenker XMG Apex 17 (Late 23) | |
| Acer Nitro 17 AN17-51-71ER | |
| Acer Nitro 17 AN17-41-R9LN | |
* ... kleiner is beter
AIDA64: FP32 Ray-Trace | FPU Julia | CPU SHA3 | CPU Queen | FPU SinJulia | FPU Mandel | CPU AES | CPU ZLib | FP64 Ray-Trace | CPU PhotoWorxx
| Performance rating | |
| Alienware m18 R1 AMD | |
| Acer Predator Helios 18 N23Q2 | |
| Alienware m18 R1 | |
| Alienware m18 R2 | |
| MSI Titan 18 HX A14VIG | |
| Gemiddeld Intel Core i9-14900HX | |
| Asus ROG Strix G18 G814JI | |
| AIDA64 / FP32 Ray-Trace | |
| Alienware m18 R1 AMD | |
| Alienware m18 R1 | |
| MSI Titan 18 HX A14VIG | |
| Alienware m18 R2 | |
| Acer Predator Helios 18 N23Q2 | |
| Gemiddeld Intel Core i9-14900HX (13098 - 33474, n=36) | |
| Asus ROG Strix G18 G814JI | |
| AIDA64 / FPU Julia | |
| Alienware m18 R1 AMD | |
| MSI Titan 18 HX A14VIG | |
| Alienware m18 R1 | |
| Alienware m18 R2 | |
| Acer Predator Helios 18 N23Q2 | |
| Gemiddeld Intel Core i9-14900HX (67573 - 166040, n=36) | |
| Asus ROG Strix G18 G814JI | |
| AIDA64 / CPU SHA3 | |
| Alienware m18 R1 AMD | |
| MSI Titan 18 HX A14VIG | |
| Alienware m18 R1 | |
| Alienware m18 R2 | |
| Acer Predator Helios 18 N23Q2 | |
| Gemiddeld Intel Core i9-14900HX (3589 - 7979, n=36) | |
| Asus ROG Strix G18 G814JI | |
| AIDA64 / CPU Queen | |
| Alienware m18 R1 AMD | |
| MSI Titan 18 HX A14VIG | |
| Alienware m18 R1 | |
| Alienware m18 R2 | |
| Gemiddeld Intel Core i9-14900HX (118405 - 148966, n=36) | |
| Acer Predator Helios 18 N23Q2 | |
| Asus ROG Strix G18 G814JI | |
| AIDA64 / FPU SinJulia | |
| Alienware m18 R1 AMD | |
| MSI Titan 18 HX A14VIG | |
| Alienware m18 R1 | |
| Alienware m18 R2 | |
| Acer Predator Helios 18 N23Q2 | |
| Gemiddeld Intel Core i9-14900HX (10475 - 18517, n=36) | |
| Asus ROG Strix G18 G814JI | |
| AIDA64 / FPU Mandel | |
| Alienware m18 R1 AMD | |
| Alienware m18 R1 | |
| Alienware m18 R2 | |
| MSI Titan 18 HX A14VIG | |
| Acer Predator Helios 18 N23Q2 | |
| Gemiddeld Intel Core i9-14900HX (32543 - 83662, n=36) | |
| Asus ROG Strix G18 G814JI | |
| AIDA64 / CPU AES | |
| Acer Predator Helios 18 N23Q2 | |
| Alienware m18 R1 AMD | |
| Gemiddeld Intel Core i9-14900HX (86964 - 241777, n=36) | |
| MSI Titan 18 HX A14VIG | |
| Alienware m18 R1 | |
| Alienware m18 R2 | |
| Asus ROG Strix G18 G814JI | |
| AIDA64 / CPU ZLib | |
| Alienware m18 R1 AMD | |
| MSI Titan 18 HX A14VIG | |
| Alienware m18 R2 | |
| Alienware m18 R1 | |
| Acer Predator Helios 18 N23Q2 | |
| Gemiddeld Intel Core i9-14900HX (1054 - 2292, n=36) | |
| Asus ROG Strix G18 G814JI | |
| AIDA64 / FP64 Ray-Trace | |
| Alienware m18 R1 AMD | |
| Alienware m18 R1 | |
| Alienware m18 R2 | |
| MSI Titan 18 HX A14VIG | |
| Acer Predator Helios 18 N23Q2 | |
| Gemiddeld Intel Core i9-14900HX (6809 - 18349, n=36) | |
| Asus ROG Strix G18 G814JI | |
| AIDA64 / CPU PhotoWorxx | |
| Alienware m18 R1 | |
| Acer Predator Helios 18 N23Q2 | |
| Alienware m18 R2 | |
| Gemiddeld Intel Core i9-14900HX (23903 - 54702, n=36) | |
| Asus ROG Strix G18 G814JI | |
| Alienware m18 R1 AMD | |
| MSI Titan 18 HX A14VIG | |
Stresstest
De kerntemperatuur tijdens het uitvoeren van Prime95 stress stabiliseert op 100 C, vergelijkbaar met wat we vorig jaar zagen op de m18 R1, ondanks de overgang naar een nieuwere processor. Kloksnelheden lijken echter vaker te fluctueren op de i9-14900HX, wat de iets langzamere prestaties kan verklaren dan de i9-13980HX, zoals hierboven vermeld.
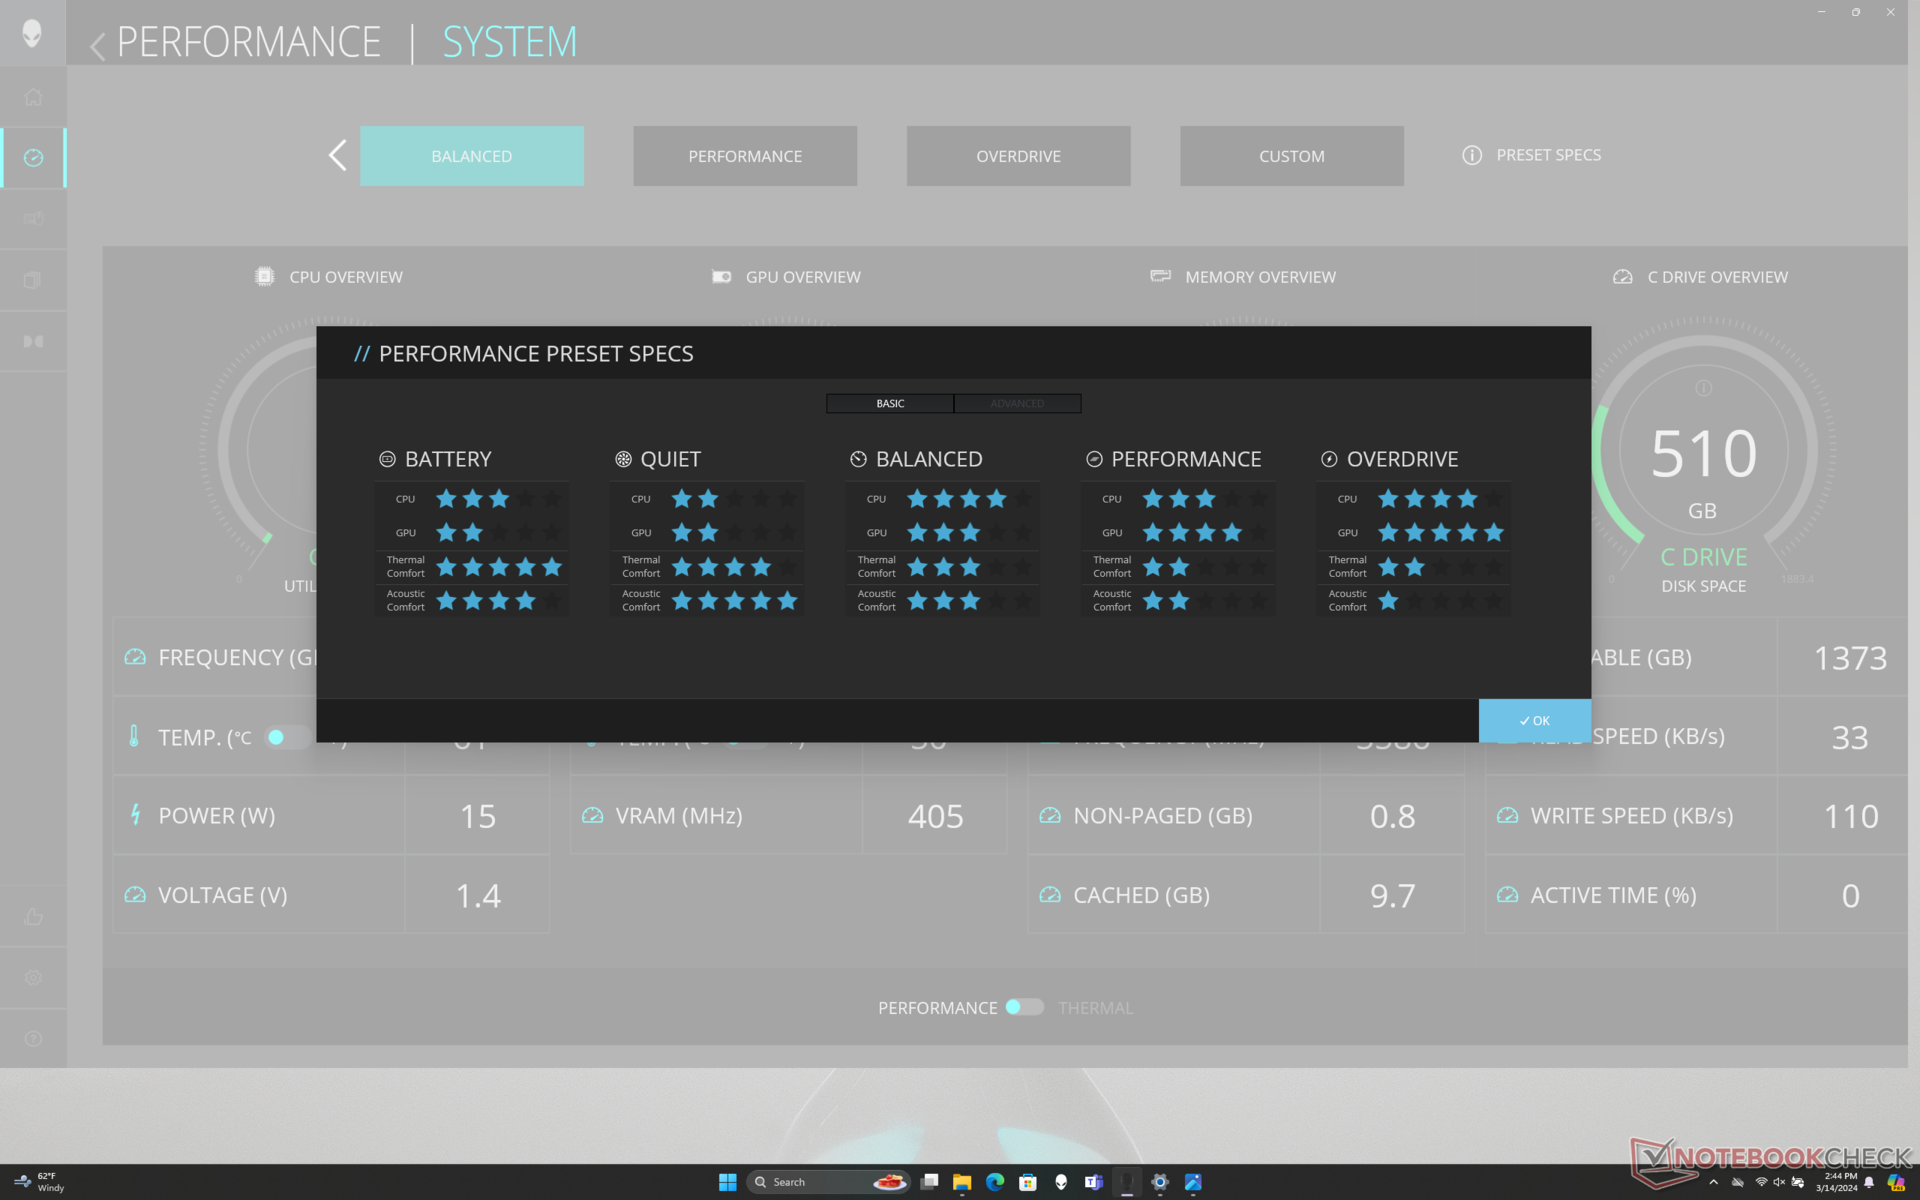
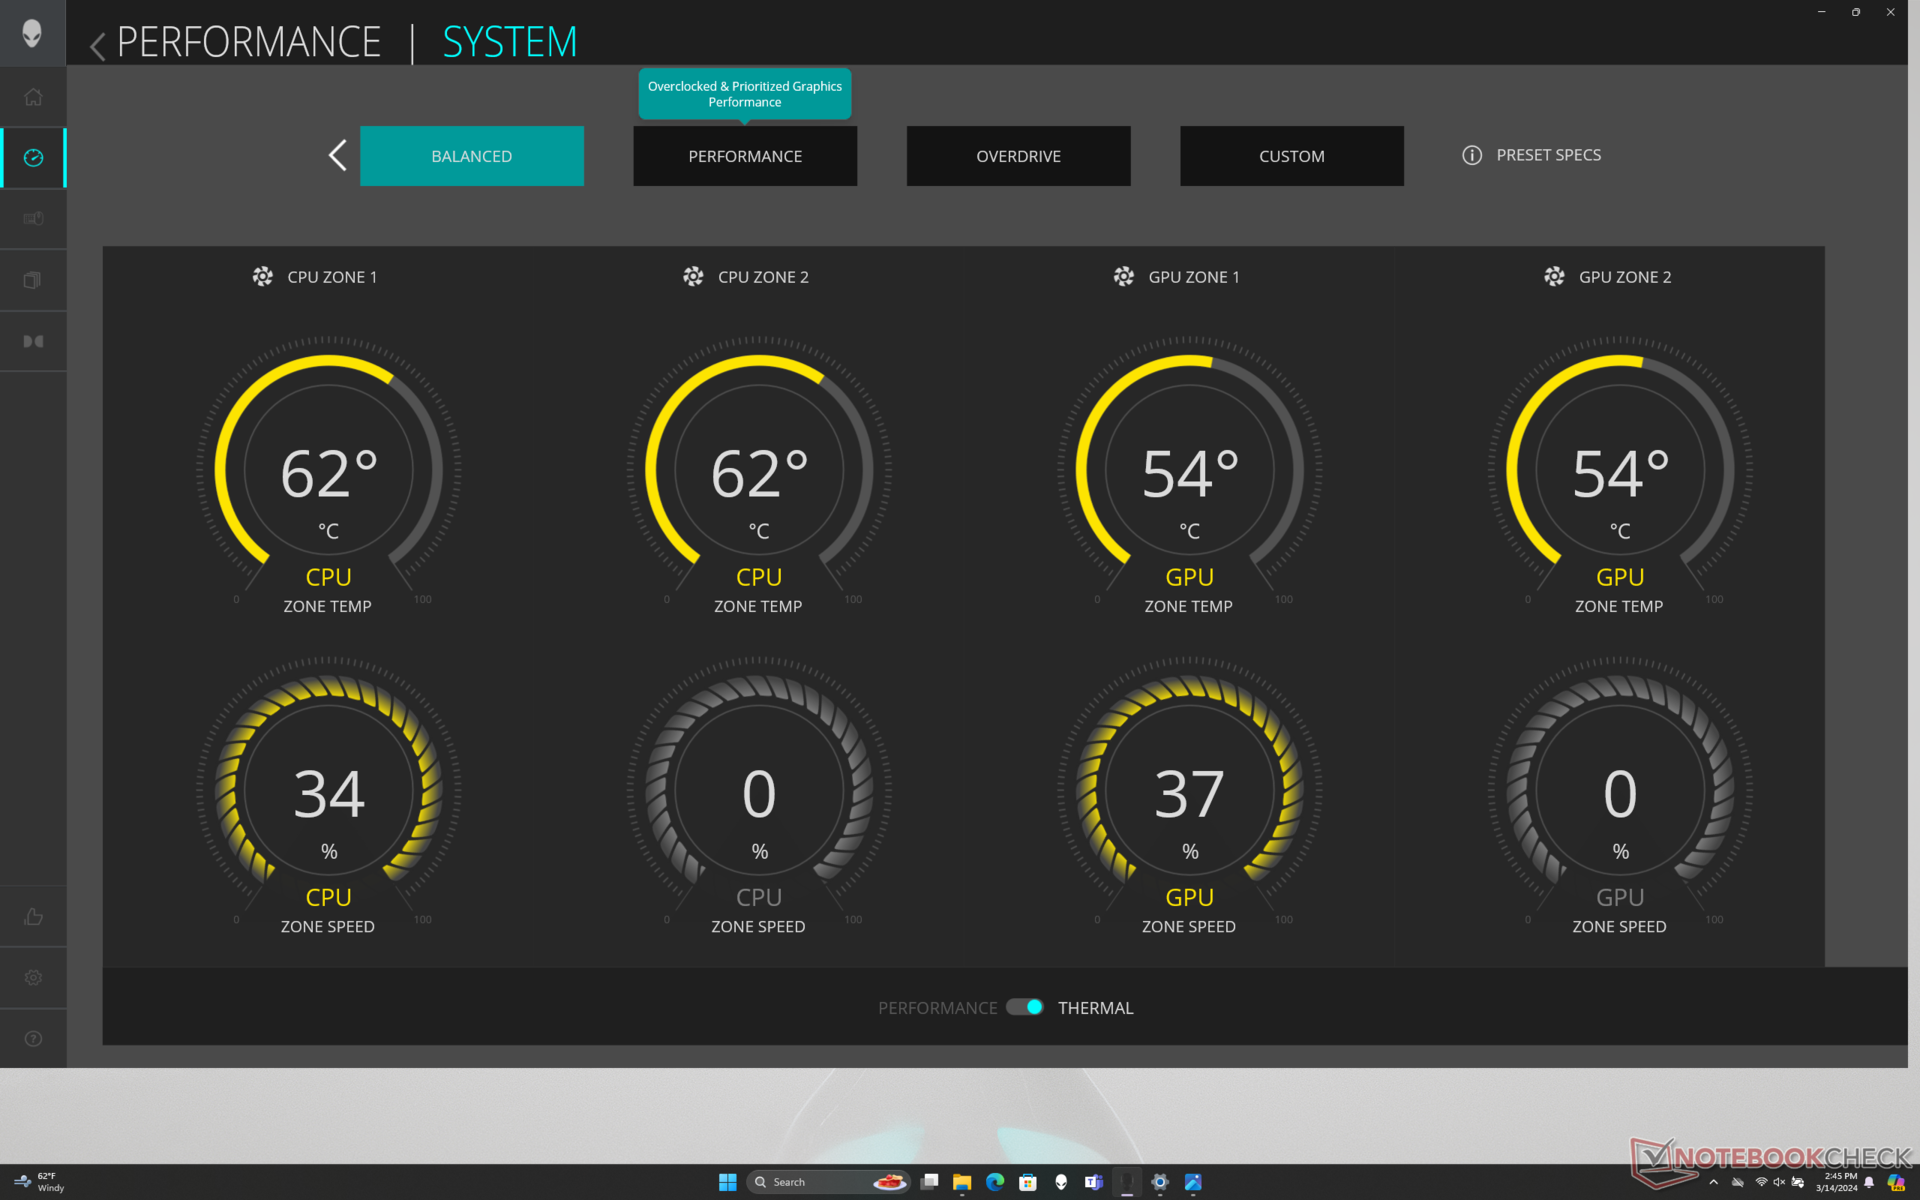
De kloksnelheden van de GPU en het stroomverbruik van de kaart veranderen nauwelijks bij het schakelen tussen de modi Balanced, Performance en Overdrive, wat overeenkomt met onze testresultaten op Fire Strike in het gedeelte GPU-prestaties hieronder. Dit gedrag is in tegenstelling tot de meeste andere gaming laptops waar er een groter prestatieverschil is tussen de modi Gebalanceerd en Prestaties.
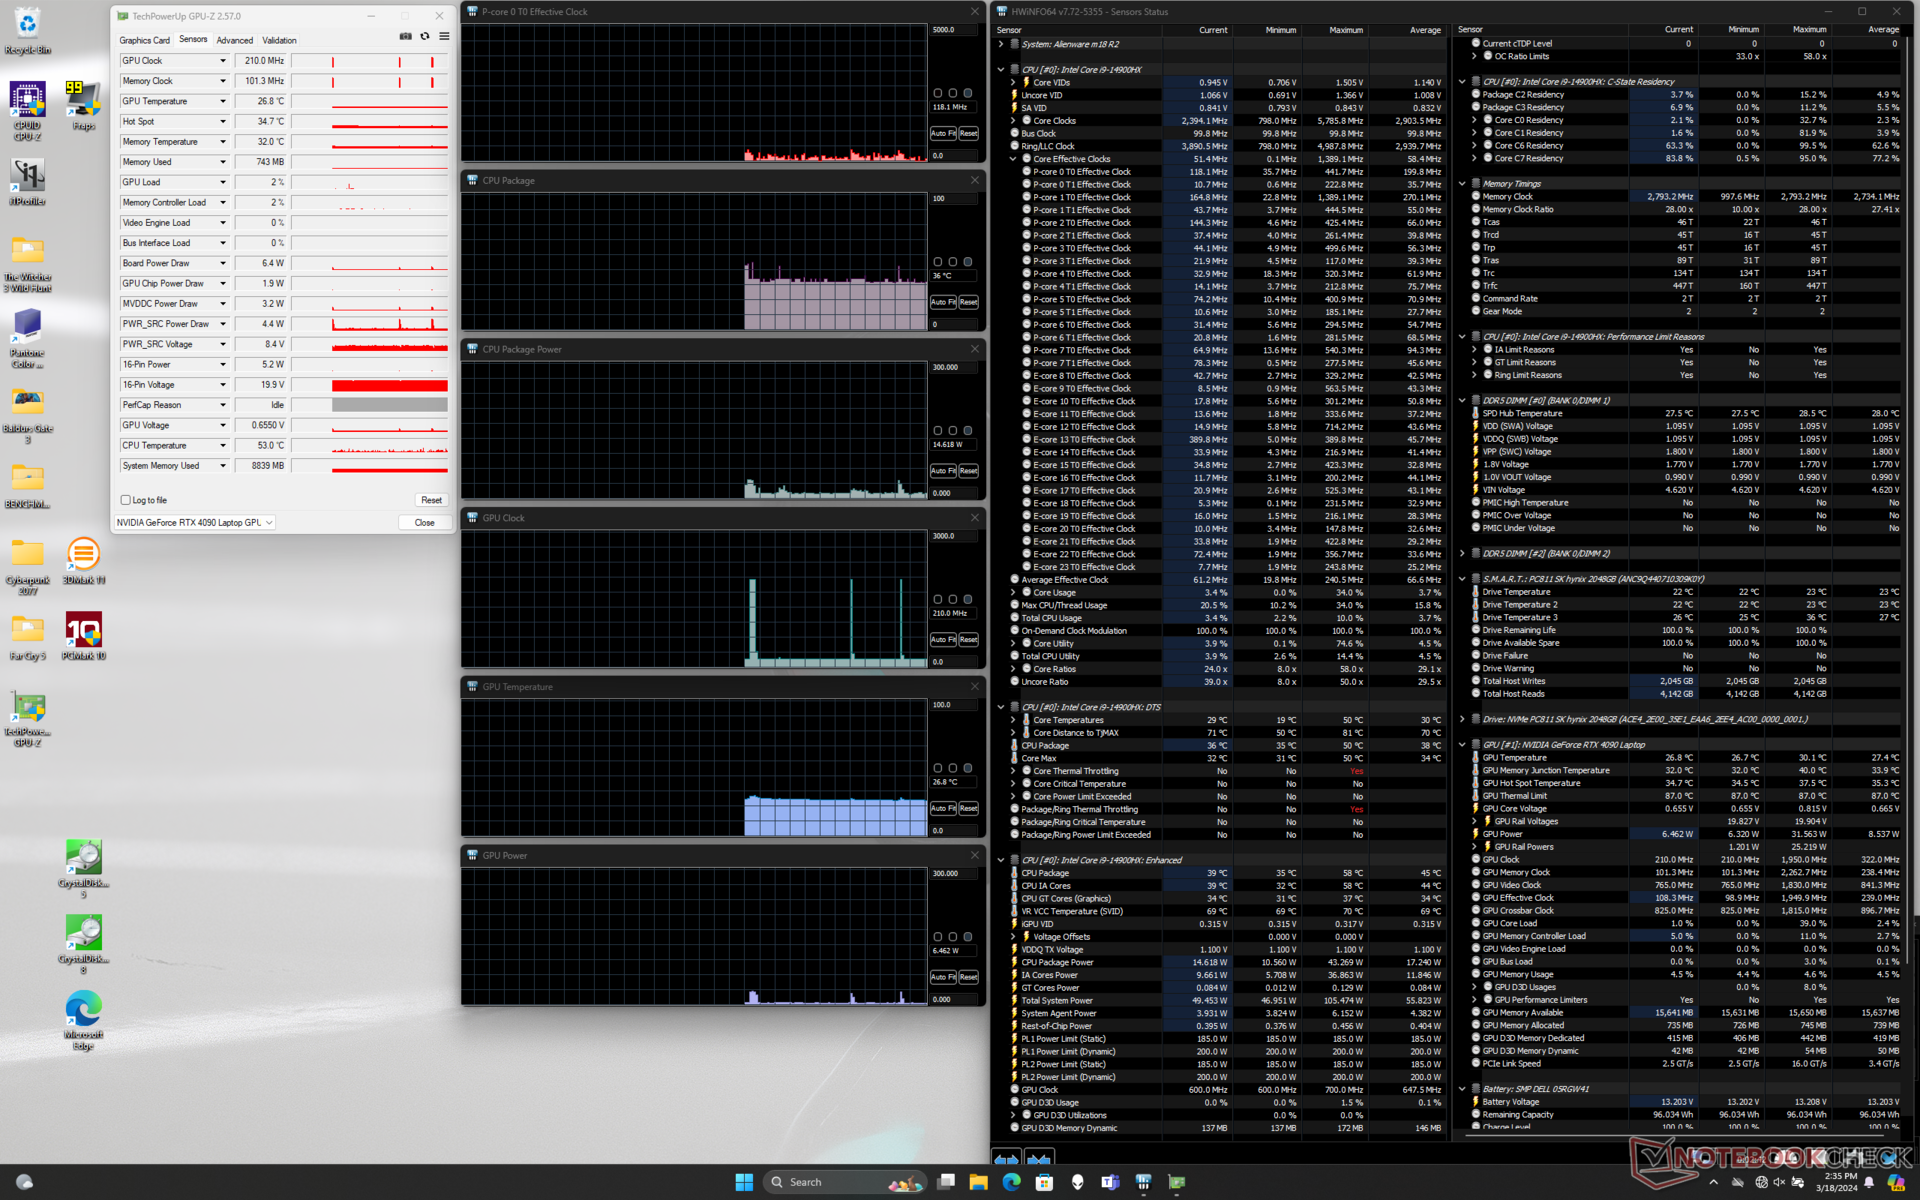
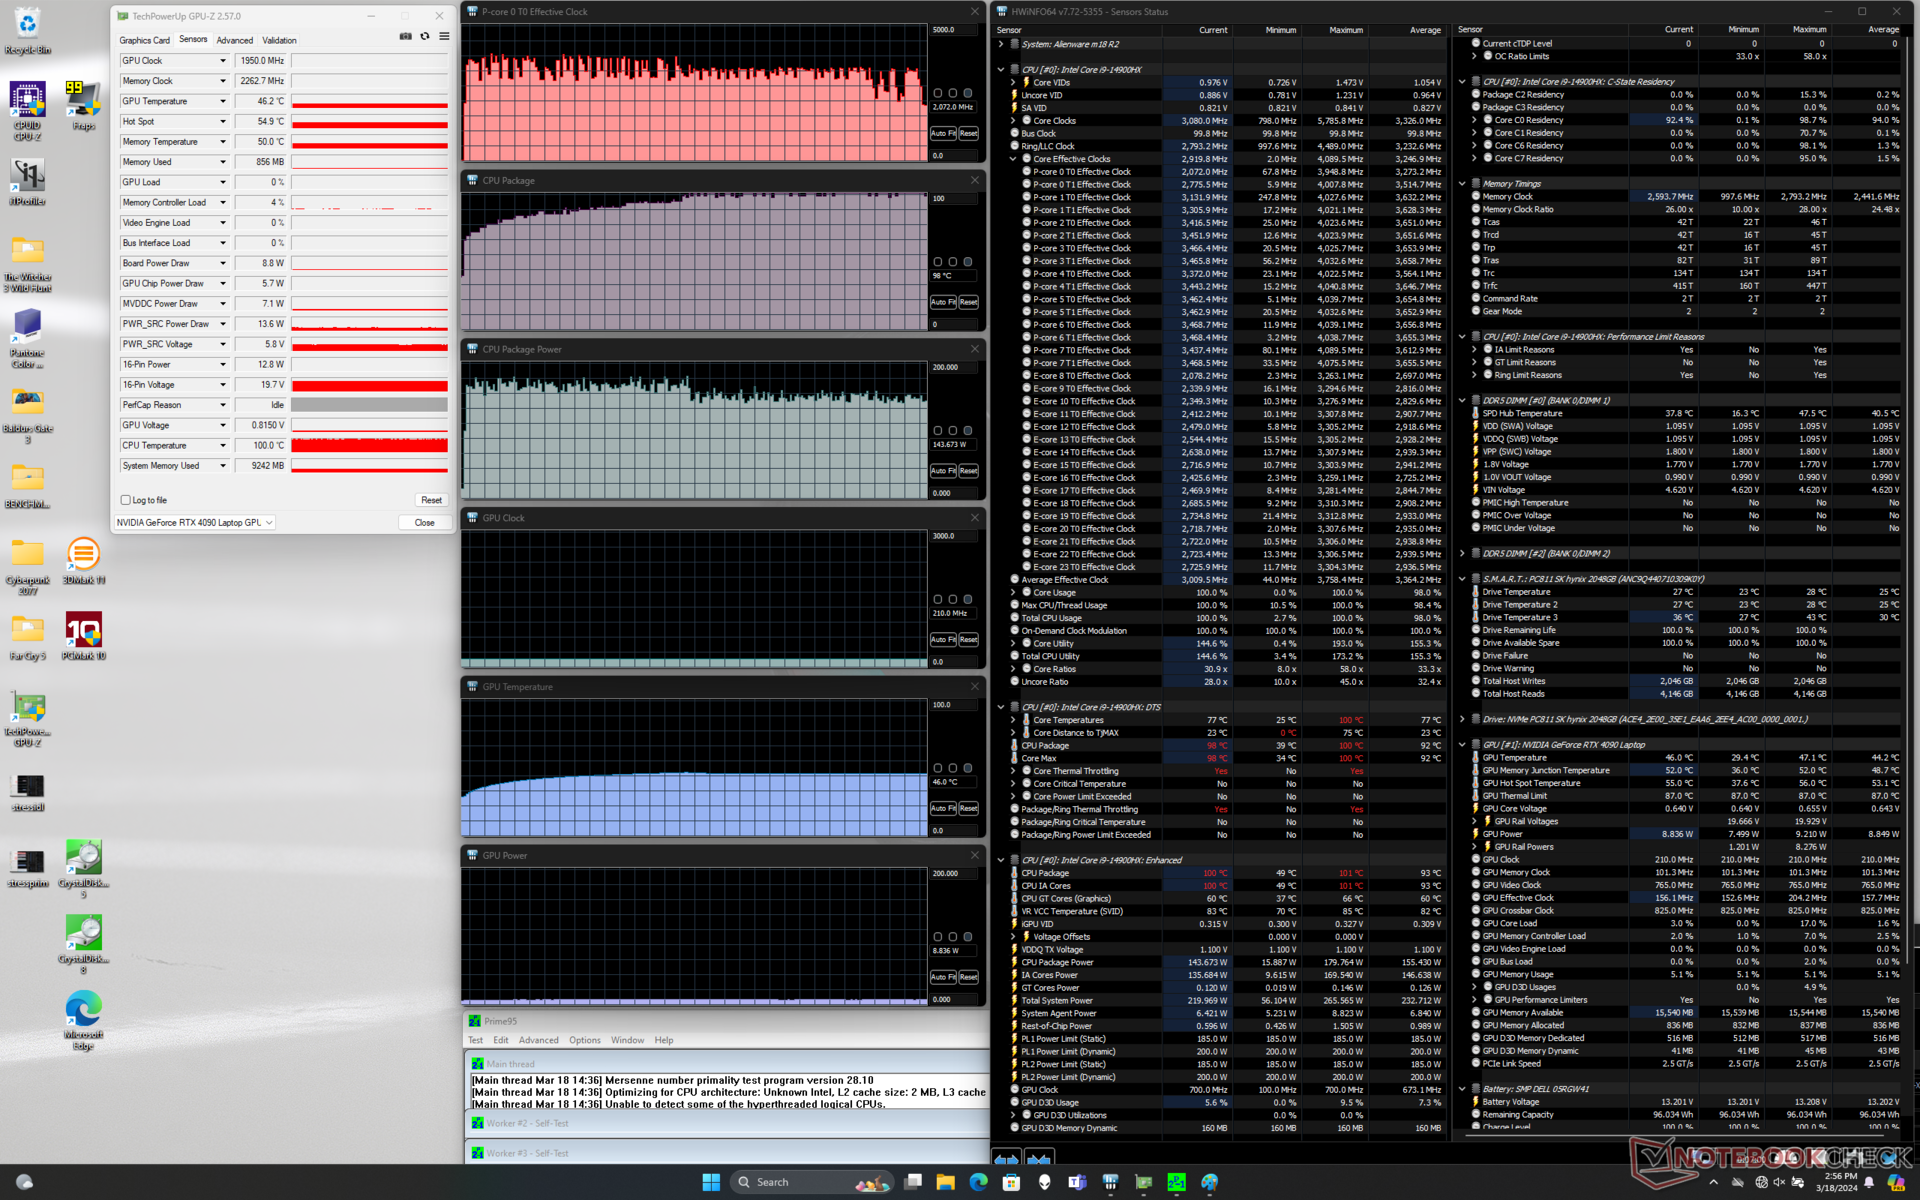
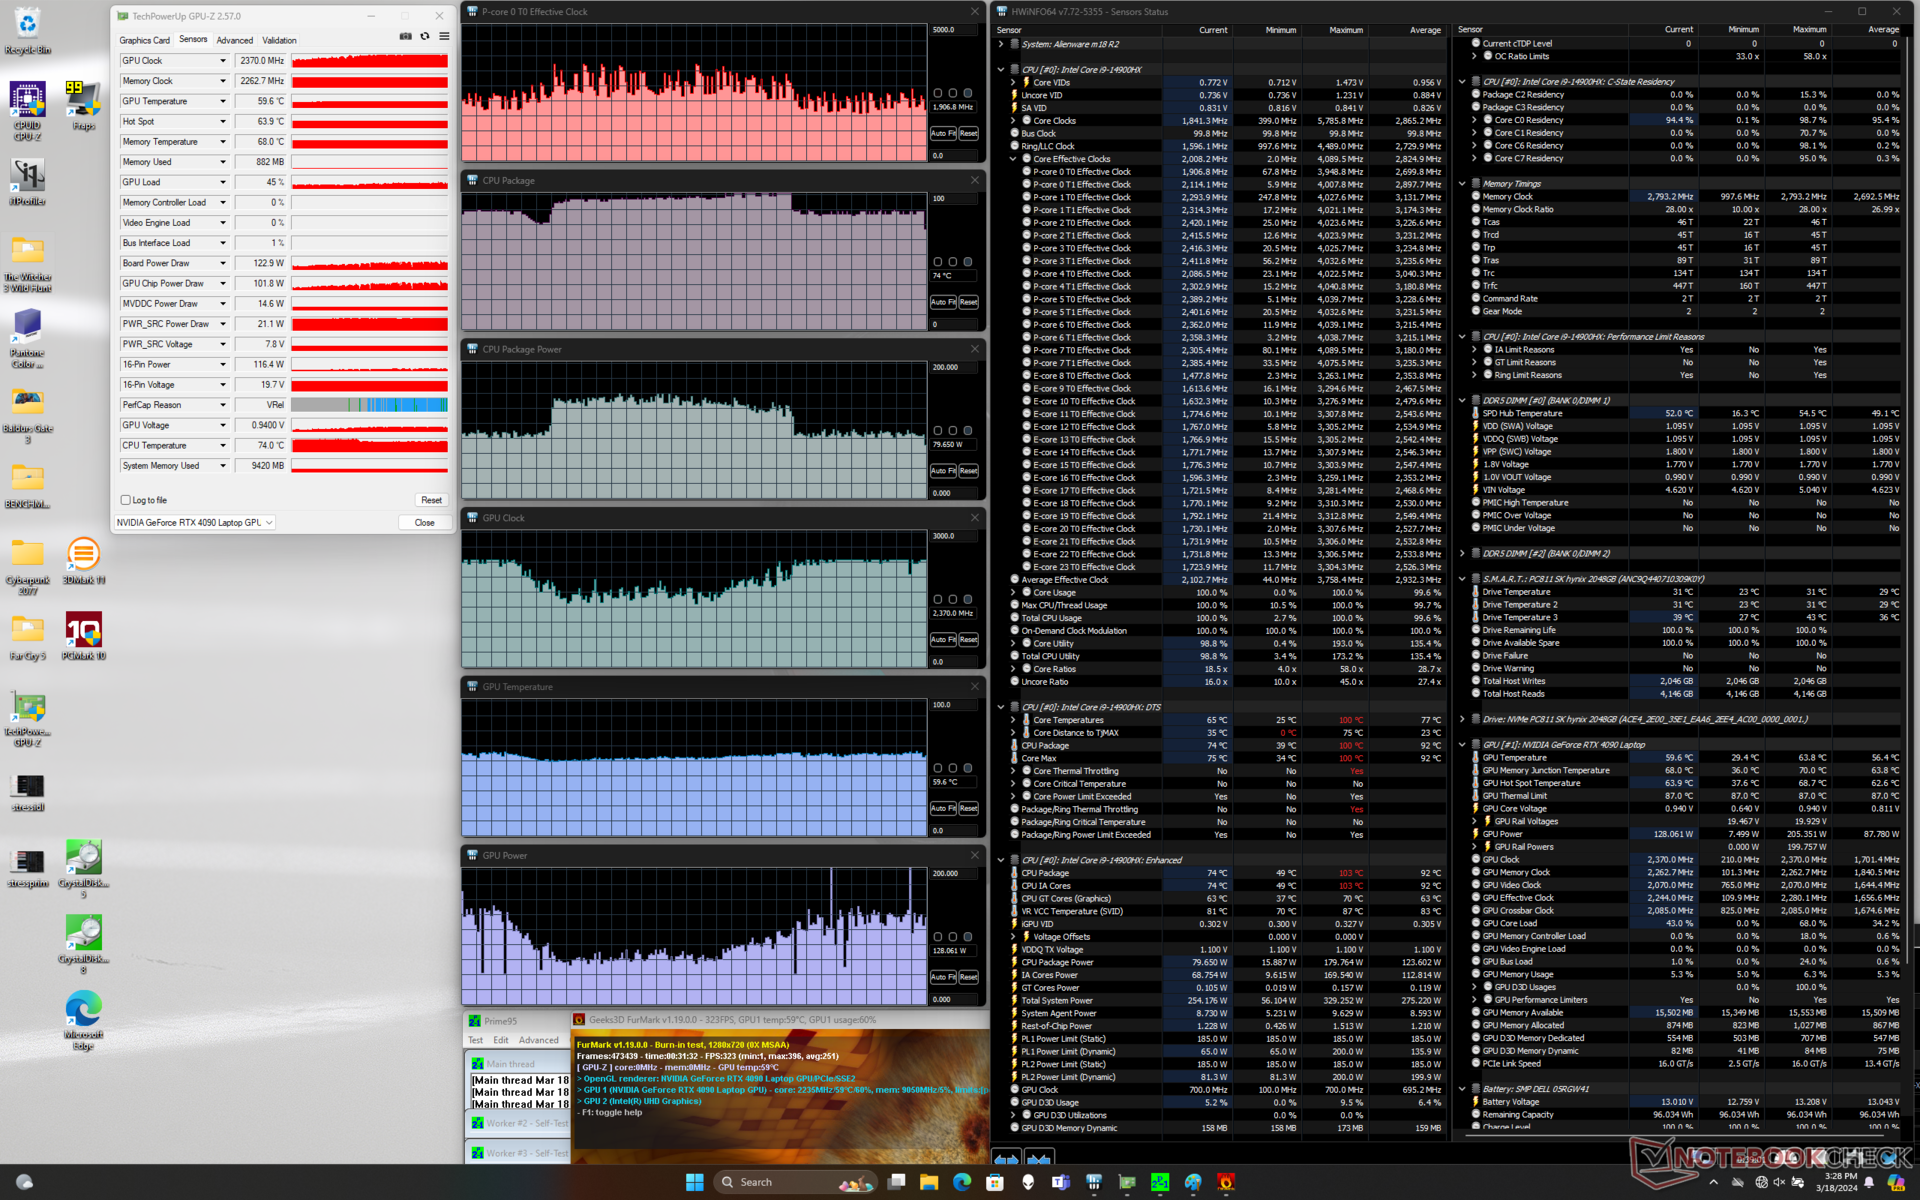
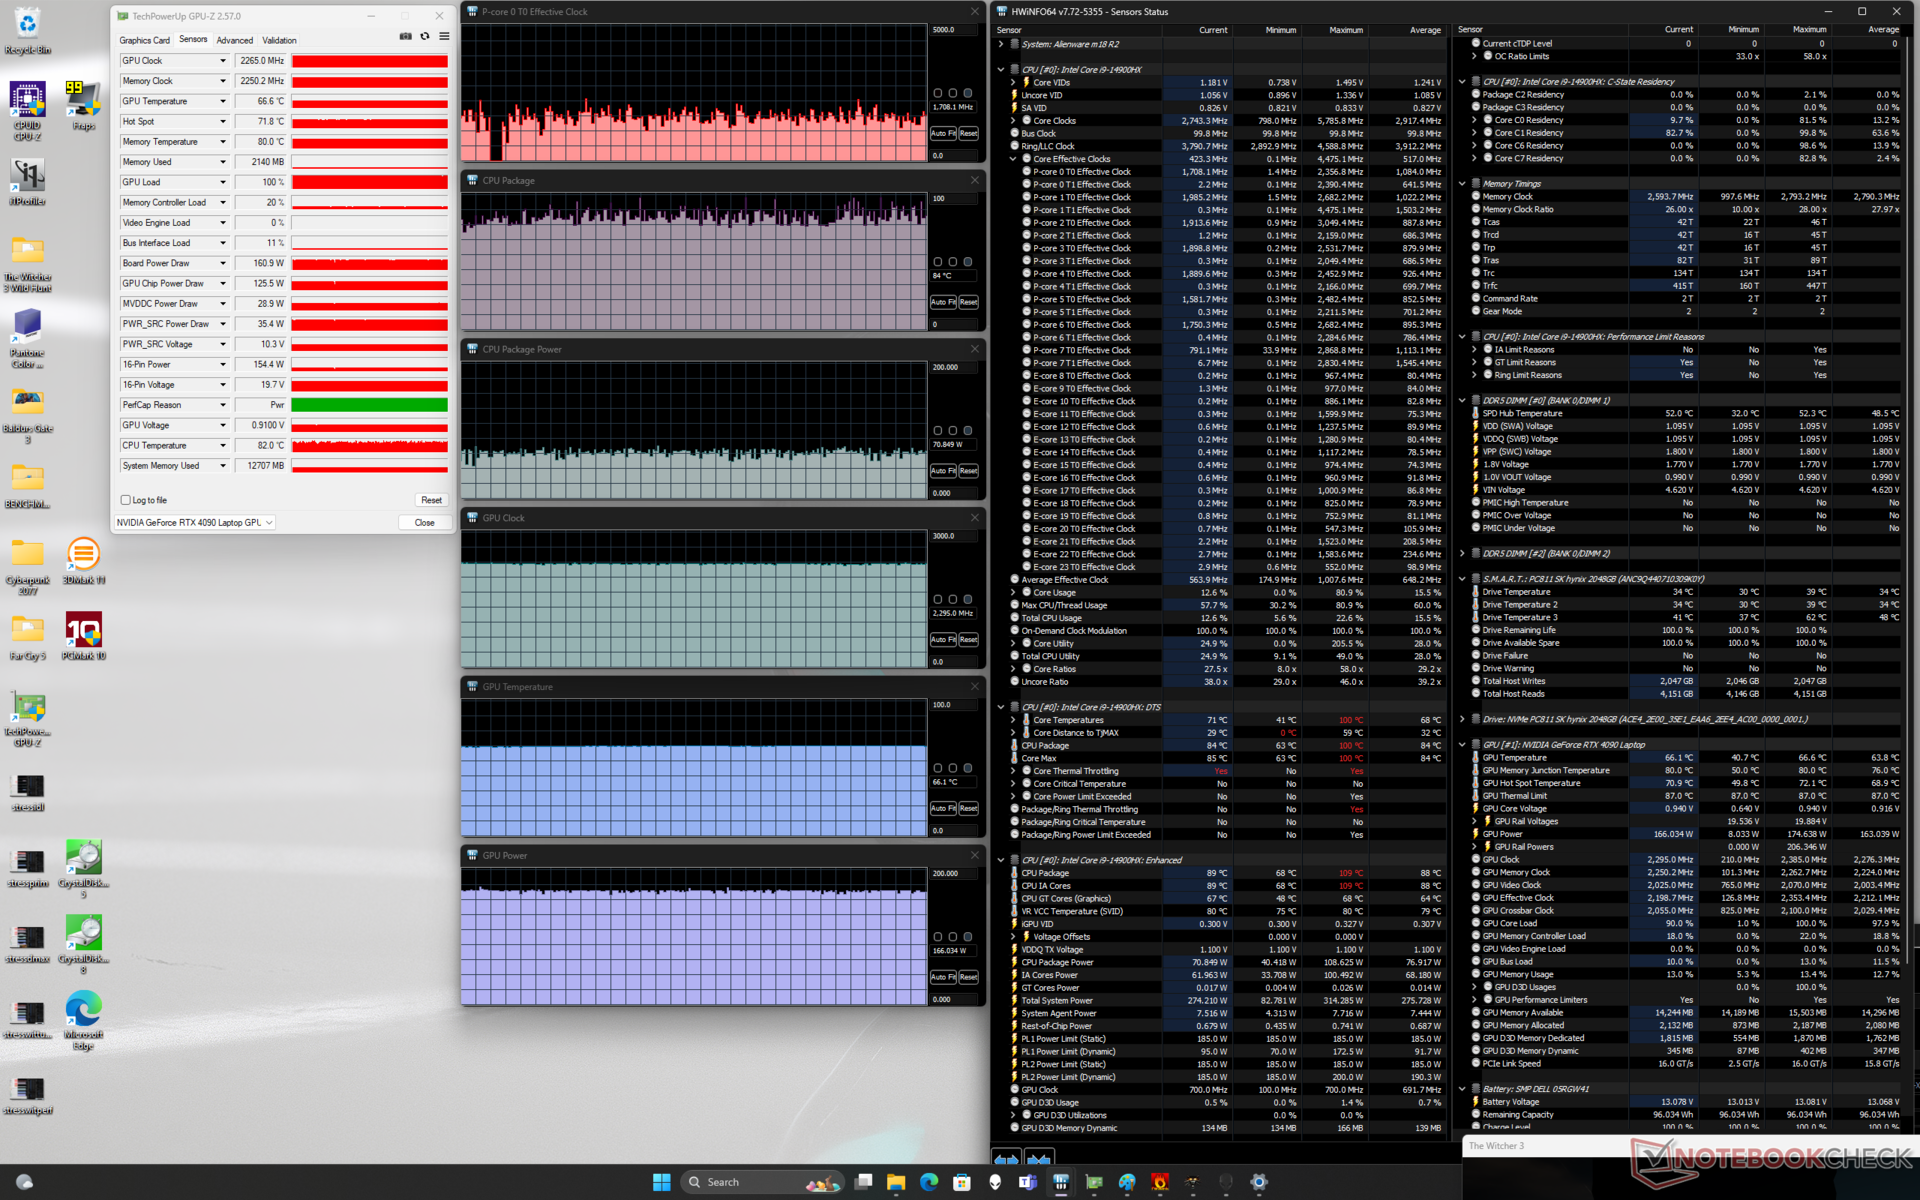
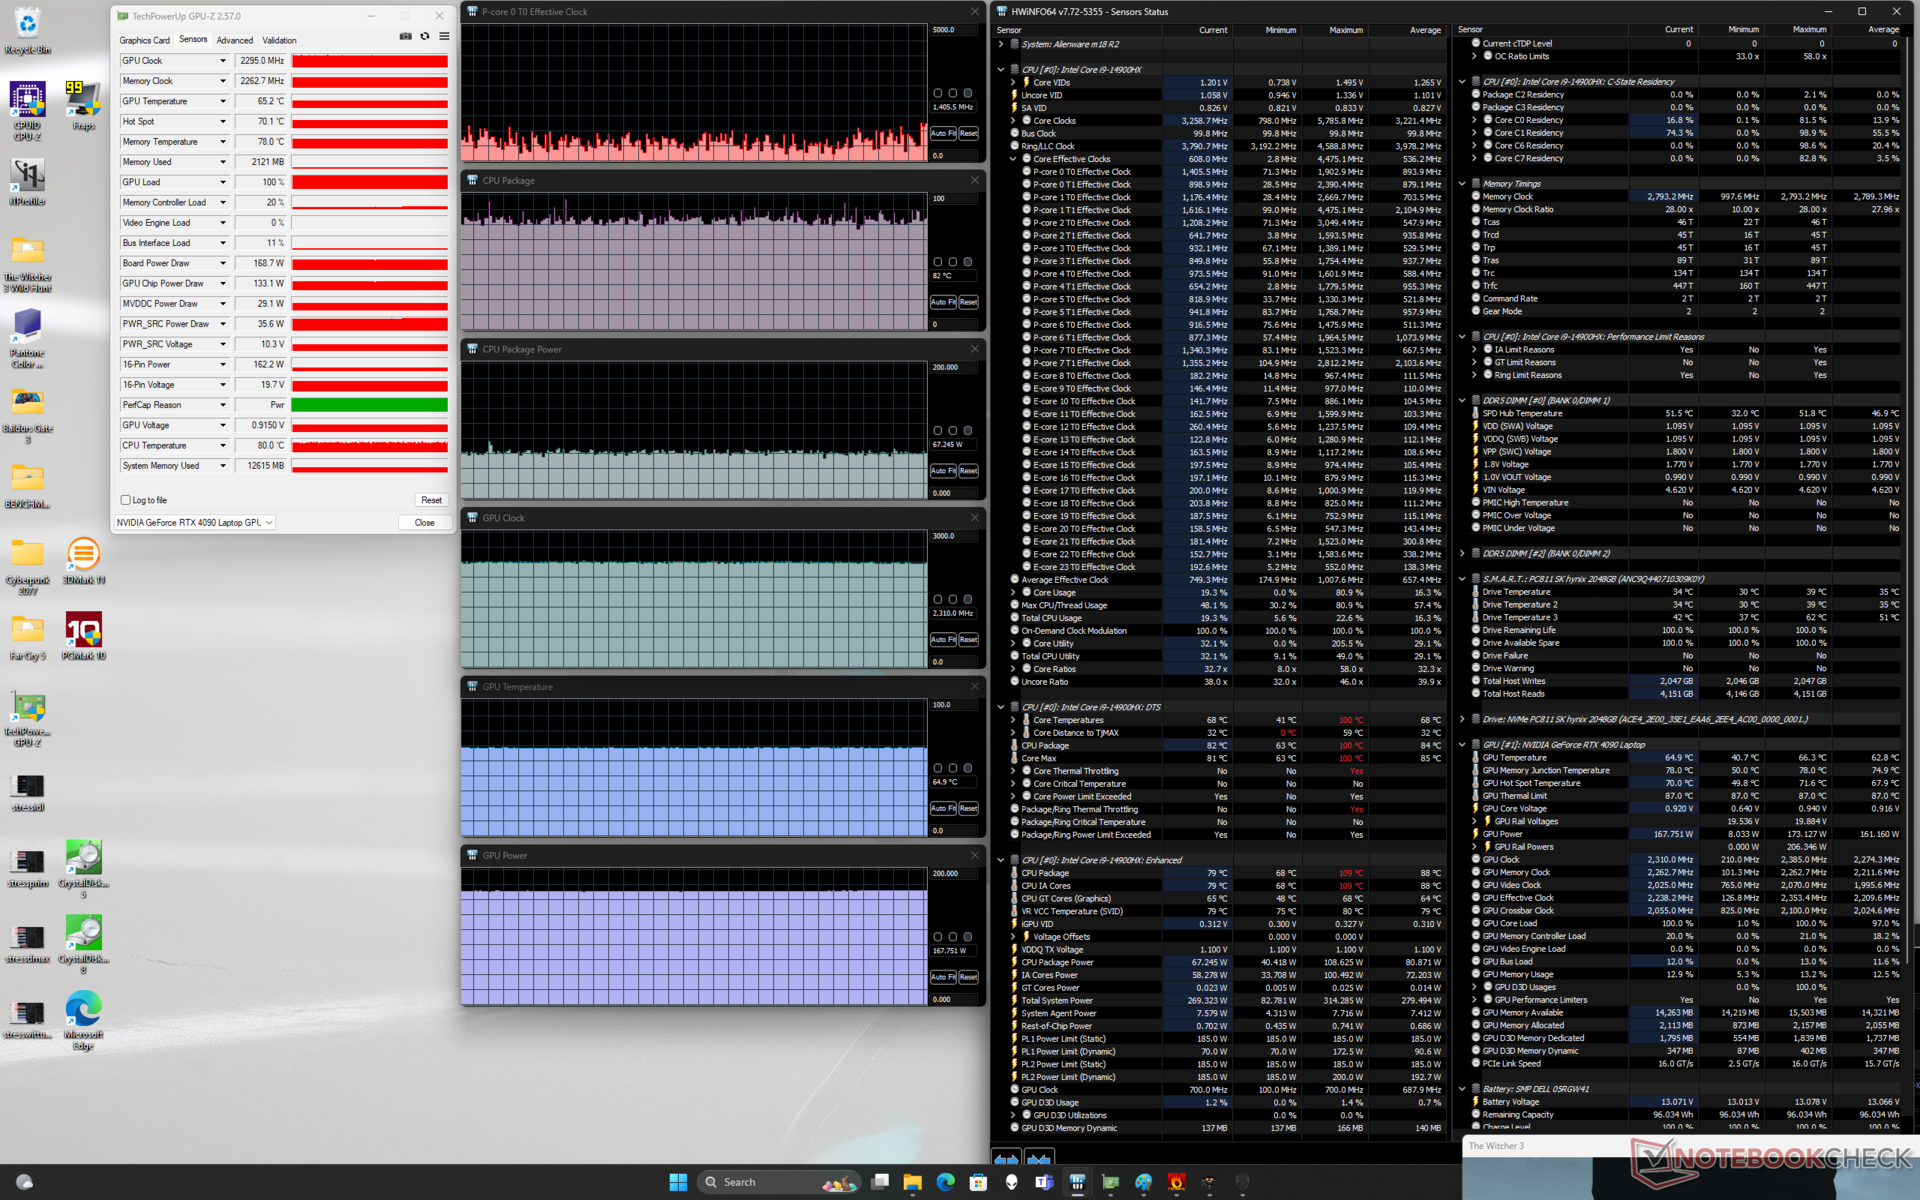
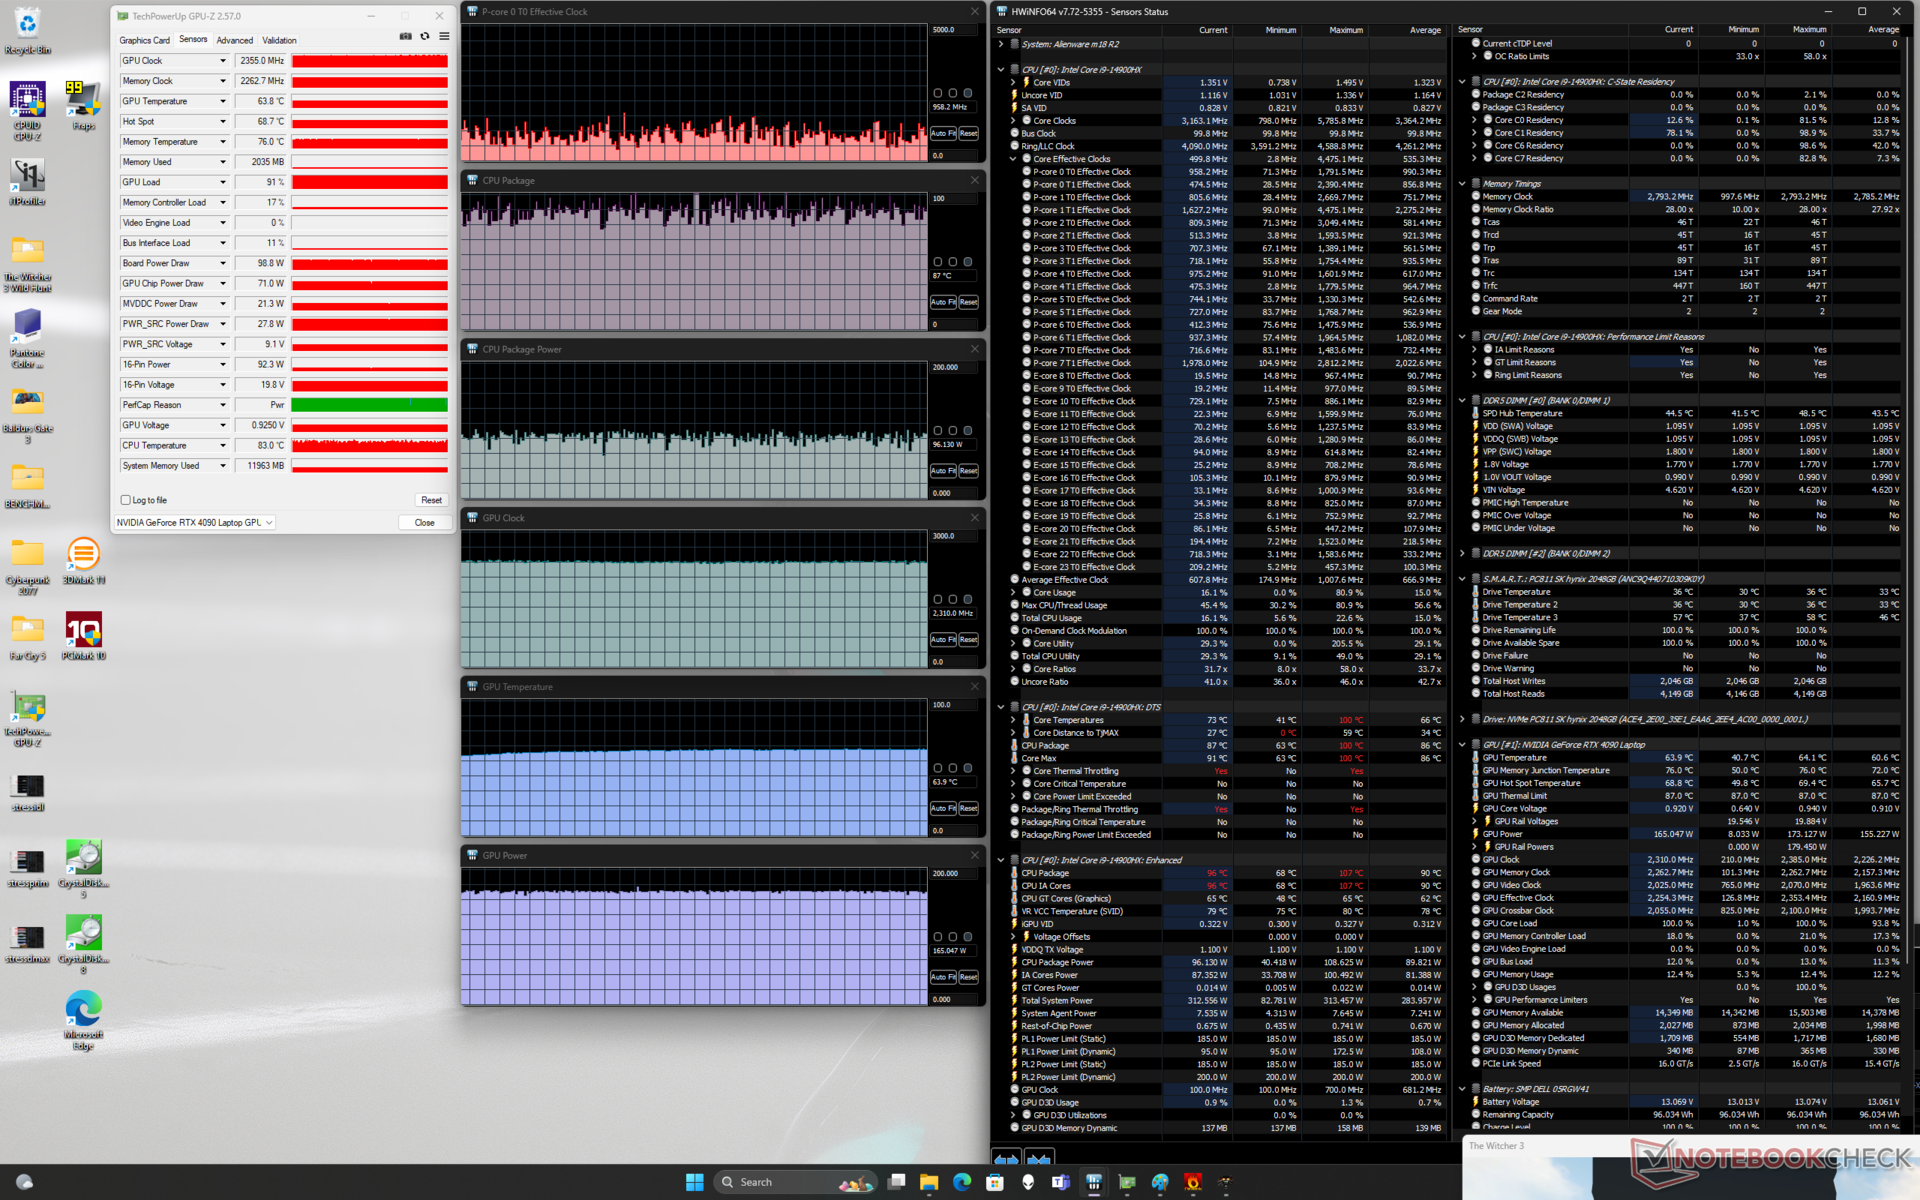
| CPU-klok (GHz) | GPU-klok (MHz) | Gemiddelde CPU-temperatuur (°C) | Gemiddelde GPU-temperatuur (°C) | |
| Systeem inactief | -- | -- | 36 | 27 |
| Prime95 Stress | 2.1 - 3.3 | -- | 99 | 46 |
| Prime95 + FurMark Stress | 1.7 - 3.7 | 1350 - 2370 | 74 - 100 | 54 - 61 |
| Witcher 3 Stress (evenwichtige modus) | ~1,7 | 2295 | ~84 | 66 |
| Witcher 3 Belasting (Prestatiemodus) | ~1.4 | 2310 | ~82 | 65 |
| Witcher 3 Belasting (Overdrive-modus) | ~1.0 | 2310 | ~87 | 64 |
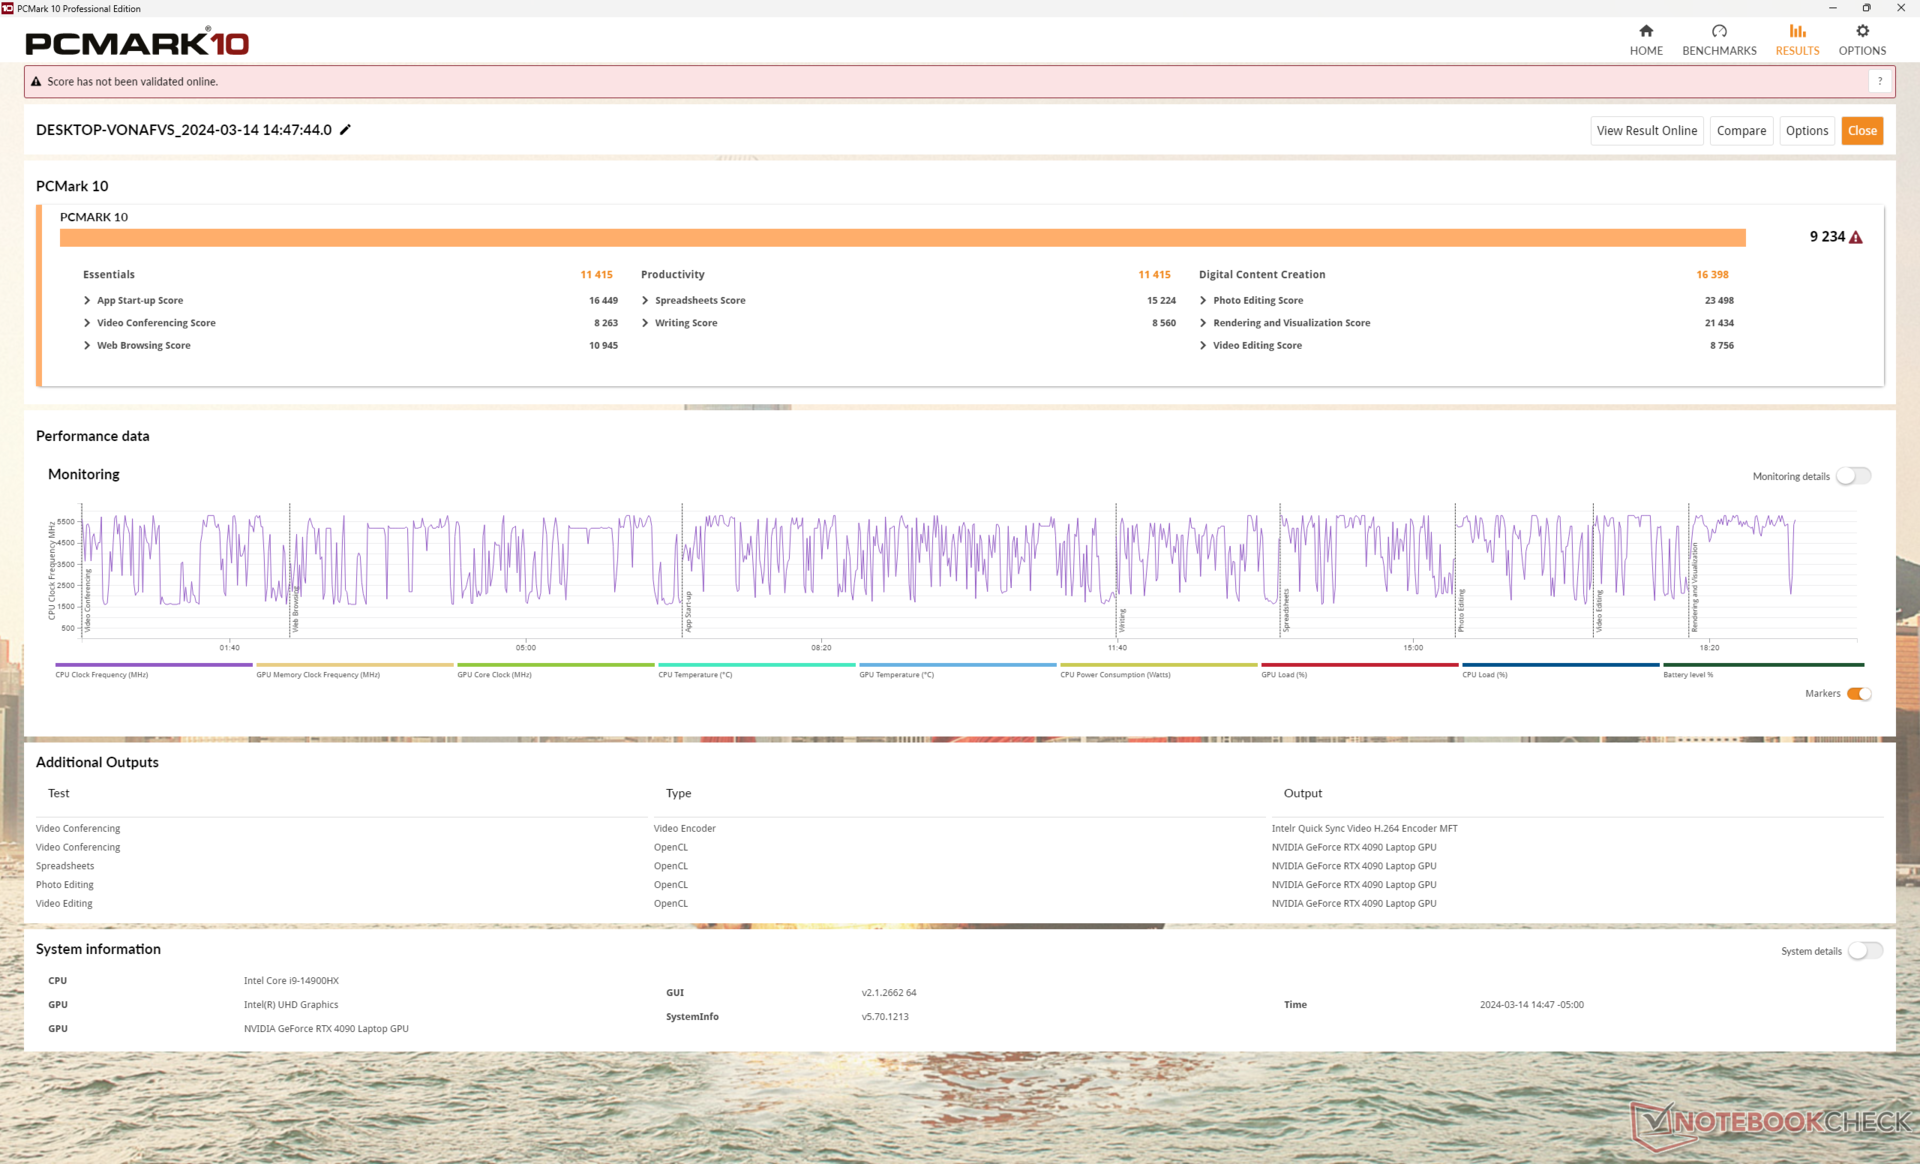
Systeemprestaties
CrossMark: Overall | Productivity | Creativity | Responsiveness
WebXPRT 3: Overall
WebXPRT 4: Overall
Mozilla Kraken 1.1: Total
| PCMark 10 / Score | |
| Alienware m18 R1 AMD | |
| Alienware m18 R2 | |
| MSI Titan 18 HX A14VIG | |
| Alienware m18 R1 | |
| Gemiddeld Intel Core i9-14900HX, NVIDIA GeForce RTX 4090 Laptop GPU (8230 - 9234, n=13) | |
| Acer Predator Helios 18 N23Q2 | |
| Asus ROG Strix G18 G814JI | |
| PCMark 10 / Essentials | |
| Alienware m18 R1 AMD | |
| MSI Titan 18 HX A14VIG | |
| Alienware m18 R2 | |
| Alienware m18 R1 | |
| Gemiddeld Intel Core i9-14900HX, NVIDIA GeForce RTX 4090 Laptop GPU (10778 - 11628, n=13) | |
| Acer Predator Helios 18 N23Q2 | |
| Asus ROG Strix G18 G814JI | |
| PCMark 10 / Productivity | |
| Alienware m18 R2 | |
| Alienware m18 R1 AMD | |
| Gemiddeld Intel Core i9-14900HX, NVIDIA GeForce RTX 4090 Laptop GPU (9458 - 11759, n=13) | |
| Acer Predator Helios 18 N23Q2 | |
| MSI Titan 18 HX A14VIG | |
| Alienware m18 R1 | |
| Asus ROG Strix G18 G814JI | |
| PCMark 10 / Digital Content Creation | |
| Alienware m18 R1 AMD | |
| MSI Titan 18 HX A14VIG | |
| Alienware m18 R2 | |
| Alienware m18 R1 | |
| Gemiddeld Intel Core i9-14900HX, NVIDIA GeForce RTX 4090 Laptop GPU (13219 - 16462, n=13) | |
| Acer Predator Helios 18 N23Q2 | |
| Asus ROG Strix G18 G814JI | |
| CrossMark / Overall | |
| Acer Predator Helios 18 N23Q2 | |
| Alienware m18 R1 | |
| Gemiddeld Intel Core i9-14900HX, NVIDIA GeForce RTX 4090 Laptop GPU (1877 - 2344, n=10) | |
| Alienware m18 R2 | |
| Alienware m18 R1 AMD | |
| MSI Titan 18 HX A14VIG | |
| CrossMark / Productivity | |
| Acer Predator Helios 18 N23Q2 | |
| Alienware m18 R1 | |
| Gemiddeld Intel Core i9-14900HX, NVIDIA GeForce RTX 4090 Laptop GPU (1738 - 2162, n=10) | |
| Alienware m18 R2 | |
| Alienware m18 R1 AMD | |
| MSI Titan 18 HX A14VIG | |
| CrossMark / Creativity | |
| Alienware m18 R1 | |
| Acer Predator Helios 18 N23Q2 | |
| Alienware m18 R2 | |
| Gemiddeld Intel Core i9-14900HX, NVIDIA GeForce RTX 4090 Laptop GPU (2195 - 2660, n=10) | |
| Alienware m18 R1 AMD | |
| MSI Titan 18 HX A14VIG | |
| CrossMark / Responsiveness | |
| Acer Predator Helios 18 N23Q2 | |
| Alienware m18 R1 | |
| Gemiddeld Intel Core i9-14900HX, NVIDIA GeForce RTX 4090 Laptop GPU (1478 - 2327, n=10) | |
| Alienware m18 R2 | |
| Alienware m18 R1 AMD | |
| MSI Titan 18 HX A14VIG | |
| WebXPRT 3 / Overall | |
| Alienware m18 R1 AMD | |
| Alienware m18 R1 | |
| MSI Titan 18 HX A14VIG | |
| Alienware m18 R2 | |
| Gemiddeld Intel Core i9-14900HX, NVIDIA GeForce RTX 4090 Laptop GPU (279 - 339, n=10) | |
| Acer Predator Helios 18 N23Q2 | |
| Asus ROG Strix G18 G814JI | |
| Asus ROG Strix G18 G814JI | |
| WebXPRT 4 / Overall | |
| Alienware m18 R2 | |
| Alienware m18 R1 | |
| Alienware m18 R1 AMD | |
| Gemiddeld Intel Core i9-14900HX, NVIDIA GeForce RTX 4090 Laptop GPU (246 - 309, n=8) | |
| MSI Titan 18 HX A14VIG | |
| Asus ROG Strix G18 G814JI | |
| Asus ROG Strix G18 G814JI | |
| Mozilla Kraken 1.1 / Total | |
| Asus ROG Strix G18 G814JI | |
| Asus ROG Strix G18 G814JI | |
| Alienware m18 R1 AMD | |
| Alienware m18 R1 | |
| Acer Predator Helios 18 N23Q2 | |
| Gemiddeld Intel Core i9-14900HX, NVIDIA GeForce RTX 4090 Laptop GPU (428 - 535, n=11) | |
| MSI Titan 18 HX A14VIG | |
| Alienware m18 R2 | |
* ... kleiner is beter
| PCMark 10 Score | 9234 punten | |
Help | ||
| AIDA64 / Memory Copy | |
| Alienware m18 R1 | |
| Alienware m18 R2 | |
| Acer Predator Helios 18 N23Q2 | |
| Gemiddeld Intel Core i9-14900HX (38028 - 83392, n=36) | |
| Asus ROG Strix G18 G814JI | |
| MSI Titan 18 HX A14VIG | |
| Alienware m18 R1 AMD | |
| AIDA64 / Memory Read | |
| Alienware m18 R1 | |
| Acer Predator Helios 18 N23Q2 | |
| Alienware m18 R2 | |
| Gemiddeld Intel Core i9-14900HX (43306 - 87568, n=36) | |
| Asus ROG Strix G18 G814JI | |
| Alienware m18 R1 AMD | |
| MSI Titan 18 HX A14VIG | |
| AIDA64 / Memory Write | |
| Alienware m18 R1 | |
| Alienware m18 R2 | |
| Acer Predator Helios 18 N23Q2 | |
| Gemiddeld Intel Core i9-14900HX (37146 - 80589, n=36) | |
| Alienware m18 R1 AMD | |
| Asus ROG Strix G18 G814JI | |
| MSI Titan 18 HX A14VIG | |
| AIDA64 / Memory Latency | |
| MSI Titan 18 HX A14VIG | |
| Alienware m18 R1 AMD | |
| Alienware m18 R2 | |
| Gemiddeld Intel Core i9-14900HX (76.1 - 105, n=36) | |
| Asus ROG Strix G18 G814JI | |
| Acer Predator Helios 18 N23Q2 | |
| Alienware m18 R1 | |
* ... kleiner is beter
DPC latentie
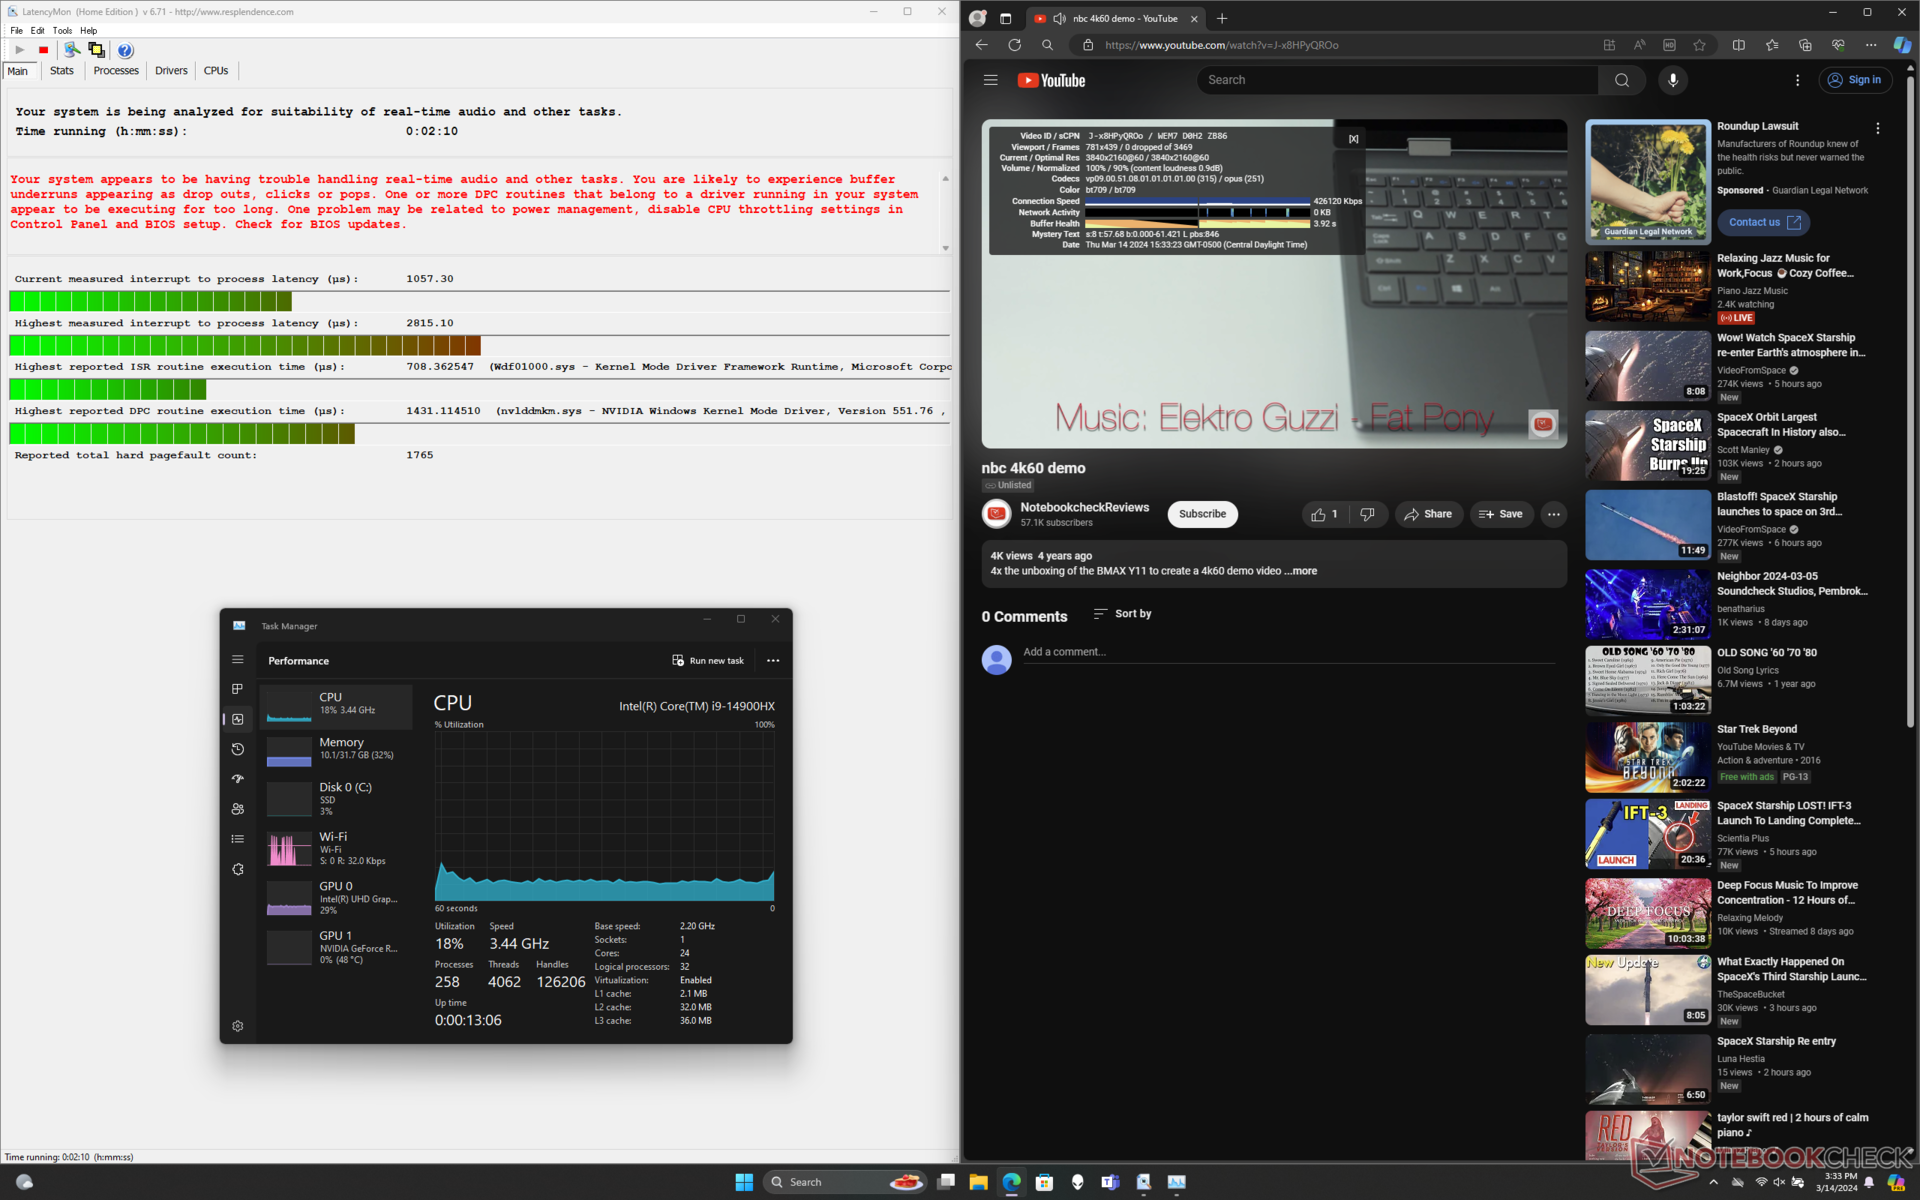
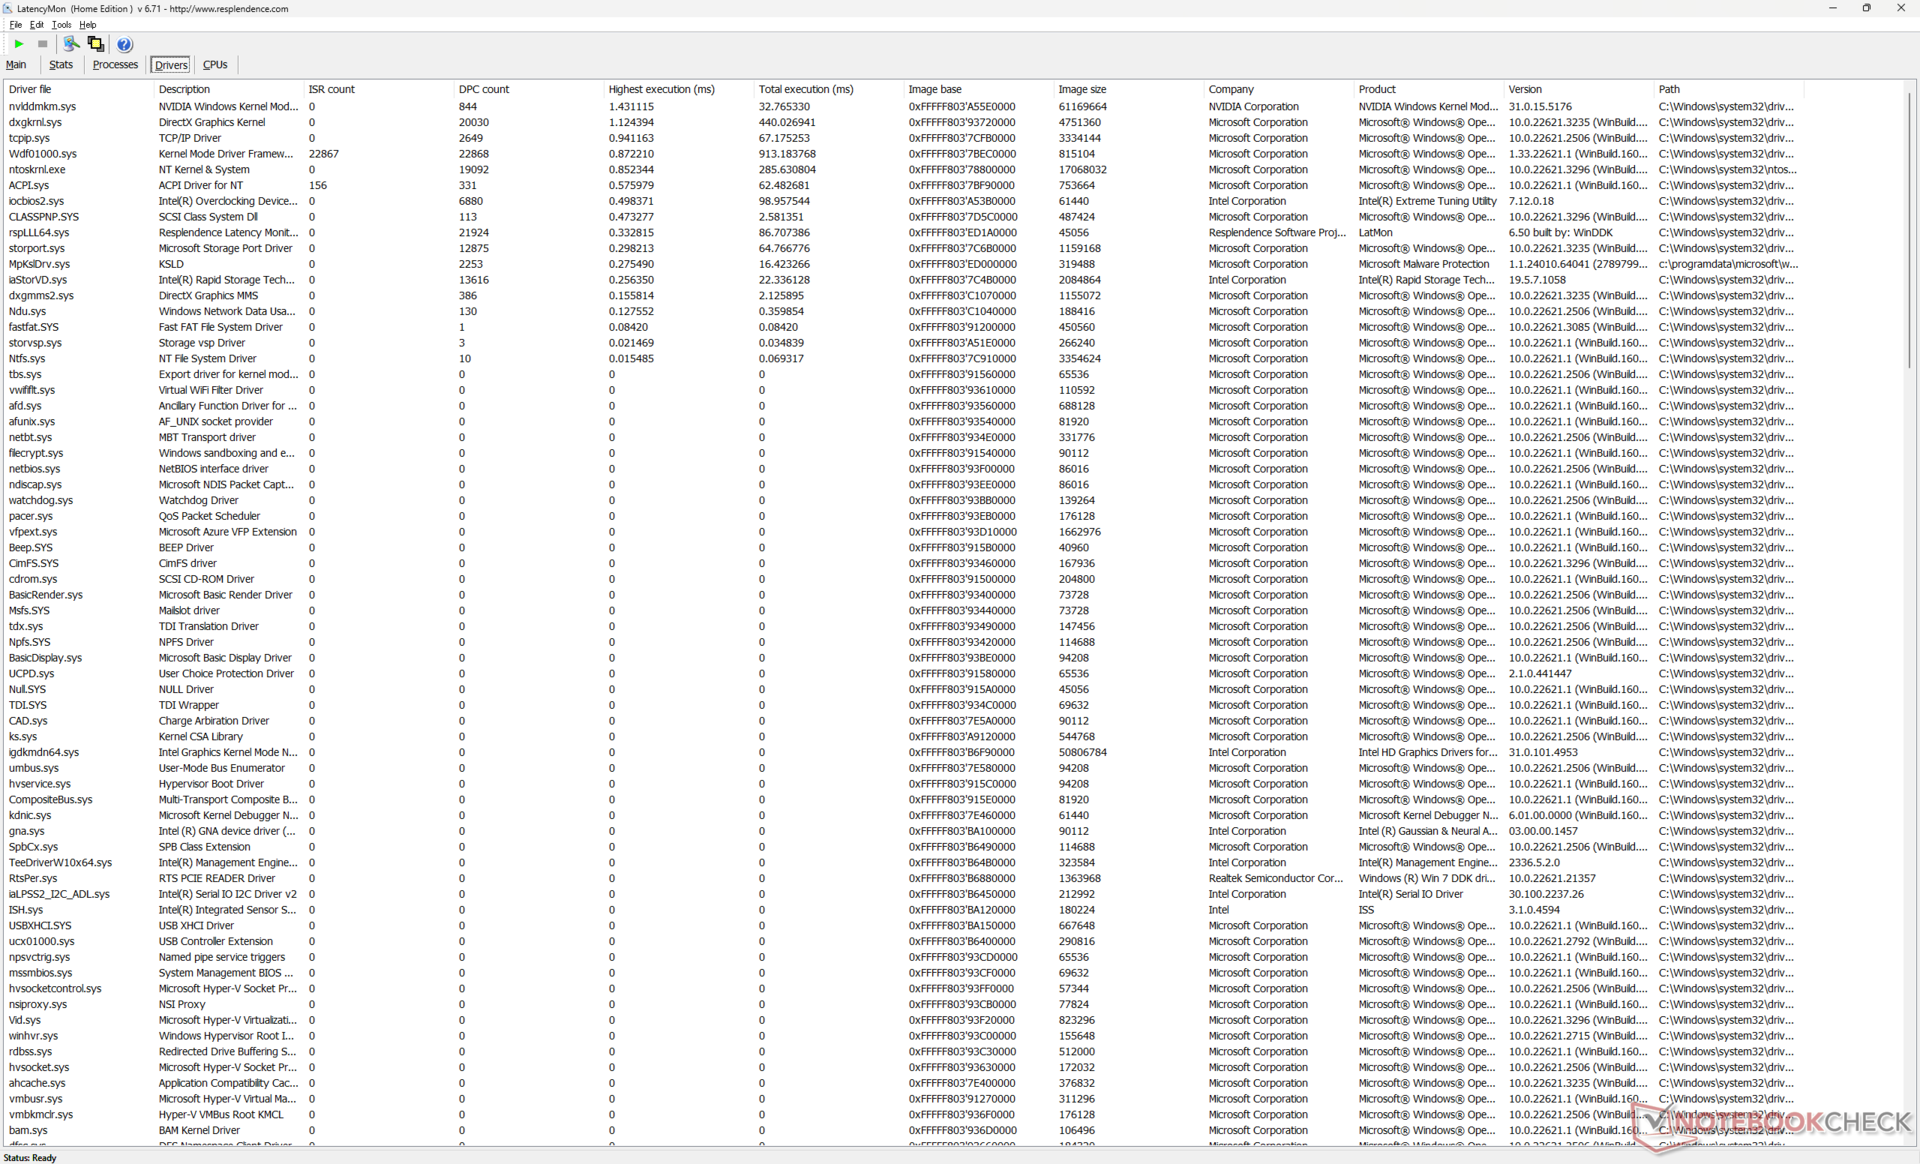
| DPC Latencies / LatencyMon - interrupt to process latency (max), Web, Youtube, Prime95 | |
| Acer Predator Helios 18 N23Q2 | |
| Alienware m18 R2 | |
| Alienware m18 R1 | |
| MSI Titan 18 HX A14VIG | |
| Alienware m18 R1 AMD | |
| Asus ROG Strix G18 G814JI | |
* ... kleiner is beter
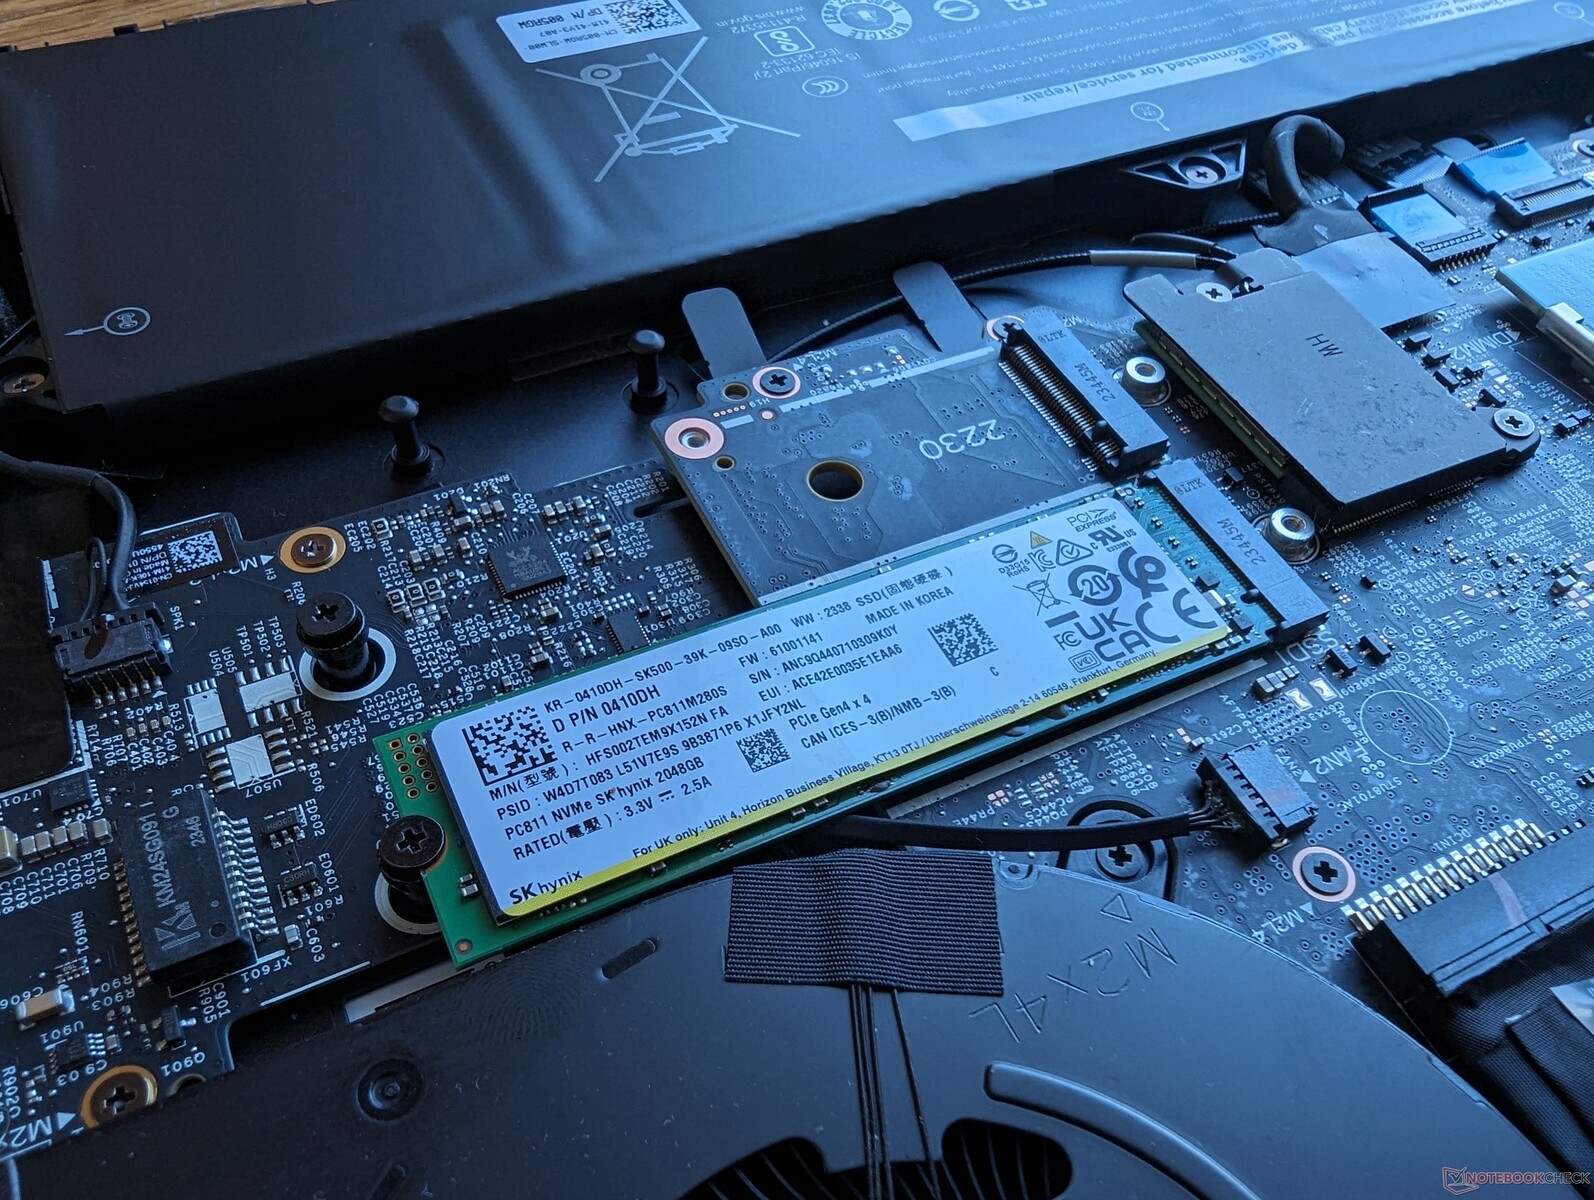
Opslagapparaten
De Alienware is een van de eerste die wordt geleverd met de 2 TB SK Hynix PC811 PCIe4 x4 NVMe SSD. In vergelijking met de PC801-serie bevat de PC811-serie 8D NAND-flash in plaats van 4D NAND voor een algehele dichtere opslagcapaciteit en een verbeterde energie-efficiëntie. De schijf is in staat om maximale overdrachtsnelheden van ~7100 MB/s te halen wanneer deze onder druk staat, wat in wezen het prestatieplafond is voor enkelvoudige PCIe4 x4 SSD's.
Dell kan configureren met twee drives van 4 TB voor een totaal van 8 TB aan opslag.
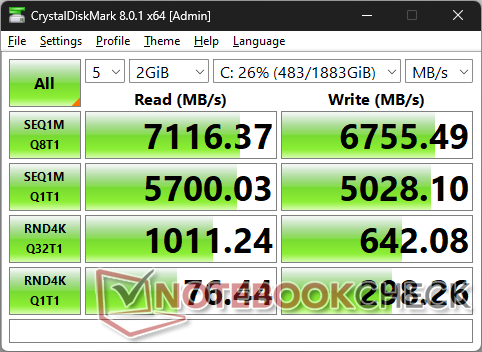
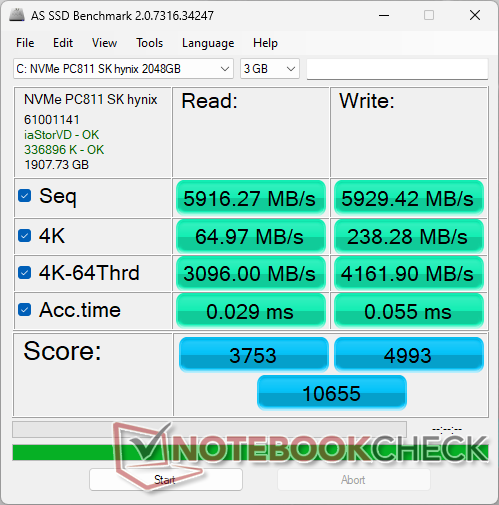

| Drive Performance rating - Percent | |
| Alienware m18 R2 | |
| Alienware m18 R1 | |
| Acer Predator Helios 18 N23Q2 | |
| MSI Titan 18 HX A14VIG | |
| Alienware m18 R1 AMD | |
| Asus ROG Strix G18 G814JI | |
* ... kleiner is beter
Disk Throttling: DiskSpd Read Loop, Queue Depth 8
GPU-prestaties - 175 W TGP Graphics
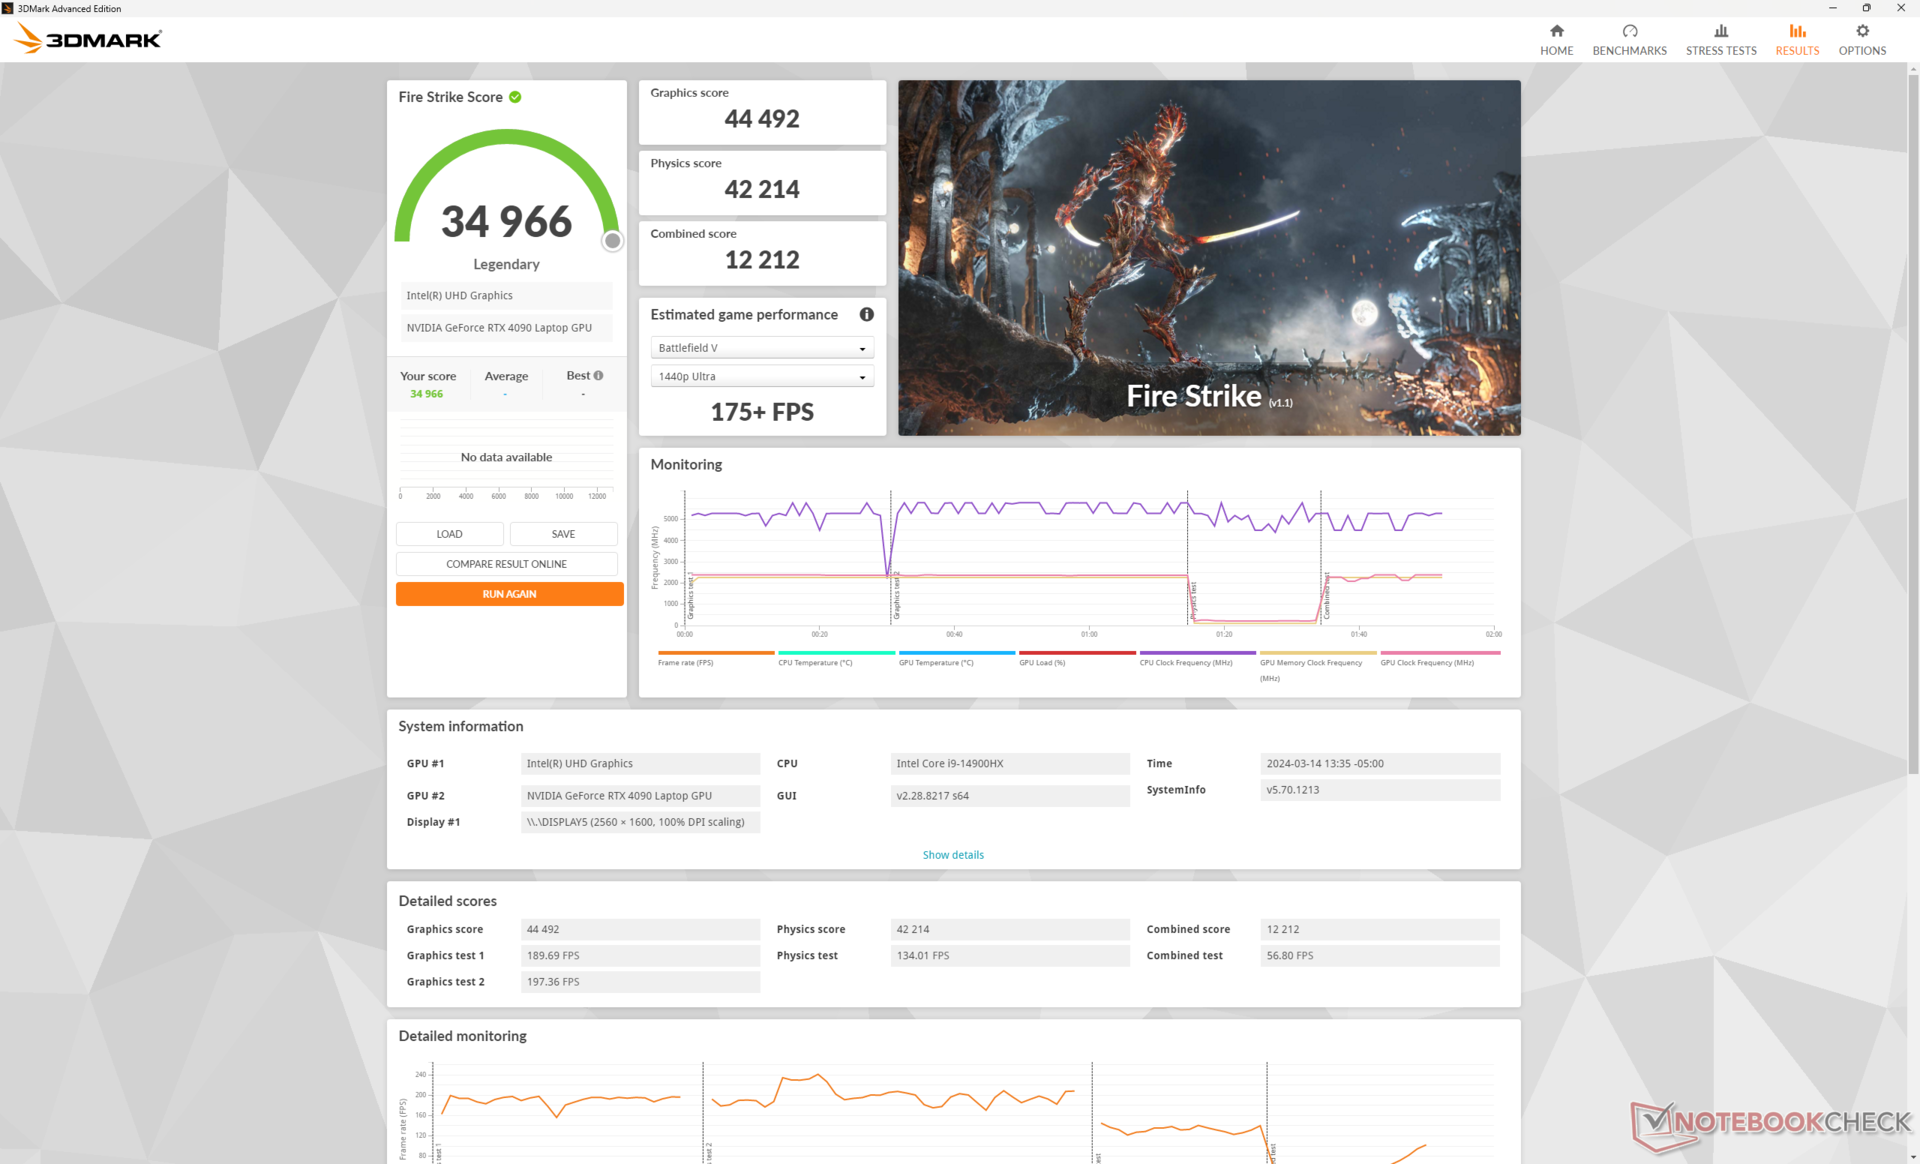
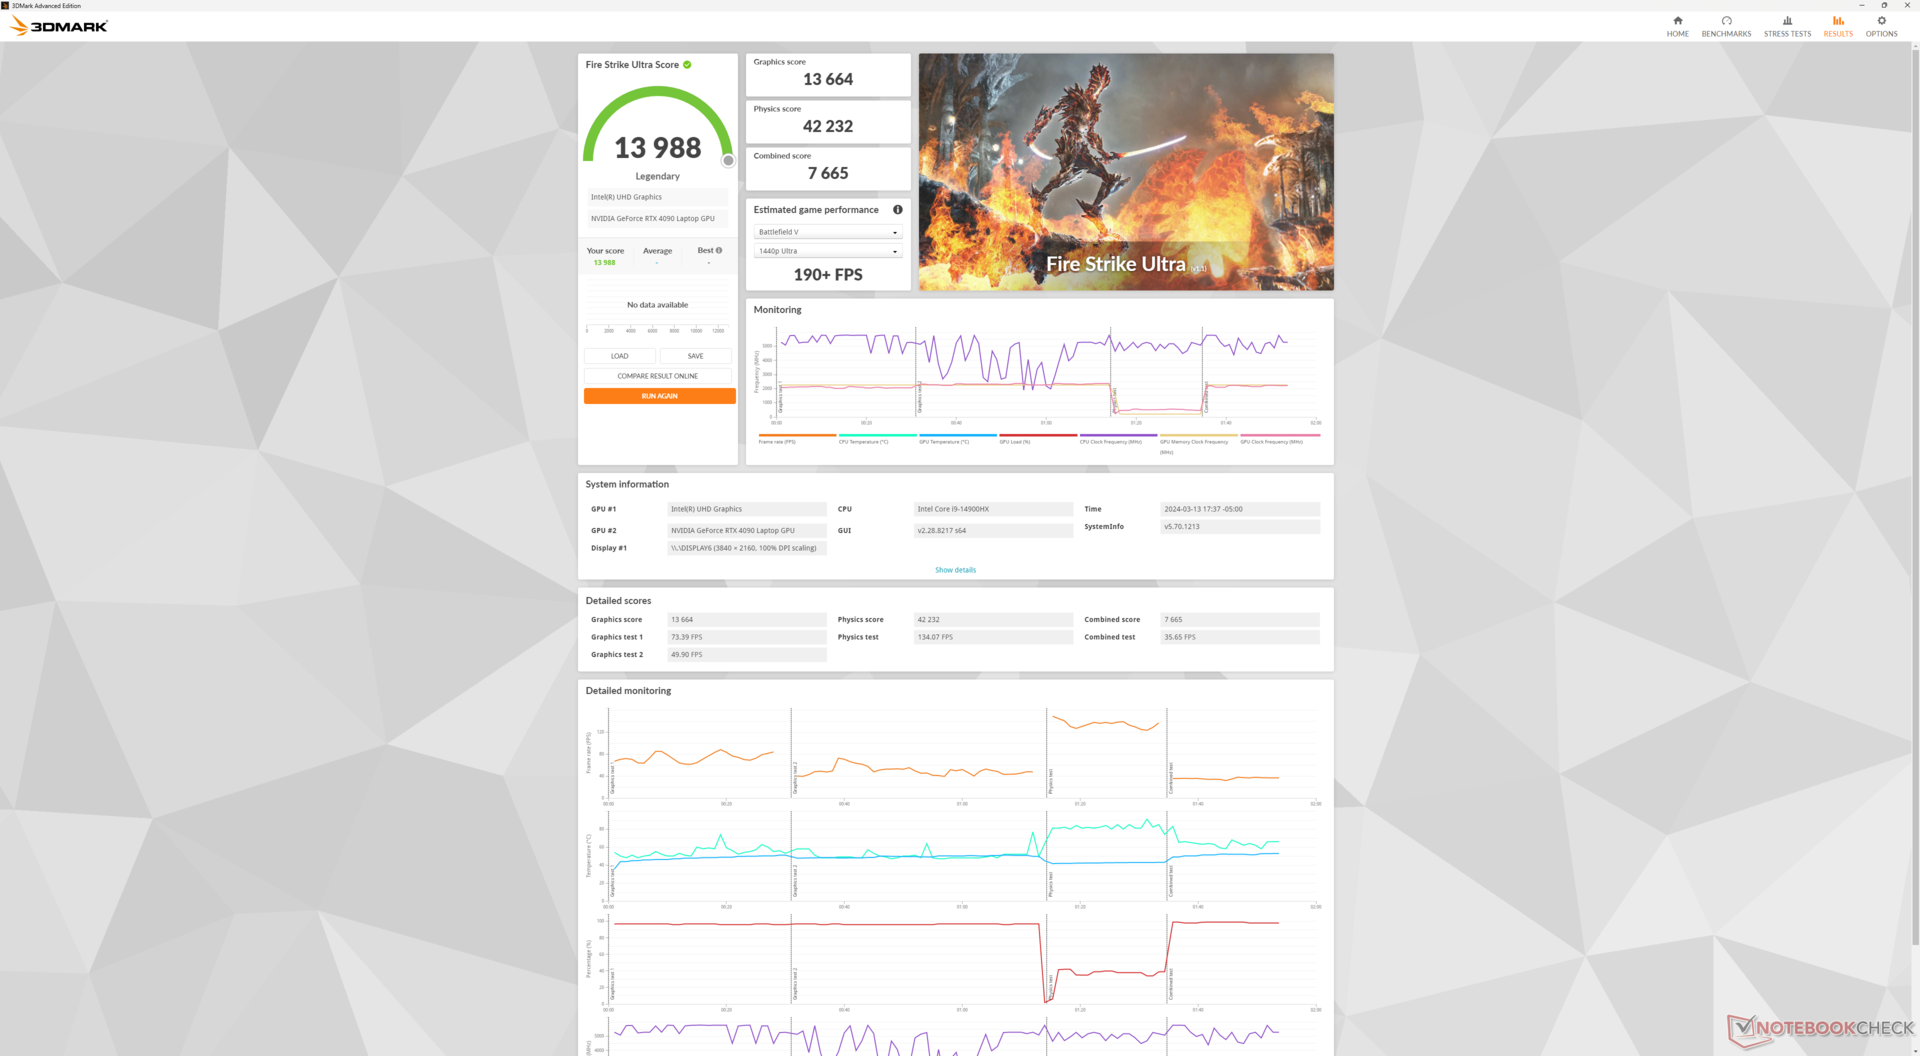
De 175 W GeForce RTX 4090 is dit jaar terug zonder grote veranderingen voor dezelfde gamingprestaties als de m18 R1 van vorig jaar. Het belangrijkste is misschien wel dat er opnieuw geen grote prestatieverschillen zijn tussen de profielen Overdrive, Performance en Balanced, zoals blijkt uit onze onderstaande tabel met Fire Strike resultaten.
| Vermogen Profiel | Grafische Score | Fysica Score | Gecombineerde Score |
| Overdrive modus | 13664 | 42232 | 7665 |
| Prestatiemodus | 13579 (-0%) | 42217 (-0%) | 7541 (-2%) |
| Gebalanceerde modus | 13449 (-1%) | 40978 (-3%) | 7592 (-1%) |
| Batterijvermogen | 5116 (-63%) | 22857 (-46%) | 2102 (-73%) |
Zakken naar de RTX 4080, 4070 of 4060 configuratie zal de grafische prestaties naar verwachting met respectievelijk ongeveer 5 tot 10 procent, 30 tot 35 procent en 45 tot 55 procent verminderen. De prestatiedaling is dus het grootst tussen de RTX 4080 en RTX 4070.
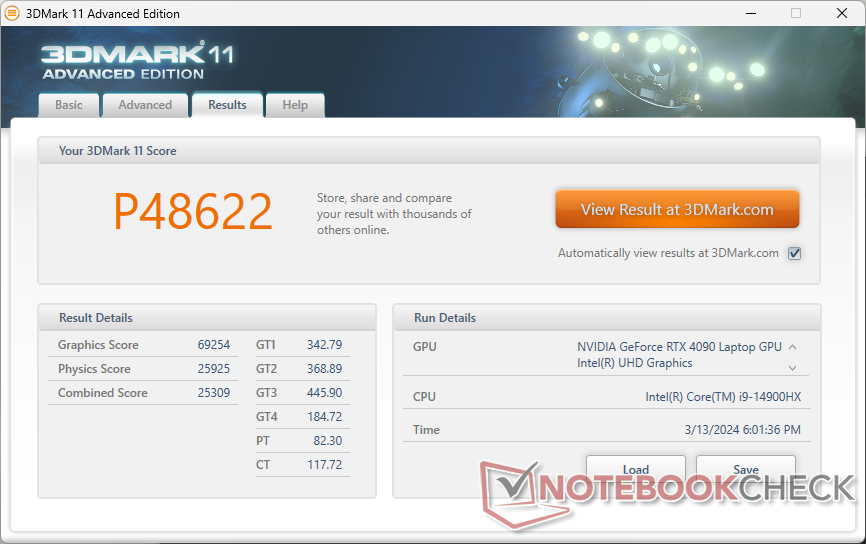
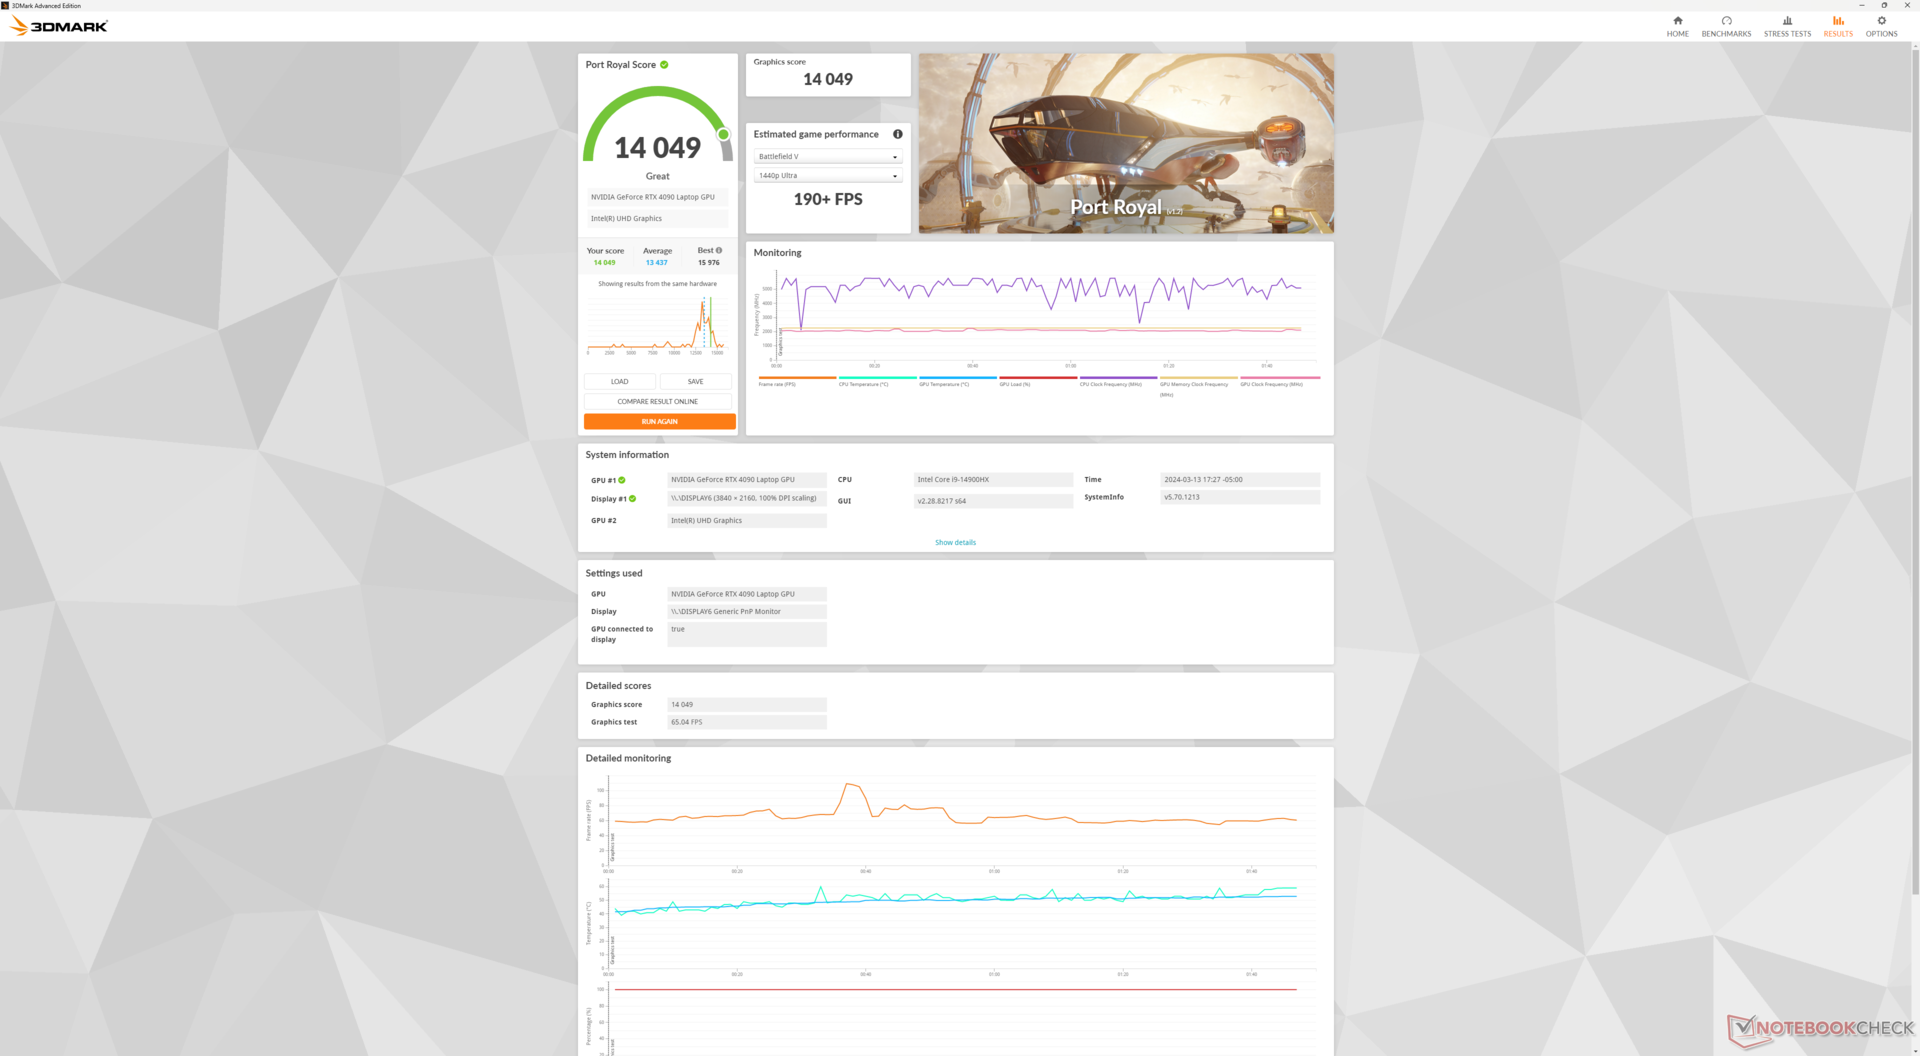
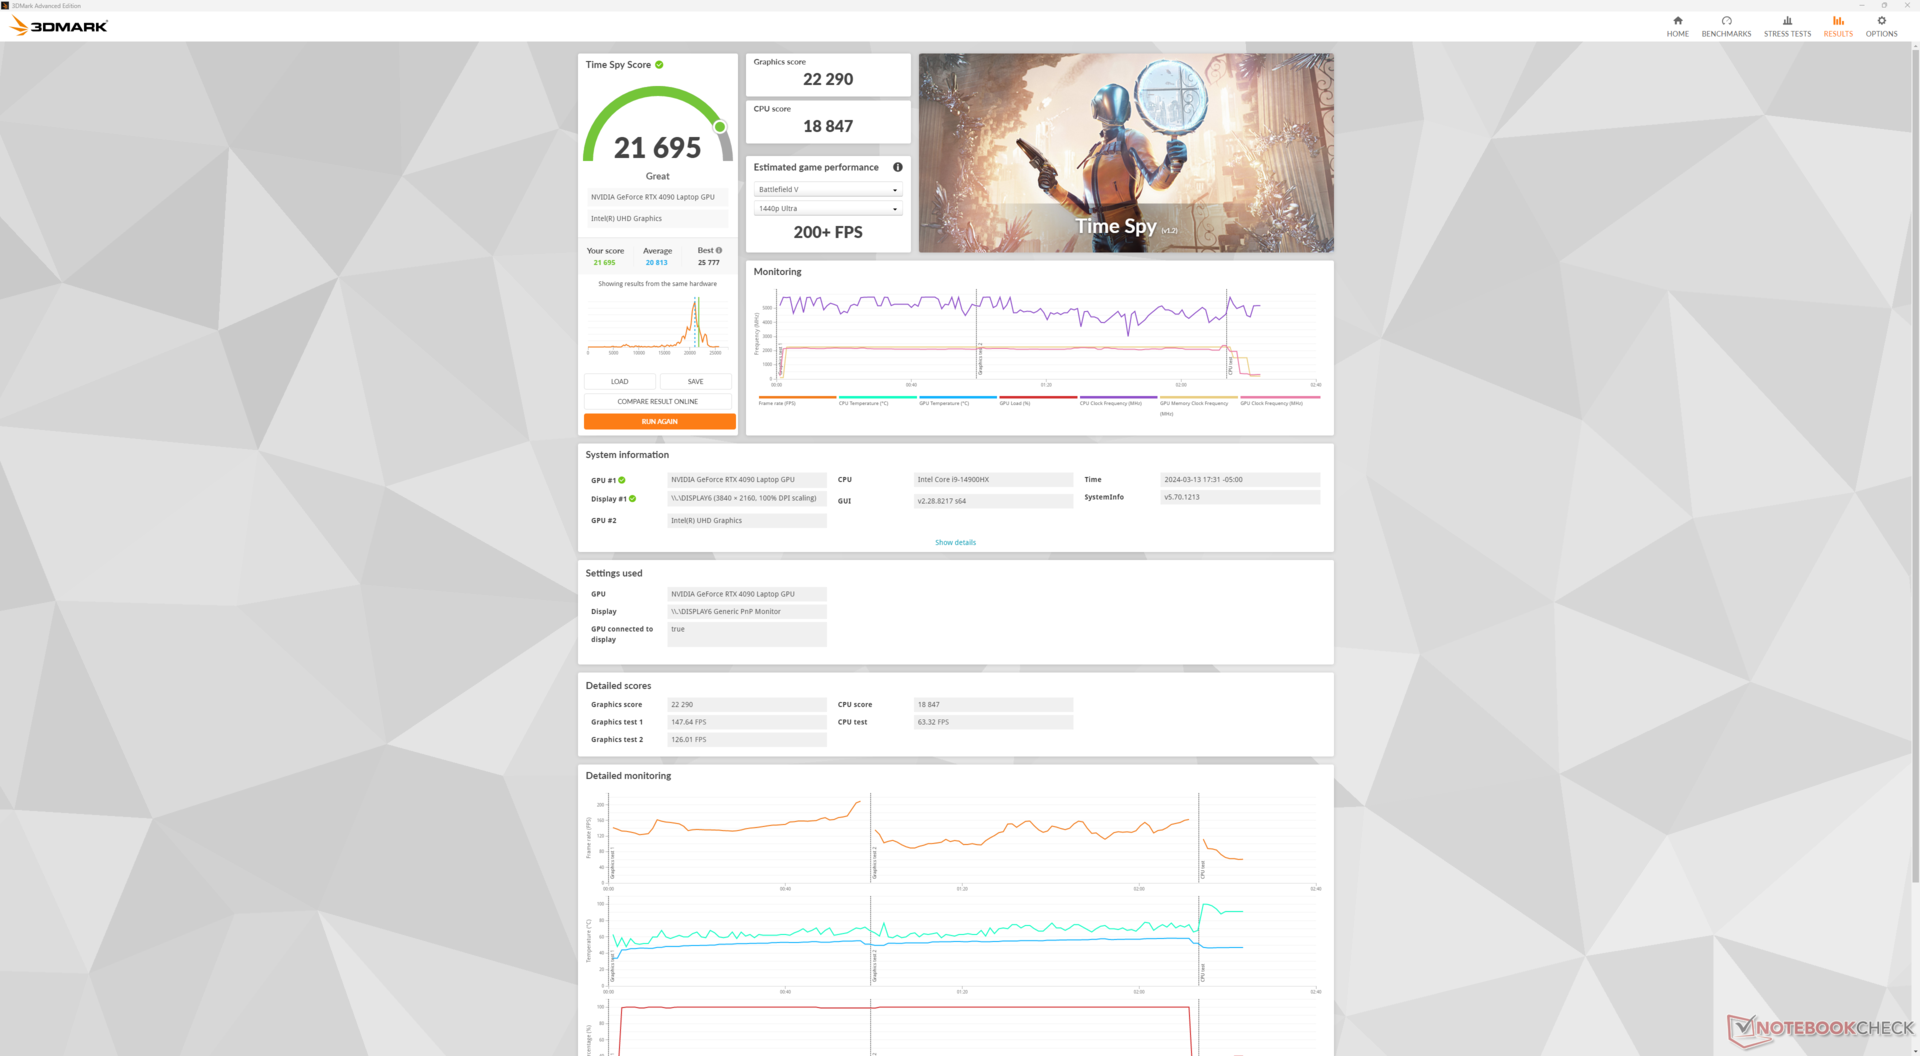
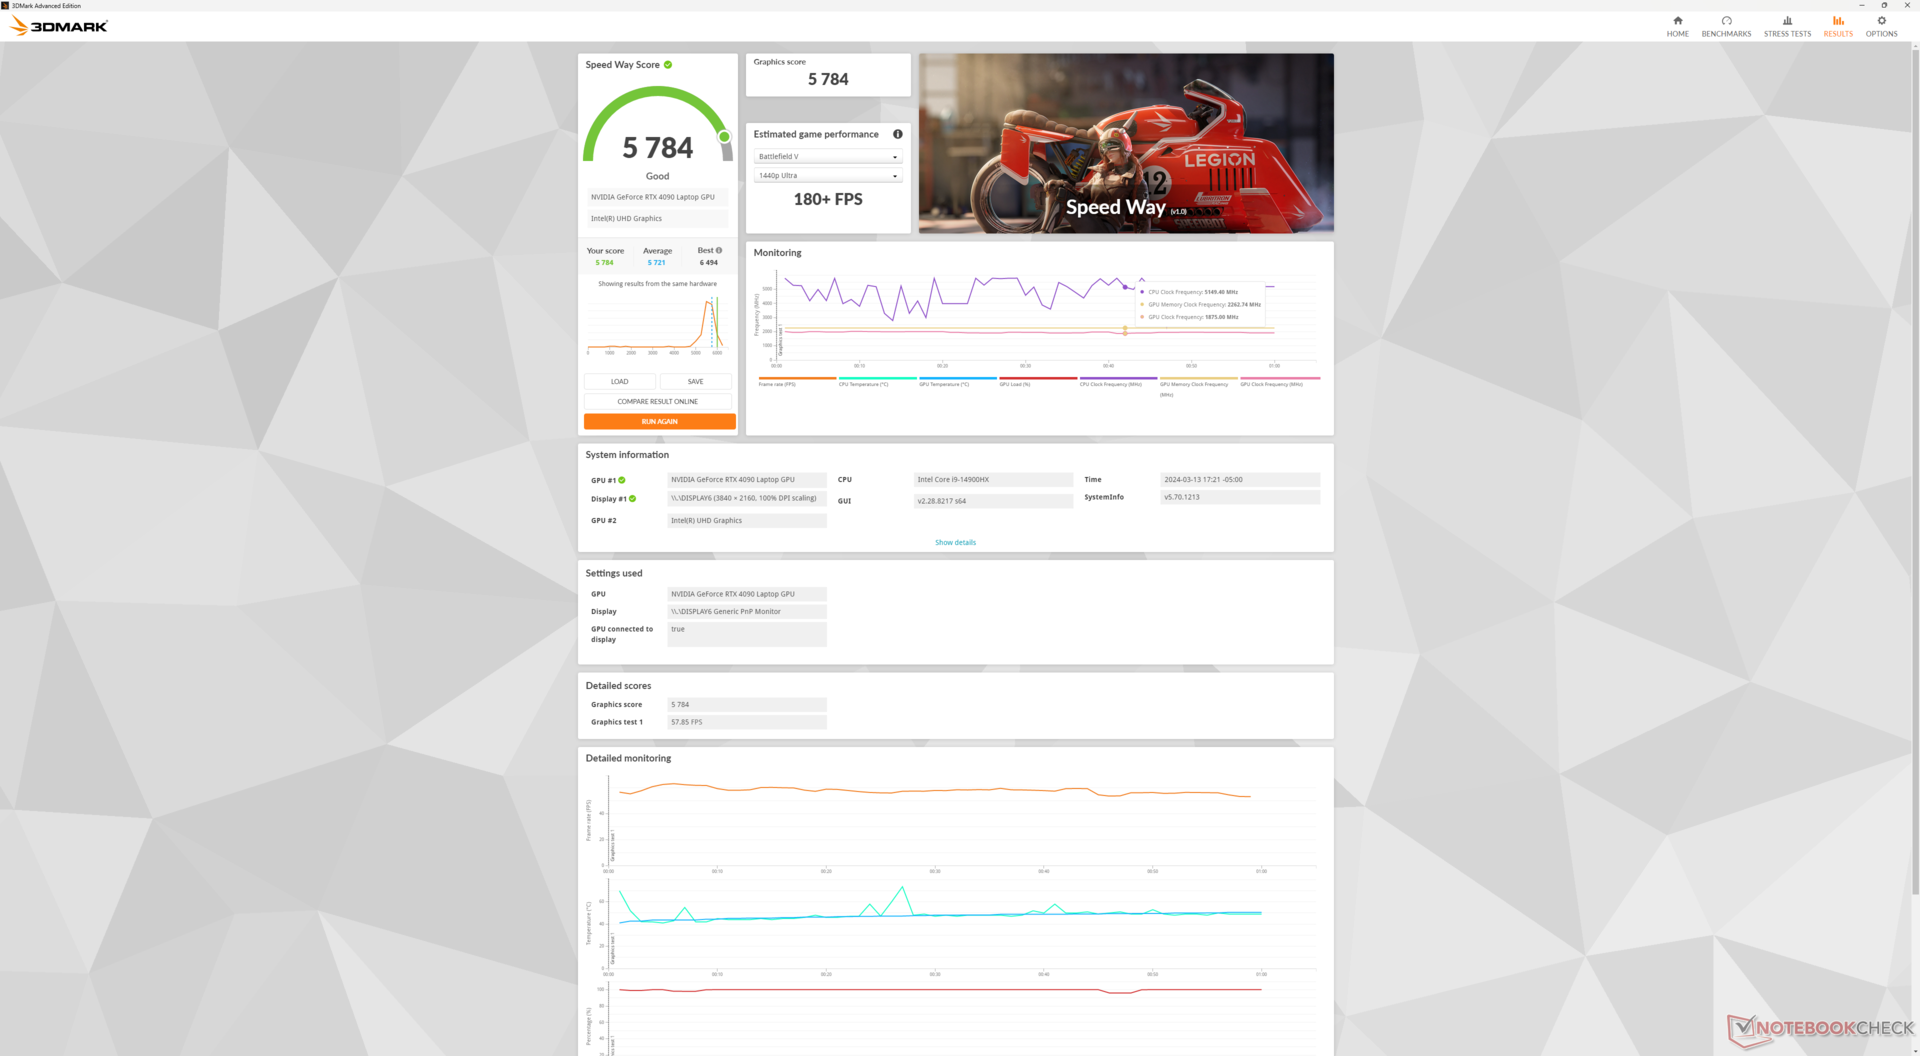
| 3DMark 11 Performance | 48622 punten | |
| 3DMark Fire Strike Score | 34966 punten | |
| 3DMark Time Spy Score | 21695 punten | |
Help | ||
* ... kleiner is beter
Gaming prestaties
De gameprestaties blijven hetzelfde als op de m18 R1, ondanks de CPU-swap. De RTX 4090 gaat heel goed samen met het beeldscherm met 1600p resolutie wanneer u streeft naar framerates van meer dan 60 FPS.
| Performance rating - Percent | |
| Alienware m18 R1 | |
| Alienware m18 R2 | |
| MSI Titan 18 HX A14VIG | |
| Acer Predator Helios 18 N23Q2 | |
| Alienware m18 R1 AMD | |
| Asus ROG Strix G18 G814JI | |
| The Witcher 3 - 1920x1080 Ultra Graphics & Postprocessing (HBAO+) | |
| Alienware m18 R1 | |
| MSI Titan 18 HX A14VIG | |
| Alienware m18 R2 | |
| Acer Predator Helios 18 N23Q2 | |
| Alienware m18 R1 AMD | |
| Asus ROG Strix G18 G814JI | |
| GTA V - 1920x1080 Highest AA:4xMSAA + FX AF:16x | |
| Acer Predator Helios 18 N23Q2 | |
| Alienware m18 R1 | |
| MSI Titan 18 HX A14VIG | |
| Alienware m18 R2 | |
| Asus ROG Strix G18 G814JI | |
| Alienware m18 R1 AMD | |
| Final Fantasy XV Benchmark - 1920x1080 High Quality | |
| Alienware m18 R1 | |
| Alienware m18 R2 | |
| MSI Titan 18 HX A14VIG | |
| Acer Predator Helios 18 N23Q2 | |
| Alienware m18 R1 AMD | |
| Asus ROG Strix G18 G814JI | |
| Strange Brigade - 1920x1080 ultra AA:ultra AF:16 | |
| MSI Titan 18 HX A14VIG | |
| Alienware m18 R1 | |
| Alienware m18 R2 | |
| Alienware m18 R1 AMD | |
| Acer Predator Helios 18 N23Q2 | |
| Asus ROG Strix G18 G814JI | |
| Dota 2 Reborn - 1920x1080 ultra (3/3) best looking | |
| Alienware m18 R1 | |
| Acer Predator Helios 18 N23Q2 | |
| MSI Titan 18 HX A14VIG | |
| Alienware m18 R2 | |
| Asus ROG Strix G18 G814JI | |
| Alienware m18 R1 AMD | |
| X-Plane 11.11 - 1920x1080 high (fps_test=3) | |
| Alienware m18 R1 | |
| Alienware m18 R2 | |
| Acer Predator Helios 18 N23Q2 | |
| MSI Titan 18 HX A14VIG | |
| Asus ROG Strix G18 G814JI | |
| Alienware m18 R1 AMD | |
Witcher 3 FPS Chart
| lage | gem. | hoge | ultra | QHD DLSS | QHD | 4K DLSS | 4K | |
|---|---|---|---|---|---|---|---|---|
| GTA V (2015) | 185.2 | 181.6 | 179.6 | 137 | 134.7 | 174.9 | ||
| The Witcher 3 (2015) | 585.5 | 525.8 | 405.6 | 205.7 | 157.7 | |||
| Dota 2 Reborn (2015) | 217 | 190.1 | 181.5 | 171.8 | 160.8 | |||
| Final Fantasy XV Benchmark (2018) | 229 | 199.2 | 193.2 | 160.1 | 93.8 | |||
| X-Plane 11.11 (2018) | 201 | 180.1 | 140.6 | 120.4 | ||||
| Far Cry 5 (2018) | 181 | 171 | 160 | 154 | 112 | |||
| Strange Brigade (2018) | 471 | 387 | 383 | 369 | 309 | 160.2 | ||
| Tiny Tina's Wonderlands (2022) | 348.6 | 285.3 | 227.2 | 187.5 | 132.8 | 71.2 | ||
| F1 22 (2022) | 305 | 295 | 276 | 135.1 | 91.4 | 45.4 | ||
| Baldur's Gate 3 (2023) | 246.9 | 222.5 | 206.7 | 202 | 151.6 | 81.7 | ||
| Cyberpunk 2077 (2023) | 149.3 | 148.7 | 142.9 | 133.9 | 94.1 | 43.4 | ||
| Assassin's Creed Mirage (2023) | 230 | 215 | 205 | 160 | 135 | 110 | 81 | |
| Alan Wake 2 (2023) | 124.6 | 121.4 | 116.9 | 83.1 | 62.3 | 45.2 | ||
| Call of Duty Modern Warfare 3 2023 (2023) | 276 | 255 | 220 | 205 | 160 | 113 | 106 | |
| Avatar Frontiers of Pandora (2023) | 162 | 150 | 131 | 103 | 70 | 63 | 36 | |
| Black Myth: Wukong (2024) | 55 | 62 | 42 | 25 | ||||
| Indiana Jones and the Great Circle (2024) | 121.1 | 95.6 | 60.9 | |||||
| Monster Hunter Wilds (2025) | 78.54 | 76.96 | 66.98 | 42.01 | ||||
| Assassin's Creed Shadows (2025) | 100 | 90 | 77 | 57 | 59 | 50 |
Uitstoot
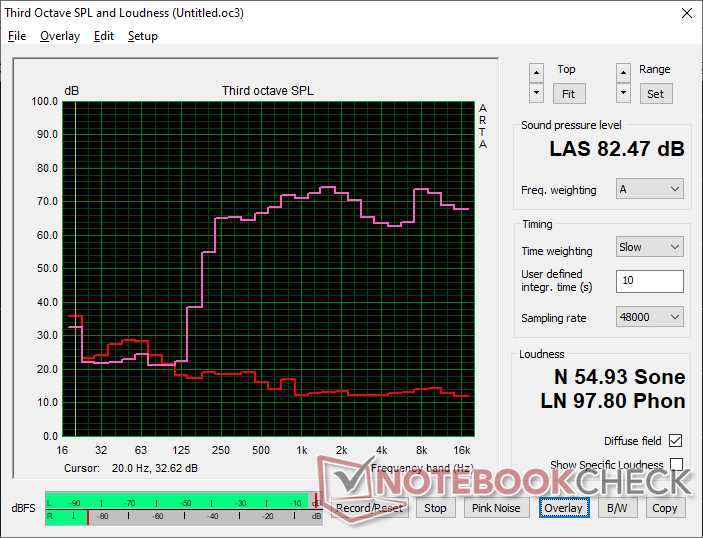
Systeemgeluid
Er zijn geen grote veranderingen in het gedrag van het ventilatorgeluid. Het belangrijkste om in gedachten te houden is dat het ventilatorgeluid iets luider is in de modi Prestaties en Overdrive in vergelijking met de modus Gebalanceerd, ook al zijn de algemene prestaties in alle drie de modi hetzelfde. Dit betekent dat u in de standen Gebalanceerd of Prestaties kunt spelen voor een stillere ervaring zonder dat u daarvoor aanzienlijke gamingprestaties hoeft op te offeren. De Overdrive-modus moet in plaats daarvan worden gereserveerd voor overklokken.
Geluidsniveau
| Onbelast |
| 23.8 / 26.1 / 31.5 dB (A) |
| Belasting |
| 31.5 / 56.6 dB (A) |
 | ||
30 dB stil 40 dB(A) hoorbaar 50 dB(A) luid |
||
min: | ||
| Alienware m18 R2 GeForce RTX 4090 Laptop GPU, i9-14900HX, SK Hynix PC811 HFS002TEM9X152N | Alienware m18 R1 AMD Radeon RX 7900M, R9 7945HX, Kioxia XG8 KXG80ZNV1T02 | Alienware m18 R1 GeForce RTX 4090 Laptop GPU, i9-13980HX, SK hynix PC801 HFS001TEJ9X101N | MSI Titan 18 HX A14VIG GeForce RTX 4090 Laptop GPU, i9-14900HX, 2x Samsung PM9A1a MZVL22T0HDLB (RAID 0) | Asus ROG Strix G18 G814JI GeForce RTX 4070 Laptop GPU, i7-13650HX, Micron 2400 MTFDKBA1T0QFM | Acer Predator Helios 18 N23Q2 GeForce RTX 4080 Laptop GPU, i9-13900HX, Samsung PM9A1 MZVL22T0HBLB | |
|---|---|---|---|---|---|---|
| Noise | 1% | 5% | -3% | -1% | -3% | |
| uit / omgeving * (dB) | 23.6 | 22.4 5% | 22.8 3% | 22.8 3% | 25 -6% | 23 3% |
| Idle Minimum * (dB) | 23.8 | 23 3% | 23 3% | 23.8 -0% | 26 -9% | 23 3% |
| Idle Average * (dB) | 26.1 | 23.4 10% | 23 12% | 23.8 9% | 28 -7% | 23 12% |
| Idle Maximum * (dB) | 31.5 | 33.5 -6% | 23 27% | 28 11% | 29 8% | 23 27% |
| Load Average * (dB) | 31.5 | 33.5 -6% | 35.6 -13% | 38 -21% | 41 -30% | 45.26 -44% |
| Witcher 3 ultra * (dB) | 52.1 | 53.6 -3% | 51.3 2% | 57.3 -10% | 44 16% | 59.82 -15% |
| Load Maximum * (dB) | 56.6 | 53.6 5% | 56.7 -0% | 62.8 -11% | 46 19% | 59.94 -6% |
* ... kleiner is beter
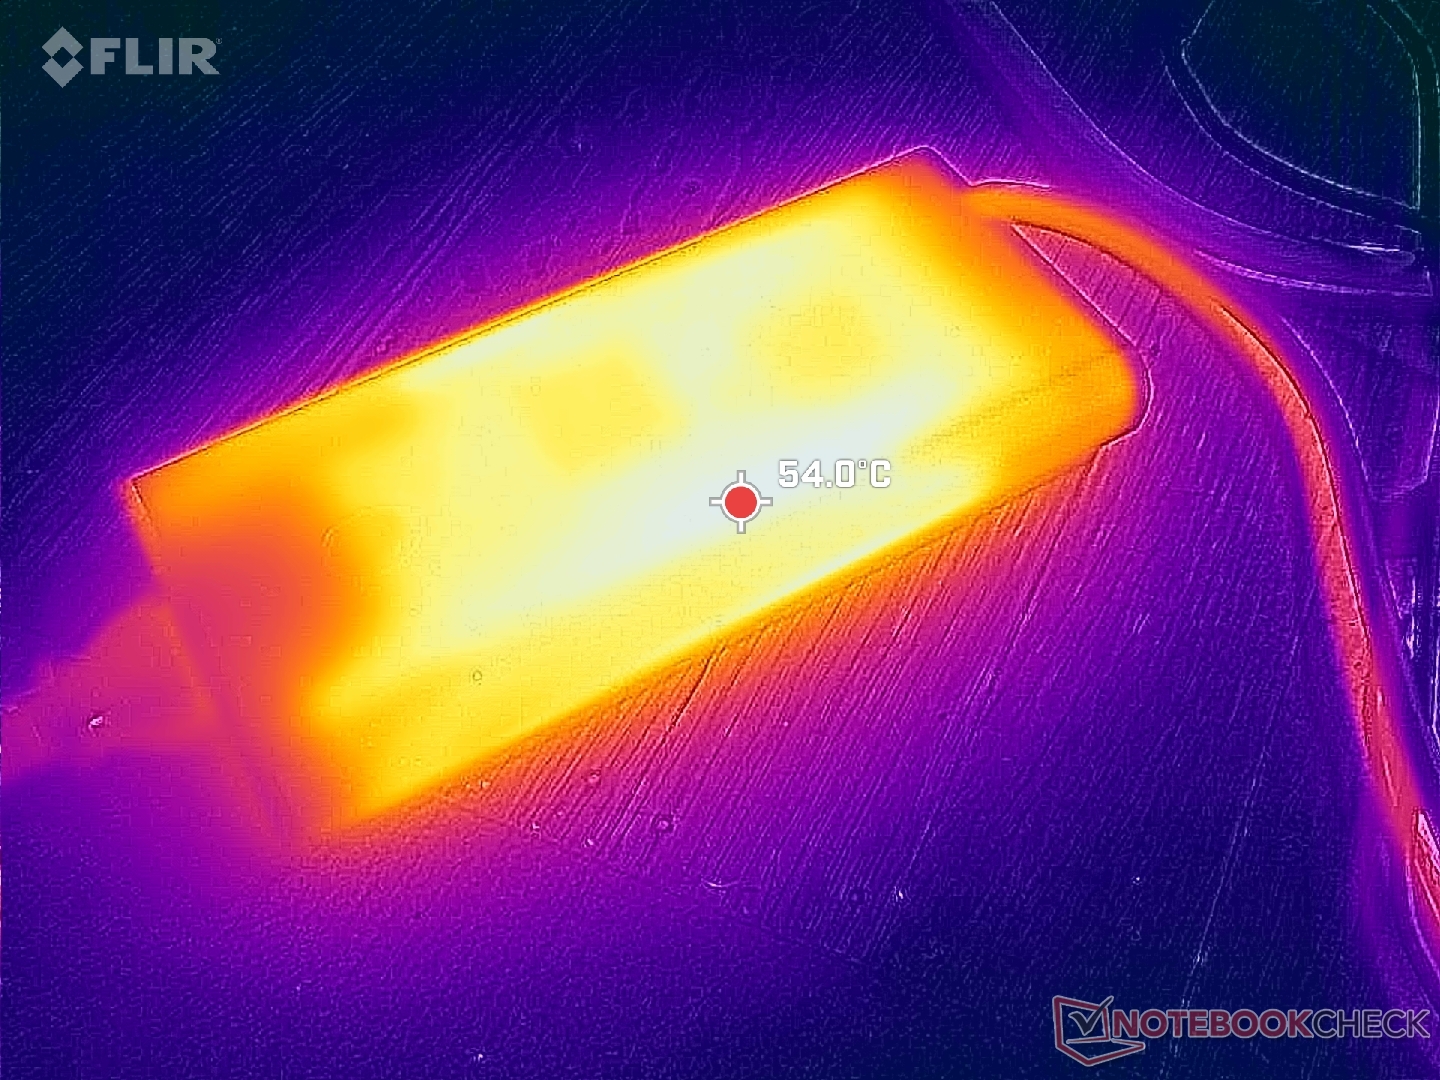
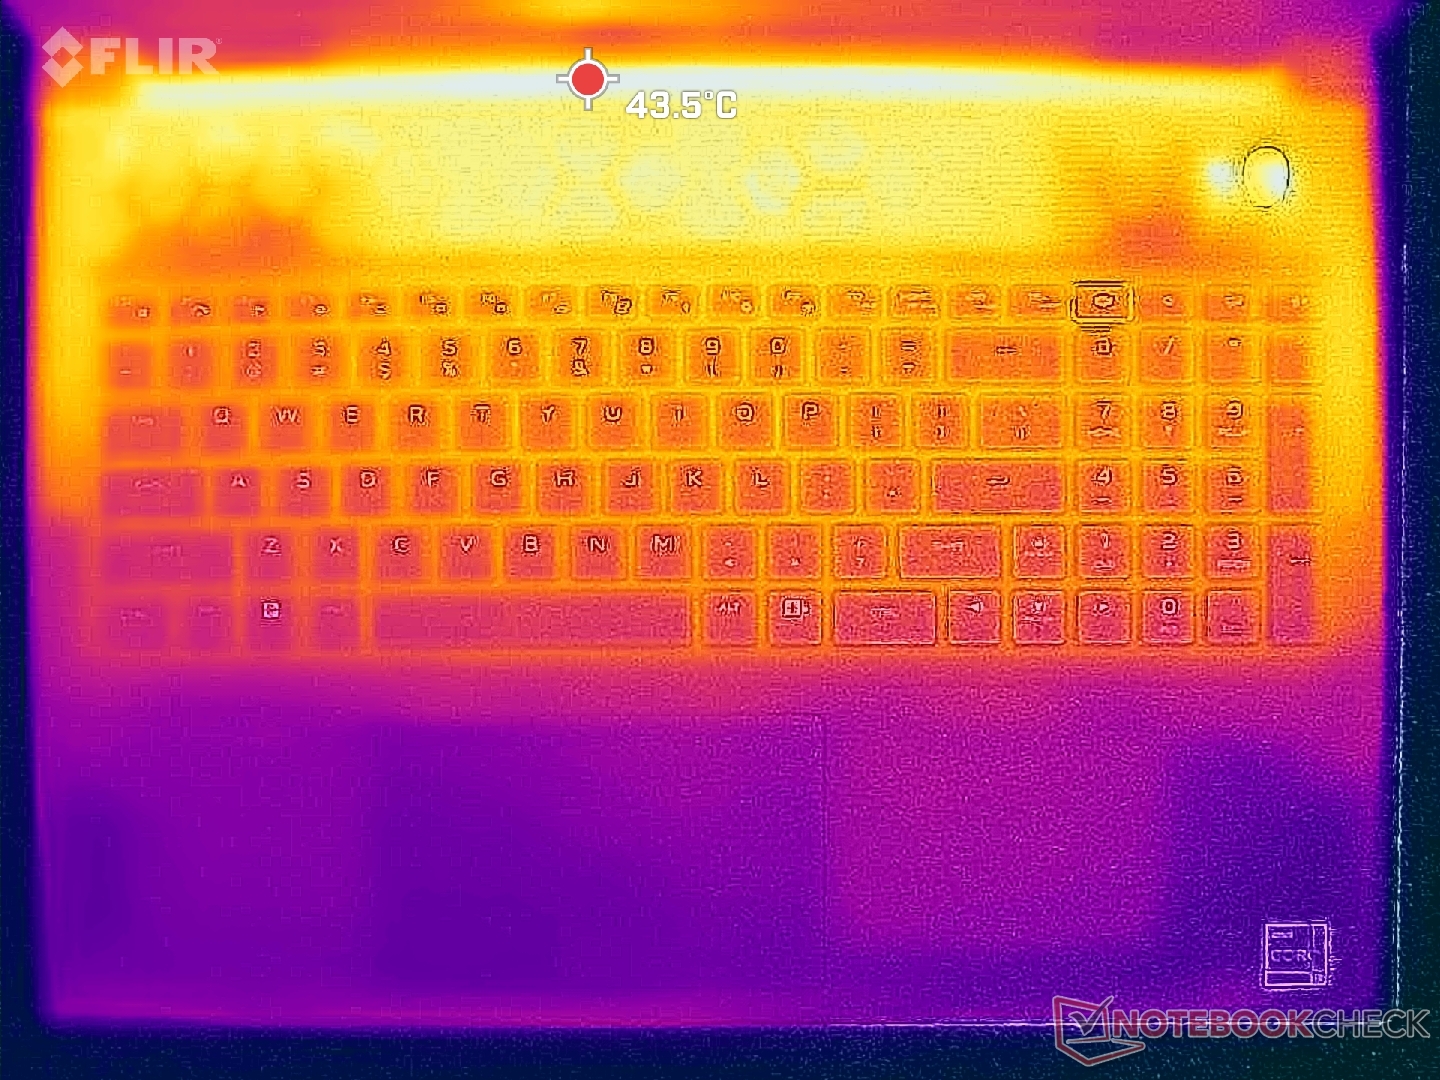
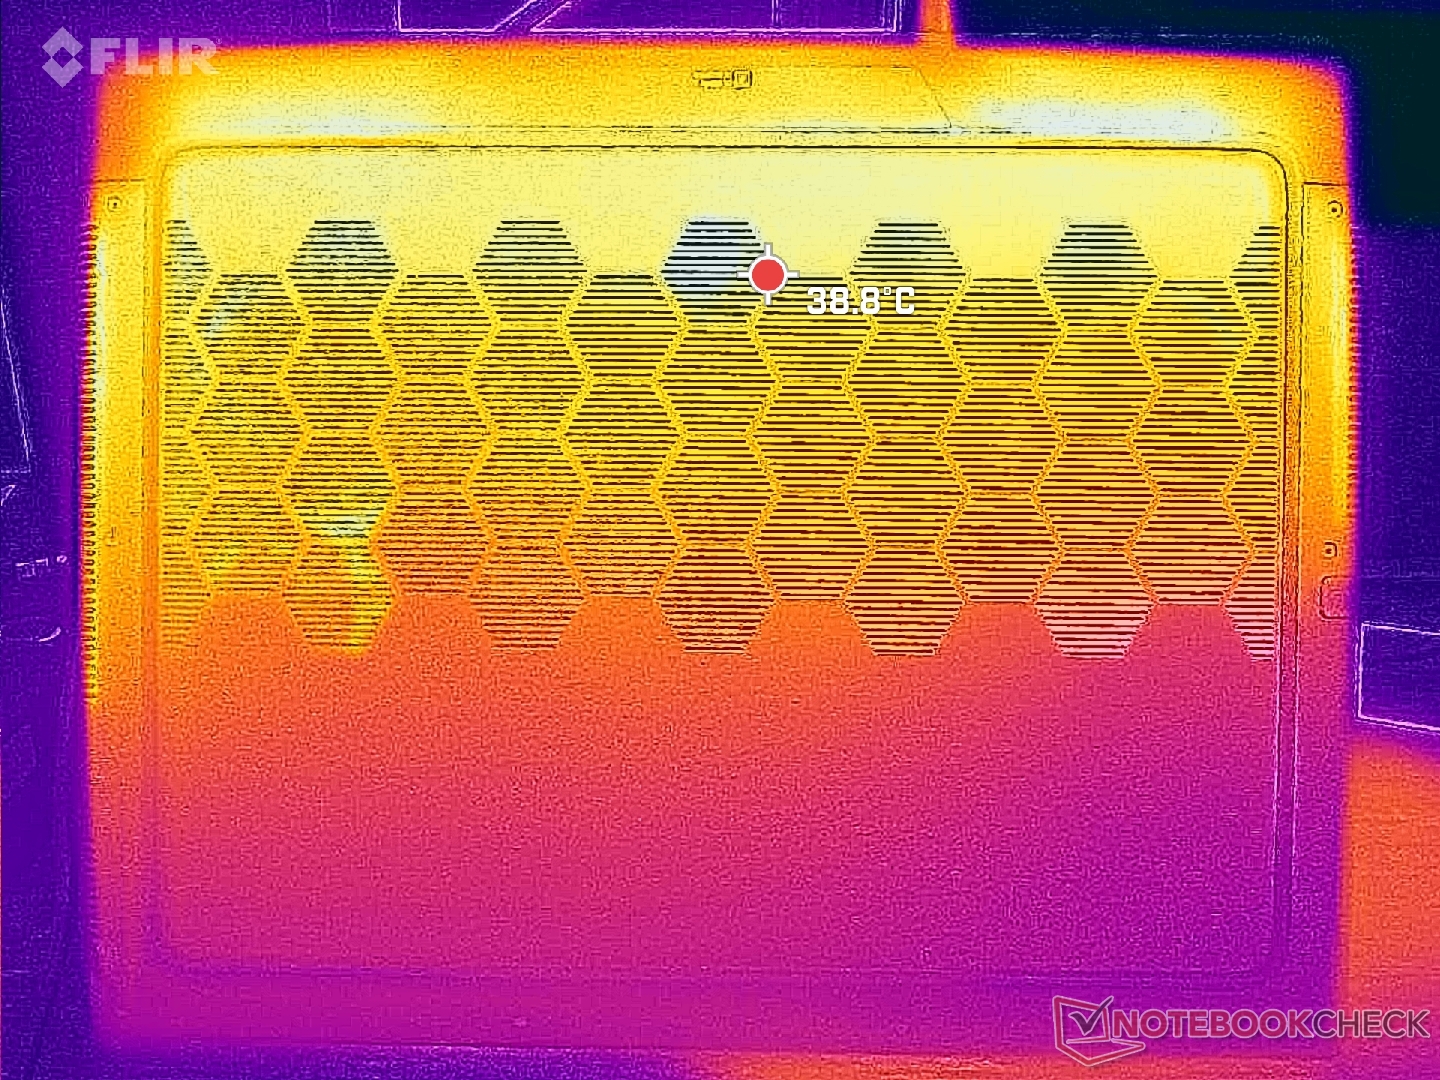
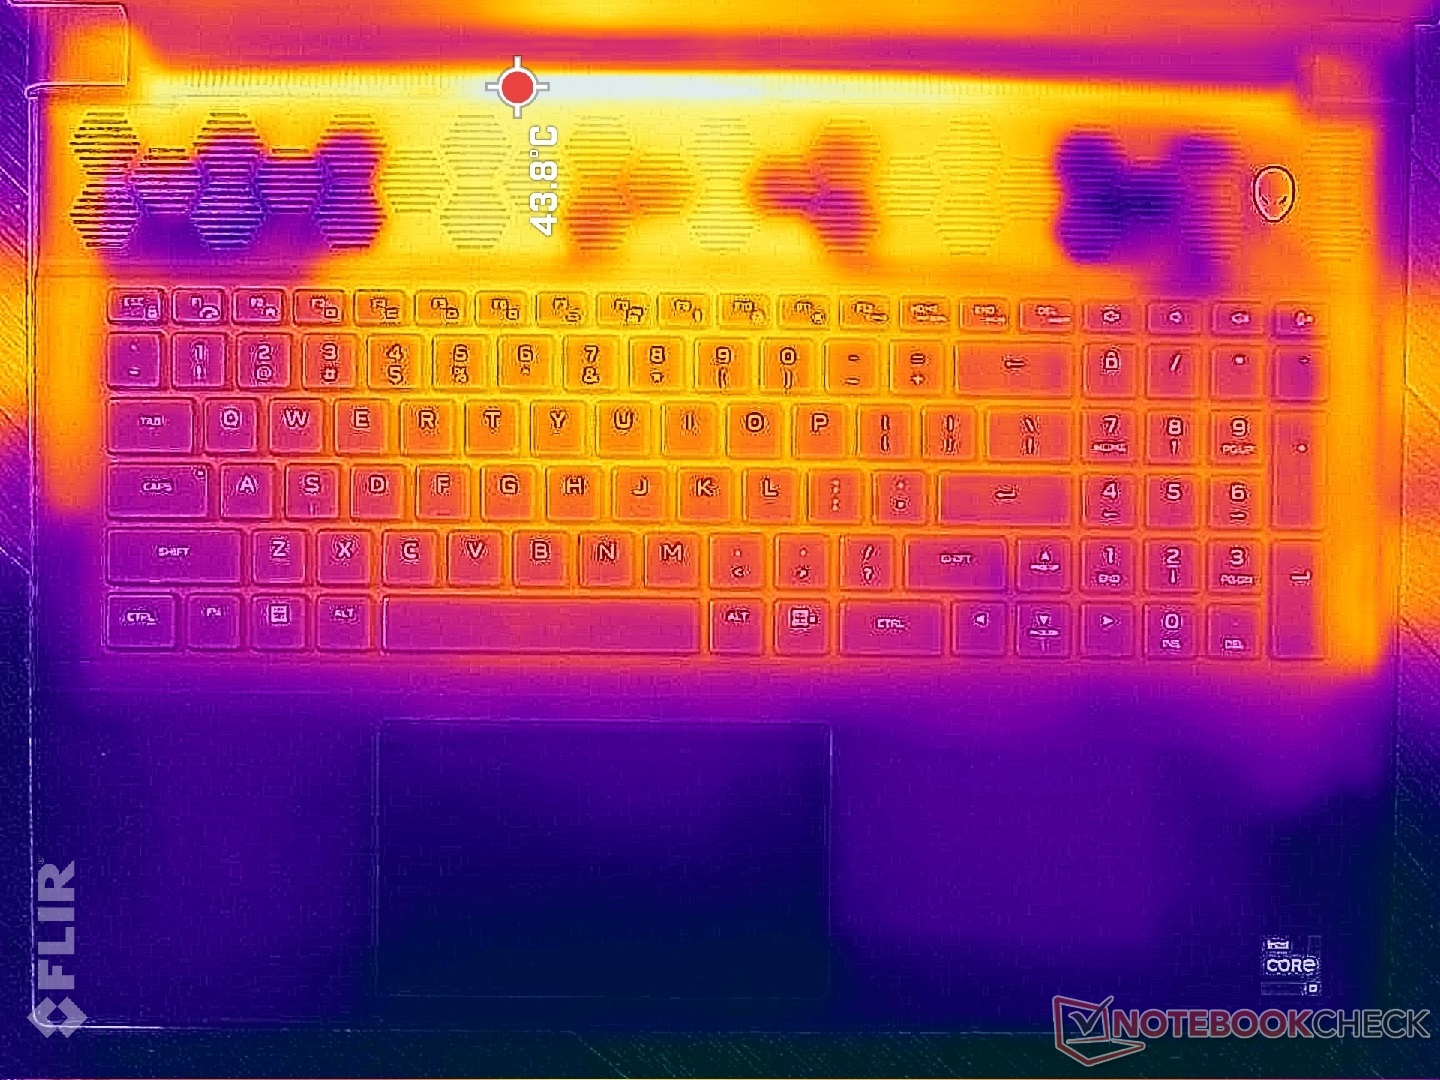
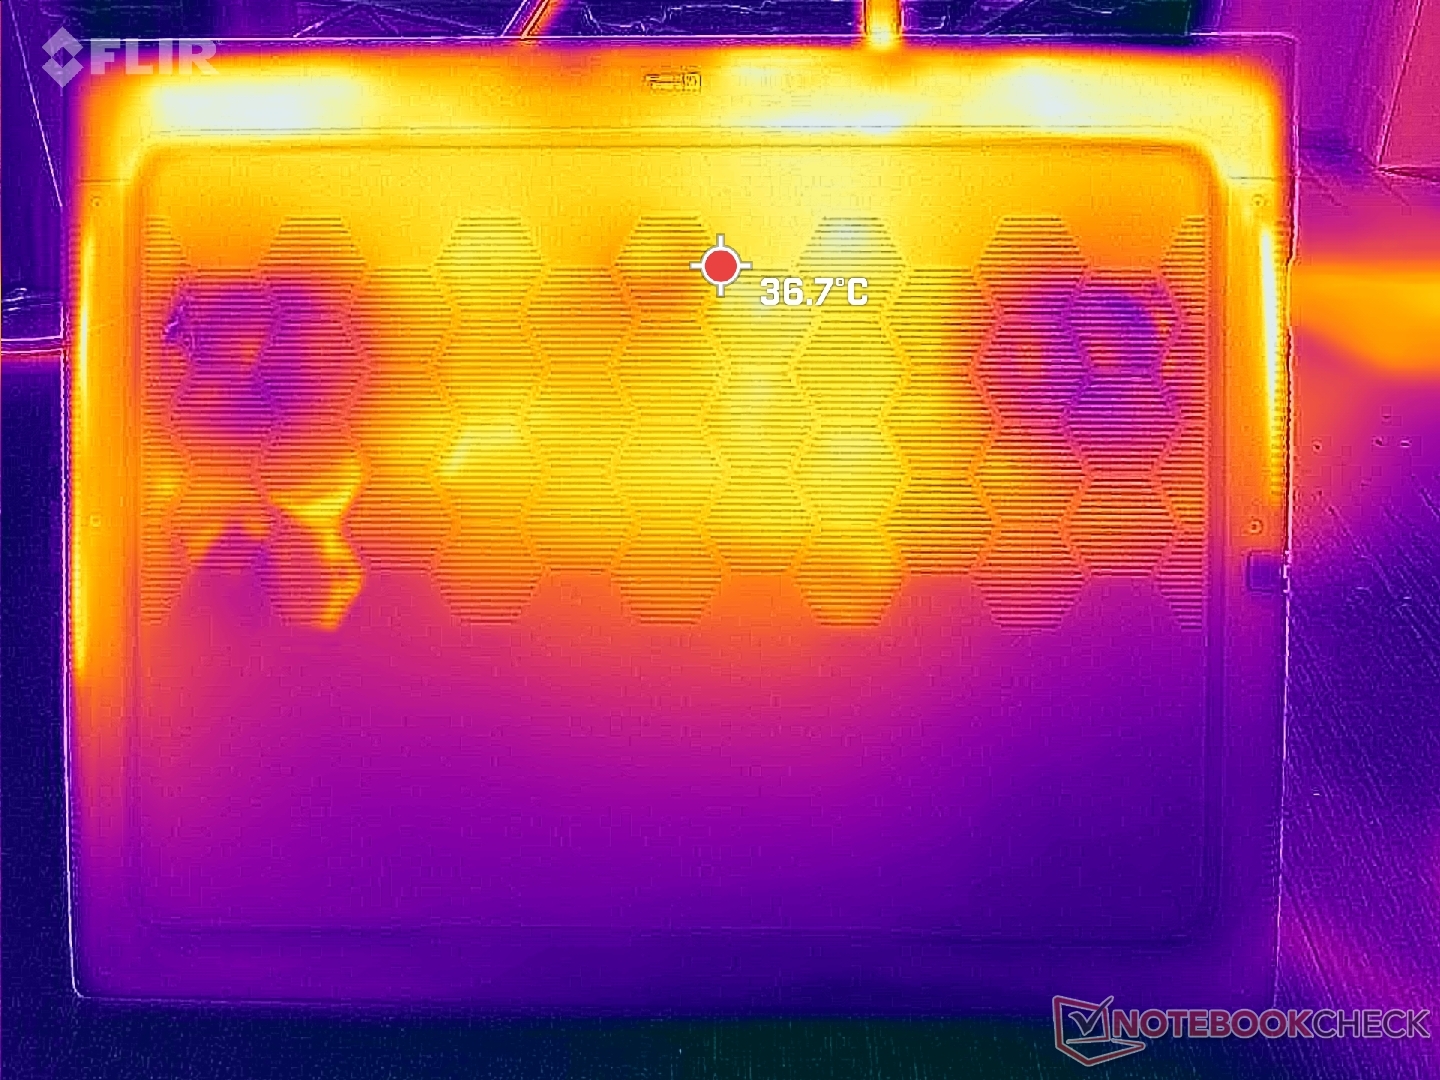
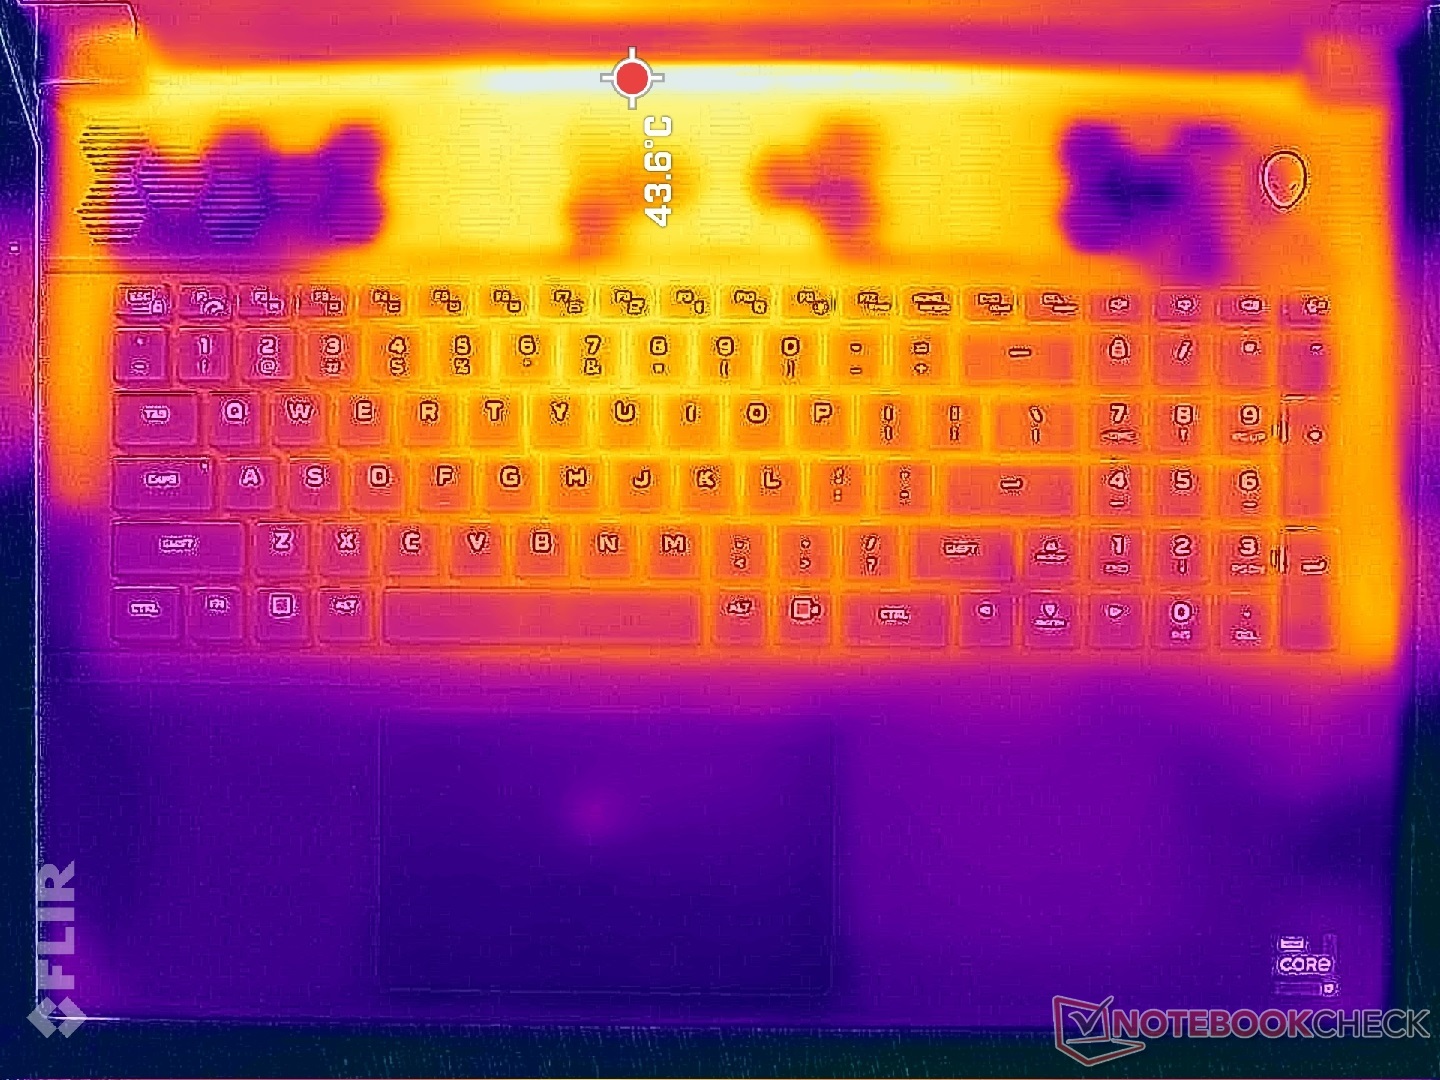
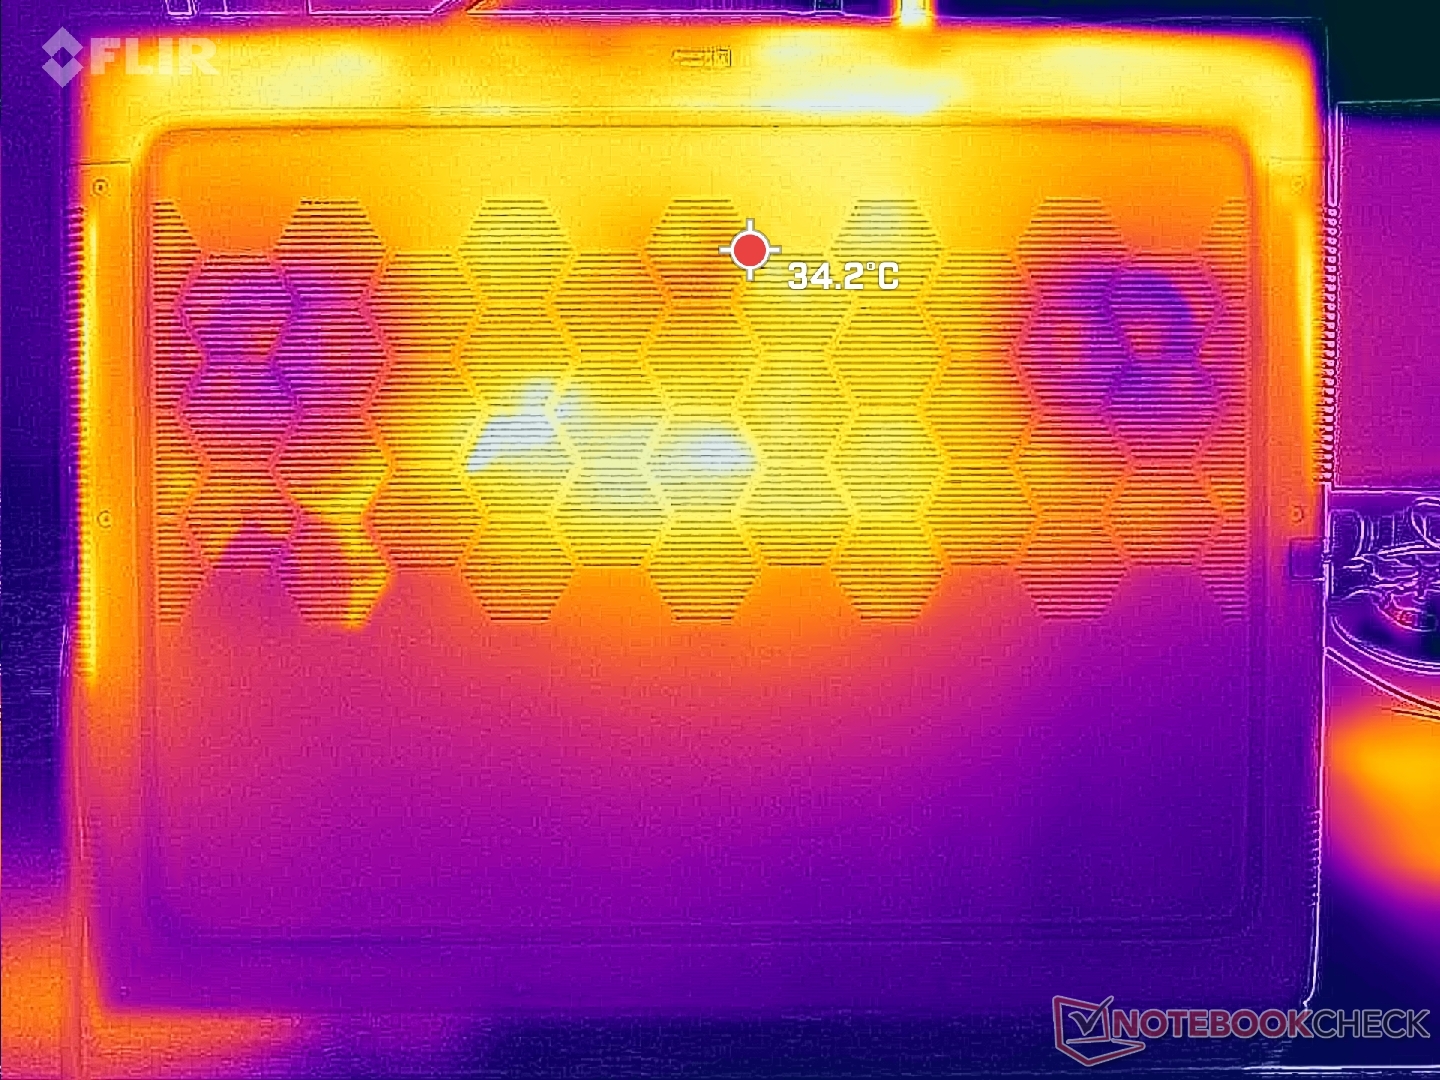
Temperatuur
De gemiddelde oppervlaktetemperaturen zijn over het algemeen koeler dan wat we hebben waargenomen op de Asus ROG Strix G18. Hete plekken worden naar de achterkant van het chassis gedegradeerd om huidcontact te minimaliseren.
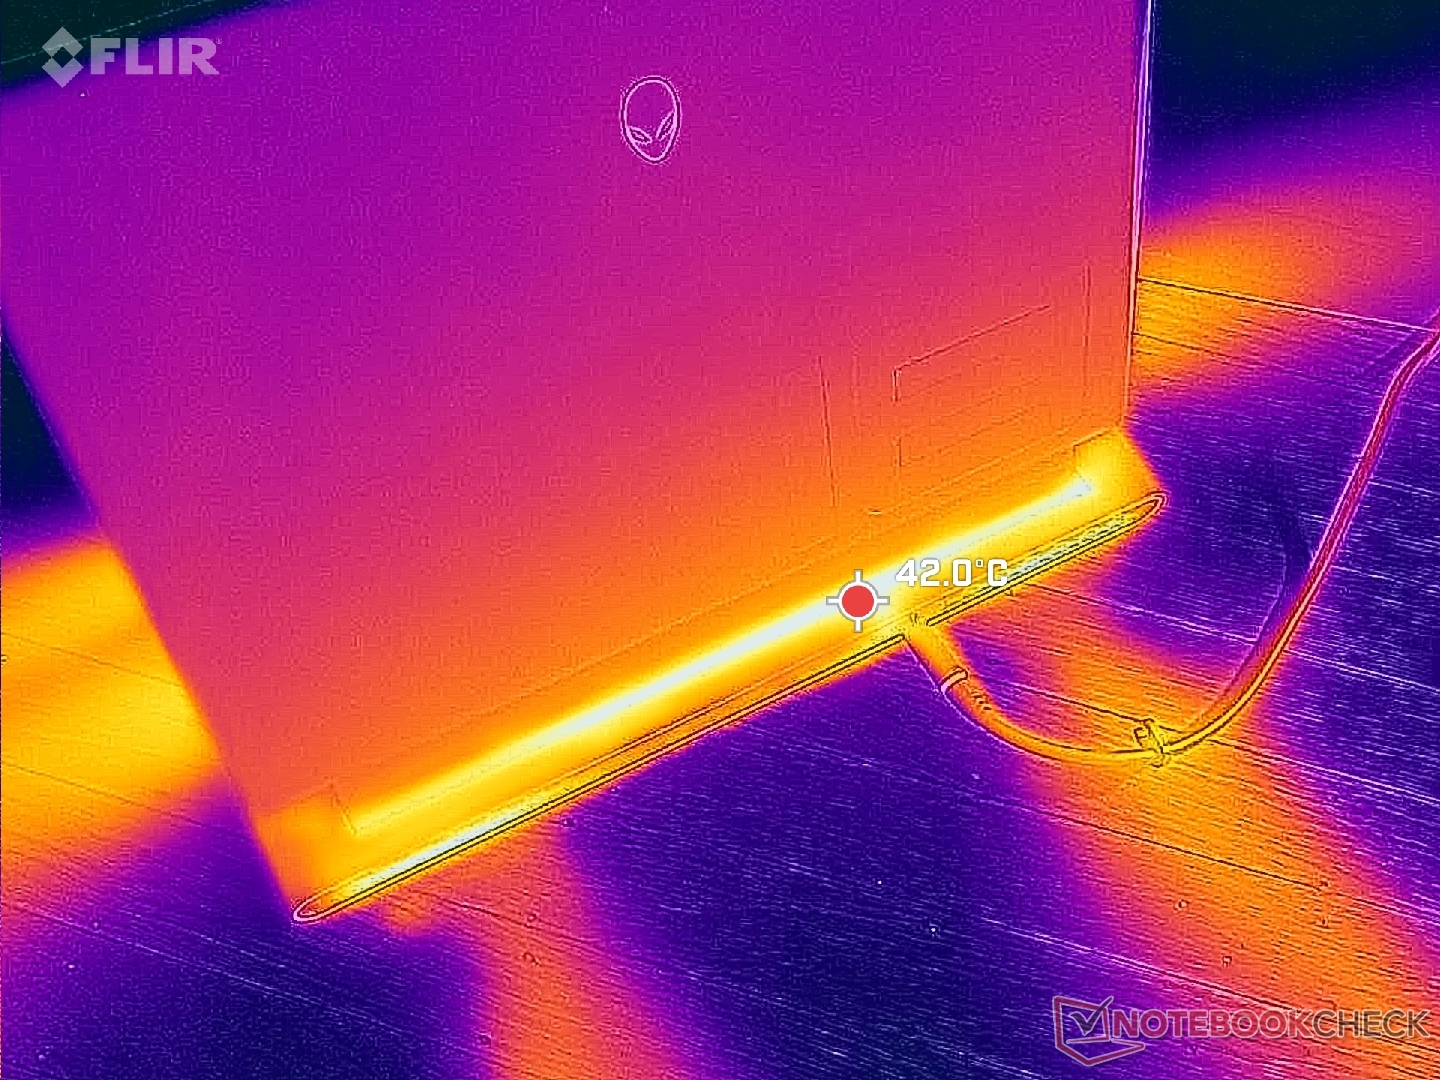
(±) De maximumtemperatuur aan de bovenzijde bedraagt 41.2 °C / 106 F, vergeleken met het gemiddelde van 40.4 °C / 105 F, variërend van 21.2 tot 68.8 °C voor de klasse Gaming.
(+) De bodem warmt op tot een maximum van 34.6 °C / 94 F, vergeleken met een gemiddelde van 43.2 °C / 110 F
(±) Bij onbelast gebruik bedraagt de gemiddelde temperatuur voor de bovenzijde 34.9 °C / 95 F, vergeleken met het apparaatgemiddelde van 33.9 °C / 93 F.
(±) Bij het spelen van The Witcher 3 is de gemiddelde temperatuur voor de bovenzijde 32 °C / 90 F, vergeleken met het apparaatgemiddelde van 33.9 °C / 93 F.
(+) De palmsteunen en het touchpad zijn met een maximum van ###max## °C / 82.8 F koeler dan de huidtemperatuur en voelen daarom koel aan.
(±) De gemiddelde temperatuur van de handpalmsteun van soortgelijke toestellen bedroeg 28.8 °C / 83.8 F (+0.6 °C / 1 F).
| Alienware m18 R2 Intel Core i9-14900HX, NVIDIA GeForce RTX 4090 Laptop GPU | Alienware m18 R1 AMD AMD Ryzen 9 7945HX, AMD Radeon RX 7900M | Alienware m18 R1 Intel Core i9-13980HX, NVIDIA GeForce RTX 4090 Laptop GPU | MSI Titan 18 HX A14VIG Intel Core i9-14900HX, NVIDIA GeForce RTX 4090 Laptop GPU | Asus ROG Strix G18 G814JI Intel Core i7-13650HX, NVIDIA GeForce RTX 4070 Laptop GPU | Acer Predator Helios 18 N23Q2 Intel Core i9-13900HX, NVIDIA GeForce RTX 4080 Laptop GPU | |
|---|---|---|---|---|---|---|
| Heat | 13% | 17% | 9% | 5% | -4% | |
| Maximum Upper Side * (°C) | 41.2 | 40.2 2% | 39 5% | 37.8 8% | 45 -9% | 35 15% |
| Maximum Bottom * (°C) | 34.6 | 37.4 -8% | 36.4 -5% | 37.6 -9% | 47 -36% | 56 -62% |
| Idle Upper Side * (°C) | 42.8 | 31.6 26% | 29.2 32% | 34.8 19% | 28 35% | 34 21% |
| Idle Bottom * (°C) | 43.6 | 30.6 30% | 27.8 36% | 36 17% | 31 29% | 39 11% |
* ... kleiner is beter
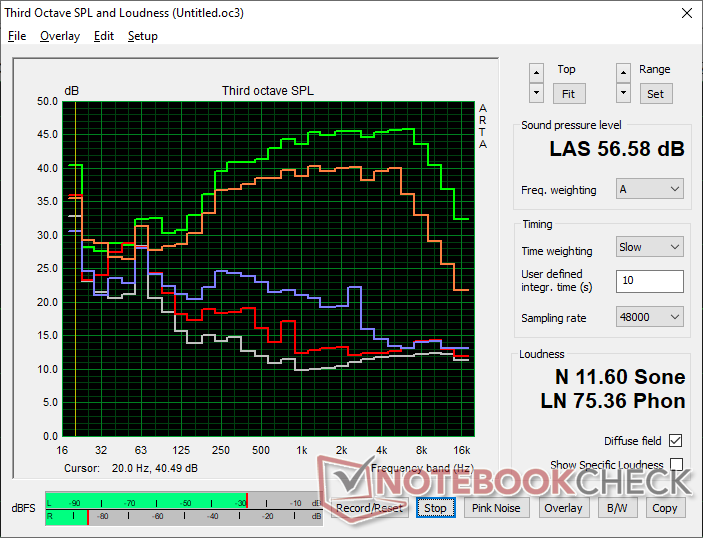
Luidsprekers
Alienware m18 R2 audioanalyse
(+) | luidsprekers kunnen relatief luid spelen (82.5 dB)
Bas 100 - 315 Hz
(-) | bijna geen lage tonen - gemiddeld 22.1% lager dan de mediaan
(±) | lineariteit van de lage tonen is gemiddeld (14% delta ten opzichte van de vorige frequentie)
Midden 400 - 2000 Hz
(+) | evenwichtige middens - slechts 4.1% verwijderd van de mediaan
(+) | de middentonen zijn lineair (3.3% delta ten opzichte van de vorige frequentie)
Hoog 2 - 16 kHz
(+) | evenwichtige hoogtepunten - slechts 4% verwijderd van de mediaan
(+) | de hoge tonen zijn lineair (6.1% delta naar de vorige frequentie)
Algemeen 100 - 16.000 Hz
(±) | lineariteit van het totale geluid is gemiddeld (17% verschil met de mediaan)
Vergeleken met dezelfde klasse
» 45% van alle geteste apparaten in deze klasse waren beter, 12% vergelijkbaar, 43% slechter
» De beste had een delta van 6%, het gemiddelde was 18%, de slechtste was 132%
Vergeleken met alle geteste toestellen
» 31% van alle geteste apparaten waren beter, 8% gelijk, 62% slechter
» De beste had een delta van 4%, het gemiddelde was 23%, de slechtste was 134%
Apple MacBook Pro 16 2021 M1 Pro audioanalyse
(+) | luidsprekers kunnen relatief luid spelen (84.7 dB)
Bas 100 - 315 Hz
(+) | goede baars - slechts 3.8% verwijderd van de mediaan
(+) | de lage tonen zijn lineair (5.2% delta naar de vorige frequentie)
Midden 400 - 2000 Hz
(+) | evenwichtige middens - slechts 1.3% verwijderd van de mediaan
(+) | de middentonen zijn lineair (2.1% delta ten opzichte van de vorige frequentie)
Hoog 2 - 16 kHz
(+) | evenwichtige hoogtepunten - slechts 1.9% verwijderd van de mediaan
(+) | de hoge tonen zijn lineair (2.7% delta naar de vorige frequentie)
Algemeen 100 - 16.000 Hz
(+) | het totale geluid is lineair (4.6% verschil met de mediaan)
Vergeleken met dezelfde klasse
» 0% van alle geteste apparaten in deze klasse waren beter, 0% vergelijkbaar, 100% slechter
» De beste had een delta van 5%, het gemiddelde was 17%, de slechtste was 45%
Vergeleken met alle geteste toestellen
» 0% van alle geteste apparaten waren beter, 0% gelijk, 100% slechter
» De beste had een delta van 4%, het gemiddelde was 23%, de slechtste was 134%
Energiebeheer
Stroomverbruik
Het uitvoeren van Witcher 3 om typische gamingbelastingen weer te geven, zou een gemiddelde van 328 W trekken, wat iets hoger is dan wat we op de m18 R1 Intel-versie van vorig jaar hebben gemeten. Er zijn dus geen grote verbeteringen wat betreft prestaties per watt, aangezien de onderliggende hardware niet veranderd is.
Nieuw dit jaar is de 360 W AC-adapter met hogere capaciteit, terwijl de m18 R1 geleverd wordt met een 330 W AC-adapter. De nieuwere adapter is ook kleiner (~18,9 x 8,6 x 2,6 cm vs. ~19,5 x 9,8 x 4 cm) dankzij de overstap naar GaN-technologie. De adapter met hogere capaciteit vermindert de kans op throttling en maakt sneller opladen mogelijk bij gelijktijdig gebruik van zware belastingen.
(Noot van de redactie: Dit gedeelte zal worden bijgewerkt wanneer de reparaties aan onze Metrahit Energy multimeter zijn voltooid. Onze excuses voor het ongemak)
| Uit / Standby | |
| Inactief | |
| Belasting |
|
Key:
min: | |
| Alienware m18 R2 i9-14900HX, GeForce RTX 4090 Laptop GPU, SK Hynix PC811 HFS002TEM9X152N, IPS, 2560x1600, 18" | Alienware m18 R1 AMD R9 7945HX, Radeon RX 7900M, Kioxia XG8 KXG80ZNV1T02, IPS, 1920x1200, 18" | Alienware m18 R1 i9-13980HX, GeForce RTX 4090 Laptop GPU, SK hynix PC801 HFS001TEJ9X101N, IPS, 1920x1200, 18" | MSI Titan 18 HX A14VIG i9-14900HX, GeForce RTX 4090 Laptop GPU, 2x Samsung PM9A1a MZVL22T0HDLB (RAID 0), Mini-LED, 3840x2400, 18" | Asus ROG Strix G18 G814JI i7-13650HX, GeForce RTX 4070 Laptop GPU, Micron 2400 MTFDKBA1T0QFM, IPS, 2560x1600, 18" | Acer Predator Helios 18 N23Q2 i9-13900HX, GeForce RTX 4080 Laptop GPU, Samsung PM9A1 MZVL22T0HBLB, IPS, 2560x1600, 18" | |
|---|---|---|---|---|---|---|
| Power Consumption | -72% | -21% | -9% | 36% | 13% | |
| Idle Minimum * (Watt) | 10.6 | 30.3 -186% | 21.6 -104% | 13.2 -25% | 8 25% | 16 -51% |
| Idle Average * (Watt) | 20.9 | 55.6 -166% | 25.2 -21% | 25.4 -22% | 15 28% | 19 9% |
| Idle Maximum * (Watt) | 40 | 101.1 -153% | 56.7 -42% | 53.5 -34% | 26 35% | 21.3 47% |
| Load Average * (Watt) | 201.1 | 160.3 20% | 164.1 18% | 151.4 25% | 102 49% | 124 38% |
| Witcher 3 ultra * (Watt) | 358 | 216 40% | 311 13% | 336 6% | 178.6 50% | 289 19% |
| Load Maximum * (Watt) | 378.9 | 332.1 12% | 338.9 11% | 395.2 -4% | 267 30% | 319 16% |
* ... kleiner is beter
Power Consumption Witcher 3 / Stresstest
Power Consumption external Monitor
Levensduur batterij
De looptijden blijven ongeveer hetzelfde als voorheen, zo niet iets langer met ongeveer een half uur. Dit in tegenstelling tot onze m18 R1 AMD configuratie die tijdens het testen problemen vertoonde met het leeglopen van de batterij.
Opladen via USB-C is nog steeds niet mogelijk.
| Alienware m18 R2 i9-14900HX, GeForce RTX 4090 Laptop GPU, 97 Wh | Alienware m18 R1 AMD R9 7945HX, Radeon RX 7900M, 97 Wh | Alienware m18 R1 i9-13980HX, GeForce RTX 4090 Laptop GPU, 97 Wh | MSI Titan 18 HX A14VIG i9-14900HX, GeForce RTX 4090 Laptop GPU, 99.9 Wh | Asus ROG Strix G18 G814JI i7-13650HX, GeForce RTX 4070 Laptop GPU, 90 Wh | Acer Predator Helios 18 N23Q2 i9-13900HX, GeForce RTX 4080 Laptop GPU, 90 Wh | |
|---|---|---|---|---|---|---|
| Batterijduur | -71% | -10% | -12% | 69% | -8% | |
| WiFi v1.3 (h) | 4.8 | 1.4 -71% | 4.3 -10% | 4.2 -12% | 8.1 69% | 4.4 -8% |
| Reader / Idle (h) | 4.5 | 5.6 | 5.9 | 11.7 | ||
| Load (h) | 0.7 | 0.7 | 1.2 | 1.2 | 1.7 | |
| H.264 (h) | 4.8 |
Pro
Contra
Verdict - Meer zoals een Alienware m18 R1.1
Gaminglaptops bevinden zich dit jaar in een moeilijke positie. De Raptor Lake-HX vernieuwde CPU's presteren bijna identiek aan hun 2023 tegenhangers, terwijl er niets nieuws is aangekondigd om de jaaroude RTX 4090 te vervangen. Als gevolg hiervan zitten nieuwe gaming laptops zoals de Alienware m18 R2 min of meer vast aan het gebruik van dezelfde onderdelen als de modellen van vorig jaar. Gebruikers in de markt voor de Alienware m18 R2 moeten daarom verwachten dat de prestatieniveaus op hetzelfde niveau liggen als de Alienware m18 R1.
De Alienware m18 R2 is een zijwaartse stap in vergelijking met de Alienware m18 R1. Het is nog steeds een van de snelste gaming laptops, maar de verbeteringen ten opzichte van vorig jaar zijn op zijn best marginaal.
Er zijn een paar kleine verbeteringen, zoals de snellere RJ-45 poort, kleinere AC-adapter en nieuwere SSD-opties, maar de gebruikerservaring is in wezen hetzelfde. Wij raden aan om de m18 R1 te overwegen vóór de m18 R2, vooral omdat de m18 R1 nu goedkoper is.
Prijs en beschikbaarheid
Dell levert de Alienware m18 R2 nu vanaf $1900 USD voor de basisconfiguratie Core i7-14650HX, GeForce RTX 4060 en 1600p165 beeldscherm, tot meer dan $3200 voor de configuratie Core i9-14900HX, RTX 4090 en 1200p480 beeldscherm.
Alienware m18 R2
- 22-03-2024 v7 (old)
Allen Ngo
Transparantie
De selectie van te beoordelen apparaten wordt gemaakt door onze redactie. Het testexemplaar werd ten behoeve van deze beoordeling door de fabrikant of detailhandelaar in bruikleen aan de auteur verstrekt. De kredietverstrekker had geen invloed op deze recensie, noch ontving de fabrikant vóór publicatie een exemplaar van deze recensie. Er bestond geen verplichting om deze recensie te publiceren. Als onafhankelijk mediabedrijf is Notebookcheck niet onderworpen aan het gezag van fabrikanten, detailhandelaren of uitgevers.
[transparency_disclaimer]Dit is hoe Notebookcheck test
Elk jaar beoordeelt Notebookcheck onafhankelijk honderden laptops en smartphones met behulp van gestandaardiseerde procedures om ervoor te zorgen dat alle resultaten vergelijkbaar zijn. We hebben onze testmethoden al zo'n 20 jaar voortdurend ontwikkeld en daarbij de industriestandaard bepaald. In onze testlaboratoria wordt gebruik gemaakt van hoogwaardige meetapparatuur door ervaren technici en redacteuren. Deze tests omvatten een validatieproces in meerdere fasen. Ons complexe beoordelingssysteem is gebaseerd op honderden goed onderbouwde metingen en benchmarks, waardoor de objectiviteit behouden blijft. Meer informatie over onze testmethoden kunt u hier vinden.
Price comparison

