 Deutsch
 English
 Español
 Français
 Italiano
 Nederlands
 Polski
 Português
 Русский
 Türkçe
 Svenska
 Chinese
 Magyar
2022 Dell XPS 15 9520 3.5K OLED laptop review: Overslaan of kopen?
Dell trapte het decennium af met een knaller door de volledig vernieuwde XPS 15 9500 te introduceren als opvolger van de oudere generatie XPS 15 7590 serie. Het model verplaatste de XPS 15-familie van 16:9 naar 16:10 naast een gloednieuw chassisontwerp met Intel 10e generatie Comet Lake-H CPU's en de GeForce GTX 1650 Ti GPU. De XPS 15 9510 ging nog een stap verder met 11th gen Tiger Lake-H CPU's en optionele 3,5K OLED-panelen. Nu is de XPS 15 9520 weer een incrementele update met 12e generatie Alder Lake-H CPU's en sneller DDR5 RAM.
We raden u aan onze bestaande review van de XPS 15 9500 aangezien het chassis van de XPS 15 9520 identiek blijft. Deze review pagina zal zich richten op de prestaties van de XPS 15 9520 en andere verschillen die gebruikers kunnen verwachten in vergelijking met voorgaande modellen.
Alternatieven voor de Dell XPS 15 9520 zijn andere high-end 15.6-inch multimedia laptops met discrete graphics zoals de Asus Zenbook Pro 15 OLED, Lenovo Yoga Creator 7 15, HP Spectre x360 15, HP Envy 15, of de MSI Creator 15.
Meer Dell reviews:
Potentiële concurrenten in vergelijking
Evaluatie | Datum | Model | Gewicht | Hoogte | Formaat | Resolutie | Beste prijs |
|---|---|---|---|---|---|---|---|
| 89.5 % | 05-2022 | Dell XPS 15 9520 RTX 3050 Ti i7-12700H, GeForce RTX 3050 Ti Laptop GPU | 1.9 kg | 18 mm | 15.60" | 3456x2160 | |
| 88.4 % | 08-2021 | Dell XPS 15 9510 11800H RTX 3050 Ti OLED i7-11800H, GeForce RTX 3050 Ti Laptop GPU | 1.9 kg | 18 mm | 15.60" | 3456x2160 | |
| 85 % | 01-2020 | HP Spectre X360 15-5ZV31AV i7-10510U, GeForce MX250 | 2.1 kg | 19.3 mm | 15.60" | 3840x2160 | |
| 87.7 % | 05-2022 | Asus Zenbook Pro 15 OLED UM535Q R9 5900HX, GeForce RTX 3050 Ti Laptop GPU | 1.9 kg | 18 mm | 15.60" | 1920x1080 | |
| 82.4 % | 02-2021 | MSI Stealth 15M A11SEK i7-1185G7, GeForce RTX 2060 Max-Q | 1.7 kg | 16.15 mm | 15.60" | 1920x1080 | |
| 93.2 % | 11-2021 | Apple MacBook Pro 16 2021 M1 Pro M1 Pro, M1 Pro 16-Core GPU | 2.2 kg | 16.8 mm | 16.20" | 3456x2234 |
Zaak
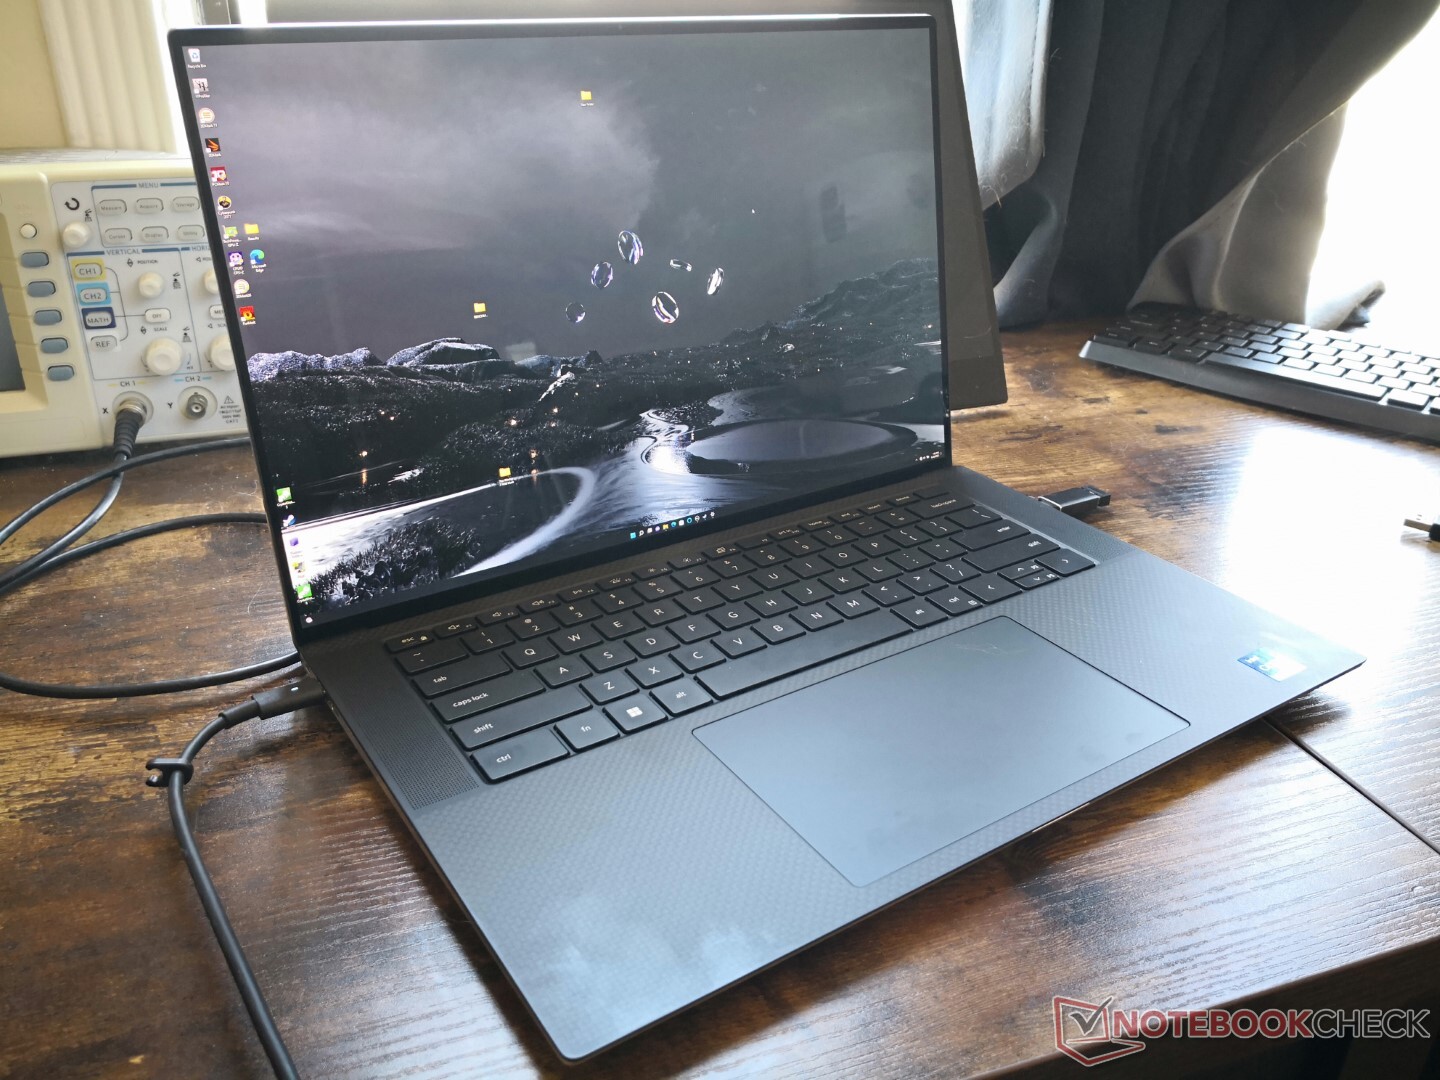
Het XPS 15 9520-chassis is nog steeds een van de kleinste ontwerpen in zijn formaatcategorie, ondanks het feit dat het twee jaar oud is. De zeer smalle bezels aan alle vier de zijden, inclusief de kin, helpen om de voetafdruk te verkleinen met grotere marges dan bijvoorbeeld de Zenbook Pro 15 of Spectre x360 15.
SD-kaartlezer
| SD Card Reader | |
| average JPG Copy Test (av. of 3 runs) | |
| Dell XPS 15 9510 11800H RTX 3050 Ti OLED (AV Pro V60) | |
| Dell XPS 15 9500 Core i7 4K UHD (Toshiba Exceria Pro SDXC 64 GB UHS-II) | |
| MSI Stealth 15M A11SEK (Toshiba Exceria Pro M501 microSDXC 32GB) | |
| Dell XPS 15 9520 RTX 3050 Ti (Toshiba Exceria Pro SDXC 64 GB UHS-II) | |
| HP Spectre X360 15-5ZV31AV (Toshiba Exceria Pro M501 UHS-II) | |
| Asus Zenbook Pro 15 OLED UM535Q (Toshiba Exceria Pro SDXC 64 GB UHS-II) | |
| maximum AS SSD Seq Read Test (1GB) | |
| MSI Stealth 15M A11SEK (Toshiba Exceria Pro M501 microSDXC 32GB) | |
| Dell XPS 15 9510 11800H RTX 3050 Ti OLED (AV Pro V60) | |
| Dell XPS 15 9500 Core i7 4K UHD (Toshiba Exceria Pro SDXC 64 GB UHS-II) | |
| HP Spectre X360 15-5ZV31AV (Toshiba Exceria Pro M501 UHS-II) | |
| Dell XPS 15 9520 RTX 3050 Ti (Toshiba Exceria Pro SDXC 64 GB UHS-II) | |
| Asus Zenbook Pro 15 OLED UM535Q (Toshiba Exceria Pro SDXC 64 GB UHS-II) | |
Communicatie
Een Intel AX211 wordt standaard geleverd voor Wi-Fi 6E en Bluetooth 5.2 connectiviteit. Dell heeft ons echter bevestigd dat de XPS 15 9520 niet is ontworpen om 6 GHz Wi-Fi 6E netwerken te ondersteunen, ondanks het feit dat de AX211 chip dat wel kan. Eigenaren van de XPS 15 9520 zullen dus alleen verbinding kunnen maken met 2,4 GHz en 5 GHz netwerken tot Wi-Fi 6.
| Networking | |
| iperf3 transmit AX12 | |
| Dell XPS 15 9510 11800H RTX 3050 Ti OLED | |
| Dell XPS 15 9500 Core i7 4K UHD | |
| MSI Stealth 15M A11SEK | |
| Asus Zenbook Pro 15 OLED UM535Q | |
| iperf3 receive AX12 | |
| Dell XPS 15 9500 Core i7 4K UHD | |
| Dell XPS 15 9510 11800H RTX 3050 Ti OLED | |
| MSI Stealth 15M A11SEK | |
| Asus Zenbook Pro 15 OLED UM535Q | |
| iperf3 receive AXE11000 | |
| Dell XPS 15 9520 RTX 3050 Ti | |
| iperf3 transmit AXE11000 | |
| Dell XPS 15 9520 RTX 3050 Ti | |
Webcam
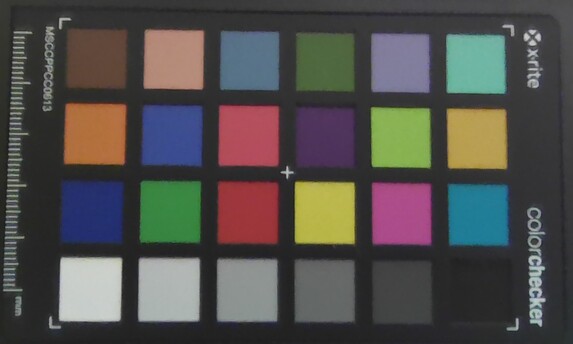
Dell heeft de kleuren van de webcam verbeterd door de IR- en RGB-sensoren te scheiden in vergelijking met de XPS 15 9510 of 9500. Het blijft echter slechts 1 MP, vergeleken met 2 MP op andere vlaggenschip 15.6-inch laptops zoals de Razer Blade 15. Dus, hoewel kleuren misschien een beetje beter zijn, is het beeld nog steeds modderig.


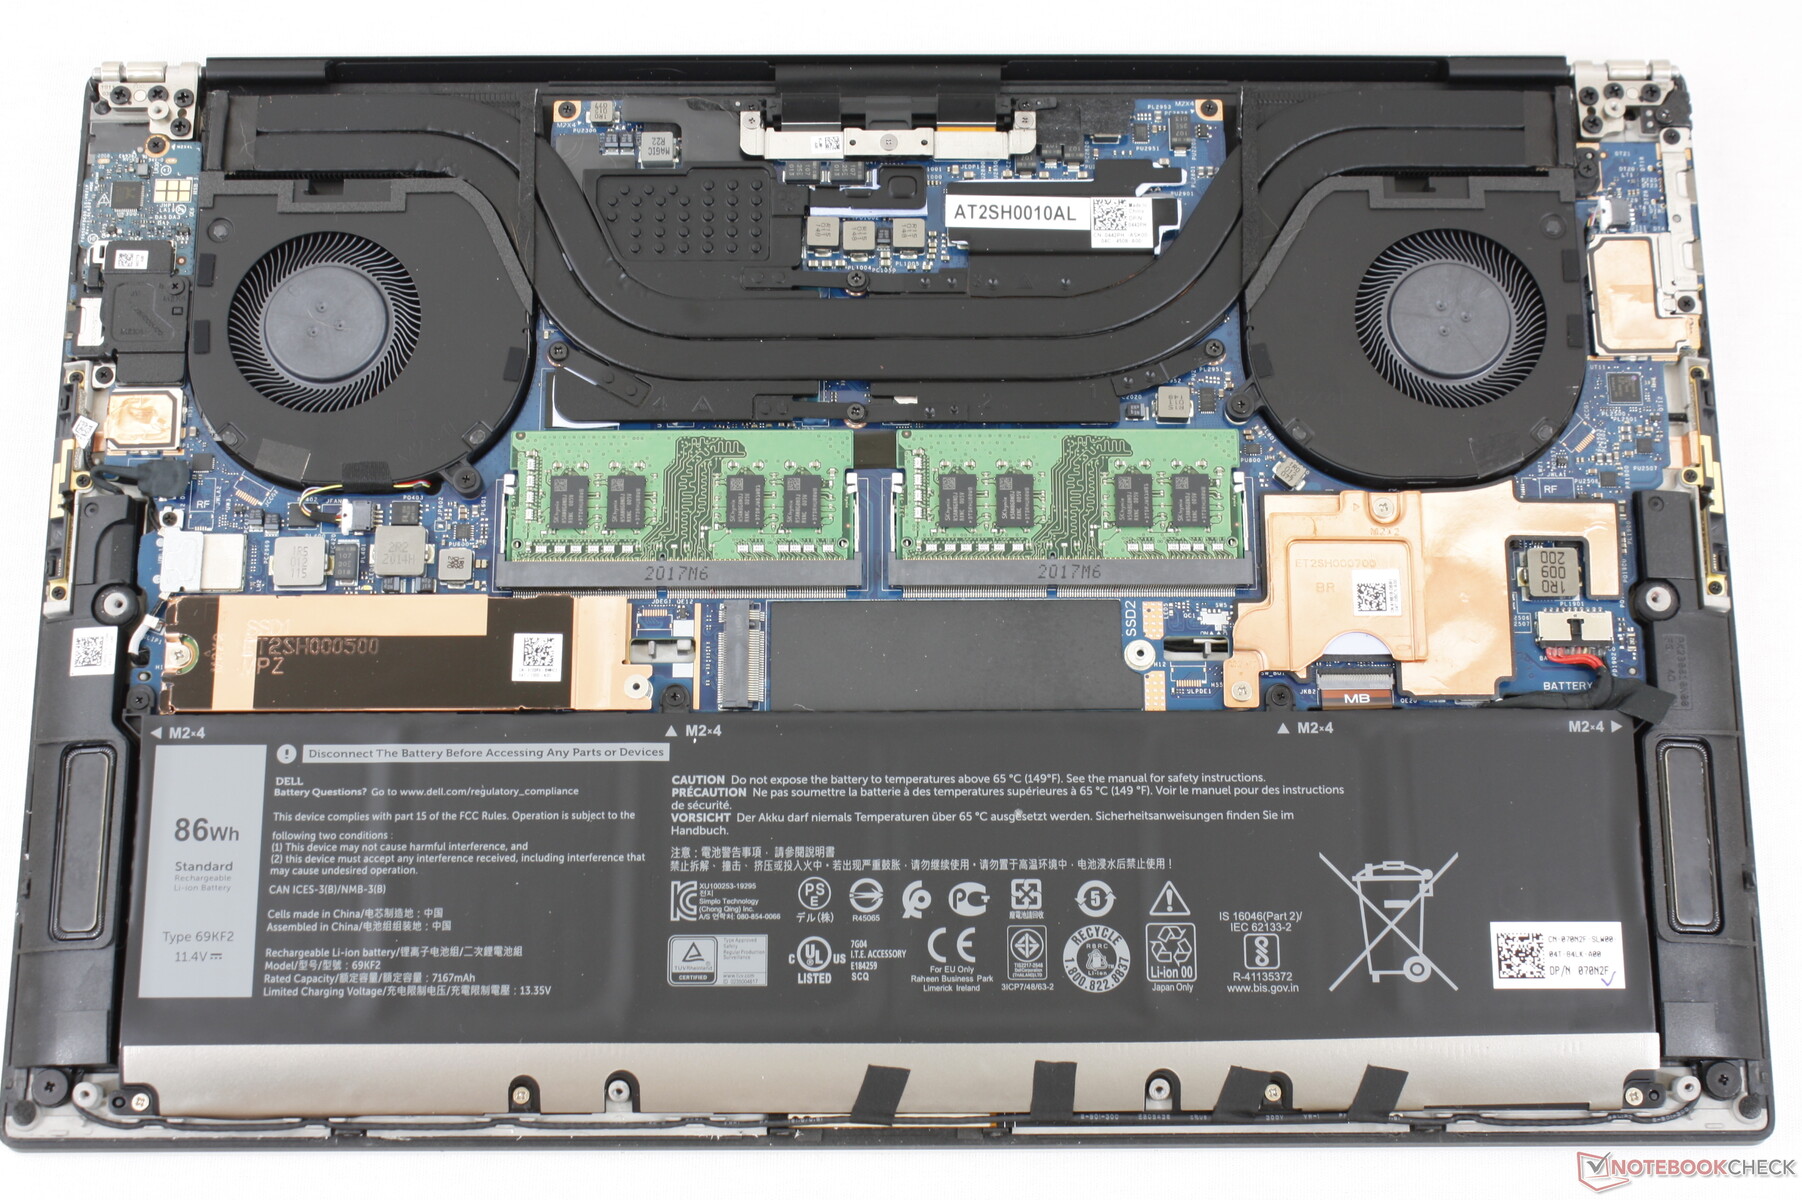
Onderhoud
Accessoires en garantie
De doos bevat de USB-C netadapter, papierwerk en een USB-C naar full-size HDMI en USB-A adapter. Deze laatste is bijzonder handig omdat het systeem alleen USB-C poorten bevat.
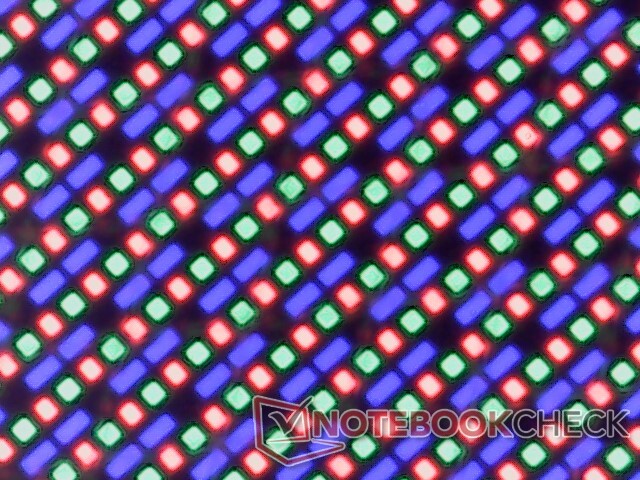
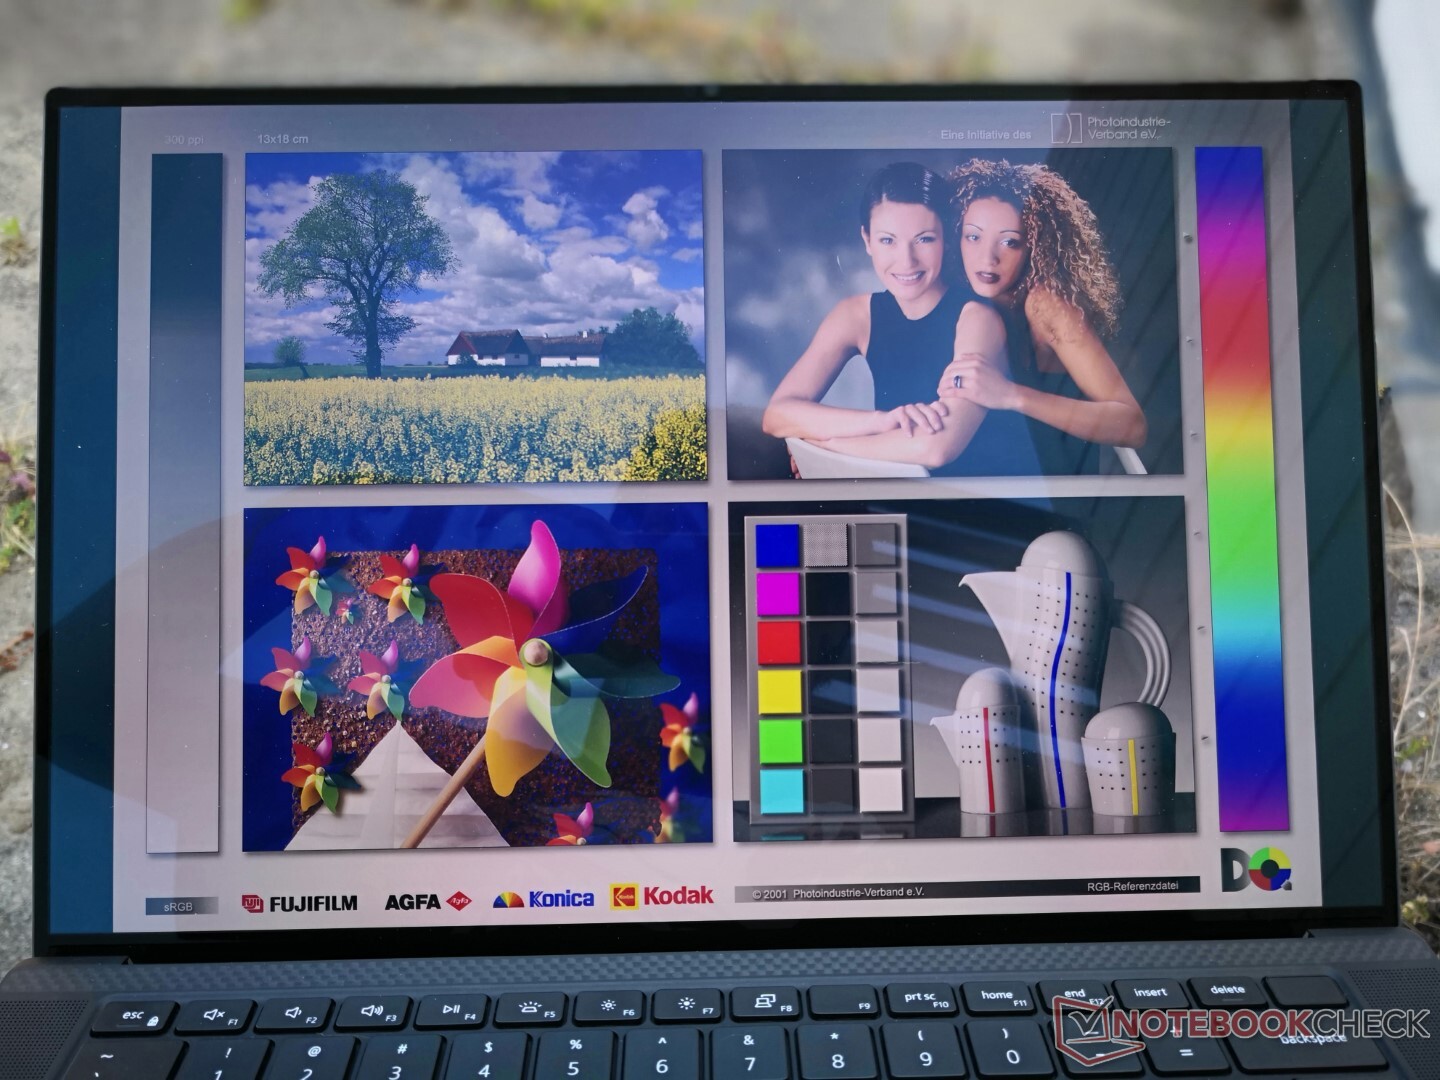
Beeldscherm - Ongebruikelijke 3.5K OLED
Ons evaluatie-exemplaar wordt geleverd met hetzelfde 3,5K OLED-touchscreen dat vorig jaar beschikbaar was op de XPS 15 9510, wat betekent dat de visuele ervaring van jaar tot jaar niet is veranderd. Een lagere-resolutie 1920 x 1200 IPS optie en een hogere-resolutie 3840 x 2400 IPS optie zijn ook beschikbaar, maar alle panelen zijn helaas beperkt tot een 60 Hz verversingssnelheid. Bepaalde Ultrabooks zoals de Lenovo IdeaPad Slim 7i Pro of Asus Vivobook Pro 14 worden al geleverd met snellere 90 Hz panelen voor een merkbaar vloeiendere UI-ervaring.
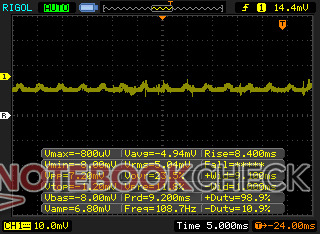
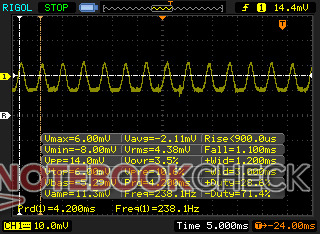
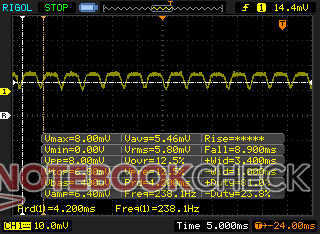
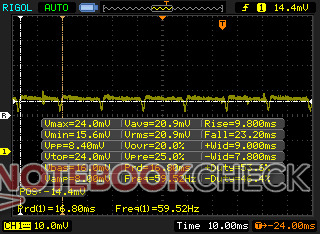
Houd in gedachten dat pulsbreedtemodulatie aanwezig is op alle helderheden bij 238 Hz van 0 procent tot 25 procent helderheid en 59 Hz van 26 procent tot 100 procent helderheid. Als flikkeren van het scherm een probleem is, raden we aan in plaats daarvan IPS te configureren.
| |||||||||||||||||||||||||
Helderheidsverdeling: 95 %
Helderheid in Batterij-modus: 381.4 cd/m²
Contrast: ∞:1 (Zwart: 0 cd/m²)
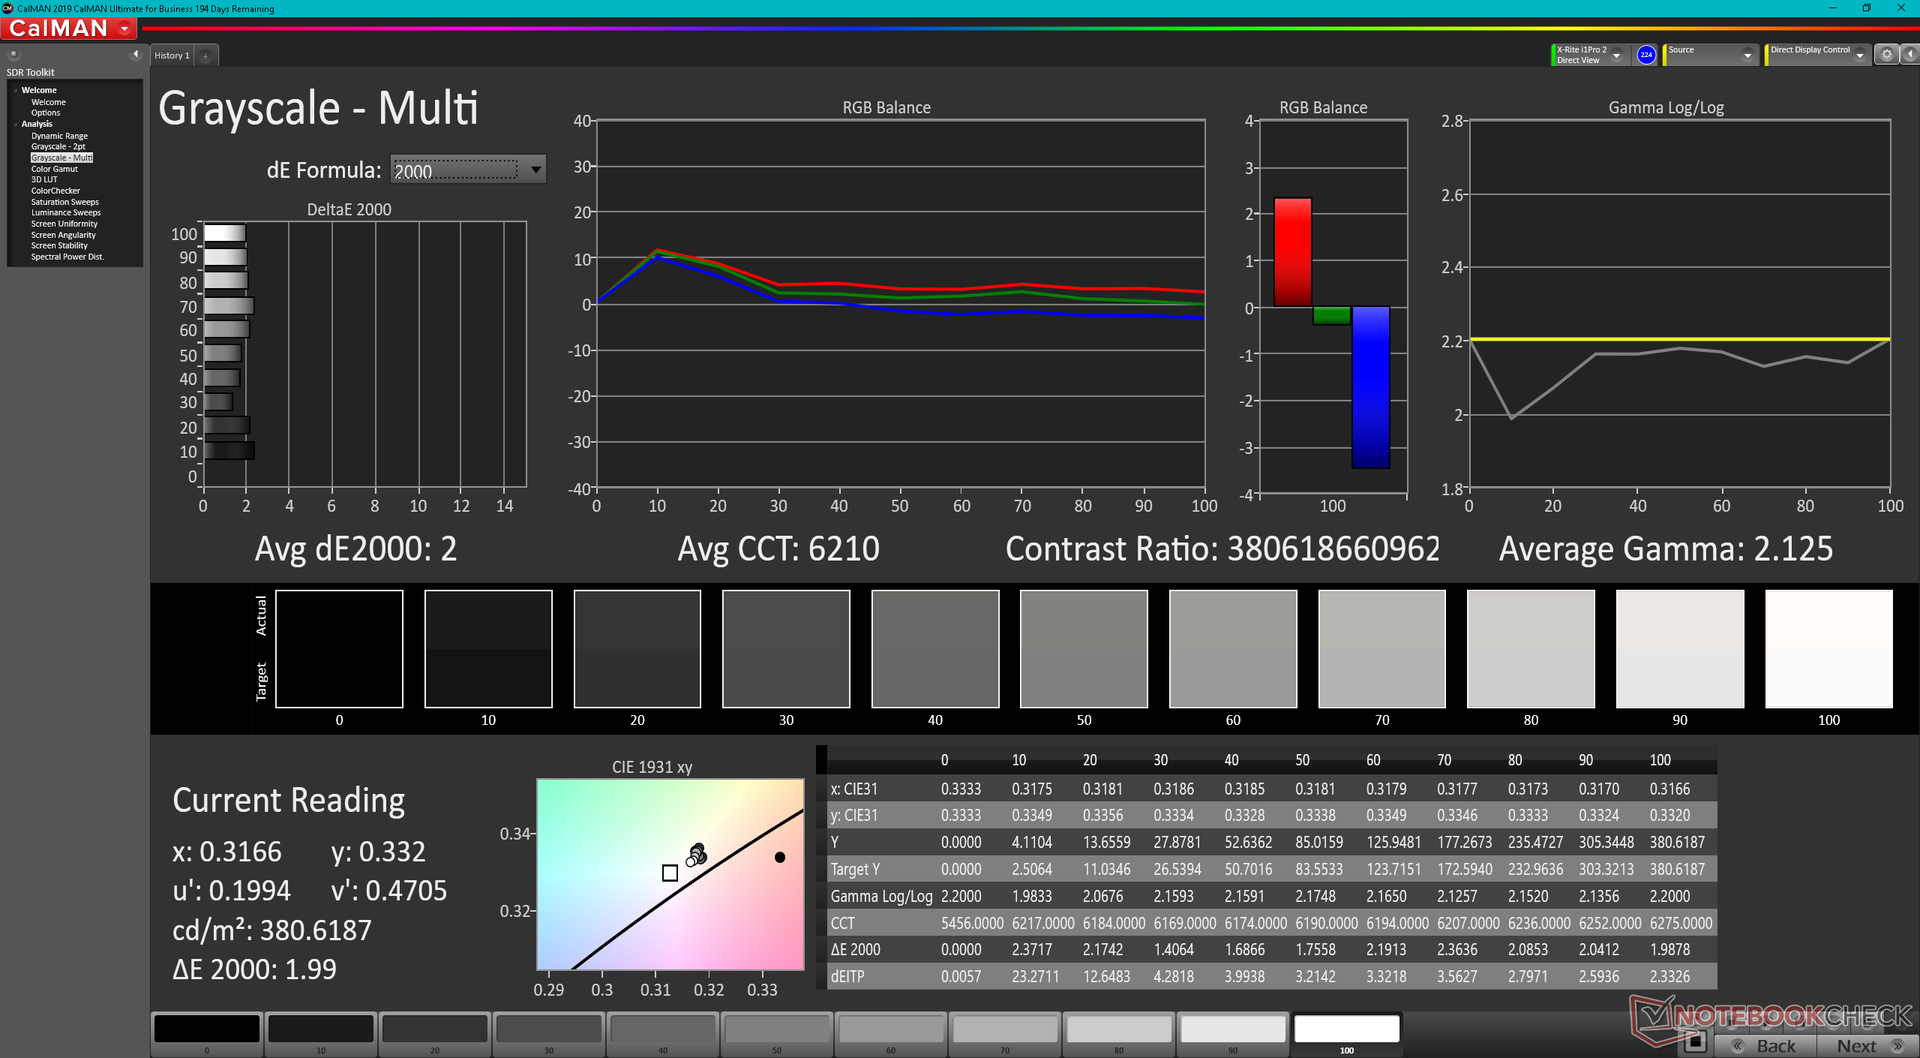
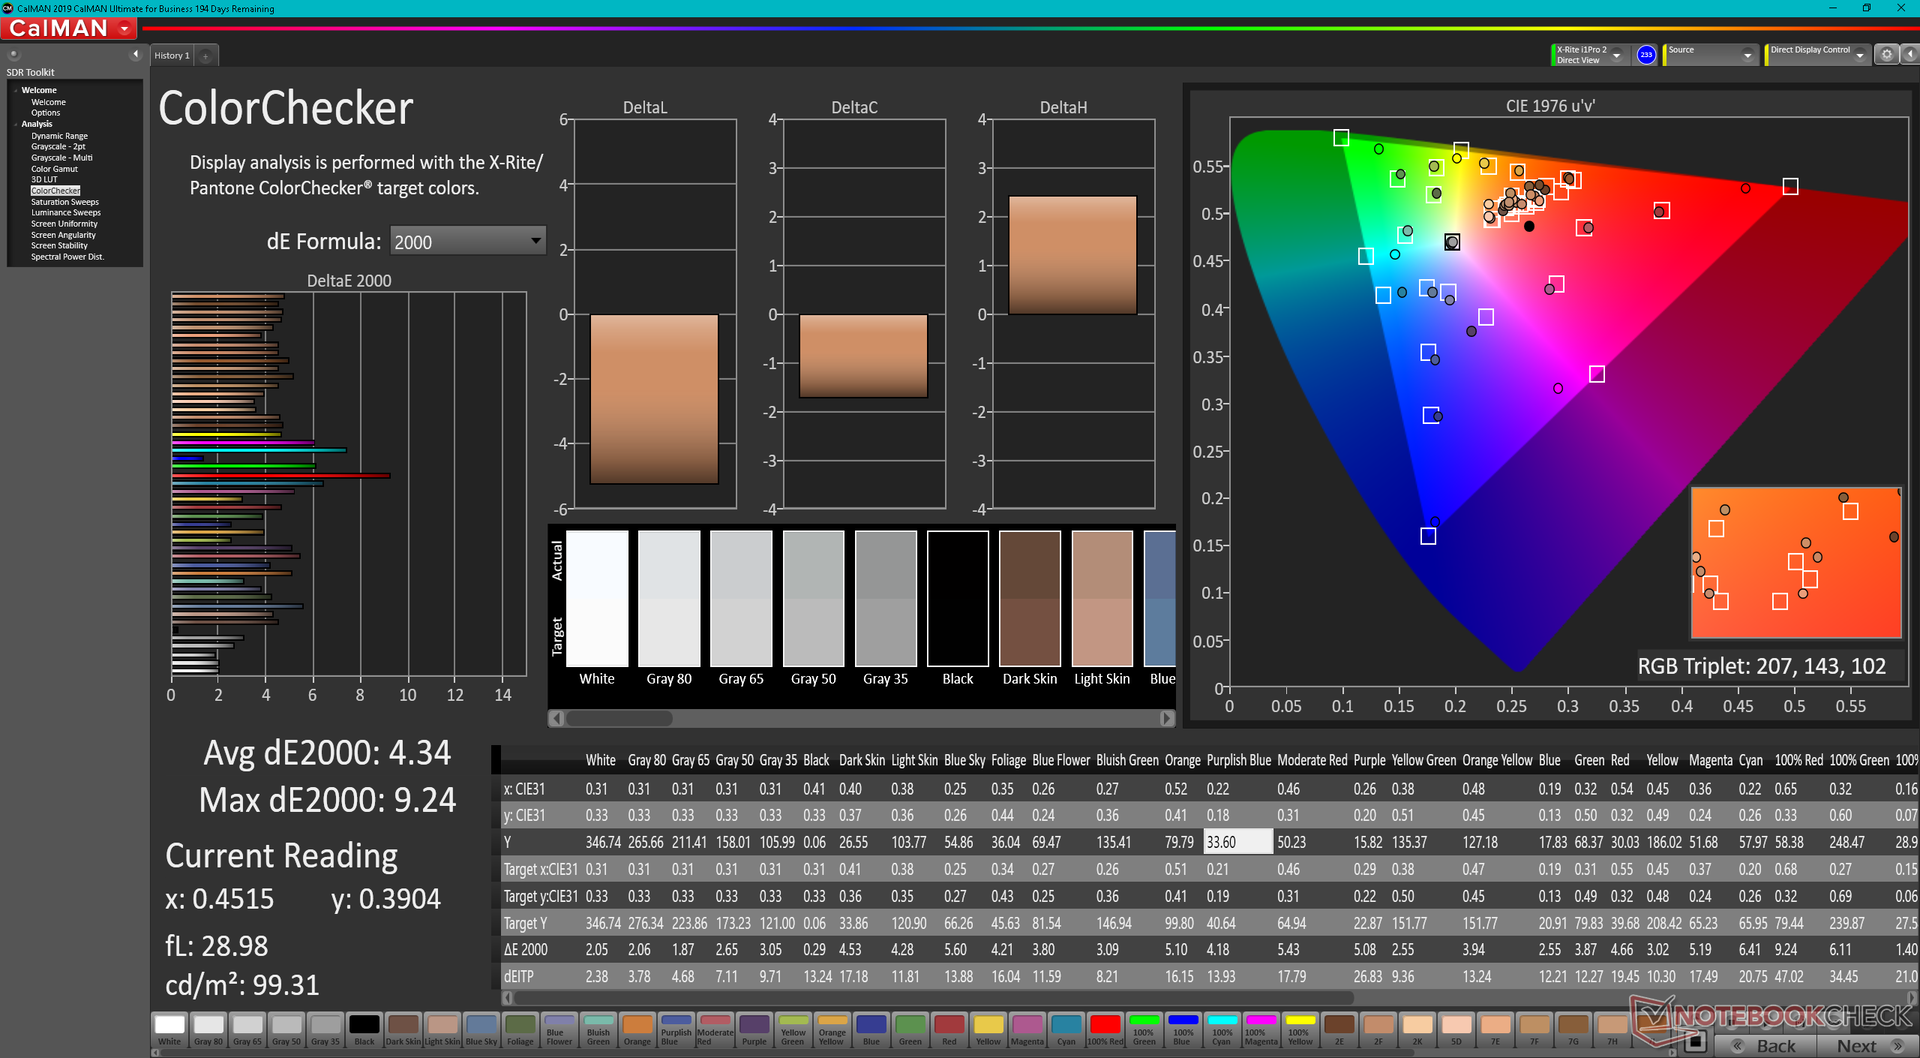
ΔE Color 4.34 | 0.5-29.43 Ø5
ΔE Greyscale 2 | 0.57-98 Ø5.3
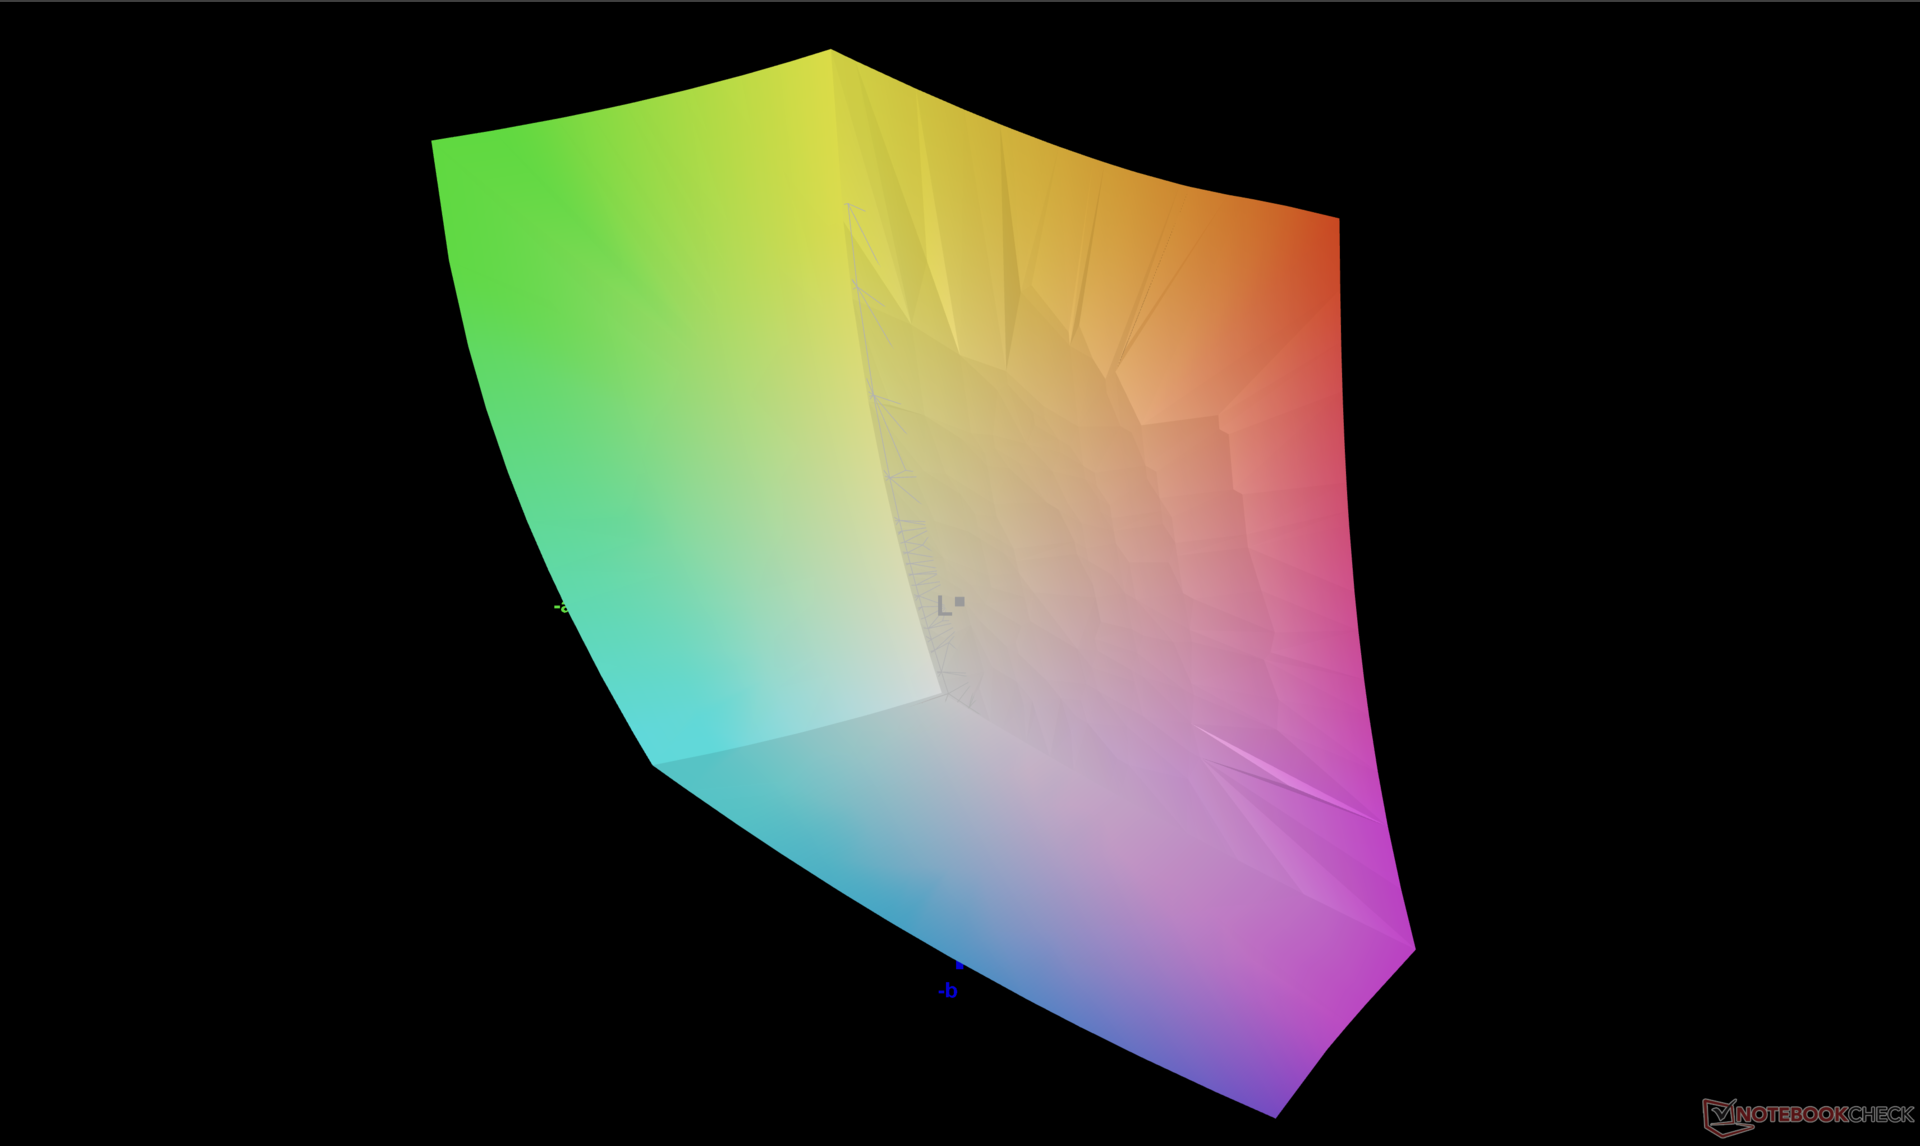
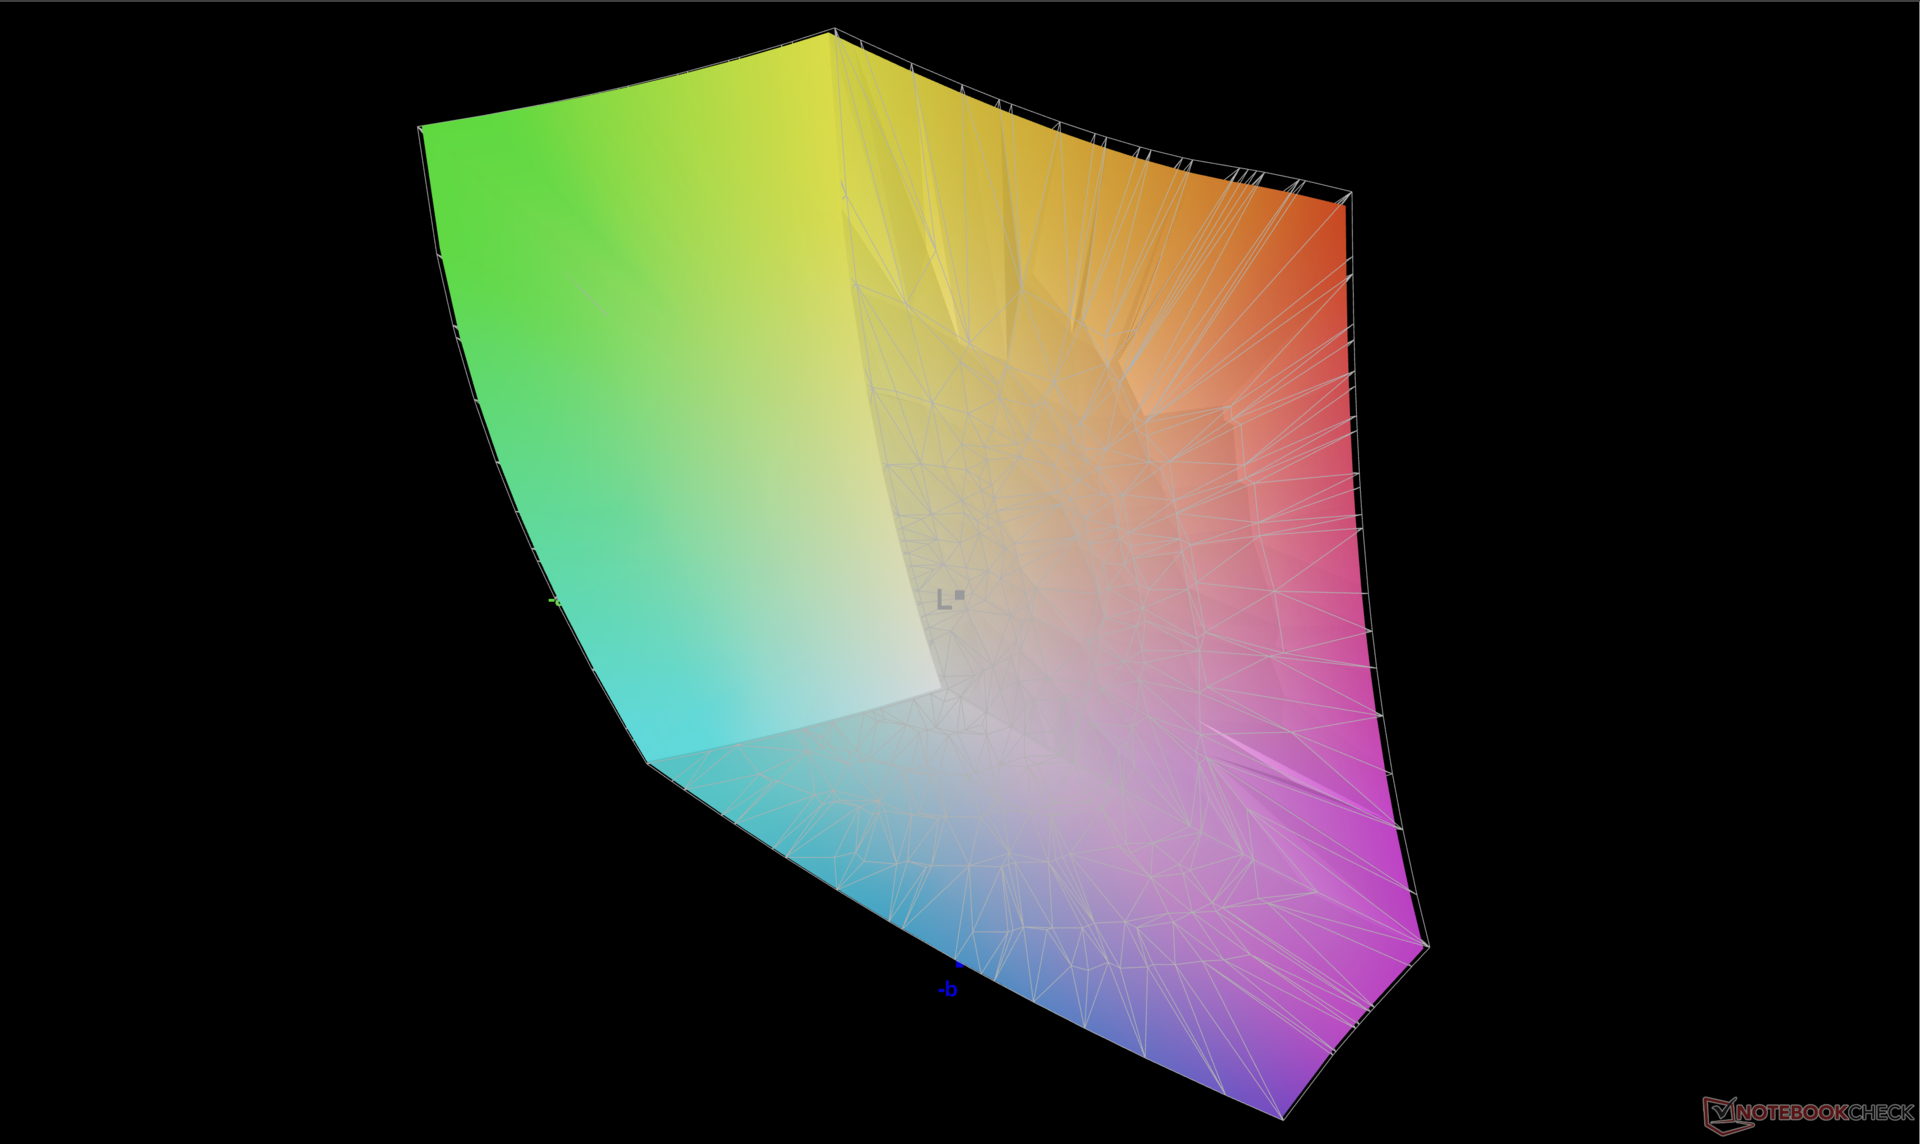
86% AdobeRGB 1998 (Argyll 2.2.0 3D)
99.9% sRGB (Argyll 2.2.0 3D)
97.8% Display P3 (Argyll 2.2.0 3D)
Gamma: 2.13
| Dell XPS 15 9520 RTX 3050 Ti Samsung 156XG01, OLED, 3456x2160, 15.60 | Dell XPS 15 9510 11800H RTX 3050 Ti OLED SDC414D, OLED, 3456x2160, 15.60 | Dell XPS 15 9500 Core i7 4K UHD Sharp LQ156R1, IPS, 3840x2400, 15.60 | HP Spectre X360 15-5ZV31AV AU Optronics AUO30EB, IPS, 3840x2160, 15.60 | Asus Zenbook Pro 15 OLED UM535Q Samsung ATNA56YX03-0, OLED, 1920x1080, 15.60 | MSI Stealth 15M A11SEK Chi Mei N156HCE-EN1, IPS, 1920x1080, 15.60 | |
|---|---|---|---|---|---|---|
| Display | 5% | 3% | -19% | -7% | -23% | |
| Display P3 Coverage | 97.8 | 99.9 2% | 89.7 -8% | 68.3 -30% | 79.3 -19% | 62 -37% |
| sRGB Coverage | 99.9 | 100 0% | 100 0% | 94.3 -6% | 95.6 -4% | 93.4 -7% |
| AdobeRGB 1998 Coverage | 86 | 98.1 14% | 99.8 16% | 68.4 -20% | 87.3 2% | 64.1 -25% |
| Response Times | -45% | -2195% | -2468% | -10% | 12582% | |
| Response Time Grey 50% / Grey 80% * | 1.9 ? | 3.6 ? -89% | 54 ? -2742% | 56.8 ? -2889% | 2.1 ? -11% | 47.6 ? -2405% |
| Response Time Black / White * | 1.9 ? | 2.8 ? -47% | 33.2 ? -1647% | 40.8 ? -2047% | 2.3 ? -21% | 35.2 ? -1753% |
| PWM Frequency | 59.52 ? | 59.5 ? 0% | 60.2 1% | 25000 ? 41903% | ||
| Screen | 22% | 5% | -11% | 13% | -4% | |
| Brightness middle | 381.4 | 362 -5% | 557.9 46% | 284.6 -25% | 342.9 -10% | 279 -27% |
| Brightness | 384 | 367 -4% | 541 41% | 285 -26% | 346 -10% | 252 -34% |
| Brightness Distribution | 95 | 97 2% | 91 -4% | 85 -11% | 98 3% | 82 -14% |
| Black Level * | 0.06 | 0.39 | 0.25 | 0.32 | ||
| Colorchecker dE 2000 * | 4.34 | 2.1 52% | 4.54 -5% | 3.52 19% | 2.42 44% | 1.72 60% |
| Colorchecker dE 2000 max. * | 9.24 | 4.1 56% | 7.92 14% | 5.56 40% | 4.05 56% | 5.62 39% |
| Greyscale dE 2000 * | 2 | 1.4 30% | 3.2 -60% | 3.2 -60% | 2.1 -5% | 2.9 -45% |
| Gamma | 2.13 103% | 2.18 101% | 1.99 111% | 2.28 96% | 2.21 100% | 2.3 96% |
| CCT | 6210 105% | 6608 98% | 6451 101% | 7070 92% | 6364 102% | 6700 97% |
| Contrast | 6033 | 1431 | 1138 | 872 | ||
| Colorchecker dE 2000 calibrated * | 2.5 | 3.82 | 3 | 1.39 | ||
| Color Space (Percent of AdobeRGB 1998) | 89.5 | 61.1 | 59 | |||
| Color Space (Percent of sRGB) | 100 | 93.8 | 93.2 | |||
| Totaal Gemiddelde (Programma / Instellingen) | -6% /
1% | -729% /
-395% | -833% /
-460% | -1% /
2% | 4185% /
3138% |
* ... kleiner is beter
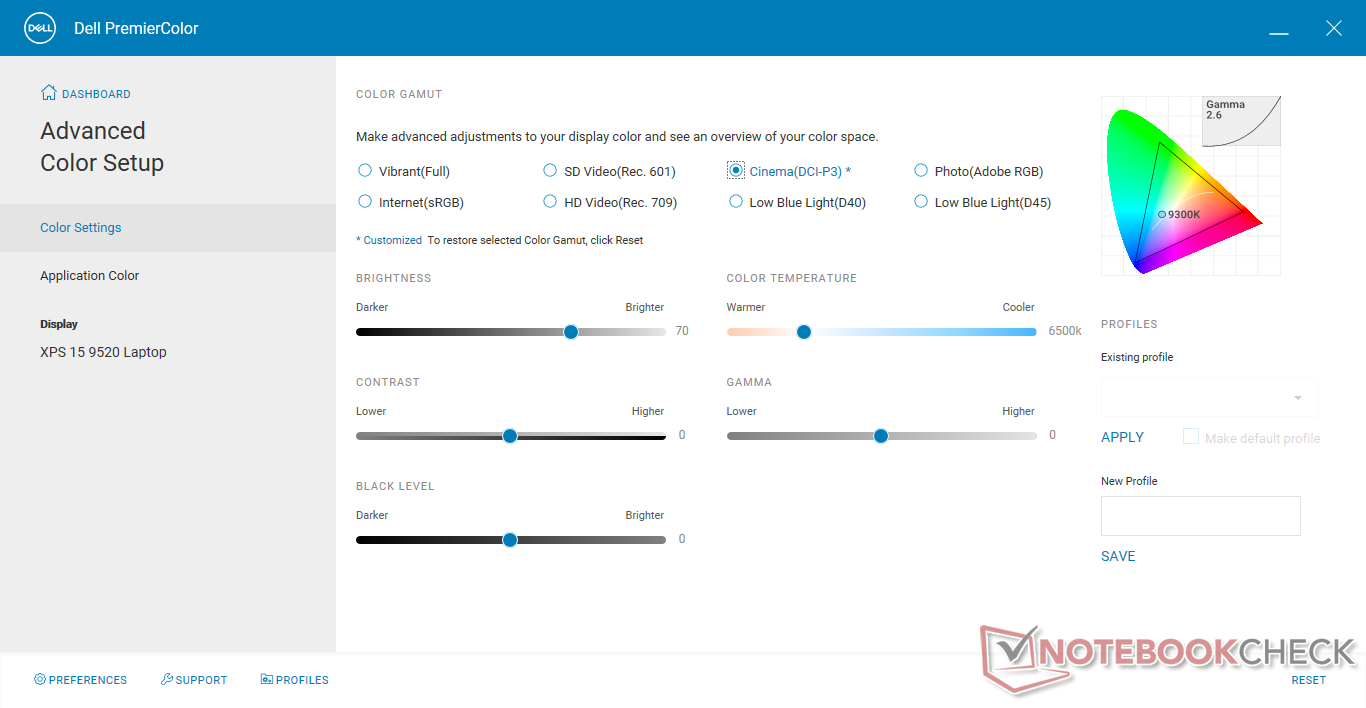
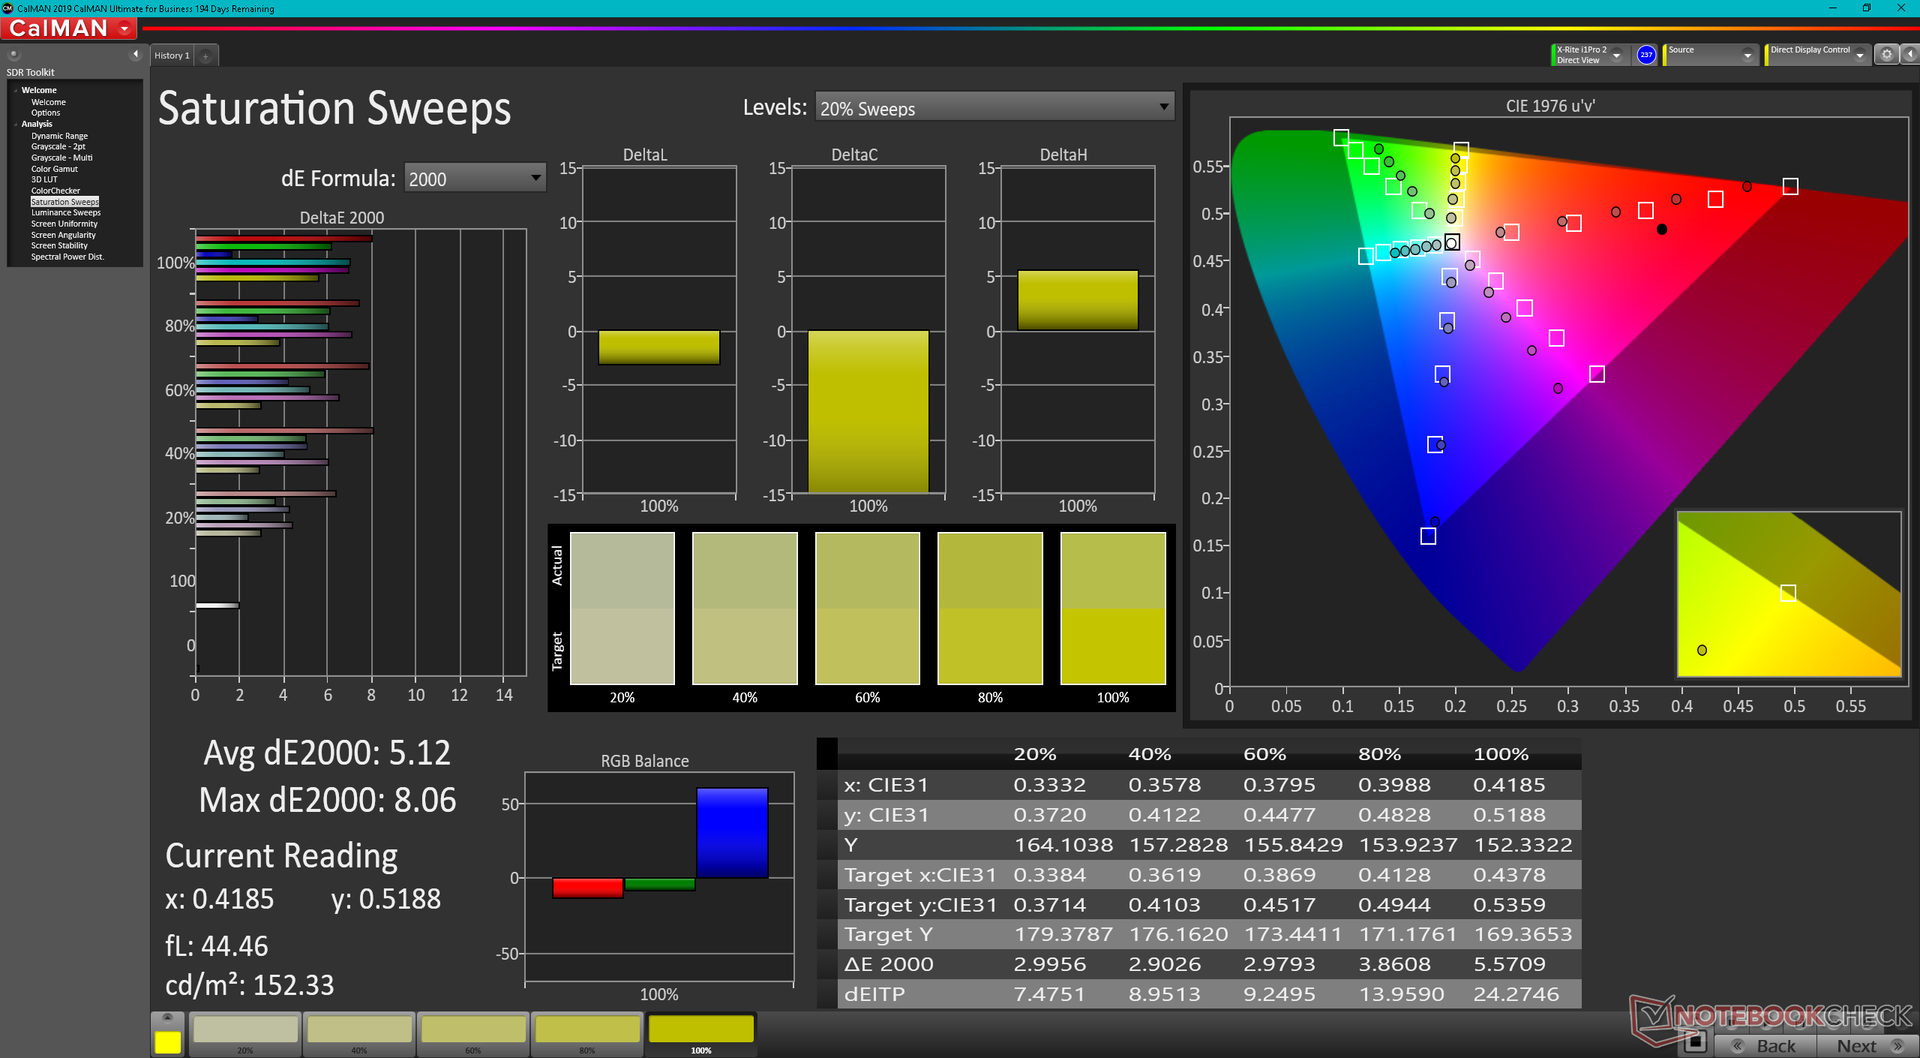
Hoewel we een DCI-P3-dekking van ten minste 98% kunnen bevestigen, zijn de kleuren op ons toestel niet goed gekalibreerd tegen de standaard, zelfs niet wanneer ze via de PremierColor-software zijn ingesteld op DCI-P3.
Responstijd Scherm
| ↔ Responstijd Zwart naar Wit | ||
|---|---|---|
| 1.9 ms ... stijging ↗ en daling ↘ gecombineerd | ↗ 1.1 ms stijging | 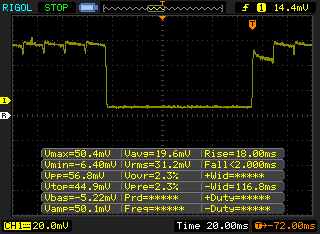 |
| ↘ 0.8 ms daling | ||
| Het scherm vertoonde erg snelle responstijden in onze tests en zou zeer geschikt moeten zijn voor snelle games. Ter vergelijking: alle testtoestellen variëren van 0.1 (minimum) tot 240 (maximum) ms. » 6 % van alle toestellen zijn beter. Dit betekent dat de gemeten responstijd beter is dan het gemiddelde (21.5 ms) van alle geteste toestellen. | ||
| ↔ Responstijd 50% Grijs naar 80% Grijs | ||
| 1.9 ms ... stijging ↗ en daling ↘ gecombineerd | ↗ 1.1 ms stijging | 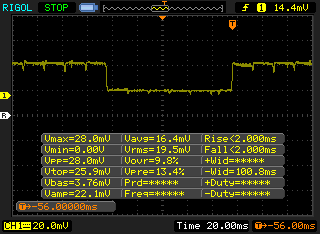 |
| ↘ 0.8 ms daling | ||
| Het scherm vertoonde erg snelle responstijden in onze tests en zou zeer geschikt moeten zijn voor snelle games. Ter vergelijking: alle testtoestellen variëren van 0.2 (minimum) tot 636 (maximum) ms. » 5 % van alle toestellen zijn beter. Dit betekent dat de gemeten responstijd beter is dan het gemiddelde (33.7 ms) van alle geteste toestellen. | ||
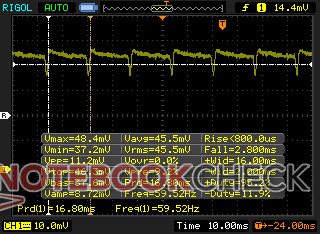
Screen Flickering / PWM (Pulse-Width Modulation)
| Screen flickering / PWM waargenomen | 59.52 Hz | ≤ 100 % helderheid instelling | 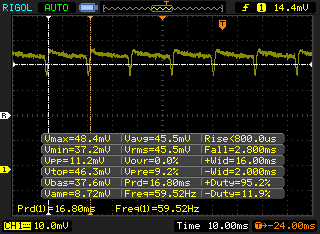 |
Het backlight van het scherm flikkert aan 59.52 Hz (hoogstwaarschijnlijk met PWM - Pulse-Width Modulation) aan een helderheid van 100 % en lager. Boven deze helderheid zou er geen flickering / PWM mogen optreden. De frequentie van 59.52 Hz is erg laag en kan dus aanleiding geven tot geïrriteerde ogen en hoofdpijn bij langer gebruik. Ter vergelijking: 53 % van alle geteste toestellen maakten geen gebruik van PWM om de schermhelderheid te verlagen. Als het wel werd gebruikt, werd een gemiddelde van 17844 (minimum: 5 - maximum: 3846000) Hz waargenomen. | |||

Prestaties - Intel 12e Gen opties
Testomstandigheden
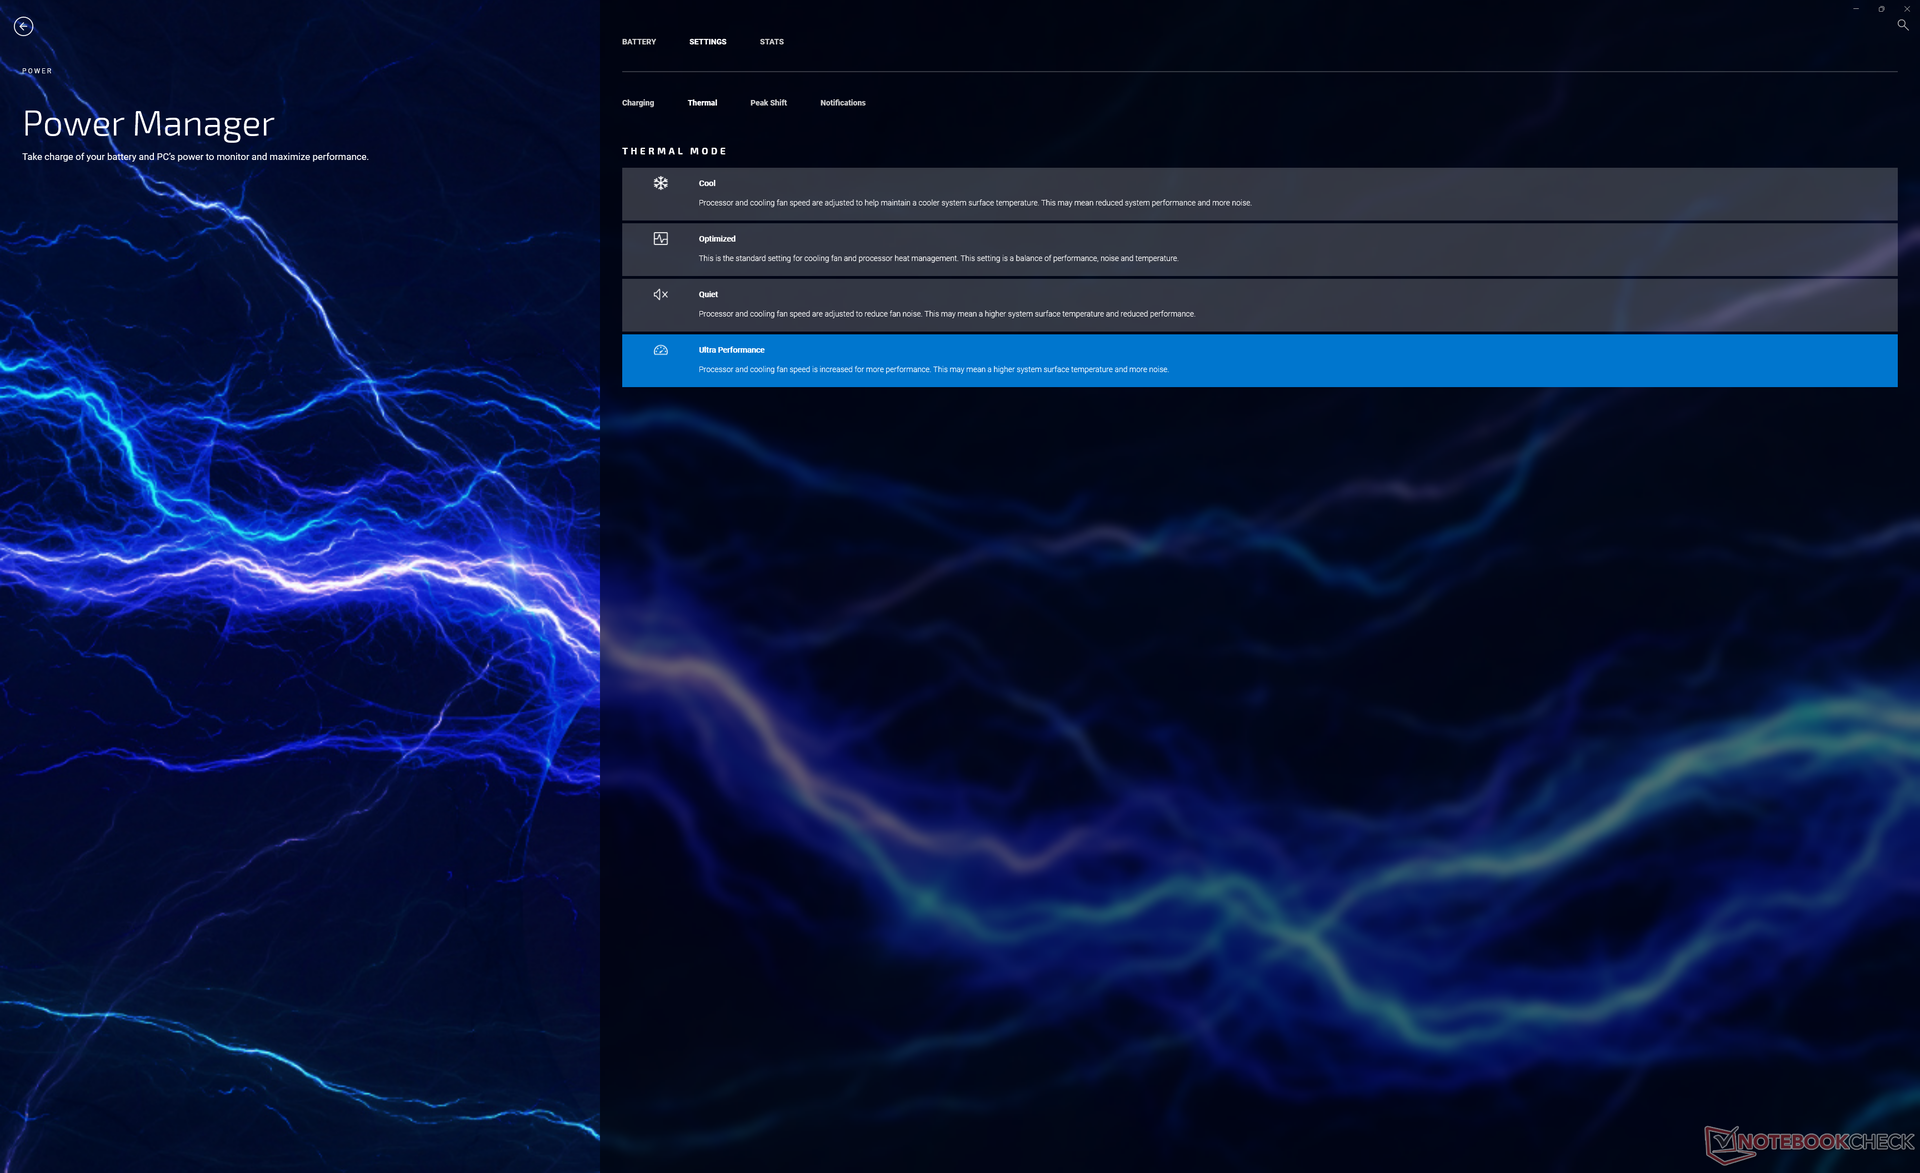
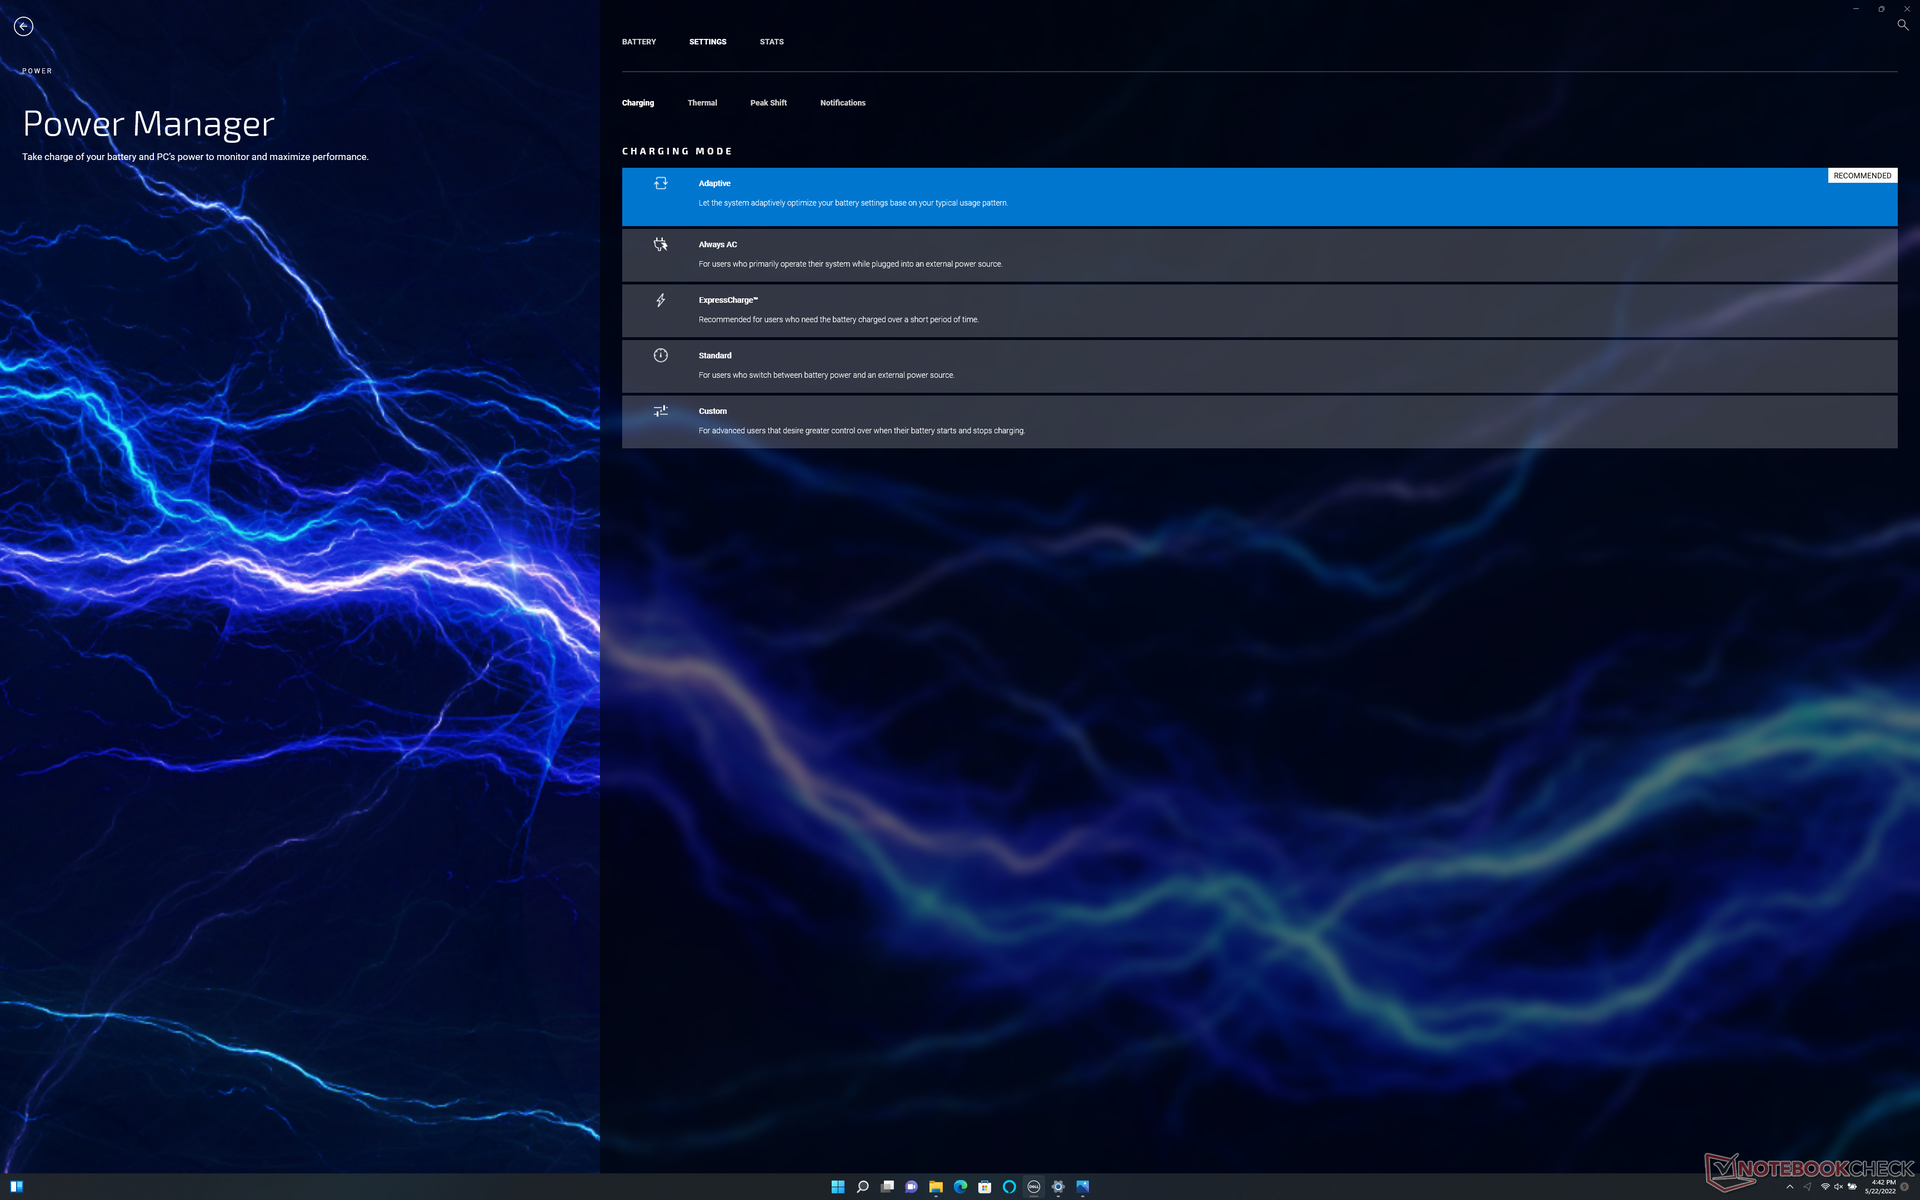
Ons toestel werd via Windows ingesteld op de modus Prestaties en via de toepassing Mijn Dell op de modus Ultraprestaties voordat de onderstaande benchmarks werden uitgevoerd voor de hoogst mogelijke scores. Let op: Mijn Dell heeft de oudere Dell Power Manager-software effectief vervangen. Wij raden gebruikers aan vertrouwd te raken met de nieuwe toepassing, omdat dit de one-stop shop is voor Dell-updates en prestatie-instellingen
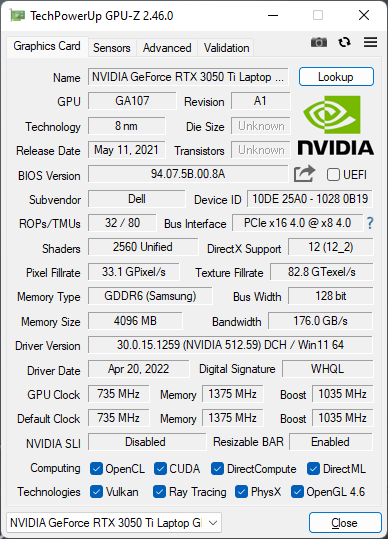
De 45 W TGP GeForce RTX 3050 Ti GPU is niet veranderd ten opzichte van de vorige XPS 15 9510. Er is naar verwachting geen MUX schakelaar of adaptieve synchronisatie aangezien de XPS 15 niet is ontworpen voor gaming.
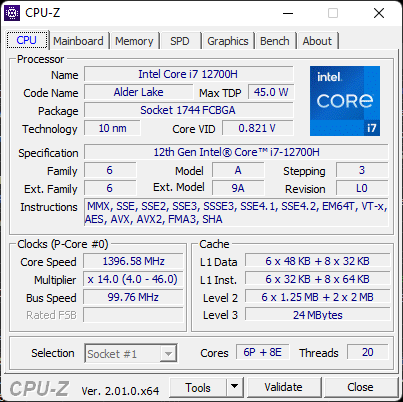
Processor
De boost in CPU-prestaties van de XPS 15 9510 naar de 9520 is significanter dan de boost in CPU-prestaties van de XPS 9500 naar de 9510. De sprong van deCore i7-11800H in de XPS 15 9510 naar de Core i7-12700H in onze 9520 zorgt voor een toename van 35 tot 40 procent in multi-thread prestaties en een toename van 15 tot 20 procent in single-thread prestaties. De sprong is genoeg om de 12e generatie Intel CPU iets voor te laten lopen op de populaire Ryzen 7 5800H die de meeste 11e generatie Intel Core-H serie CPU's schandalig heeft overtroffen in multi-thread werkbelastingen
De CPU prestaties hadden beter kunnen zijn, ondanks de eerder genoemde jaar-op-jaar stijging. In vergelijking met de meer dan 20 andere laptops die we tot nu toe hebben getest met dezelfde Core i7-12700H CPU, is de CPU in onze XPS 15 9520 zo'n 5 tot 15 procent langzamer dan het gemiddelde. Het draaien van CineBench R15 xT in een loop laat zien dat de CPU in de Dell niet in staat is om hoge Turbo Boost kloksnelheden zo lang vast te houden als de meeste andere laptops met dezelfde processor. Modellen zoals deAsus TUF Gaming F15 FX507ZM kunnen dezelfde CPU tot 36 procent sneller laten draaien dan op onze Dell.
Cinebench R15 Multi Loop
Cinebench R23: Multi Core | Single Core
Cinebench R15: CPU Multi 64Bit | CPU Single 64Bit
Blender: v2.79 BMW27 CPU
7-Zip 18.03: 7z b 4 | 7z b 4 -mmt1
Geekbench 5.5: Multi-Core | Single-Core
HWBOT x265 Benchmark v2.2: 4k Preset
LibreOffice : 20 Documents To PDF
R Benchmark 2.5: Overall mean
* ... kleiner is beter
AIDA64: FP32 Ray-Trace | FPU Julia | CPU SHA3 | CPU Queen | FPU SinJulia | FPU Mandel | CPU AES | CPU ZLib | FP64 Ray-Trace | CPU PhotoWorxx
| Performance Rating | |
| Asus Zenbook Pro 15 OLED UM535Q | |
| Gemiddeld Intel Core i7-12700H | |
| Dell XPS 15 9520 RTX 3050 Ti | |
| Dell XPS 15 9500 Core i7 4K UHD | |
| Dell XPS 15 9510 11800H RTX 3050 Ti OLED -9! | |
| AIDA64 / FP32 Ray-Trace | |
| Asus Zenbook Pro 15 OLED UM535Q | |
| Gemiddeld Intel Core i7-12700H (2585 - 17957, n=62) | |
| Dell XPS 15 9500 Core i7 4K UHD | |
| Dell XPS 15 9520 RTX 3050 Ti | |
| AIDA64 / FPU Julia | |
| Asus Zenbook Pro 15 OLED UM535Q | |
| Dell XPS 15 9500 Core i7 4K UHD | |
| Gemiddeld Intel Core i7-12700H (12439 - 90760, n=62) | |
| Dell XPS 15 9520 RTX 3050 Ti | |
| AIDA64 / CPU SHA3 | |
| Asus Zenbook Pro 15 OLED UM535Q | |
| Gemiddeld Intel Core i7-12700H (833 - 4242, n=62) | |
| Dell XPS 15 9500 Core i7 4K UHD | |
| Dell XPS 15 9520 RTX 3050 Ti | |
| AIDA64 / CPU Queen | |
| Asus Zenbook Pro 15 OLED UM535Q | |
| Dell XPS 15 9520 RTX 3050 Ti | |
| Gemiddeld Intel Core i7-12700H (57923 - 103202, n=62) | |
| Dell XPS 15 9500 Core i7 4K UHD | |
| AIDA64 / FPU SinJulia | |
| Asus Zenbook Pro 15 OLED UM535Q | |
| Dell XPS 15 9500 Core i7 4K UHD | |
| Gemiddeld Intel Core i7-12700H (3249 - 9939, n=62) | |
| Dell XPS 15 9520 RTX 3050 Ti | |
| AIDA64 / FPU Mandel | |
| Asus Zenbook Pro 15 OLED UM535Q | |
| Dell XPS 15 9500 Core i7 4K UHD | |
| Gemiddeld Intel Core i7-12700H (7135 - 44760, n=62) | |
| Dell XPS 15 9520 RTX 3050 Ti | |
| AIDA64 / CPU AES | |
| Asus Zenbook Pro 15 OLED UM535Q | |
| Gemiddeld Intel Core i7-12700H (31839 - 144360, n=62) | |
| Dell XPS 15 9520 RTX 3050 Ti | |
| Dell XPS 15 9500 Core i7 4K UHD | |
| AIDA64 / CPU ZLib | |
| Gemiddeld Intel Core i7-12700H (305 - 1171, n=62) | |
| Dell XPS 15 9520 RTX 3050 Ti | |
| Asus Zenbook Pro 15 OLED UM535Q | |
| Dell XPS 15 9500 Core i7 4K UHD | |
| Dell XPS 15 9510 11800H RTX 3050 Ti OLED | |
| AIDA64 / FP64 Ray-Trace | |
| Asus Zenbook Pro 15 OLED UM535Q | |
| Gemiddeld Intel Core i7-12700H (1437 - 9692, n=62) | |
| Dell XPS 15 9520 RTX 3050 Ti | |
| Dell XPS 15 9500 Core i7 4K UHD | |
| AIDA64 / CPU PhotoWorxx | |
| Dell XPS 15 9520 RTX 3050 Ti | |
| Gemiddeld Intel Core i7-12700H (12863 - 52207, n=62) | |
| Dell XPS 15 9500 Core i7 4K UHD | |
| Asus Zenbook Pro 15 OLED UM535Q | |
Systeemprestaties
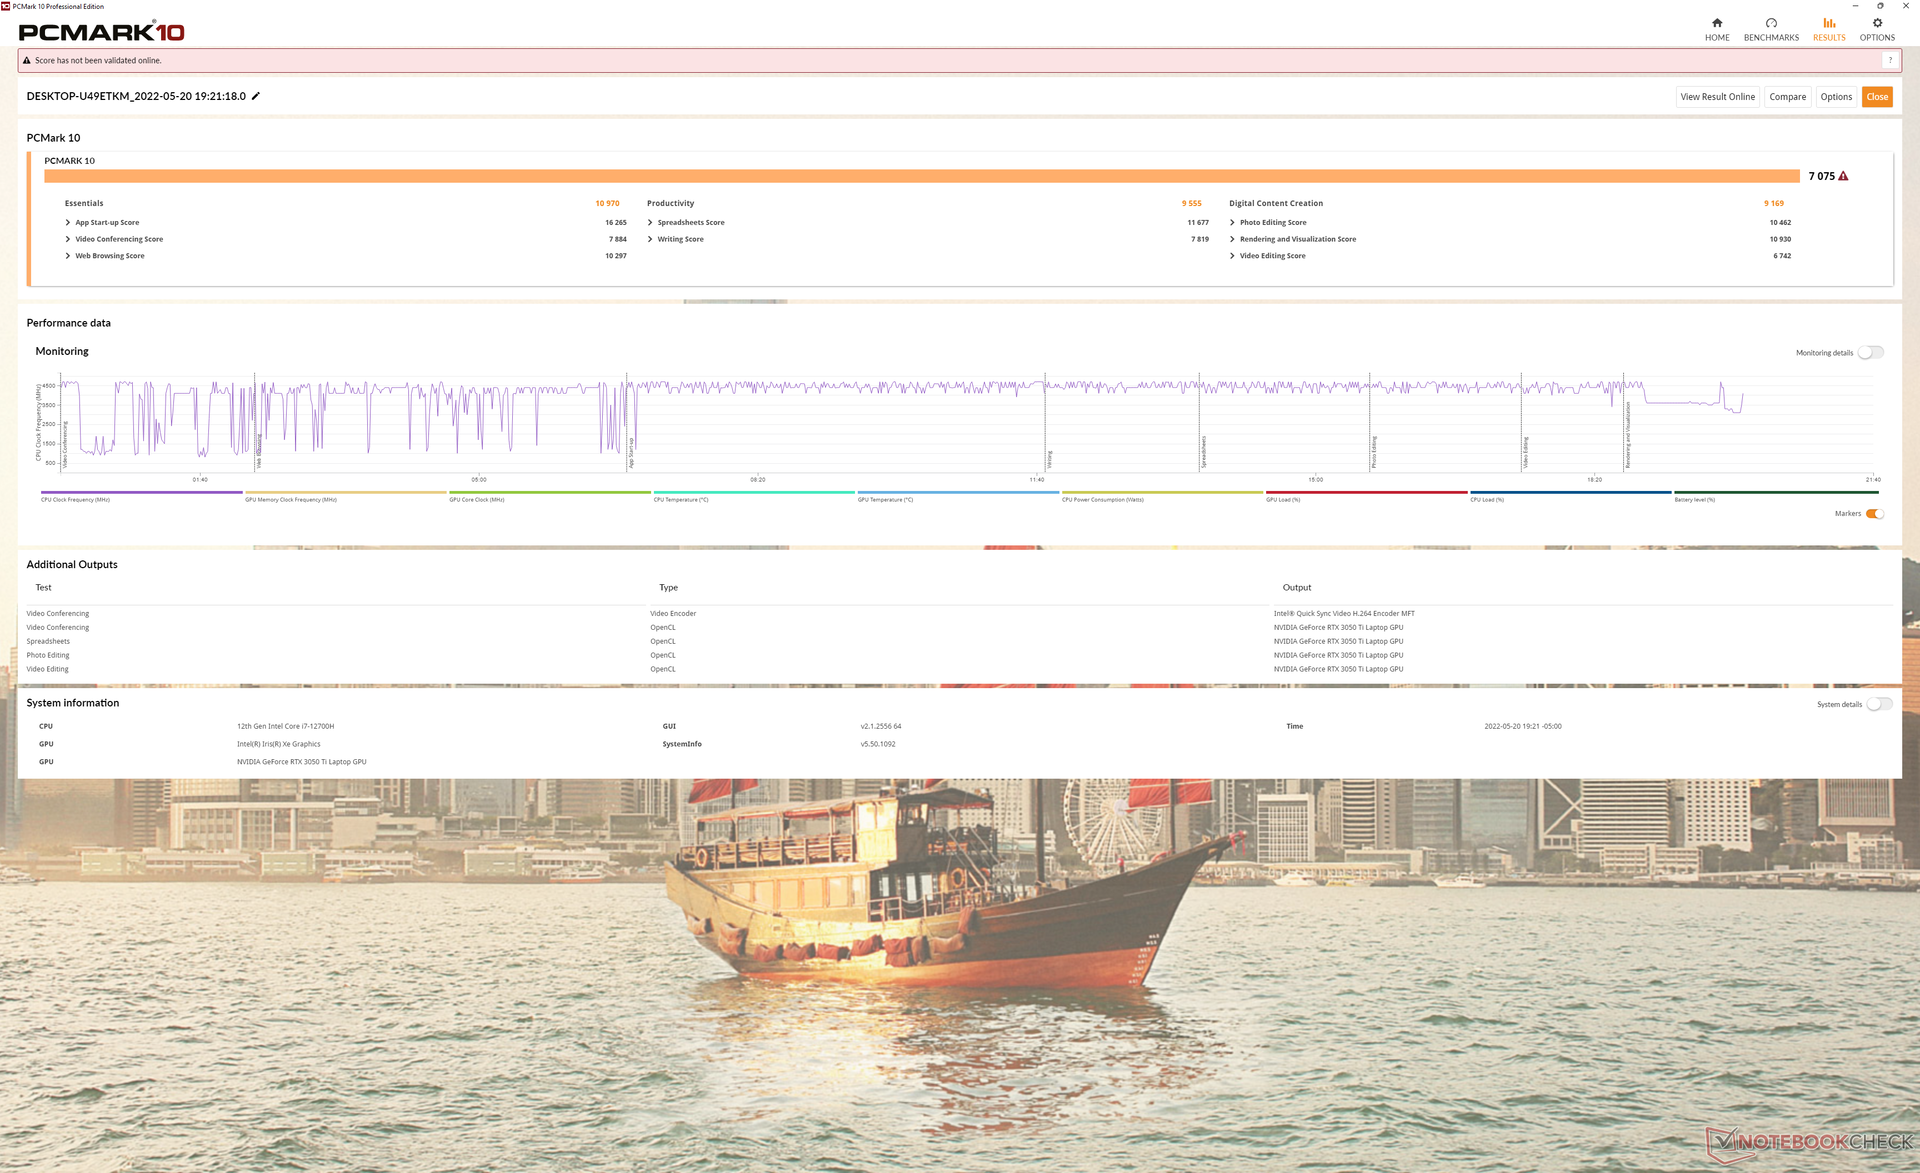
PCMark 10 resultaten zijn consistent hoger dan wat we registreerden op de oudere XPS 15 9510 en 9500, grotendeels dankzij de boost in CPU en SSD prestaties.
CrossMark: Overall | Productivity | Creativity | Responsiveness
| PCMark 10 / Score | |
| Dell XPS 15 9520 RTX 3050 Ti | |
| Gemiddeld Intel Core i7-12700H, NVIDIA GeForce RTX 3050 Ti Laptop GPU (6623 - 7075, n=5) | |
| Asus Zenbook Pro 15 OLED UM535Q | |
| Dell XPS 15 9510 11800H RTX 3050 Ti OLED | |
| MSI Stealth 15M A11SEK | |
| Dell XPS 15 9500 Core i7 4K UHD | |
| HP Spectre X360 15-5ZV31AV | |
| PCMark 10 / Essentials | |
| Dell XPS 15 9520 RTX 3050 Ti | |
| Asus Zenbook Pro 15 OLED UM535Q | |
| Gemiddeld Intel Core i7-12700H, NVIDIA GeForce RTX 3050 Ti Laptop GPU (9540 - 10970, n=5) | |
| Dell XPS 15 9500 Core i7 4K UHD | |
| MSI Stealth 15M A11SEK | |
| Dell XPS 15 9510 11800H RTX 3050 Ti OLED | |
| HP Spectre X360 15-5ZV31AV | |
| PCMark 10 / Productivity | |
| Asus Zenbook Pro 15 OLED UM535Q | |
| Dell XPS 15 9520 RTX 3050 Ti | |
| Gemiddeld Intel Core i7-12700H, NVIDIA GeForce RTX 3050 Ti Laptop GPU (8530 - 9555, n=5) | |
| MSI Stealth 15M A11SEK | |
| Dell XPS 15 9510 11800H RTX 3050 Ti OLED | |
| Dell XPS 15 9500 Core i7 4K UHD | |
| HP Spectre X360 15-5ZV31AV | |
| PCMark 10 / Digital Content Creation | |
| Gemiddeld Intel Core i7-12700H, NVIDIA GeForce RTX 3050 Ti Laptop GPU (8855 - 9542, n=5) | |
| Dell XPS 15 9520 RTX 3050 Ti | |
| Asus Zenbook Pro 15 OLED UM535Q | |
| Dell XPS 15 9510 11800H RTX 3050 Ti OLED | |
| MSI Stealth 15M A11SEK | |
| Dell XPS 15 9500 Core i7 4K UHD | |
| HP Spectre X360 15-5ZV31AV | |
| CrossMark / Overall | |
| Dell XPS 15 9520 RTX 3050 Ti | |
| Gemiddeld Intel Core i7-12700H, NVIDIA GeForce RTX 3050 Ti Laptop GPU (1654 - 1872, n=5) | |
| Asus Zenbook Pro 15 OLED UM535Q | |
| CrossMark / Productivity | |
| Dell XPS 15 9520 RTX 3050 Ti | |
| Gemiddeld Intel Core i7-12700H, NVIDIA GeForce RTX 3050 Ti Laptop GPU (1595 - 1792, n=5) | |
| Asus Zenbook Pro 15 OLED UM535Q | |
| CrossMark / Creativity | |
| Dell XPS 15 9520 RTX 3050 Ti | |
| Gemiddeld Intel Core i7-12700H, NVIDIA GeForce RTX 3050 Ti Laptop GPU (1699 - 1993, n=5) | |
| Asus Zenbook Pro 15 OLED UM535Q | |
| CrossMark / Responsiveness | |
| Dell XPS 15 9520 RTX 3050 Ti | |
| Gemiddeld Intel Core i7-12700H, NVIDIA GeForce RTX 3050 Ti Laptop GPU (1383 - 1768, n=5) | |
| Asus Zenbook Pro 15 OLED UM535Q | |
| PCMark 10 Score | 7075 punten | |
Help | ||
| AIDA64 / Memory Copy | |
| Dell XPS 15 9520 RTX 3050 Ti | |
| Gemiddeld Intel Core i7-12700H (25615 - 80511, n=62) | |
| Asus Zenbook Pro 15 OLED UM535Q | |
| Dell XPS 15 9500 Core i7 4K UHD | |
| AIDA64 / Memory Read | |
| Dell XPS 15 9520 RTX 3050 Ti | |
| Gemiddeld Intel Core i7-12700H (25586 - 79442, n=62) | |
| Asus Zenbook Pro 15 OLED UM535Q | |
| Dell XPS 15 9500 Core i7 4K UHD | |
| AIDA64 / Memory Write | |
| Dell XPS 15 9520 RTX 3050 Ti | |
| Gemiddeld Intel Core i7-12700H (23679 - 88660, n=62) | |
| Asus Zenbook Pro 15 OLED UM535Q | |
| Dell XPS 15 9500 Core i7 4K UHD | |
| AIDA64 / Memory Latency | |
| Dell XPS 15 9520 RTX 3050 Ti | |
| Asus Zenbook Pro 15 OLED UM535Q | |
| Gemiddeld Intel Core i7-12700H (76.2 - 133.9, n=60) | |
| Dell XPS 15 9500 Core i7 4K UHD | |
| Dell XPS 15 9510 11800H RTX 3050 Ti OLED | |
* ... kleiner is beter
DPC latentie
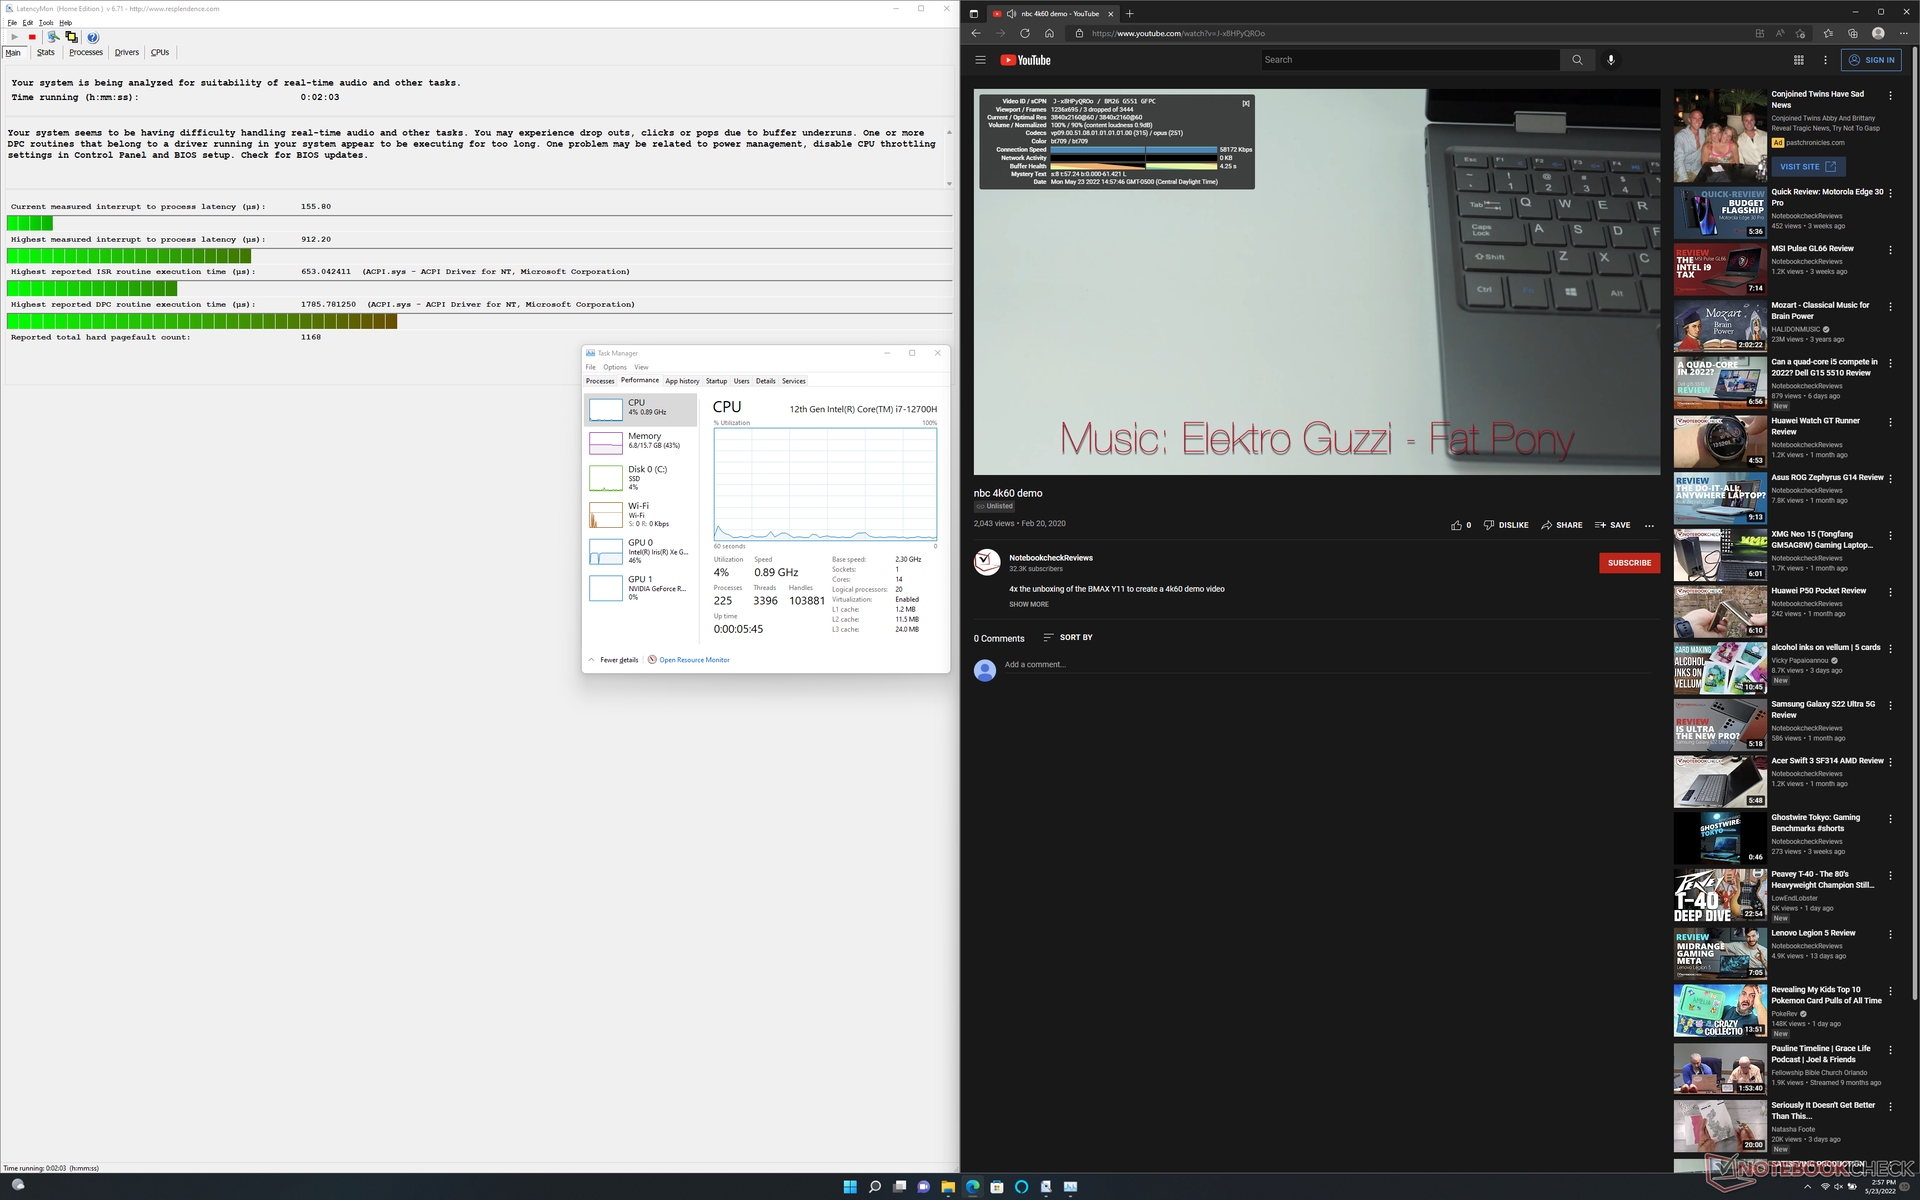
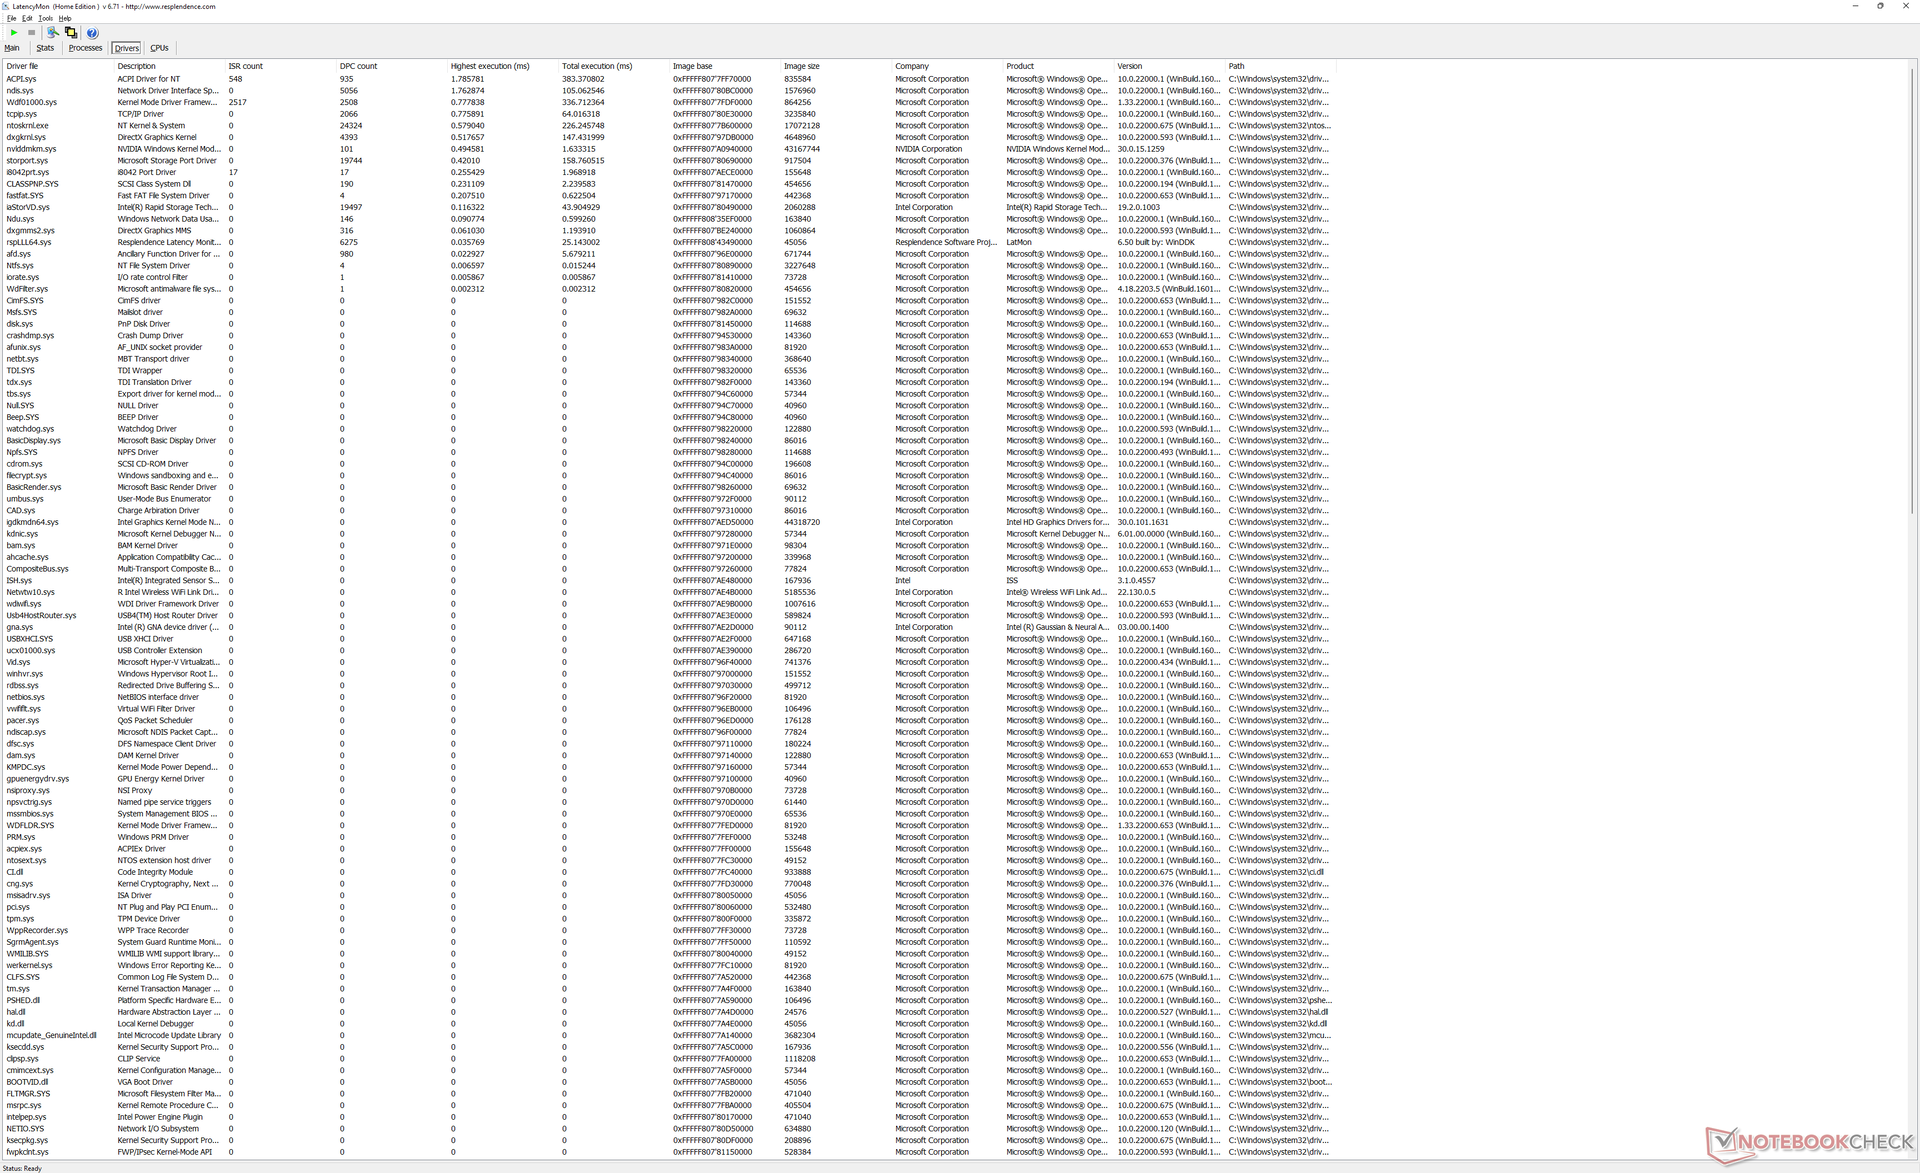
LatencyMon onthult kleine DPC-problemen bij het openen van meerdere browsertabbladen op onze startpagina. het afspelen van 4K-video's met 60 FPS verloopt verder vloeiend, met slechts 3 dropped frames tijdens onze minutenlange videotest.
| DPC Latencies / LatencyMon - interrupt to process latency (max), Web, Youtube, Prime95 | |
| Dell XPS 15 9500 Core i7 4K UHD | |
| Dell XPS 15 9510 11800H RTX 3050 Ti OLED | |
| Dell XPS 15 9520 RTX 3050 Ti | |
| MSI Stealth 15M A11SEK | |
| Asus Zenbook Pro 15 OLED UM535Q | |
* ... kleiner is beter
Opslagapparatuur - Ondersteunt tot twee PCIe4 NVMe SSD's
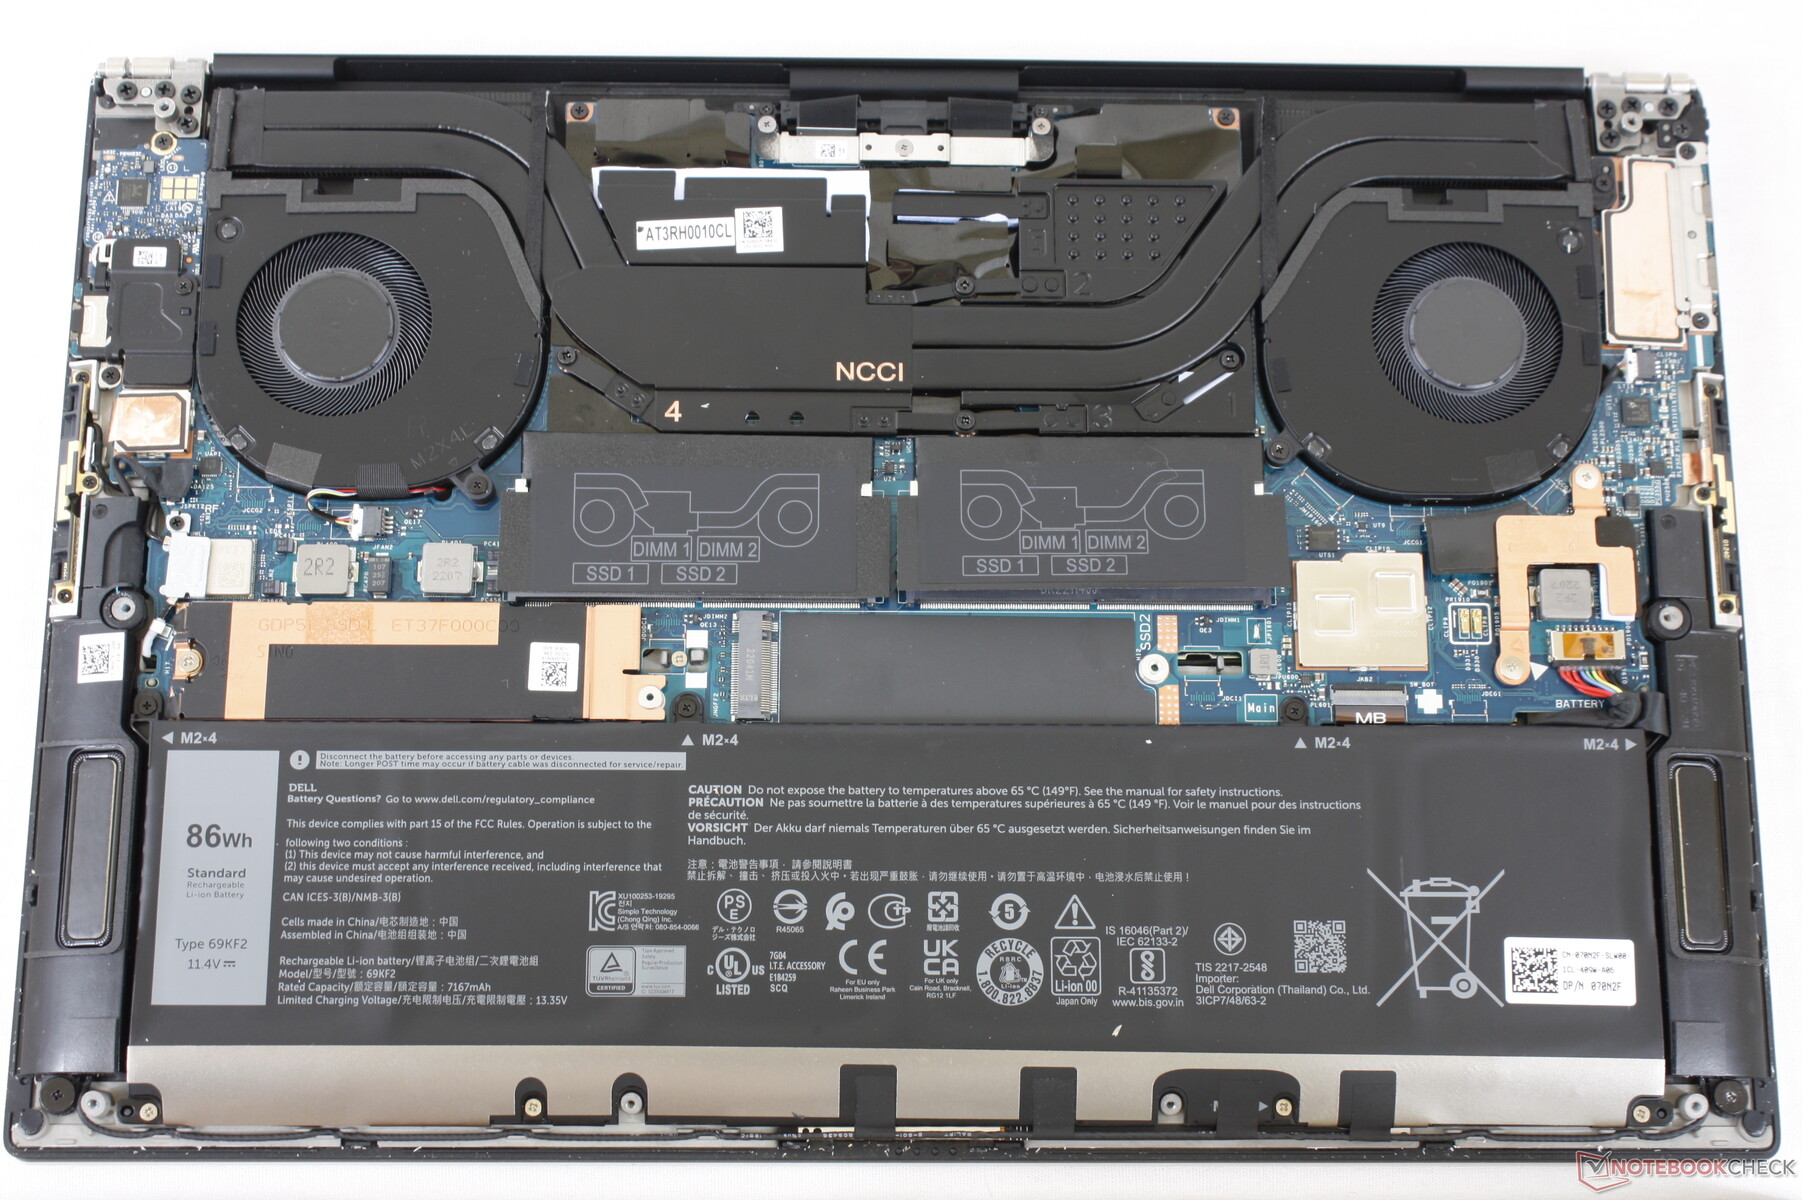
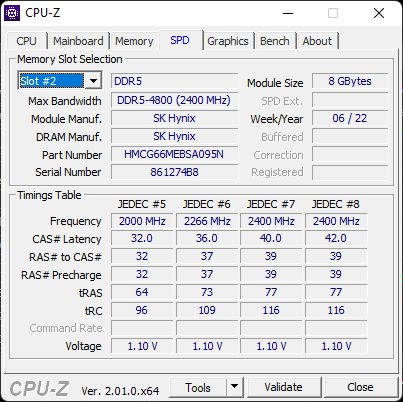
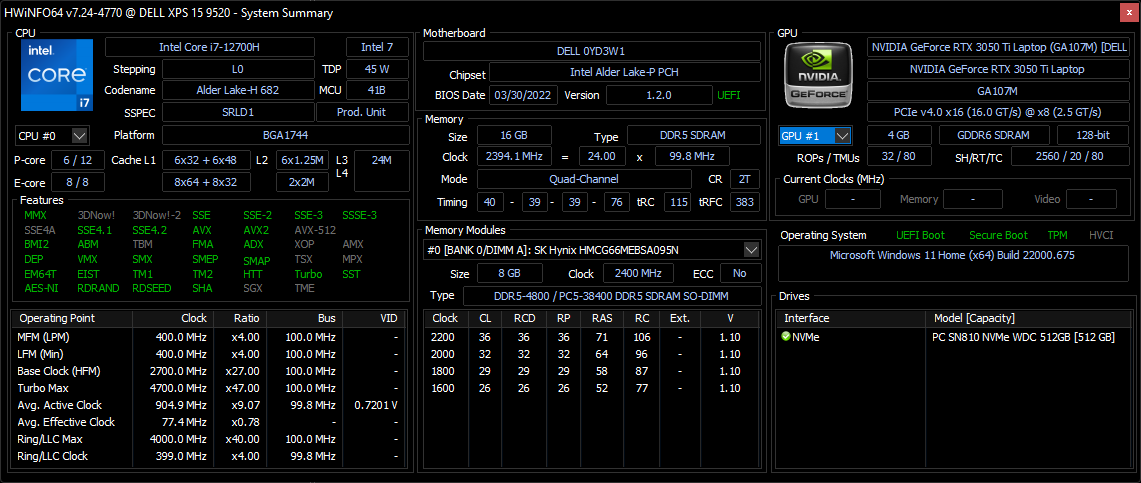
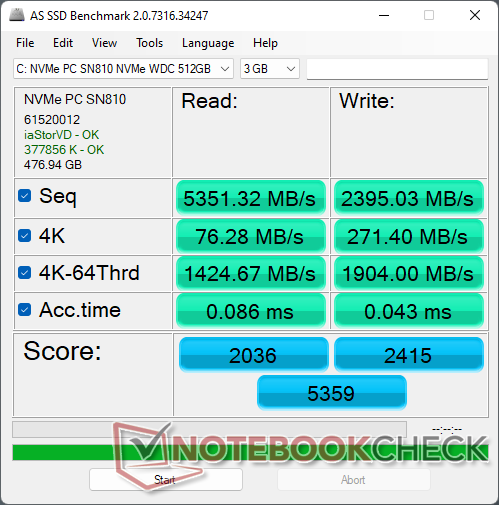
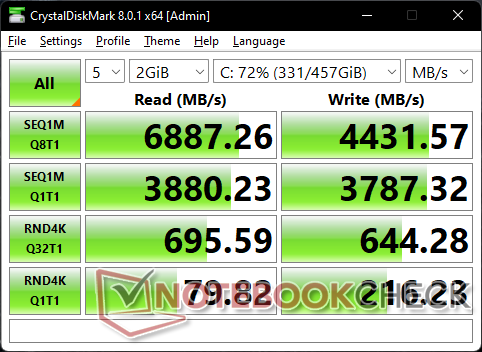
Onze testeenheid wordt geleverd met een PCIe4 x4 Western Digital SN810 NVMe SSD in tegenstelling tot de PCIe3 x4 oplossingen op oudere modellen. De overdrachtsnelheden zijn hierdoor aanzienlijk hoger, tot wel ~6700 MB/s, oftewel meer dan twee keer zo hoog als bij de meeste PCIe3-schijven. De SN810 in ons apparaat had geen problemen om zijn maximale overdrachtssnelheid gedurende langere perioden vast te houden wanneer hij werd belast onder DiskSpd om uitstekende warmteafvoer te suggereren.

* ... kleiner is beter
Disk Throttling: DiskSpd Read Loop, Queue Depth 8
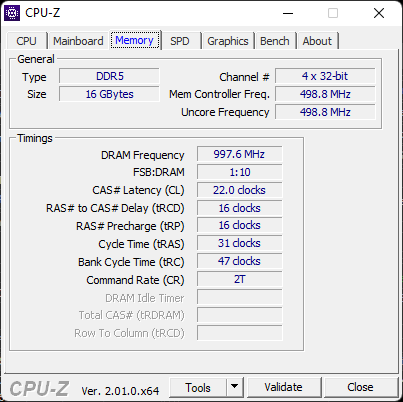
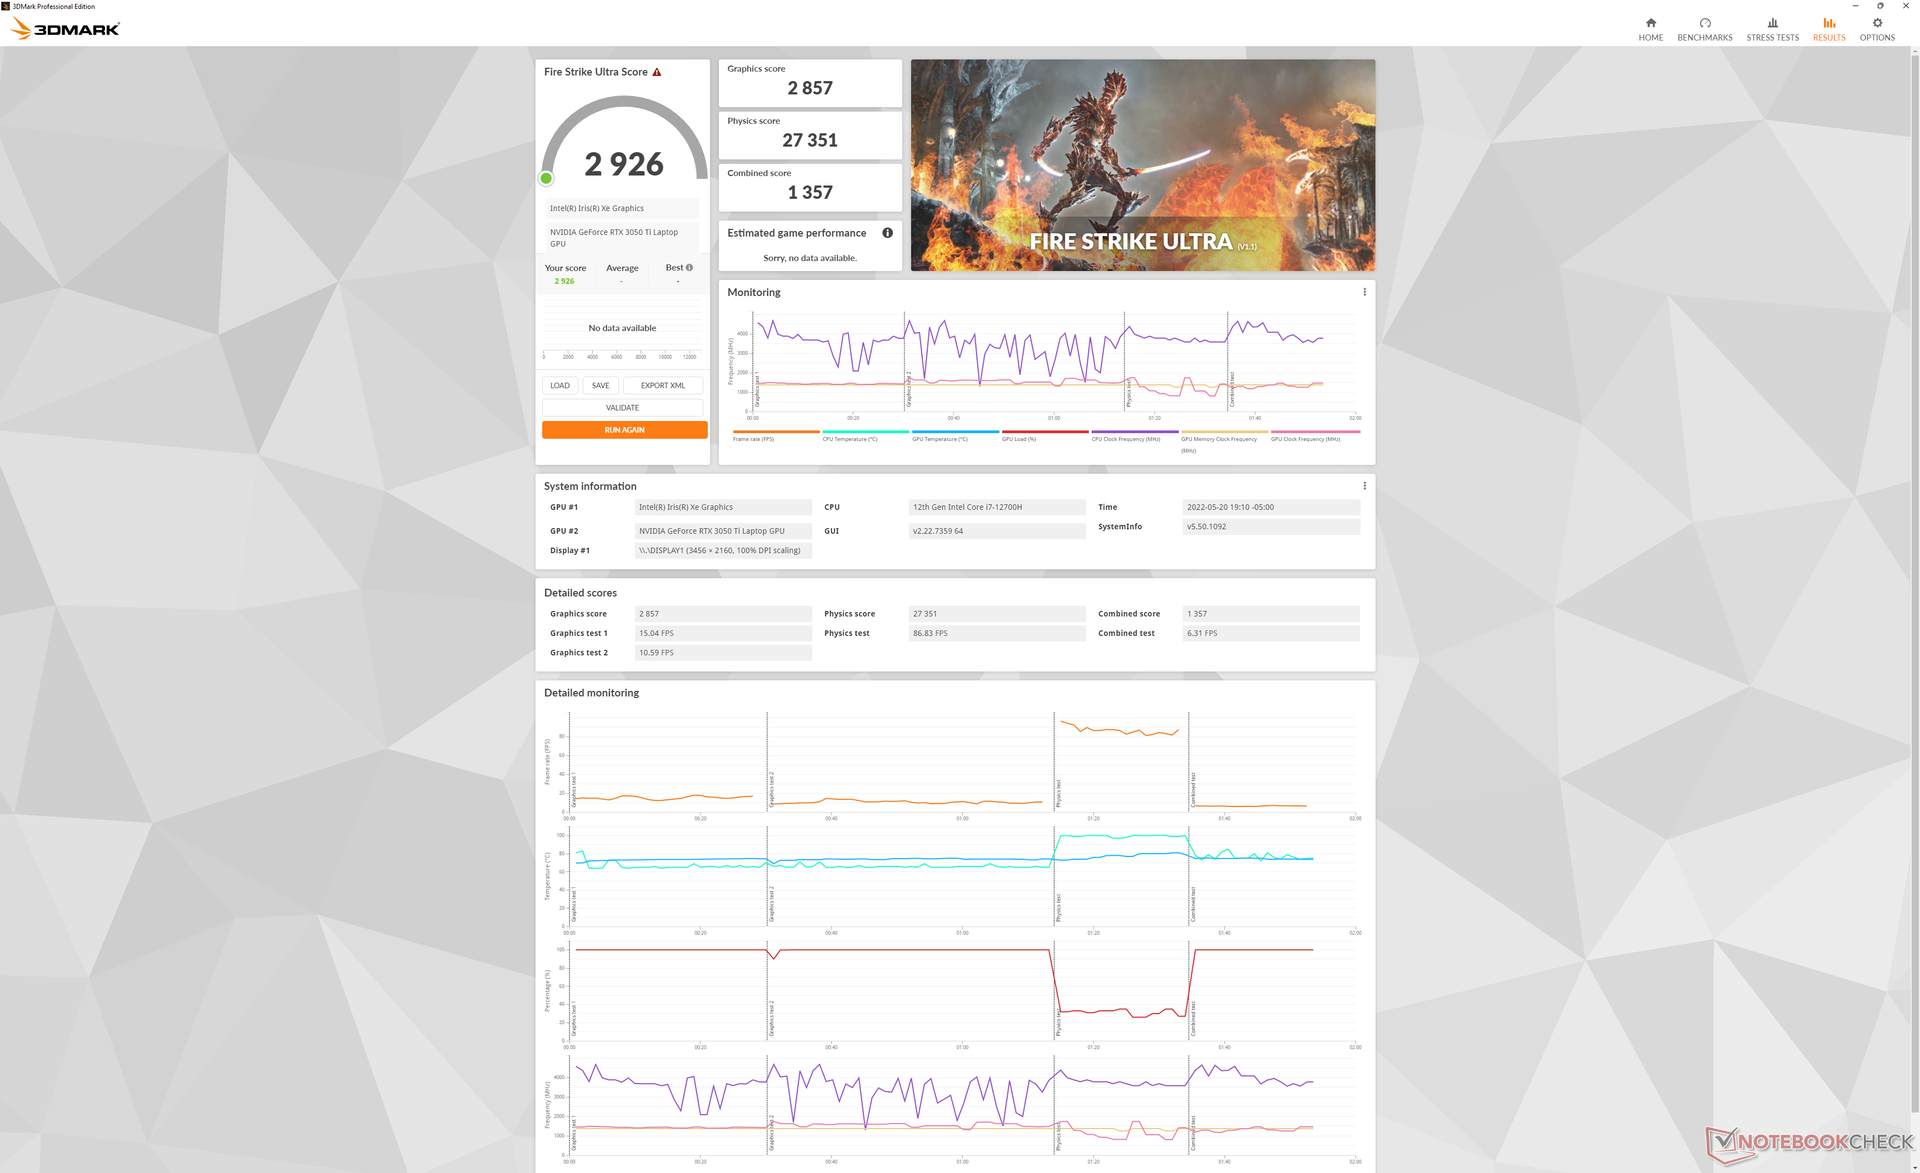
GPU-prestaties - GeForce RTX 3050 Ti voor het tweede jaar op rij
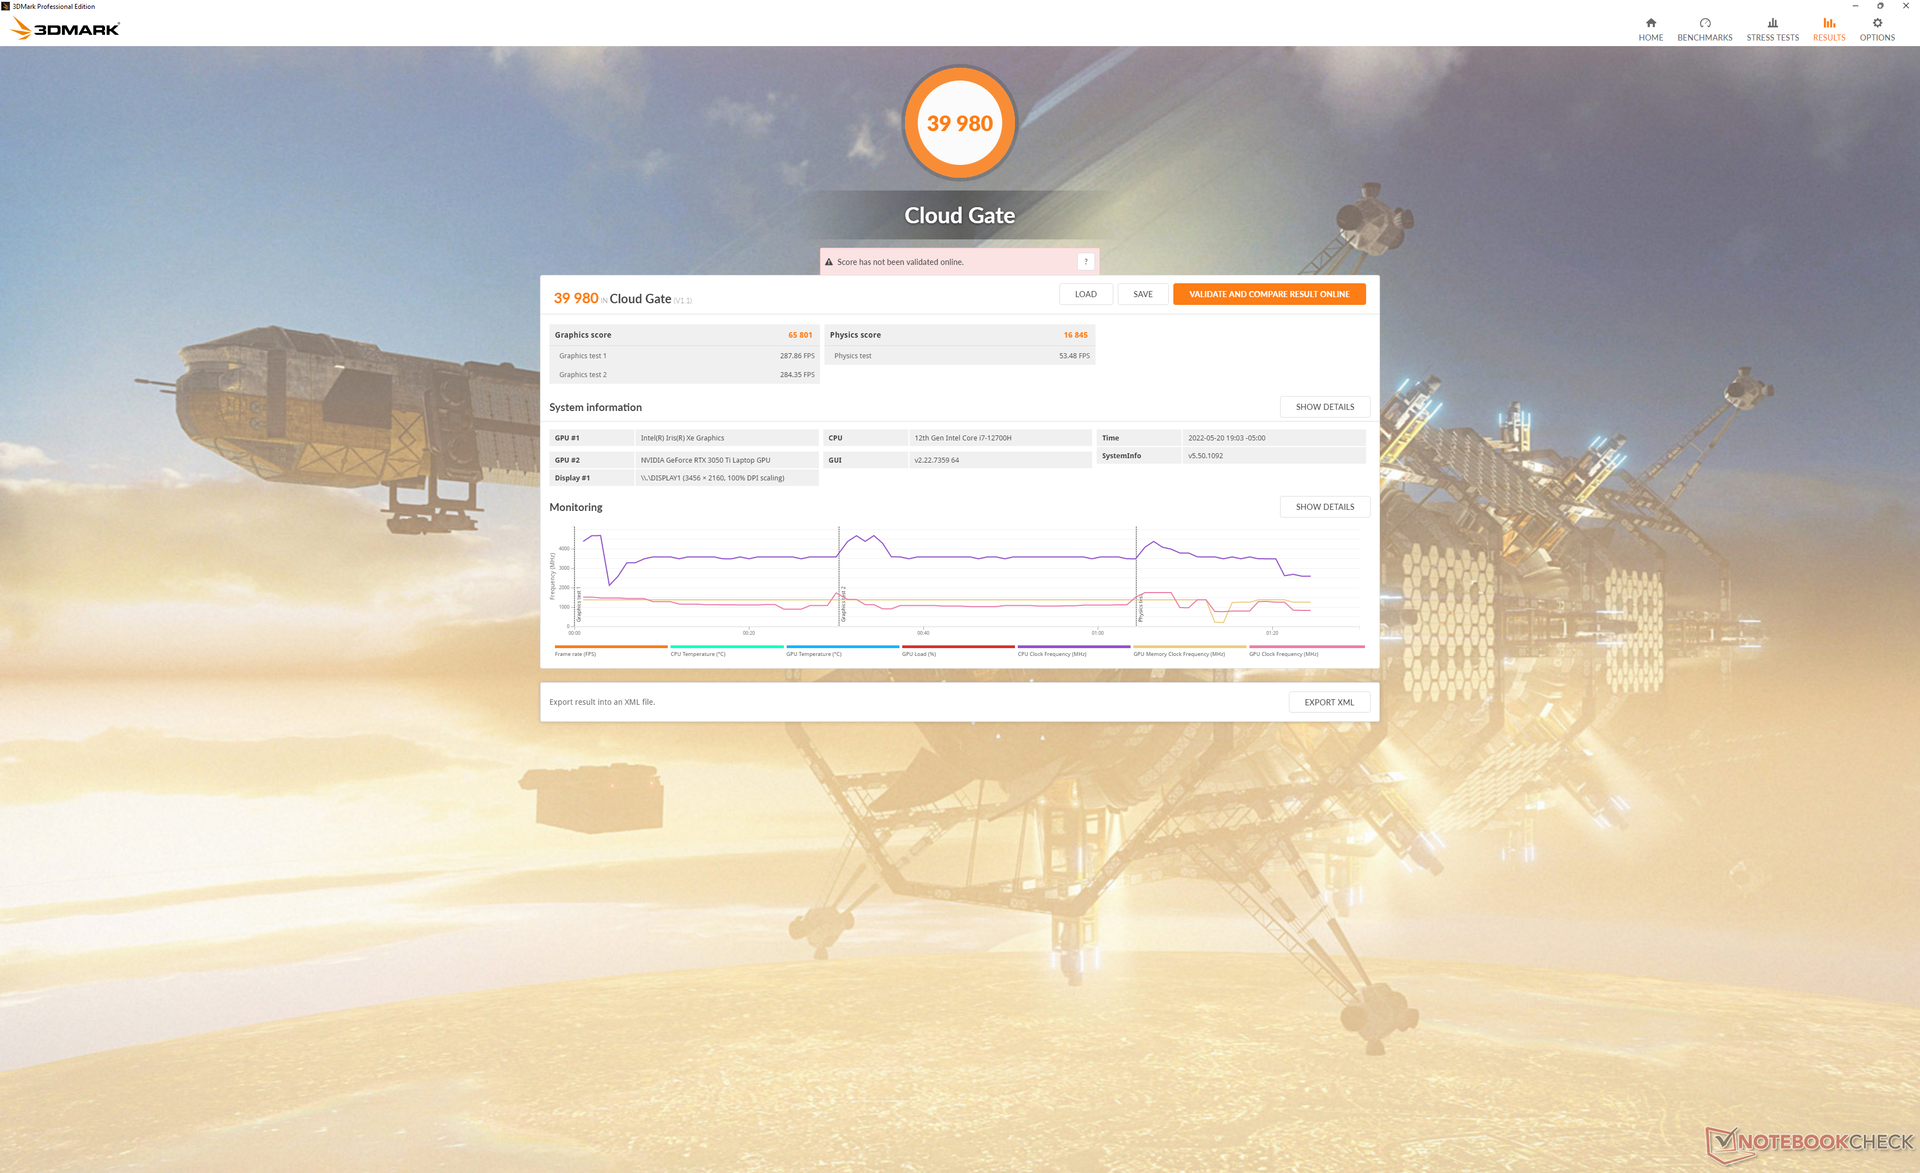
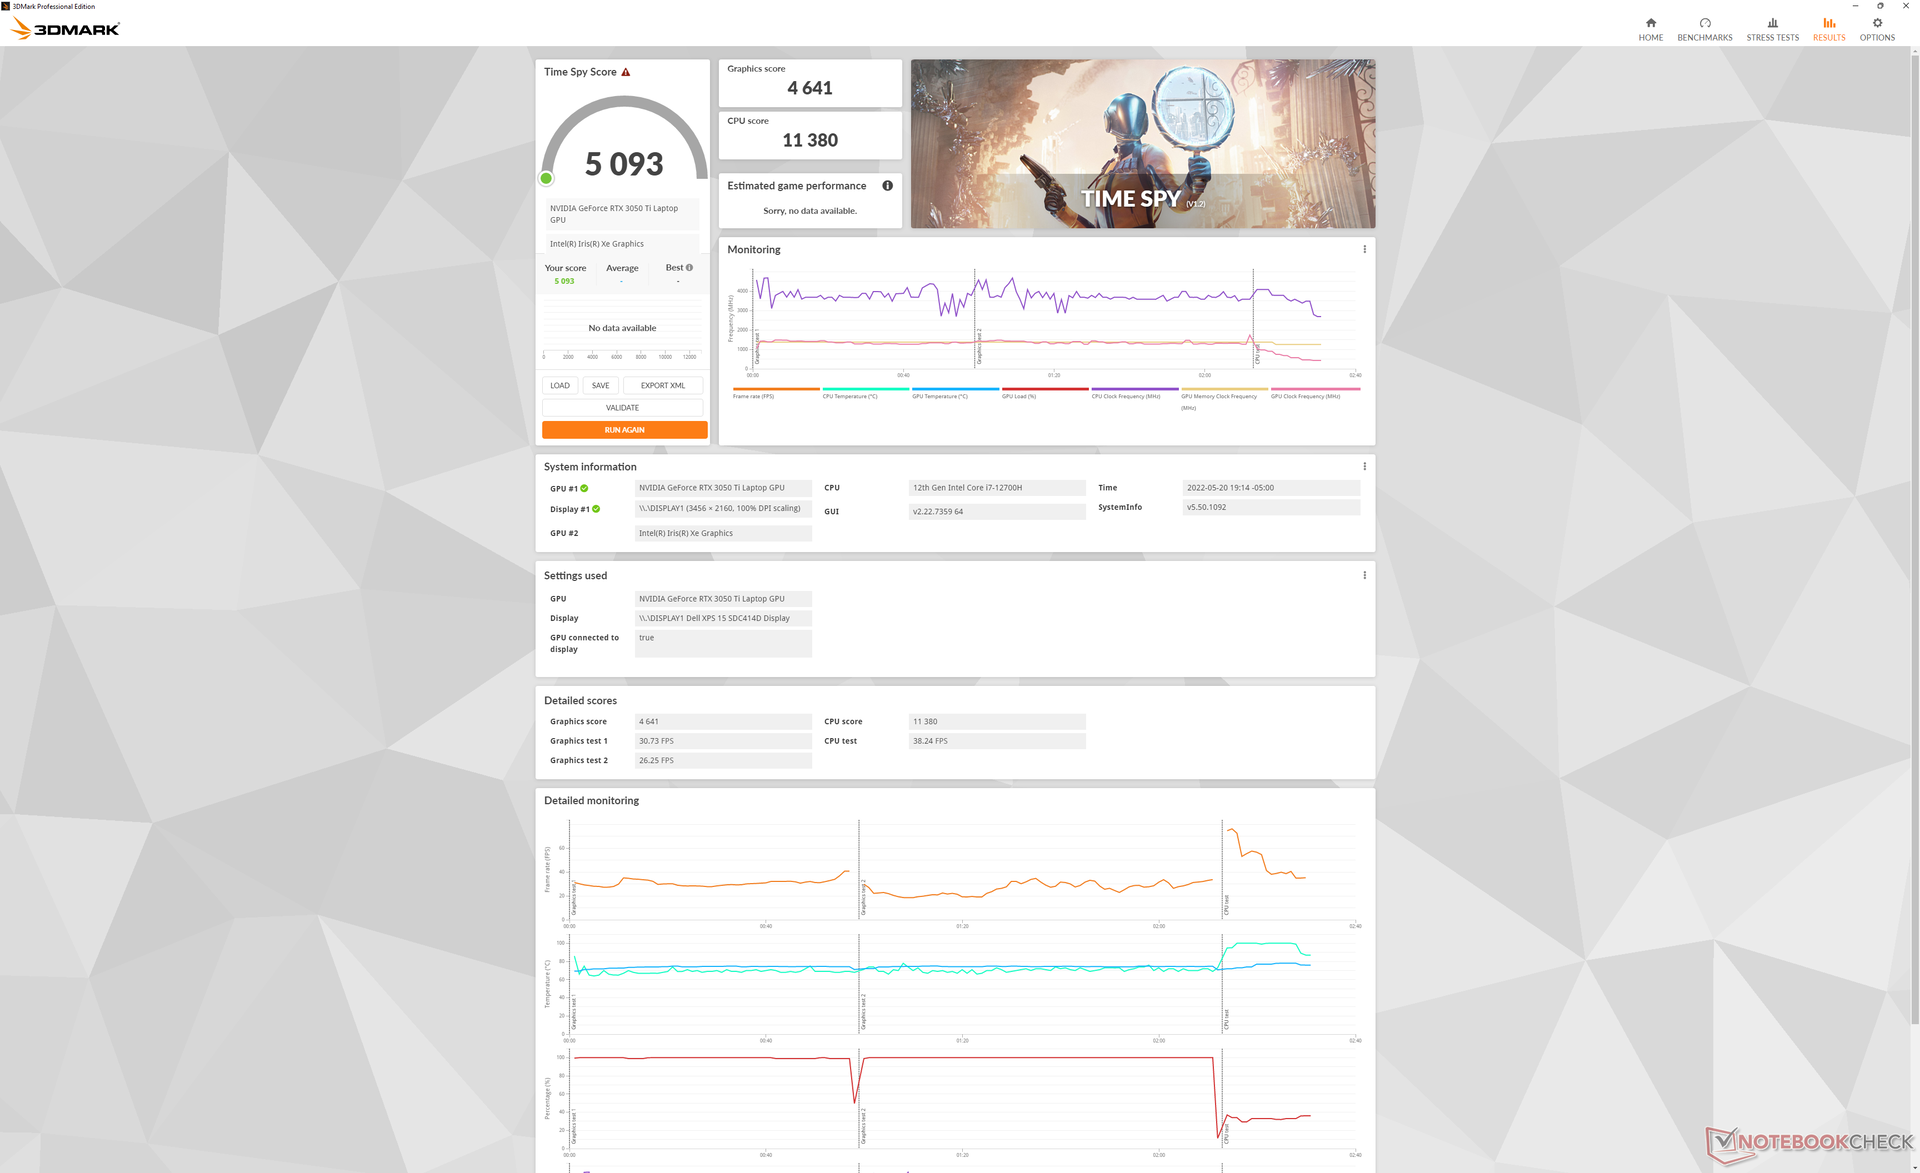
De XPS 15 9520 wordt geleverd met sneller RAM dan op de XPS 15 9510 (DDR5-4800 vs. DDR4-3200) wat zou moeten leiden tot iets snellere grafische prestaties. Helaas heeft Dell de GPU kloksnelheid verlaagd van 1530 MHz op de XPS 15 9510 naar 1035 MHz op de 9520, dus alle potentiële prestatieverbeteringen van het snellere RAM zijn teniet gedaan GeForce RTX 3050 Ti 3DMark resultaten tussen de XPS 15 9510 en 9520 zijn bijna identiek als gevolg hiervan.
Grafische prestaties blijven ongeveer 20 tot 30 procent sneller dan de GTX 1650 Ti op de oudere XPS 15 9500.
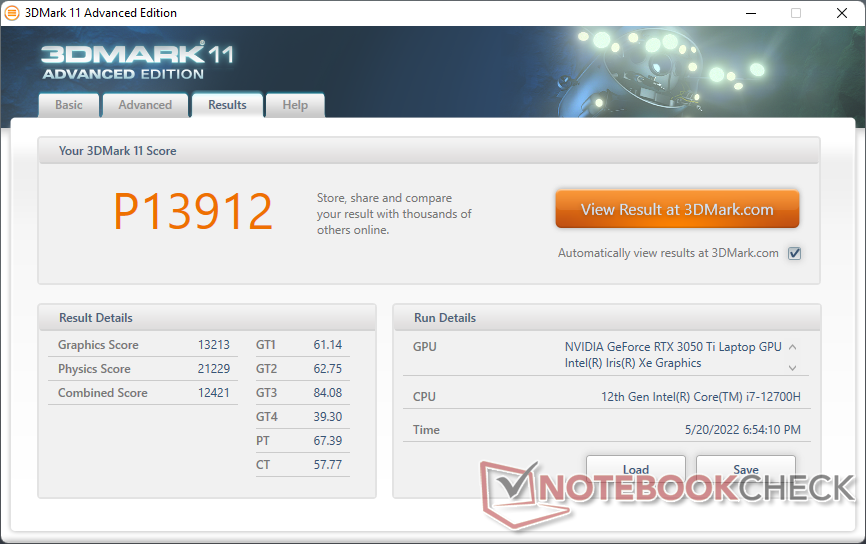
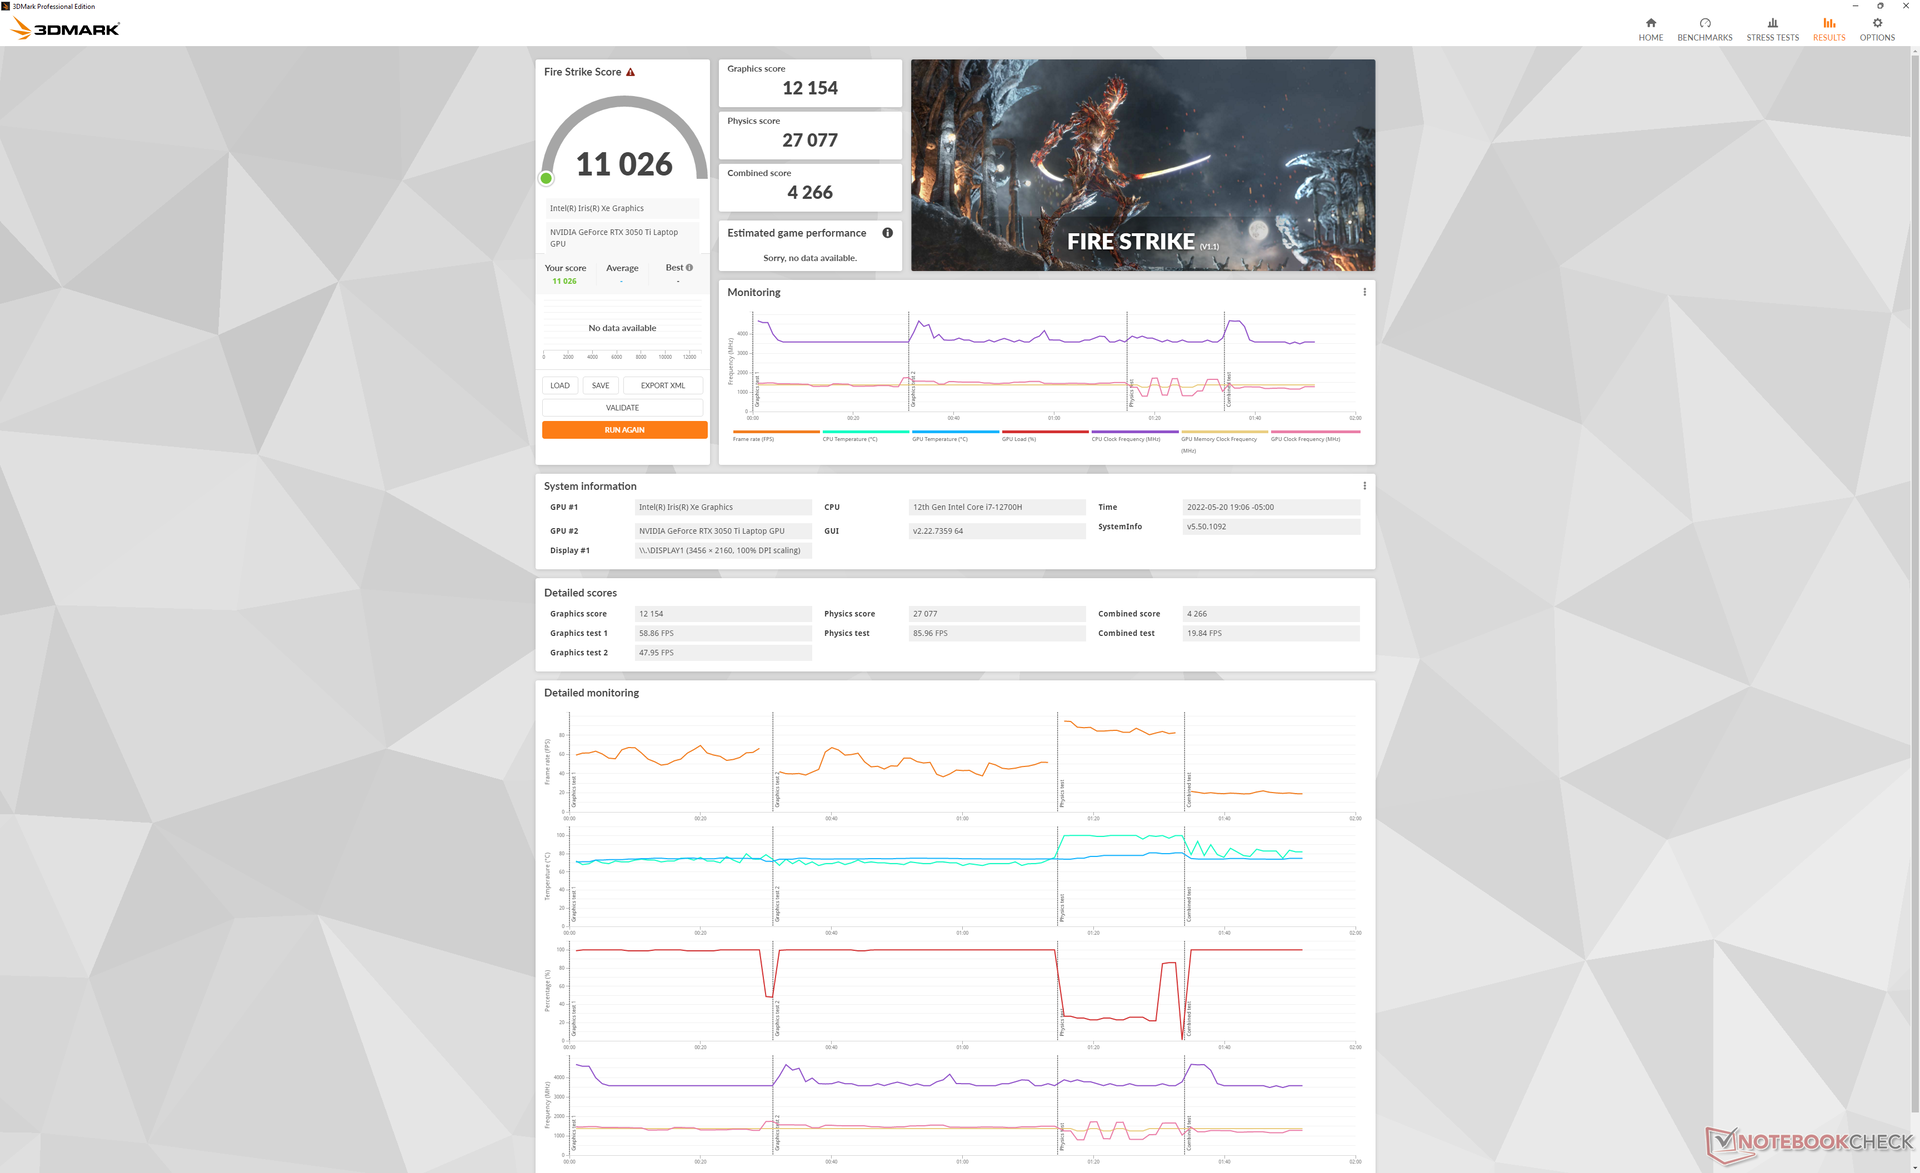
| 3DMark 11 Performance | 13912 punten | |
| 3DMark Cloud Gate Standard Score | 39980 punten | |
| 3DMark Fire Strike Score | 11026 punten | |
| 3DMark Time Spy Score | 5093 punten | |
Help | ||
Witcher 3 FPS Chart
| lage | gem. | hoge | ultra | QHD | 4K | |
| GTA V (2015) | 185 | 181.3 | 90.3 | 49.9 | 37.4 | |
| The Witcher 3 (2015) | 226.5 | 127.1 | 62.4 | 34.2 | ||
| Dota 2 Reborn (2015) | 180.3 | 166.1 | 116.1 | 104.5 | 47.1 | |
| Final Fantasy XV Benchmark (2018) | 106.6 | 62.9 | 45.7 | 34.1 | ||
| X-Plane 11.11 (2018) | 137.6 | 117 | 100.6 | 73.7 | ||
| Strange Brigade (2018) | 206 | 109.6 | 91.1 | 79.4 | 60.4 | |
| Cyberpunk 2077 1.6 (2022) | 59.4 | 47.4 | 39.3 | 39.5 | 20.2 |
Emissies
Systeemgeluid
Het geluid van de ventilatoren lijkt stiller te zijn dan bij de oudere XPS modellen wanneer ze worden blootgesteld aan vergelijkbare belastingen. Of, op zijn minst, duurt het iets langer voor de ventilatoren in de 9520 om op te trekken in toerental wanneer veeleisende belastingen worden geïntroduceerd. Tegen het einde van de eerste 3DMark 06 benchmark scene, bijvoorbeeld, zou het ventilatorgeluid slechts 31 dB(A) bedragen, vergeleken met 36 dB(A) en 46 dB(A) op respectievelijk de XPS 15 9510 en 9500. Het systeem is onder de meeste omstandigheden nog steeds stiller dan verwacht, zelfs wanneer het is ingesteld op de Ultra Performance modus.
Geluidsniveau
| Onbelast |
| 22.9 / 22.9 / 22.9 dB (A) |
| Belasting |
| 30.9 / 44.7 dB (A) |
 | ||
30 dB stil 40 dB(A) hoorbaar 50 dB(A) luid |
||
min: | ||
| Dell XPS 15 9520 RTX 3050 Ti GeForce RTX 3050 Ti Laptop GPU, i7-12700H, WDC PC SN810 512GB | Dell XPS 15 9510 11800H RTX 3050 Ti OLED GeForce RTX 3050 Ti Laptop GPU, i7-11800H, Micron 2300 512GB MTFDHBA512TDV | Dell XPS 15 9500 Core i7 4K UHD GeForce GTX 1650 Ti Mobile, i7-10875H, SK Hynix PC611 512GB | HP Spectre X360 15-5ZV31AV GeForce MX250, i7-10510U, Intel SSD 660p 2TB SSDPEKNW020T8 | Asus Zenbook Pro 15 OLED UM535Q GeForce RTX 3050 Ti Laptop GPU, R9 5900HX, WDC PC SN730 SDBPNTY-1T00 | MSI Stealth 15M A11SEK GeForce RTX 2060 Max-Q, i7-1185G7, WDC PC SN530 SDBPNPZ-1T00 | |
|---|---|---|---|---|---|---|
| Noise | -2% | -23% | -17% | -7% | -34% | |
| uit / omgeving * | 22.8 | 23.8 -4% | 28.4 -25% | 30.1 -32% | 22.8 -0% | 27.5 -21% |
| Idle Minimum * | 22.9 | 23.8 -4% | 28.4 -24% | 30.1 -31% | 22.9 -0% | 32.3 -41% |
| Idle Average * | 22.9 | 23.8 -4% | 28.4 -24% | 30.1 -31% | 22.9 -0% | 32.3 -41% |
| Idle Maximum * | 22.9 | 23.8 -4% | 28.4 -24% | 30.1 -31% | 22.9 -0% | 33.7 -47% |
| Load Average * | 30.9 | 36 -17% | 46 -49% | 30.1 3% | 33.2 -7% | 46.3 -50% |
| Witcher 3 ultra * | 37.8 | 36 5% | 42 -11% | 39.7 -5% | 47.3 -25% | 41.3 -9% |
| Load Maximum * | 44.7 | 38.2 15% | 47.1 -5% | 42 6% | 52.8 -18% | 56.2 -26% |
* ... kleiner is beter
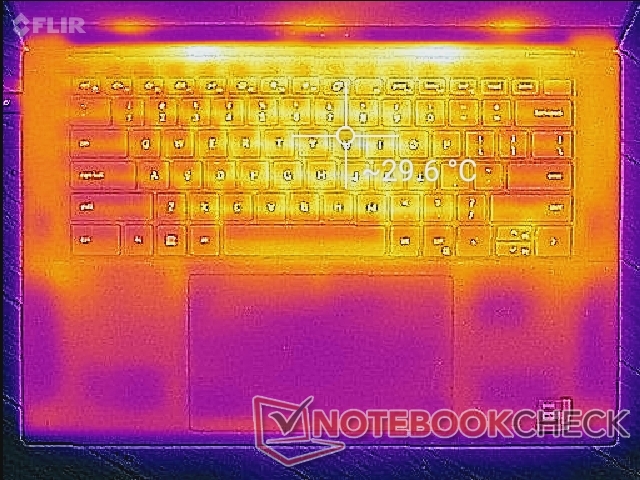
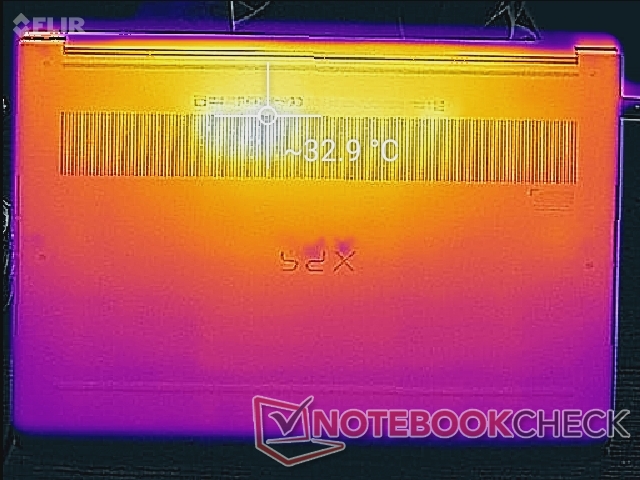
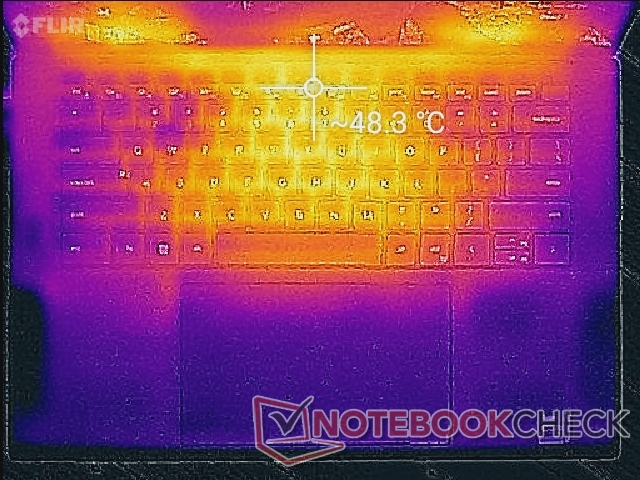
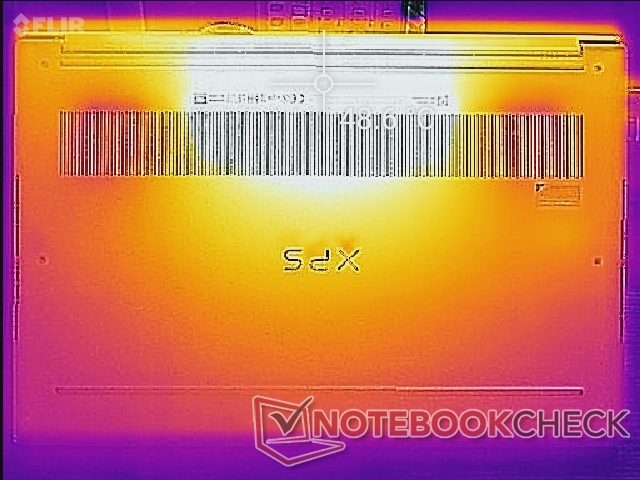
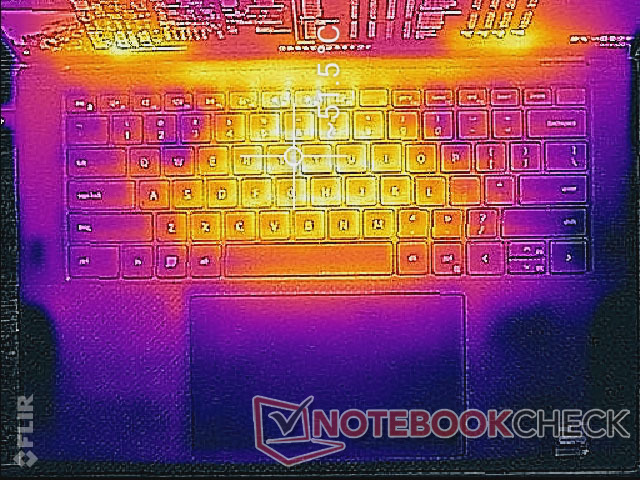
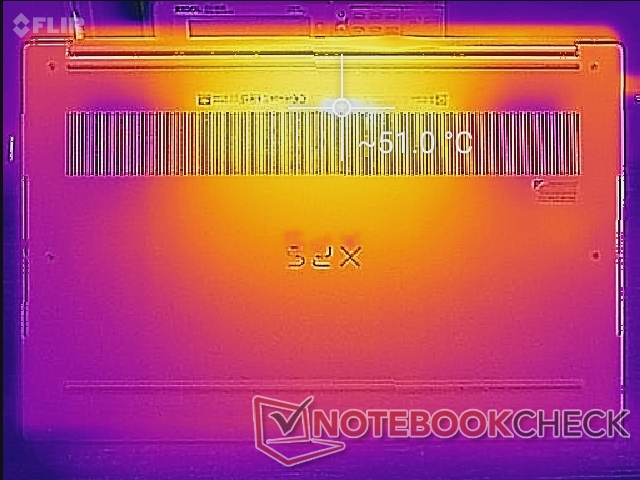
Temperatuur - iets warmer over het algemeen
De oppervlaktetemperaturen onder belasting zijn warmer dan wat we registreerden op de oudere XPS 15 9510 en 9500 modellen. Hete plekken kunnen 51 C tot 52 C bereiken aan de boven- en onderkant, respectievelijk, vergeleken met 44 C tot 47 C op elk van de vorige versies. Hotspots op concurrenten zoals de Zenbook Pro 15 OLED zijn een paar graden C koeler wanneer ze onder vergelijkbare omstandigheden worden gebruikt. De XPS 9520 is per slot van rekening een van de kleinste 15,6-inch laptops met Core H-motor op de markt.
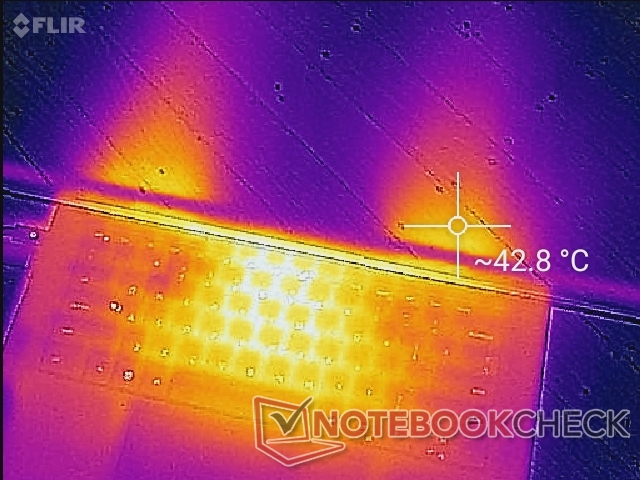
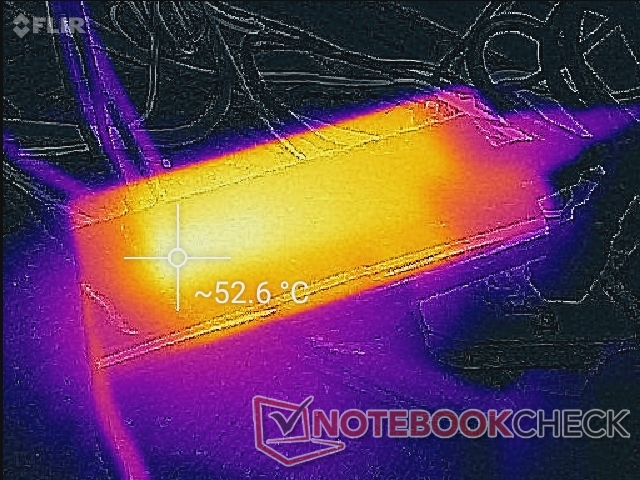
(-) De maximumtemperatuur aan de bovenzijde bedraagt 51.4 °C / 125 F, vergeleken met het gemiddelde van 36.9 °C / 98 F, variërend van 21.1 tot 71 °C voor de klasse Multimedia.
(-) De bodem warmt op tot een maximum van 51 °C / 124 F, vergeleken met een gemiddelde van 39.1 °C / 102 F
(+) Bij onbelast gebruik bedraagt de gemiddelde temperatuur voor de bovenzijde 27.8 °C / 82 F, vergeleken met het apparaatgemiddelde van 31.2 °C / 88 F.
(±) Bij het spelen van The Witcher 3 is de gemiddelde temperatuur voor de bovenzijde 35.2 °C / 95 F, vergeleken met het apparaatgemiddelde van 31.2 °C / 88 F.
(+) De palmsteunen en het touchpad zijn met een maximum van ###max## °C / 88.9 F koeler dan de huidtemperatuur en voelen daarom koel aan.
(-) De gemiddelde temperatuur van de handpalmsteun van soortgelijke toestellen bedroeg 28.8 °C / 83.8 F (-2.8 °C / -5.1 F).
| Dell XPS 15 9520 RTX 3050 Ti Intel Core i7-12700H, NVIDIA GeForce RTX 3050 Ti Laptop GPU | Dell XPS 15 9510 11800H RTX 3050 Ti OLED Intel Core i7-11800H, NVIDIA GeForce RTX 3050 Ti Laptop GPU | Dell XPS 15 9500 Core i7 4K UHD Intel Core i7-10875H, NVIDIA GeForce GTX 1650 Ti Mobile | HP Spectre X360 15-5ZV31AV Intel Core i7-10510U, NVIDIA GeForce MX250 | Asus Zenbook Pro 15 OLED UM535Q AMD Ryzen 9 5900HX, NVIDIA GeForce RTX 3050 Ti Laptop GPU | MSI Stealth 15M A11SEK Intel Core i7-1185G7, NVIDIA GeForce RTX 2060 Max-Q | |
|---|---|---|---|---|---|---|
| Heat | 13% | 3% | 17% | -1% | 10% | |
| Maximum Upper Side * | 51.4 | 45.5 11% | 44 14% | 47 9% | 36 30% | 47.2 8% |
| Maximum Bottom * | 51 | 44.2 13% | 48.8 4% | 47.4 7% | 47.2 7% | 47.4 7% |
| Idle Upper Side * | 30 | 27 10% | 33 -10% | 22.8 24% | 37 -23% | 27.2 9% |
| Idle Bottom * | 33 | 26.7 19% | 32.4 2% | 23.6 28% | 39.2 -19% | 28.2 15% |
* ... kleiner is beter
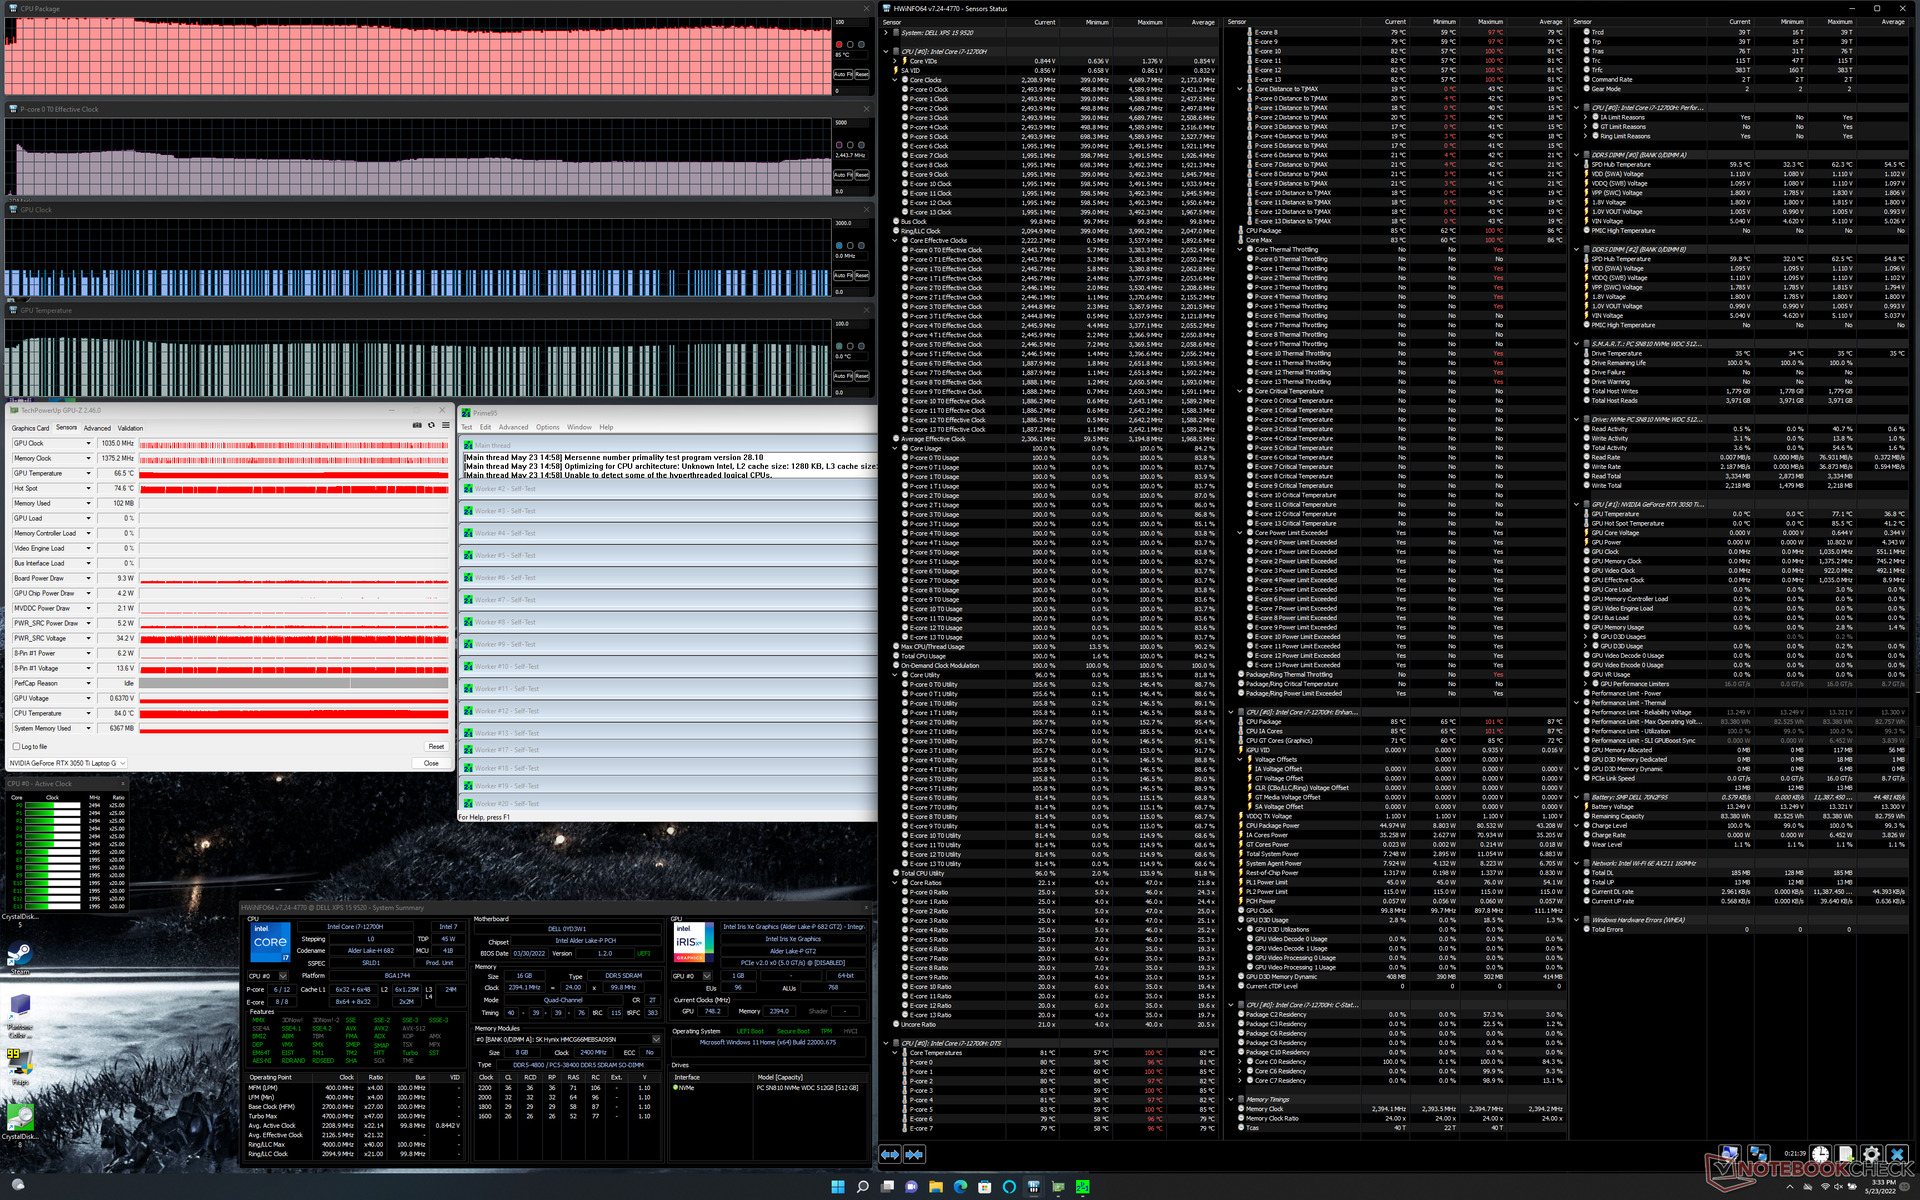
Stresstest
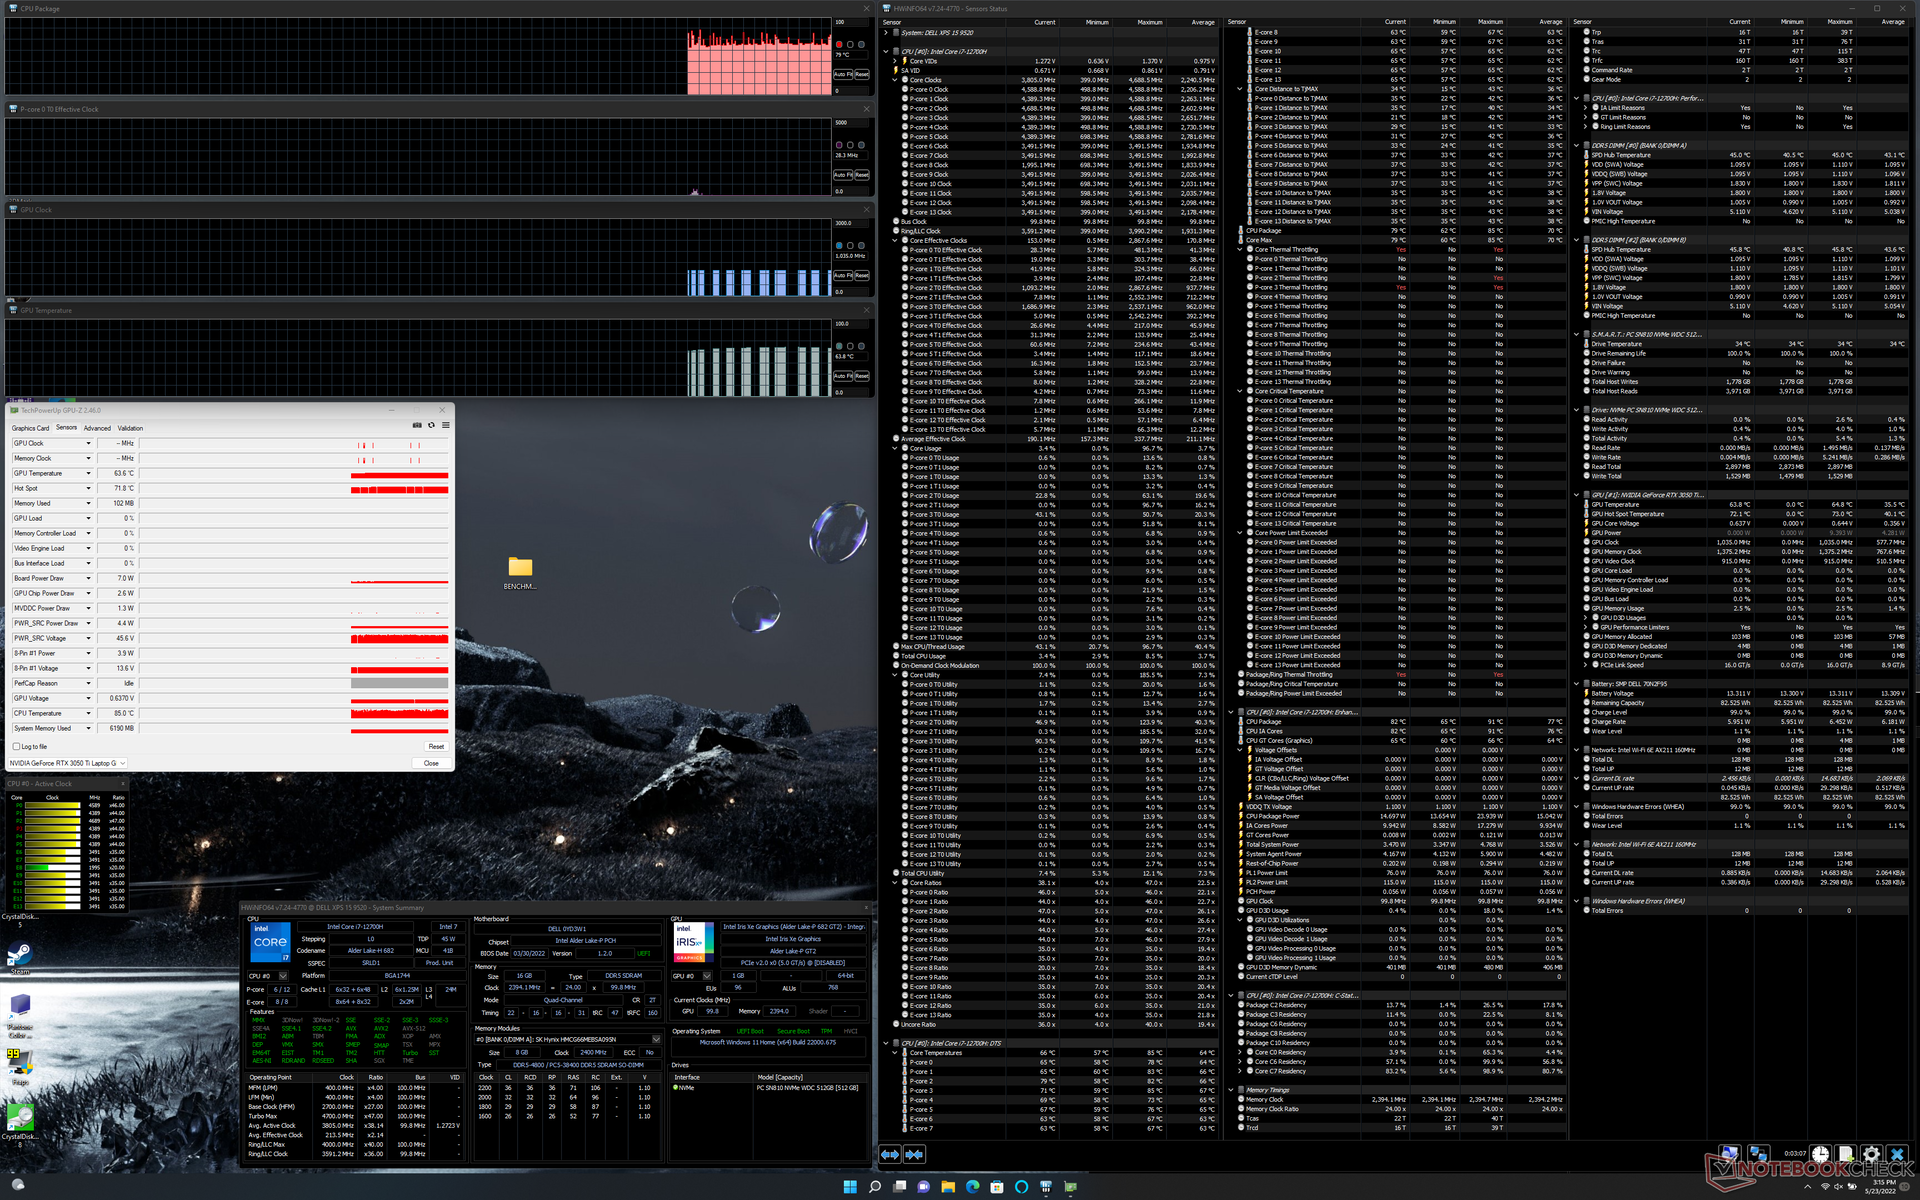
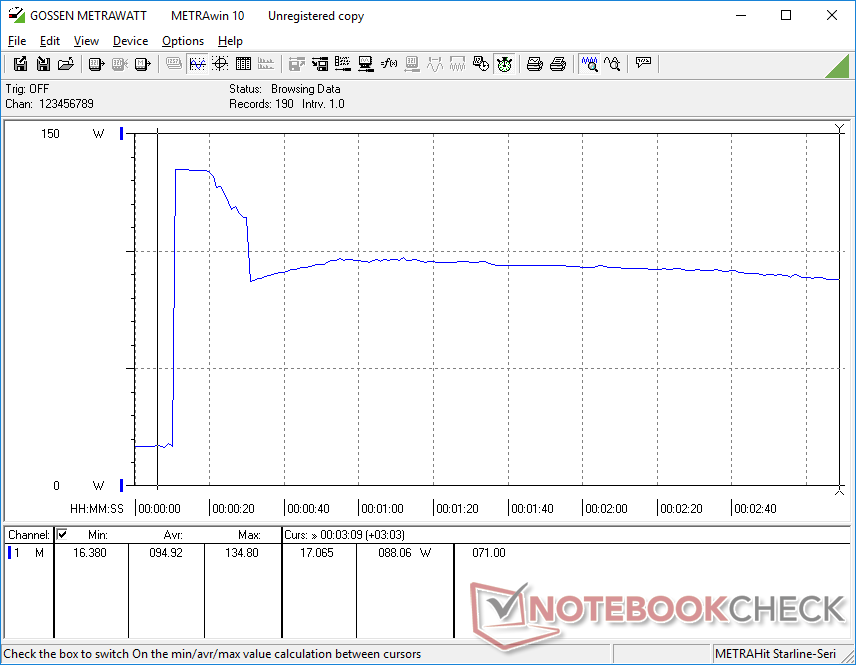
Wanneer de CPU wordt belast onder Prime95, zal deze de eerste 10 seconden een boost geven van 81 W, 100 C en 3,3 GHz, voordat deze snel daalt en stabiliseert op 45 W, 85 C en 2,5 GHz, om de temperatuur onder controle te houden. Het uitvoeren van dezelfde test op de XPS 15 9500 zou resulteren in een stabiele CPU temperatuur van 73 C in vergelijking. Het lijkt er dus op dat de XPS 15 9520 warmer draait dan zijn voorgangers om meer processorprestaties te halen uit hetzelfde algehele chassisontwerp.
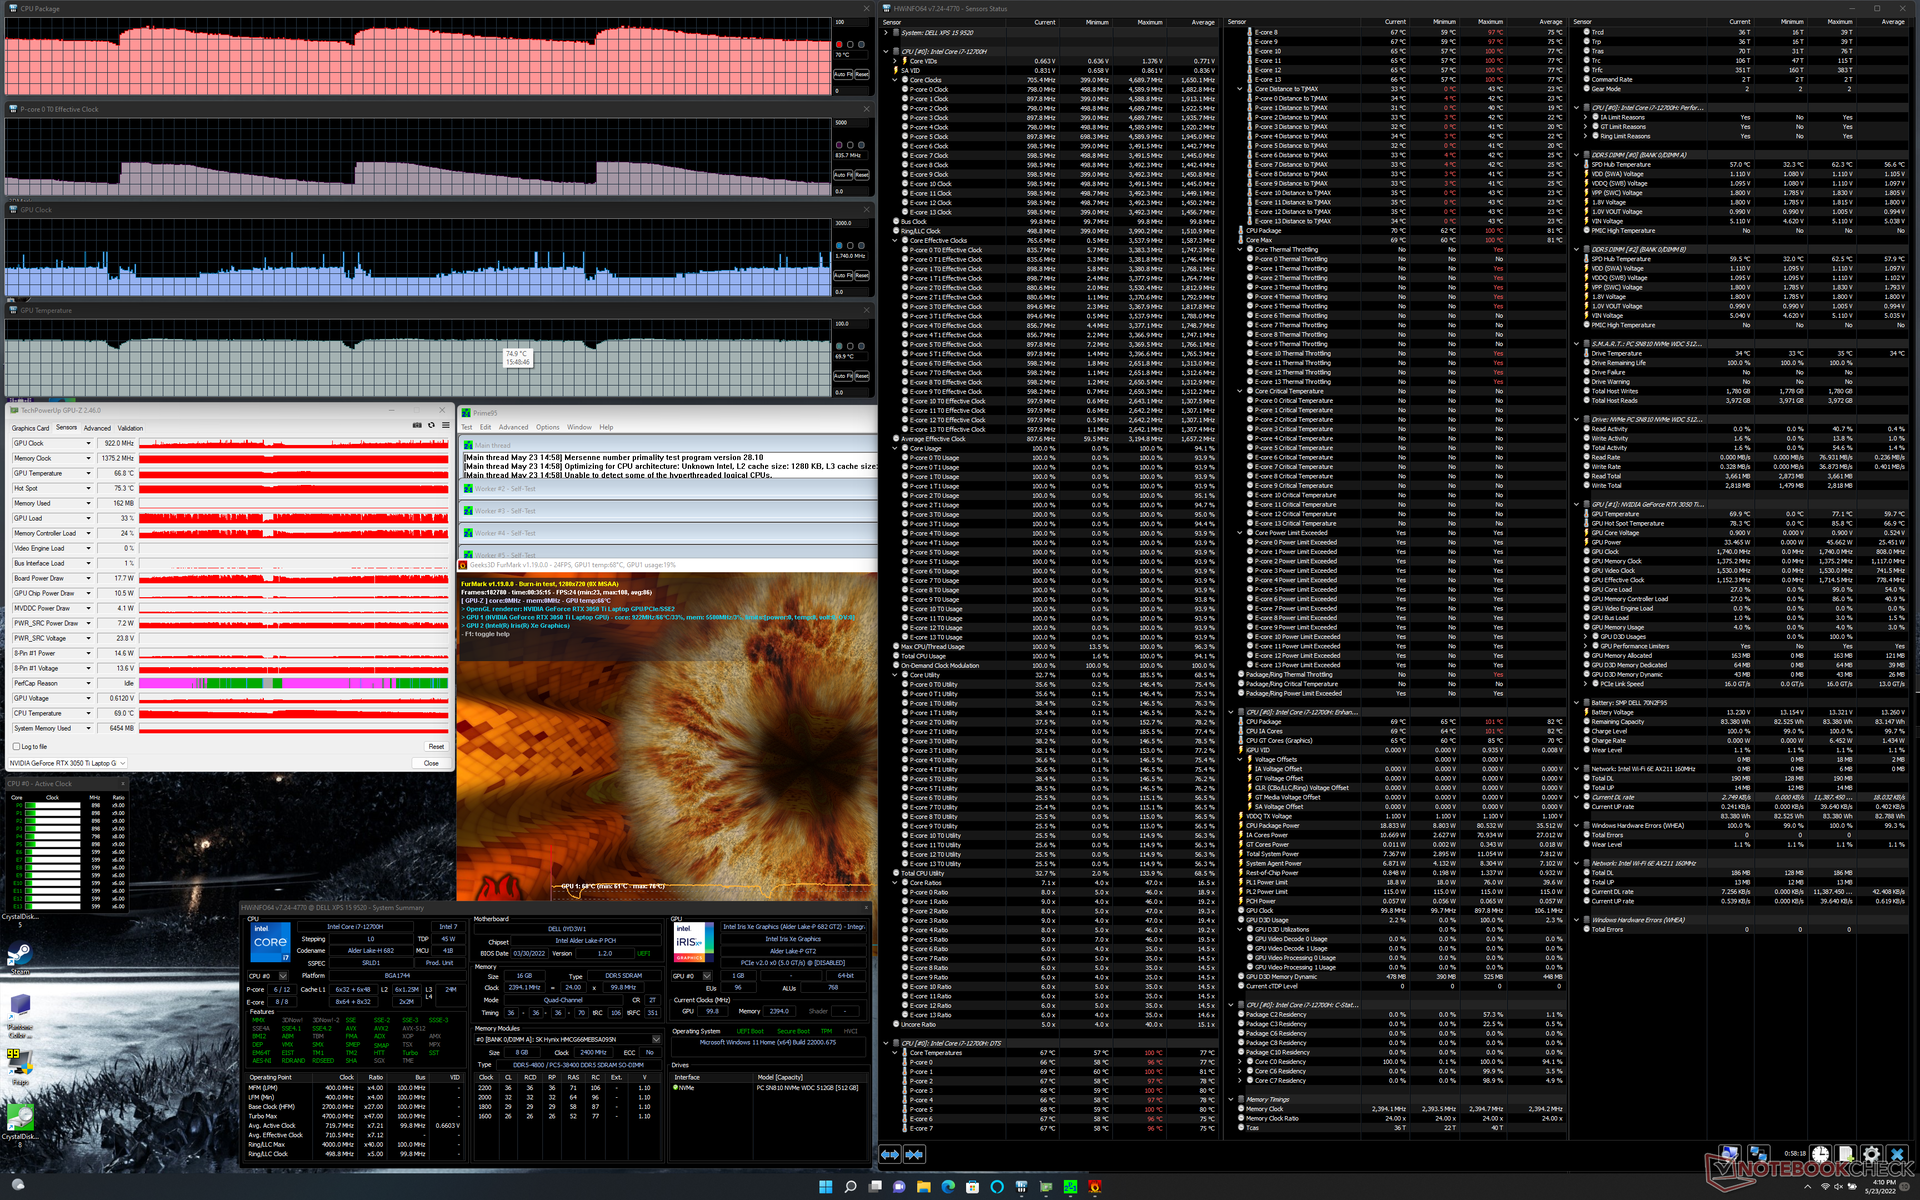
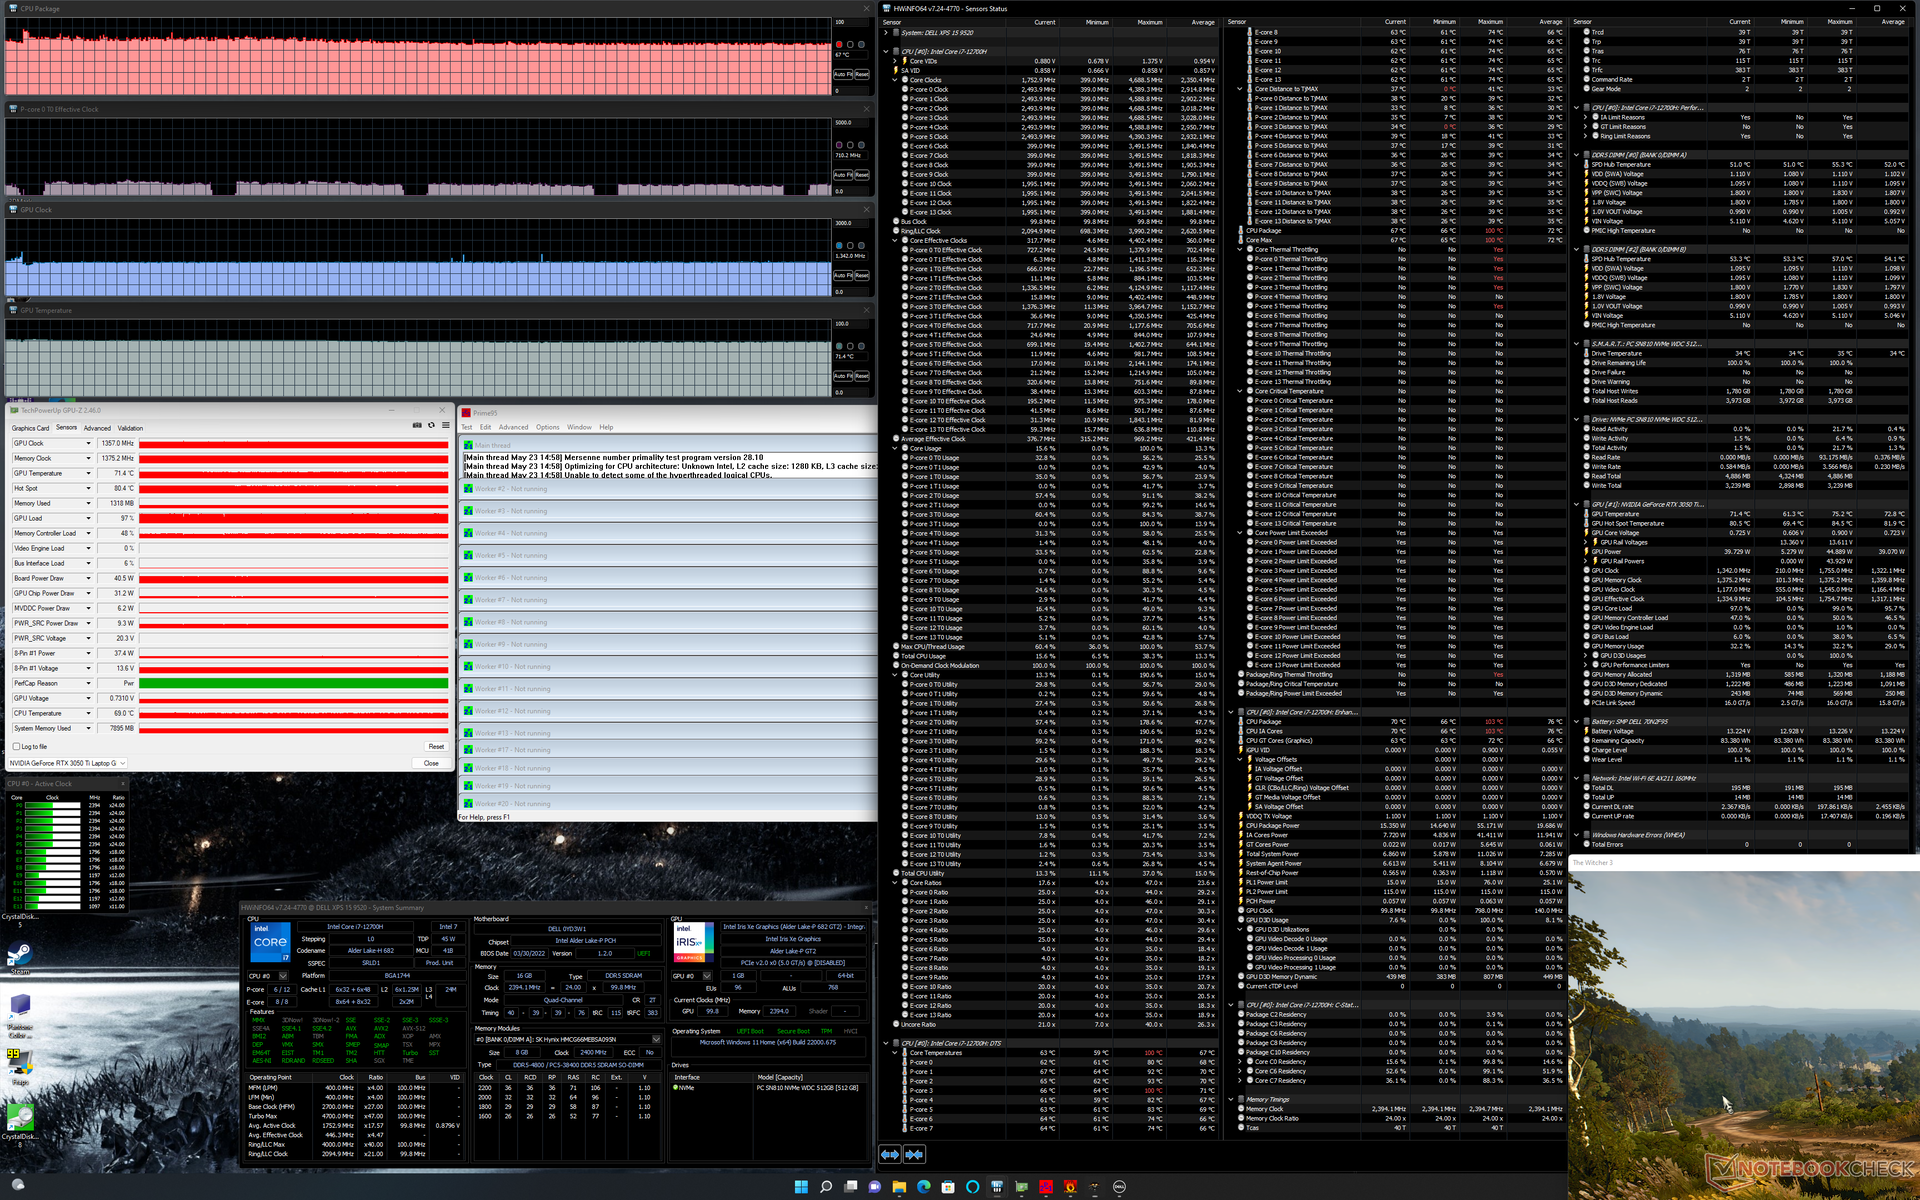
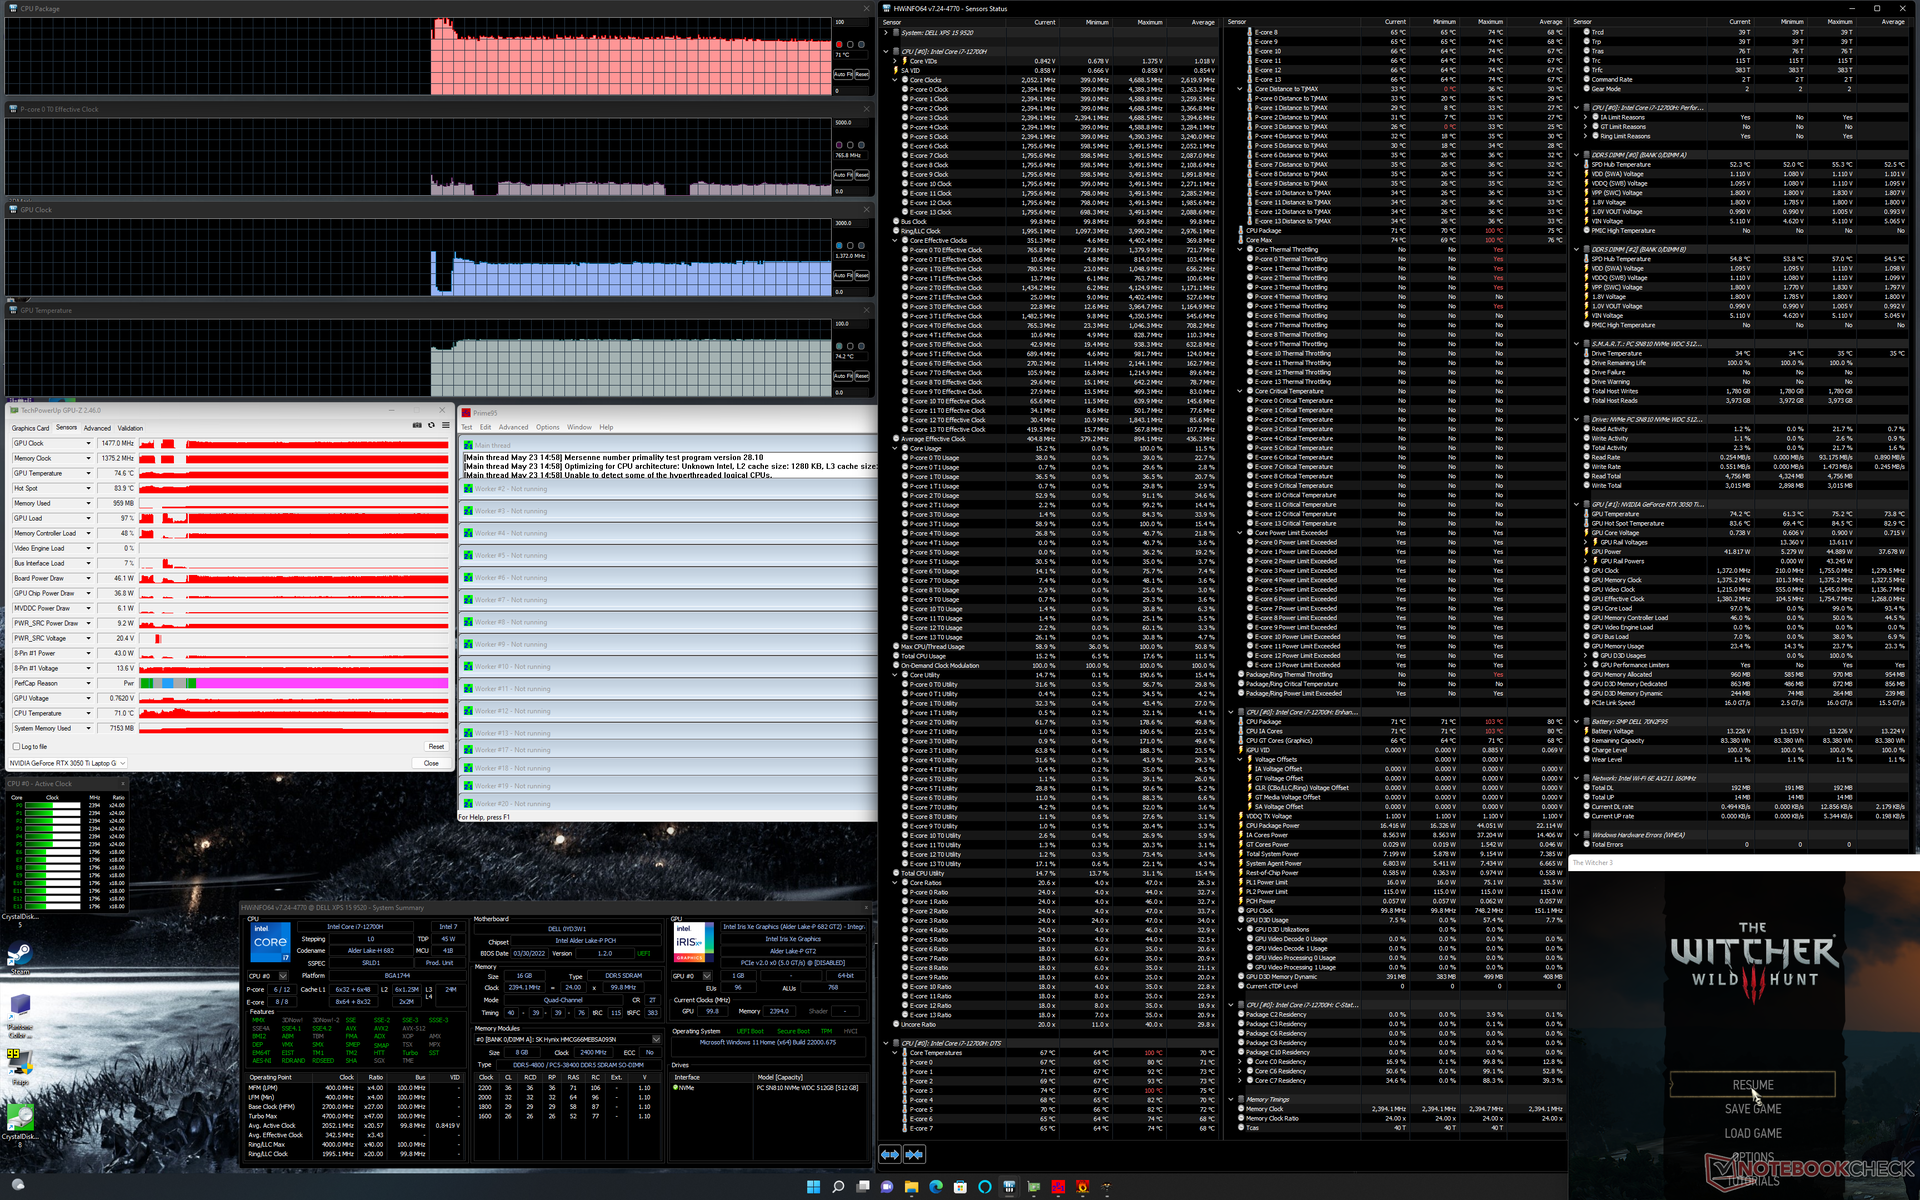
GPU kloksnelheden, stroomverbruik en temperatuur zouden stabiliseren op respectievelijk 1477 MHz, 46 W en 74 C, wanneer Witcher 3 in de Ultra Performance-modus. Uitvoeren in de geoptimaliseerde modus resulteert in iets lagere kloksnelheden en temperaturen, zoals blijkt uit de tabel hieronder, en een lager energieverbruik van 41 W. Gebruikers moeten het systeem in de Ultra Performance-modus zetten als ze zoveel mogelijk prestaties uit de GPU willen halen. Het uitvoeren van dezelfde test op de XPS 15 9500 met de langzamere GeForce GTX 1650 Ti zou resulteren in vergelijkbare CPU- en GPU-temperaturen.
Werken op batterijvoeding beperkt de prestaties. Een Fire Strike test op batterijen zou een Physics en Graphics score opleveren van respectievelijk 9450 en 8332 punten, vergeleken met 27077 en 12154 punten op netstroom.
| CPU Klok (GHz) | GPU Klok (MHz) | Gemiddelde CPU Temperatuur (°C) | Gemiddelde GPU Temperatuur (°C) | |
| Systeem in rusttoestand | -- | -- | 79 | 64 |
| Prime95 Stress | 2.4 | 85 | -- | 67 |
| Prime95 + FurMark Stress | 0.8 - 2.3 | 700 - 1100 | 79 - 86 | 62 - 75 |
| Witcher 3 Stress(gebalanceerde modus) | 0.7 | 1357 | 67 | 71 |
| Witcher 3 Stress(prestatiemodus) | 0.8 | 1477 | 71 | 74 |
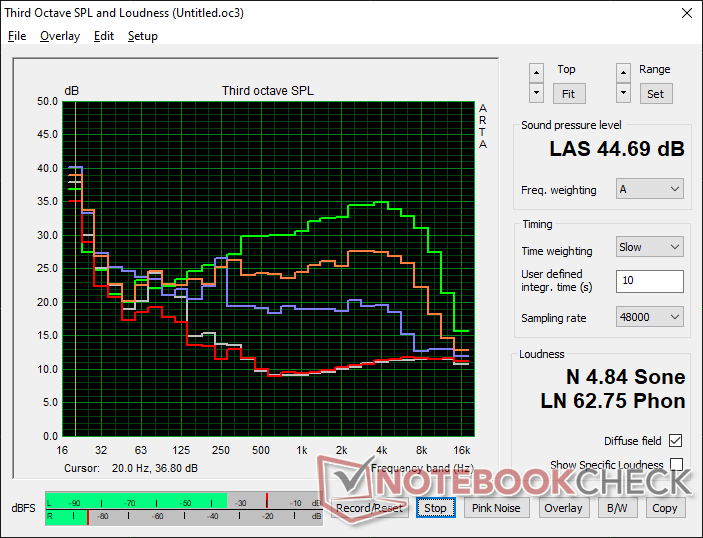
Sprekers
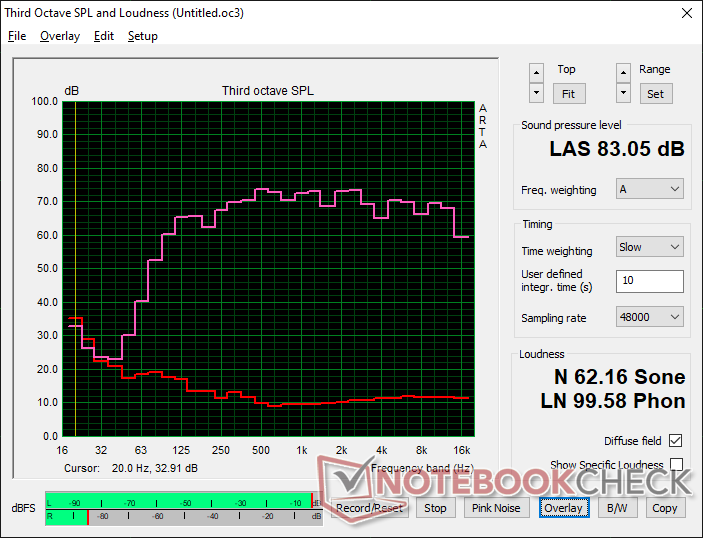
Dell XPS 15 9520 RTX 3050 Ti audioanalyse
(+) | luidsprekers kunnen relatief luid spelen (83.1 dB)
Bas 100 - 315 Hz
(+) | goede baars - slechts 4.4% verwijderd van de mediaan
(+) | de lage tonen zijn lineair (6.8% delta naar de vorige frequentie)
Mids 400 - 2000 Hz
(+) | evenwichtige middens - slechts 2.6% verwijderd van de mediaan
(+) | de middentonen zijn lineair (4.1% delta ten opzichte van de vorige frequentie)
Hoog 2 - 16 kHz
(+) | evenwichtige hoogtepunten - slechts 1.9% verwijderd van de mediaan
(+) | de hoge tonen zijn lineair (5.4% delta naar de vorige frequentie)
Algemeen 100 - 16.000 Hz
(+) | het totale geluid is lineair (6.4% verschil met de mediaan)
Vergeleken met dezelfde klasse
» 2% van alle geteste apparaten in deze klasse waren beter, 1% vergelijkbaar, 97% slechter
» De beste had een delta van 5%, het gemiddelde was 18%, de slechtste was 45%
Vergeleken met alle geteste toestellen
» 0% van alle geteste apparaten waren beter, 0% gelijk, 99% slechter
» De beste had een delta van 4%, het gemiddelde was 25%, de slechtste was 134%
Apple MacBook Pro 16 2021 M1 Pro audioanalyse
(+) | luidsprekers kunnen relatief luid spelen (84.7 dB)
Bas 100 - 315 Hz
(+) | goede baars - slechts 3.8% verwijderd van de mediaan
(+) | de lage tonen zijn lineair (5.2% delta naar de vorige frequentie)
Mids 400 - 2000 Hz
(+) | evenwichtige middens - slechts 1.3% verwijderd van de mediaan
(+) | de middentonen zijn lineair (2.1% delta ten opzichte van de vorige frequentie)
Hoog 2 - 16 kHz
(+) | evenwichtige hoogtepunten - slechts 1.9% verwijderd van de mediaan
(+) | de hoge tonen zijn lineair (2.7% delta naar de vorige frequentie)
Algemeen 100 - 16.000 Hz
(+) | het totale geluid is lineair (4.6% verschil met de mediaan)
Vergeleken met dezelfde klasse
» 0% van alle geteste apparaten in deze klasse waren beter, 0% vergelijkbaar, 100% slechter
» De beste had een delta van 5%, het gemiddelde was 18%, de slechtste was 45%
Vergeleken met alle geteste toestellen
» 0% van alle geteste apparaten waren beter, 0% gelijk, 100% slechter
» De beste had een delta van 4%, het gemiddelde was 25%, de slechtste was 134%
Energiebeheer - meer vermogen
Stroomverbruik
De XPS 15 9500, 9510, en 9520 zijn de enige grote laptops op de markt op dit moment met 130 W USB-C adapters om de 100 W USB-C Power Delivery limiet, vastgesteld door de USB-IF, te overtreffen. De hogere overhead zorgt ervoor dat de batterij kan blijven opladen tegen een fatsoenlijke snelheid, zelfs bij het uitvoeren van veeleisende belastingen zoals games. Het is ook vermeldenswaard dat onze testeenheid geen oplaadproblemen vertoonde die we ondervonden bij de XPS 17 9700.
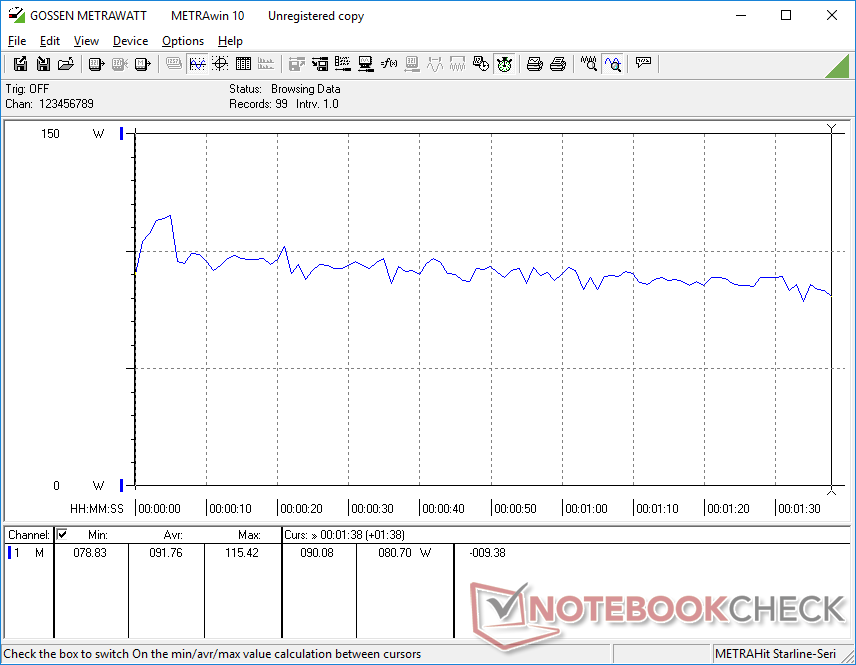
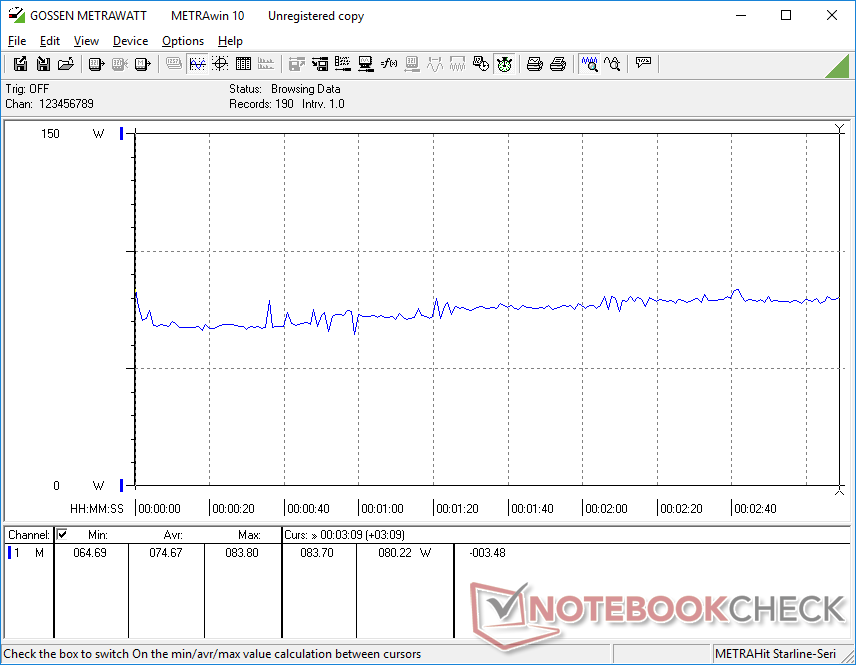
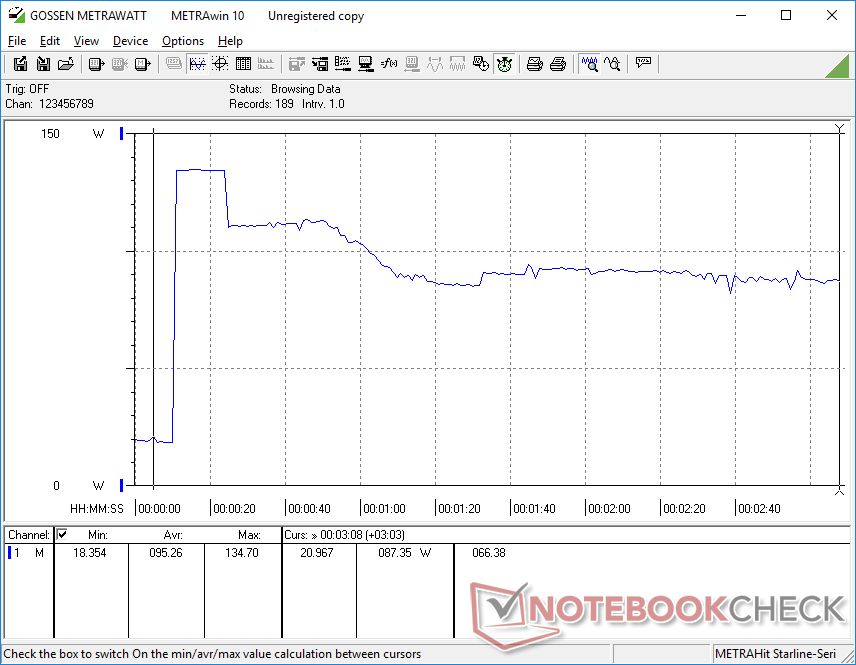
Het draaien van Witcher 3 verbruikt 75 W om in de buurt te komen van wat we registreerden op de XPS 15 9510 of concurrerende AMD-aangedreven Zenbook Pro 15 OLED. Wellicht interessanter is dat het draaien van Prime95 een constante 88 W zou verbruiken, vergeleken met 65 W op de Core 7-11800H-aangedreven XPS 15 9510. Het stroomverbruik is dus met ongeveer 35 procent toegenomen voor de 35 tot 42 procent jaar-op-jaar winst in multi-thread prestaties die we hierboven noteerden. Het over het algemeen hogere stroomverbruik komt overeen met wat we waarnemen op het Alder Lake platform als geheel
De kleine-medium (~14,3 x 6,6 x 2,3 cm) USB-C AC-adapter van 130 W die bij de XPS 15 9520 wordt geleverd, is identiek aan de adapters die bij de XPS 9500 en 9510 werden geleverd.
| Uit / Standby | |
| Inactief | |
| Belasting |
|
| Dell XPS 15 9520 RTX 3050 Ti i7-12700H, GeForce RTX 3050 Ti Laptop GPU, WDC PC SN810 512GB, OLED, 3456x2160, 15.60 | Dell XPS 15 9510 11800H RTX 3050 Ti OLED i7-11800H, GeForce RTX 3050 Ti Laptop GPU, Micron 2300 512GB MTFDHBA512TDV, OLED, 3456x2160, 15.60 | Dell XPS 15 9500 Core i7 4K UHD i7-10875H, GeForce GTX 1650 Ti Mobile, SK Hynix PC611 512GB, IPS, 3840x2400, 15.60 | HP Spectre X360 15-5ZV31AV i7-10510U, GeForce MX250, Intel SSD 660p 2TB SSDPEKNW020T8, IPS, 3840x2160, 15.60 | Asus Zenbook Pro 15 OLED UM535Q R9 5900HX, GeForce RTX 3050 Ti Laptop GPU, WDC PC SN730 SDBPNTY-1T00, OLED, 1920x1080, 15.60 | MSI Stealth 15M A11SEK i7-1185G7, GeForce RTX 2060 Max-Q, WDC PC SN530 SDBPNPZ-1T00, IPS, 1920x1080, 15.60 | |
|---|---|---|---|---|---|---|
| Power Consumption | -5% | -27% | 20% | 5% | -25% | |
| Idle Minimum * | 5.5 | 7.6 -38% | 5.7 -4% | 5.2 5% | 5.5 -0% | 7.3 -33% |
| Idle Average * | 7.2 | 9.9 -38% | 13.5 -88% | 8.5 -18% | 7.4 -3% | 10.1 -40% |
| Idle Maximum * | 16 | 10.8 32% | 19.6 -23% | 8.7 46% | 14.9 7% | 17.6 -10% |
| Load Average * | 91.8 | 81 12% | 114.1 -24% | 65.6 29% | 78.2 15% | 106.6 -16% |
| Witcher 3 ultra * | 74.6 | 76.2 -2% | 93 -25% | 56.5 24% | 80.1 -7% | 105.4 -41% |
| Load Maximum * | 134.7 | 131 3% | 135.2 -0% | 92.4 31% | 110.9 18% | 151.2 -12% |
* ... kleiner is beter
Power Consumption Witcher 3 / Stresstest
Power Consumption external Monitor
Levensduur batterij
Met bijna 9 uur constant WLAN-gebruik in de echte wereld zijn de runtimes over het algemeen vergelijkbaar met wat we hebben geregistreerd op de XPS 9500 en bijna 2 uur langer dan op de XPS 9510. Houd er echter rekening mee dat witte kleuren bij dezelfde helderheidsinstelling een paar watt meer vragen dan donkere kleuren, omdat onze configuratie een OLED paneel gebruikt.
Het opladen van leeg naar vol met de bijgeleverde AC adapter duurt ongeveer 2 tot 2,5 uur bij stationair draaien of lage belasting.
| Dell XPS 15 9520 RTX 3050 Ti i7-12700H, GeForce RTX 3050 Ti Laptop GPU, 86 Wh | Dell XPS 15 9510 11800H RTX 3050 Ti OLED i7-11800H, GeForce RTX 3050 Ti Laptop GPU, 86 Wh | Dell XPS 15 9500 Core i7 4K UHD i7-10875H, GeForce GTX 1650 Ti Mobile, 86 Wh | HP Spectre X360 15-5ZV31AV i7-10510U, GeForce MX250, 84 Wh | Asus Zenbook Pro 15 OLED UM535Q R9 5900HX, GeForce RTX 3050 Ti Laptop GPU, 96 Wh | MSI Stealth 15M A11SEK i7-1185G7, GeForce RTX 2060 Max-Q, 52 Wh | |
|---|---|---|---|---|---|---|
| Batterijduur | -33% | 7% | 22% | 45% | -42% | |
| Reader / Idle | 886 | 1382 56% | 1355 53% | 1571 77% | 627 -29% | |
| WiFi v1.3 | 528 | 420 -20% | 546 3% | 646 22% | 766 45% | 378 -28% |
| Load | 192 | 106 -45% | 121 -37% | 173 -10% | 215 12% | 60 -69% |
| H.264 | 624 |
Pro
Contra
Verdict - Het Alder Lake Verschil
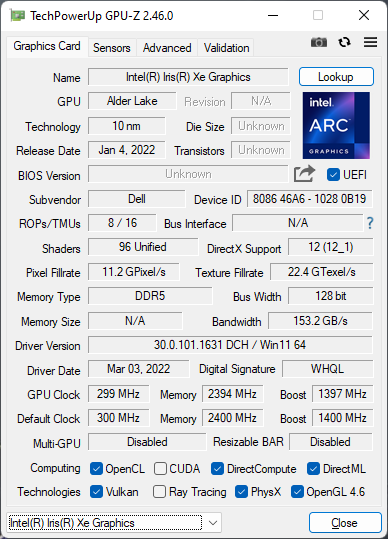
Als de CPU's in de XPS 15 9500 of 9510 te traag zijn voor uw specifieke toepassingen, dan is de 9520 het overwegen waard. Zijn 12e generatie Core i7-12700H kan 70 procent en 40 procent snellere multi-thread prestaties bieden dan de 10e generatie Core i7-10875H en 11e genCore i7-11800Hzonder de batterijduur noemenswaardig te beïnvloeden. De inherente boost van de geïntegreerde grafische prestaties kan ook genoeg zijn om de meeste kantoorgebruikers tevreden te stellen zonder te hoeven upgraden naar een prijzige discrete Nvidia-optie.
Krachtige gebruikers zullen de aanzienlijke toename in processorprestaties ten opzichte van Intel 11e generatie of 10e generatie opties op prijs stellen. Voor meer basis- of gemiddelde kantoortaken is de extra kracht van de 12e-gen-serie de prijsverhoging echter wellicht niet waard.
Buiten de CPU prestaties, blijft de ervaring hetzelfde als op de XPS 9510 of zelfs 9500. De Nvidia GPU is gedownclocked ten opzichte van de 9510 en dus zijn de voordelen van sneller DDR5 RAM geminimaliseerd. Bepaalde veranderingen die we graag hadden gezien, zoals schermen met een hogere verversingsfrequentie, een webcam met een hogere resolutie, goede Wi-Fi 6E ondersteuning of een privacy sluiter, zijn nog steeds afwezig. Als de snellere 12e generatie CPU niet aantrekkelijk is, dan kunt u in plaats daarvan de XPS 15 9510 kopen, die exact dezelfde beeldscherm- en GPU-opties heeft als onze 9520, maar tegen lagere prijzen.
Prijs en beschikbaarheid
Dell verscheept momenteel zijn XPS 15 9520 serie vanaf $1500 USD voor het basismodel tot $3500 USD indien geconfigureerd met alles tot het maximum.
Dell XPS 15 9520 RTX 3050 Ti
-
30-08-2022 v7
Allen Ngo
Pricecompare

