MSI Crosshair 15 Rainbow Six Extraction Edition Review: Capabele QHD 165 Hz midranger voorbij de thematisering

Laptops met een gamethema zijn tegenwoordig moeilijk te krijgen. Alienware vierde de lancering van Cyberpunk 2077 met een gethematiseerde m17 R3 destijds, maar dat was meer een skin om het ontwerp op te leuken. Met de Crosshair 15 heeft MSI de laptop van de grond af ontworpen om Ubisoft's Rainbow Six: Extraction vibes in alle aspecten van het ontwerp.
Het ding met gaming-thema-laptops is dat ze alleen een niche-publiek aanspreken dat investeert in het specifieke spel. Rainbow Six: Extraction kreeg gemengde kritieken van critici en fans, dus een laptop met dit spel als thema zal op het eerste gezicht niet ieders interesse wekken.
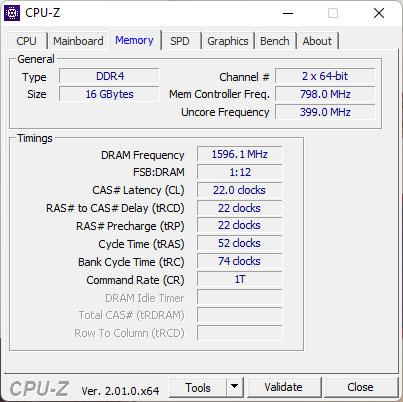
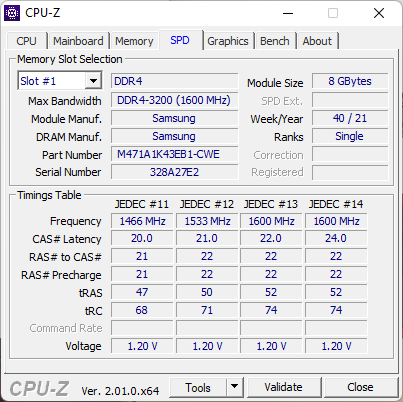
Als we verder gaan dan het thema, vinden we echter dat MSI veel te bieden heeft in het pakket. Onze MSI Crosshair 15 Rainbow Six: Extraction Edition (R6E) was uitgerust met een Intel Core i7-12700H processor, Nvidia GeForce RTX 3070 laptop GPU, 16 GB DDR4-3200 RAM, een 1 TB NVMe SSD en een 165 Hz QHD beeldscherm
De combinatie van een Alder Lake-H CPU en de RTX 3070 Laptop GPU komt niet vaak voor, aangezien Nvidia deze GPU heeft vervangen door de RTX 3070 Ti Laptop GPU. Niettemin kost deze Crosshair 15 configuratie je ₹1.90.990 (US$2.312) in India.
In deze review evalueren we de MSI Crosshair 15 Rainbow Six: Extraction Edition en kijken we hoe hij het doet ten opzichte van de concurrentie als een gaming laptop uit het hogere middensegment.
Potentiële concurrenten in vergelijking
Evaluatie | Datum | Model | Gewicht | Hoogte | Formaat | Resolutie | Beste prijs |
|---|---|---|---|---|---|---|---|
| 85.8 % v7 (old) | 12-2022 | MSI Crosshair 15 R6E B12UGZ-050 i7-12700H, GeForce RTX 3070 Laptop GPU | 2.5 kg | 26.9 mm | 15.60" | 2560x1440 | |
| 84.5 % v7 (old) | 02-2022 | MSI Stealth GS66 12UGS i7-12700H, GeForce RTX 3070 Ti Laptop GPU | 2.2 kg | 19.8 mm | 15.60" | 2560x1440 | |
| 88 % v7 (old) | 03-2022 | Lenovo Legion 5 Pro 16 G7 i7 RTX 3070Ti i7-12700H, GeForce RTX 3070 Ti Laptop GPU | 2.6 kg | 26.6 mm | 16.00" | 2560x1600 | |
| 80.3 % v7 (old) | 06-2022 | MSI Katana GF66 12UGS i7-12700H, GeForce RTX 3070 Ti Laptop GPU | 2.3 kg | 27.5 mm | 15.60" | 1920x1080 | |
| 80.7 % v7 (old) | 04-2022 | MSI Pulse GL66 12UEK i9-12900H, GeForce RTX 3060 Laptop GPU | 2.3 kg | 25 mm | 15.60" | 1920x1080 | |
| 84 % v7 (old) | 06-2022 | Acer Nitro 5 AN515-58-72QR i7-12700H, GeForce RTX 3070 Ti Laptop GPU | 2.5 kg | 26.8 mm | 15.60" | 2560x1440 | |
| 85.5 % v7 (old) | 12-2022 | Aorus 15 XE5 i7-12700H, GeForce RTX 3070 Ti Laptop GPU | 2.3 kg | 24 mm | 15.60" | 2560x1440 | |
| 88.4 % v7 (old) | 07-2022 | Schenker XMG Neo 15 (i7-12700H, RTX 3080 Ti) i7-12700H, GeForce RTX 3080 Ti Laptop GPU | 2.3 kg | 26.6 mm | 15.60" | 2560x1440 | |
| 85.8 % v7 (old) | 07-2022 | Asus TUF Dash F15 FX517ZR i7-12650H, GeForce RTX 3070 Laptop GPU | 2 kg | 20.7 mm | 15.60" | 2560x1440 | |
| 88 % v7 (old) | 11-2022 | Schenker XMG Neo 15 (Ryzen 9 6900HX, RTX 3070 Ti) R9 6900HX, GeForce RTX 3070 Ti Laptop GPU | 2.3 kg | 26.6 mm | 15.60" | 2560x1440 |
Zaak: Pulse GL66 geschilderd in Rainbow Six: Extraction kleuren
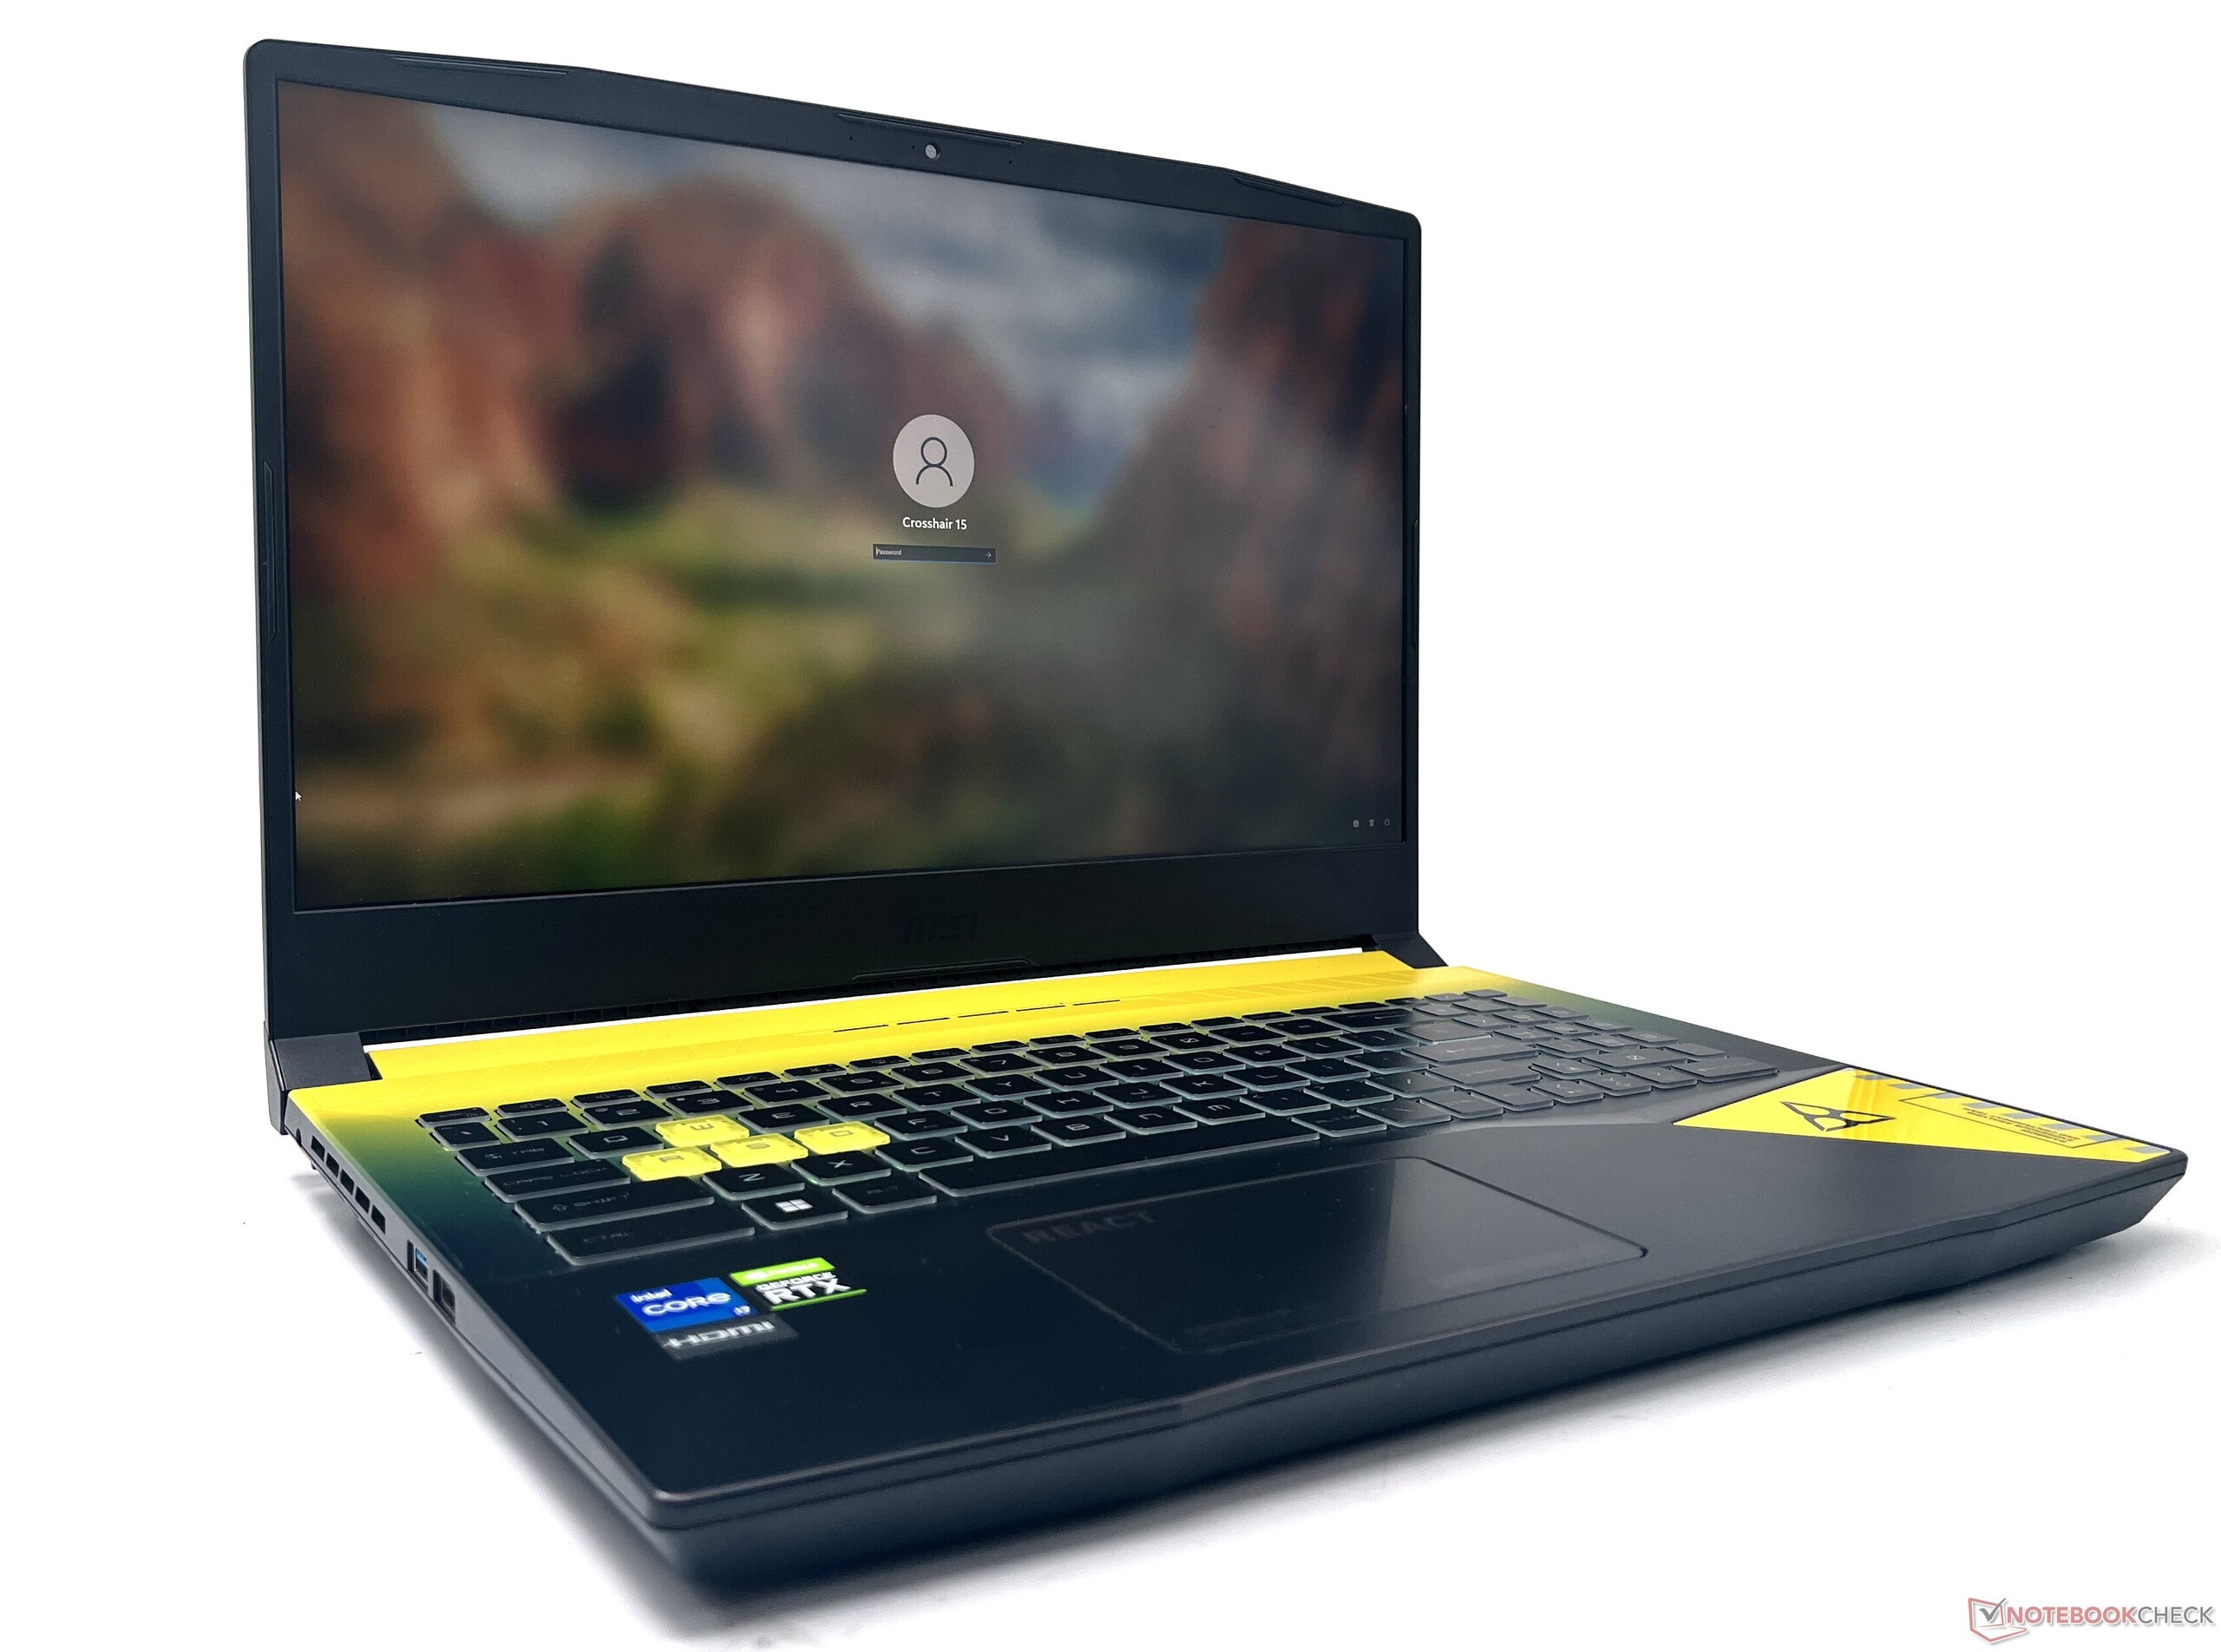
Het chassis van de MSI Crosshair 15 R6E is voornamelijk gemaakt van plastic. De bouw straalt niet echt een premium vibe uit, maar voelt stevig genoeg voor dagelijks gebruik. Er is merkbare flex in het toetsenbord dek, maar het heeft niet belemmerd regelmatig gebruik.
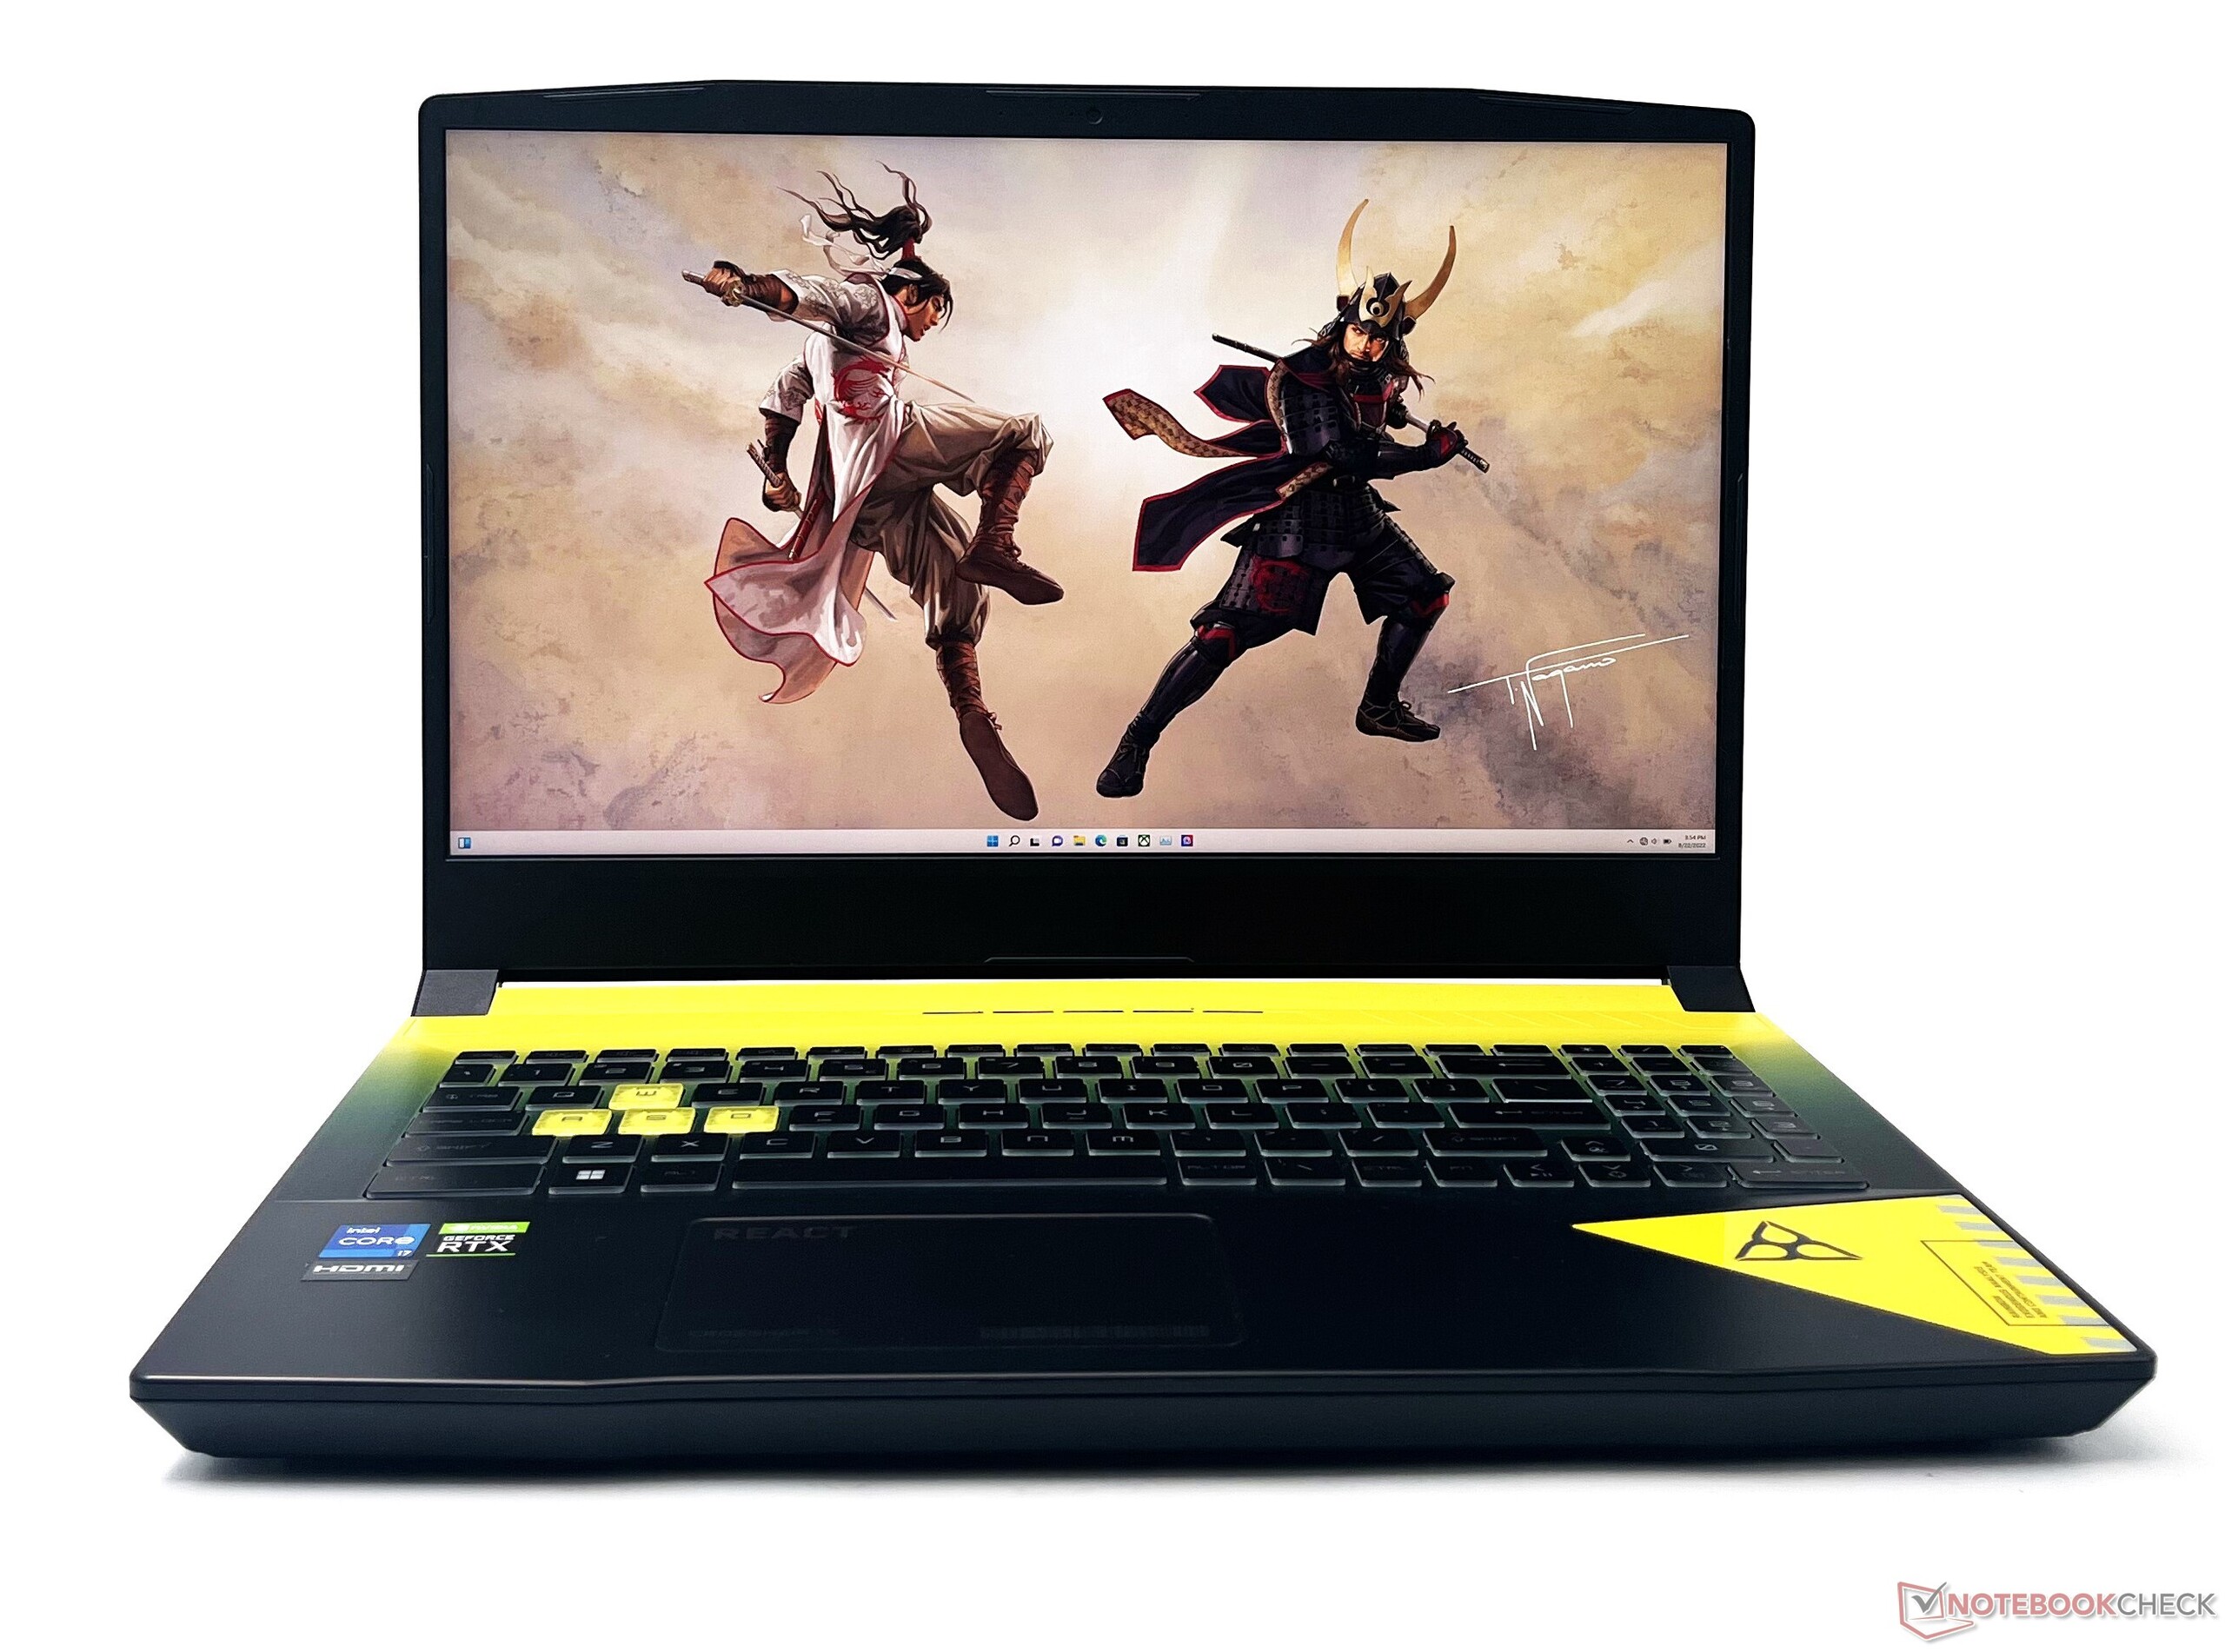
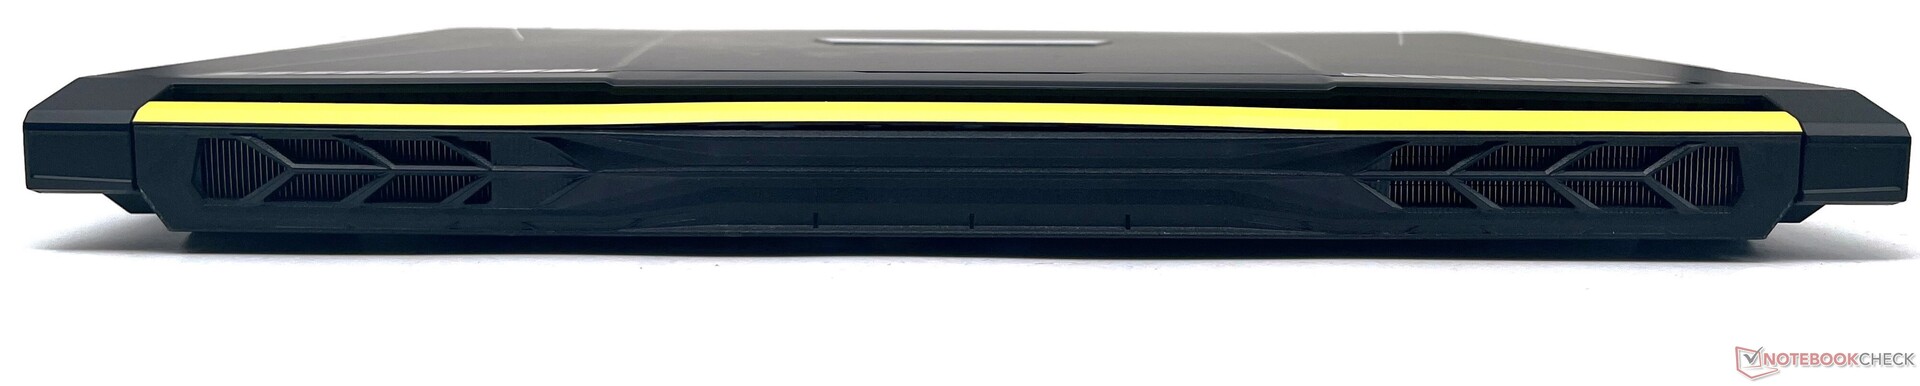
De Crosshair 15 R6E maakt uitgebreid gebruik van een geel-zwart dual-tone kleurenschema en de REACT ontwerpelementen van de game, van de verpakking tot het chassis, en verkondigt daarmee zijn Rainbow Six: Extraction.
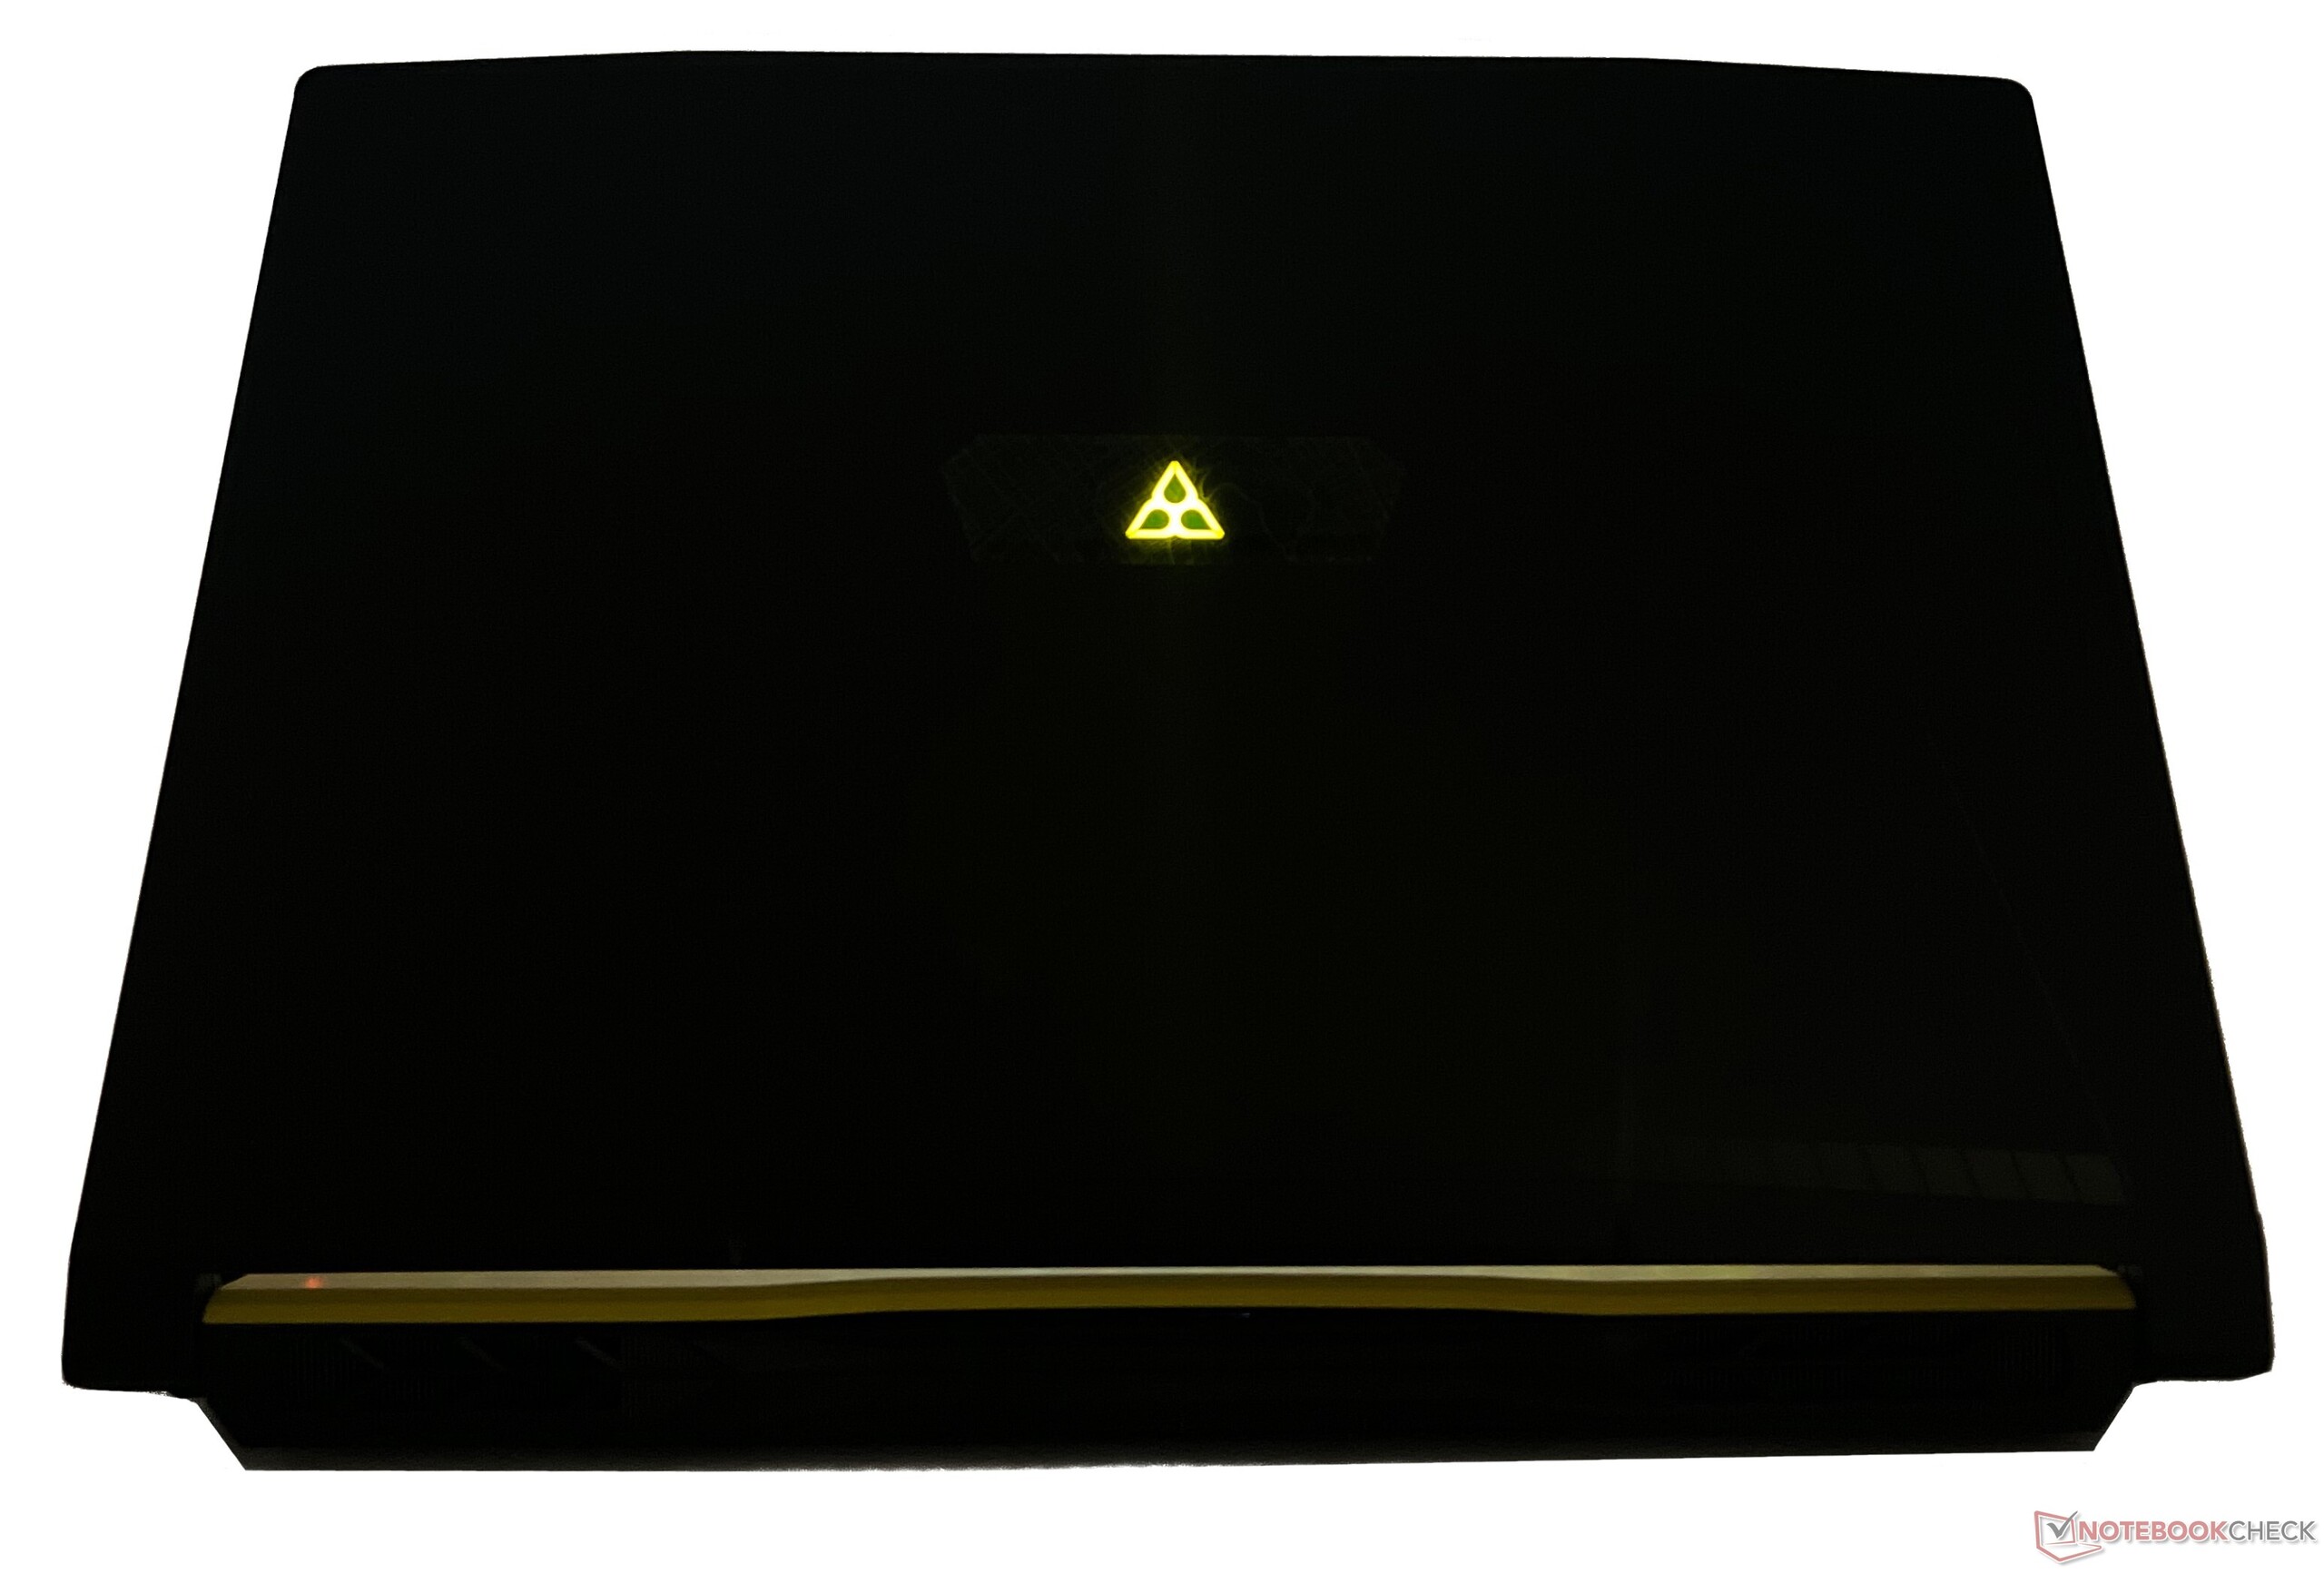
MSI heeft zelfs zijn logo vervangen door dat van het spel aan de achterkant van het scherm. Het Rainbow Six: Extraction logo is niet te groot, maar valt genoeg op en gloeit in helder geel. Er zijn geen RGB verlichtingspatronen, dus je zult het moeten doen met het aangeboden kleurenschema.
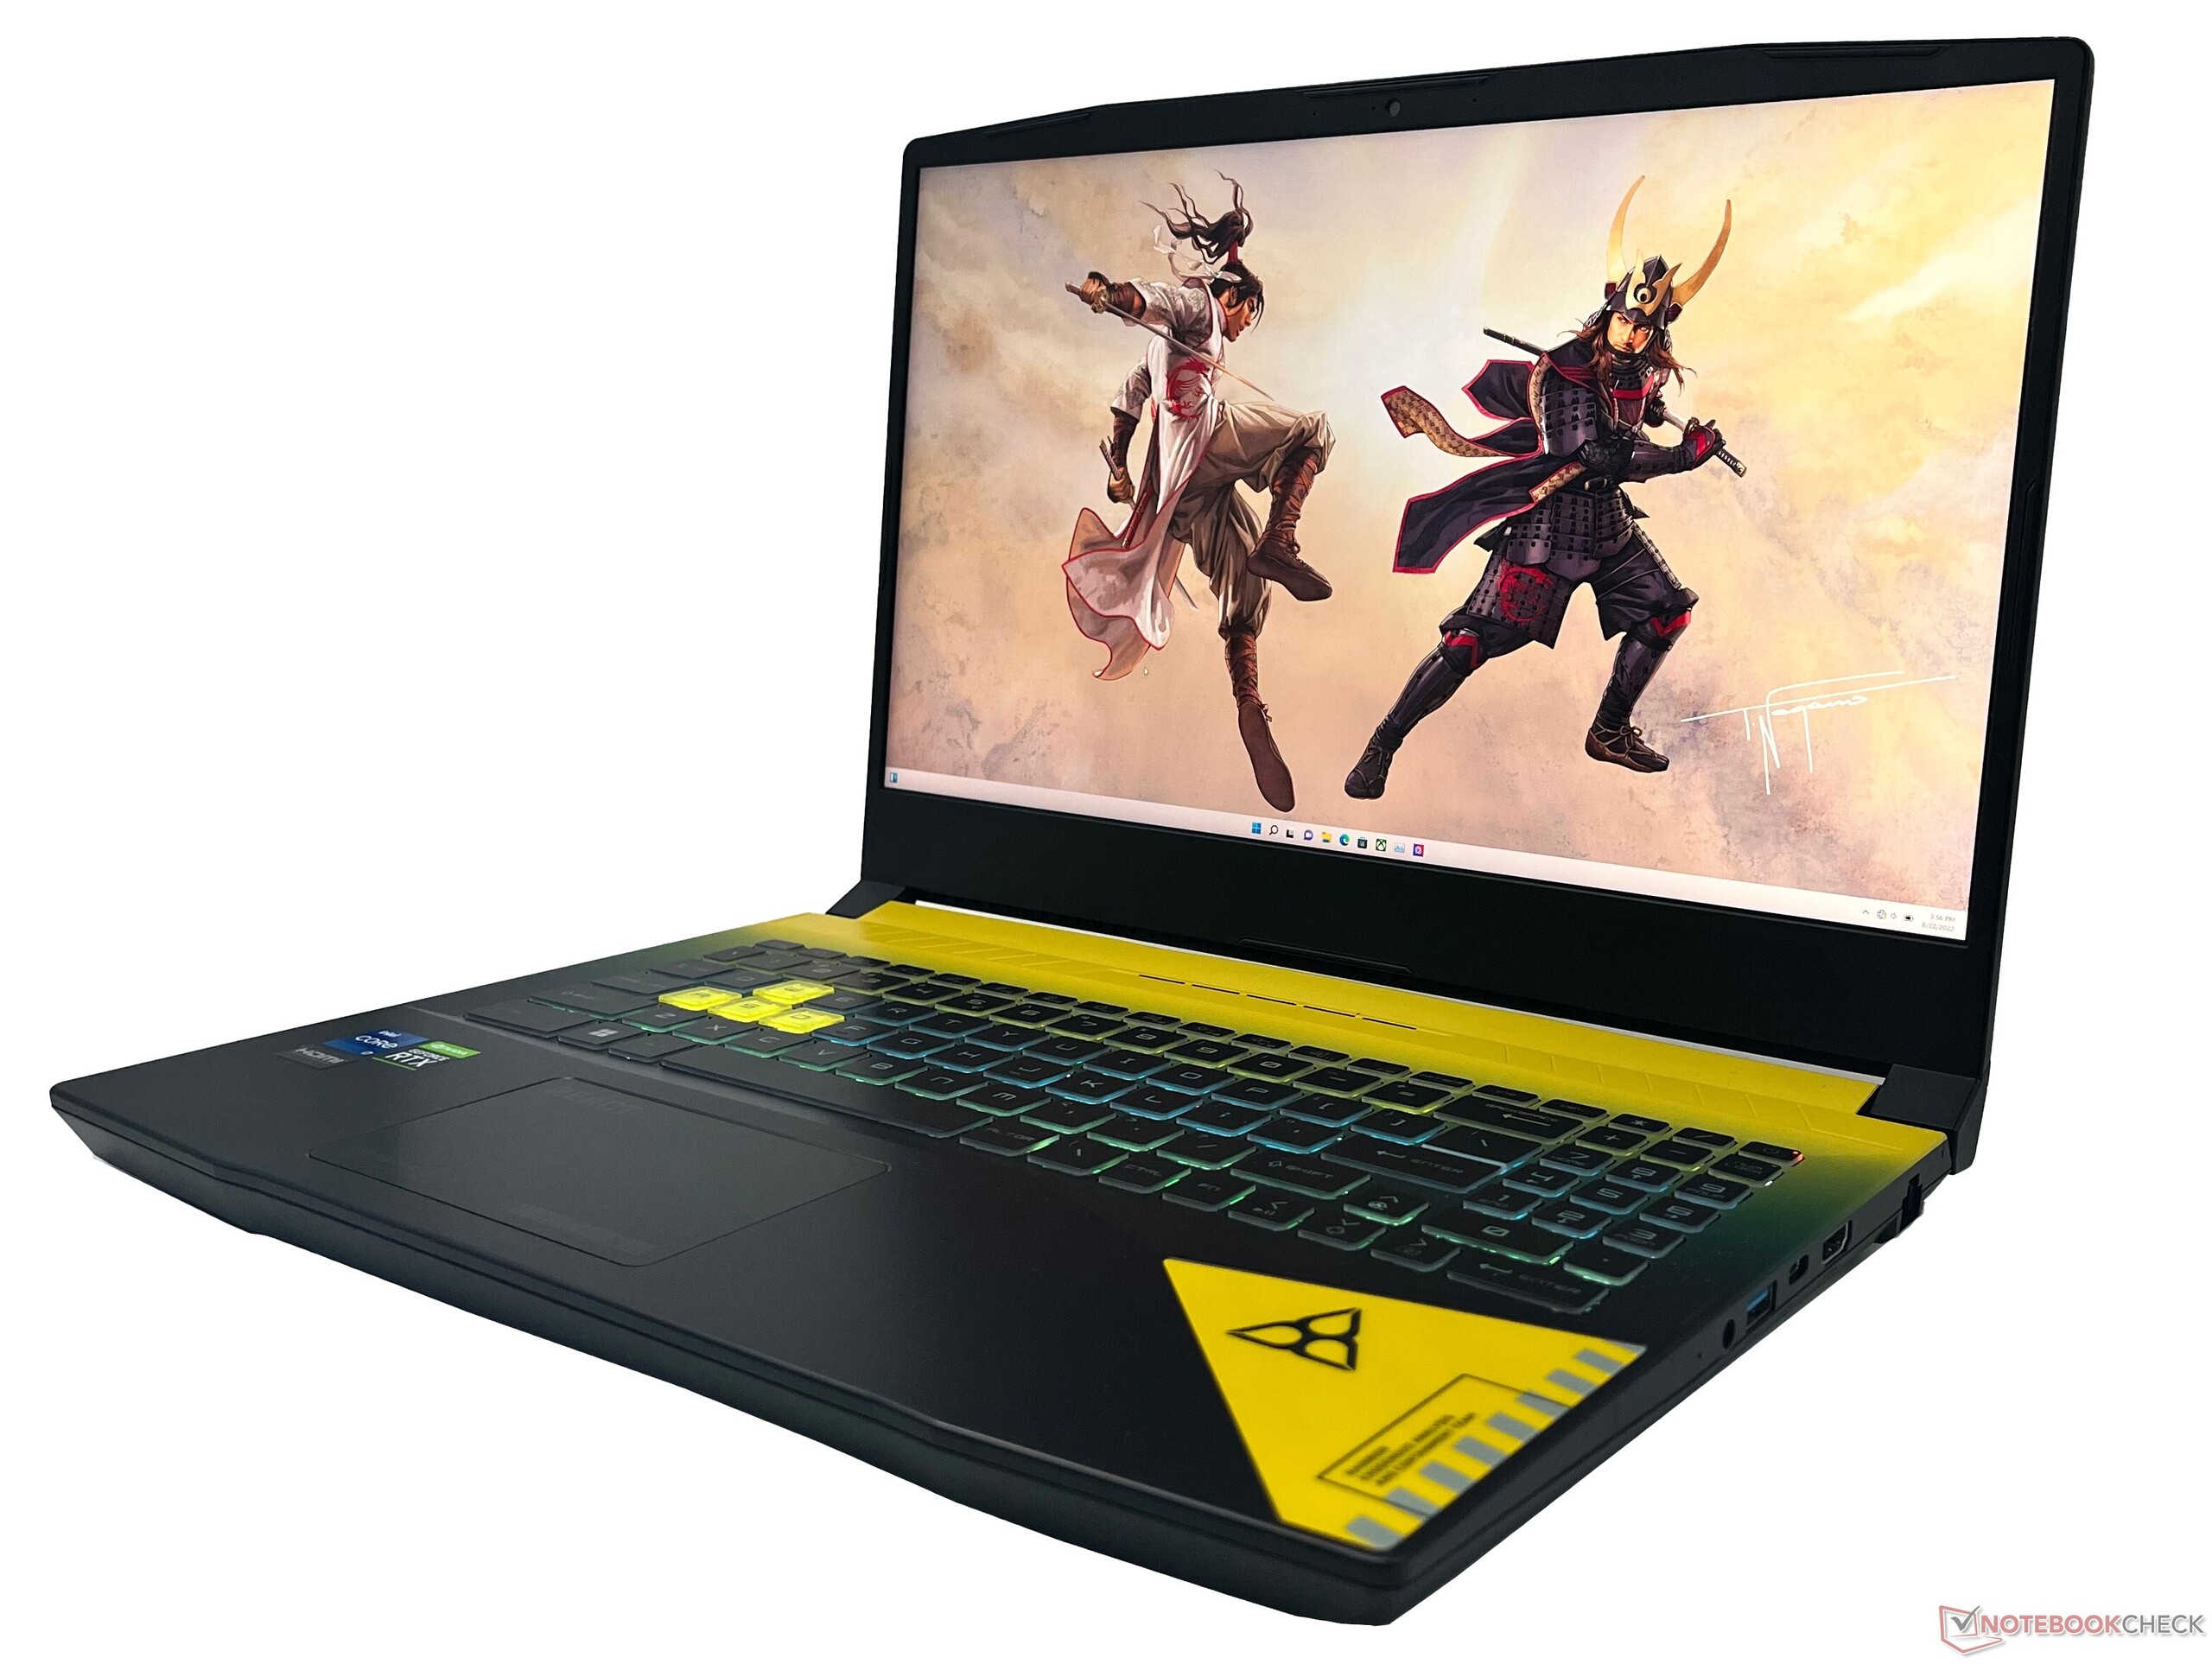
Met een dikte van 26,9 mm is het niet de dunste laptop in zijn klasse - dat krediet gaat naar de MSI Stealth GS66 en de Razer Blade 15. Toch is hij draagbaar genoeg om in een rugzak te stoppen en het gewicht van 2,5 kg voelt ook niet te zwaar aan.
Over het algemeen is de MSI Crosshair 15 Rainbow Six: Extraction Edition's chassis is fatsoenlijk gebouwd voor de prijs en komt in wezen over als een rehash van de Pulse GL66en in veel opzichten de Katana GF66met een verse laag verf.

Connectiviteit: Dekt alleen het essentiële
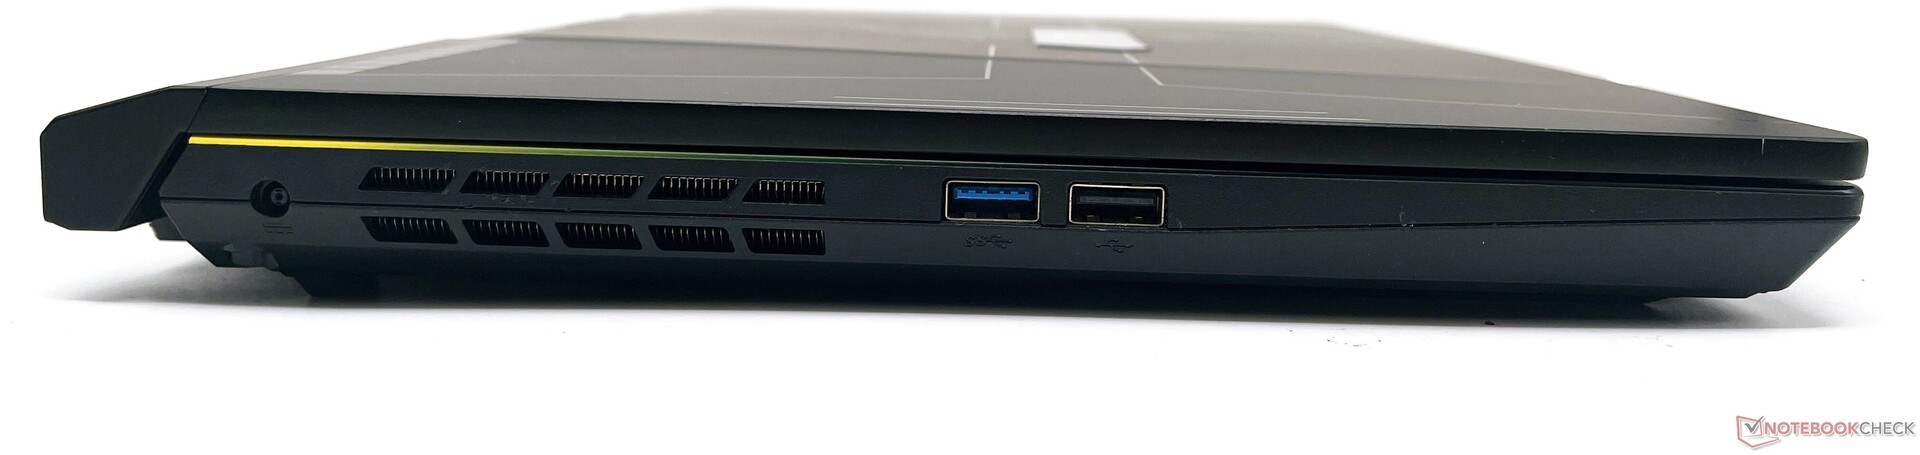
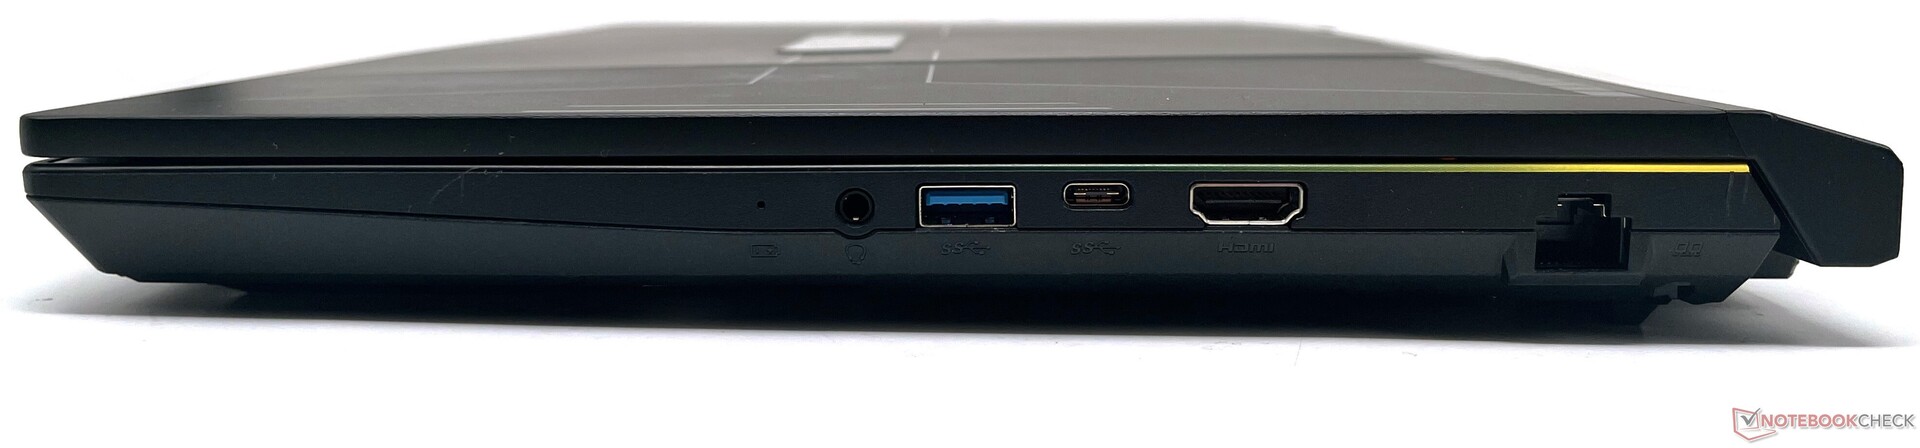
De Crosshair 15 R6E biedt geen uitgebreide poortselectie, maar het essentiële is gedekt. Aan de linkerkant hebben we USB 3.2 Gen1 Type-A en USB 2.0 Type-A poorten. Aan de rechterkant krijgen we een 3,5 mm combo audio-aansluiting, nog een USB 3.2 Gen1 Type-A, een USB 3.2 Gen1 Type-C poort, HDMI-out, en Gigabit Ethernet
De HDMI-poort ondersteunt alleen 4K 60 Hz uitvoer. Er is geen kaartlezer, Thunderbolt 4 of Kensington-slot aanwezig.
De plaatsing van de poorten is niet echt ideaal, aangezien een meerderheid ervan zich aan de rechterkant van het apparaat bevindt. De poorten aan de linkerkant zouden wat extra ruimte kunnen gebruiken, aangezien een flinke hoeveelheid ruimte ongebruikt blijft. Dit gezegd zijnde, zijn er geen belemmeringen bij het aansluiten van meerdere randapparaten.
Communicatie
De Crosshair 15 R6E is uitgerust met een Intel Wi-Fi 6 AX201 WLAN-module met Bluetooth 5.2. De laptop staat onderaan onze Wi-Fi grafieken met de Asus ROG Rapture GT-AXE11000 referentie router.
Dat gezegd hebbende, is zijn doorvoer nog steeds beter dan die van de Pulse GL66. De ontvangstsnelheden zijn redelijk stabiel, maar we merkten dips op tijdens het zenden.
| Networking / iperf3 transmit AXE11000 | |
| Schenker XMG Neo 15 (i7-12700H, RTX 3080 Ti) | |
| Acer Nitro 5 AN515-58-72QR | |
| Schenker XMG Neo 15 (Ryzen 9 6900HX, RTX 3070 Ti) | |
| MSI Katana GF66 12UGS | |
| Asus TUF Dash F15 FX517ZR | |
| Gemiddeld Intel Wi-Fi 6 AX201 (438 - 1715, n=74) | |
| Gemiddelde van klas Gaming (560 - 1862, n=88, laatste 2 jaar) | |
| MSI Crosshair 15 R6E B12UGZ-050 | |
| Networking / iperf3 receive AXE11000 | |
| Acer Nitro 5 AN515-58-72QR | |
| MSI Katana GF66 12UGS | |
| Schenker XMG Neo 15 (i7-12700H, RTX 3080 Ti) | |
| Asus TUF Dash F15 FX517ZR | |
| MSI Stealth GS66 12UGS | |
| Schenker XMG Neo 15 (Ryzen 9 6900HX, RTX 3070 Ti) | |
| Gemiddelde van klas Gaming (680 - 1745, n=88, laatste 2 jaar) | |
| Gemiddeld Intel Wi-Fi 6 AX201 (390 - 1734, n=79) | |
| MSI Crosshair 15 R6E B12UGZ-050 | |
| Networking / iperf3 transmit AX12 | |
| Lenovo Legion 5 Pro 16 G7 i7 RTX 3070Ti | |
| Gemiddeld Intel Wi-Fi 6 AX201 (49.8 - 1775, n=324) | |
| MSI Pulse GL66 12UEK | |
| Networking / iperf3 receive AX12 | |
| Lenovo Legion 5 Pro 16 G7 i7 RTX 3070Ti | |
| Gemiddeld Intel Wi-Fi 6 AX201 (136 - 1743, n=324) | |
| MSI Pulse GL66 12UEK | |
Webcam
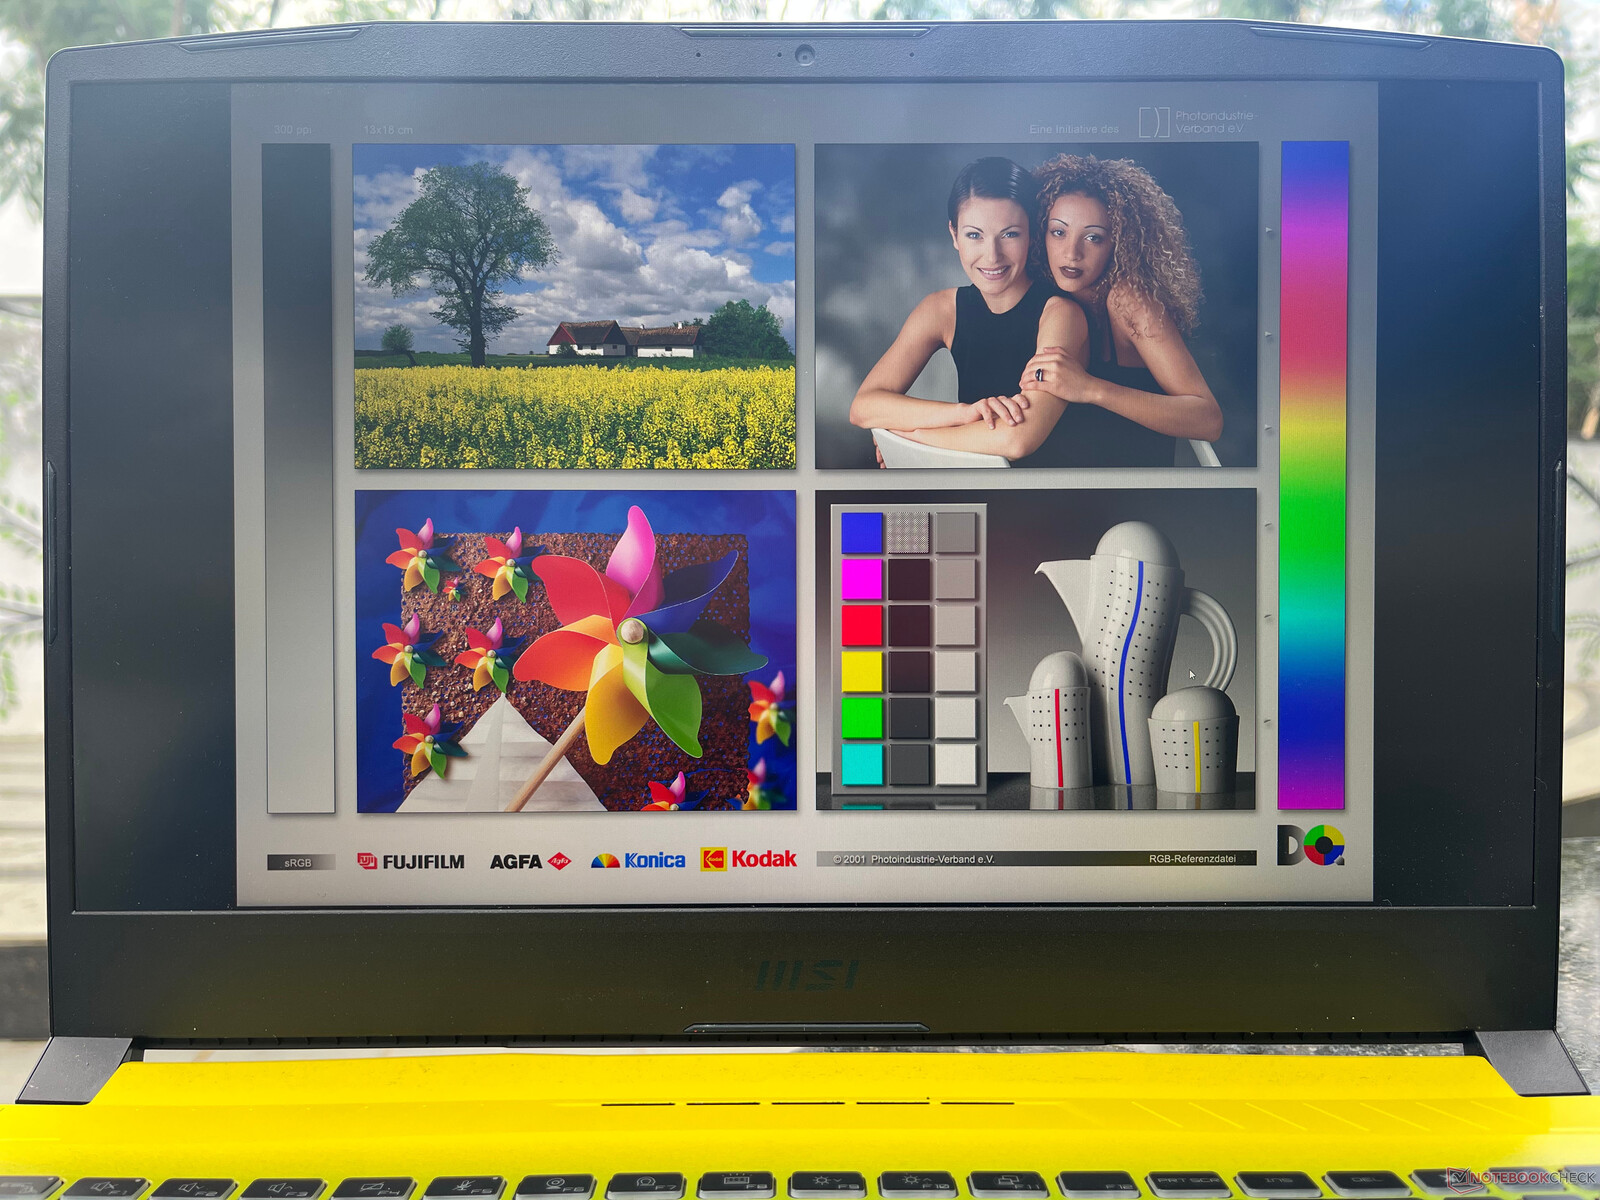
De 720p webcam is nog net bruikbaar voor een paar videogesprekken. Zoals opgemerkt in onze ColorChecker Passport en onderstaande testgrafieken, vertoont de webcam van de Crosshair 15 veel ruis en een algemeen gebrek aan scherpte.
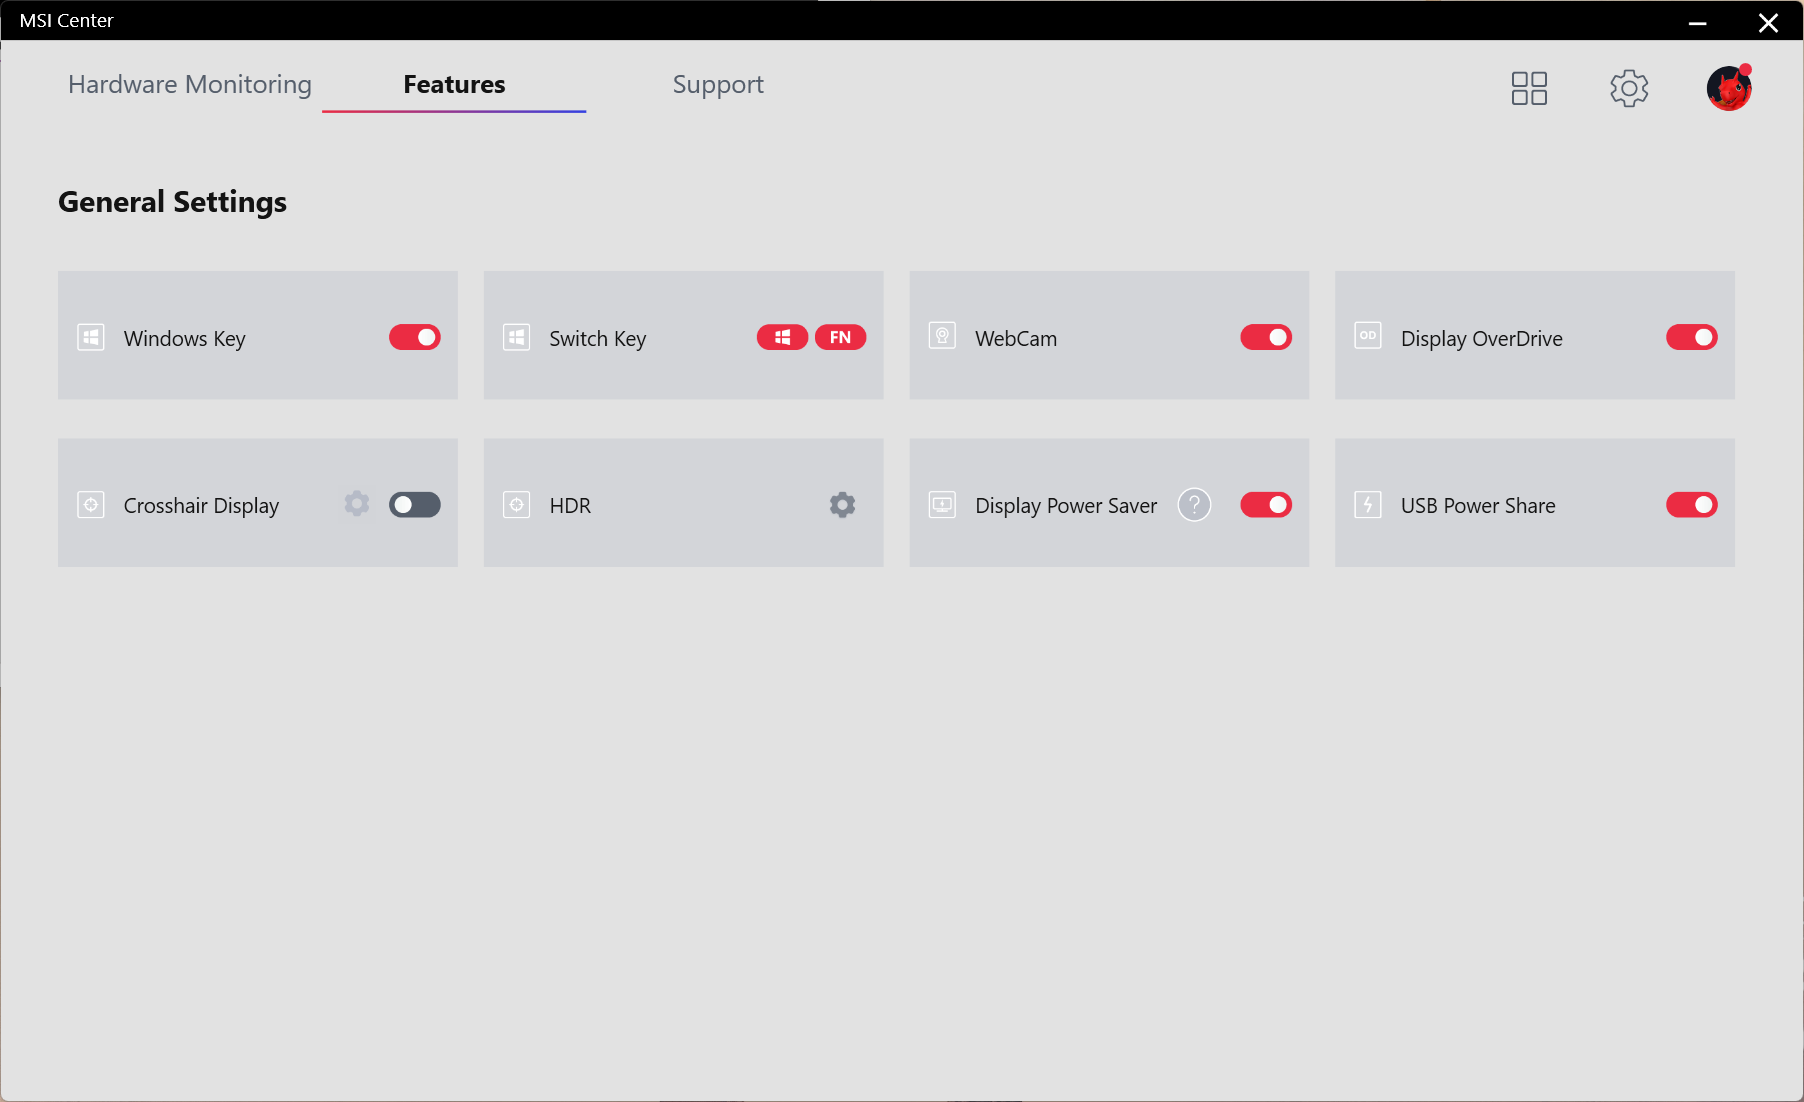
Er is geen fysieke privacy shutter beschikbaar, maar het is mogelijk om de webcam in of uit te schakelen via de snelkoppeling op de F6 functietoets of via MSI Center.


Beveiliging
Er is geen biometrische login beschikbaar op de Crosshair 15 R6E. De enige belangrijke beveiligingscomponent aan boord is de TPM 2.0 module.
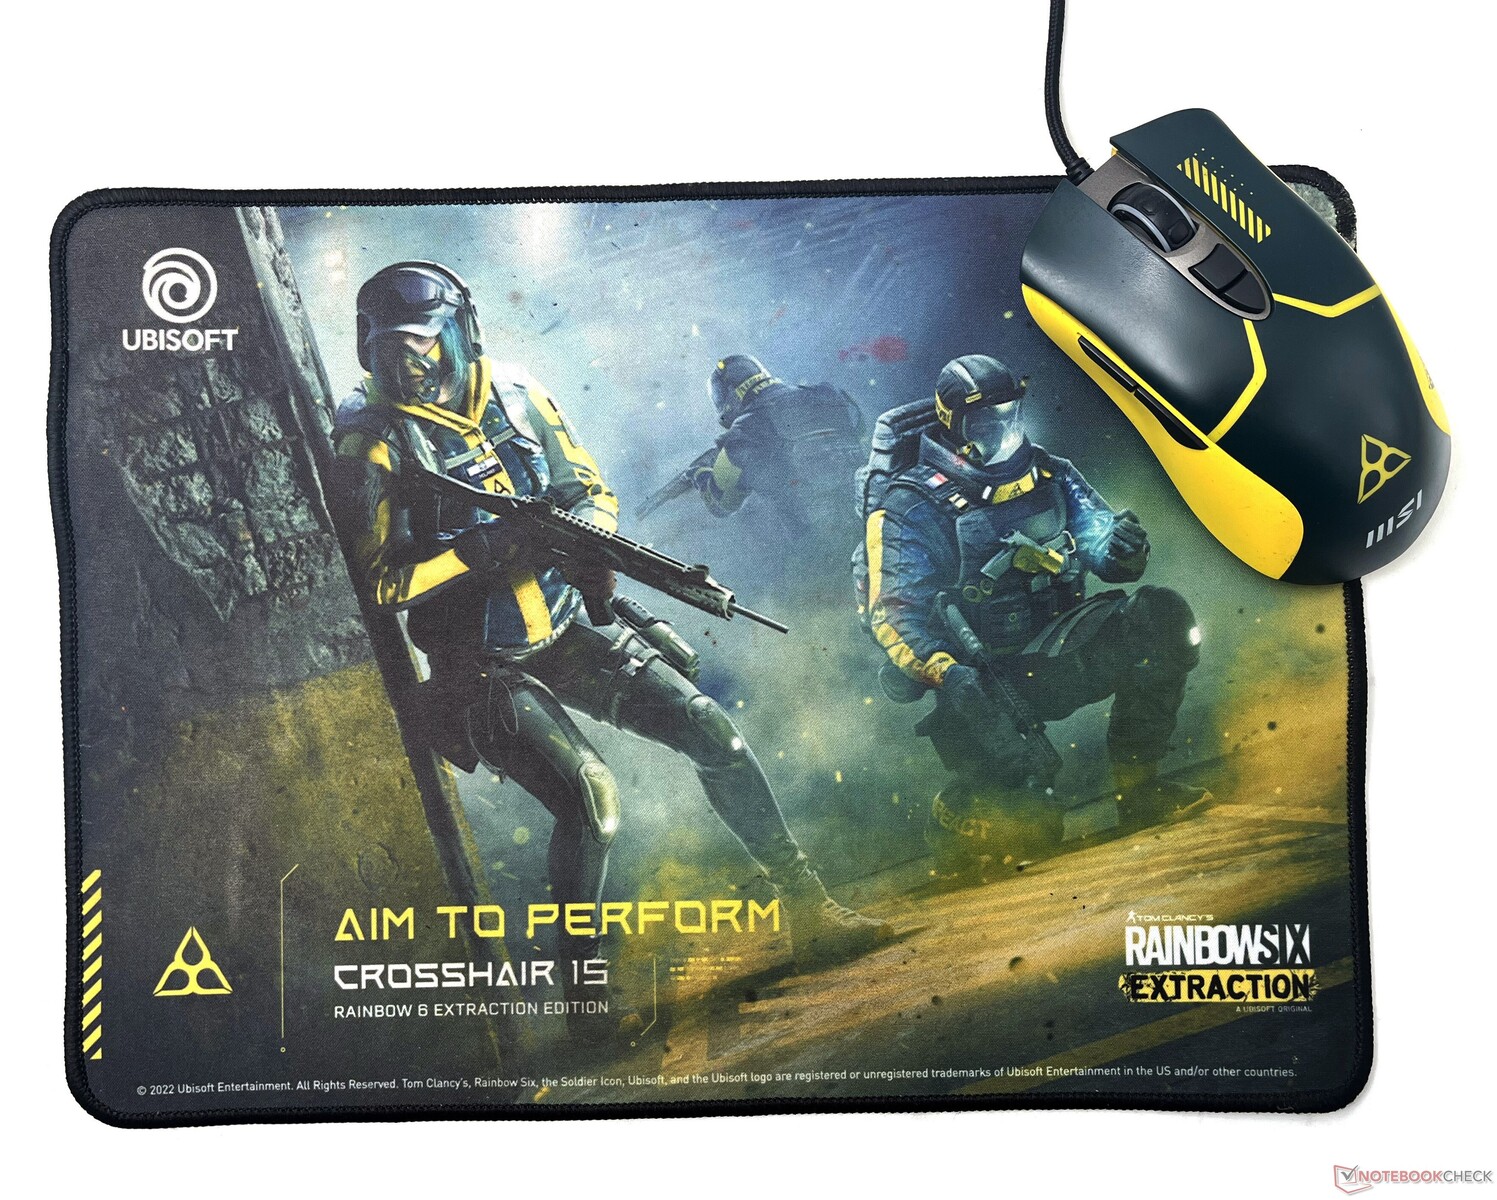
Accessoires
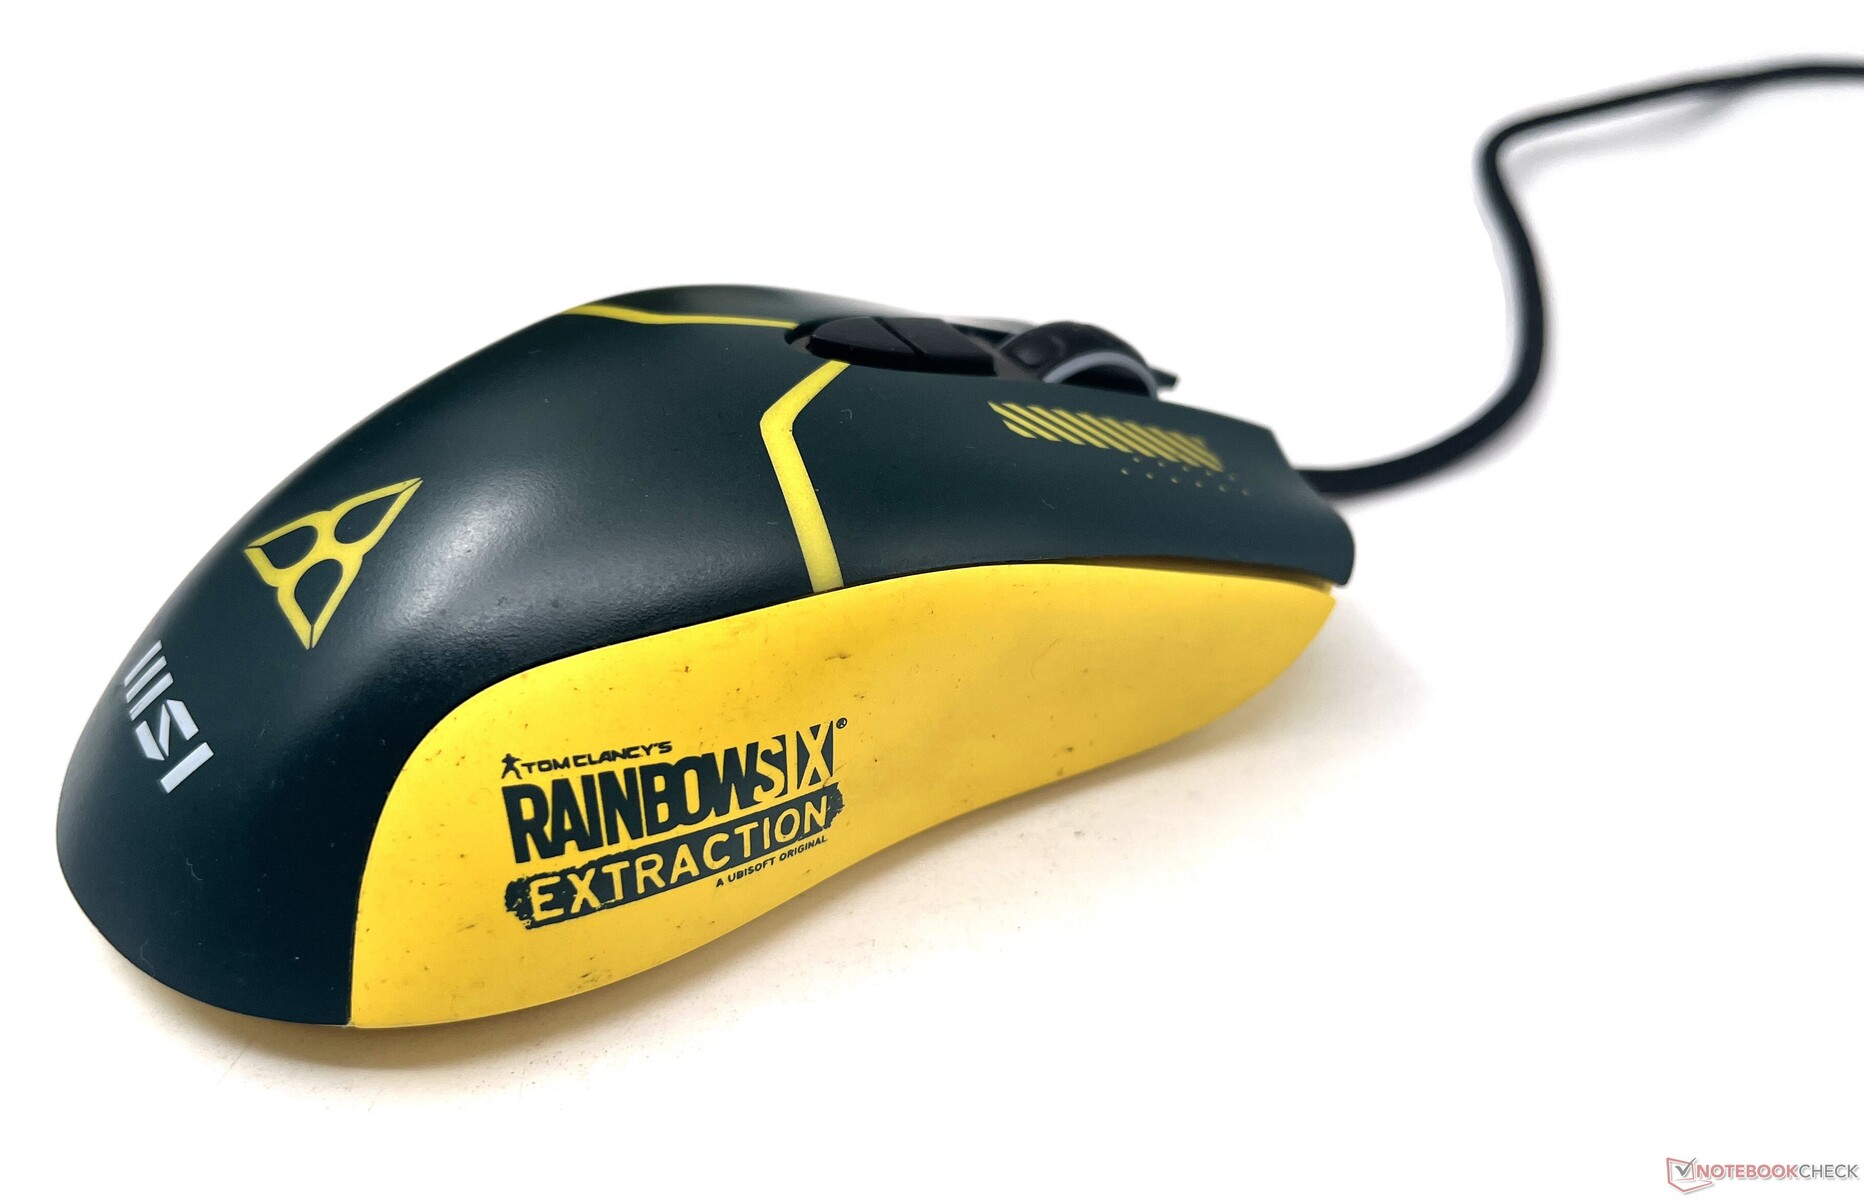
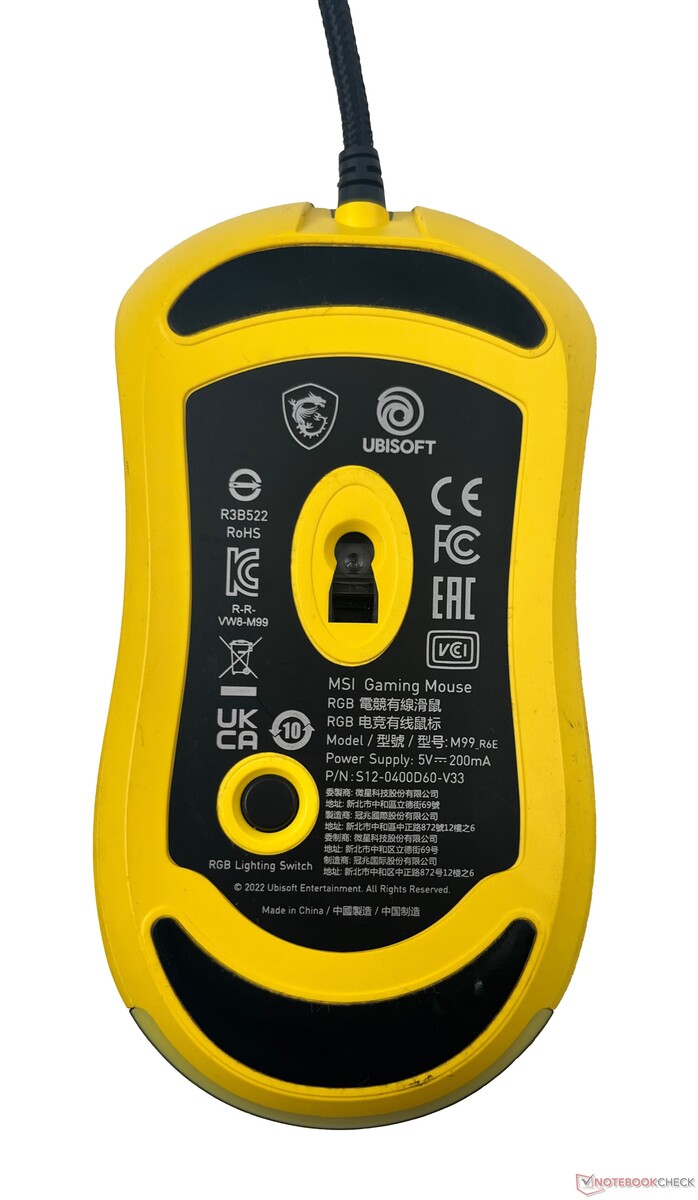
MSI probeert je verder het Rainbow Six: Extraction universum met een paar extra accessoires. Een muismat en een gaming muis met het thema van het spel zijn inbegrepen in het pakket. Kopers krijgen ook een gratis exemplaar van Rainbow Six: Extraction Deluxe Edition via Ubisoft.
De muis is een aangepaste versie van de MSI M99. De muis gebruikt een Avago 3050 sensor met een 4.000 DPI resolutie en een 500 Hz polling rate. Het is duidelijk niet in de league van een Corsair IronClaw RGB of zelfs de Mad Catz R.A.T. Airmaar het is nog steeds een fatsoenlijk gratis aanbod.
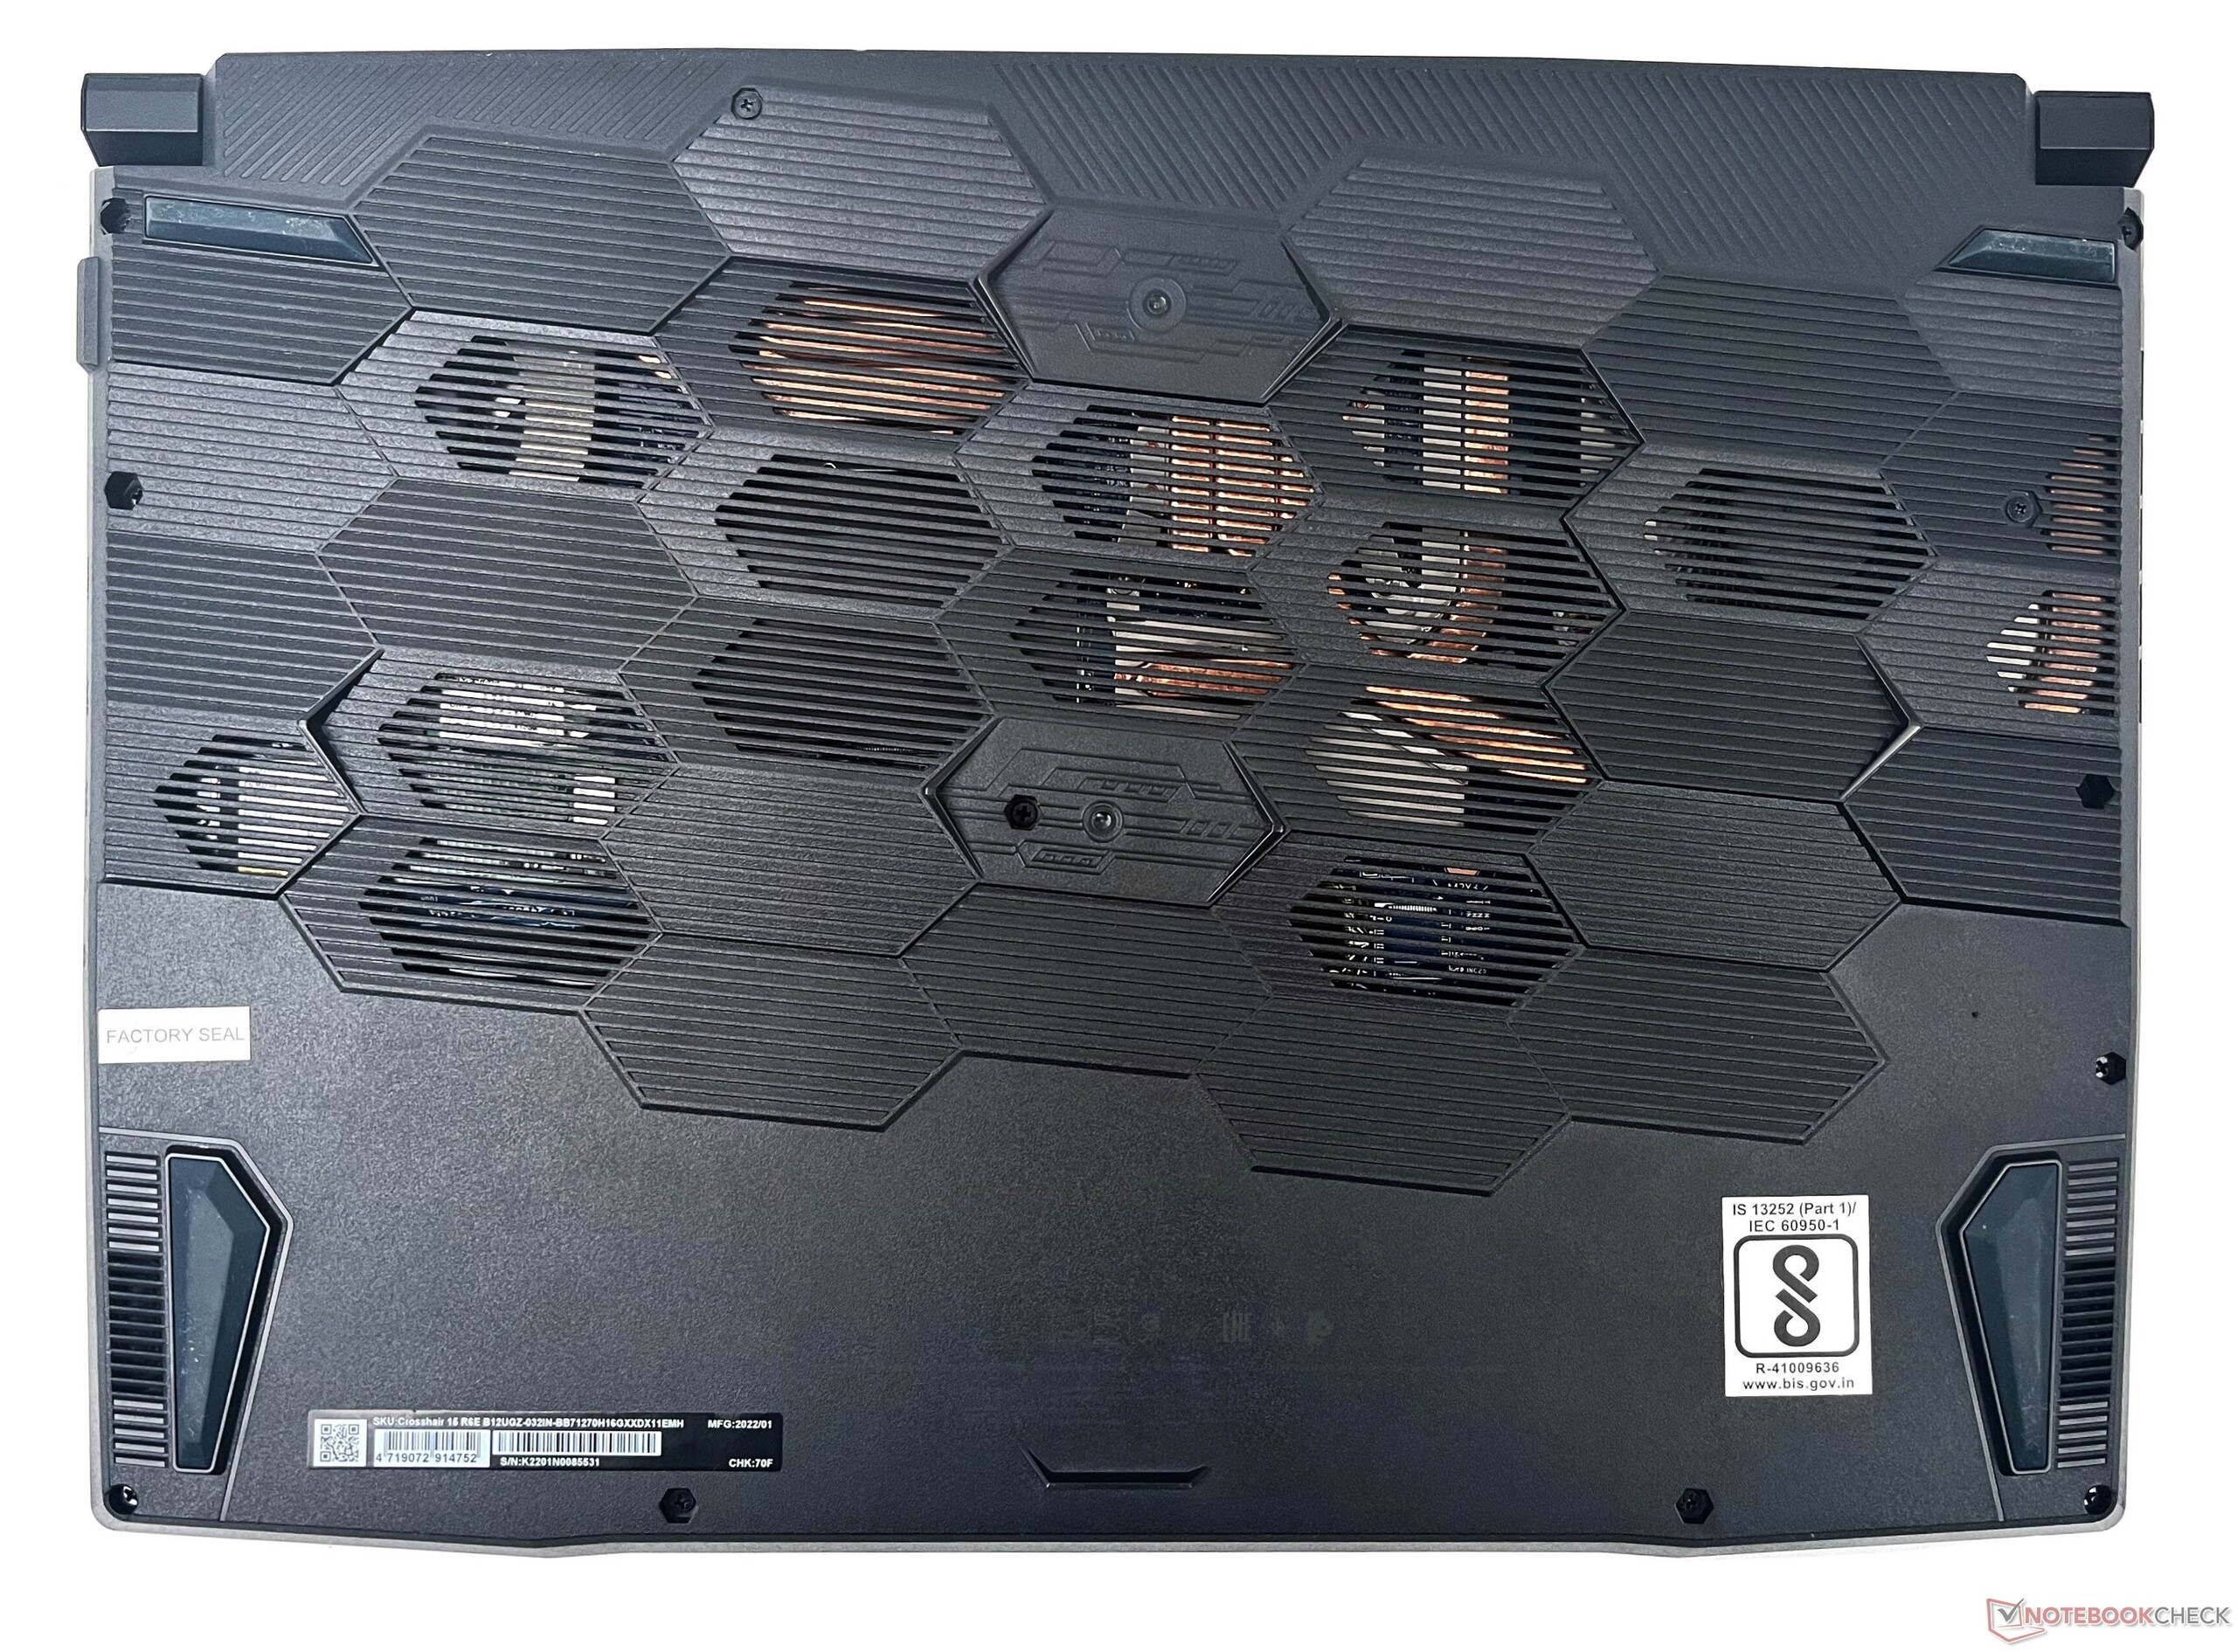
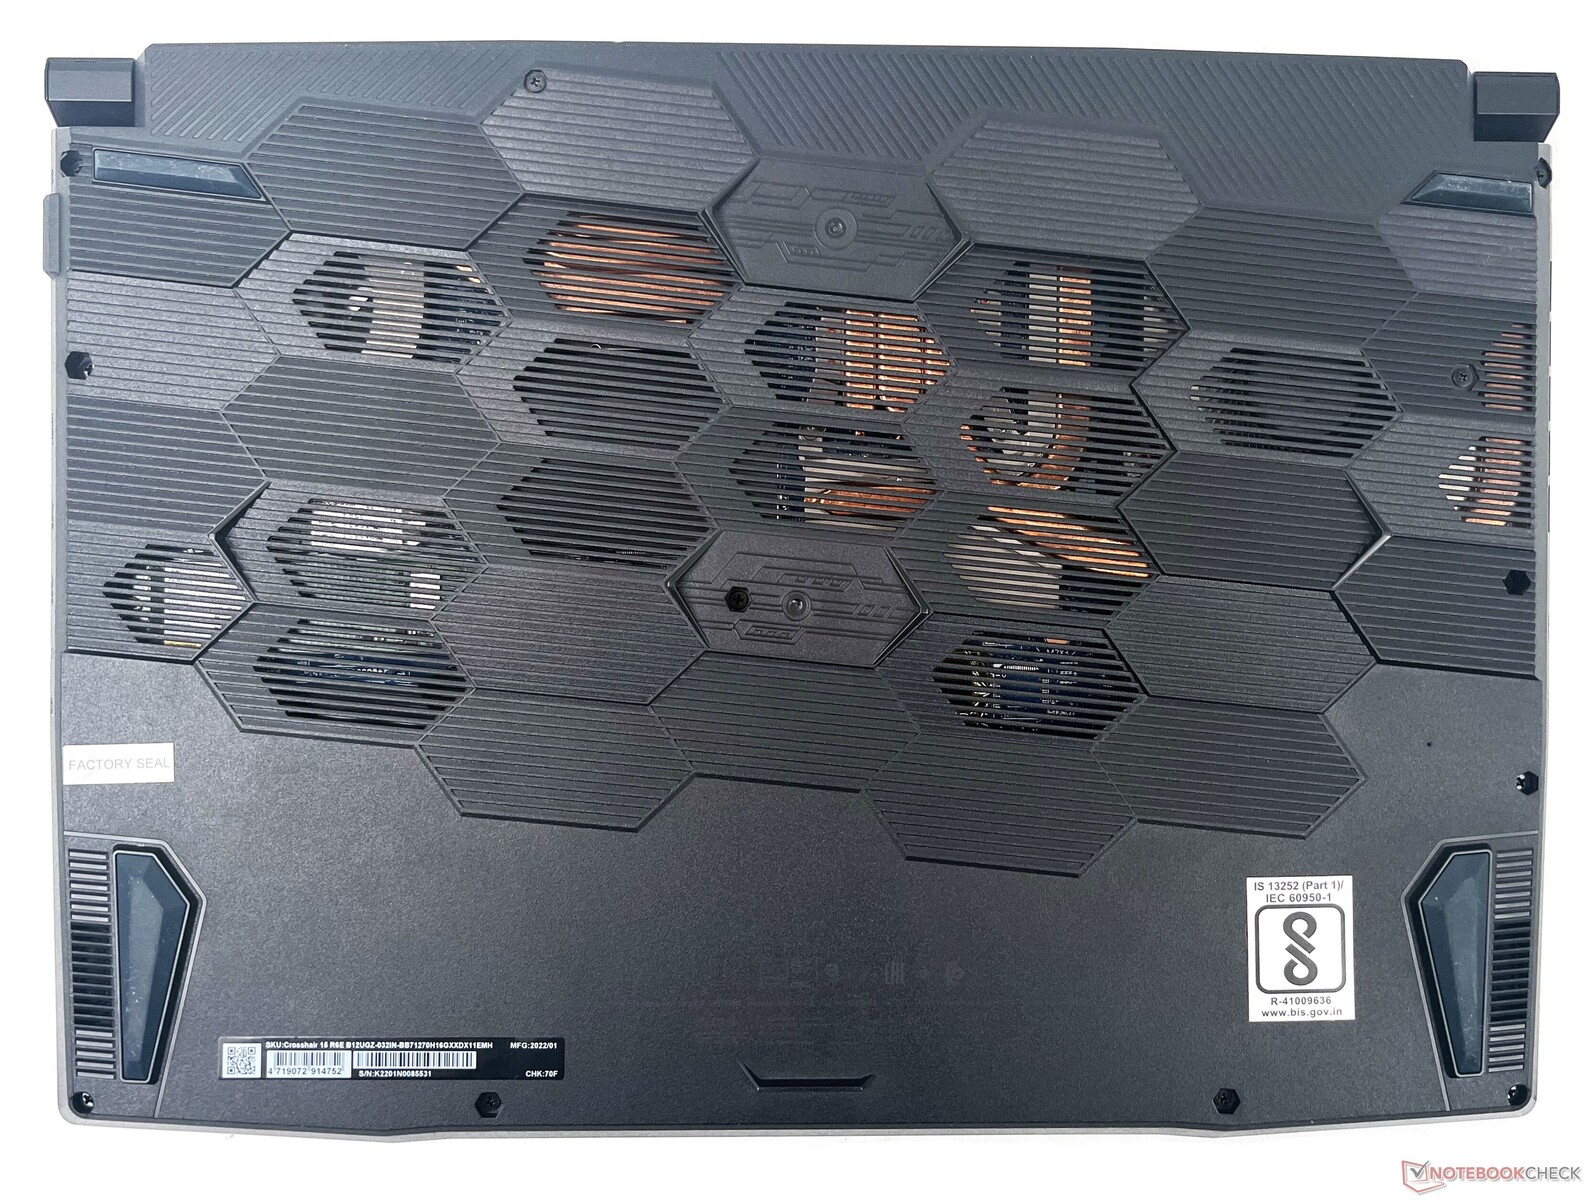
Onderhoud
Zoals gebruikelijk bij MSI review samples, konden we de Factory Seal sticker die een van de schroeven verbergt niet verwijderen. Dat gezegd hebbende, het openen van het achterpaneel is vrij eenvoudig en gebruikers moeten in staat zijn om upgrades uit te voeren zonder problemen.
Garantie
MSI biedt twee jaar garantie voor de Crosshair 15 R6E die ook een jaar wereldwijde reisverzekering bij geautoriseerde MSI servicecentra omvat.
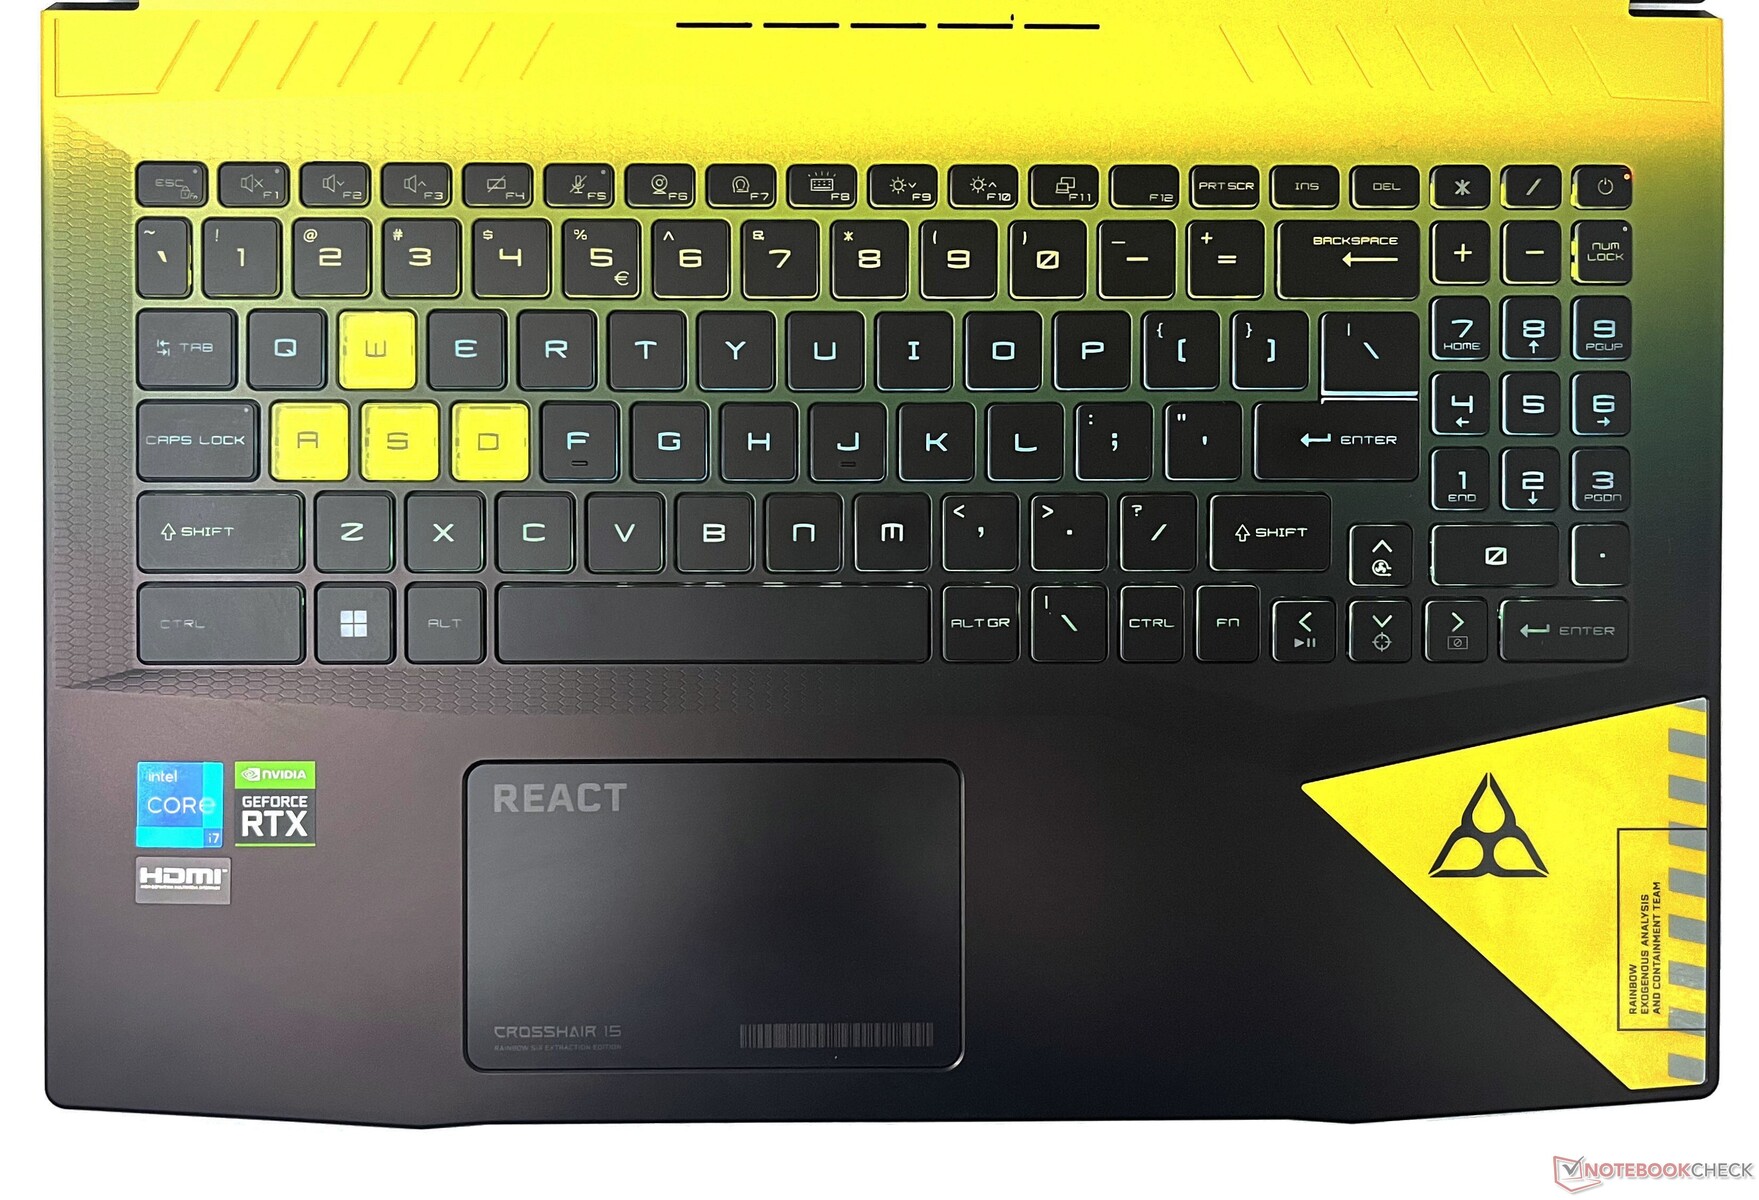
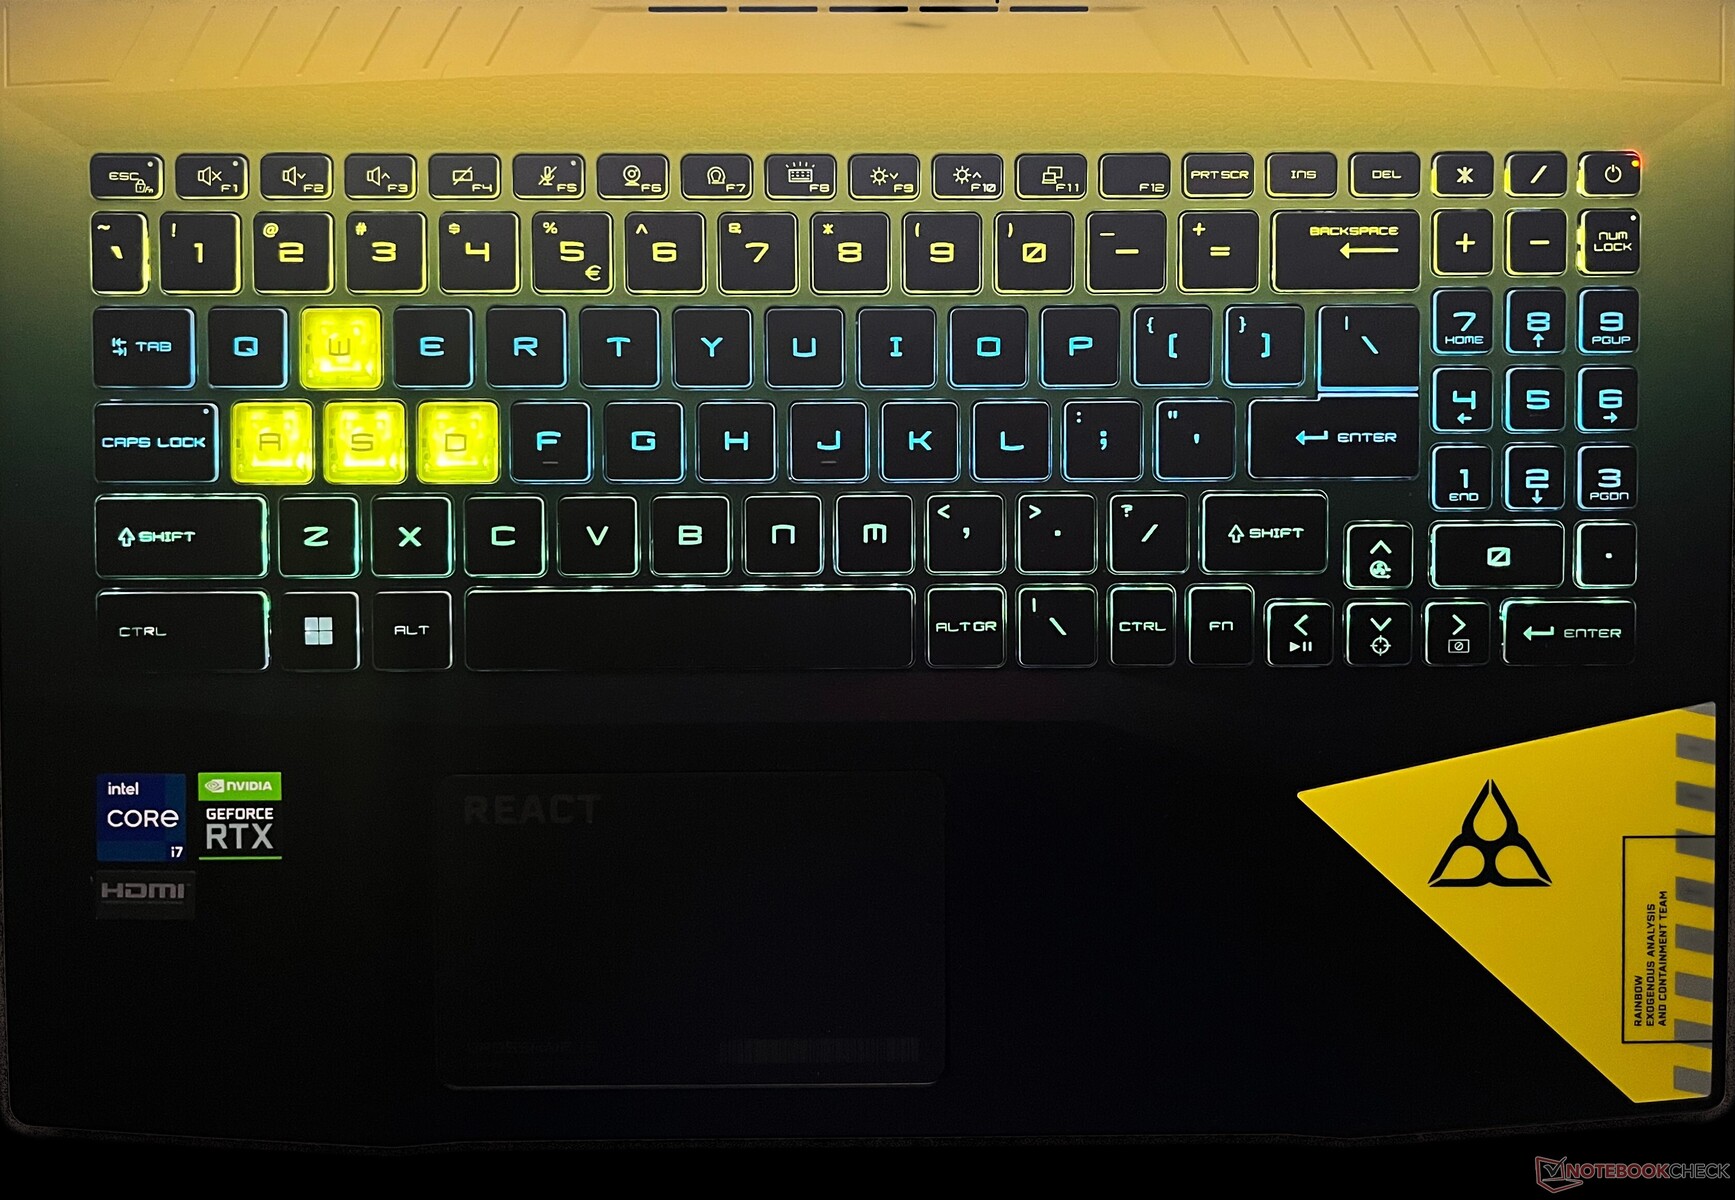
Invoerapparaten: Vaste thematische achtergrondverlichting kleuren
Toetsenbord
Het toetsenbord van de Crosshair 15 R6E beschikt niet over RGB of een van de fancy SteelSeries functies, maar MSI heeft wat het noemt een Spectrum Backlight toetsenbord ingebouwd. In wezen zijn de toetsenbordlichten geïnspireerd door - je raadt het al - de Rainbow Six: Extraction game met gele en blauwe kleuren
Elke toets heeft vaste verlichting die niet kan worden aangepast, hoewel de intensiteit van de algemene achtergrondverlichting zelf kan worden aangepast via een sneltoets. De toetsen hebben een goede veerweg van 1,7 mm en behoorlijke tactiele feedback
De opname van het numpad is welkom, en de pijltjestoetsen zijn niet geplet. De secundaire functies zijn gelukkig verlicht, waardoor ze gemakkelijk te herkennen zijn in het donker.
Als je nieuw bent bij MSI laptops, moet je rekening houden met de onhandige plaatsing van de Fn toets aan de rechterkant in plaats van de gebruikelijke positie.
Touchpad
Het 10,5 cm x 6,5 cm touchpad krijgt het REACT logo van de game en het Crosshair 15 label. Qua functionaliteit is het verwant aan de touchpads die we hebben gezien bij de Pulse en Katana neven.
De respons van het touchpad is goed en gebaren werken goed dankzij de Windows Precision drivers. De linker- en rechtermuisknop liggen gelijk met het touchpad en klikken moeiteloos, zij het met wat ruis.
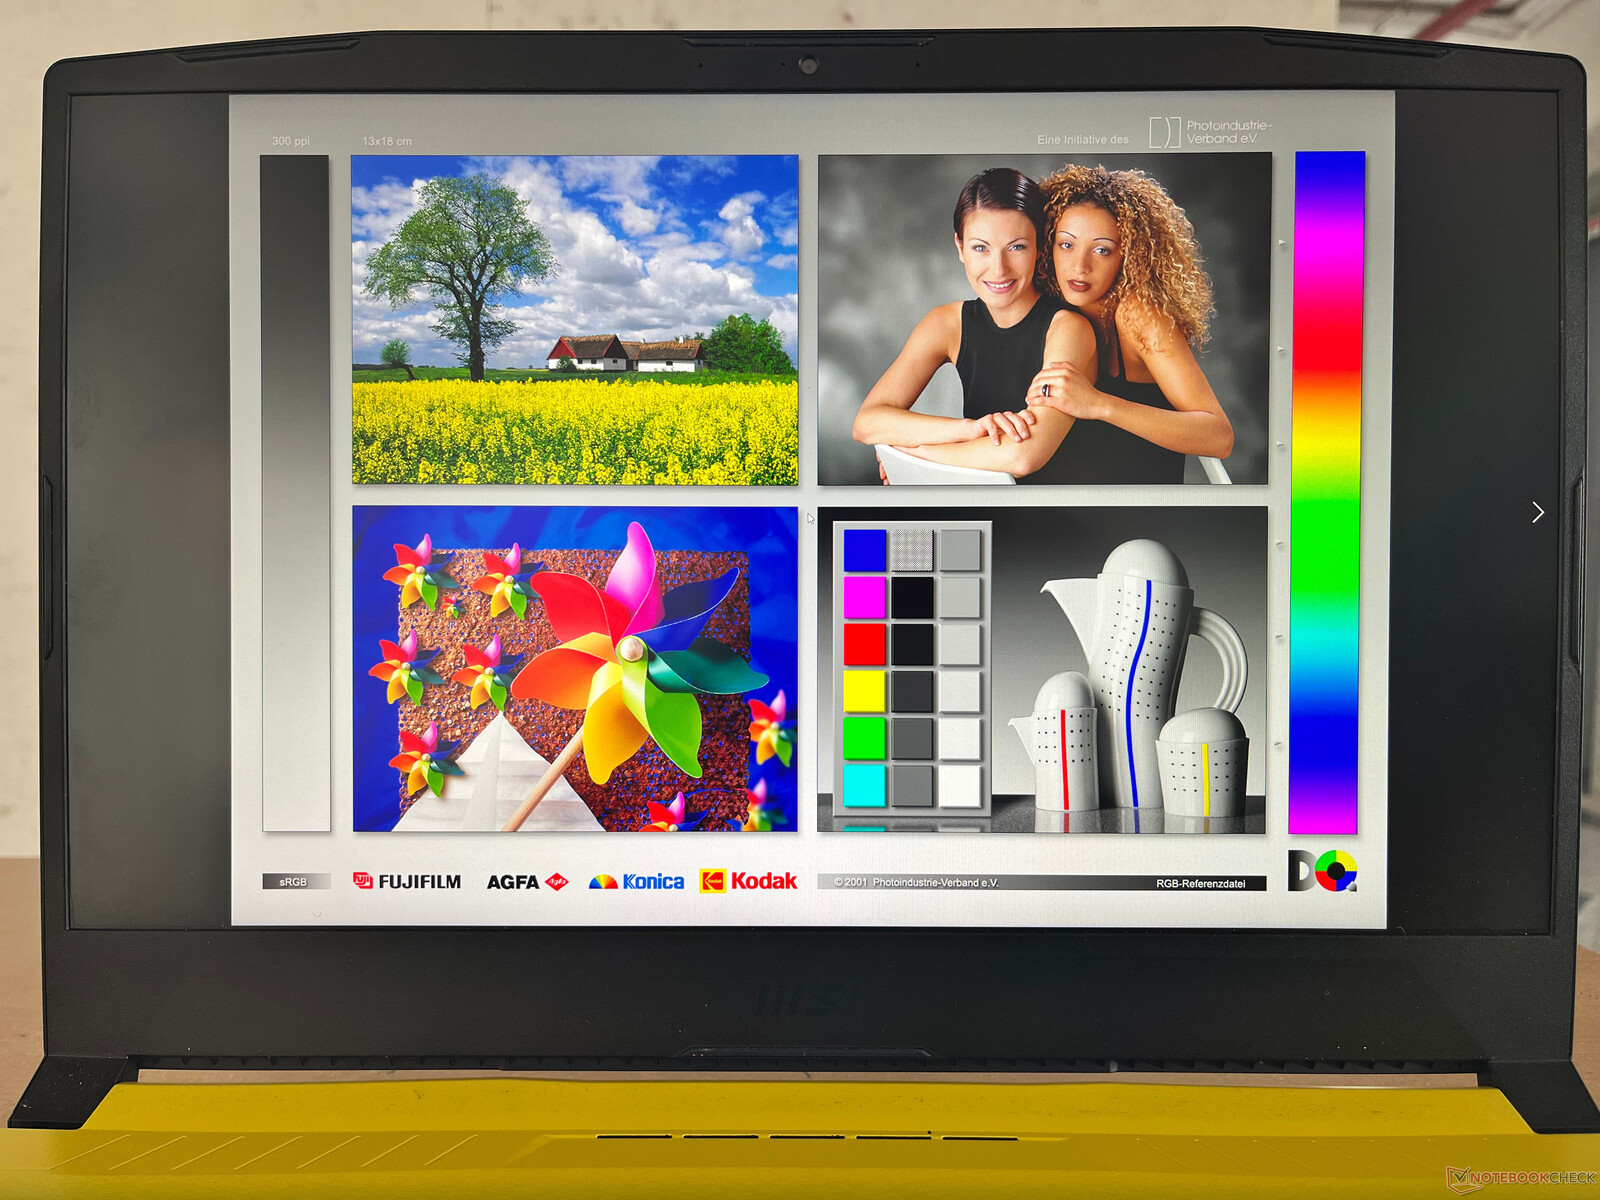
Beeldscherm: QHD 165 Hz paneel met breed kleurenspectrum en geen PWM
MSI biedt in beide Crosshair 15 R6E SKU's een 15,6-inch QHD IPS-paneel met een verversingssnelheid van 165 Hz. Er is geen ondersteuning voor HDR10 of Dolby Vision. We registreerden een maximale helderheid van 342 nits, wat geschikt zou moeten zijn voor gebruik binnenshuis.
Een helderheidsverdeling van 89% en een gemeten contrastverhouding van 1069:1 bieden een fatsoenlijke kijkervaring. Dit is vergelijkbaar met wat we eerder hebben waargenomen bij de Asus ROG Zephyrus G15 en de Acer Nitro 5, die hetzelfde paneel gebruiken.
We zien echter aanzienlijke backlight bleeding in de buurt van de onderste hoeken van het scherm.

| |||||||||||||||||||||||||
Helderheidsverdeling: 89 %
Helderheid in Batterij-modus: 341 cd/m²
Contrast: 1069:1 (Zwart: 0.32 cd/m²)
ΔE ColorChecker Calman: 3.71 | ∀{0.5-29.43 Ø4.71}
calibrated: 2.59
ΔE Greyscale Calman: 3 | ∀{0.09-98 Ø4.96}
84.7% AdobeRGB 1998 (Argyll 3D)
99.8% sRGB (Argyll 3D)
94.8% Display P3 (Argyll 3D)
Gamma: 2.07
CCT: 6621 K
| MSI Crosshair 15 R6E B12UGZ-050 CMN N156KME-GNA, IPS-Level, 2560x1440, 15.6" | MSI Stealth GS66 12UGS Sharp LQ156T1JW04 (SHP153C), IPS-Level, 2560x1440, 15.6" | Lenovo Legion 5 Pro 16 G7 i7 RTX 3070Ti NE160QDM-NY1, IPS, 2560x1600, 16" | Acer Nitro 5 AN515-58-72QR Chi Mei N156KME-GNA, IPS, 2560x1440, 15.6" | Schenker XMG Neo 15 (Ryzen 9 6900HX, RTX 3070 Ti) BOE0A67, IPS, 2560x1440, 15.6" | |
|---|---|---|---|---|---|
| Display | 1% | -15% | 1% | -15% | |
| Display P3 Coverage (%) | 94.8 | 96.4 2% | 68.7 -28% | 95.6 1% | 68.9 -27% |
| sRGB Coverage (%) | 99.8 | 99.7 0% | 97.6 -2% | 99.8 0% | 97.7 -2% |
| AdobeRGB 1998 Coverage (%) | 84.7 | 85.6 1% | 70.9 -16% | 85.2 1% | 70.4 -17% |
| Response Times | -8% | -112% | -110% | -70% | |
| Response Time Grey 50% / Grey 80% * (ms) | 5.36 ? | 6 ? -12% | 17.6 ? -228% | 15.7 ? -193% | 12.4 ? -131% |
| Response Time Black / White * (ms) | 8.04 ? | 8.4 ? -4% | 7.6 ? 5% | 10.2 ? -27% | 8.8 ? -9% |
| PWM Frequency (Hz) | |||||
| Screen | -13% | 25% | -1% | 14% | |
| Brightness middle (cd/m²) | 342 | 272 -20% | 502 47% | 332 -3% | 370 8% |
| Brightness (cd/m²) | 326 | 253 -22% | 491 51% | 303 -7% | 343 5% |
| Brightness Distribution (%) | 89 | 87 -2% | 91 2% | 86 -3% | 82 -8% |
| Black Level * (cd/m²) | 0.32 | 0.25 22% | 0.37 -16% | 0.29 9% | 0.28 12% |
| Contrast (:1) | 1069 | 1088 2% | 1357 27% | 1145 7% | 1321 24% |
| Colorchecker dE 2000 * | 3.71 | 3.73 -1% | 2.7 27% | 3.61 3% | 2.31 38% |
| Colorchecker dE 2000 max. * | 6.51 | 9.43 -45% | 4.5 31% | 7.71 -18% | 4.03 38% |
| Colorchecker dE 2000 calibrated * | 2.59 | 0.98 62% | 1.4 46% | 0.59 77% | |
| Greyscale dE 2000 * | 3 | 6.5 -117% | 2.7 10% | 5.2 -73% | 3.28 -9% |
| Gamma | 2.07 106% | 2.172 101% | 2.44 90% | 2.155 102% | 2.47 89% |
| CCT | 6621 98% | 6485 100% | 6326 103% | 6724 97% | 6206 105% |
| Totaal Gemiddelde (Programma / Instellingen) | -7% /
-10% | -34% /
-3% | -37% /
-16% | -24% /
-6% |
* ... kleiner is beter
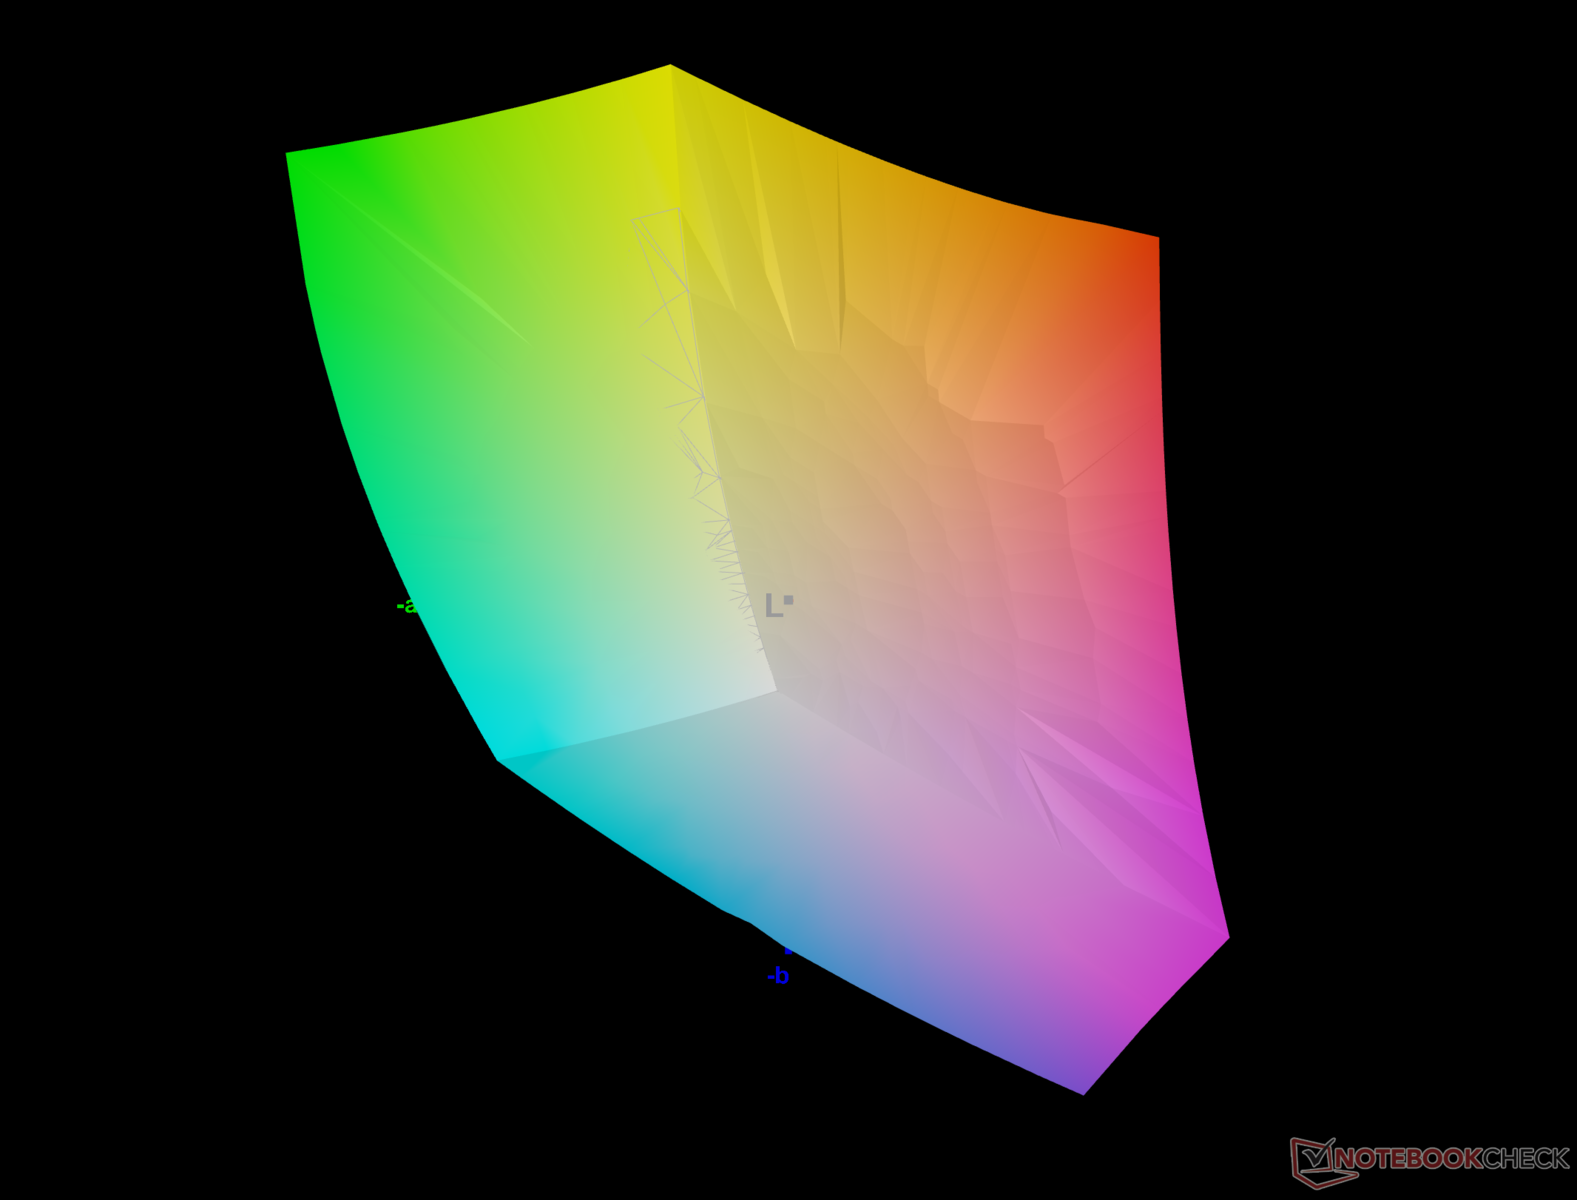
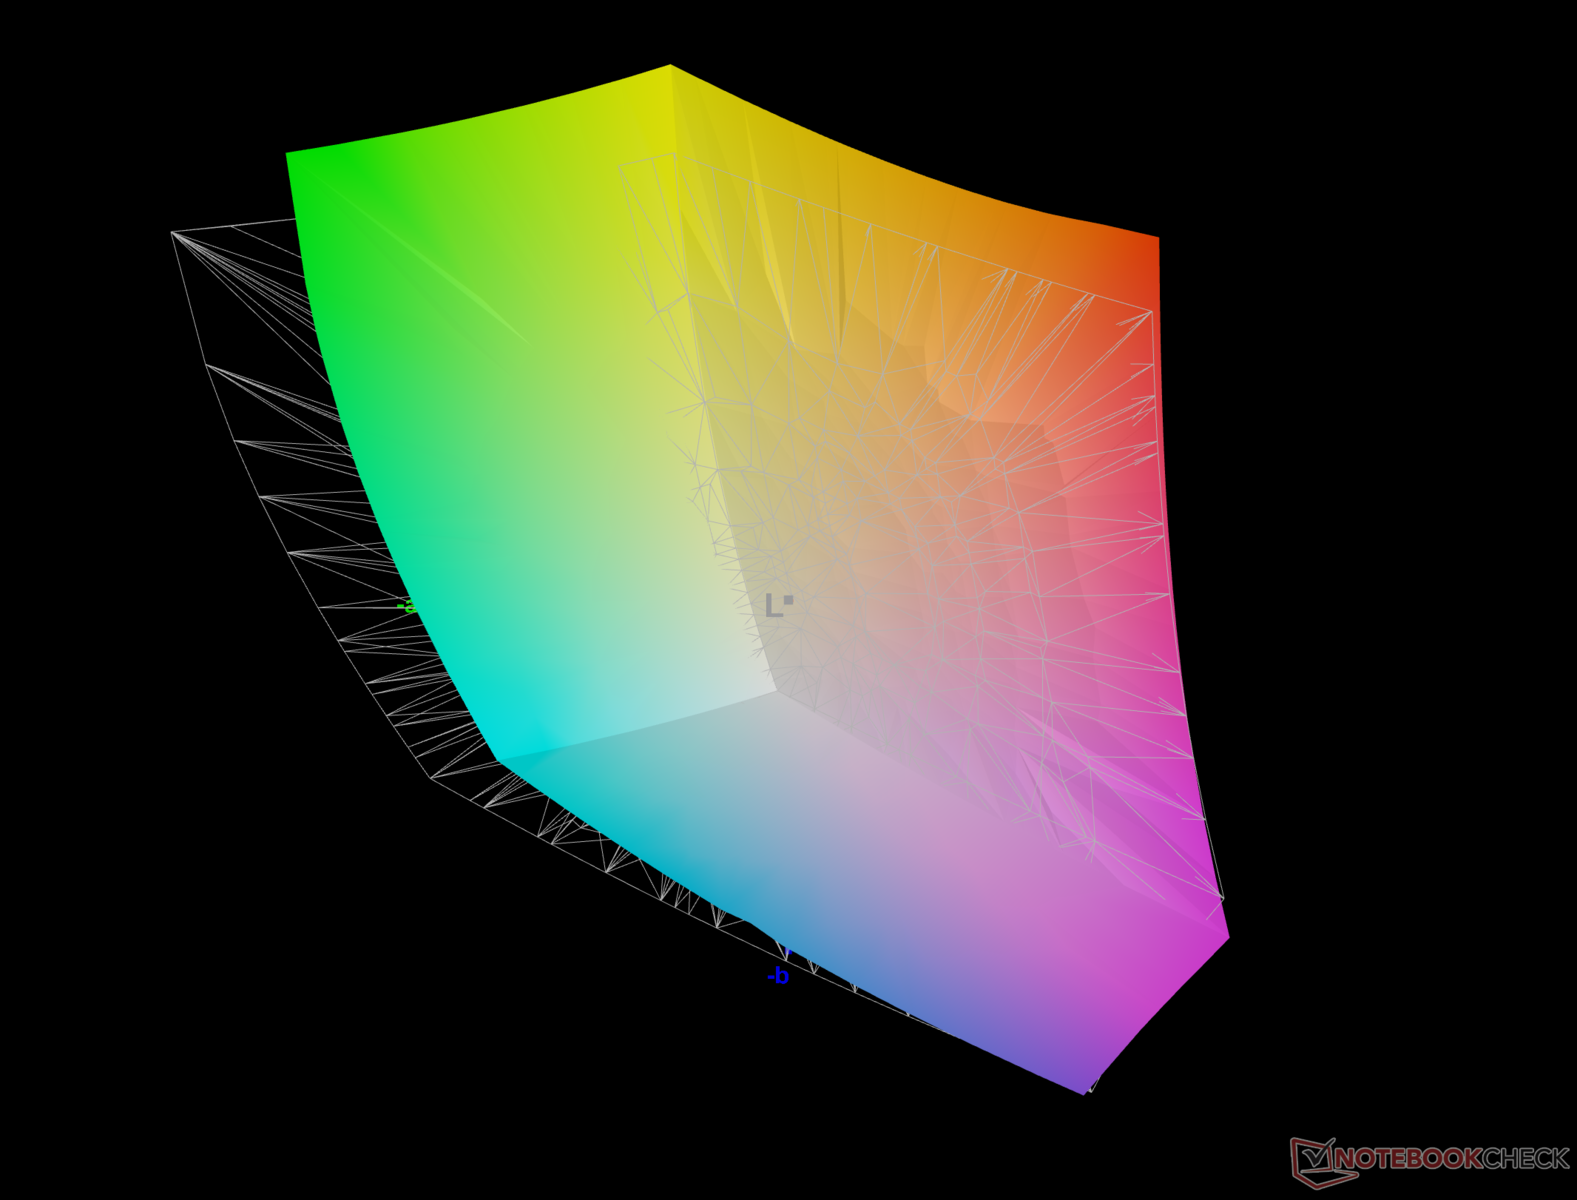
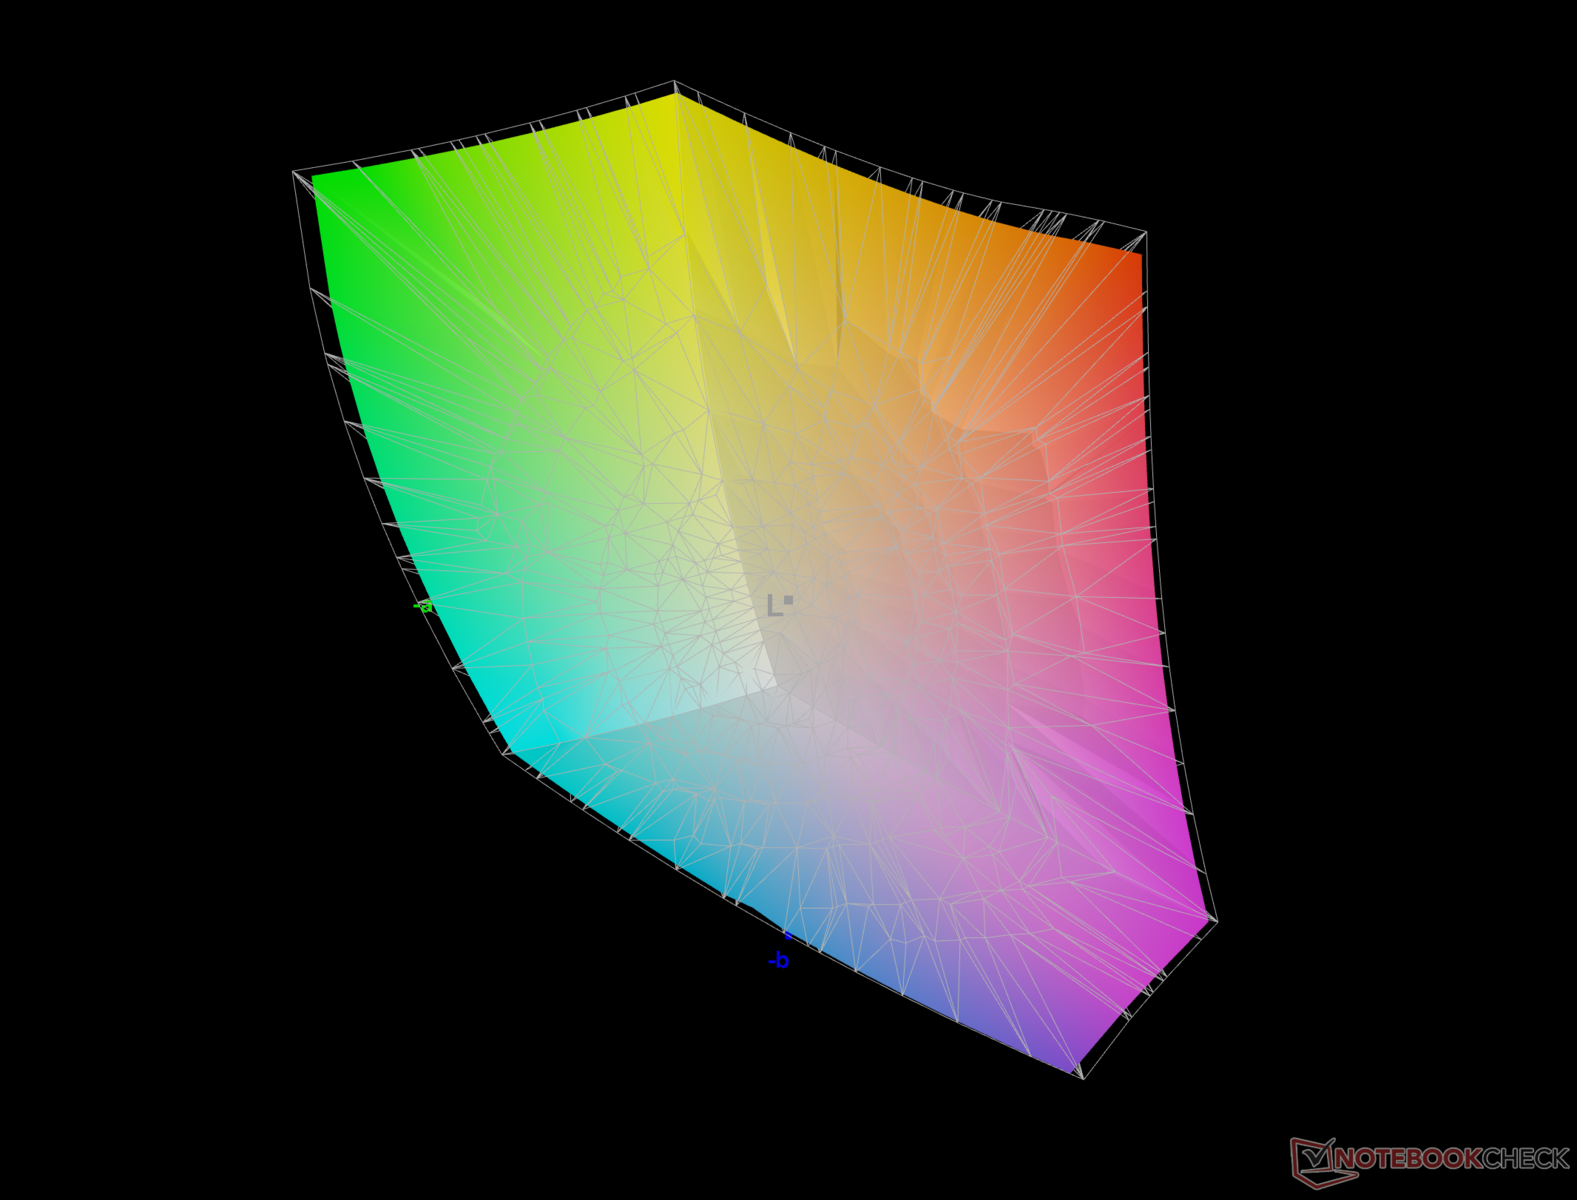
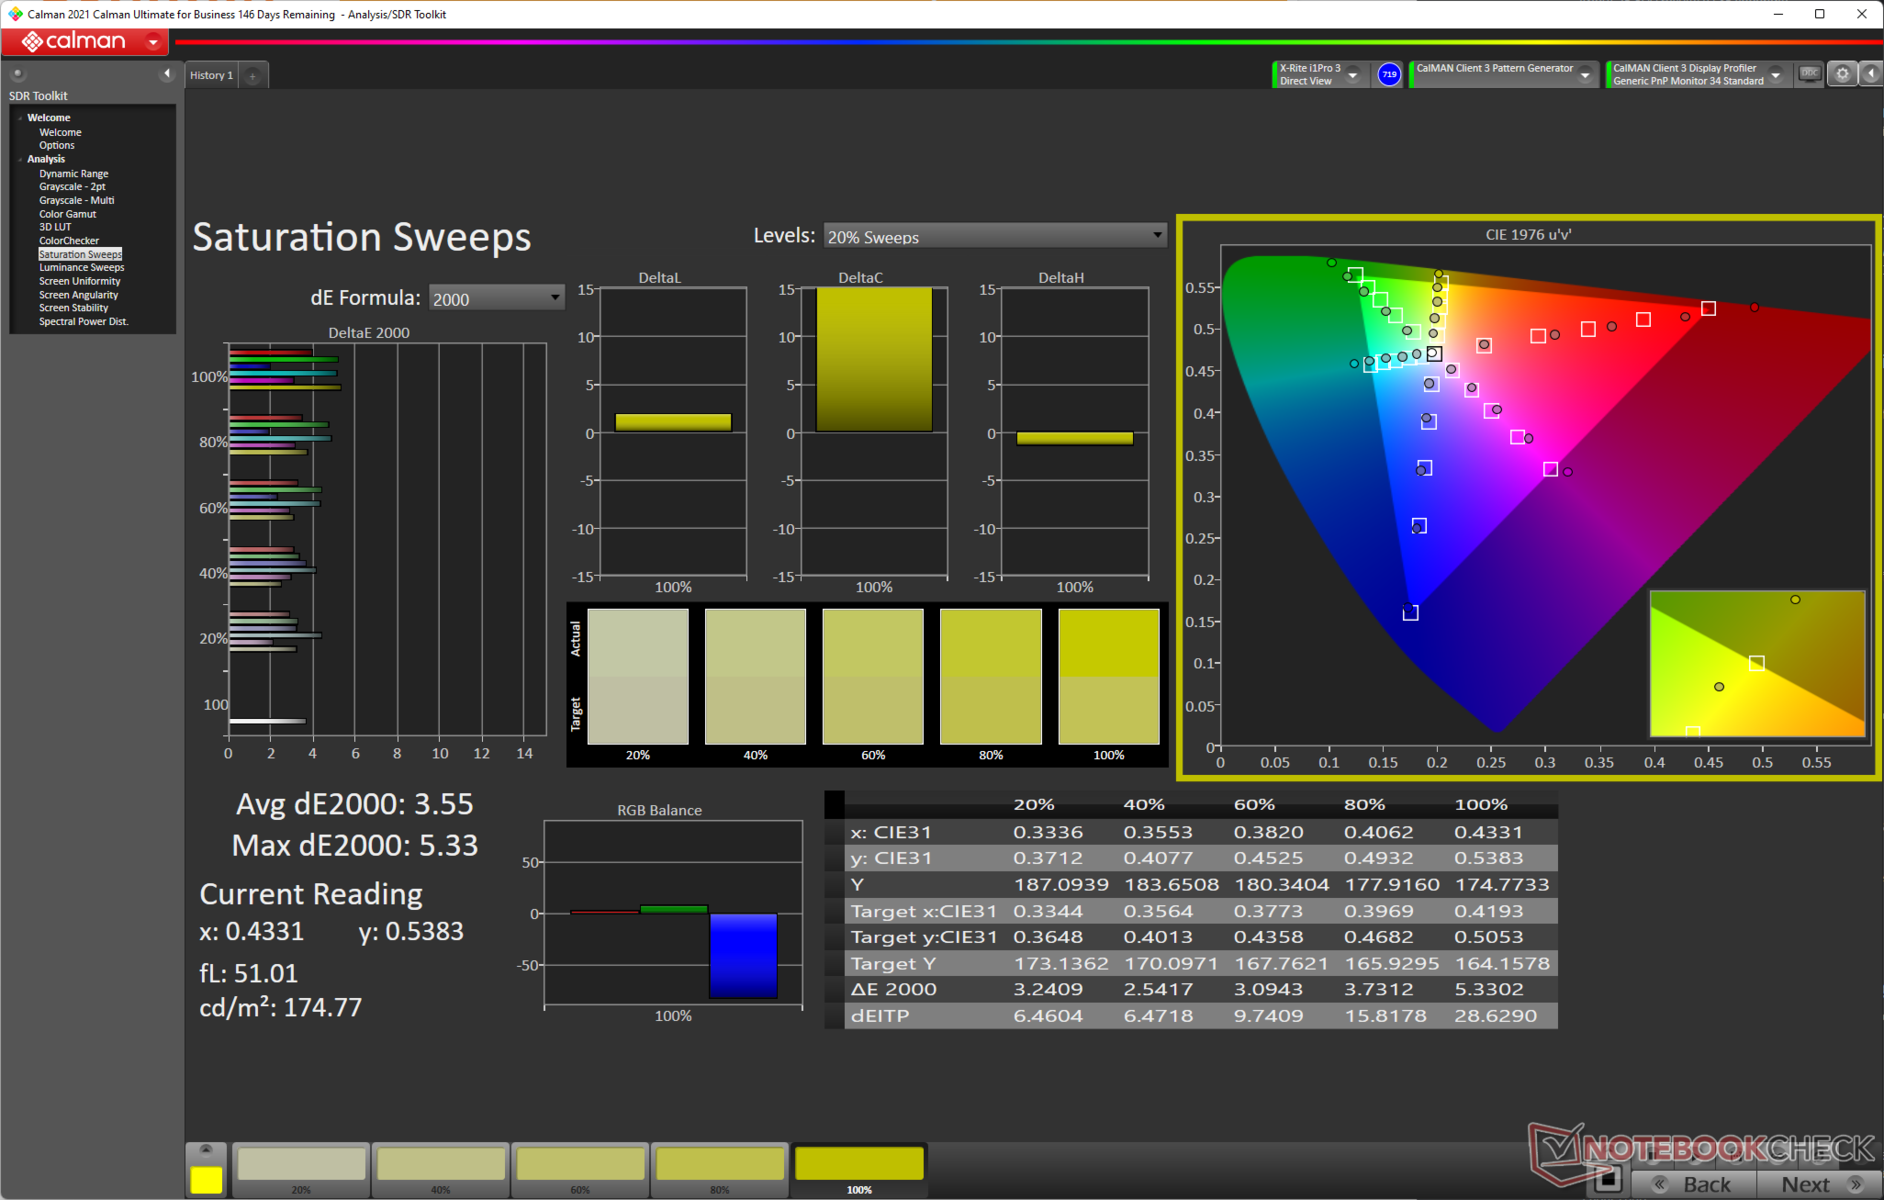
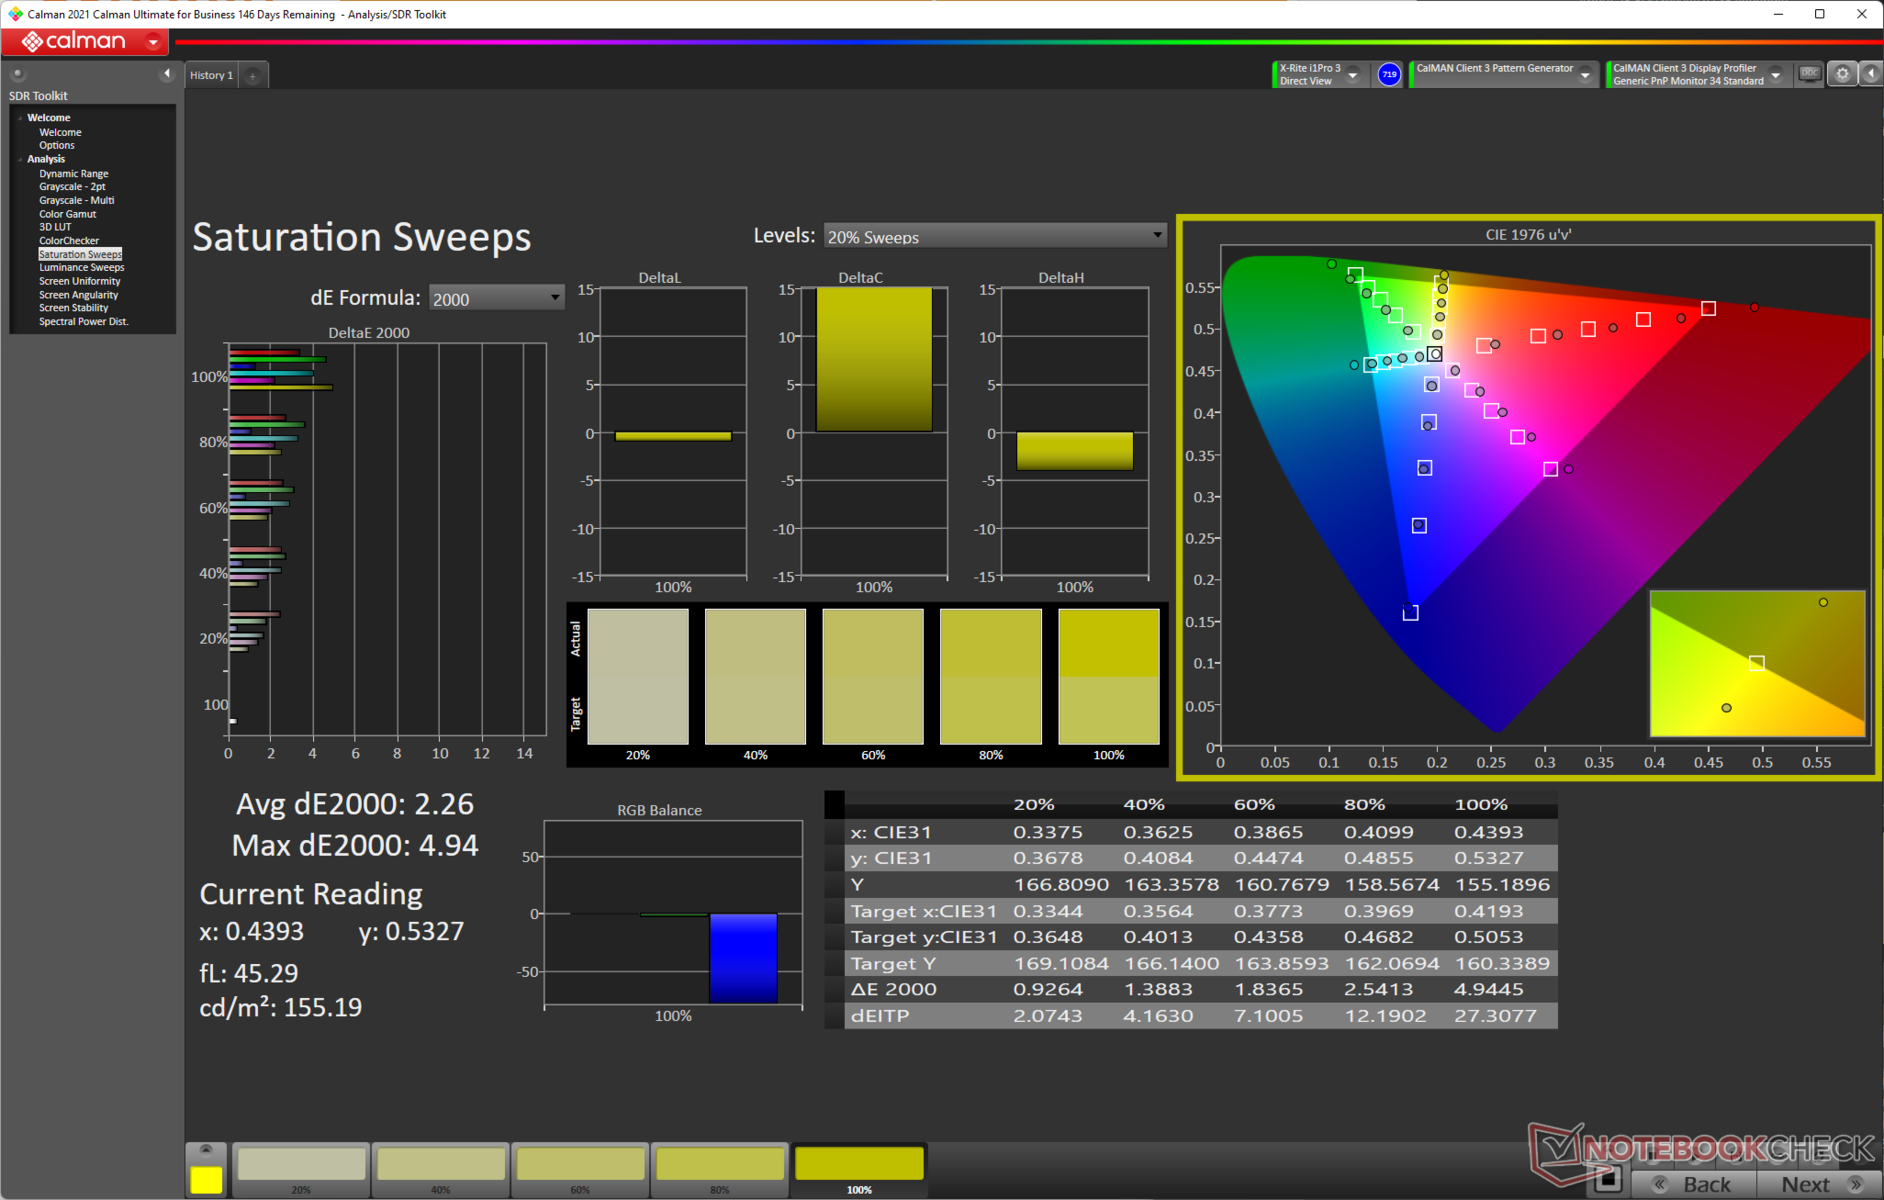
MSI beweert dat het paneel van de Crosshair 15 100% DCI-P3 kleurruimte kan dekken. In onze tests vonden we dat het bijna 95% Display P3 kan doen, wat de interesse van content creators zou moeten wekken. Het paneel dekt het volledige sRGB-kleurengamma. De Adobe RGB dekking is ook behoorlijk met bijna 85%.
We merken op dat de kleurbereikdekking vergelijkbaar is met de Acer Nitro 5 en Aorus 15 XE5met hetzelfde Chi Mei N156KME-GNA paneel. Het is goed om te zien dat fabrikanten eindelijk rekening houden met goede kleurprestaties voor deze prijzen.
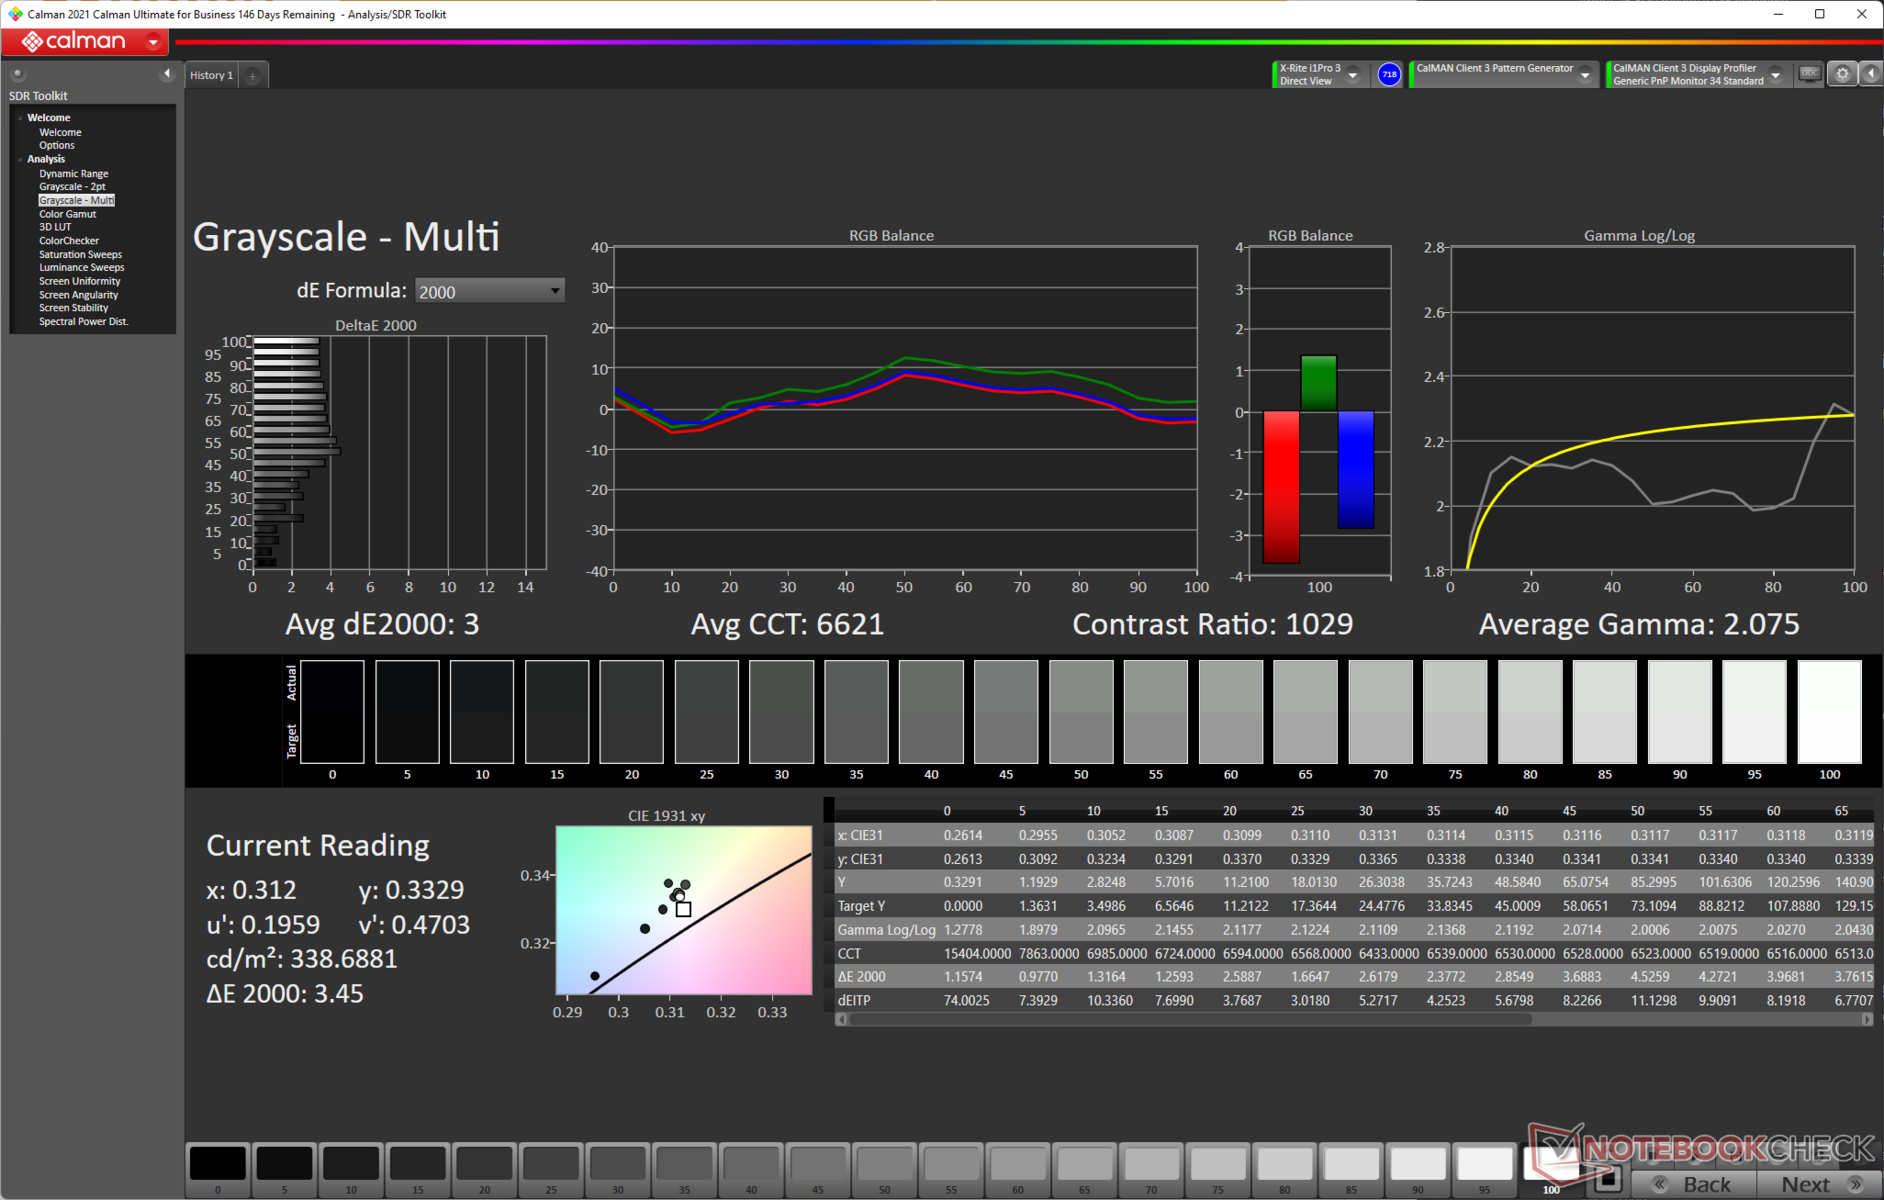
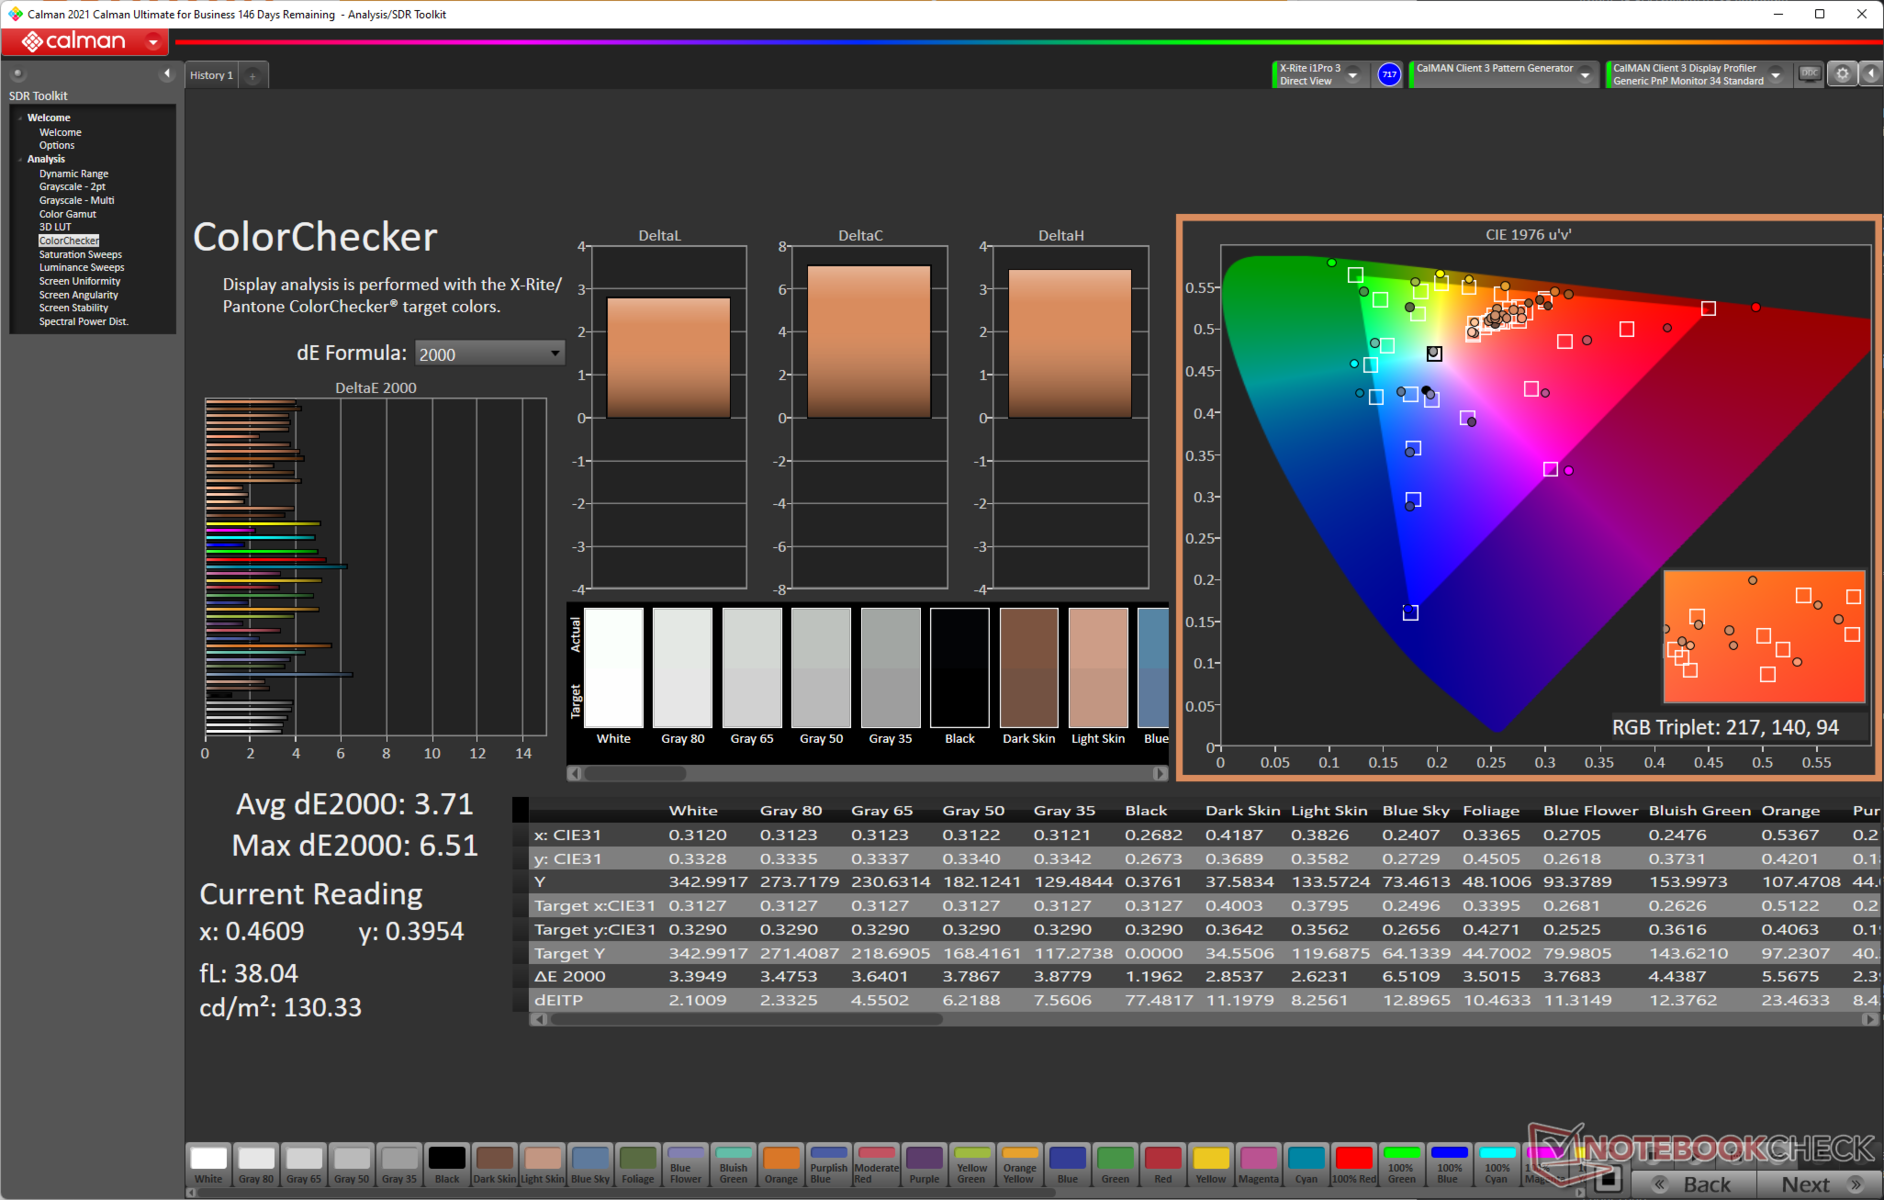
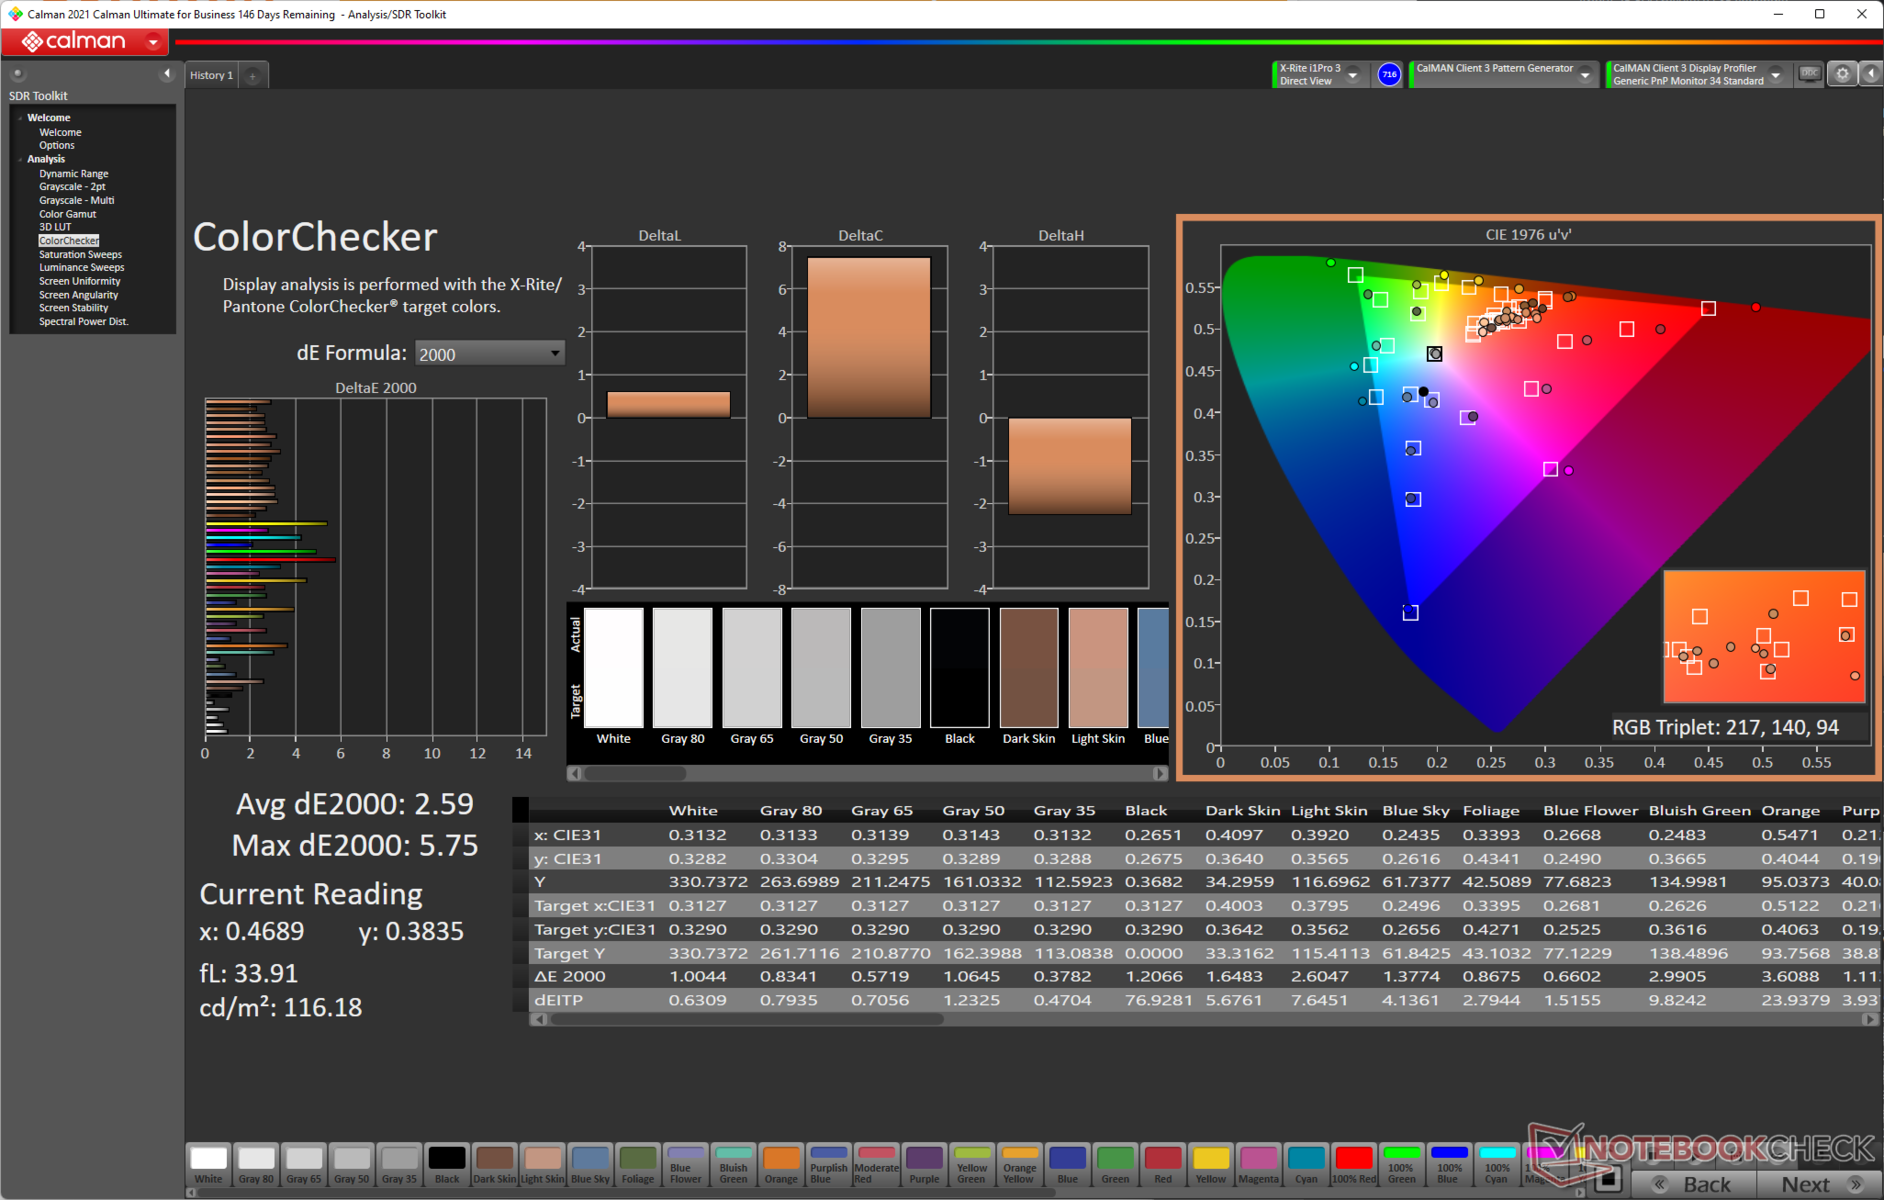
De kleurnauwkeurigheid uit de doos is zeker bruikbaar met een grijswaarden Delta E van 3 en een gemiddelde ColorChecker Delta E van 3,71
Onze kalibratieroutine met de X-rite i1Basic Pro 3 spectrofotometer en Calman Ultimate kleurkalibratiesoftware van Portrait Displays resulteert in een aanzienlijk lagere Delta E in grijswaarden van 0,7 en een waarneembare gemiddelde Delta E verbetering tot 2,59 in ColorChecker. Hogere afwijkingen worden gezien bij de rode kleur.
Het gekalibreerde ICC-bestand kan worden gedownload via bovenstaande link.

Responstijd Scherm
| ↔ Responstijd Zwart naar Wit | ||
|---|---|---|
| 8.04 ms ... stijging ↗ en daling ↘ gecombineerd | ↗ 4.72 ms stijging | 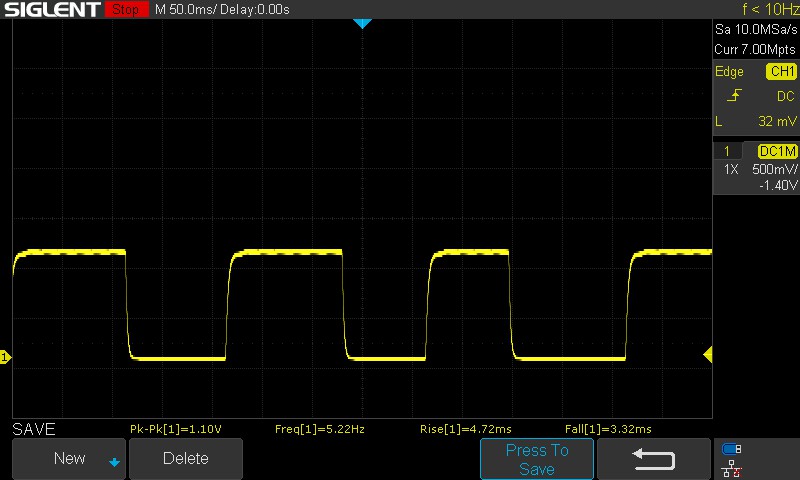 |
| ↘ 3.32 ms daling | ||
| Het scherm vertoonde snelle responstijden in onze tests en zou geschikt moeten zijn voor games. Ter vergelijking: alle testtoestellen variëren van 0.1 (minimum) tot 240 (maximum) ms. » 24 % van alle toestellen zijn beter. Dit betekent dat de gemeten responstijd beter is dan het gemiddelde (19.8 ms) van alle geteste toestellen. | ||
| ↔ Responstijd 50% Grijs naar 80% Grijs | ||
| 5.36 ms ... stijging ↗ en daling ↘ gecombineerd | ↗ 2.71 ms stijging | 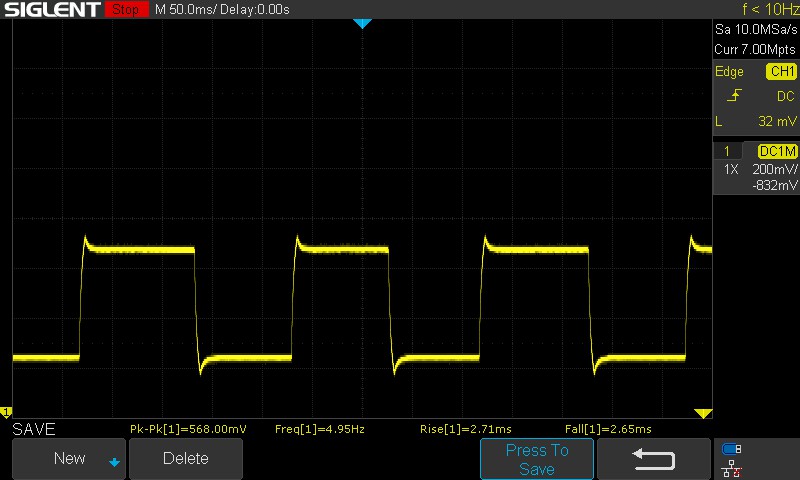 |
| ↘ 2.65 ms daling | ||
| Het scherm vertoonde erg snelle responstijden in onze tests en zou zeer geschikt moeten zijn voor snelle games. Ter vergelijking: alle testtoestellen variëren van 0.165 (minimum) tot 636 (maximum) ms. » 18 % van alle toestellen zijn beter. Dit betekent dat de gemeten responstijd beter is dan het gemiddelde (31 ms) van alle geteste toestellen. | ||
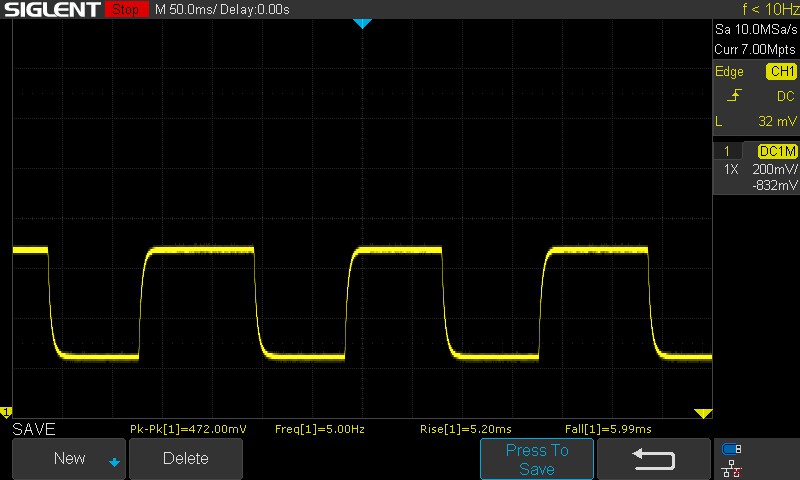
De reactietijden zijn behoorlijk, hoewel we graag lagere waarden hadden gezien voor de overgang van 100% zwart naar 100% wit
Het paneel gebruikt standaard overdrive, wat te zien is als een "hoorn" in het oscilloscooppatroon van 50% grijs naar 80% grijs.
Zonder overdrive ingeschakeld kan deze waarde oplopen tot 11,19 ms.
Screen Flickering / PWM (Pulse-Width Modulation)
| Screen flickering / PWM niet waargenomen | ≤ 100 % helderheid instelling | 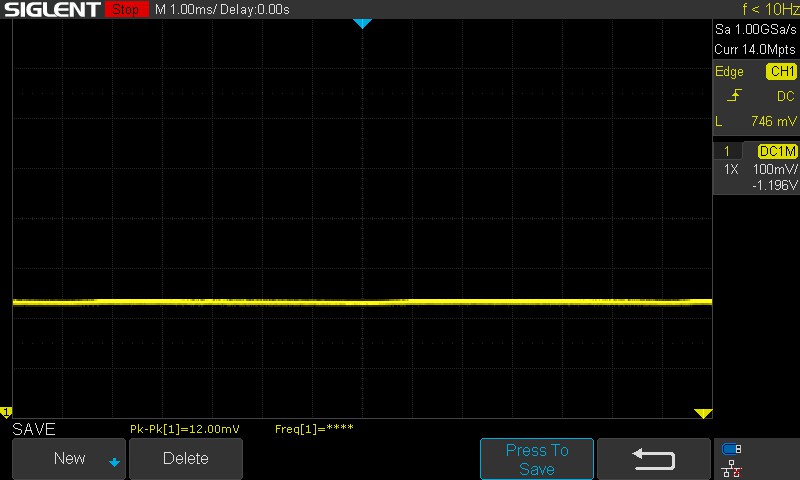 | |
Ter vergelijking: 52 % van alle geteste toestellen maakten geen gebruik van PWM om de schermhelderheid te verlagen. Als het wel werd gebruikt, werd een gemiddelde van 7754 (minimum: 5 - maximum: 343500) Hz waargenomen. | |||
We hebben geen PWM flikkering waargenomen bij alle geteste helderheidsniveaus, dus dat is een ding minder om je zorgen over te maken tijdens lange werkuren of gaming sessies.
Bekijk ons artikel over "Waarom Pulse Width Modulation (PWM) zo'n hoofdpijn is", en ook onze PWM ranglijst voor vergelijkingen tussen alle beoordeelde apparaten.
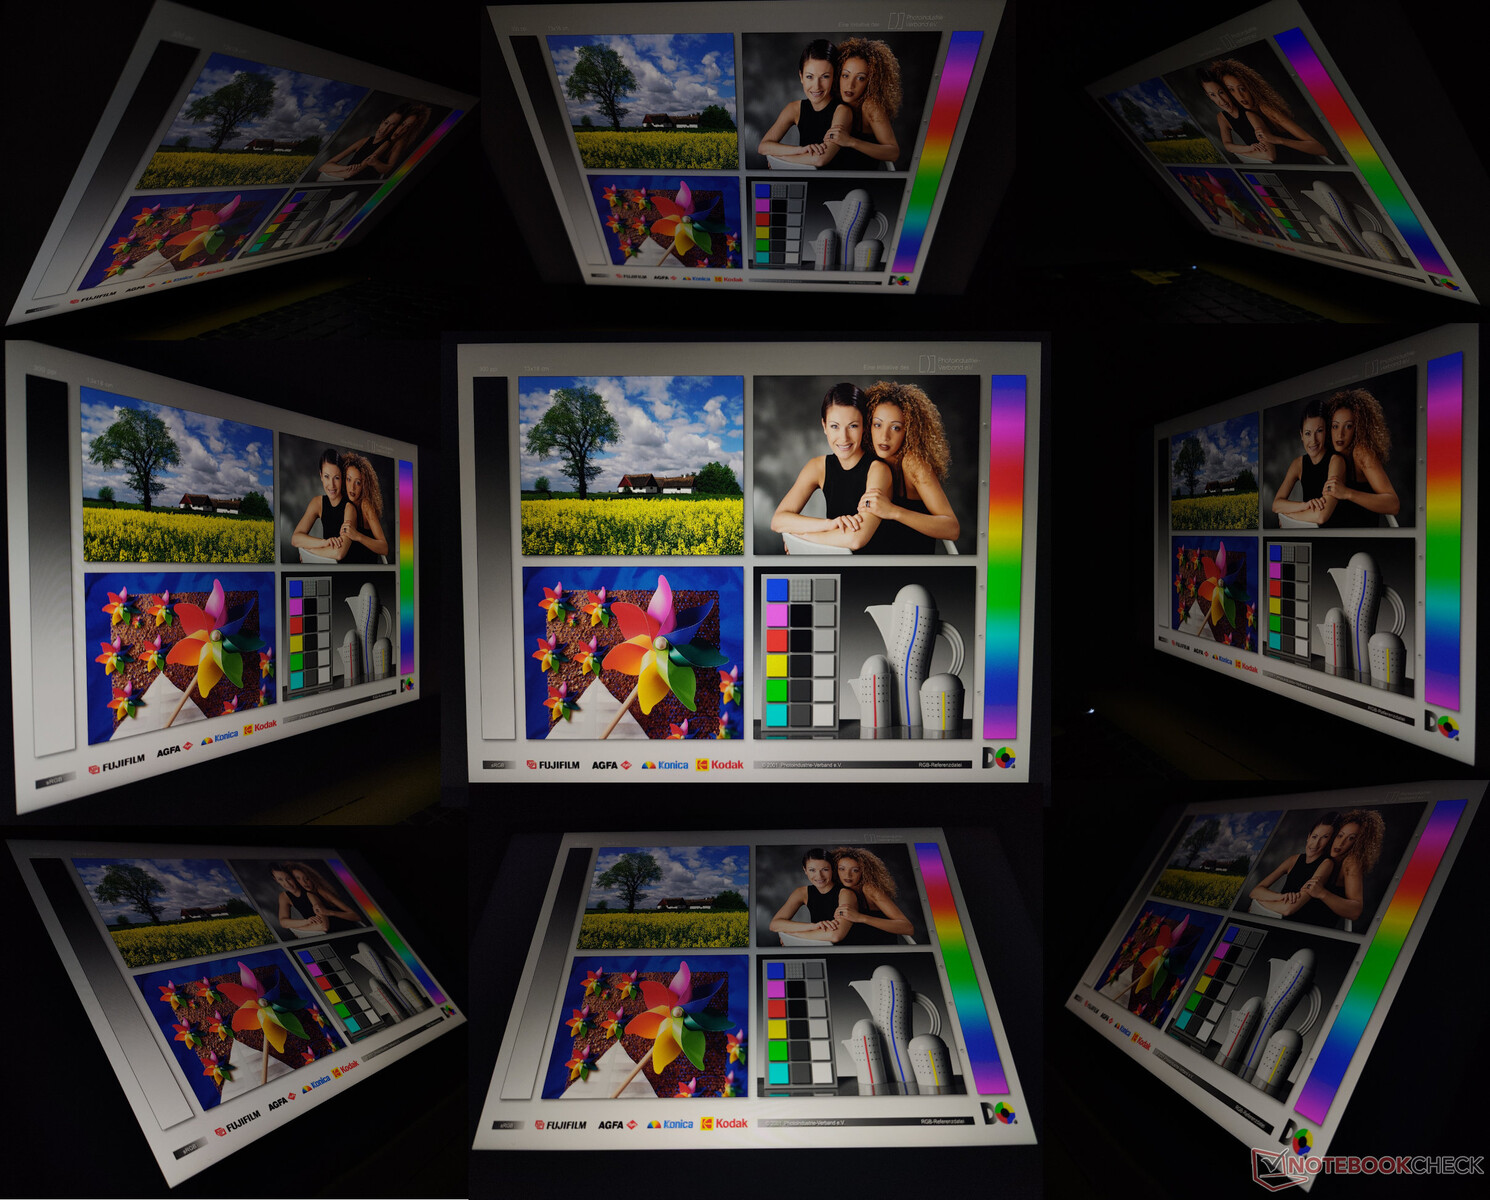
De weergave buitenshuis is goed leesbaar zolang er geen direct zonlicht op het scherm valt. De kijkhoeken zijn echter niet bijzonder indrukwekkend. We zagen verlies van helderheid en kleur bij extreme kijkhoeken.
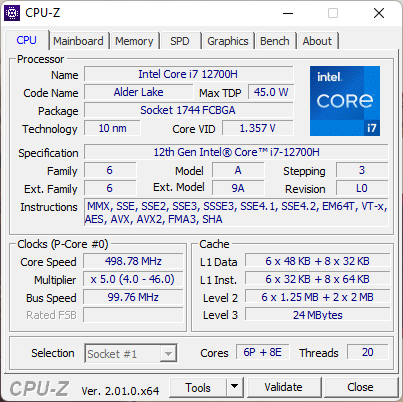
Prestaties: Niet de snelste Core i7-12700H die we hebben gezien
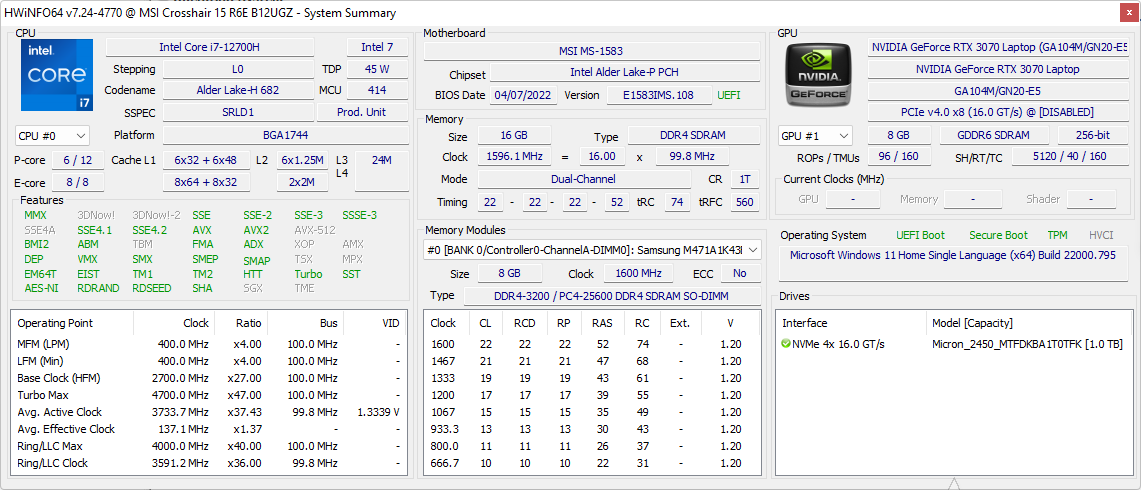
Onze Crosshair 15 R6E wordt aangedreven door een Intel Core i7-12700H processor en een 140 W Nvidia GeForce RTX 3070 laptop GPU. Kopers hebben ook de mogelijkheid om de laptop te configureren met een RTX 3060 laptop GPU of CPU-opties tot de Alder Lake Core i9.
Testomstandigheden
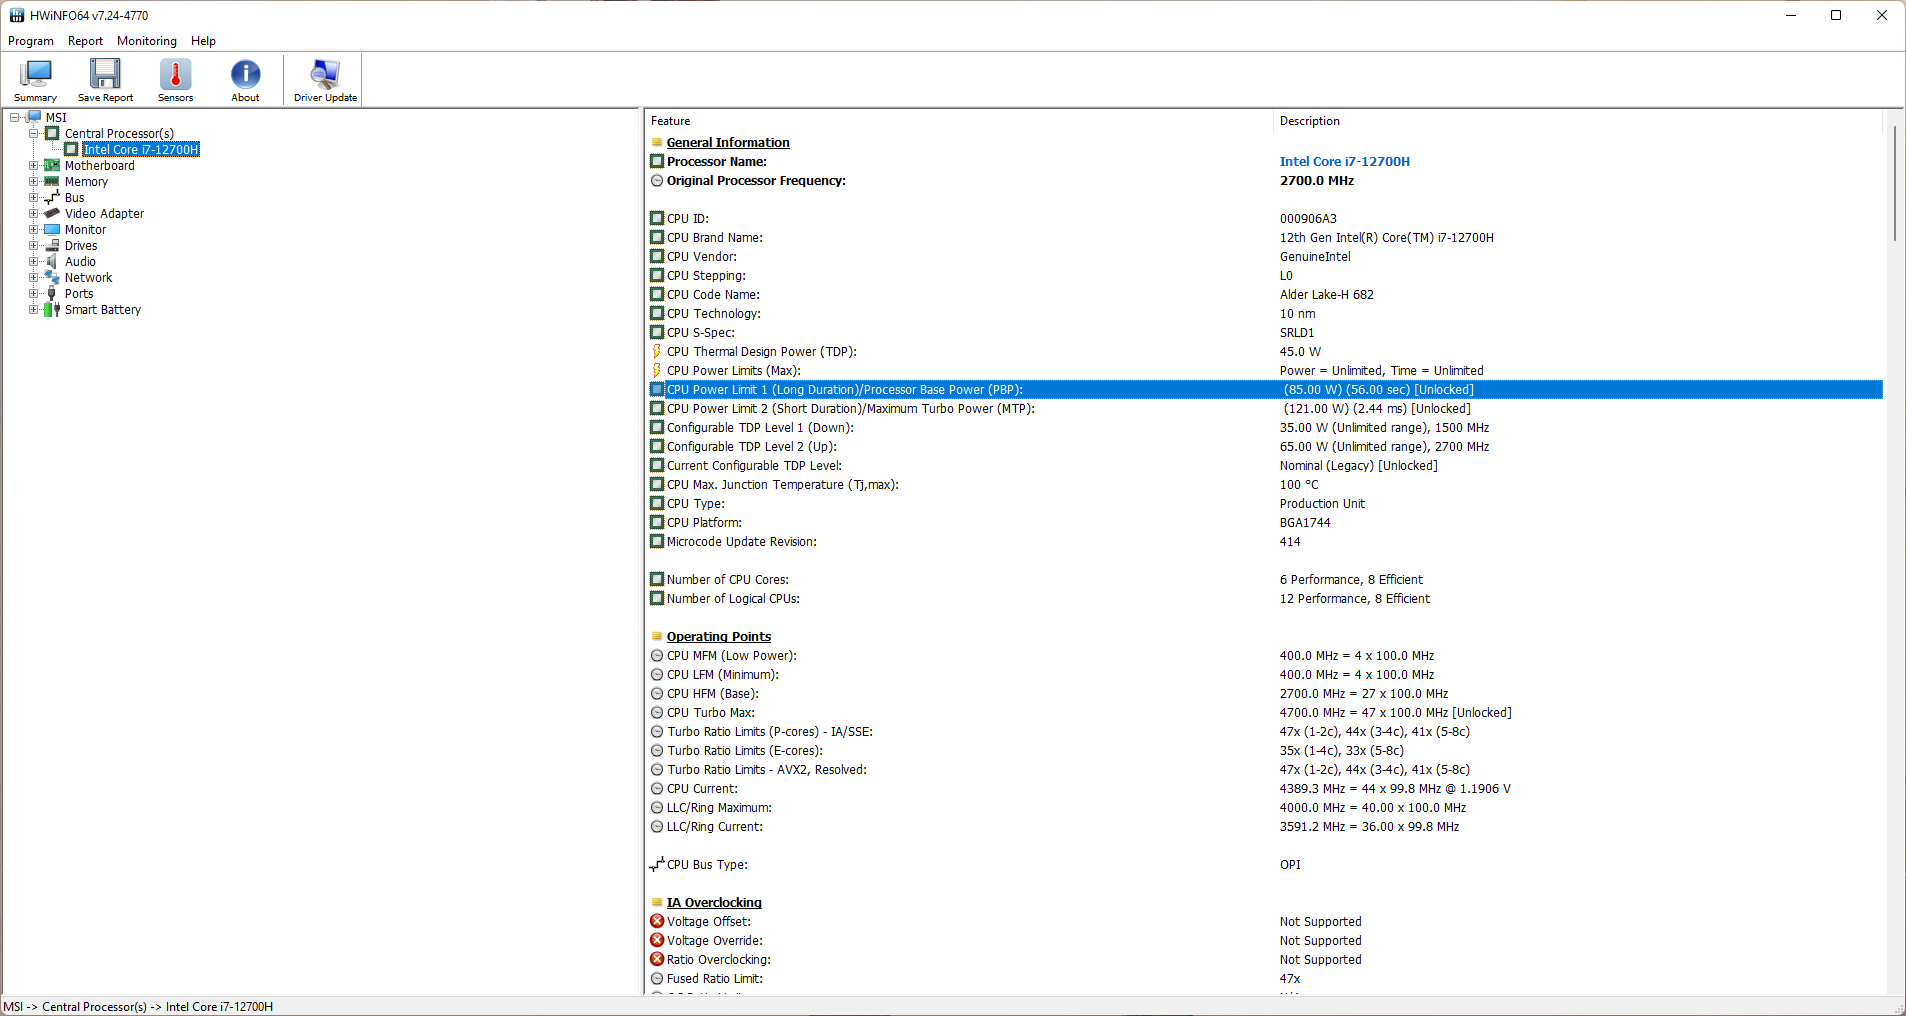
MSI Center biedt een one-stop shop voor het aanpassen van verschillende prestatieparameters van de Crosshair 15 R6E. We gebruikten de Extreme Performance preset om de Core i7-12700H volledig zijn spieren te laten werken. Hierdoor kan de processor werken op een duurzame PL1 van 85 W en kortstondige PL2 van 121 W. Er is geen MUX-schakeloptie beschikbaar voor de dGPU.
Alle tests zijn uitgevoerd in het Extreme Performance-profiel, tenzij anders aangegeven.
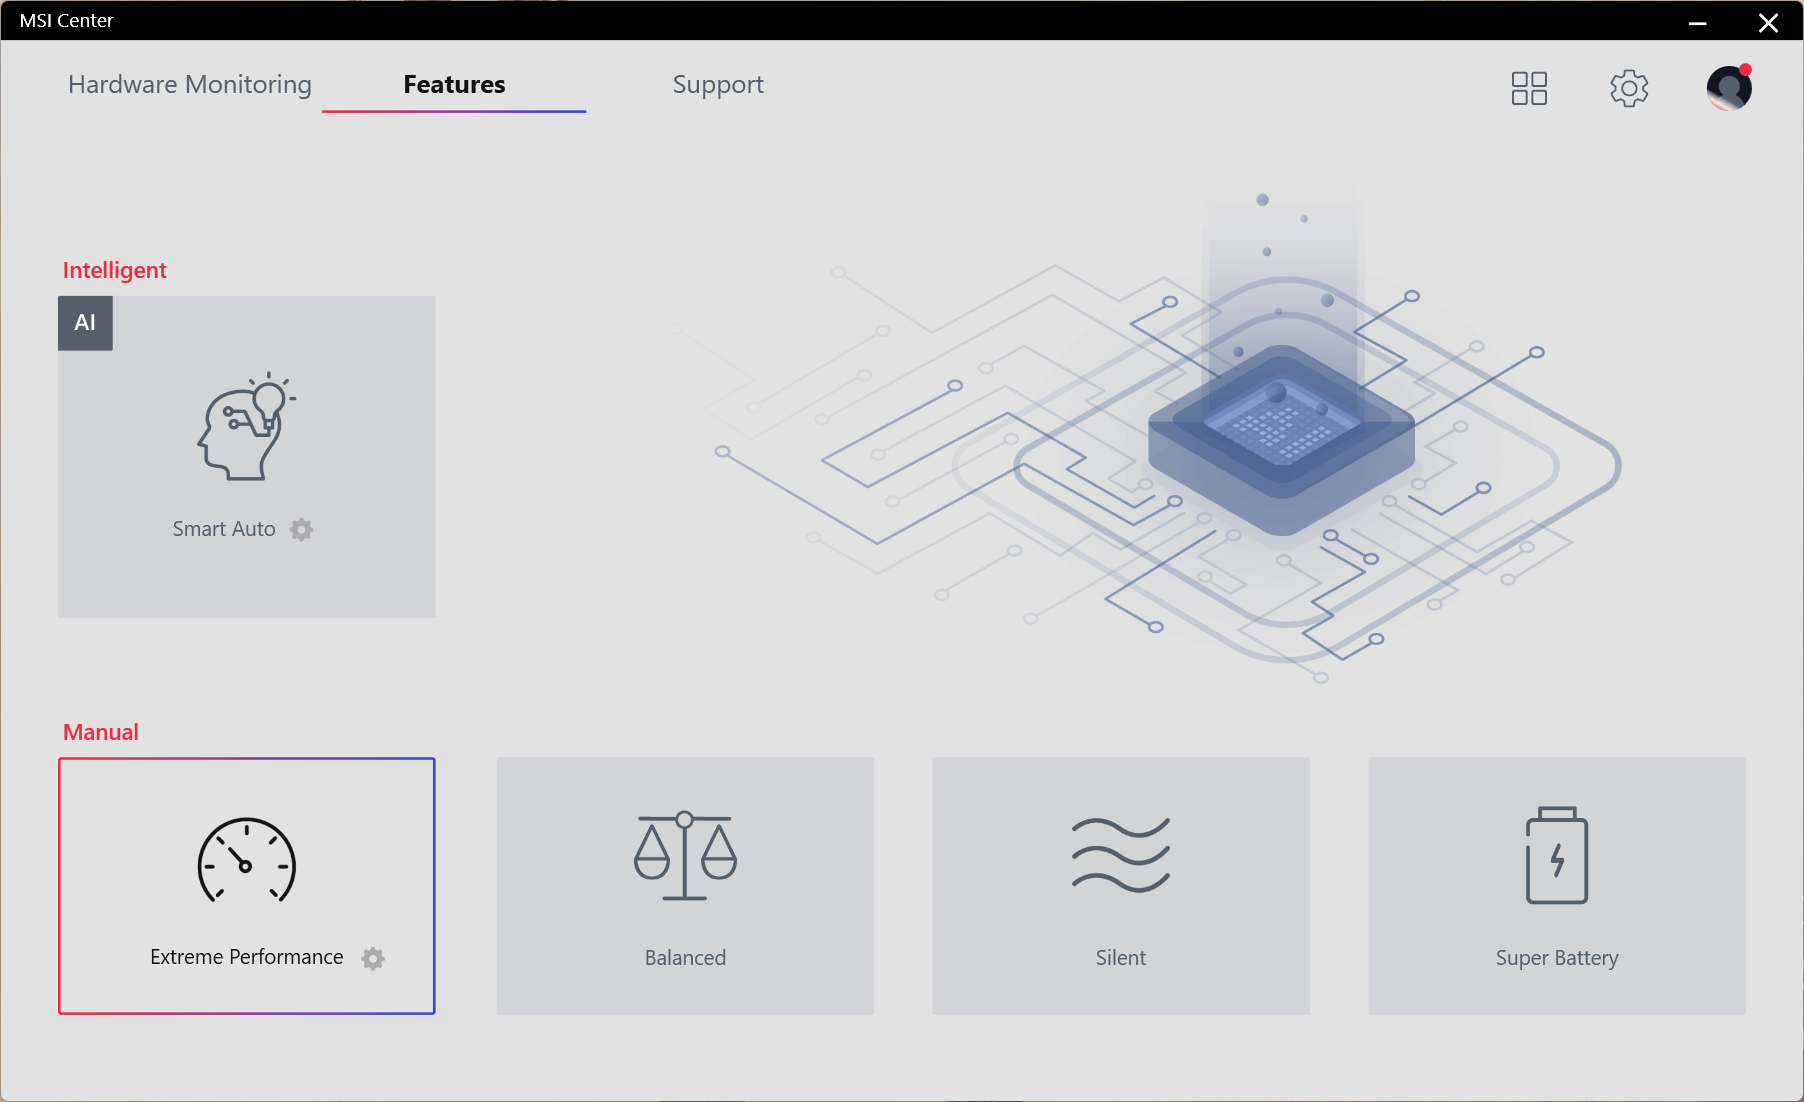
De onderstaande tabel laat zien hoe het basisvermogen van de processor (PBP, PL1) en het maximale turbovermogen (MTP, PL2) veranderen bij elke prestatiemodus. Het Balanced profiel zou aan de meeste behoeften moeten voldoen. Wie de maximaal mogelijke prestaties uit de Core i7-12700H wil halen, kan kiezen voor de modus Extreme prestaties.
| Prestatiemodus | PL1 (PBP) / Tau | PL2 (MTP) / Tau |
|---|---|---|
| Super Battery | 13 W / 56 s | 121 W / 2,44 ms |
| Stil | 23 W / 56 s | 121 W / 2,44 ms |
| Gebalanceerd | 38 W / 56 s | 121 W / 2,44 ms |
| Extreme prestaties | 85 W / 56 s | 121 W / 2,44 ms |
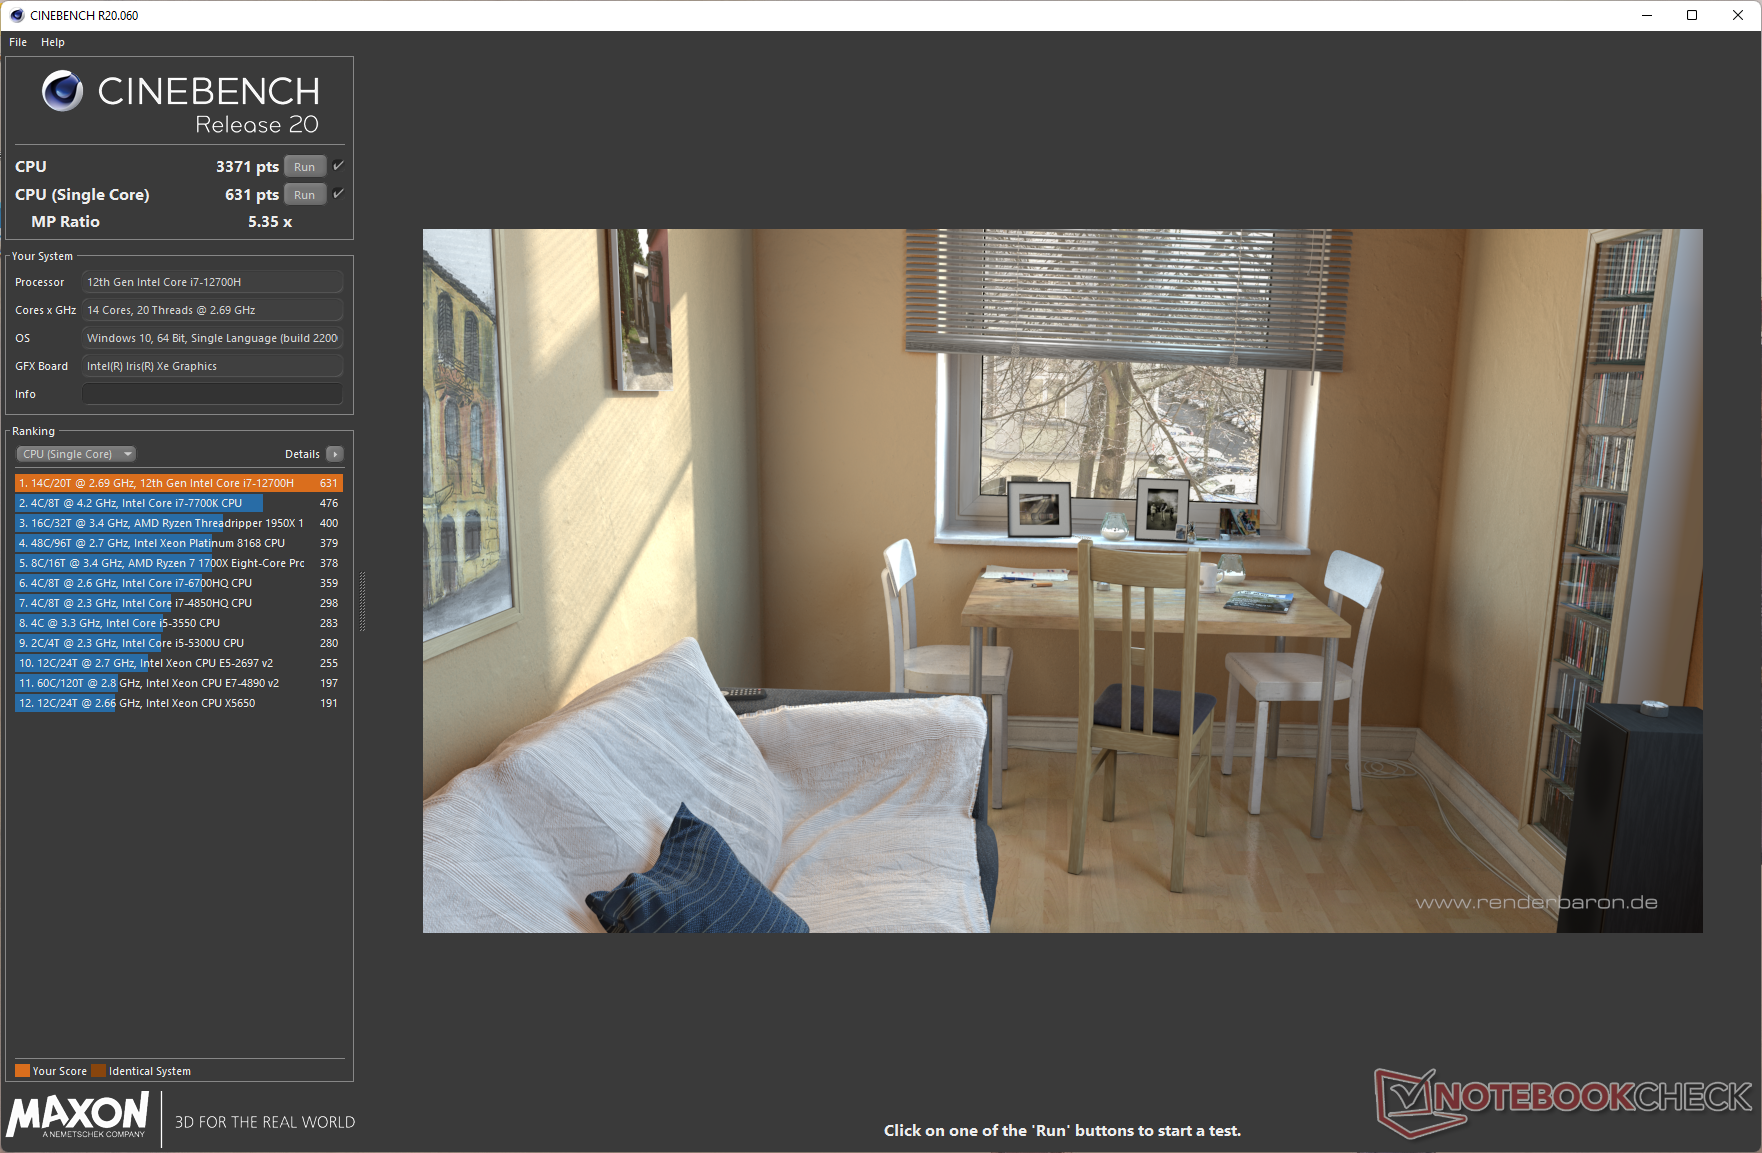
Processor
De Core i7-12700H is een Alder Lake-H processor met zes P-cores en acht E-cores. De Crosshair 15 R6E is in staat om voor deze processor fatsoenlijke aanhoudende prestaties te leveren in onze Cinebench R15 multi-core loop test, die overeenkomt met die van de AMD Ryzen 9 6900HX in de Schenker XMG Neo 15.
Dit is echter niet de snelste Core i7-12700H die we hebben gezien. De uitvoering van de processor in de MSI Stealth GS66 en Lenovo Legion 5i Pro 16 G7 krijgt betere scores door hogere PL1 en PL2 waarden.
Cinebench R15 Multi Loop
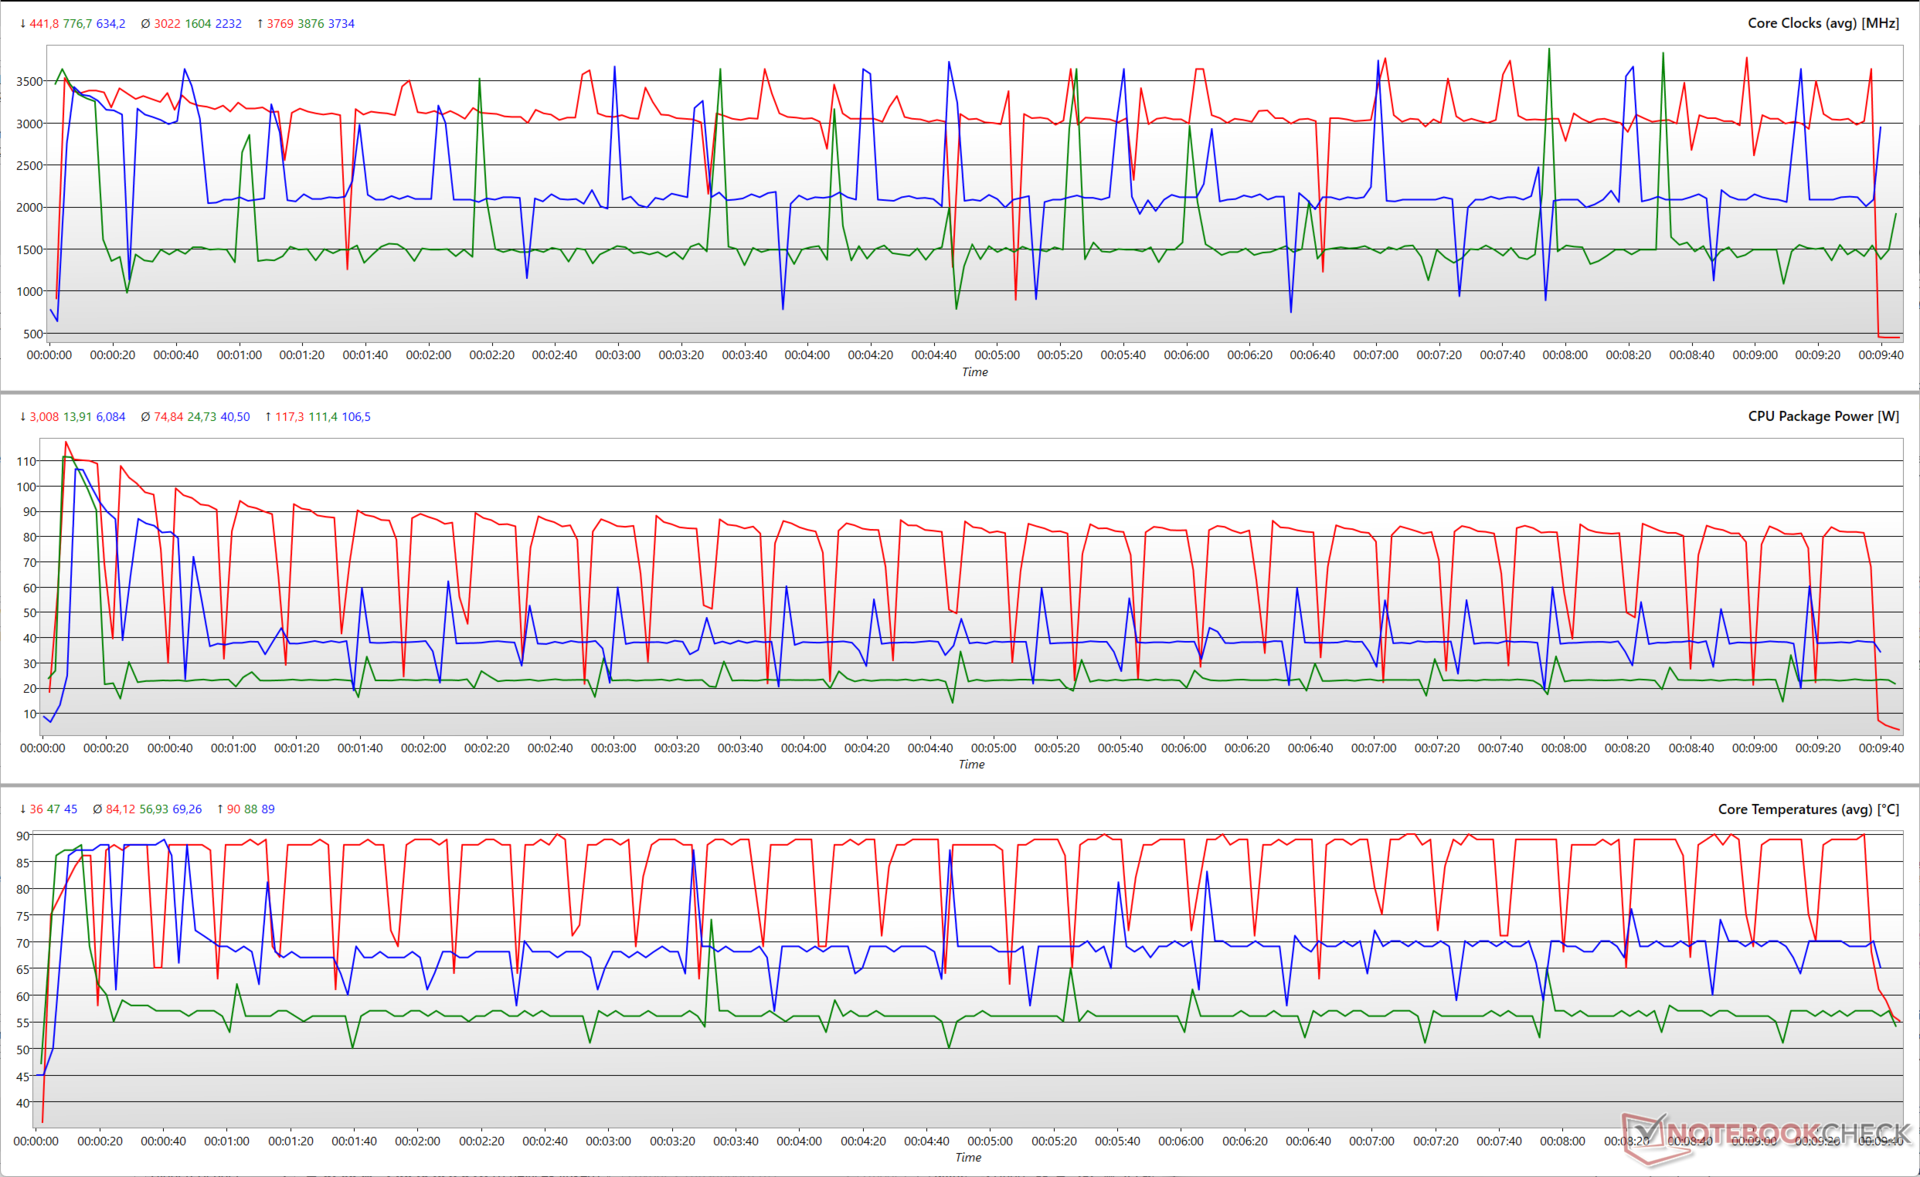
De volgende grafiek illustreert hoe CPU-parameters variëren tijdens een Cinebench R15 multi-core loop test. Aangezien de 121 W PL2 onveranderd blijft in alle drie de prestatiemodi, kan de Core i7-12700H een boost geven tot bijna 3,8 GHz, rekening houdend met zowel de P- als de E-kernen. De P-cores en E-cores kunnen afzonderlijk worden opgevoerd tot respectievelijk 4,6 GHz en 3,5 GHz.
Terwijl het piekvermogen van het pakket en de kerntemperaturen min of meer gelijk zijn in de geteste prestatiemodi, vertonen de gemiddelde waarden duidelijke verschillen. Het gemiddelde pakketvermogen tijdens de run is bijna 75 W in de stand Extreme Performance met temperaturen rond de 84 °C. De Balanced stand heeft gemiddelde temperaturen rond 69 °C voor een gemiddeld pakketvermogen van 40,5 W
De Stille modus heeft de minste emissies in de vergelijking met een gemiddeld pakketvermogen van bijna 25 W en gemiddelde kerntemperaturen rond 57 °C.
Hoewel de multi-core prestaties een klap van 15% krijgen in vergelijking met de Core i7-12700H in de Lenovo Legion 5i Pro 16 G7, blijft de Crosshair 15 R6E slechts ongeveer 8% achter in algemene CPU-prestaties.
De Crosshair 15 R6E is 13% sneller dan de Ryzen 9 6900HX-aangedreven XMG Neo 15, maar de laatste scoort 32% hogere prestaties in AIDA64-tests.
Cinebench R20 multi-core prestaties dalen met een enorme 45% op de batterij, hoewel single-core scores slechts met 10% afnemen.
Cinebench R23: Multi Core | Single Core
Cinebench R20: CPU (Multi Core) | CPU (Single Core)
Cinebench R15: CPU Multi 64Bit | CPU Single 64Bit
Blender: v2.79 BMW27 CPU
7-Zip 18.03: 7z b 4 | 7z b 4 -mmt1
Geekbench 5.5: Multi-Core | Single-Core
HWBOT x265 Benchmark v2.2: 4k Preset
LibreOffice : 20 Documents To PDF
R Benchmark 2.5: Overall mean
| CPU Performance rating | |
| Gemiddelde van klas Gaming | |
| Lenovo Legion 5 Pro 16 G7 i7 RTX 3070Ti | |
| MSI Pulse GL66 12UEK | |
| MSI Stealth GS66 12UGS | |
| Schenker XMG Neo 15 (i7-12700H, RTX 3080 Ti) | |
| MSI Crosshair 15 R6E B12UGZ-050 | |
| Acer Nitro 5 AN515-58-72QR | |
| Aorus 15 XE5 | |
| MSI Katana GF66 12UGS | |
| Gemiddeld Intel Core i7-12700H | |
| Asus TUF Dash F15 FX517ZR | |
| Schenker XMG Neo 15 (Ryzen 9 6900HX, RTX 3070 Ti) | |
| Cinebench R23 / Multi Core | |
| Gemiddelde van klas Gaming (10488 - 42661, n=107, laatste 2 jaar) | |
| Lenovo Legion 5 Pro 16 G7 i7 RTX 3070Ti | |
| MSI Stealth GS66 12UGS | |
| MSI Pulse GL66 12UEK | |
| Schenker XMG Neo 15 (i7-12700H, RTX 3080 Ti) | |
| MSI Katana GF66 12UGS | |
| Acer Nitro 5 AN515-58-72QR | |
| MSI Crosshair 15 R6E B12UGZ-050 | |
| Aorus 15 XE5 | |
| Gemiddeld Intel Core i7-12700H (4032 - 19330, n=64) | |
| Schenker XMG Neo 15 (Ryzen 9 6900HX, RTX 3070 Ti) | |
| Asus TUF Dash F15 FX517ZR | |
| Cinebench R23 / Single Core | |
| Gemiddelde van klas Gaming (1166 - 2415, n=107, laatste 2 jaar) | |
| MSI Pulse GL66 12UEK | |
| MSI Katana GF66 12UGS | |
| Lenovo Legion 5 Pro 16 G7 i7 RTX 3070Ti | |
| Acer Nitro 5 AN515-58-72QR | |
| Schenker XMG Neo 15 (i7-12700H, RTX 3080 Ti) | |
| Asus TUF Dash F15 FX517ZR | |
| MSI Stealth GS66 12UGS | |
| MSI Crosshair 15 R6E B12UGZ-050 | |
| Aorus 15 XE5 | |
| Gemiddeld Intel Core i7-12700H (778 - 1826, n=63) | |
| Schenker XMG Neo 15 (Ryzen 9 6900HX, RTX 3070 Ti) | |
| Cinebench R20 / CPU (Multi Core) | |
| Gemiddelde van klas Gaming (4029 - 16433, n=106, laatste 2 jaar) | |
| Lenovo Legion 5 Pro 16 G7 i7 RTX 3070Ti | |
| Schenker XMG Neo 15 (i7-12700H, RTX 3080 Ti) | |
| MSI Pulse GL66 12UEK | |
| MSI Stealth GS66 12UGS | |
| Acer Nitro 5 AN515-58-72QR | |
| MSI Katana GF66 12UGS | |
| MSI Crosshair 15 R6E B12UGZ-050 | |
| Aorus 15 XE5 | |
| Gemiddeld Intel Core i7-12700H (1576 - 7407, n=64) | |
| Schenker XMG Neo 15 (Ryzen 9 6900HX, RTX 3070 Ti) | |
| Asus TUF Dash F15 FX517ZR | |
| Cinebench R20 / CPU (Single Core) | |
| Gemiddelde van klas Gaming (442 - 913, n=106, laatste 2 jaar) | |
| MSI Pulse GL66 12UEK | |
| MSI Katana GF66 12UGS | |
| Lenovo Legion 5 Pro 16 G7 i7 RTX 3070Ti | |
| Asus TUF Dash F15 FX517ZR | |
| MSI Crosshair 15 R6E B12UGZ-050 | |
| Acer Nitro 5 AN515-58-72QR | |
| MSI Stealth GS66 12UGS | |
| Schenker XMG Neo 15 (i7-12700H, RTX 3080 Ti) | |
| Aorus 15 XE5 | |
| Gemiddeld Intel Core i7-12700H (300 - 704, n=64) | |
| Schenker XMG Neo 15 (Ryzen 9 6900HX, RTX 3070 Ti) | |
| Cinebench R15 / CPU Multi 64Bit | |
| Gemiddelde van klas Gaming (1578 - 6330, n=105, laatste 2 jaar) | |
| Lenovo Legion 5 Pro 16 G7 i7 RTX 3070Ti | |
| MSI Stealth GS66 12UGS | |
| Acer Nitro 5 AN515-58-72QR | |
| MSI Pulse GL66 12UEK | |
| MSI Katana GF66 12UGS | |
| MSI Katana GF66 12UGS | |
| Schenker XMG Neo 15 (i7-12700H, RTX 3080 Ti) | |
| Aorus 15 XE5 | |
| MSI Crosshair 15 R6E B12UGZ-050 | |
| Gemiddeld Intel Core i7-12700H (1379 - 2916, n=70) | |
| Schenker XMG Neo 15 (Ryzen 9 6900HX, RTX 3070 Ti) | |
| Asus TUF Dash F15 FX517ZR | |
| Cinebench R15 / CPU Single 64Bit | |
| Gemiddelde van klas Gaming (188.8 - 350, n=106, laatste 2 jaar) | |
| MSI Pulse GL66 12UEK | |
| Lenovo Legion 5 Pro 16 G7 i7 RTX 3070Ti | |
| MSI Katana GF66 12UGS | |
| MSI Katana GF66 12UGS | |
| Acer Nitro 5 AN515-58-72QR | |
| Schenker XMG Neo 15 (i7-12700H, RTX 3080 Ti) | |
| MSI Crosshair 15 R6E B12UGZ-050 | |
| Asus TUF Dash F15 FX517ZR | |
| MSI Stealth GS66 12UGS | |
| Aorus 15 XE5 | |
| Gemiddeld Intel Core i7-12700H (113 - 263, n=65) | |
| Schenker XMG Neo 15 (Ryzen 9 6900HX, RTX 3070 Ti) | |
| Blender / v2.79 BMW27 CPU | |
| MSI Katana GF66 12UGS | |
| Aorus 15 XE5 | |
| Asus TUF Dash F15 FX517ZR | |
| Gemiddeld Intel Core i7-12700H (168 - 732, n=63) | |
| Schenker XMG Neo 15 (Ryzen 9 6900HX, RTX 3070 Ti) | |
| Acer Nitro 5 AN515-58-72QR | |
| MSI Crosshair 15 R6E B12UGZ-050 | |
| MSI Stealth GS66 12UGS | |
| MSI Pulse GL66 12UEK | |
| Schenker XMG Neo 15 (i7-12700H, RTX 3080 Ti) | |
| Lenovo Legion 5 Pro 16 G7 i7 RTX 3070Ti | |
| Gemiddelde van klas Gaming (79 - 330, n=104, laatste 2 jaar) | |
| 7-Zip 18.03 / 7z b 4 -mmt1 | |
| Gemiddelde van klas Gaming (4199 - 7436, n=105, laatste 2 jaar) | |
| MSI Pulse GL66 12UEK | |
| Schenker XMG Neo 15 (i7-12700H, RTX 3080 Ti) | |
| MSI Katana GF66 12UGS | |
| Lenovo Legion 5 Pro 16 G7 i7 RTX 3070Ti | |
| Schenker XMG Neo 15 (Ryzen 9 6900HX, RTX 3070 Ti) | |
| Acer Nitro 5 AN515-58-72QR | |
| MSI Stealth GS66 12UGS | |
| Asus TUF Dash F15 FX517ZR | |
| MSI Crosshair 15 R6E B12UGZ-050 | |
| Aorus 15 XE5 | |
| Gemiddeld Intel Core i7-12700H (2743 - 5972, n=63) | |
| Geekbench 5.5 / Multi-Core | |
| Gemiddelde van klas Gaming (6460 - 28263, n=105, laatste 2 jaar) | |
| Schenker XMG Neo 15 (i7-12700H, RTX 3080 Ti) | |
| MSI Stealth GS66 12UGS | |
| Lenovo Legion 5 Pro 16 G7 i7 RTX 3070Ti | |
| Aorus 15 XE5 | |
| MSI Pulse GL66 12UEK | |
| MSI Katana GF66 12UGS | |
| Gemiddeld Intel Core i7-12700H (5144 - 13745, n=64) | |
| MSI Crosshair 15 R6E B12UGZ-050 | |
| Asus TUF Dash F15 FX517ZR | |
| Schenker XMG Neo 15 (Ryzen 9 6900HX, RTX 3070 Ti) | |
| Acer Nitro 5 AN515-58-72QR | |
| Geekbench 5.5 / Single-Core | |
| Gemiddelde van klas Gaming (986 - 2474, n=105, laatste 2 jaar) | |
| MSI Pulse GL66 12UEK | |
| MSI Crosshair 15 R6E B12UGZ-050 | |
| Asus TUF Dash F15 FX517ZR | |
| Acer Nitro 5 AN515-58-72QR | |
| MSI Katana GF66 12UGS | |
| Schenker XMG Neo 15 (i7-12700H, RTX 3080 Ti) | |
| Lenovo Legion 5 Pro 16 G7 i7 RTX 3070Ti | |
| Gemiddeld Intel Core i7-12700H (803 - 1851, n=64) | |
| Aorus 15 XE5 | |
| MSI Stealth GS66 12UGS | |
| Schenker XMG Neo 15 (Ryzen 9 6900HX, RTX 3070 Ti) | |
| HWBOT x265 Benchmark v2.2 / 4k Preset | |
| Gemiddelde van klas Gaming (11.5 - 44.4, n=105, laatste 2 jaar) | |
| Lenovo Legion 5 Pro 16 G7 i7 RTX 3070Ti | |
| Schenker XMG Neo 15 (i7-12700H, RTX 3080 Ti) | |
| MSI Stealth GS66 12UGS | |
| MSI Pulse GL66 12UEK | |
| Acer Nitro 5 AN515-58-72QR | |
| MSI Crosshair 15 R6E B12UGZ-050 | |
| Schenker XMG Neo 15 (Ryzen 9 6900HX, RTX 3070 Ti) | |
| Asus TUF Dash F15 FX517ZR | |
| Gemiddeld Intel Core i7-12700H (4.67 - 21.8, n=64) | |
| Aorus 15 XE5 | |
| MSI Katana GF66 12UGS | |
| LibreOffice / 20 Documents To PDF | |
| Schenker XMG Neo 15 (Ryzen 9 6900HX, RTX 3070 Ti) | |
| Gemiddelde van klas Gaming (33.2 - 88.8, n=105, laatste 2 jaar) | |
| Schenker XMG Neo 15 (i7-12700H, RTX 3080 Ti) | |
| Gemiddeld Intel Core i7-12700H (34.2 - 95.3, n=63) | |
| MSI Crosshair 15 R6E B12UGZ-050 | |
| Lenovo Legion 5 Pro 16 G7 i7 RTX 3070Ti | |
| MSI Pulse GL66 12UEK | |
| Acer Nitro 5 AN515-58-72QR | |
| MSI Stealth GS66 12UGS | |
| Asus TUF Dash F15 FX517ZR | |
| Aorus 15 XE5 | |
| MSI Katana GF66 12UGS | |
| R Benchmark 2.5 / Overall mean | |
| Schenker XMG Neo 15 (Ryzen 9 6900HX, RTX 3070 Ti) | |
| Gemiddeld Intel Core i7-12700H (0.4441 - 1.052, n=63) | |
| Aorus 15 XE5 | |
| Asus TUF Dash F15 FX517ZR | |
| Schenker XMG Neo 15 (i7-12700H, RTX 3080 Ti) | |
| Acer Nitro 5 AN515-58-72QR | |
| MSI Katana GF66 12UGS | |
| Lenovo Legion 5 Pro 16 G7 i7 RTX 3070Ti | |
| MSI Stealth GS66 12UGS | |
| MSI Crosshair 15 R6E B12UGZ-050 | |
| Gemiddelde van klas Gaming (0.3439 - 0.759, n=106, laatste 2 jaar) | |
| MSI Pulse GL66 12UEK | |
* ... kleiner is beter
AIDA64: FP32 Ray-Trace | FPU Julia | CPU SHA3 | CPU Queen | FPU SinJulia | FPU Mandel | CPU AES | CPU ZLib | FP64 Ray-Trace | CPU PhotoWorxx
| Performance rating | |
| Gemiddelde van klas Gaming | |
| Schenker XMG Neo 15 (Ryzen 9 6900HX, RTX 3070 Ti) | |
| Aorus 15 XE5 | |
| Lenovo Legion 5 Pro 16 G7 i7 RTX 3070Ti | |
| MSI Stealth GS66 12UGS | |
| Asus TUF Dash F15 FX517ZR | |
| Gemiddeld Intel Core i7-12700H | |
| MSI Pulse GL66 12UEK | |
| Schenker XMG Neo 15 (i7-12700H, RTX 3080 Ti) | |
| MSI Katana GF66 12UGS | |
| MSI Crosshair 15 R6E B12UGZ-050 | |
| Acer Nitro 5 AN515-58-72QR | |
| AIDA64 / FP32 Ray-Trace | |
| Gemiddelde van klas Gaming (10227 - 85542, n=105, laatste 2 jaar) | |
| Schenker XMG Neo 15 (Ryzen 9 6900HX, RTX 3070 Ti) | |
| Asus TUF Dash F15 FX517ZR | |
| Aorus 15 XE5 | |
| Gemiddeld Intel Core i7-12700H (2585 - 17957, n=64) | |
| Lenovo Legion 5 Pro 16 G7 i7 RTX 3070Ti | |
| Schenker XMG Neo 15 (i7-12700H, RTX 3080 Ti) | |
| MSI Stealth GS66 12UGS | |
| MSI Pulse GL66 12UEK | |
| MSI Katana GF66 12UGS | |
| MSI Crosshair 15 R6E B12UGZ-050 | |
| Acer Nitro 5 AN515-58-72QR | |
| AIDA64 / FP64 Ray-Trace | |
| Gemiddelde van klas Gaming (5509 - 45446, n=105, laatste 2 jaar) | |
| Schenker XMG Neo 15 (Ryzen 9 6900HX, RTX 3070 Ti) | |
| Asus TUF Dash F15 FX517ZR | |
| Aorus 15 XE5 | |
| Gemiddeld Intel Core i7-12700H (1437 - 9692, n=64) | |
| Lenovo Legion 5 Pro 16 G7 i7 RTX 3070Ti | |
| Schenker XMG Neo 15 (i7-12700H, RTX 3080 Ti) | |
| MSI Stealth GS66 12UGS | |
| MSI Pulse GL66 12UEK | |
| Acer Nitro 5 AN515-58-72QR | |
| MSI Katana GF66 12UGS | |
| MSI Crosshair 15 R6E B12UGZ-050 | |
| AIDA64 / CPU PhotoWorxx | |
| Gemiddelde van klas Gaming (12271 - 89891, n=105, laatste 2 jaar) | |
| Schenker XMG Neo 15 (i7-12700H, RTX 3080 Ti) | |
| MSI Stealth GS66 12UGS | |
| Aorus 15 XE5 | |
| Asus TUF Dash F15 FX517ZR | |
| Lenovo Legion 5 Pro 16 G7 i7 RTX 3070Ti | |
| Gemiddeld Intel Core i7-12700H (12863 - 52207, n=64) | |
| Schenker XMG Neo 15 (Ryzen 9 6900HX, RTX 3070 Ti) | |
| MSI Katana GF66 12UGS | |
| MSI Pulse GL66 12UEK | |
| MSI Crosshair 15 R6E B12UGZ-050 | |
| Acer Nitro 5 AN515-58-72QR | |
Bekijk onze speciale Intel Core i7-12700H pagina voor meer informatie en prestatievergelijkingen.
Systeemprestaties
Concurrerende apparaten zijn in staat om de Crosshair 15 R6E in PCMark 10 scores te overtreffen, maar niet met veel. CrossMark ziet de Crosshair 15 R6E veel betere prestaties neerzetten
AIDA64 tests zien de Crosshair 15 R6E achterblijven bij andere Core i7-12700H-aangedreven laptops. We ondervonden geen bijzondere prestatieproblemen met dagelijkse productiviteitstaken of surfen op het web
CrossMark: Overall | Productivity | Creativity | Responsiveness
| PCMark 10 / Score | |
| Gemiddelde van klas Gaming (5828 - 12414, n=93, laatste 2 jaar) | |
| Aorus 15 XE5 | |
| MSI Stealth GS66 12UGS | |
| Schenker XMG Neo 15 (i7-12700H, RTX 3080 Ti) | |
| Lenovo Legion 5 Pro 16 G7 i7 RTX 3070Ti | |
| MSI Katana GF66 12UGS | |
| Gemiddeld Intel Core i7-12700H, NVIDIA GeForce RTX 3070 Laptop GPU (7082 - 7647, n=2) | |
| Schenker XMG Neo 15 (Ryzen 9 6900HX, RTX 3070 Ti) | |
| MSI Pulse GL66 12UEK | |
| MSI Crosshair 15 R6E B12UGZ-050 | |
| Acer Nitro 5 AN515-58-72QR | |
| Asus TUF Dash F15 FX517ZR | |
| PCMark 10 / Essentials | |
| MSI Stealth GS66 12UGS | |
| Aorus 15 XE5 | |
| Gemiddelde van klas Gaming (8810 - 11935, n=97, laatste 2 jaar) | |
| Schenker XMG Neo 15 (i7-12700H, RTX 3080 Ti) | |
| Gemiddeld Intel Core i7-12700H, NVIDIA GeForce RTX 3070 Laptop GPU (10076 - 10926, n=2) | |
| Schenker XMG Neo 15 (Ryzen 9 6900HX, RTX 3070 Ti) | |
| MSI Pulse GL66 12UEK | |
| MSI Katana GF66 12UGS | |
| MSI Crosshair 15 R6E B12UGZ-050 | |
| Asus TUF Dash F15 FX517ZR | |
| Lenovo Legion 5 Pro 16 G7 i7 RTX 3070Ti | |
| Acer Nitro 5 AN515-58-72QR | |
| PCMark 10 / Productivity | |
| Gemiddelde van klas Gaming (6845 - 25323, n=95, laatste 2 jaar) | |
| Aorus 15 XE5 | |
| MSI Katana GF66 12UGS | |
| Lenovo Legion 5 Pro 16 G7 i7 RTX 3070Ti | |
| MSI Pulse GL66 12UEK | |
| Gemiddeld Intel Core i7-12700H, NVIDIA GeForce RTX 3070 Laptop GPU (9460 - 9877, n=2) | |
| Schenker XMG Neo 15 (Ryzen 9 6900HX, RTX 3070 Ti) | |
| Asus TUF Dash F15 FX517ZR | |
| MSI Stealth GS66 12UGS | |
| MSI Crosshair 15 R6E B12UGZ-050 | |
| Schenker XMG Neo 15 (i7-12700H, RTX 3080 Ti) | |
| Acer Nitro 5 AN515-58-72QR | |
| PCMark 10 / Digital Content Creation | |
| Gemiddelde van klas Gaming (7602 - 19954, n=95, laatste 2 jaar) | |
| Schenker XMG Neo 15 (i7-12700H, RTX 3080 Ti) | |
| Lenovo Legion 5 Pro 16 G7 i7 RTX 3070Ti | |
| MSI Stealth GS66 12UGS | |
| Aorus 15 XE5 | |
| MSI Katana GF66 12UGS | |
| Gemiddeld Intel Core i7-12700H, NVIDIA GeForce RTX 3070 Laptop GPU (10113 - 11245, n=2) | |
| Acer Nitro 5 AN515-58-72QR | |
| MSI Crosshair 15 R6E B12UGZ-050 | |
| Schenker XMG Neo 15 (Ryzen 9 6900HX, RTX 3070 Ti) | |
| MSI Pulse GL66 12UEK | |
| Asus TUF Dash F15 FX517ZR | |
| CrossMark / Overall | |
| MSI Pulse GL66 12UEK | |
| MSI Crosshair 15 R6E B12UGZ-050 | |
| Gemiddelde van klas Gaming (1366 - 2409, n=94, laatste 2 jaar) | |
| Lenovo Legion 5 Pro 16 G7 i7 RTX 3070Ti | |
| Aorus 15 XE5 | |
| MSI Katana GF66 12UGS | |
| Gemiddeld Intel Core i7-12700H, NVIDIA GeForce RTX 3070 Laptop GPU (1844 - 2003, n=2) | |
| Asus TUF Dash F15 FX517ZR | |
| Schenker XMG Neo 15 (i7-12700H, RTX 3080 Ti) | |
| Acer Nitro 5 AN515-58-72QR | |
| Schenker XMG Neo 15 (Ryzen 9 6900HX, RTX 3070 Ti) | |
| CrossMark / Productivity | |
| MSI Pulse GL66 12UEK | |
| MSI Crosshair 15 R6E B12UGZ-050 | |
| MSI Katana GF66 12UGS | |
| Aorus 15 XE5 | |
| Gemiddeld Intel Core i7-12700H, NVIDIA GeForce RTX 3070 Laptop GPU (1785 - 1971, n=2) | |
| Lenovo Legion 5 Pro 16 G7 i7 RTX 3070Ti | |
| Gemiddelde van klas Gaming (1386 - 2254, n=94, laatste 2 jaar) | |
| Acer Nitro 5 AN515-58-72QR | |
| Asus TUF Dash F15 FX517ZR | |
| Schenker XMG Neo 15 (i7-12700H, RTX 3080 Ti) | |
| Schenker XMG Neo 15 (Ryzen 9 6900HX, RTX 3070 Ti) | |
| CrossMark / Creativity | |
| Gemiddelde van klas Gaming (1343 - 2786, n=94, laatste 2 jaar) | |
| MSI Pulse GL66 12UEK | |
| Lenovo Legion 5 Pro 16 G7 i7 RTX 3070Ti | |
| Schenker XMG Neo 15 (i7-12700H, RTX 3080 Ti) | |
| Asus TUF Dash F15 FX517ZR | |
| Aorus 15 XE5 | |
| MSI Crosshair 15 R6E B12UGZ-050 | |
| Gemiddeld Intel Core i7-12700H, NVIDIA GeForce RTX 3070 Laptop GPU (1912 - 1979, n=2) | |
| MSI Katana GF66 12UGS | |
| Acer Nitro 5 AN515-58-72QR | |
| Schenker XMG Neo 15 (Ryzen 9 6900HX, RTX 3070 Ti) | |
| CrossMark / Responsiveness | |
| MSI Pulse GL66 12UEK | |
| MSI Crosshair 15 R6E B12UGZ-050 | |
| MSI Katana GF66 12UGS | |
| Aorus 15 XE5 | |
| Gemiddeld Intel Core i7-12700H, NVIDIA GeForce RTX 3070 Laptop GPU (1824 - 2182, n=2) | |
| Lenovo Legion 5 Pro 16 G7 i7 RTX 3070Ti | |
| Gemiddelde van klas Gaming (1226 - 2334, n=94, laatste 2 jaar) | |
| Acer Nitro 5 AN515-58-72QR | |
| Asus TUF Dash F15 FX517ZR | |
| Schenker XMG Neo 15 (i7-12700H, RTX 3080 Ti) | |
| Schenker XMG Neo 15 (Ryzen 9 6900HX, RTX 3070 Ti) | |
| PCMark 8 Home Score Accelerated v2 | 6083 punten | |
| PCMark 8 Creative Score Accelerated v2 | 9960 punten | |
| PCMark 8 Work Score Accelerated v2 | 6346 punten | |
| PCMark 10 Score | 7082 punten | |
Help | ||
| AIDA64 / Memory Latency | |
| Gemiddelde van klas Gaming (75.3 - 259, n=105, laatste 2 jaar) | |
| Lenovo Legion 5 Pro 16 G7 i7 RTX 3070Ti | |
| MSI Katana GF66 12UGS | |
| Asus TUF Dash F15 FX517ZR | |
| Aorus 15 XE5 | |
| MSI Stealth GS66 12UGS | |
| MSI Crosshair 15 R6E B12UGZ-050 | |
| MSI Pulse GL66 12UEK | |
| Schenker XMG Neo 15 (Ryzen 9 6900HX, RTX 3070 Ti) | |
| Gemiddeld Intel Core i7-12700H (76.2 - 133.9, n=62) | |
| Acer Nitro 5 AN515-58-72QR | |
| Acer Nitro 5 AN515-58-72QR | |
* ... kleiner is beter
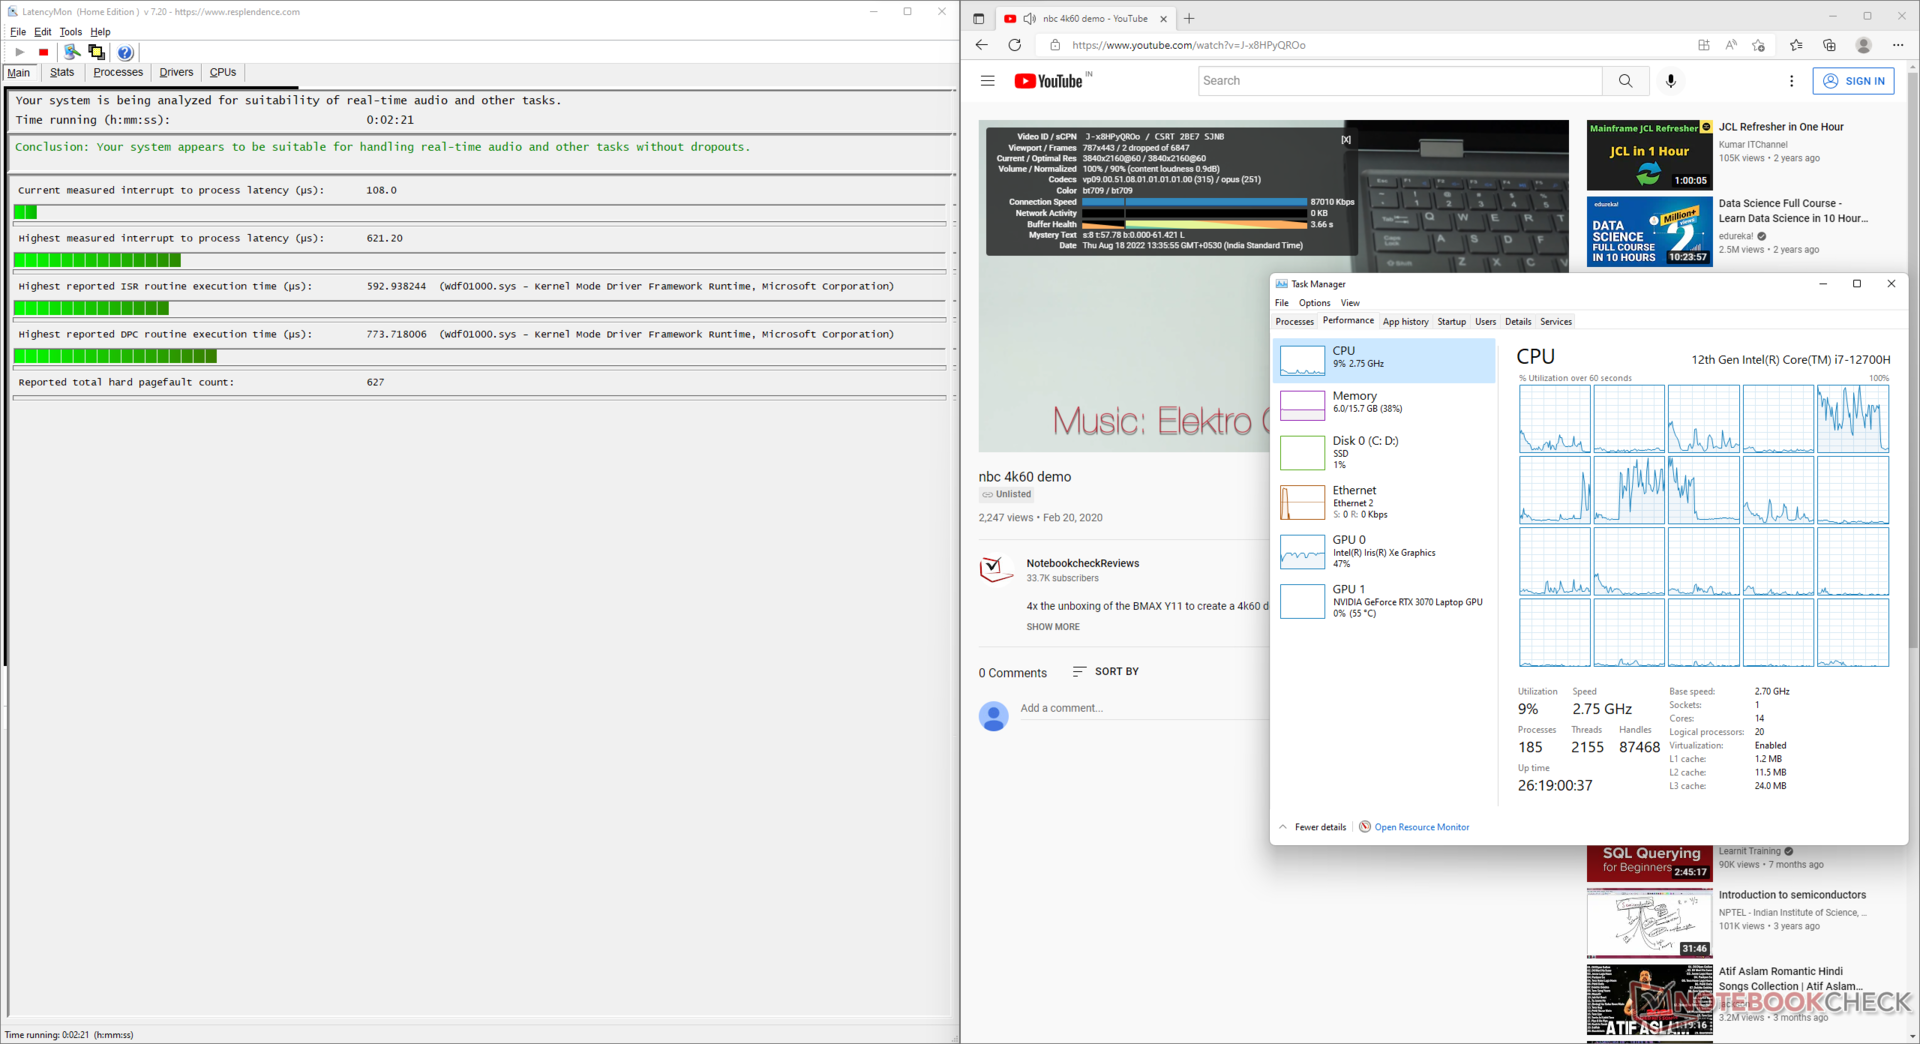
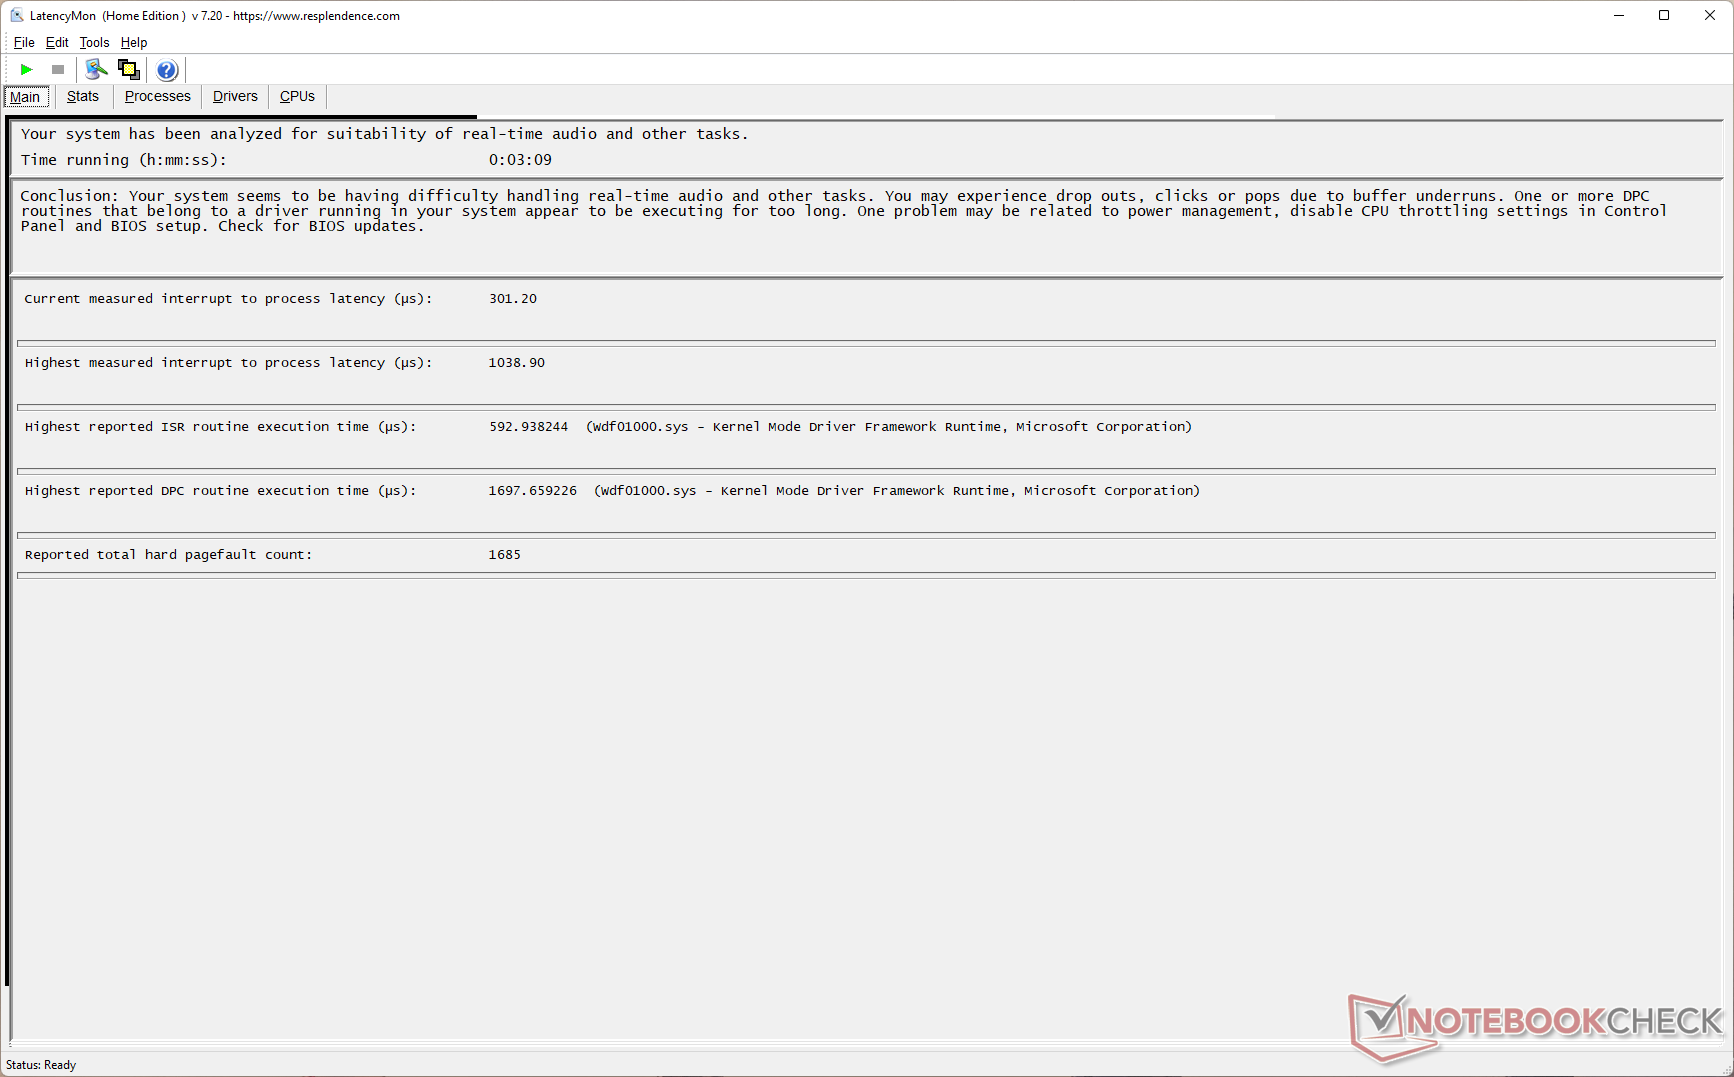
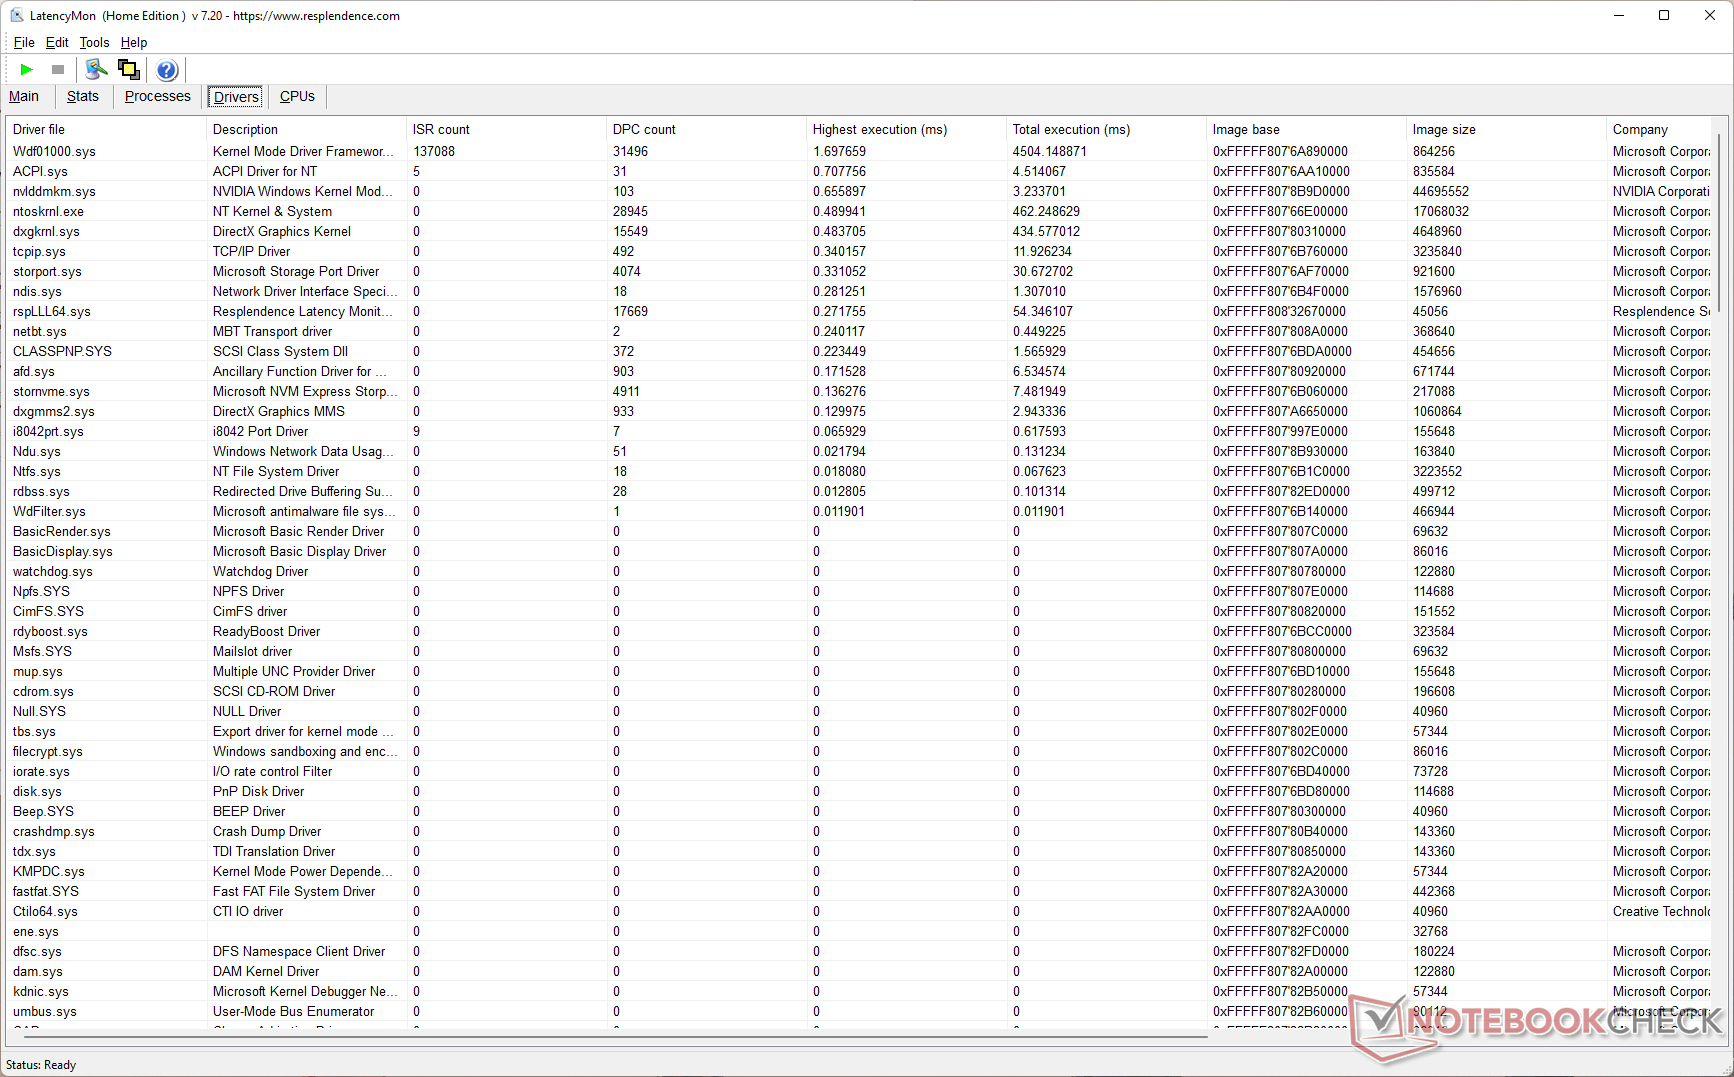
DPC latentie
Onze gestandaardiseerde LatencyMon test laat zien dat de Crosshair 15 R6E een iets hogere DPC latentie heeft dan andere Core i7-12700H-aangedreven laptops. We zagen een verhoogde latentie na het uitvoeren van de Prime95 in-place large FFTs test na onze YouTube benchmark
Het Windows Kernel Mode Driver Framework lijkt de reden te zijn voor de verhoogde latentie.
| DPC Latencies / LatencyMon - interrupt to process latency (max), Web, Youtube, Prime95 | |
| Schenker XMG Neo 15 (i7-12700H, RTX 3080 Ti) | |
| MSI Stealth GS66 12UGS | |
| Schenker XMG Neo 15 (Ryzen 9 6900HX, RTX 3070 Ti) | |
| Aorus 15 XE5 | |
| MSI Crosshair 15 R6E B12UGZ-050 | |
| MSI Pulse GL66 12UEK | |
| Acer Nitro 5 AN515-58-72QR | |
| Lenovo Legion 5 Pro 16 G7 i7 RTX 3070Ti | |
| MSI Katana GF66 12UGS | |
| Asus TUF Dash F15 FX517ZR | |
* ... kleiner is beter
Meer latentievergelijkingen tussen beoordeelde apparaten vindt u in onze DPC latentie ranglijst pagina.
Opslagapparaten
De Micron 2450 1 TB NVMe PCIe SSD breekt geen snelheidsrecords. De twee NVMe M.2 slots van de Crosshair 15 R6E en de Micron drive zelf ondersteunen PCIe Gen 4, maar de prestaties zijn meer in lijn met PCIe Gen 3 snelheden. Dat gezegd hebbende, is de schijf in staat om voor het grootste deel dicht bij de nominale I/O-specificaties te komen.
De schijf vertoont geen throttling in onze DiskSpd leeslus test bij een wachtrij diepte van 8. Er is geen ruimte voor het toevoegen van een 2,5-inch SATA opslag uitbreiding.

* ... kleiner is beter
Disk Throttling: DiskSpd Read Loop, Queue Depth 8
GPU-prestaties
Onze Crosshair 15 R6E testunit gebruikt een 140 W RTX 3070 Laptop GPU met 8 GB GDDR6 VRAM. MSI specificeert niet de exacte Dynamic Boost voor deze GPU.
3DMark prestaties blijven achter bij sommige RTX 3070 Ti-aangedreven laptops, maar niet veel. De Crosshair 15 R6E blijft achter bij de RTX 3080 Ti-aangedreven XMG Neo 15 met respectievelijk 11% en 13% in 3DMark Fire Strike Graphics en Time Spy Graphics tests.
De Asus TUF Dash F15 met dezelfde GPU is 19% langzamer dan die in de Crosshair 15 R6E door een lagere TGP van 105 W.
| 3DMark 11 Performance | 30240 punten | |
| 3DMark Ice Storm Standard Score | 158460 punten | |
| 3DMark Cloud Gate Standard Score | 56797 punten | |
| 3DMark Fire Strike Score | 24233 punten | |
| 3DMark Fire Strike Extreme Score | 12959 punten | |
| 3DMark Time Spy Score | 10496 punten | |
Help | ||
De Crosshair 15 R6E neemt 42% en 33% minder tijd in beslag in respectievelijk Blender Classroom Optix en Classroom CUDA, in vergelijking met de gemiddelde tijden die voor de RTX 3070 Laptop GPU werden geregistreerd.
| Blender / v3.3 Classroom OPTIX/RTX | |
| Asus TUF Dash F15 FX517ZR | |
| Gemiddeld NVIDIA GeForce RTX 3070 Laptop GPU (26 - 30, n=8) | |
| MSI Crosshair 15 R6E B12UGZ-050 | |
| Aorus 15 XE5 | |
| Schenker XMG Neo 15 (Ryzen 9 6900HX, RTX 3070 Ti) | |
| Gemiddelde van klas Gaming (9 - 32, n=106, laatste 2 jaar) | |
| Blender / v3.3 Classroom CUDA | |
| Asus TUF Dash F15 FX517ZR | |
| Gemiddeld NVIDIA GeForce RTX 3070 Laptop GPU (43 - 51, n=9) | |
| MSI Crosshair 15 R6E B12UGZ-050 | |
| Aorus 15 XE5 | |
| Schenker XMG Neo 15 (Ryzen 9 6900HX, RTX 3070 Ti) | |
| Gemiddelde van klas Gaming (15 - 228, n=106, laatste 2 jaar) | |
| Blender / v3.3 Classroom CPU | |
| Gemiddeld NVIDIA GeForce RTX 3070 Laptop GPU (329 - 698, n=12) | |
| Asus TUF Dash F15 FX517ZR | |
| Aorus 15 XE5 | |
| MSI Crosshair 15 R6E B12UGZ-050 | |
| Schenker XMG Neo 15 (Ryzen 9 6900HX, RTX 3070 Ti) | |
| Gemiddelde van klas Gaming (122 - 565, n=102, laatste 2 jaar) | |
* ... kleiner is beter
Spelprestaties
De gaming prestaties in geteste games bij 1080p Ultra instellingen liggen slechts ongeveer 8% achter op die van de RTX 3080 Ti-aangedreven XMG Neo 15. De Lenovo Legion 5i Pro 16 G7 met een RTX 3070 Ti toont waarneembare voorsprong op de Crosshair 15 R6E in de meeste games, vooral bij QHD Ultra.
De RTX 3080 Ti-powered XMG Neo 15 kan tot 17% voorblijven in Far Cry 5 QHD Ultra, maar deze delta loopt op tot 45% in De Witcher 3 bij 1080p High. In Rainbow Six: Extraction laat de Crosshair 15 R6E goede voorsprong zien in 1080p en QHD Ultra instellingen ten opzichte van de Stealth GS66 met een RTX 3070 Ti Laptop GPU.
| F1 2021 | |
| 1920x1080 High Preset AA:T AF:16x | |
| Lenovo Legion 5 Pro 16 G7 i7 RTX 3070Ti | |
| MSI Stealth GS66 12UGS | |
| MSI Crosshair 15 R6E B12UGZ-050 | |
| Gemiddeld NVIDIA GeForce RTX 3070 Laptop GPU (66.1 - 256, n=16) | |
| Asus TUF Dash F15 FX517ZR | |
| Acer Nitro 5 AN515-58-72QR | |
| 1920x1080 Ultra High Preset + Raytracing AA:T AF:16x | |
| Lenovo Legion 5 Pro 16 G7 i7 RTX 3070Ti | |
| MSI Crosshair 15 R6E B12UGZ-050 | |
| MSI Stealth GS66 12UGS | |
| Acer Nitro 5 AN515-58-72QR | |
| Gemiddeld NVIDIA GeForce RTX 3070 Laptop GPU (33.1 - 123.1, n=23) | |
| Asus TUF Dash F15 FX517ZR | |
| 2560x1440 Ultra High Preset + Raytracing AA:T AF:16x | |
| Lenovo Legion 5 Pro 16 G7 i7 RTX 3070Ti | |
| MSI Crosshair 15 R6E B12UGZ-050 | |
| Gemiddeld NVIDIA GeForce RTX 3070 Laptop GPU (67.1 - 90.2, n=11) | |
| Acer Nitro 5 AN515-58-72QR | |
| MSI Stealth GS66 12UGS | |
| Asus TUF Dash F15 FX517ZR | |
| Rainbow Six Extraction | |
| 1920x1080 High Preset (with Fixed Resolution Quality) | |
| Gemiddeld NVIDIA GeForce RTX 3070 Laptop GPU (171 - 202, n=4) | |
| MSI Stealth GS66 12UGS | |
| MSI Crosshair 15 R6E B12UGZ-050 | |
| 1920x1080 Ultra Preset (with Fixed Resolution Quality) | |
| MSI Crosshair 15 R6E B12UGZ-050 | |
| Gemiddeld NVIDIA GeForce RTX 3070 Laptop GPU (149 - 157, n=4) | |
| MSI Stealth GS66 12UGS | |
| 2560x1440 Ultra Preset (with Fixed Resolution Quality) | |
| MSI Crosshair 15 R6E B12UGZ-050 | |
| Gemiddeld NVIDIA GeForce RTX 3070 Laptop GPU (97 - 103, n=3) | |
| MSI Stealth GS66 12UGS | |
De Witcher 3 FPS grafiek
De RTX 3070 Laptop GPU laat goede aanhoudende prestaties zien in The Witcher 3 op 1080p Ultra waarbij het personage gedurende de hele test stil blijft staan. We zien wel framerate schommelingen, maar die zijn niet erg drastisch.
| lage | gem. | hoge | ultra | QHD | 4K | |
|---|---|---|---|---|---|---|
| GTA V (2015) | 184.2 | 182 | 173.8 | 113.7 | 97.1 | |
| The Witcher 3 (2015) | 368 | 294 | 168 | 105.7 | ||
| Dota 2 Reborn (2015) | 177.7 | 161.4 | 150.4 | 142.7 | 127.2 | |
| Final Fantasy XV Benchmark (2018) | 166.6 | 127.5 | 98 | 79 | 46.9 | |
| X-Plane 11.11 (2018) | 150.1 | 133.1 | 106.3 | 98.7 | ||
| Far Cry 5 (2018) | 137 | 125 | 122 | 118 | 99 | |
| Strange Brigade (2018) | 444 | 251 | 211 | 185.5 | 140.5 | |
| F1 2021 (2021) | 319 | 228 | 192.6 | 115.4 | 86.3 | |
| Rainbow Six Extraction (2022) | 225 | 189 | 171 | 155 | 103 | |
| Cyberpunk 2077 1.6 (2022) | 123 | 111.6 | 90.8 | 76.9 | 49.5 |
Bekijk onze speciale Nvidia GeForce RTX 3070 Laptop GPU pagina voor meer informatie en prestatievergelijkingen.
Emissies: Toelaatbare geluidsniveaus in het gebalanceerde profiel
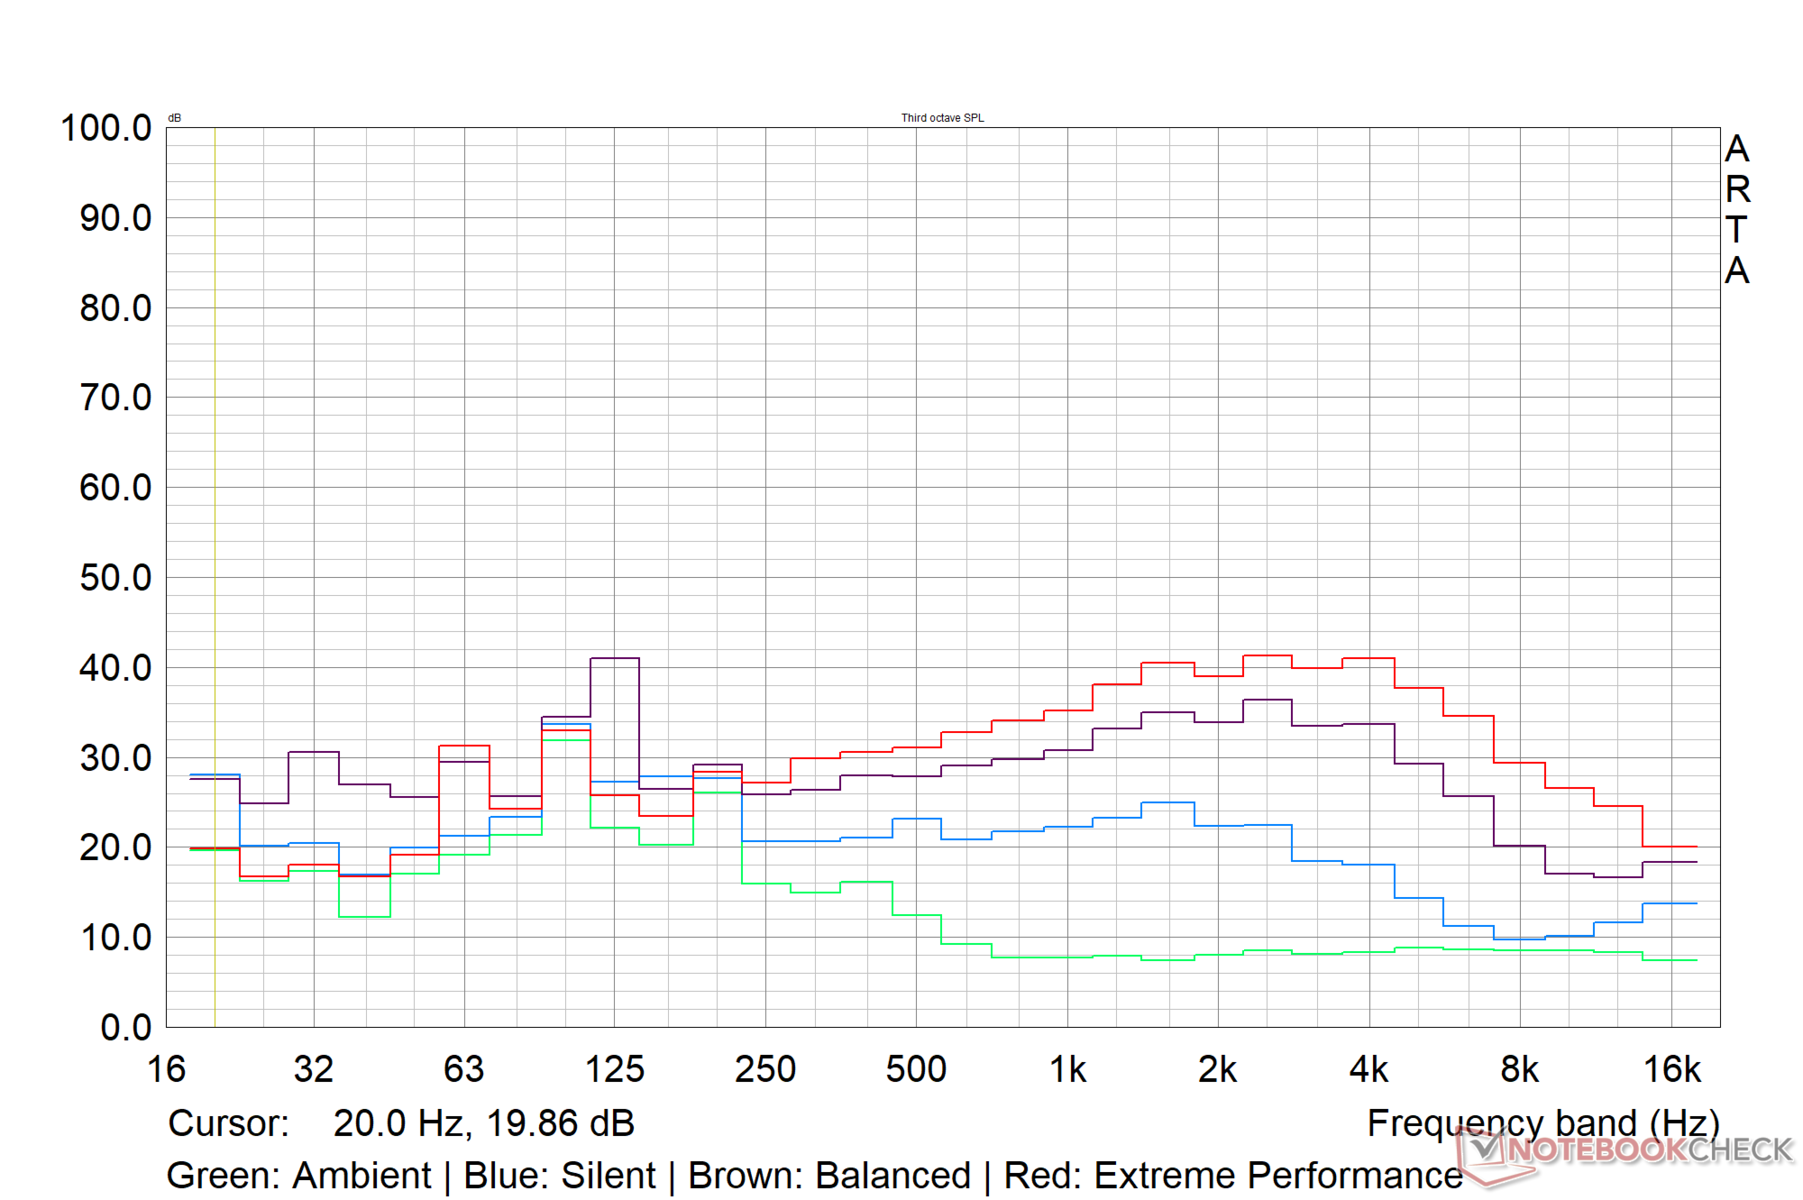
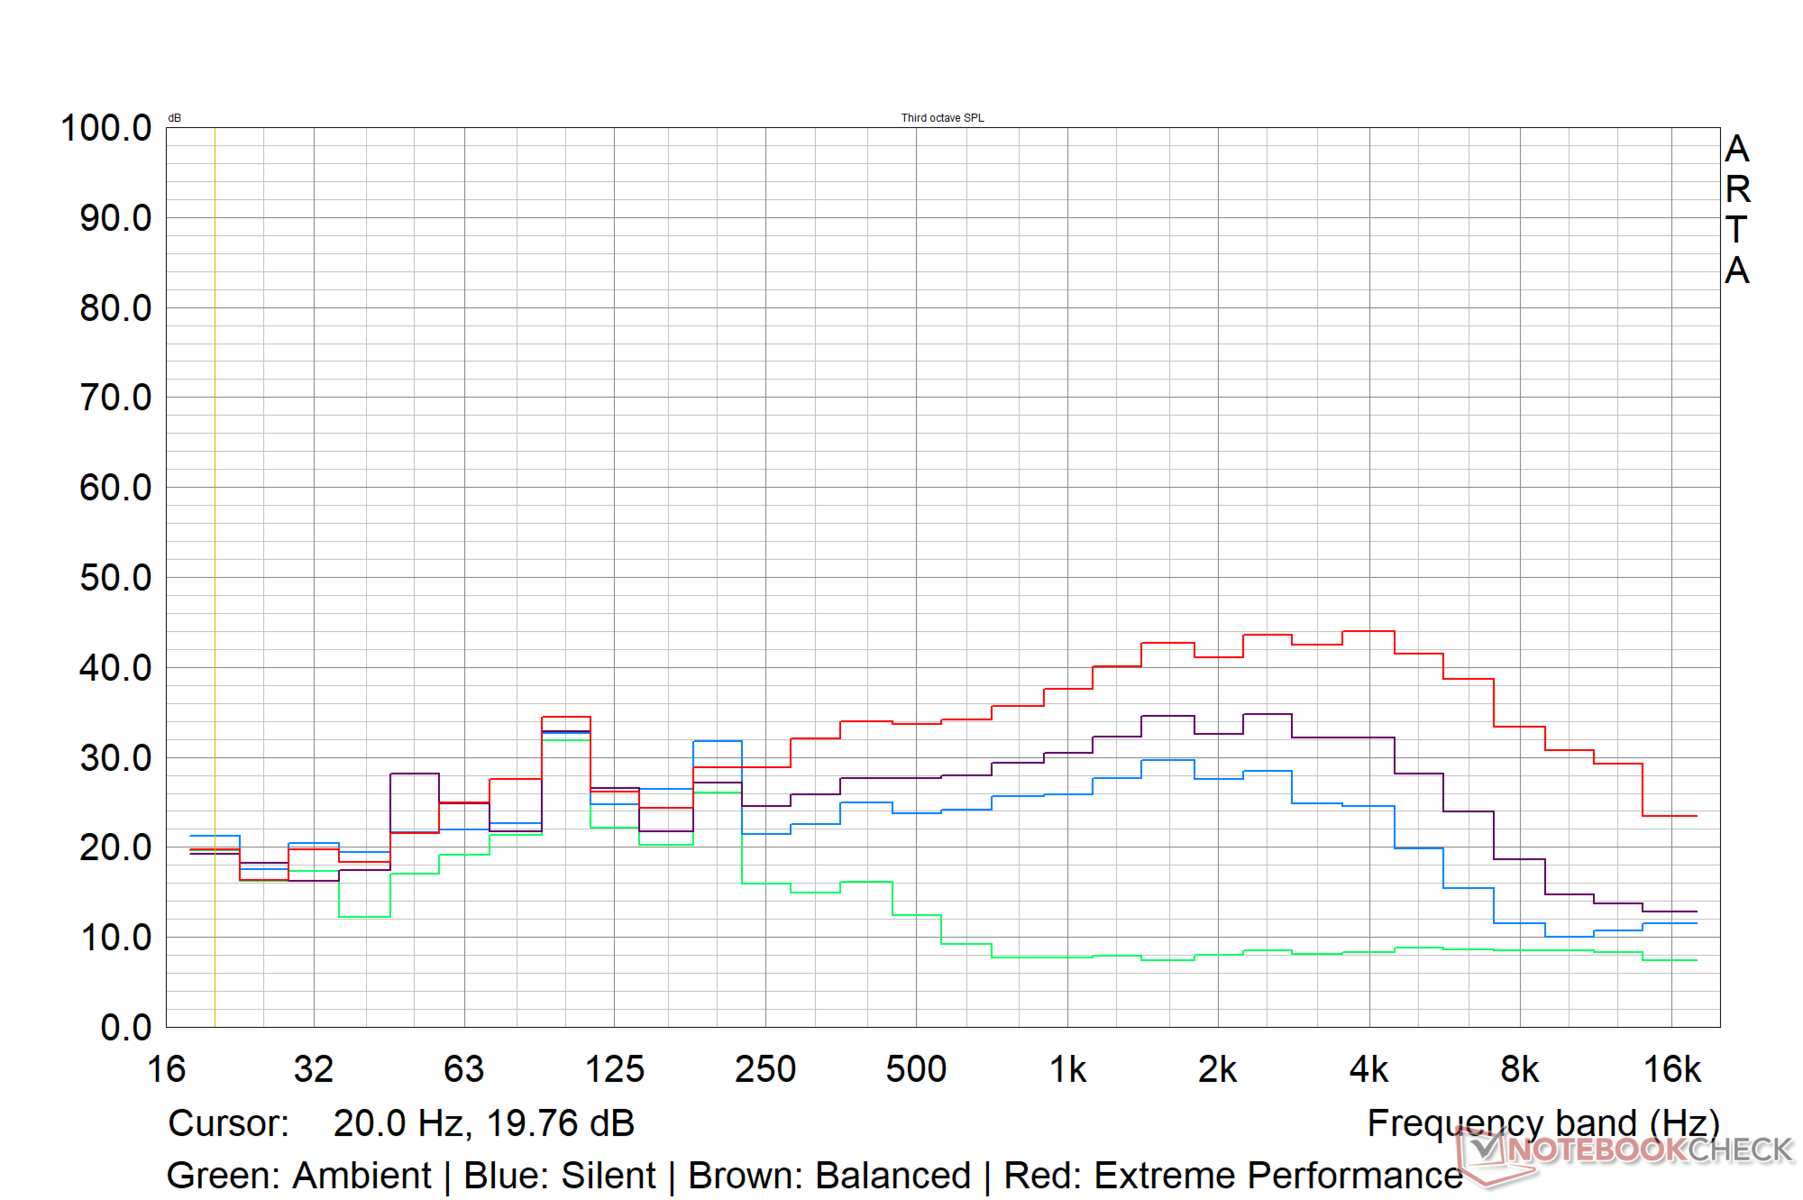
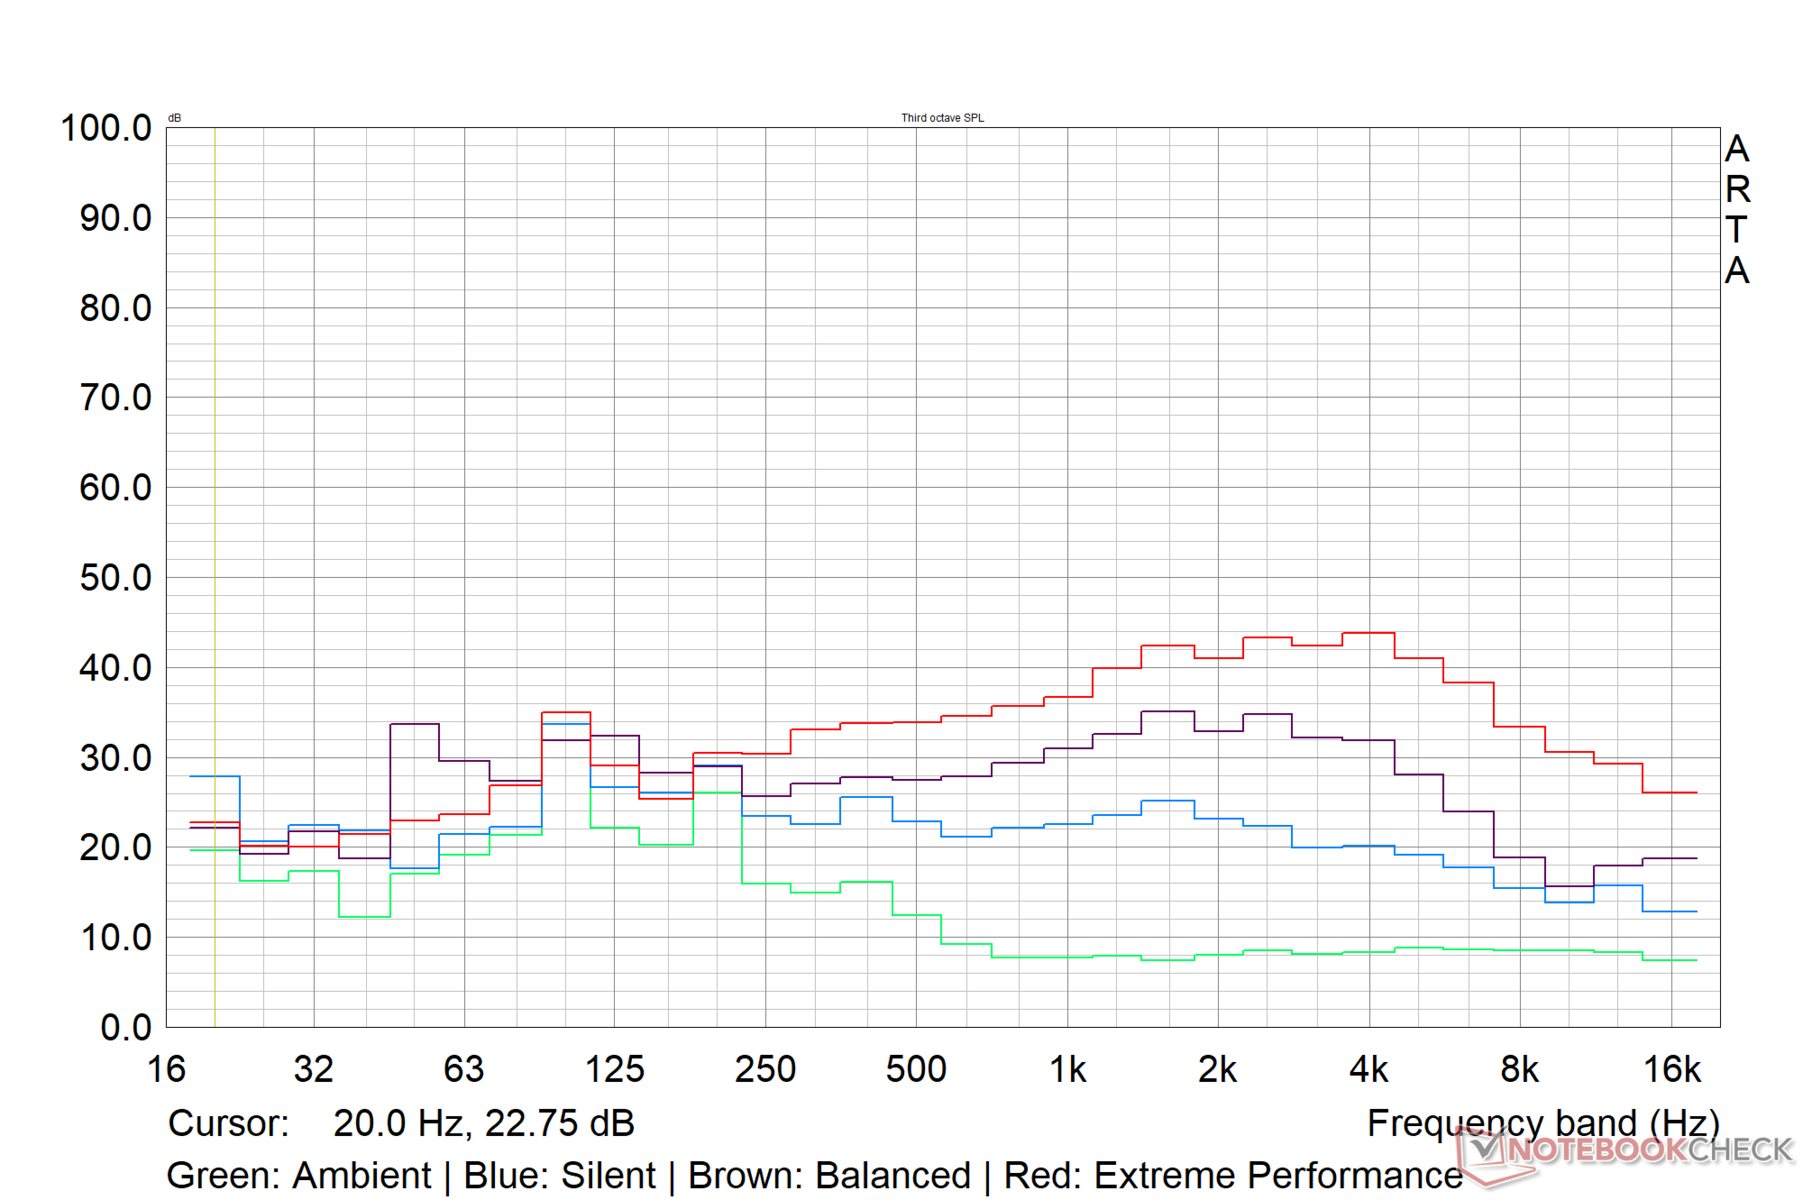
Systeemgeluid
Ventilator geluid in de standaard Balanced instelling is vrij tolerant, zelfs onder belasting. MSI lijkt het maximale ventilatorgeluid van de Crosshair 15 R6E te hebben afgetopt tot ongeveer 45 db(A) in deze modus.
De Extreme Performance instelling ziet het geluidsdrukniveau (SPL) toenemen tot 52 dB(A). De SPL is beperkt tot minder dan 40 dB(A) in het Silent profiel.
| Prestatie-instelling | Stationair dB(A) | Belasting Gemiddeld dB(A) | Belasting Maximaal dB(A) | De Witcher 3 dB(A) |
|---|---|---|---|---|
| Stil | 25,98 | 33,09 | 37,69 | 34 |
| Gebalanceerd | 26,14 | 44,33 | 43,20 | 43,34 |
| Extreme prestaties | 26,14 | 50,07 | 52,66 | 52,43 |
Geluidsniveau
| Onbelast |
| 26.14 / 26.14 / 26.14 dB (A) |
| Belasting |
| 44.33 / 43.2 dB (A) |
 | ||
30 dB stil 40 dB(A) hoorbaar 50 dB(A) luid |
||
min: | ||
| MSI Crosshair 15 R6E B12UGZ-050 Intel Core i7-12700H, NVIDIA GeForce RTX 3070 Laptop GPU | MSI Stealth GS66 12UGS Intel Core i7-12700H, NVIDIA GeForce RTX 3070 Ti Laptop GPU | Lenovo Legion 5 Pro 16 G7 i7 RTX 3070Ti Intel Core i7-12700H, NVIDIA GeForce RTX 3070 Ti Laptop GPU | Asus TUF Dash F15 FX517ZR Intel Core i7-12650H, NVIDIA GeForce RTX 3070 Laptop GPU | Schenker XMG Neo 15 (Ryzen 9 6900HX, RTX 3070 Ti) AMD Ryzen 9 6900HX, NVIDIA GeForce RTX 3070 Ti Laptop GPU | |
|---|---|---|---|---|---|
| Noise | -14% | -12% | -13% | -7% | |
| uit / omgeving * (dB) | 22.82 | 24 -5% | 24.6 -8% | 26 -14% | 23 -1% |
| Idle Minimum * (dB) | 26.14 | 31 -19% | 28.4 -9% | 26 1% | 23 12% |
| Idle Average * (dB) | 26.14 | 32 -22% | 28.4 -9% | 32 -22% | 25.82 1% |
| Idle Maximum * (dB) | 26.14 | 35 -34% | 28.4 -9% | 33 -26% | 27.3 -4% |
| Load Average * (dB) | 44.33 | 48 -8% | 49.4 -11% | 48 -8% | 42.7 4% |
| Witcher 3 ultra * (dB) | 43.3 | 43 1% | 49.4 -14% | 47 -9% | 56 -29% |
| Load Maximum * (dB) | 43.2 | 48 -11% | 54.7 -27% | 49 -13% | 56 -30% |
* ... kleiner is beter
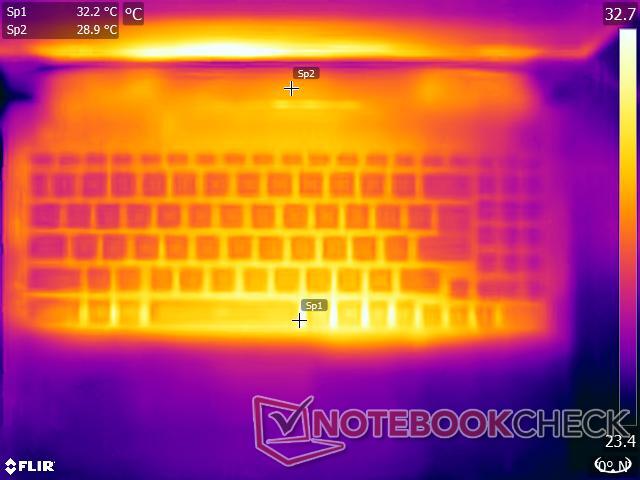
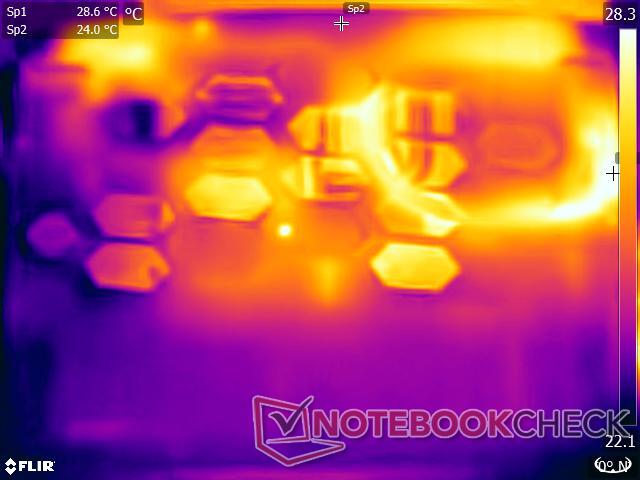
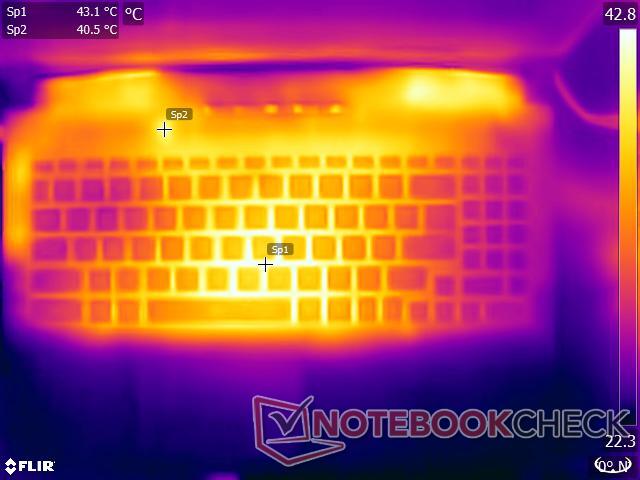
Temperatuur
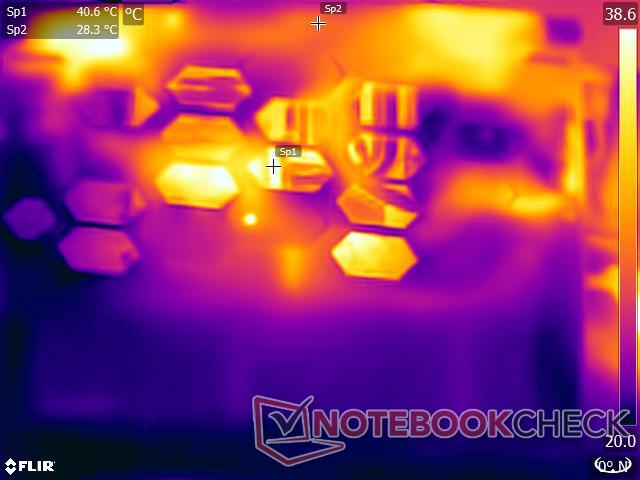
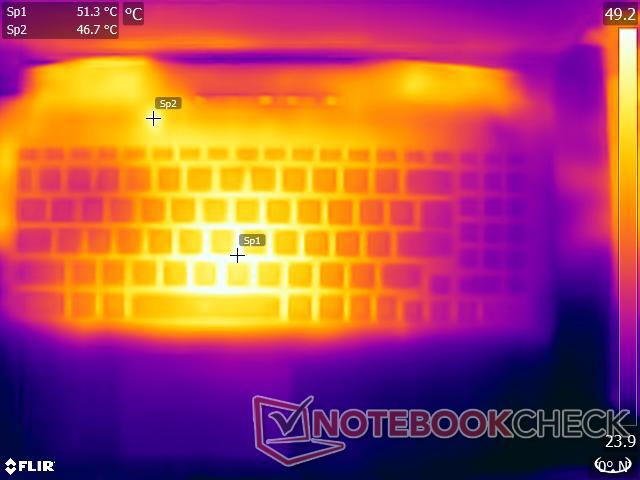
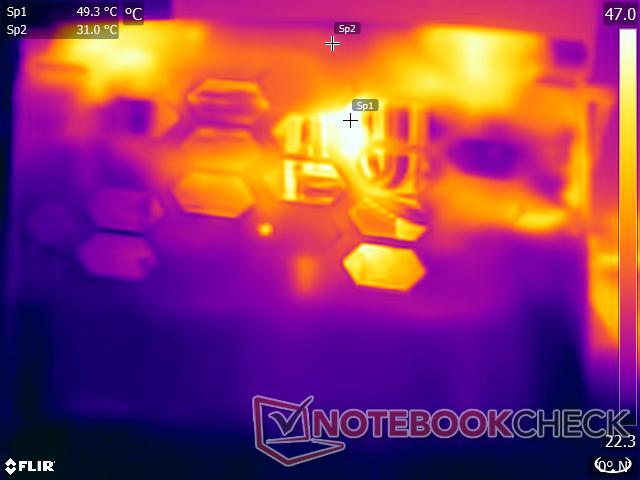
De oppervlaktetemperaturen zijn acceptabel tijdens de meeste productiviteitstaken die de CPU en GPU niet tot het uiterste drijven. Onder een gecombineerde Prime95 en FurMark belasting registreerden we oppervlaktetemperaturen tot aan de 48 °C aan beide zijden van het apparaat. Dit loopt op tot bijna 55 °C tijdens het belasten met The Witcher 3 op 1080p Ultra
Het touchpad en de palmsteun blijven tijdens de test relatief koel.
(-) De maximumtemperatuur aan de bovenzijde bedraagt 48.4 °C / 119 F, vergeleken met het gemiddelde van 40.4 °C / 105 F, variërend van 21.2 tot 68.8 °C voor de klasse Gaming.
(-) De bodem warmt op tot een maximum van 48.2 °C / 119 F, vergeleken met een gemiddelde van 43.2 °C / 110 F
(+) Bij onbelast gebruik bedraagt de gemiddelde temperatuur voor de bovenzijde 30.6 °C / 87 F, vergeleken met het apparaatgemiddelde van 33.9 °C / 93 F.
(-) Bij het spelen van The Witcher 3 is de gemiddelde temperatuur voor de bovenzijde 43.5 °C / 110 F, vergeleken met het apparaatgemiddelde van 33.9 °C / 93 F.
(+) De handpalmsteunen en het touchpad bereiken maximaal de huidtemperatuur (32.8 °C / 91 F) en zijn dus niet heet.
(-) De gemiddelde temperatuur van de handpalmsteun van soortgelijke toestellen bedroeg 28.8 °C / 83.8 F (-4 °C / -7.2 F).
Hoewel onze stresstests extreme scenario's weergeven, raden wij u aan te kiezen voor de standen Stil of Gebalanceerd als u het apparaat op schoot wilt gebruiken.
| MSI Crosshair 15 R6E B12UGZ-050 Intel Core i7-12700H, NVIDIA GeForce RTX 3070 Laptop GPU | MSI Stealth GS66 12UGS Intel Core i7-12700H, NVIDIA GeForce RTX 3070 Ti Laptop GPU | Lenovo Legion 5 Pro 16 G7 i7 RTX 3070Ti Intel Core i7-12700H, NVIDIA GeForce RTX 3070 Ti Laptop GPU | Asus TUF Dash F15 FX517ZR Intel Core i7-12650H, NVIDIA GeForce RTX 3070 Laptop GPU | Schenker XMG Neo 15 (Ryzen 9 6900HX, RTX 3070 Ti) AMD Ryzen 9 6900HX, NVIDIA GeForce RTX 3070 Ti Laptop GPU | |
|---|---|---|---|---|---|
| Heat | 2% | -1% | -6% | 6% | |
| Maximum Upper Side * (°C) | 48.4 | 54 -12% | 45.3 6% | 52 -7% | 41 15% |
| Maximum Bottom * (°C) | 48.2 | 59 -22% | 61.2 -27% | 52 -8% | 57 -18% |
| Idle Upper Side * (°C) | 34 | 26 24% | 28.6 16% | 33 3% | 28 18% |
| Idle Bottom * (°C) | 32.4 | 27 17% | 31.4 3% | 36 -11% | 30 7% |
* ... kleiner is beter
Stresstest
Tijdens Prime95 stress zien we dat de Core i7-12700H in staat is om op te voeren tot 3,8 GHz met een verbruik van 111 W. De gemiddelde kernklokken liggen echter meer in het 2,9 GHz bereik met een gemiddeld pakketvermogen rond de 80 W. De processor kan tijdens deze stress oplopen tot 93 °C.
Door het toevoegen van FurMark verschuift de Crosshair 15 R6E een deel van het totale stroombudget naar de RTX 3070. Dit resulteert in lagere gemiddelde CPU-kernklokken tot 1,9 GHz met een daling van het gemiddelde pakketvermogen tot 47,4 W. De RTX 3070 kan zijn piekklok van 1,9 GHz bereiken en op 1,54 GHz handhaven. Daarbij verbruikt de GPU bijna 195 W piekvermogen en een gemiddelde van ongeveer 101 W. De gemiddelde CPU- en GPU-temperaturen schommelen respectievelijk rond 85,6 °C en 79 °C.
De Witcher 3 stress op 1080p Ultra ziet een eerlijker verdeling van het vermogen, waarbij de Core i7-12700H nu op gemiddelde snelheden van 2,2 GHz kan werken en de RTX 3070 ook iets hoger oploopt tot 1,6 GHz. De hogere gemiddelde GPU-klok gaat ten koste van een hoger gemiddeld stroomverbruik van 138,5 W
Interessant genoeg zien we dat de Core i7-12700H een hogere klok kan halen met net geen 20 W gemiddeld pakketvermogen. De gemiddelde temperaturen tijdens De Witcher 3 stresskust liggen rond de 71,4 °C en 88 °C voor respectievelijk de CPU en GPU.
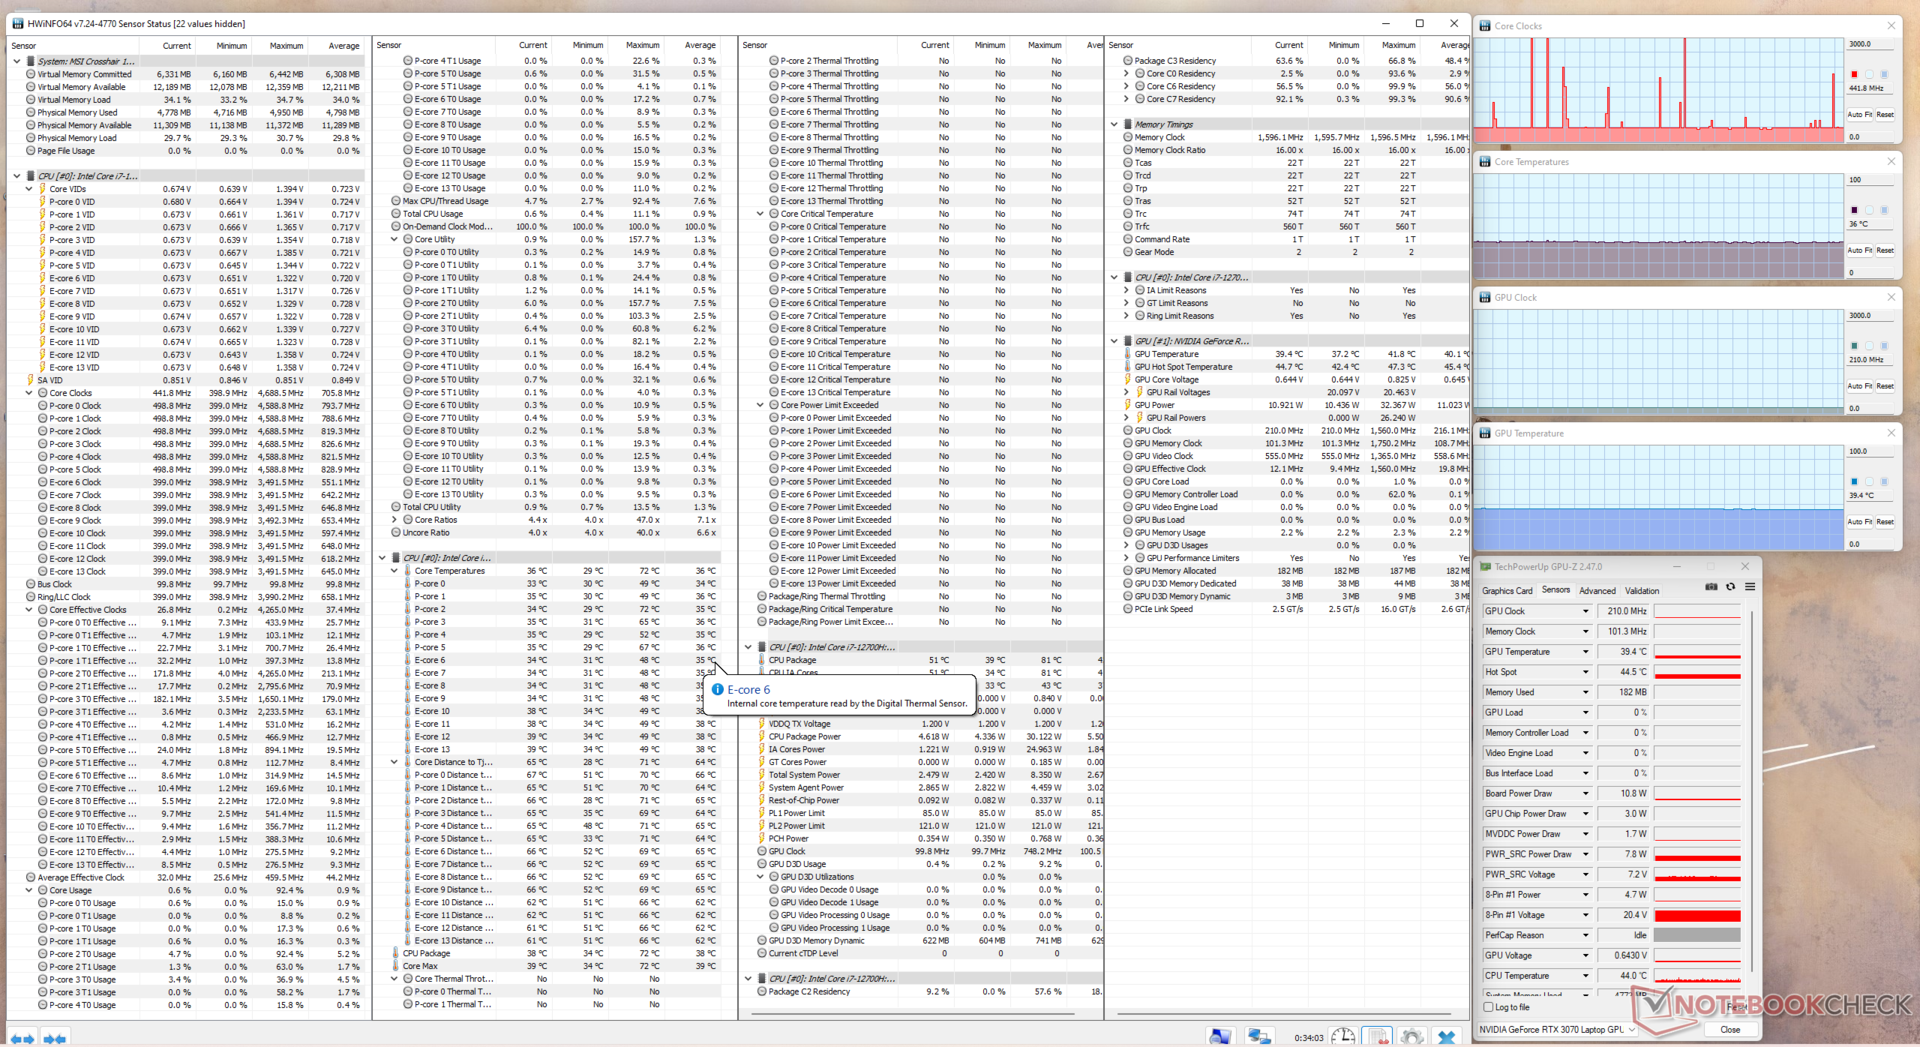
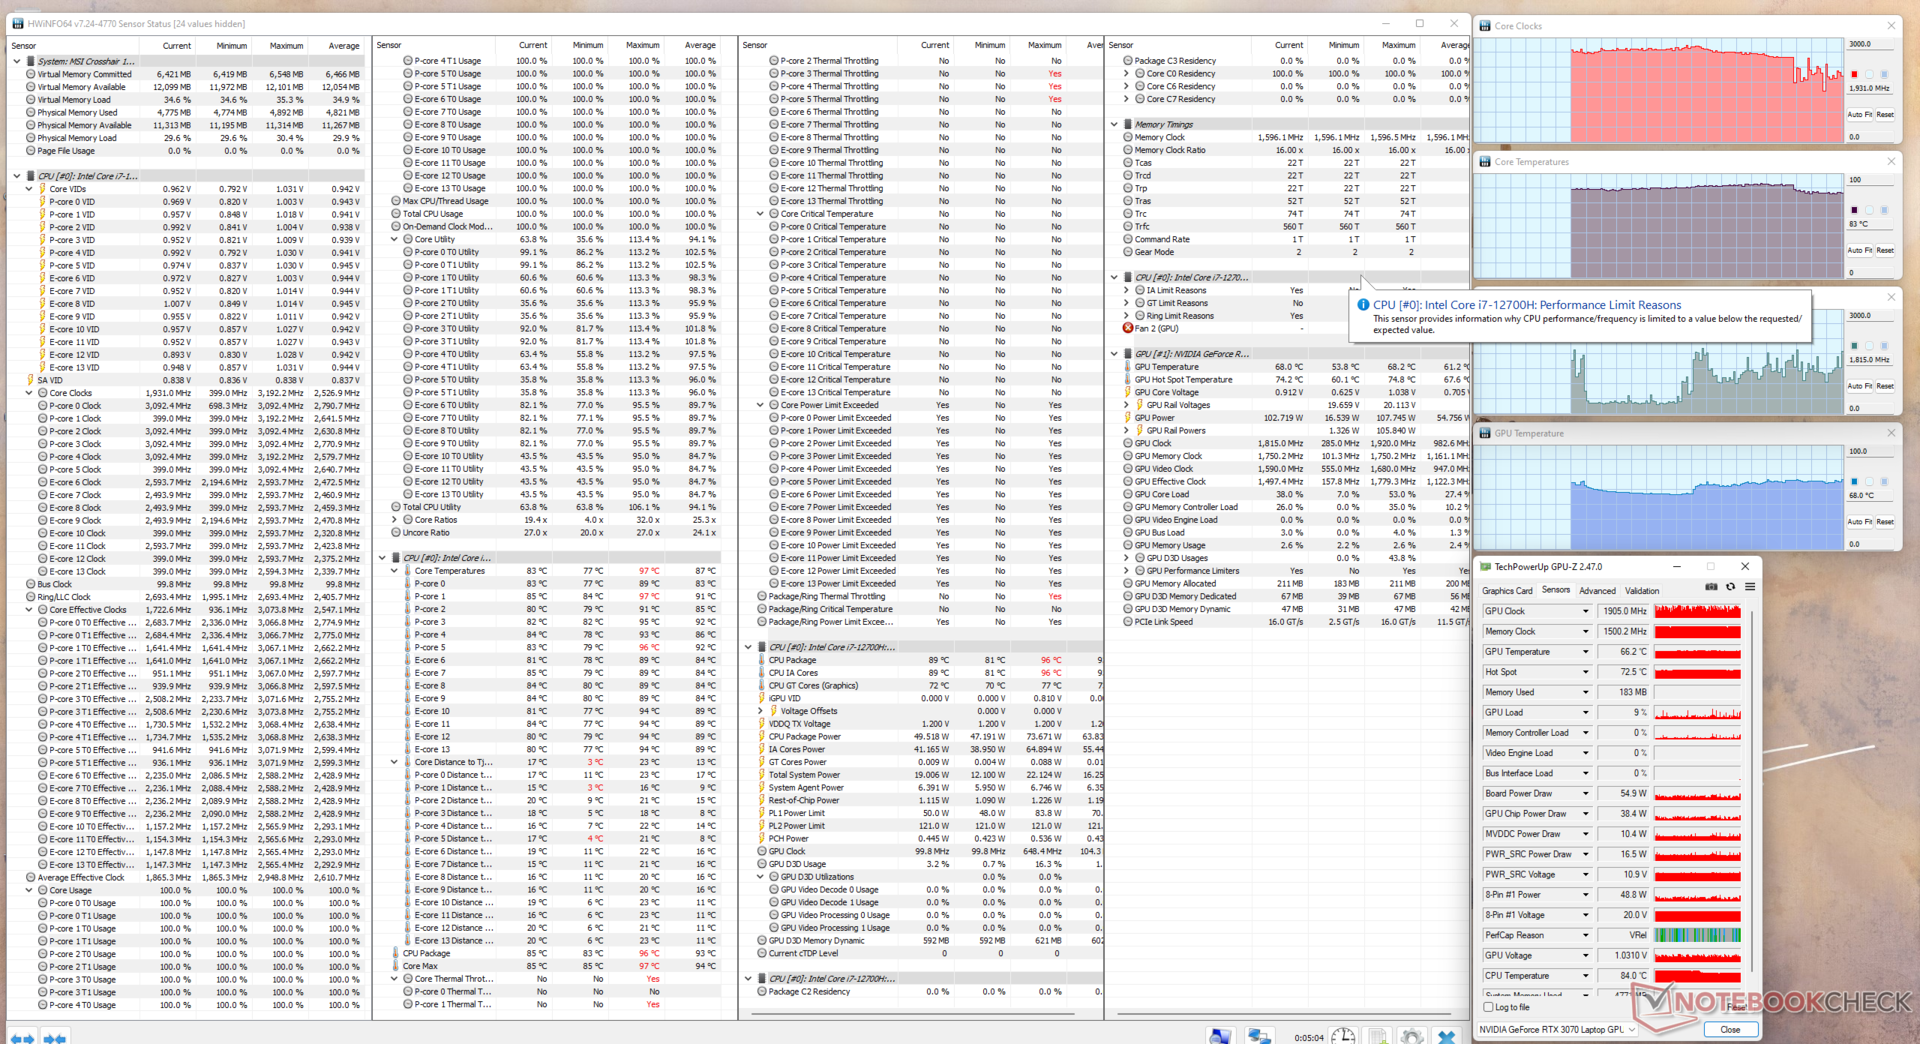
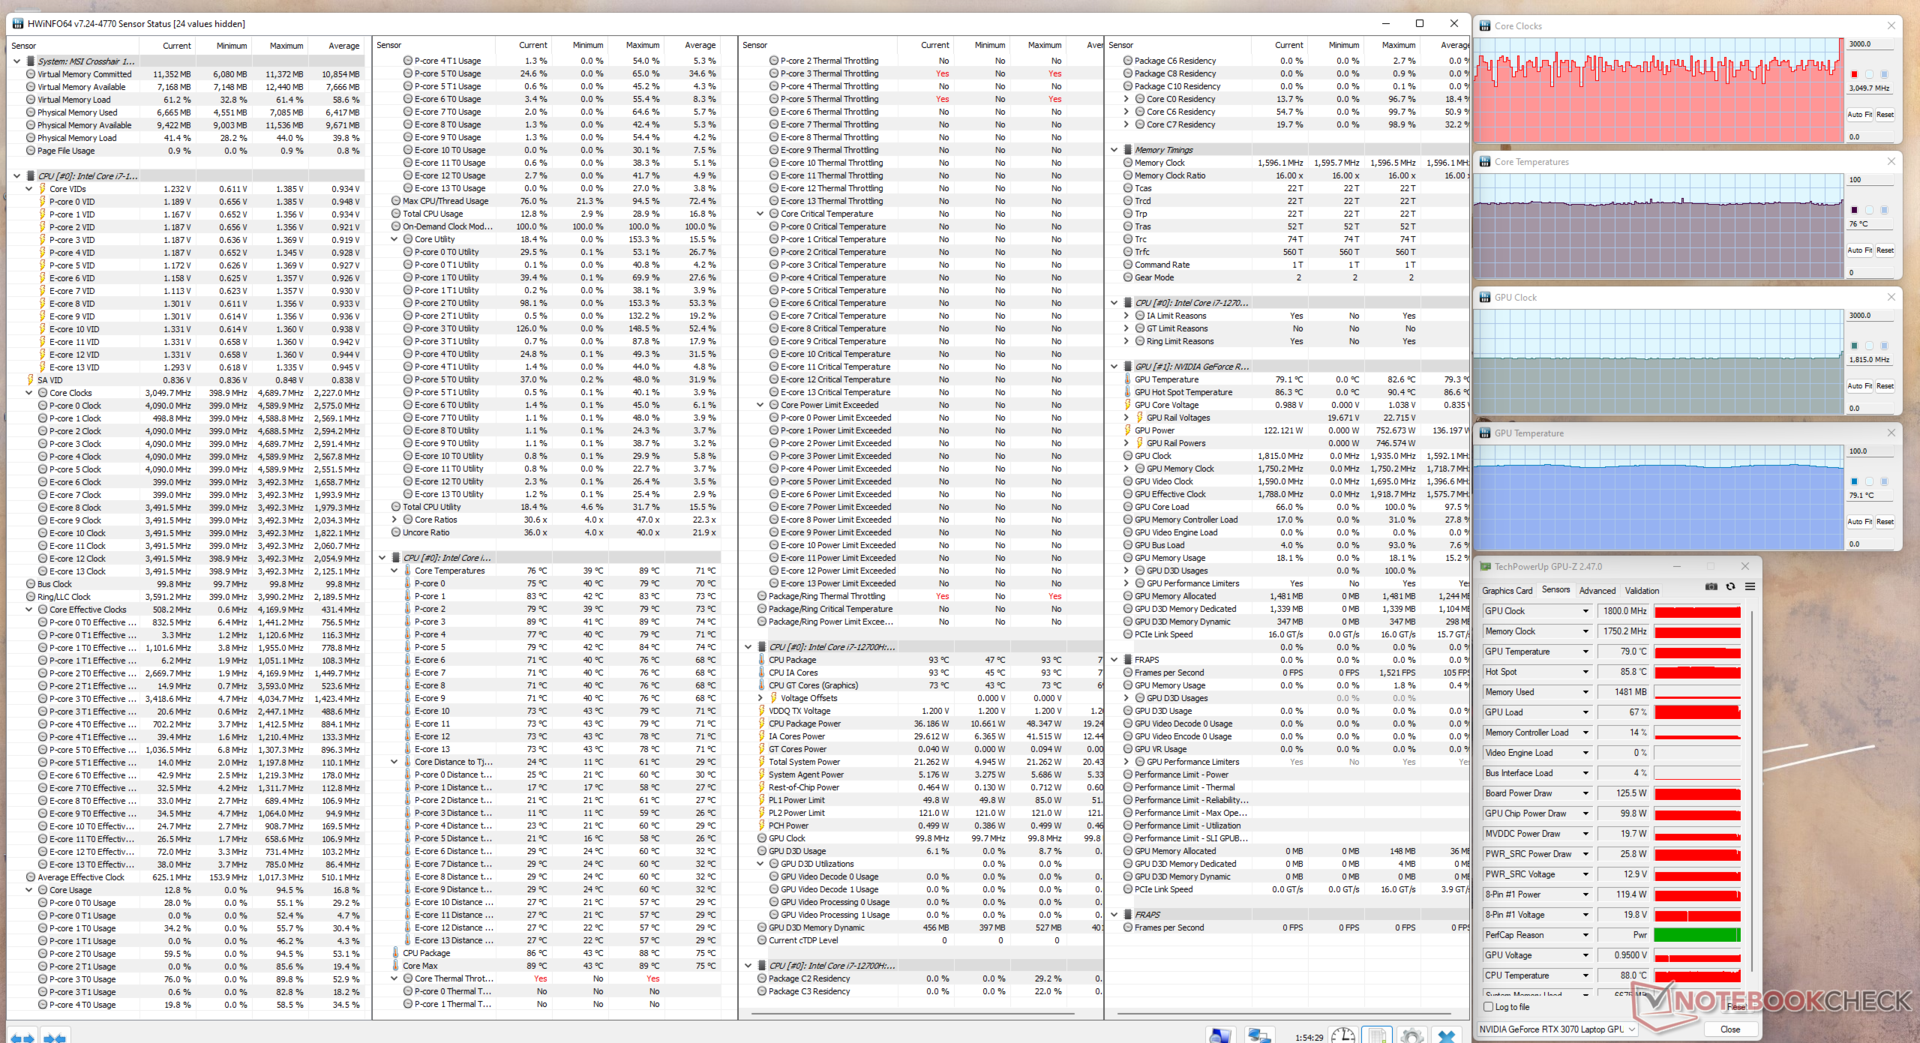
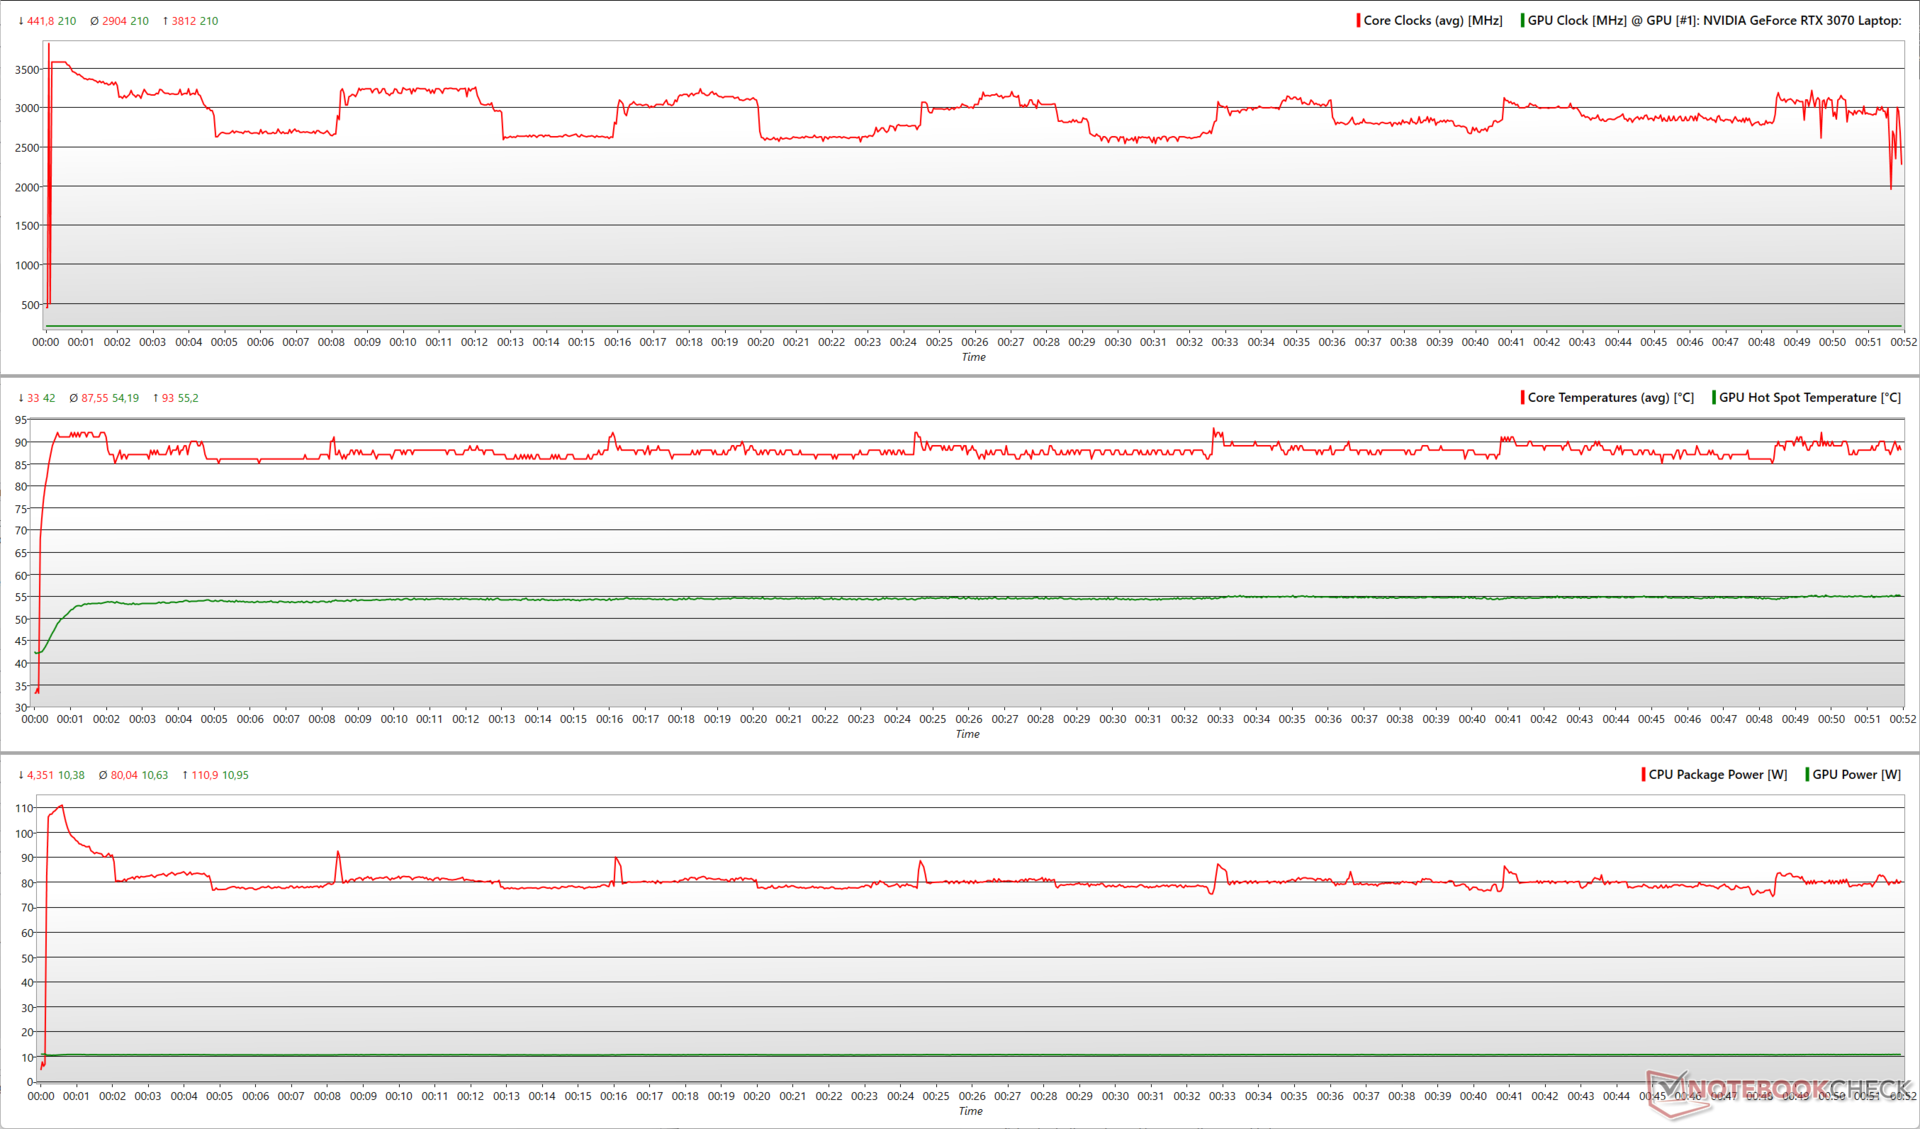
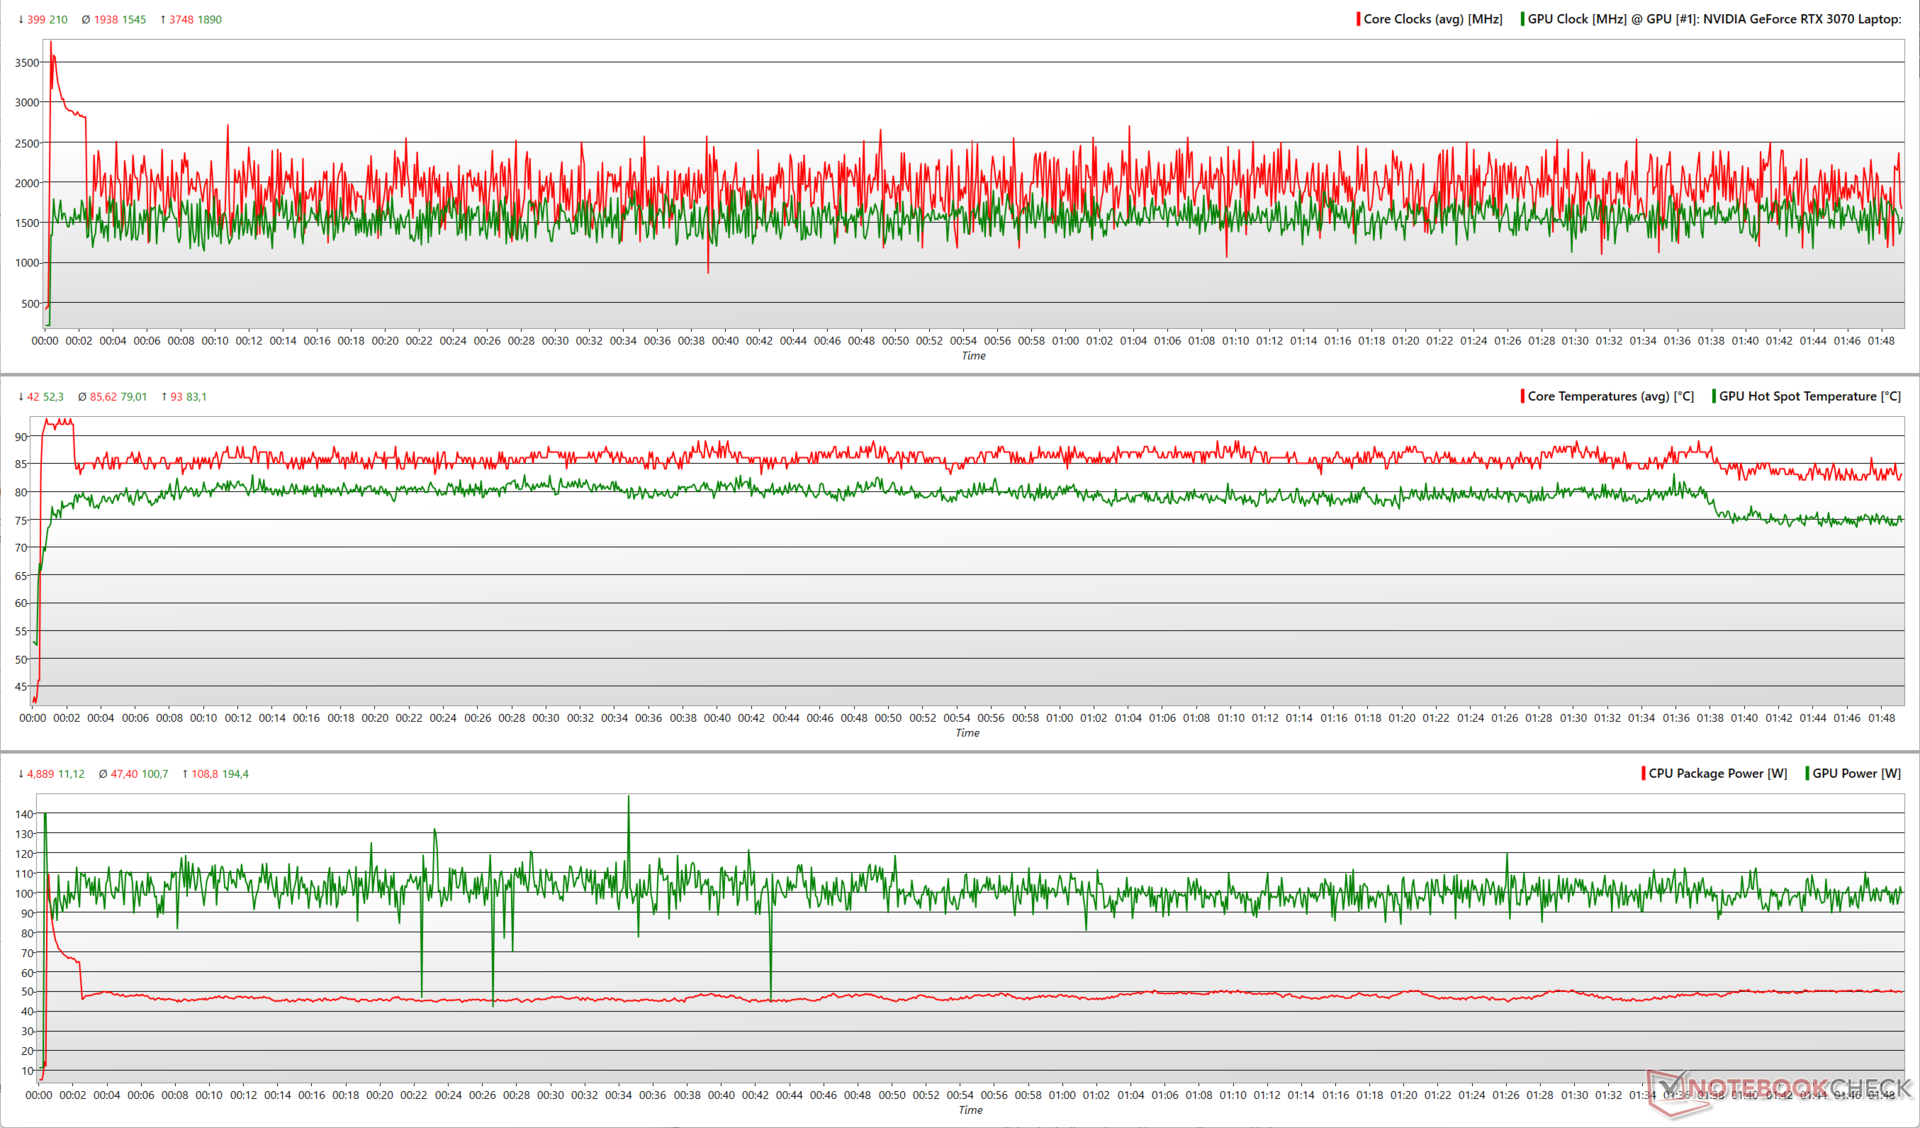
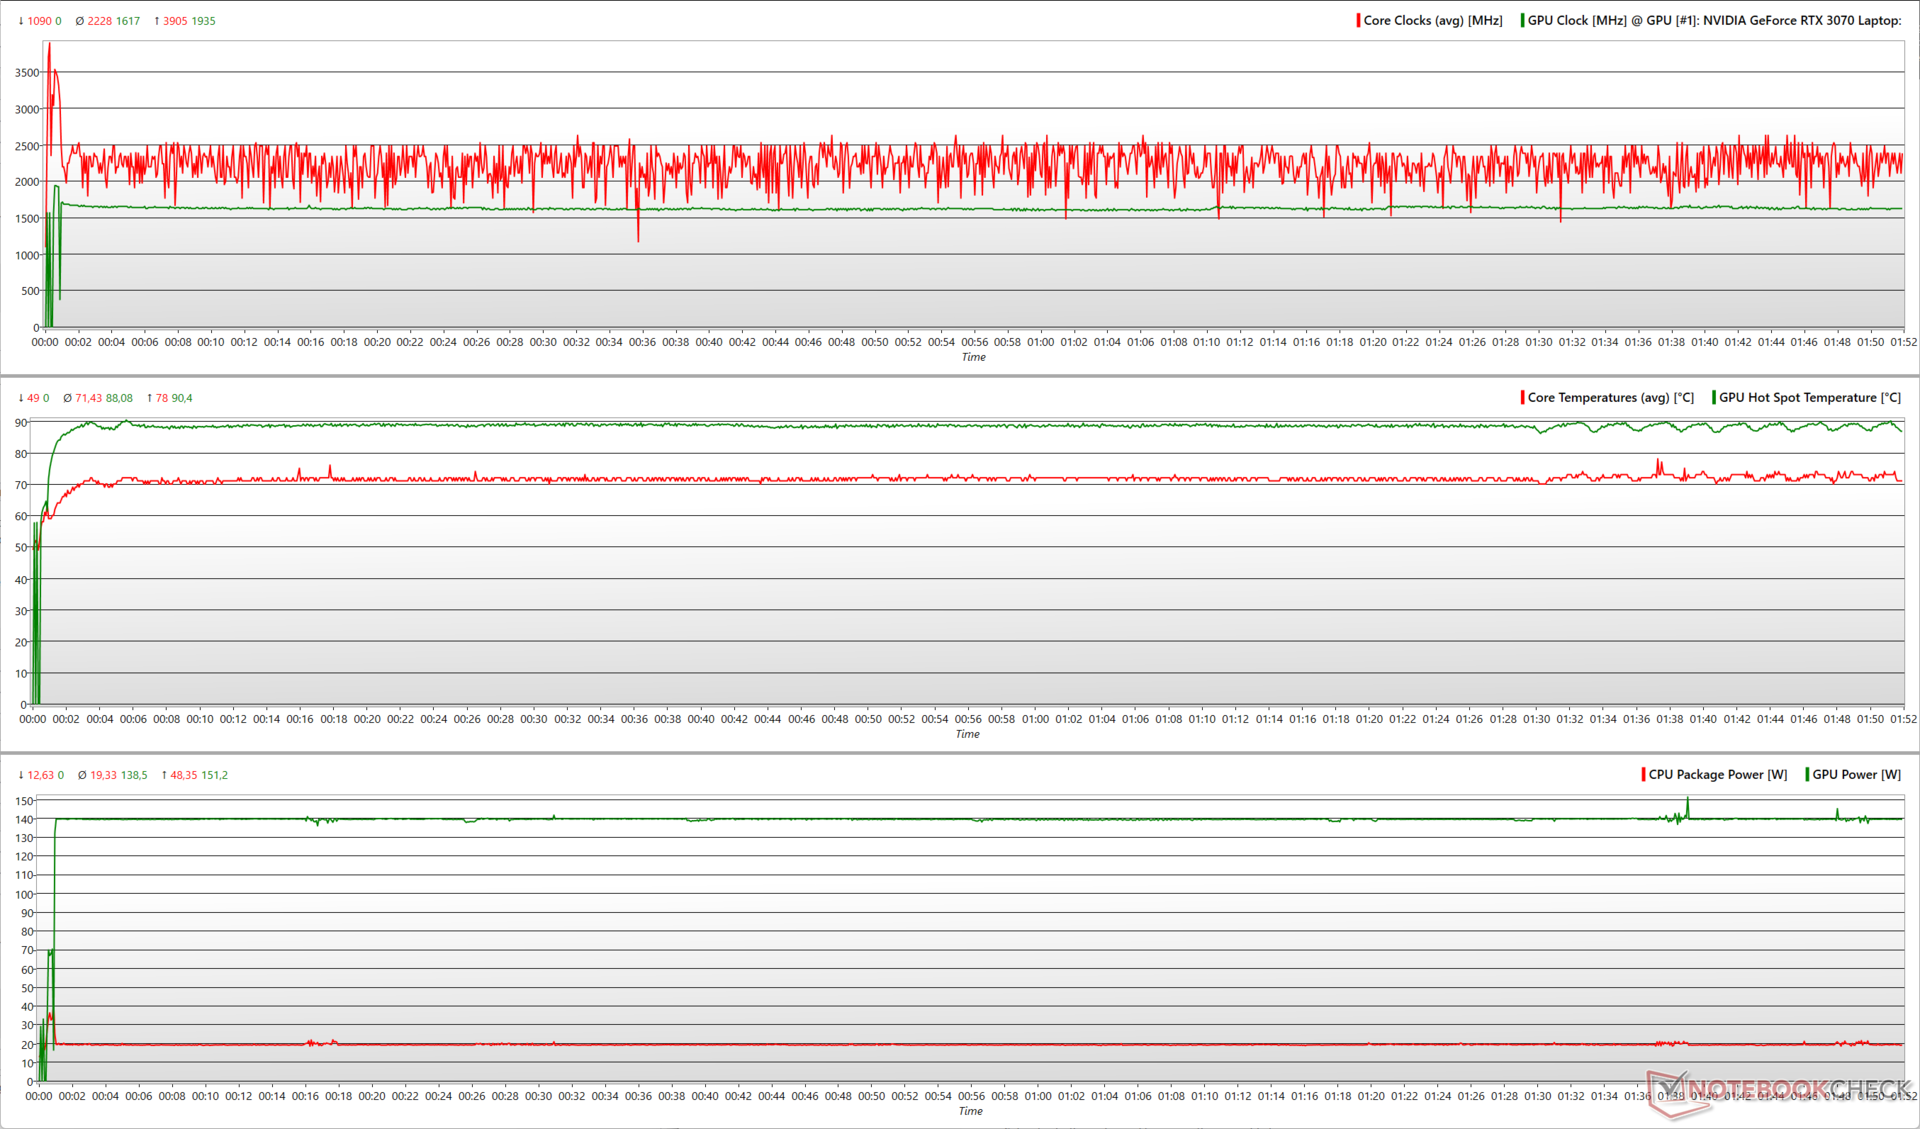
| Stresstest | CPU Klok (GHz) | GPU Klok (MHz) | Gemiddelde CPU Temperatuur (°C) | Gemiddelde GPU Temperatuur (°C) |
| Systeem Idle | 0.4 | 210 | 36 | 40.1 |
| Prime95 | 2.53 | 210 | 51 | 41.3 |
| Prime95 + FurMark | 1.93 | 1.81 | 87 | 61.2 |
| De Witcher 3 | 3.04 | 1.81 | 71 | 79.3 |
Luidsprekers
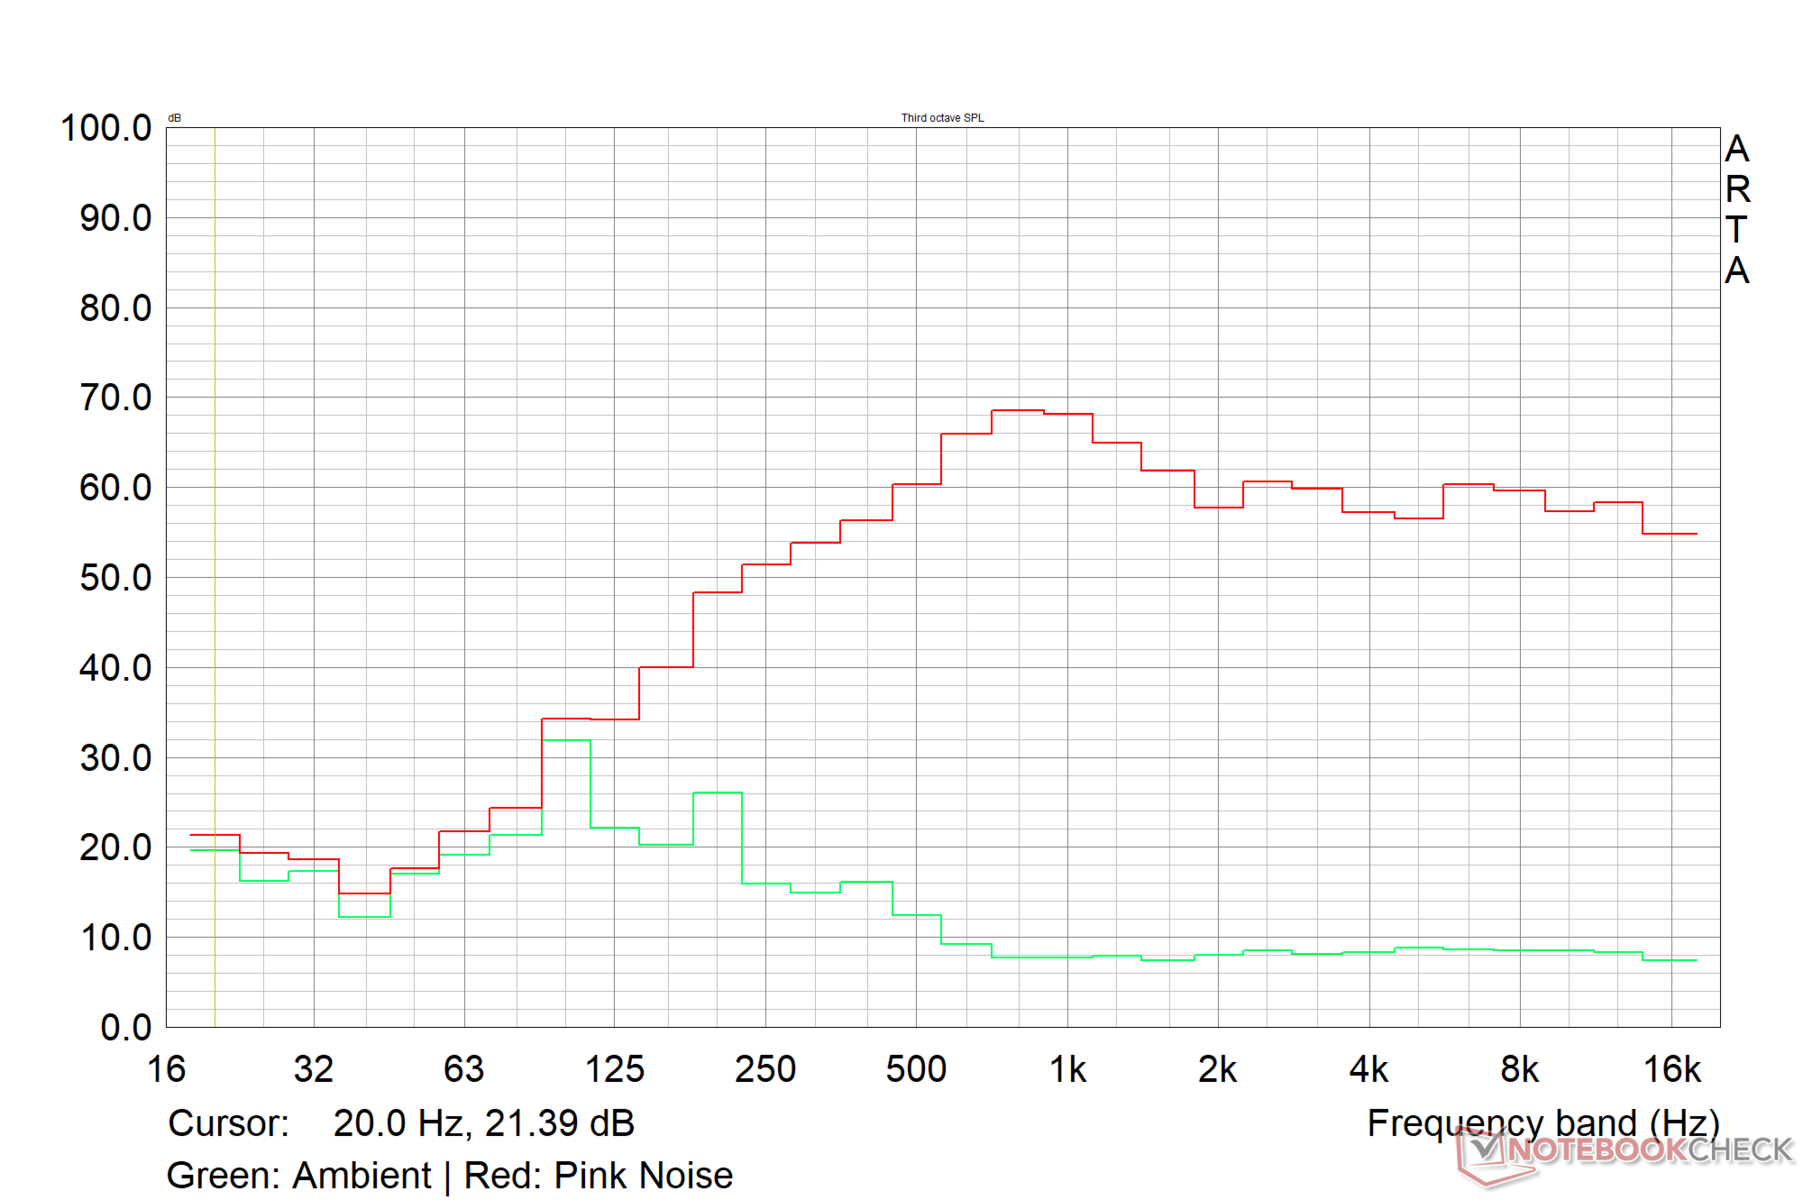
De Crosshair 15 R6E heeft 2x 2W luidsprekers die 74,6 dB(A) luidheid produceren. De basweergave is redelijk, maar de midden- en hoge tonen zijn duidelijk waarneembaar zonder vervorming. De geluidskwaliteit is net voldoende voor basis multimediaconsumptie in een kamer van gemiddelde grootte.
Externe audio kan worden aangesloten via Bluetooth 5.2 of de 3,5 mm combo audio-aansluiting.
MSI Crosshair 15 R6E B12UGZ-050 audioanalyse
(±) | luidspreker luidheid is gemiddeld maar goed (74.6 dB)
Bas 100 - 315 Hz
(±) | verminderde zeebaars - gemiddeld 14.1% lager dan de mediaan
(±) | lineariteit van de lage tonen is gemiddeld (10% delta ten opzichte van de vorige frequentie)
Midden 400 - 2000 Hz
(±) | hogere middens - gemiddeld 5.6% hoger dan de mediaan
(+) | de middentonen zijn lineair (6.5% delta ten opzichte van de vorige frequentie)
Hoog 2 - 16 kHz
(+) | evenwichtige hoogtepunten - slechts 1.7% verwijderd van de mediaan
(+) | de hoge tonen zijn lineair (4% delta naar de vorige frequentie)
Algemeen 100 - 16.000 Hz
(±) | lineariteit van het totale geluid is gemiddeld (15.1% verschil met de mediaan)
Vergeleken met dezelfde klasse
» 32% van alle geteste apparaten in deze klasse waren beter, 6% vergelijkbaar, 62% slechter
» De beste had een delta van 6%, het gemiddelde was 18%, de slechtste was 132%
Vergeleken met alle geteste toestellen
» 21% van alle geteste apparaten waren beter, 4% gelijk, 75% slechter
» De beste had een delta van 4%, het gemiddelde was 23%, de slechtste was 134%
Apple MacBook Pro 16 2021 M1 Pro audioanalyse
(+) | luidsprekers kunnen relatief luid spelen (84.7 dB)
Bas 100 - 315 Hz
(+) | goede baars - slechts 3.8% verwijderd van de mediaan
(+) | de lage tonen zijn lineair (5.2% delta naar de vorige frequentie)
Midden 400 - 2000 Hz
(+) | evenwichtige middens - slechts 1.3% verwijderd van de mediaan
(+) | de middentonen zijn lineair (2.1% delta ten opzichte van de vorige frequentie)
Hoog 2 - 16 kHz
(+) | evenwichtige hoogtepunten - slechts 1.9% verwijderd van de mediaan
(+) | de hoge tonen zijn lineair (2.7% delta naar de vorige frequentie)
Algemeen 100 - 16.000 Hz
(+) | het totale geluid is lineair (4.6% verschil met de mediaan)
Vergeleken met dezelfde klasse
» 0% van alle geteste apparaten in deze klasse waren beter, 0% vergelijkbaar, 100% slechter
» De beste had een delta van 5%, het gemiddelde was 17%, de slechtste was 45%
Vergeleken met alle geteste toestellen
» 0% van alle geteste apparaten waren beter, 0% gelijk, 100% slechter
» De beste had een delta van 4%, het gemiddelde was 23%, de slechtste was 134%
Energiebeheer: Hoog stroomverbruik bij maximale belasting
Stroomverbruik
Zelfs in het Extreme Performance profiel lijkt het stroomverbruik relatief zuinig voor de aangeboden hardware. De Asus TUF Dash F15 is 30% zuiniger dan de Crosshair 15 R6E in load max. en The Witcher 3 tests vanwege zijn lagere wattage CPU en GPU
De voeding is gewaardeerd op 240 W, maar we namen stroomtrekkingen waar tot 290 W tijdens een gecombineerde Prime95 en FurMark belasting. Het fluctuerende stroomverbruik tijdens deze run komt overeen met de fluctuerende CPU- en GPU-klokken die we tijdens de bovenstaande stresstest hebben waargenomen.
| Uit / Standby | |
| Inactief | |
| Belasting |
|
Key:
min: | |
| MSI Crosshair 15 R6E B12UGZ-050 i7-12700H, GeForce RTX 3070 Laptop GPU, IPS-Level, 2560x1440, 15.6" | MSI Stealth GS66 12UGS i7-12700H, GeForce RTX 3070 Ti Laptop GPU, IPS-Level, 2560x1440, 15.6" | Lenovo Legion 5 Pro 16 G7 i7 RTX 3070Ti i7-12700H, GeForce RTX 3070 Ti Laptop GPU, IPS, 2560x1600, 16" | Asus TUF Dash F15 FX517ZR i7-12650H, GeForce RTX 3070 Laptop GPU, IPS, 2560x1440, 15.6" | Schenker XMG Neo 15 (Ryzen 9 6900HX, RTX 3070 Ti) R9 6900HX, GeForce RTX 3070 Ti Laptop GPU, IPS, 2560x1440, 15.6" | Gemiddeld NVIDIA GeForce RTX 3070 Laptop GPU | Gemiddelde van klas Gaming | |
|---|---|---|---|---|---|---|---|
| Power Consumption | -7% | -10% | 2% | -11% | -36% | -25% | |
| Idle Minimum * (Watt) | 9.6 | 11 -15% | 8.6 10% | 10 -4% | 13 -35% | 15.6 ? -63% | 13 ? -35% |
| Idle Average * (Watt) | 14.1 | 16 -13% | 17.6 -25% | 14 1% | 17 -21% | 20.1 ? -43% | 19 ? -35% |
| Idle Maximum * (Watt) | 14.96 | 23 -54% | 18.5 -24% | 20 -34% | 20 -34% | 29.4 ? -97% | 24.6 ? -64% |
| Load Average * (Watt) | 107.3 | 110 -3% | 110 -3% | 122 -14% | 89 17% | 110.8 ? -3% | 110.7 ? -3% |
| Witcher 3 ultra * (Watt) | 197 | 151 23% | 227 -15% | 138.6 30% | 200 -2% | ||
| Load Maximum * (Watt) | 289.93 | 230 21% | 294.6 -2% | 189 35% | 260 10% | 214 ? 26% | 259 ? 11% |
* ... kleiner is beter
Power Consumption - The Witcher 3 / Stress test
Power Consumption - External monitor
Levensduur van de batterij
De batterijtests werden uitgevoerd in het gebalanceerde profiel met de schermverversingsfrequentie ingesteld op 60 Hz. Onze Crosshair 15 R6E B12UGZ was uitgerust met een 4-cel 90 WHr batterij die een behoorlijke looptijd heeft in onze gestandaardiseerde Wi-Fi browsing test bij 150 nits. Video afspelen back-up is net iets minder dan 9 uur bij 150 nits met alle radio's uitgeschakeld.
MSI biedt ook de Crosshair R6E B12UEZ variant die wordt geleverd met een 3-cell 56.5 WHr batterij.
| MSI Crosshair 15 R6E B12UGZ-050 i7-12700H, GeForce RTX 3070 Laptop GPU, 90 Wh | MSI Stealth GS66 12UGS i7-12700H, GeForce RTX 3070 Ti Laptop GPU, 99.9 Wh | Lenovo Legion 5 Pro 16 G7 i7 RTX 3070Ti i7-12700H, GeForce RTX 3070 Ti Laptop GPU, 80 Wh | Asus TUF Dash F15 FX517ZR i7-12650H, GeForce RTX 3070 Laptop GPU, 76 Wh | Schenker XMG Neo 15 (Ryzen 9 6900HX, RTX 3070 Ti) R9 6900HX, GeForce RTX 3070 Ti Laptop GPU, 93 Wh | Gemiddelde van klas Gaming | |
|---|---|---|---|---|---|---|
| Batterijduur | 4% | -35% | 18% | 34% | 5% | |
| H.264 (h) | 8.9 | 6.3 -29% | 5.8 -35% | 10.7 20% | 8.32 ? -7% | |
| WiFi v1.3 (h) | 7.3 | 5.4 -26% | 5.4 -26% | 7 -4% | 10.9 49% | 7.11 ? -3% |
| Witcher 3 ultra (h) | 1.6 | |||||
| Load (h) | 1.2 | 1.6 33% | 0.6 -50% | 2.3 92% | 1.6 33% | 1.502 ? 25% |
| Reader / Idle (h) | 7.8 | 10.8 | 8.27 ? |
Pro
Contra
Verdict: Pulse GL66 reskin die veel dingen goed doet

Laptops met als thema specifieke games hebben over het algemeen een beperkte aantrekkingskracht buiten de fans van het genoemde spel. De MSI Crosshair 15 Rainbow Six: Extraction Edition, gelijknamig aan Ubisofts populaire co-op FPS-franchise, is de enige Crosshair 15 die dit jaar wordt aangeboden
Het chassis is in wezen een rehash van de Pulse GL66 met zwaar geleende ontwerpelementen uit de game. MSI heeft zelfs zijn eigen logo op het schermdeksel vervangen door dat van Rainbow Six: Extraction. Je krijgt ook een paar goodies in de doos, waaronder een game-thema muis, een muismat, en een Deluxe kopie van het spel zelf
Als zodanig erft de Crosshair 15 R6E enkele tekortkomingen van het ontwerp van de Pulse GL66, zoals flexibiliteit in het toetsenbord en een niet-ideale poortverdeling. De laptop wordt echter geleverd met een zeer functioneel QHD 165 Hz scherm dat goed zou moeten zijn voor zowel gaming als content creatie.
De MSI Crosshair 15 Rainbow Six: Extraction's design kan een beperkte aantrekkingskracht hebben, maar onder de huid krijg je een zeer capabele midranger met goede display eigenschappen en verdraagbare emissies."
De Crosshair 15 R6E's implementatie van de Core i7-12700H is niet de snelste die we hebben gezien. De MSI Stealth GS66 en de Lenovo Legion 5i Pro 16 G7 met dezelfde processor presteren merkbaar beter in multi-core tests. De algemene prestaties van de Crosshair 15 R6E in gaming kunnen beter of gelijk zijn aan sommige RTX 3070 Ti-aangedreven laptops zoals de Schenker XMG Neo 15, Acer Nitro 5, en MSI Katana GF66
Thermische en geluidsemissies zijn grotendeels tolereerbaar zolang je het Balanced prestatieprofiel goed vindt. Het stroomverbruik is echter aan de hogere kant, vooral bij stroomtrekkingen onder maximale belasting en gaming
Zelfs als je geen fan bent van het spel, is de MSI Crosshair 15 Rainbow Six: Extraction Edition wel een overweging waard, rekening houdend met de geboden prestaties en de prijs ten opzichte van de concurrentie.
Prijs en beschikbaarheid
De MSI Crosshair 15 Rainbow Six: Extraction Edition is beschikbaar op Amazon US voor US$2,149. In India verkoopt de laptop rond de ₹1,90,990 mark, maar is momenteel vermeld als uitverkocht op Amazon India en Flipkart.
MSI Crosshair 15 R6E B12UGZ-050
- 19-12-2022 v7 (old)
Vaidyanathan Subramaniam
Price comparison

