Lenovo ThinkPad T16 Gen 1 Core i7 laptop review: Stil ten koste van de prestaties
De ThinkPad T16 G1 is Lenovo's tweede 16-inch ThinkPad, ontworpen als een stap omhoog van de bestaande prosumer ThinkBook 16-serie. Hij heeft zowel 12e generatie Core U als Core P CPU opties naast de discrete GeForce MX550 GPU op bepaalde SKU's.
We hebben onlangs de Core i5-1240P en Ryzen 5 Pro 6650U configuraties beoordeeld en daarom zal deze review zich richten op de Core i7-1270P configuratie. We raden aan onze bestaande review van de Core i5 versie om meer te weten te komen over het chassis en andere fysieke kenmerken van de ThinkPad T16 G1. Hoeveel verschil in prestaties kunnen gebruikers verwachten bij een upgrade naar de duurdere Core i7-optie?
Concurrenten van de ThinkPad T16 G1 zijn onder andere de 16-inch LG Gram 16, MSI Summit E16of HP EliteBook 860/865 G9. Dell heeft op het moment van schrijven nog geen directe 16-inch Latitude concurrent op de markt gebracht. Onze configuratie zoals beoordeeld wordt verkocht voor ongeveer 1800 USD.
Meer Lenovo beoordelingen:
Potentiële concurrenten in vergelijking
Evaluatie | Datum | Model | Gewicht | Hoogte | Formaat | Resolutie | Beste prijs |
|---|---|---|---|---|---|---|---|
| 88.6 % v7 (old) | 01-2023 | Lenovo ThinkPad T16 Gen 1 Core i7-1270P i7-1270P, Iris Xe G7 96EUs | 2 kg | 20.5 mm | 16.00" | 1920x1200 | |
| 90.2 % v7 (old) | 02-2023 | Lenovo ThinkPad T16 G1 21CH004MGE R5 PRO 6650U, Radeon 660M | 1.8 kg | 20.5 mm | 16.00" | 2560x1600 | |
| 86.6 % v7 (old) | 01-2023 | LG Gram 16Z90Q i7-1260P, Iris Xe G7 96EUs | 1.2 kg | 16.8 mm | 16.00" | 2560x1600 | |
| 87.2 % v7 (old) | 12-2022 | HP EliteBook 865 G9 R7 PRO 6850U, Radeon 680M | 1.9 kg | 19 mm | 16.00" | 1920x1200 | |
| 86.4 % v7 (old) | 07-2022 | Huawei MateBook 16s i7 i7-12700H, Iris Xe G7 96EUs | 2 kg | 17.8 mm | 16.00" | 2520x1680 | |
| 93.2 % v7 (old) | 11-2021 | Apple MacBook Pro 16 2021 M1 Pro M1 Pro, M1 Pro 16-Core GPU | 2.2 kg | 16.8 mm | 16.20" | 3456x2234 |
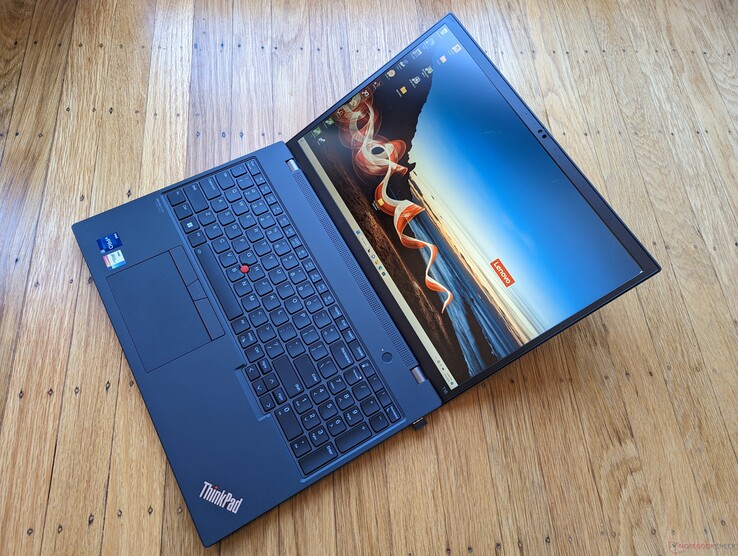
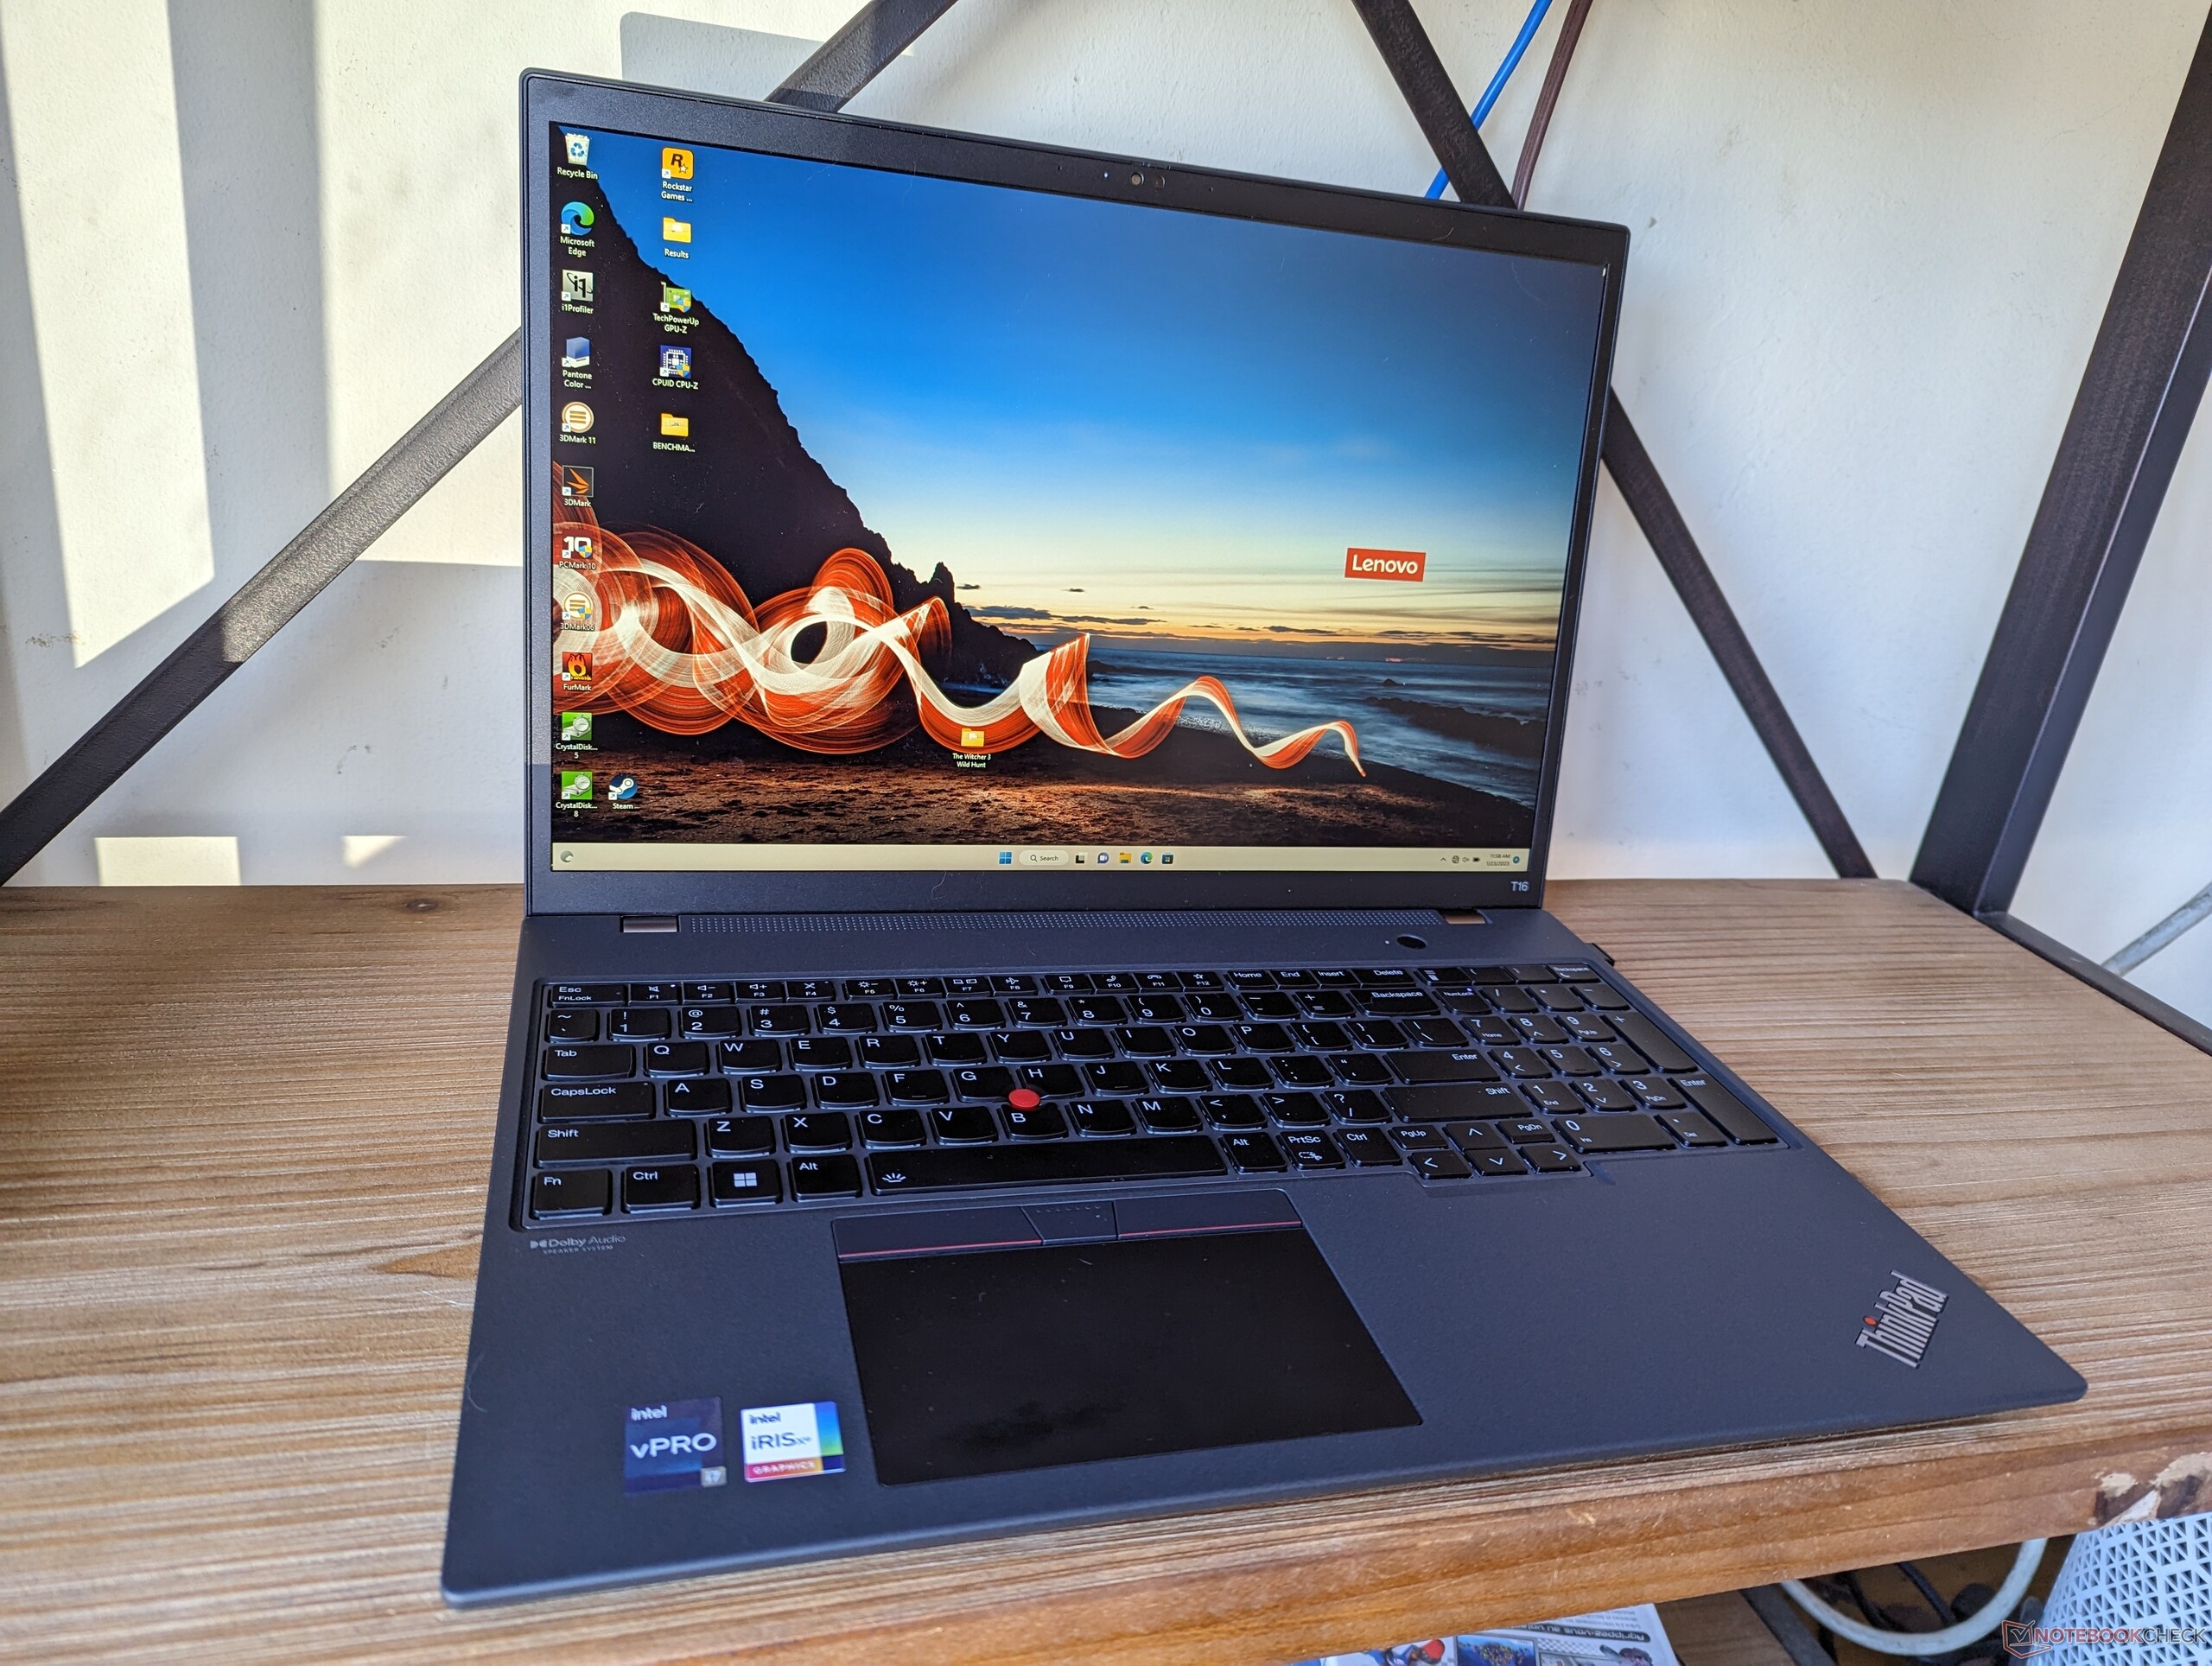
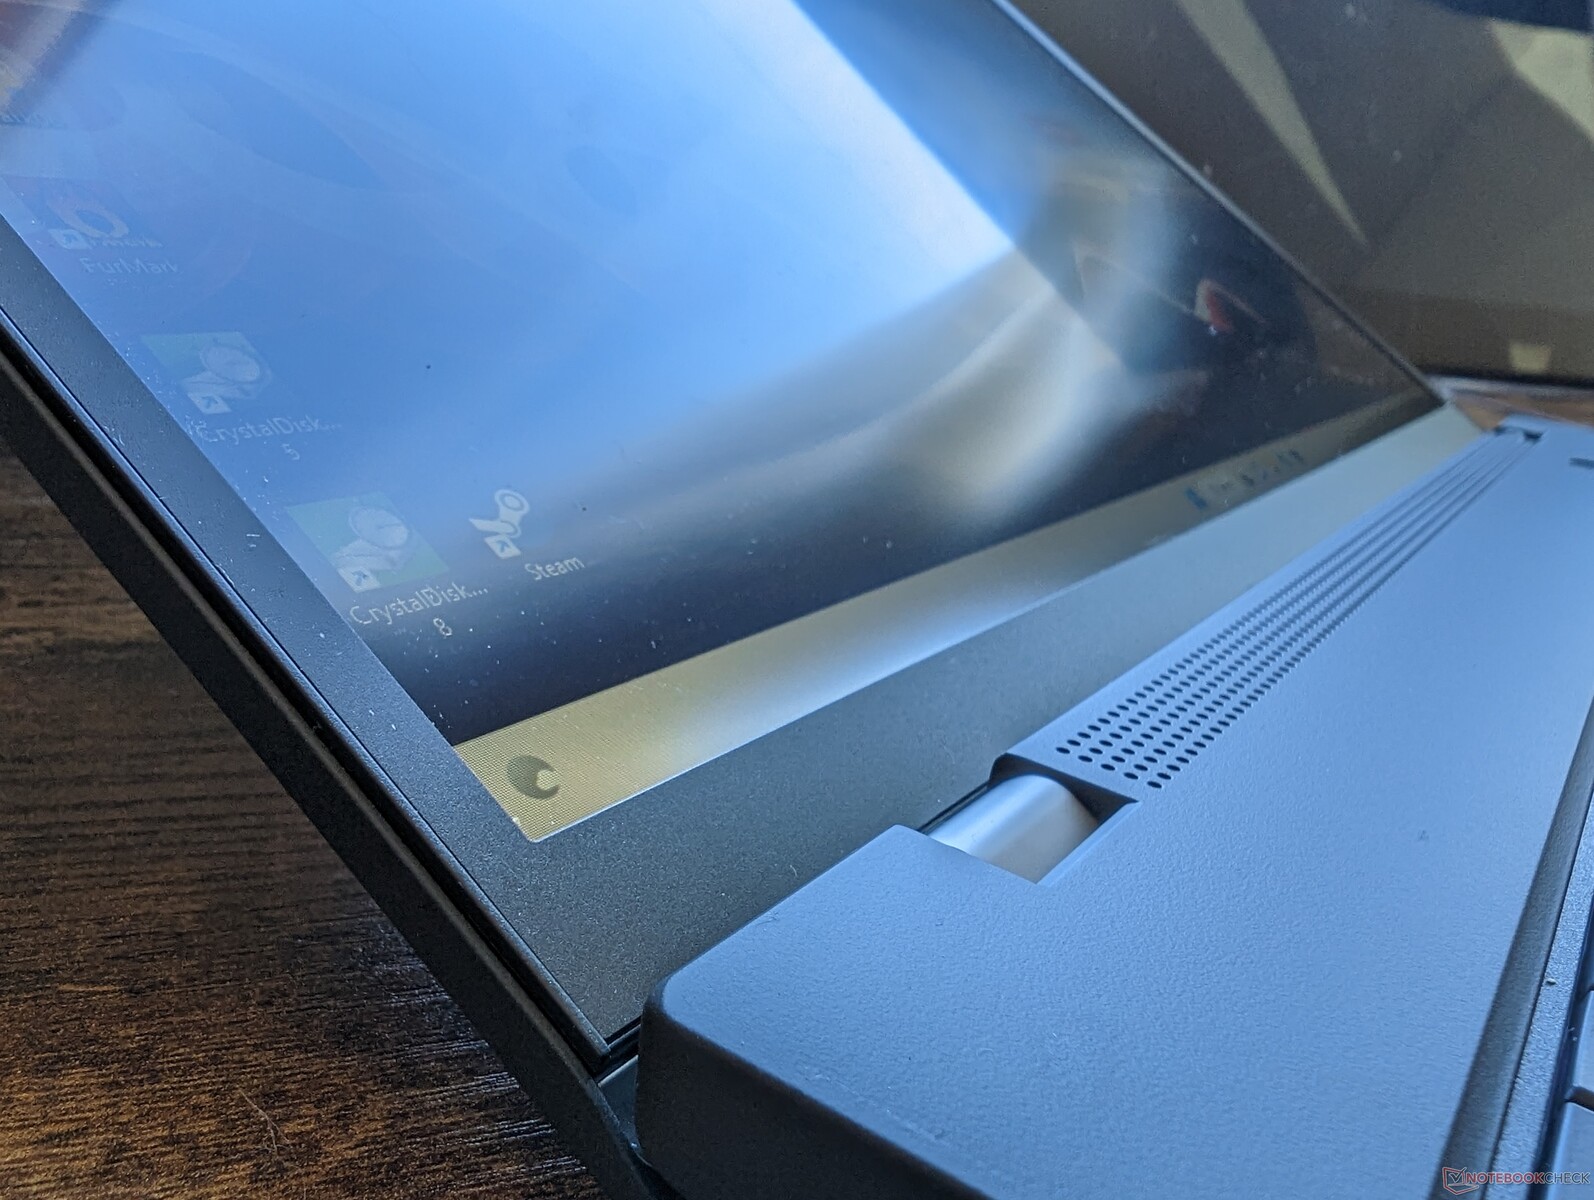
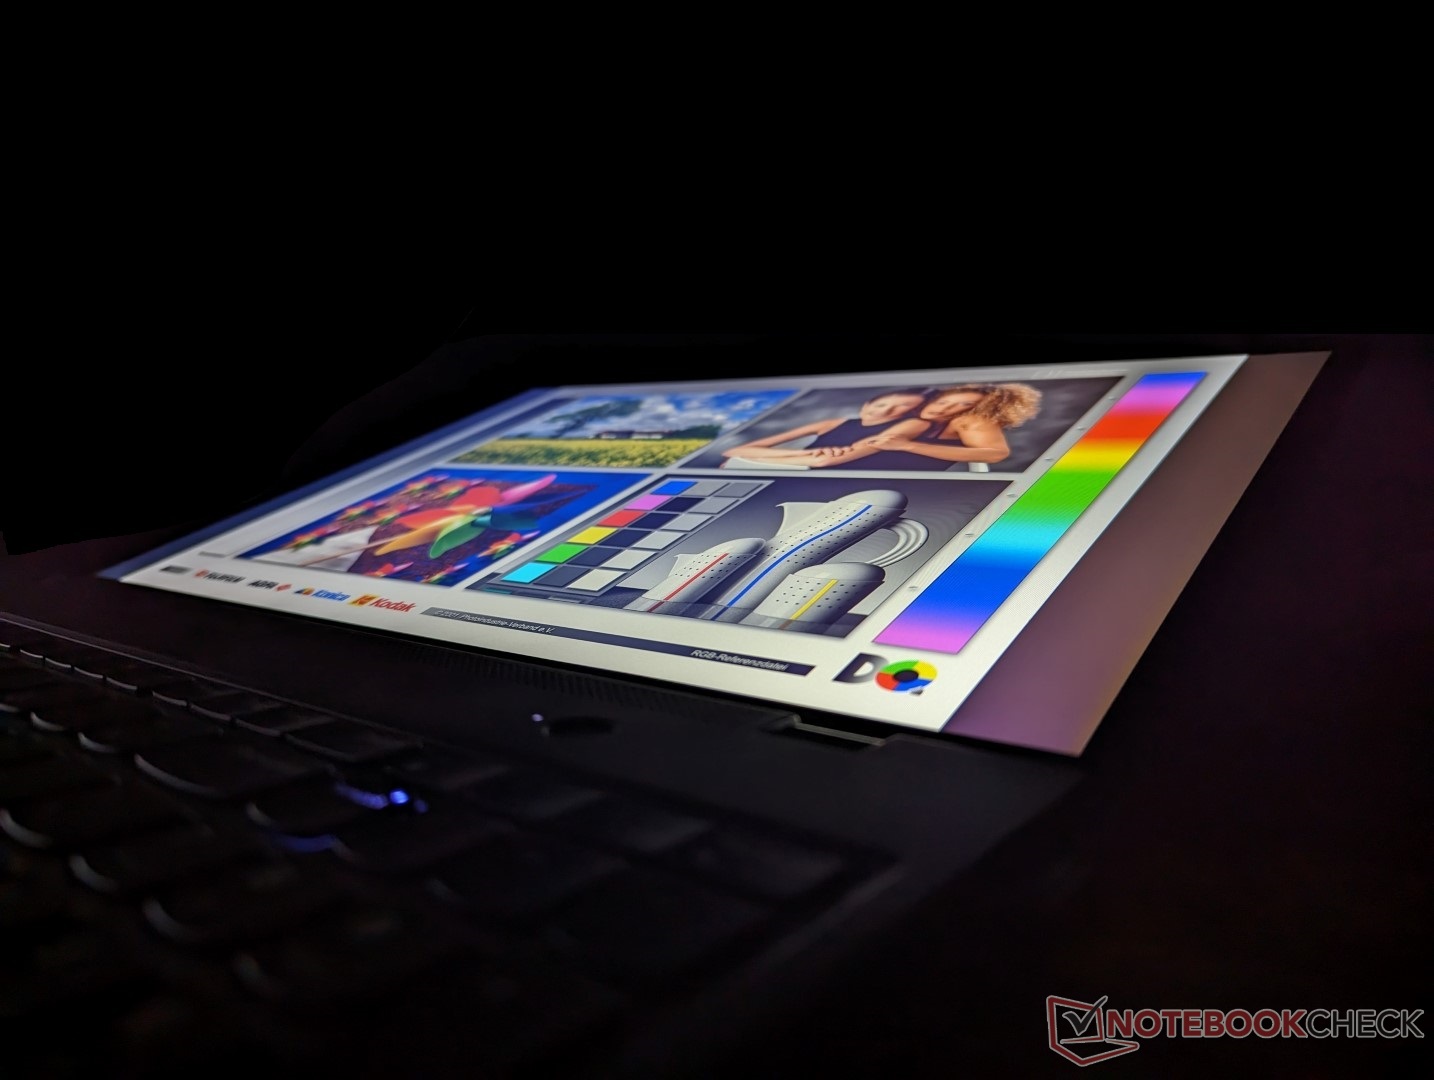
Case - A Little Big
Hoewel het model nog maar een paar maanden oud is, is het chassisontwerp iets groter in alle dimensies in vergelijking met concurrerende 16-inch laptops zoals de HP EliteBook 865 G9 of Apple MacBook Pro 16. De LG Gram 16 in het bijzonder is lichter met 800 gram.
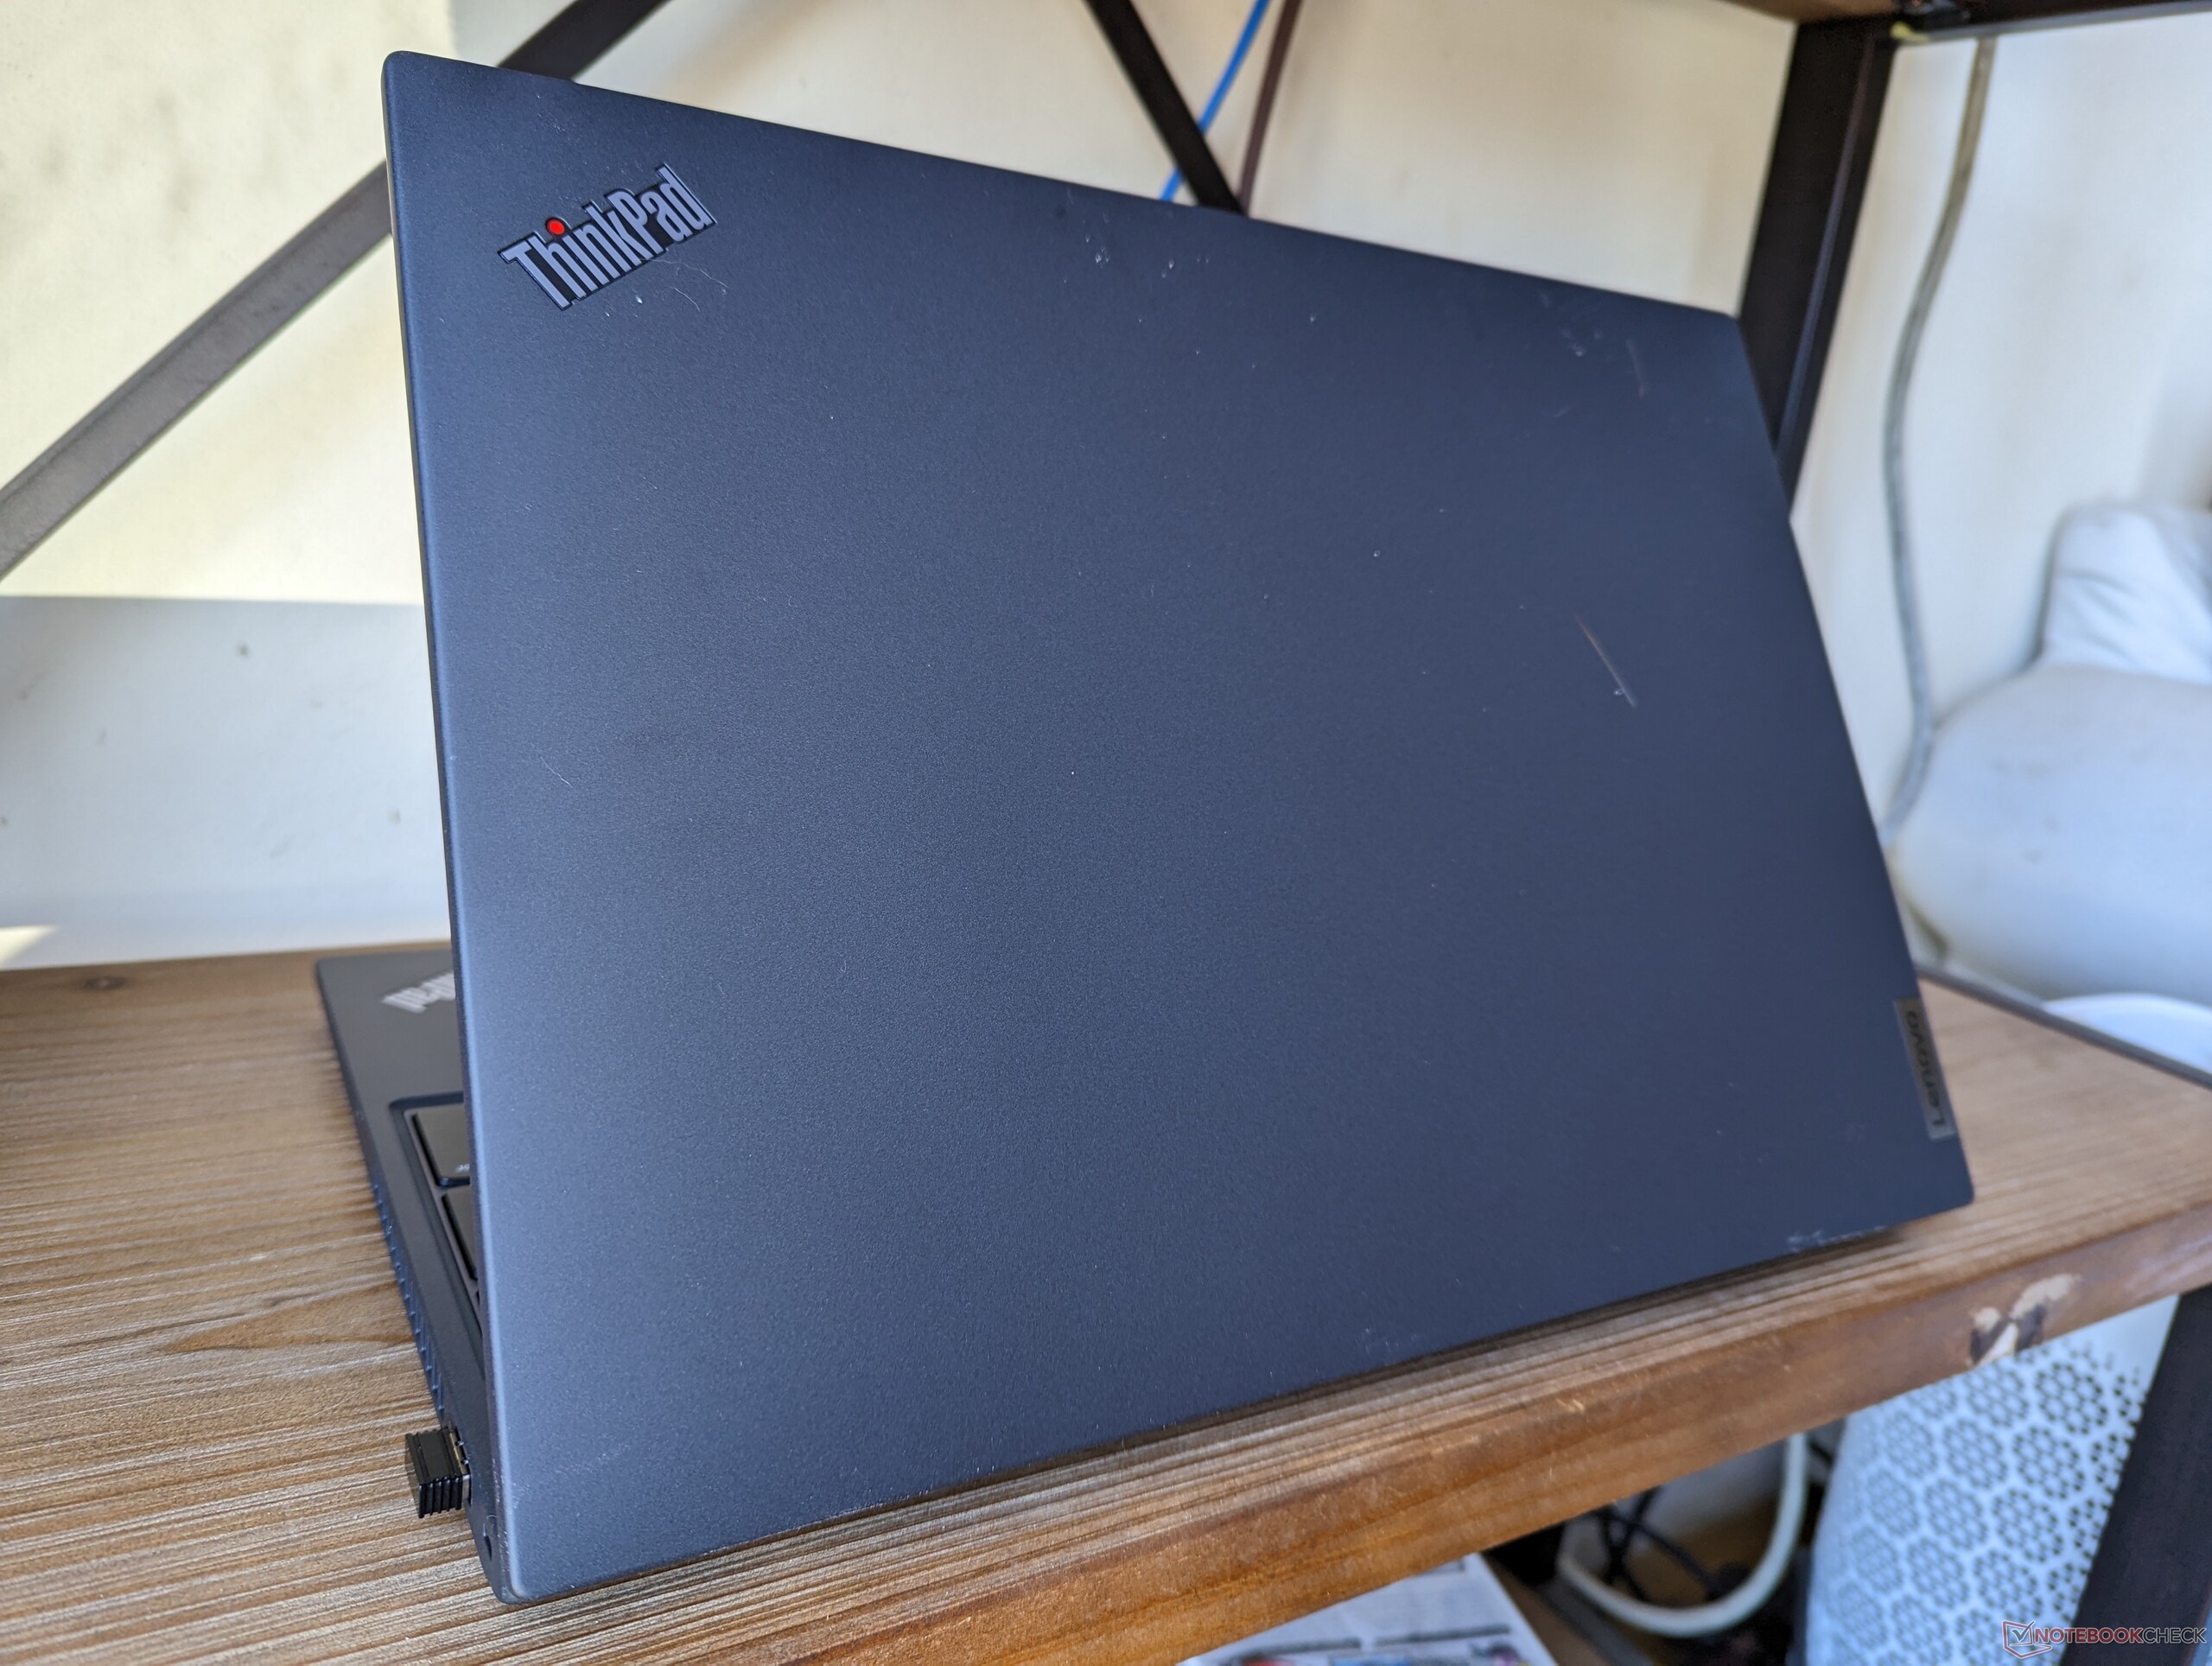
Verwacht dat vet en vingerafdrukken zich zeer snel ophopen op de matzwarte oppervlakken. De donkere koolstofvezel, glasvezel en plastic aanpak staat hier in contrast met de helder grijze metaallegering aanpak van de concurrerende HP EliteBook.
Communicatie
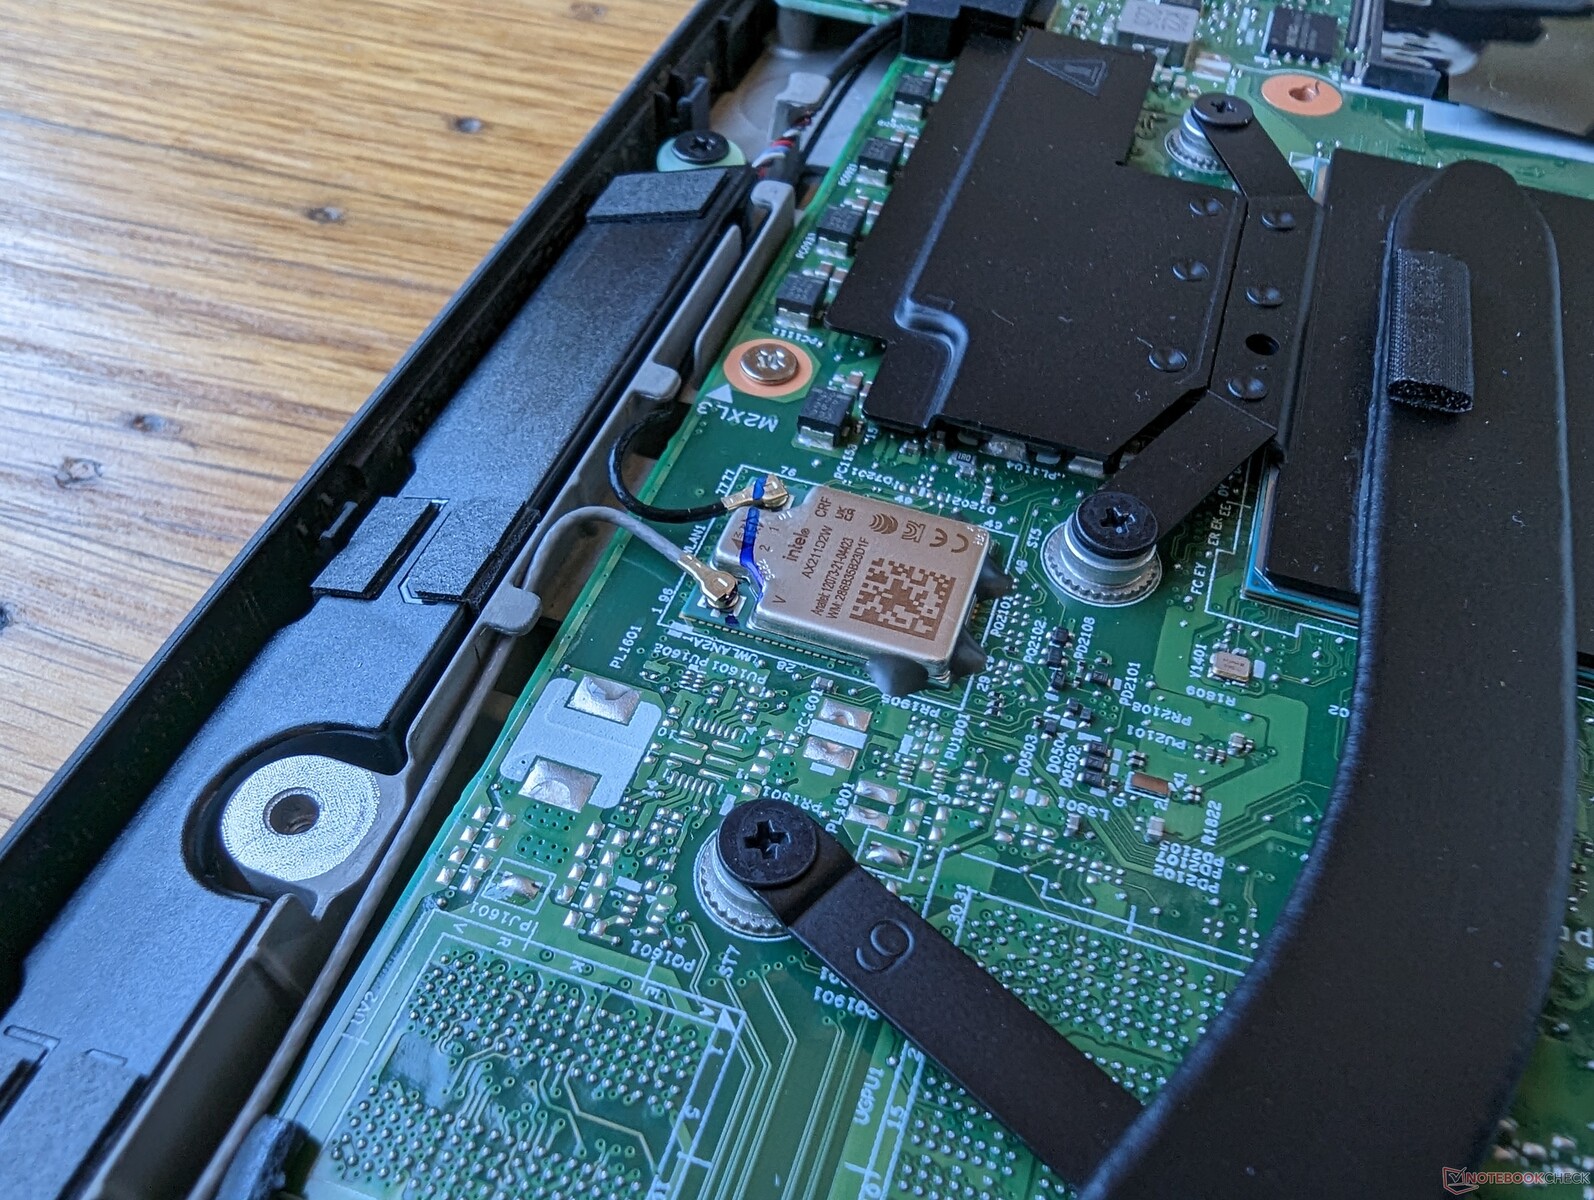
Een Intel AX211 wordt standaard geleverd voor Bluetooth 5.2 en Wi-Fi 6E connectiviteit. De overdrachtssnelheden zijn stabiel wanneer gekoppeld aan onze Asus AXE11000 testrouter.
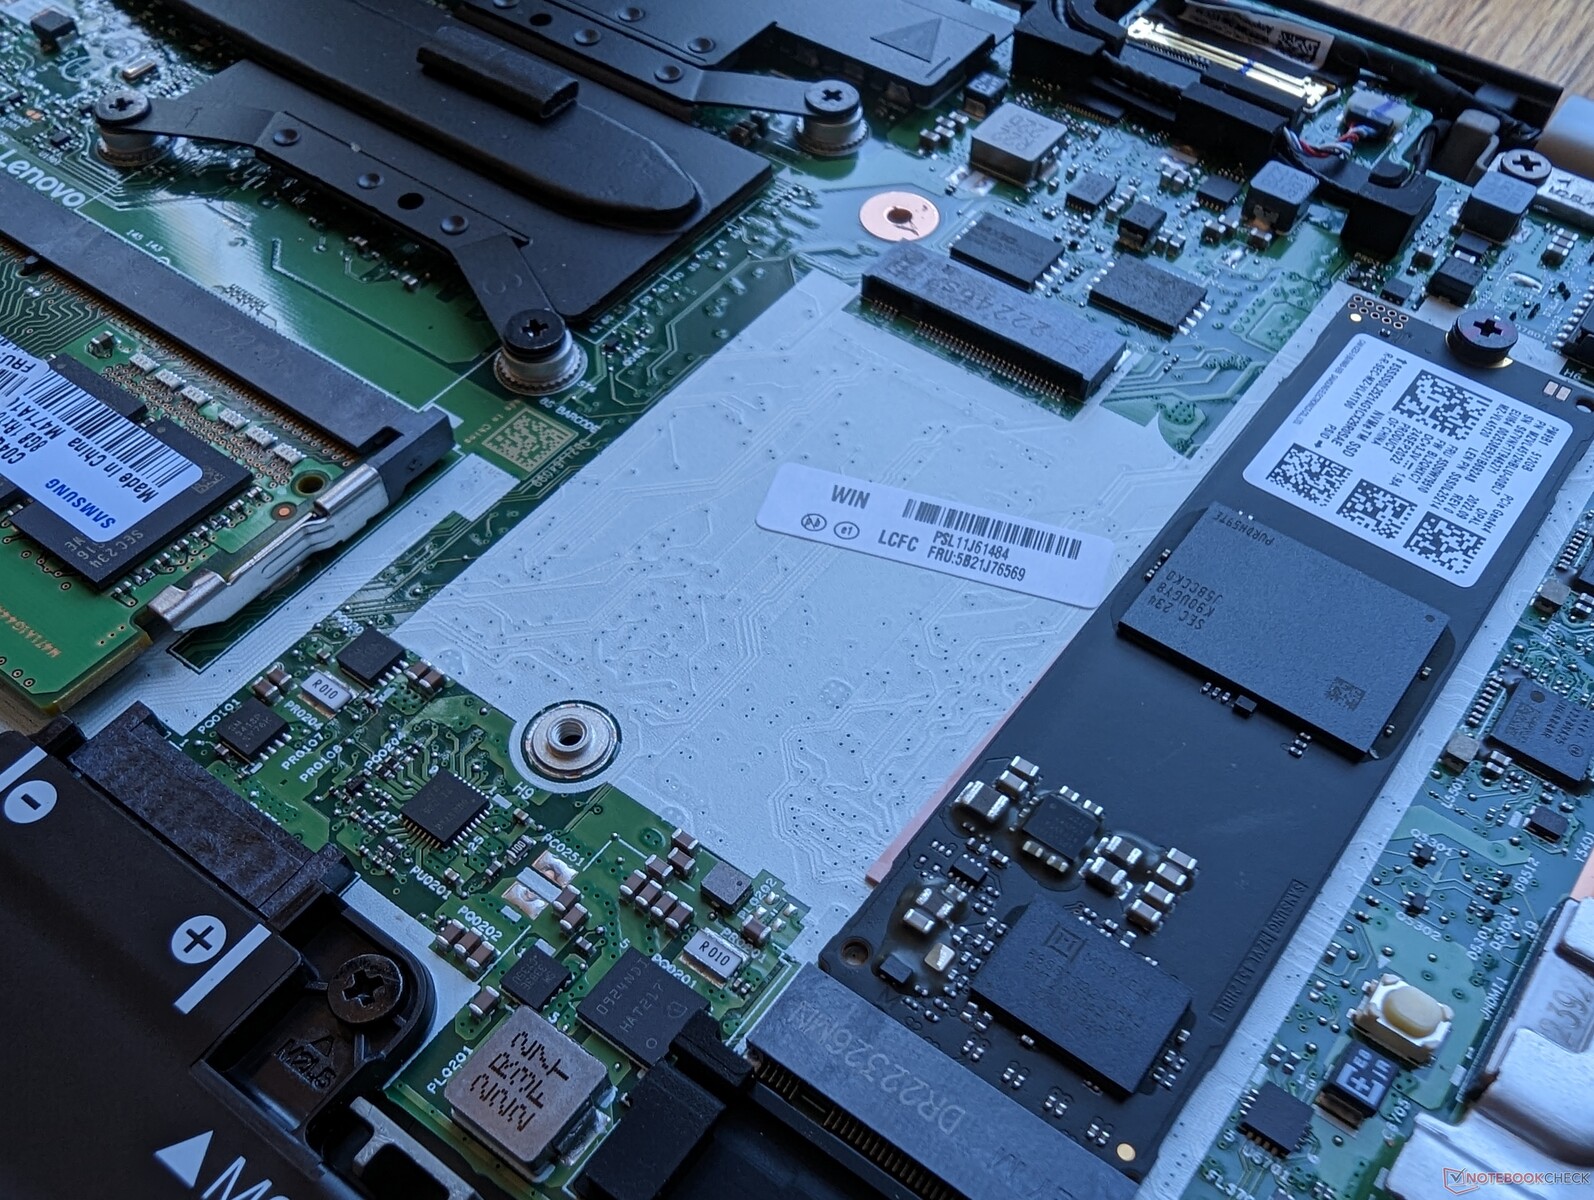
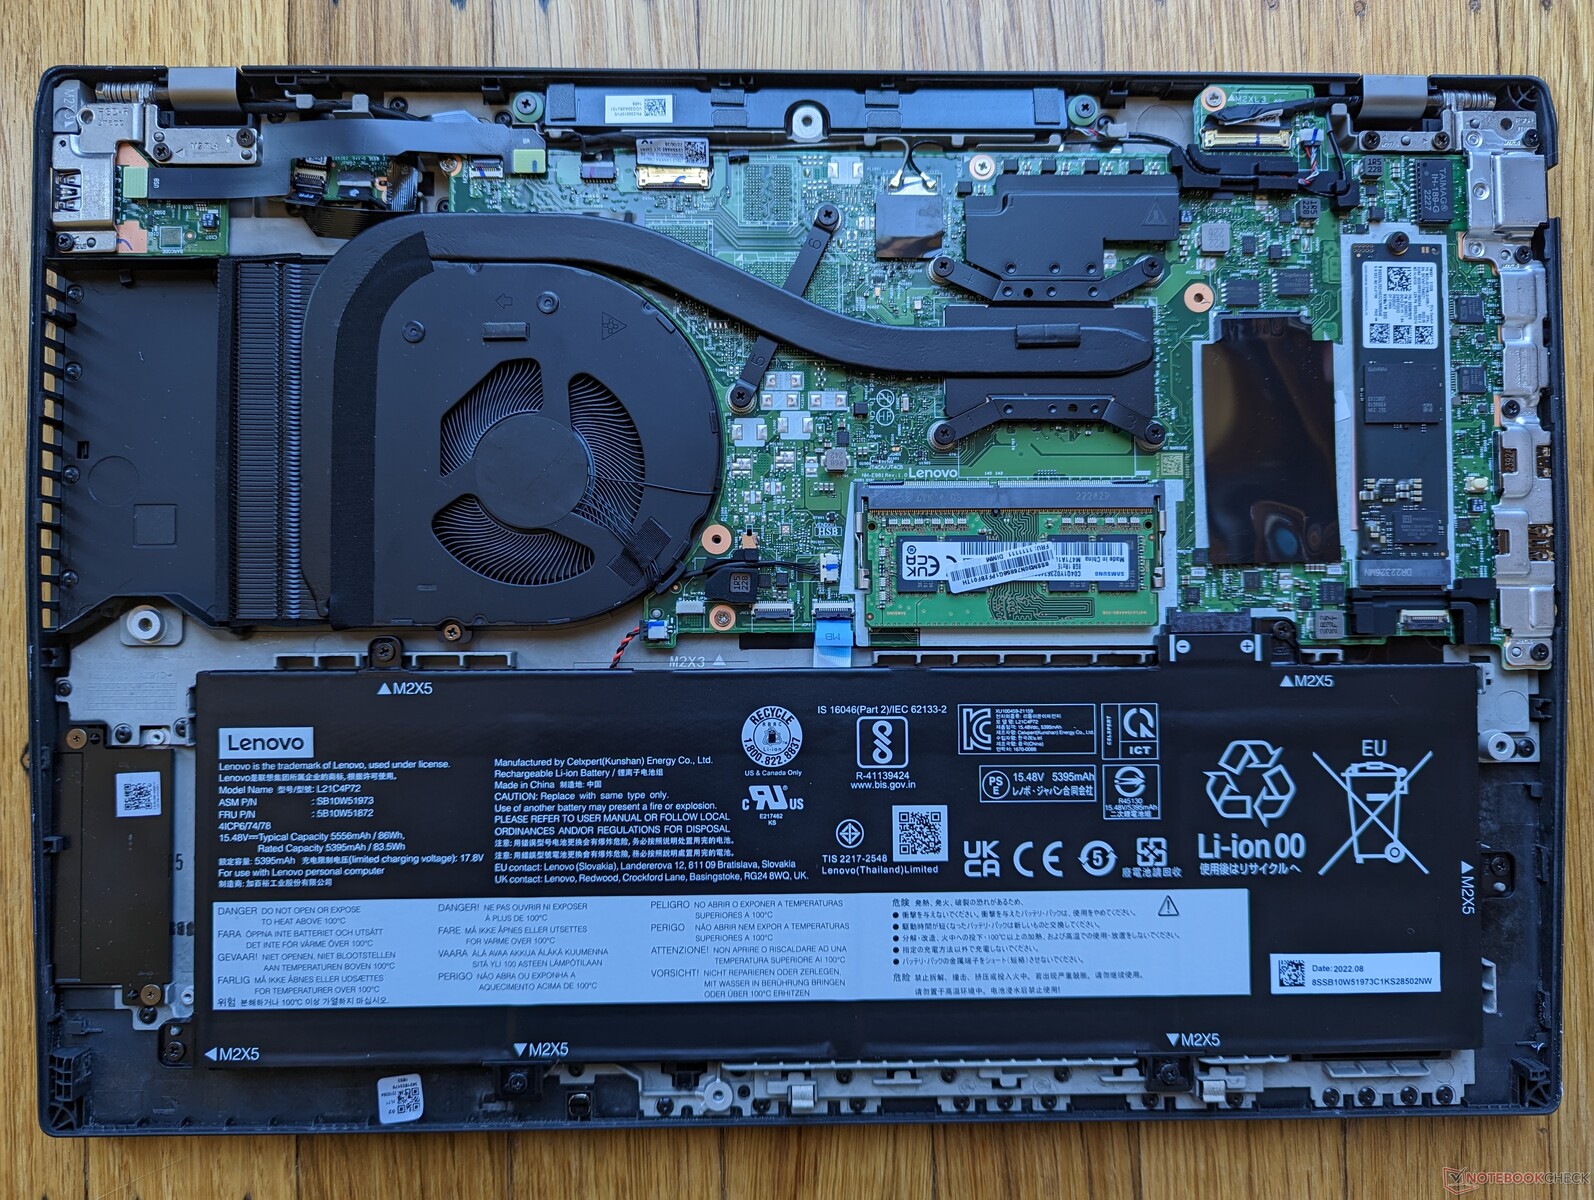
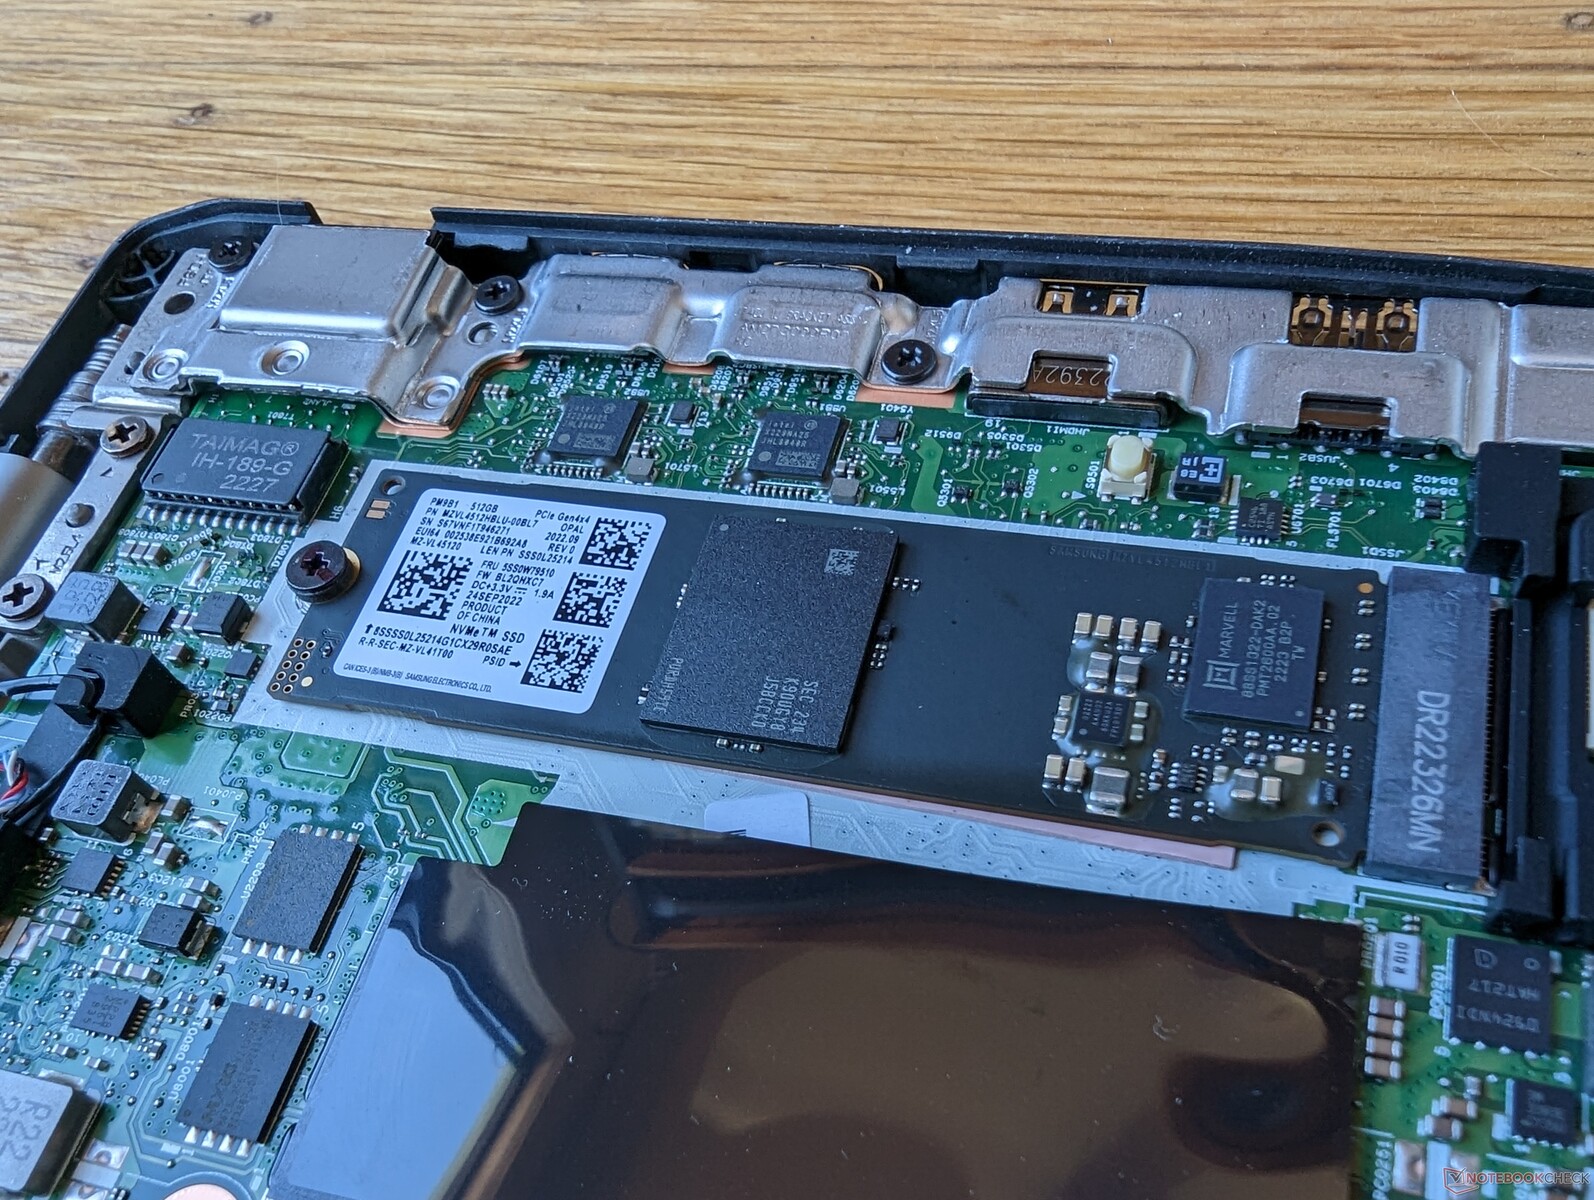
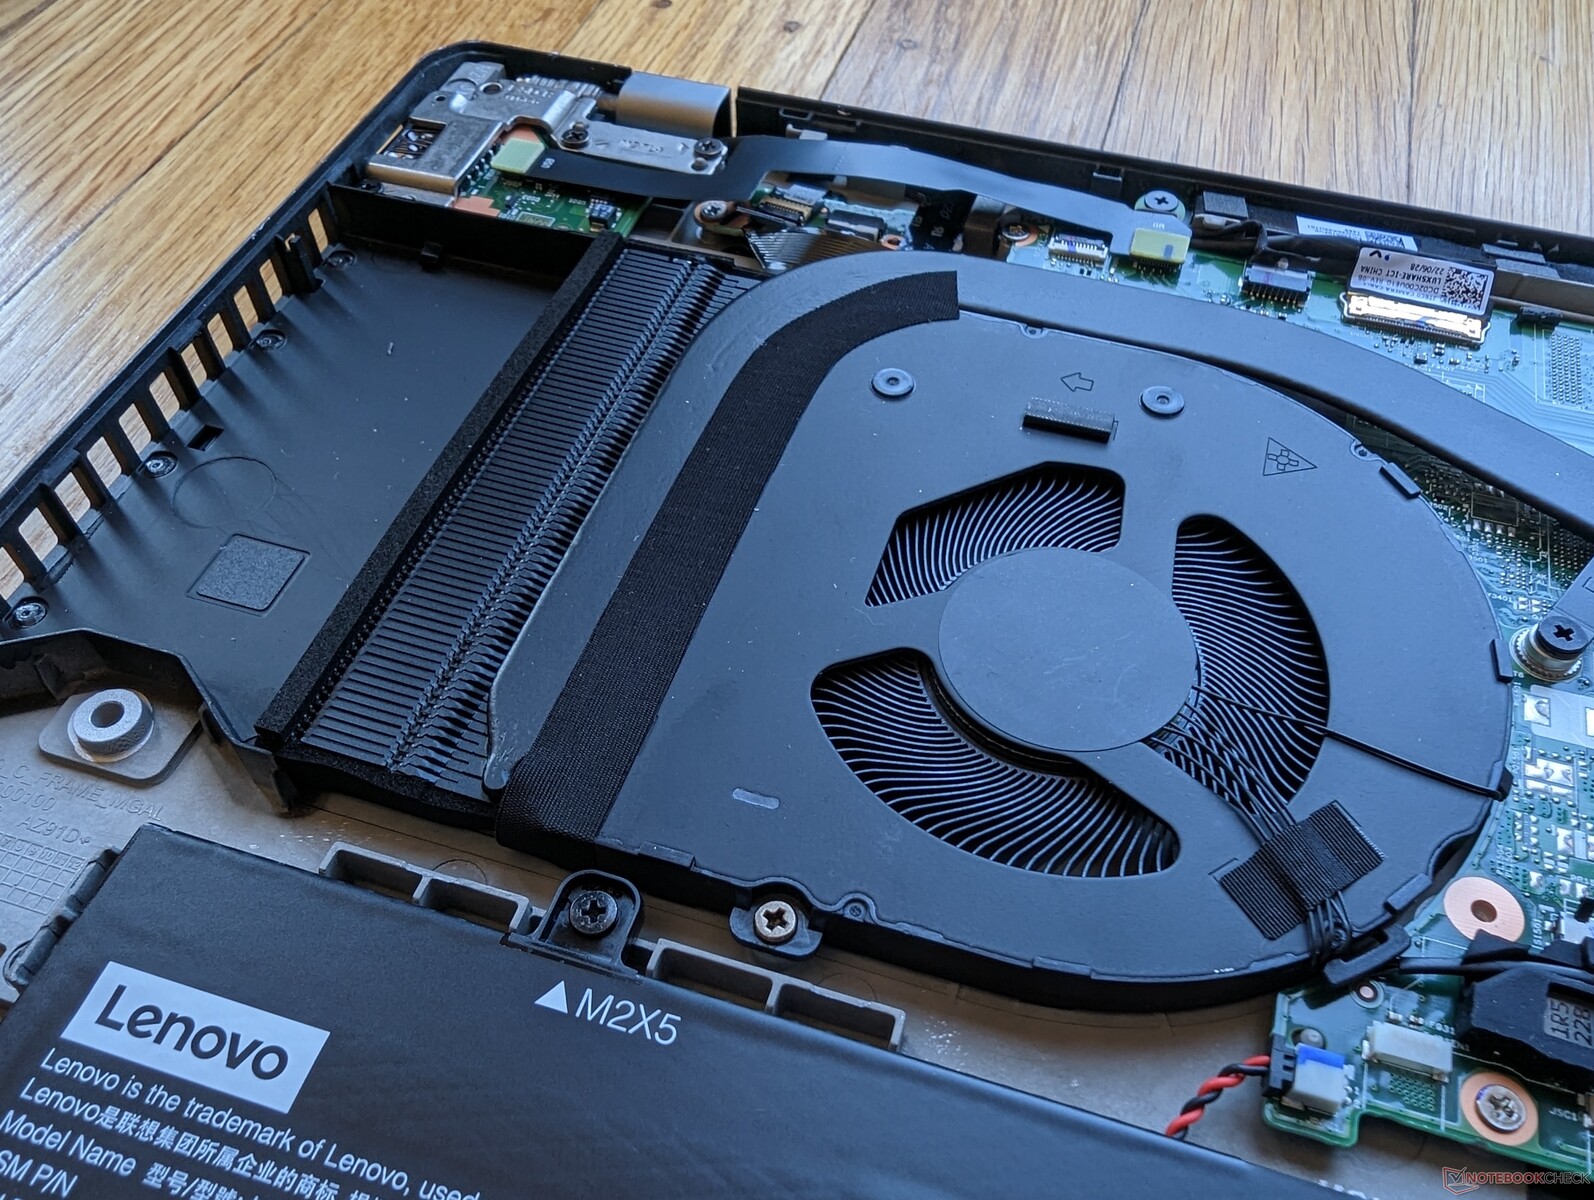
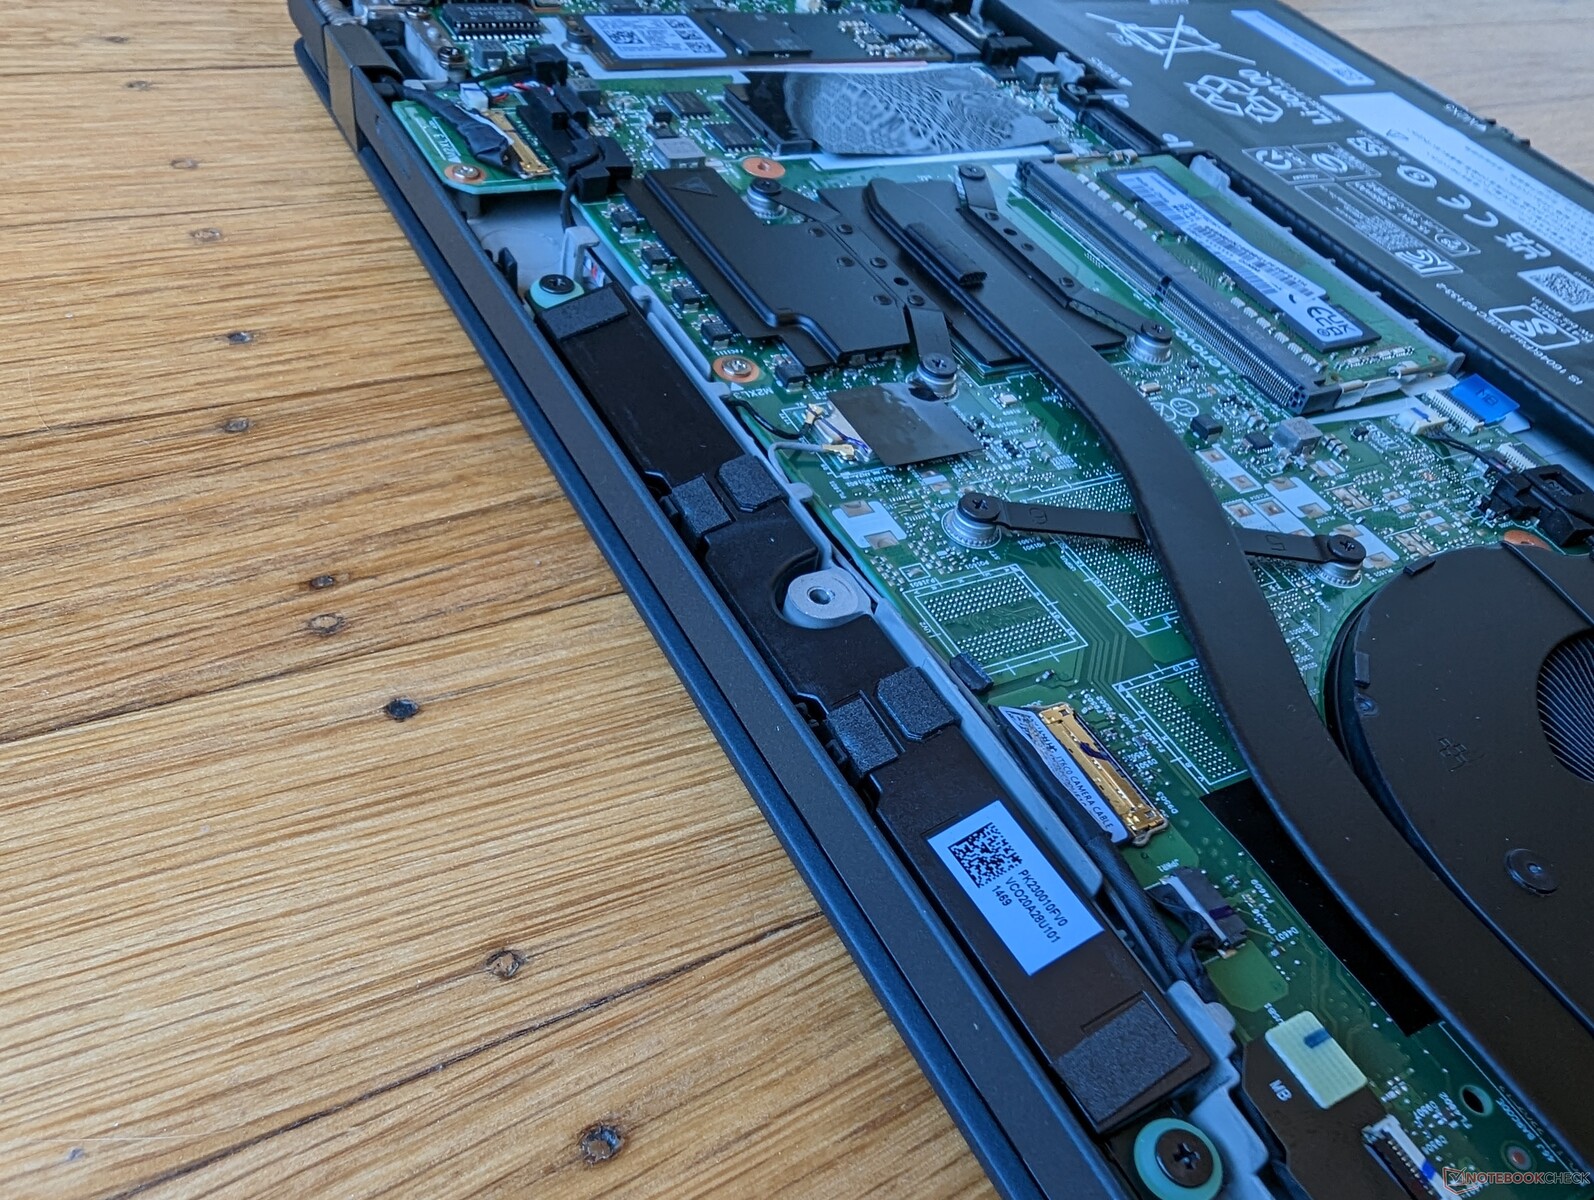
De M.2 WWAN-sleuf is leeg in onze specifieke configuratie zoals blijkt uit de afbeelding hieronder. Helaas levert Lenovo de antenne niet mee bij een configuratie zonder WWAN.
| Networking | |
| iperf3 transmit AX12 | |
| Apple MacBook Pro 16 2021 M1 Pro | |
| iperf3 receive AX12 | |
| Apple MacBook Pro 16 2021 M1 Pro | |
| iperf3 receive AXE11000 6GHz | |
| Lenovo ThinkPad T16 G1 21CH004MGE | |
| Huawei MateBook 16s i7 | |
| Lenovo ThinkPad T16 Gen 1 Core i7-1270P | |
| iperf3 receive AXE11000 | |
| Lenovo ThinkPad T16 G1 21CH004MGE | |
| HP EliteBook 865 G9 | |
| LG Gram 16Z90Q | |
| Lenovo ThinkPad T16 Gen 1 Core i7-1270P | |
| Apple MacBook Pro 16 2021 M1 Pro | |
| iperf3 transmit AXE11000 | |
| Lenovo ThinkPad T16 G1 21CH004MGE | |
| HP EliteBook 865 G9 | |
| LG Gram 16Z90Q | |
| Lenovo ThinkPad T16 Gen 1 Core i7-1270P | |
| Apple MacBook Pro 16 2021 M1 Pro | |
| iperf3 transmit AXE11000 6GHz | |
| Lenovo ThinkPad T16 G1 21CH004MGE | |
| Huawei MateBook 16s i7 | |
| Lenovo ThinkPad T16 Gen 1 Core i7-1270P | |
Webcam
De 2 MP webcam verbleekt in vergelijking met de 5 MP webcams die nu op veel HP EliteBook modellen. Zowel IR als een fysieke sluiter zijn opgenomen op de ThinkPad T16.


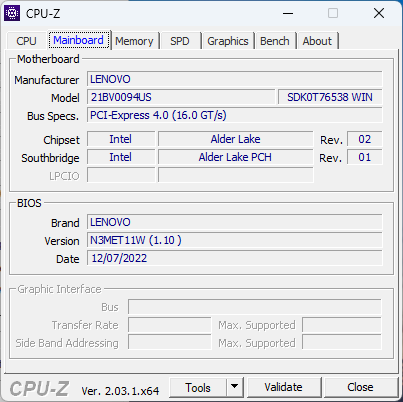
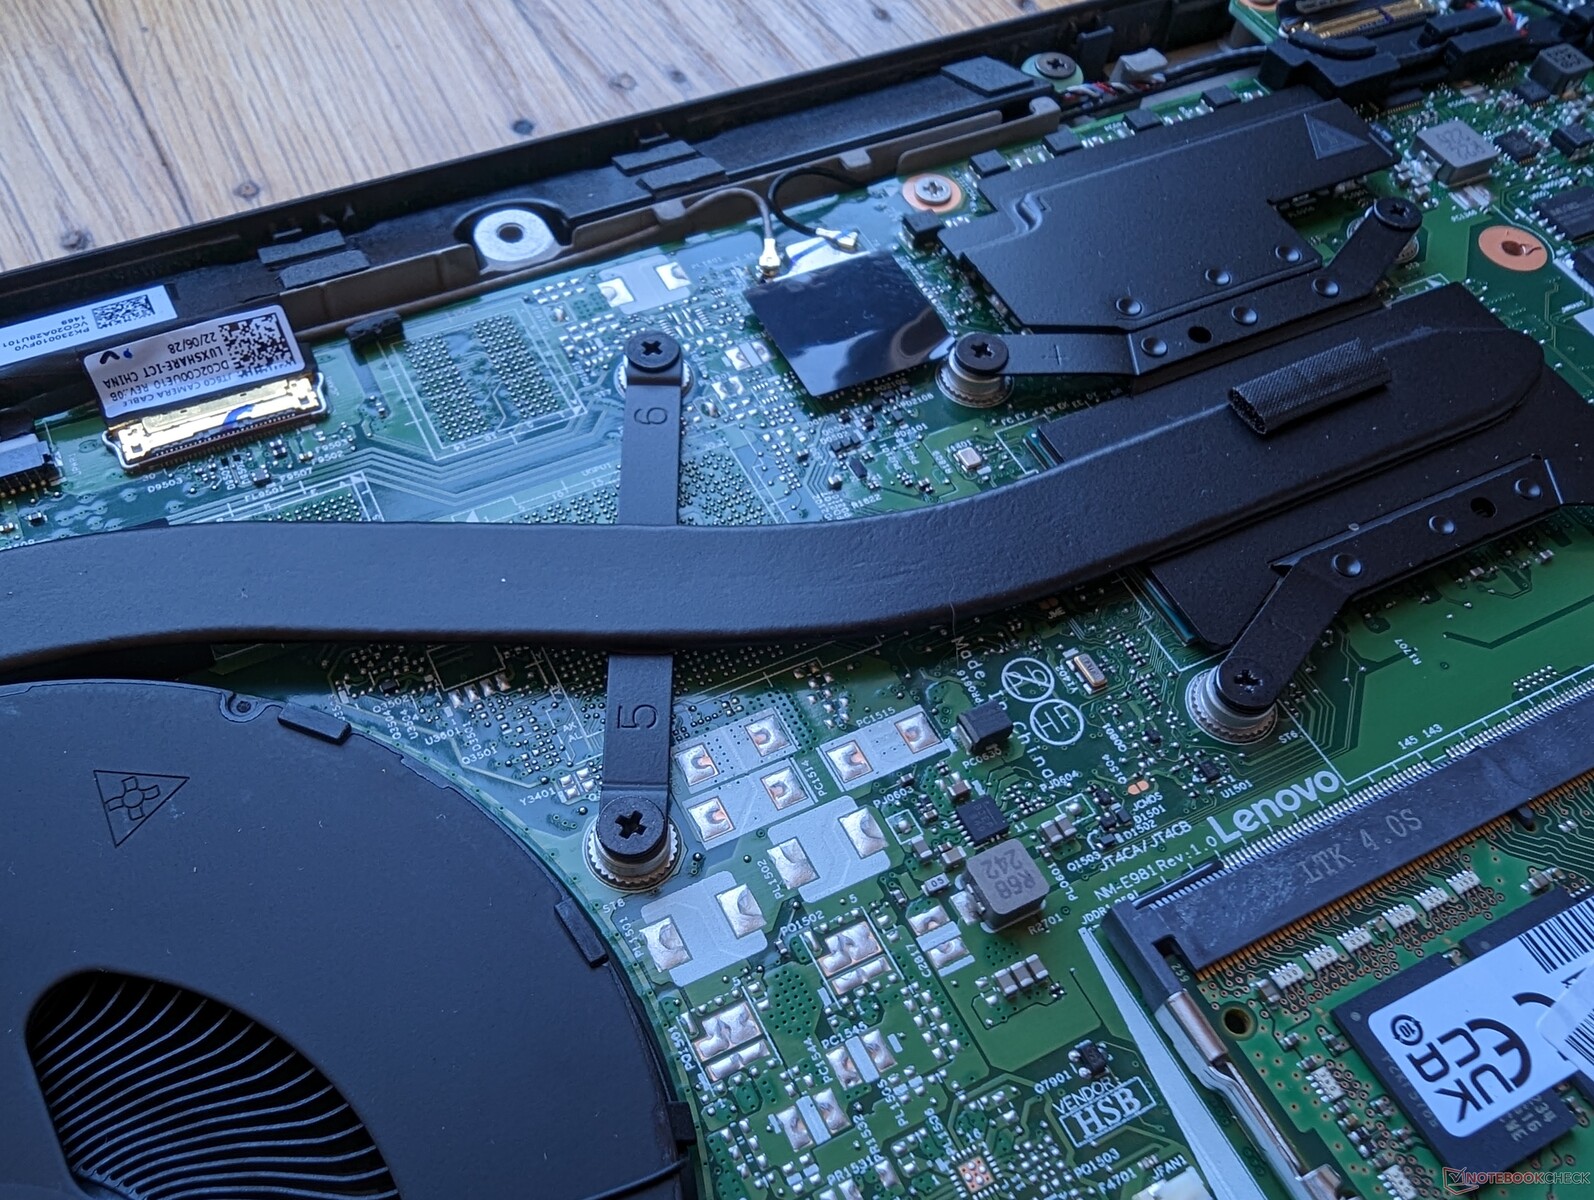
Onderhoud
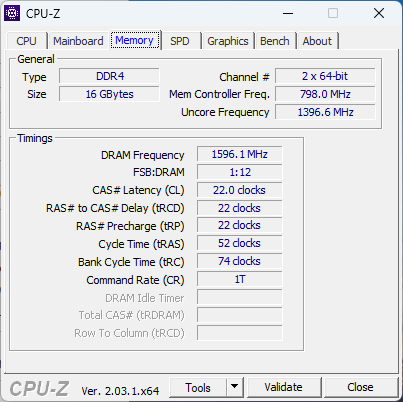
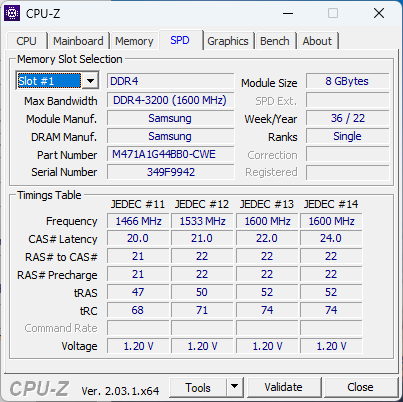
Het onderpaneel is bevestigd met acht Philips-schroeven voor eenvoudig onderhoud. Houd er rekening mee dat het model wordt geleverd met 8 GB gesoldeerd RAM plus 1x SODIMM-sleuf voor uitbreiding, terwijl de meeste andere laptops uitsluitend gesoldeerd RAM of 2x SODIMM gebruiken. Bepaalde SKU's kunnen worden geleverd met 16 GB gesoldeerd RAM.
Accessoires en garantie
Er zijn geen extra's in de doos behalve de wisselstroomadapter en het papierwerk. Bij aankoop in de VS geldt een fabrieksgarantie van een jaar.
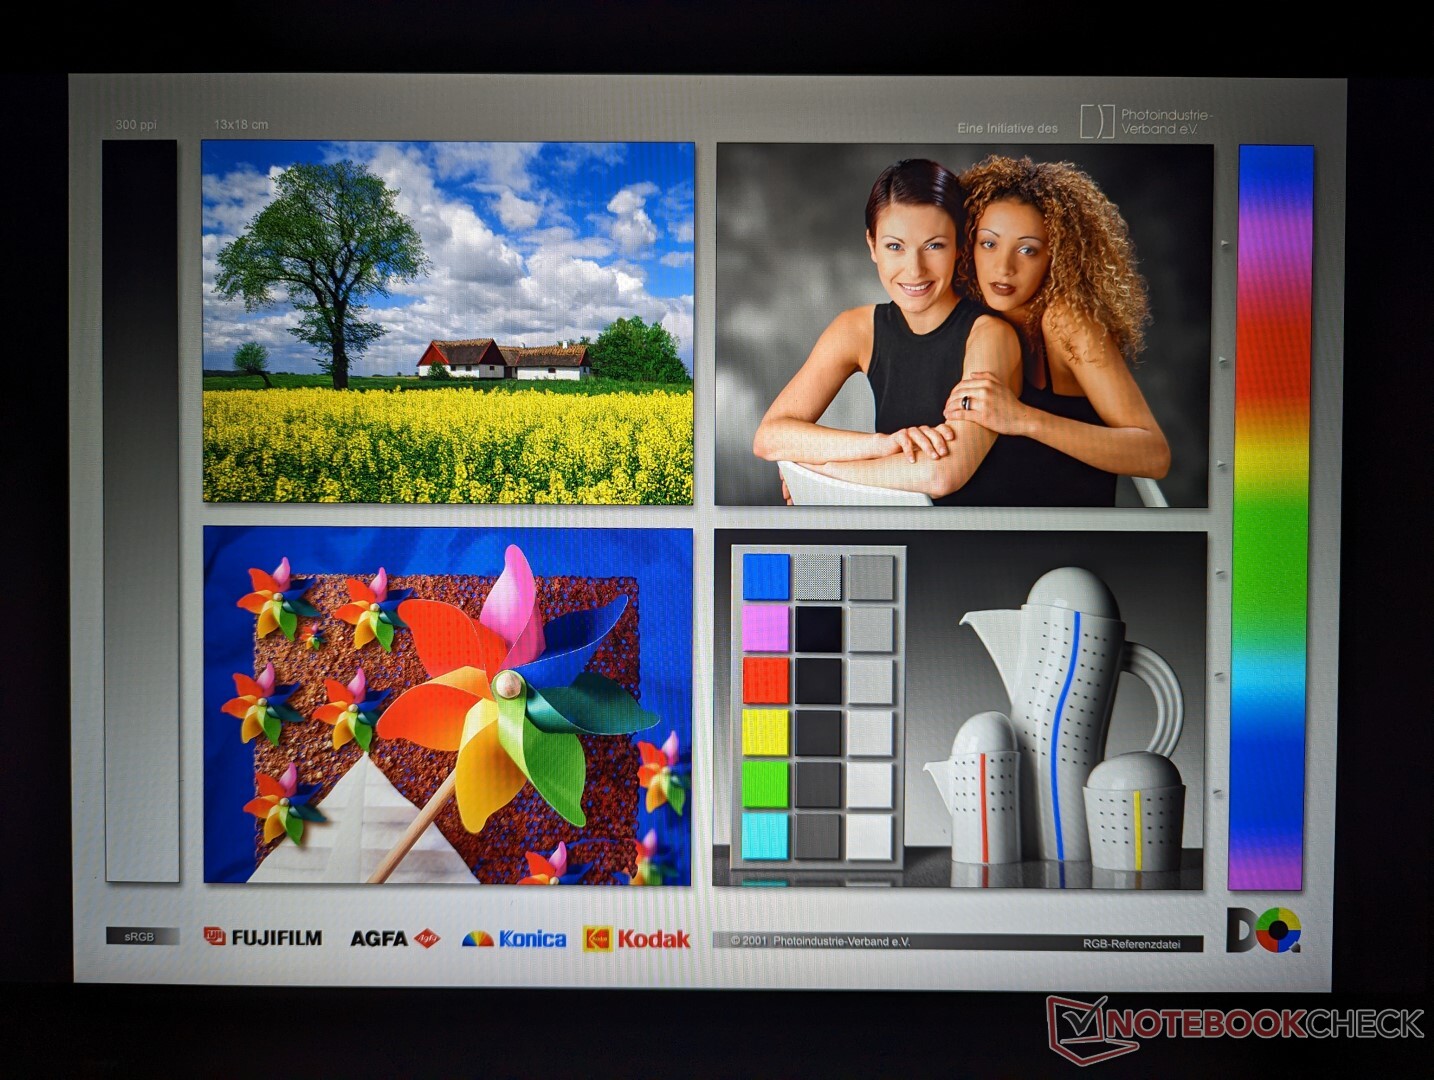
Beeldscherm - van low-end tot high-end
Lenovo biedt momenteel vijf verschillende opties voor matte IPS-schermen:
- 1920 x 1200, 300 nits, 45% NTSC
- 1920 x 1200, 300 nits, aanraakscherm, 45% NTSC
- 1920 x 1200, laag vermogen, 400 nits, 100% sRGB, weinig blauw licht
- 1920 x 1200, aanraakscherm met Privacy Guard, 500 nits, 100% sRGB, weinig blauw licht
- 2560 x 1600, 400 nits, weinig blauw licht, International Color Consortium gekalibreerd
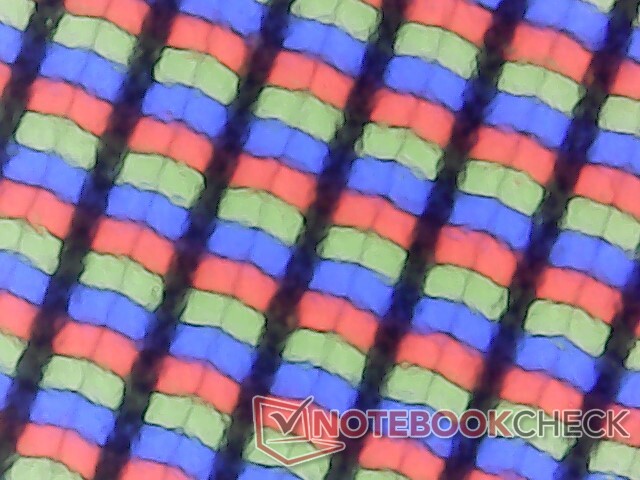
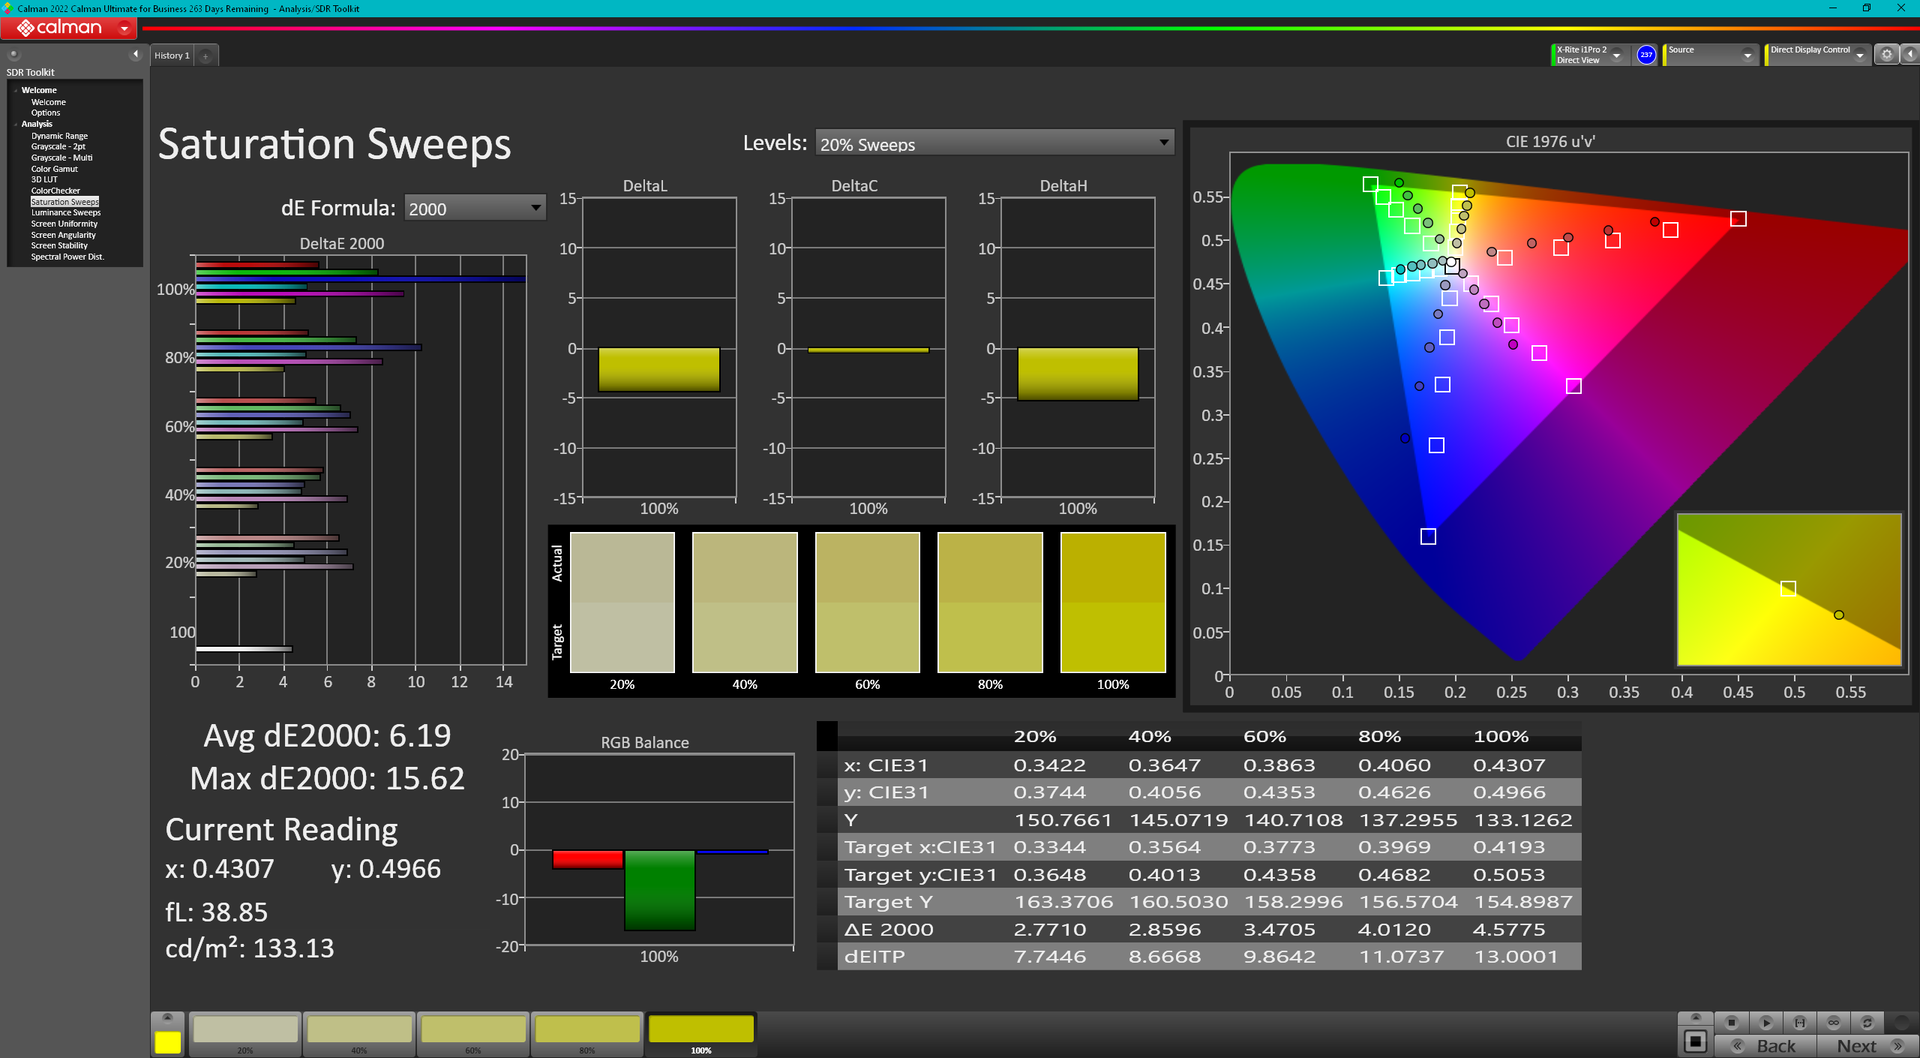
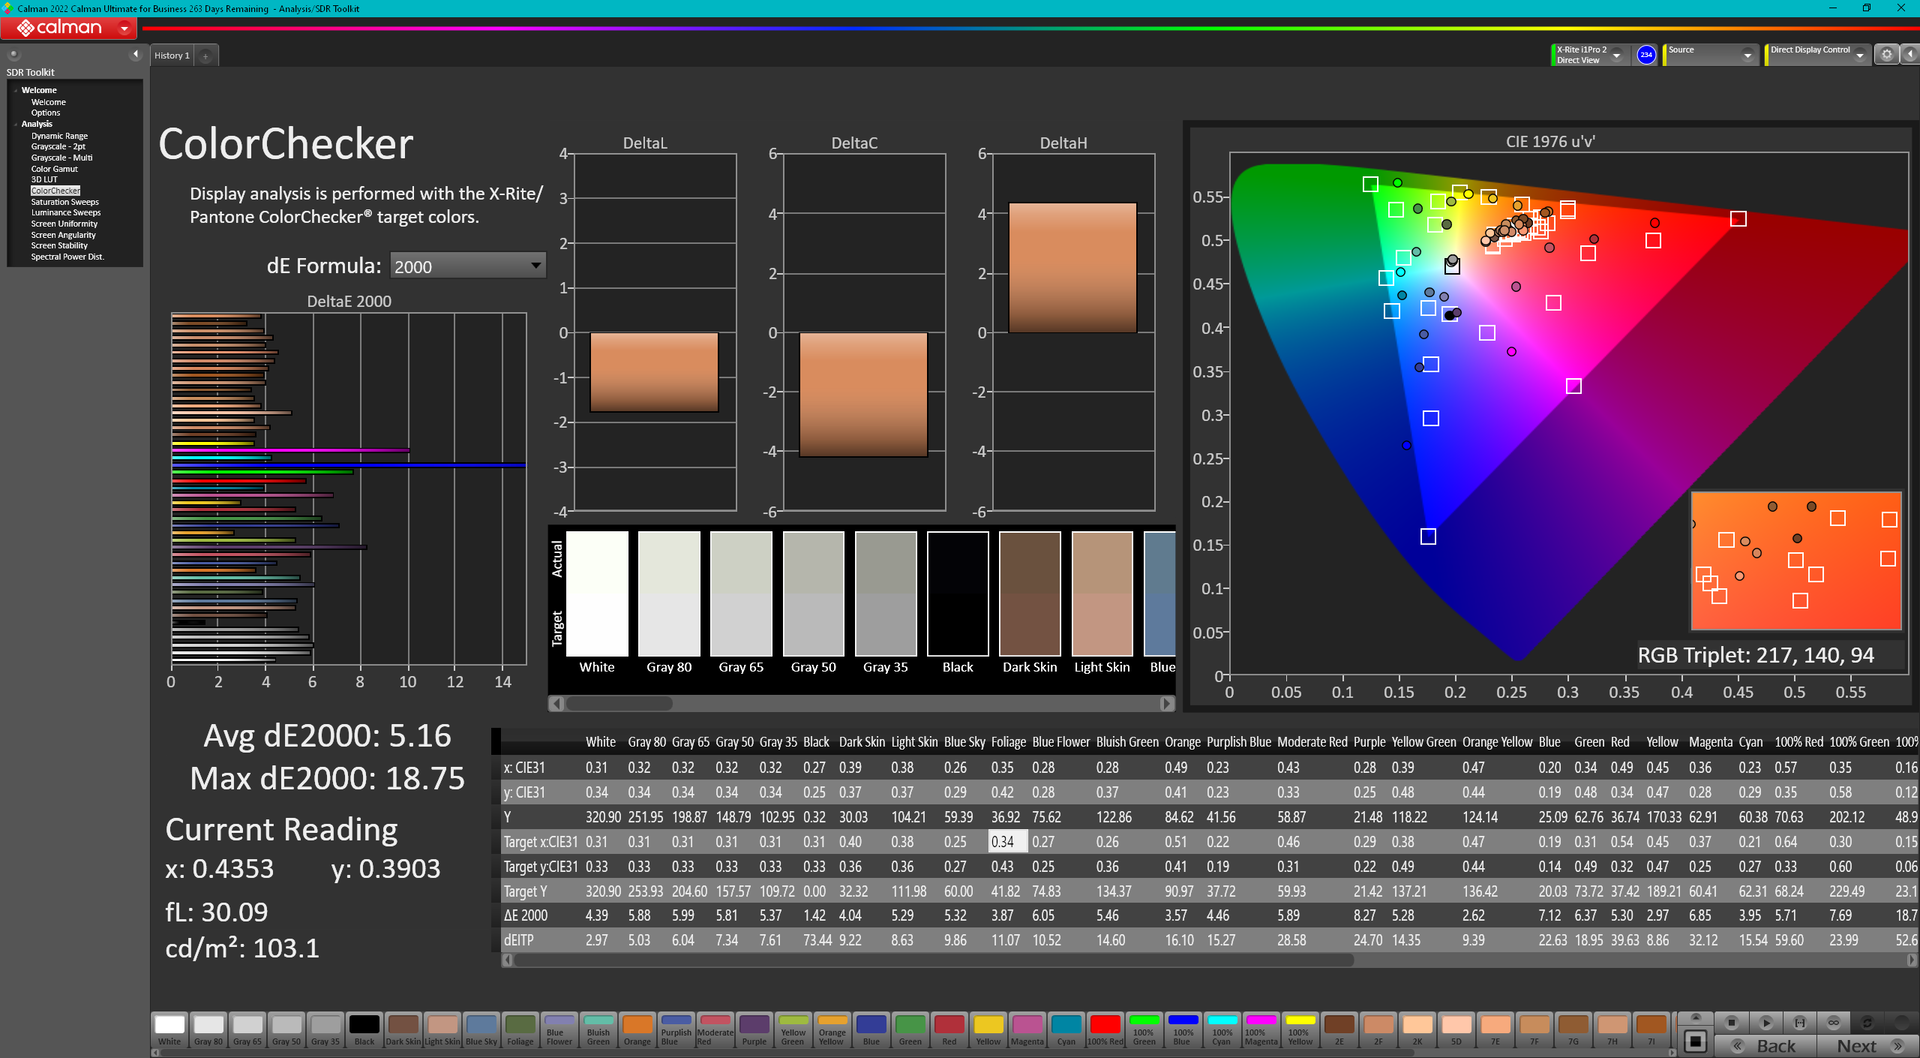
Onze configuratie wordt geleverd met het vetgedrukte B160UAN03.2 paneel hierboven, de goedkoopste optie. In vergelijking met het duurdere 1600p paneel heeft ons 1200p paneel zowel lagere kleuren als scherpte met aanzienlijke marges. Het is echter nog steeds een behoorlijk scherm, vooral in vergelijking met andere panelen met een vergelijkbaar sRGB-gamma van 60 procent, maar u zult een volledige sRGB-dekking willen kiezen voor elke vorm van video- of grafische bewerking.

| |||||||||||||||||||||||||
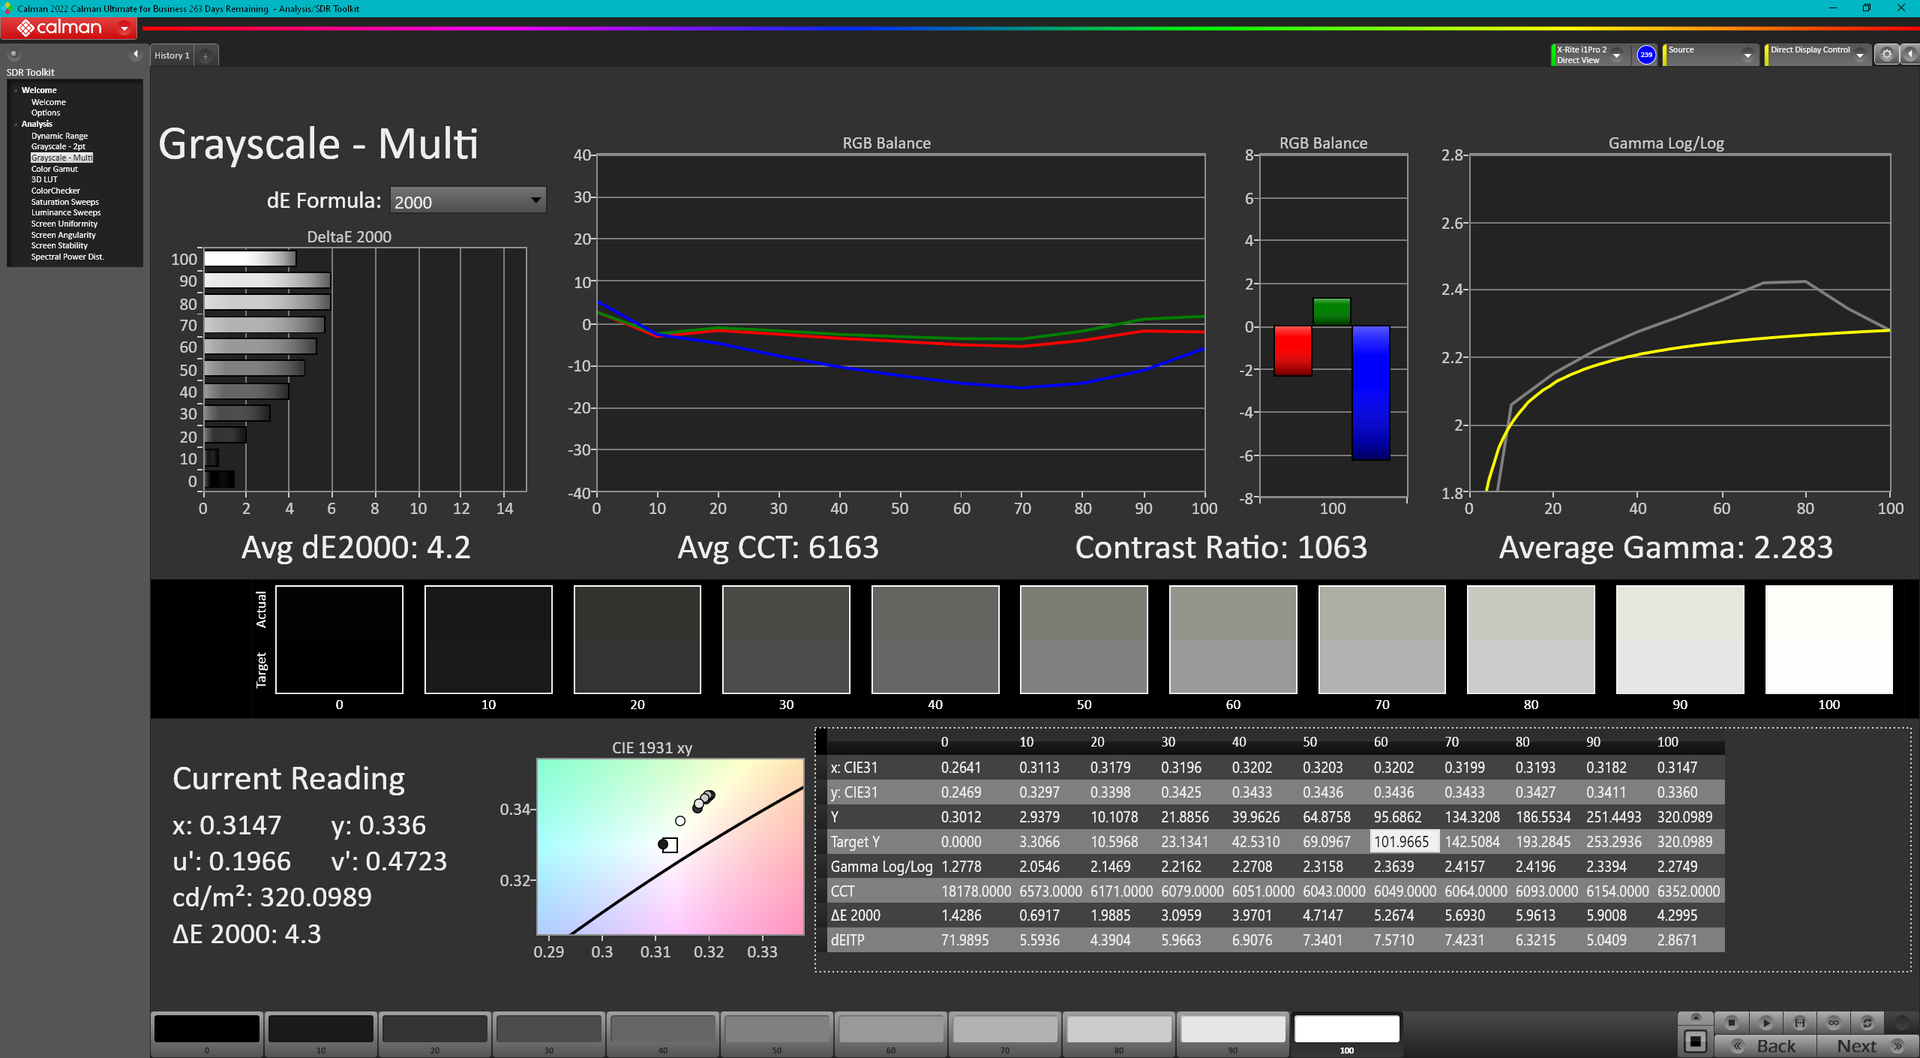
Helderheidsverdeling: 82 %
Helderheid in Batterij-modus: 321.3 cd/m²
Contrast: 1036:1 (Zwart: 0.31 cd/m²)
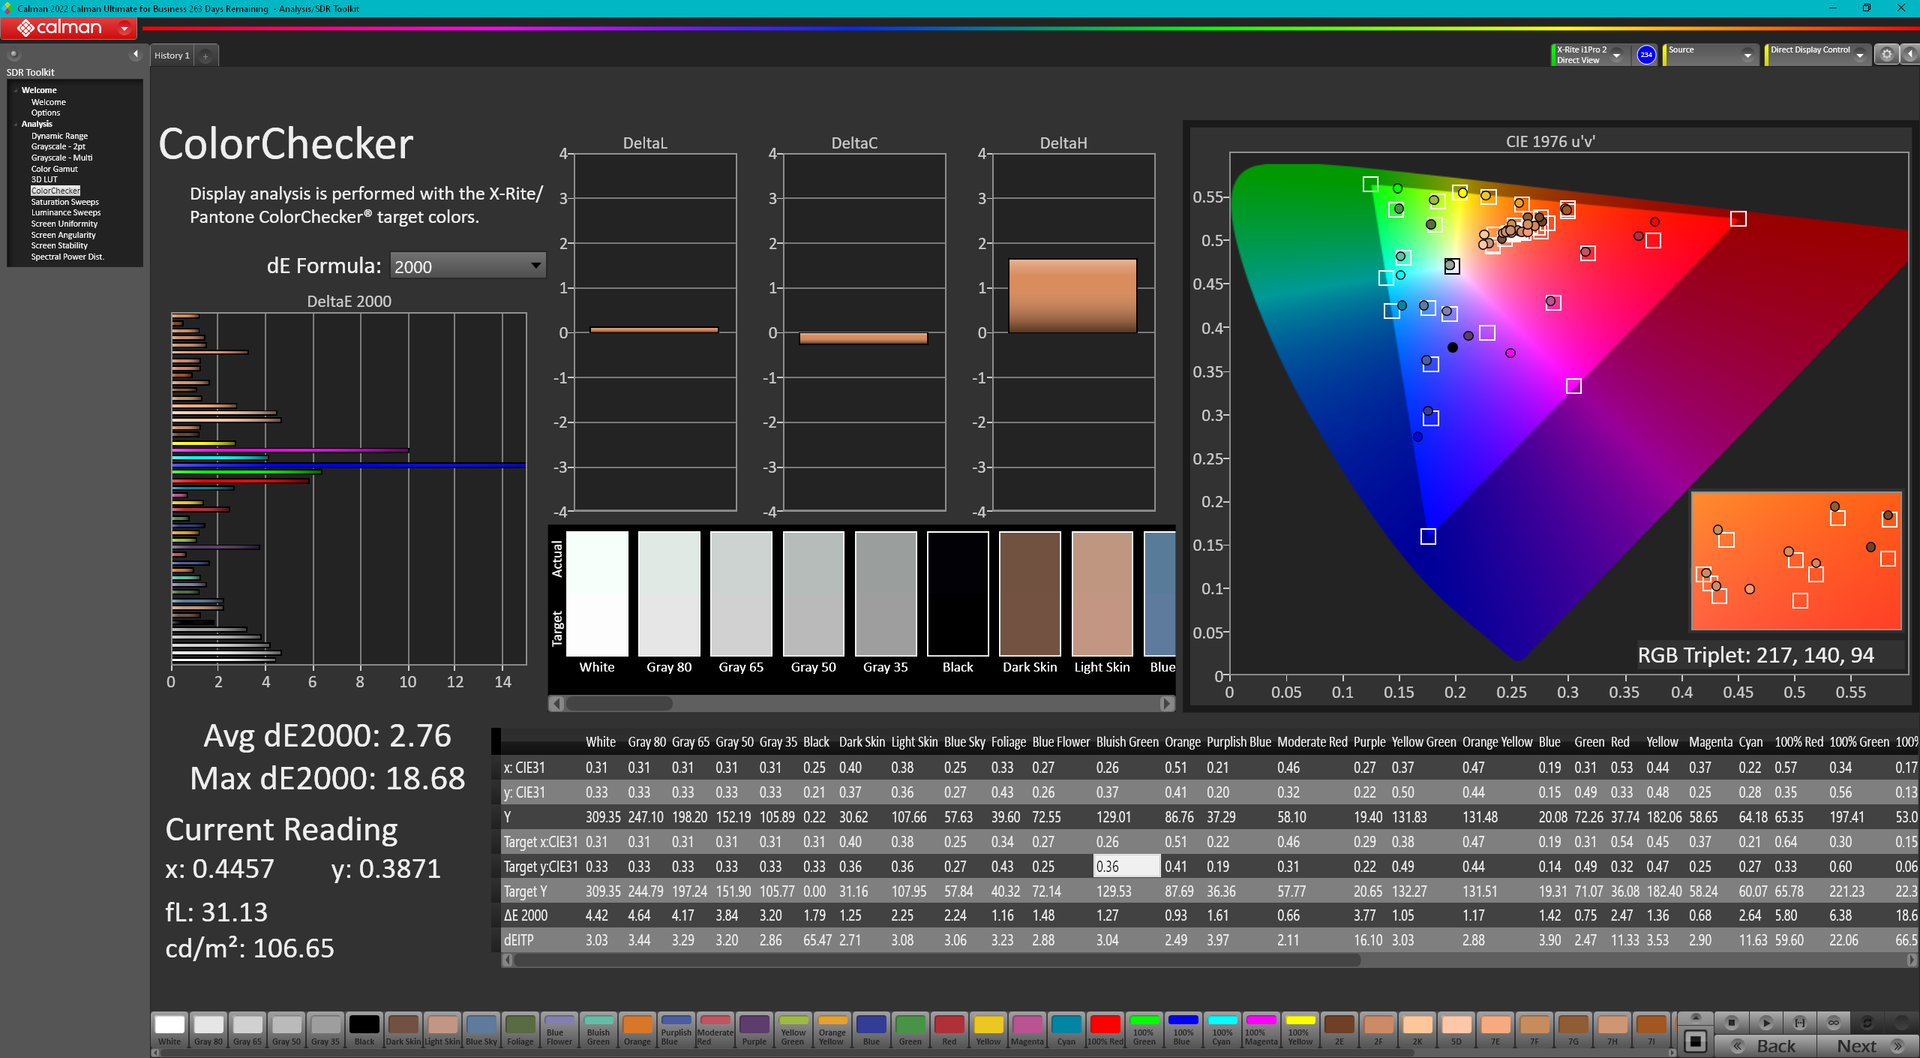
ΔE ColorChecker Calman: 5.16 | ∀{0.5-29.43 Ø4.71}
calibrated: 2.76
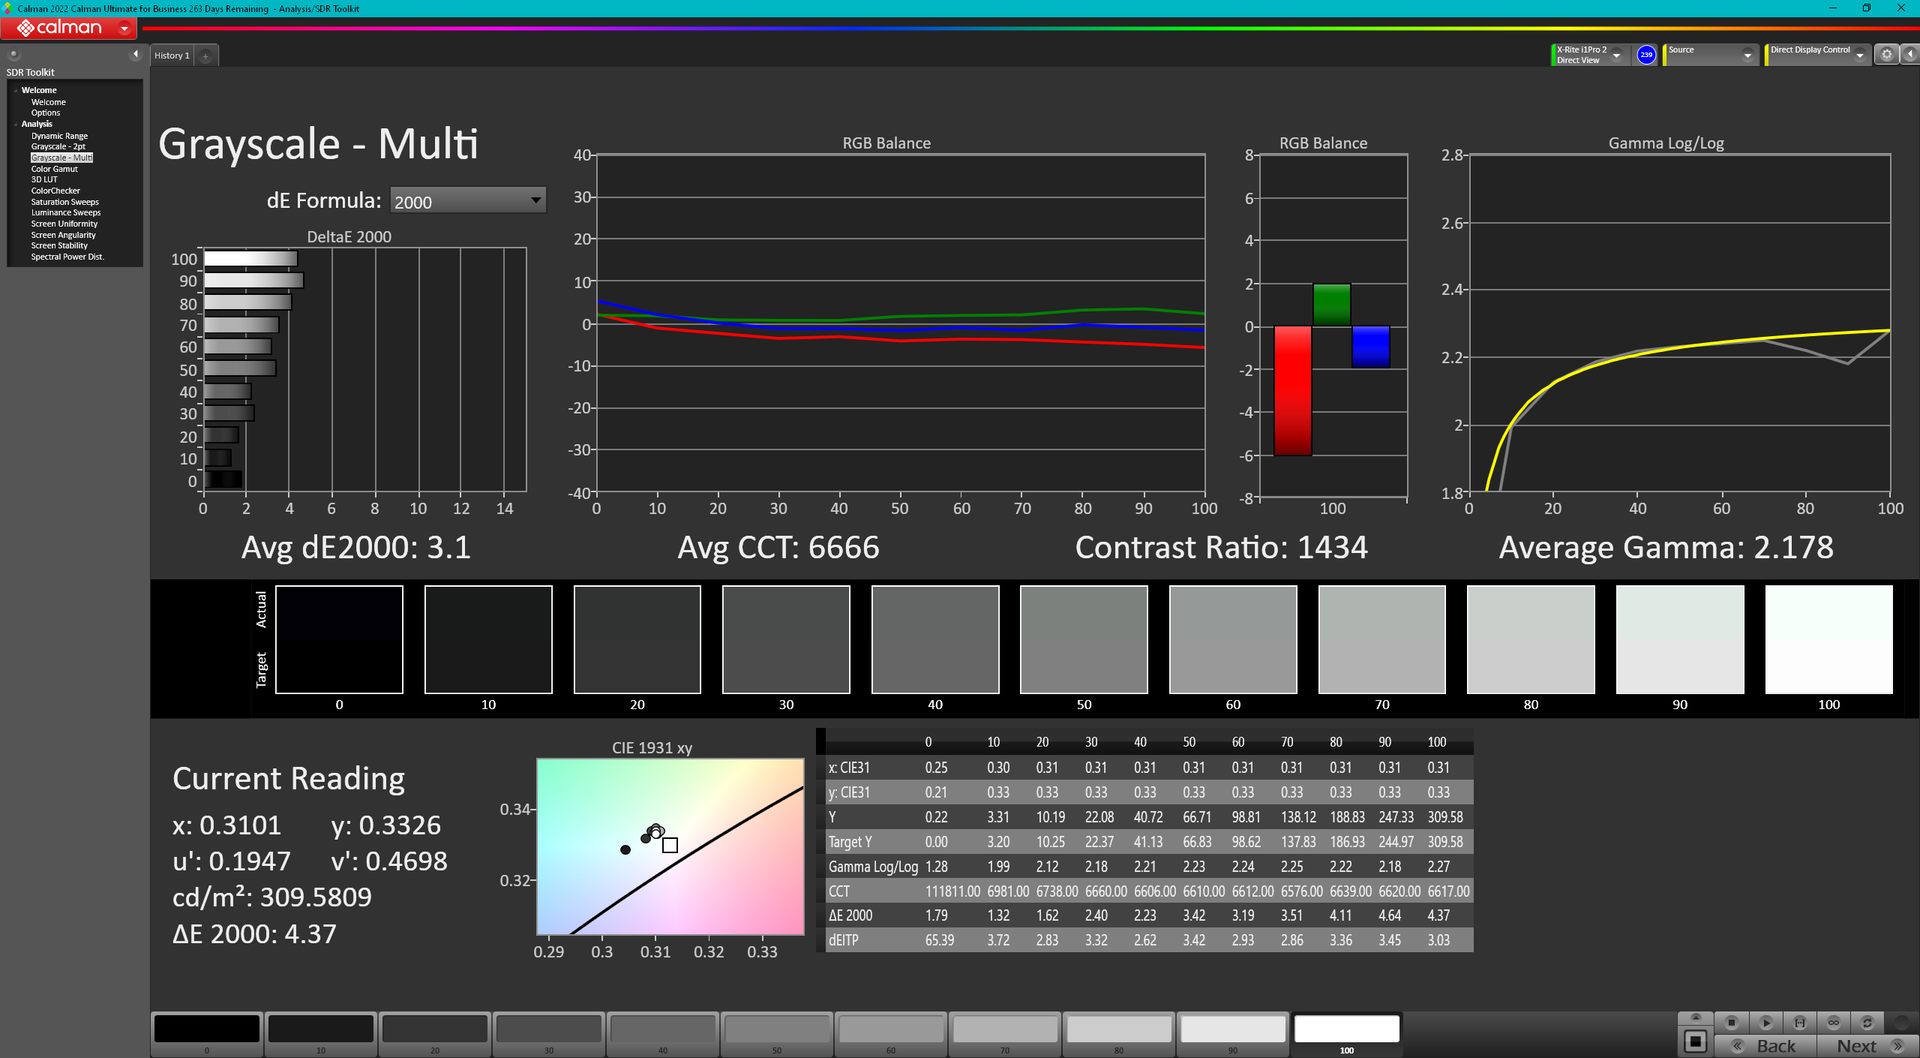
ΔE Greyscale Calman: 4.2 | ∀{0.09-98 Ø4.96}
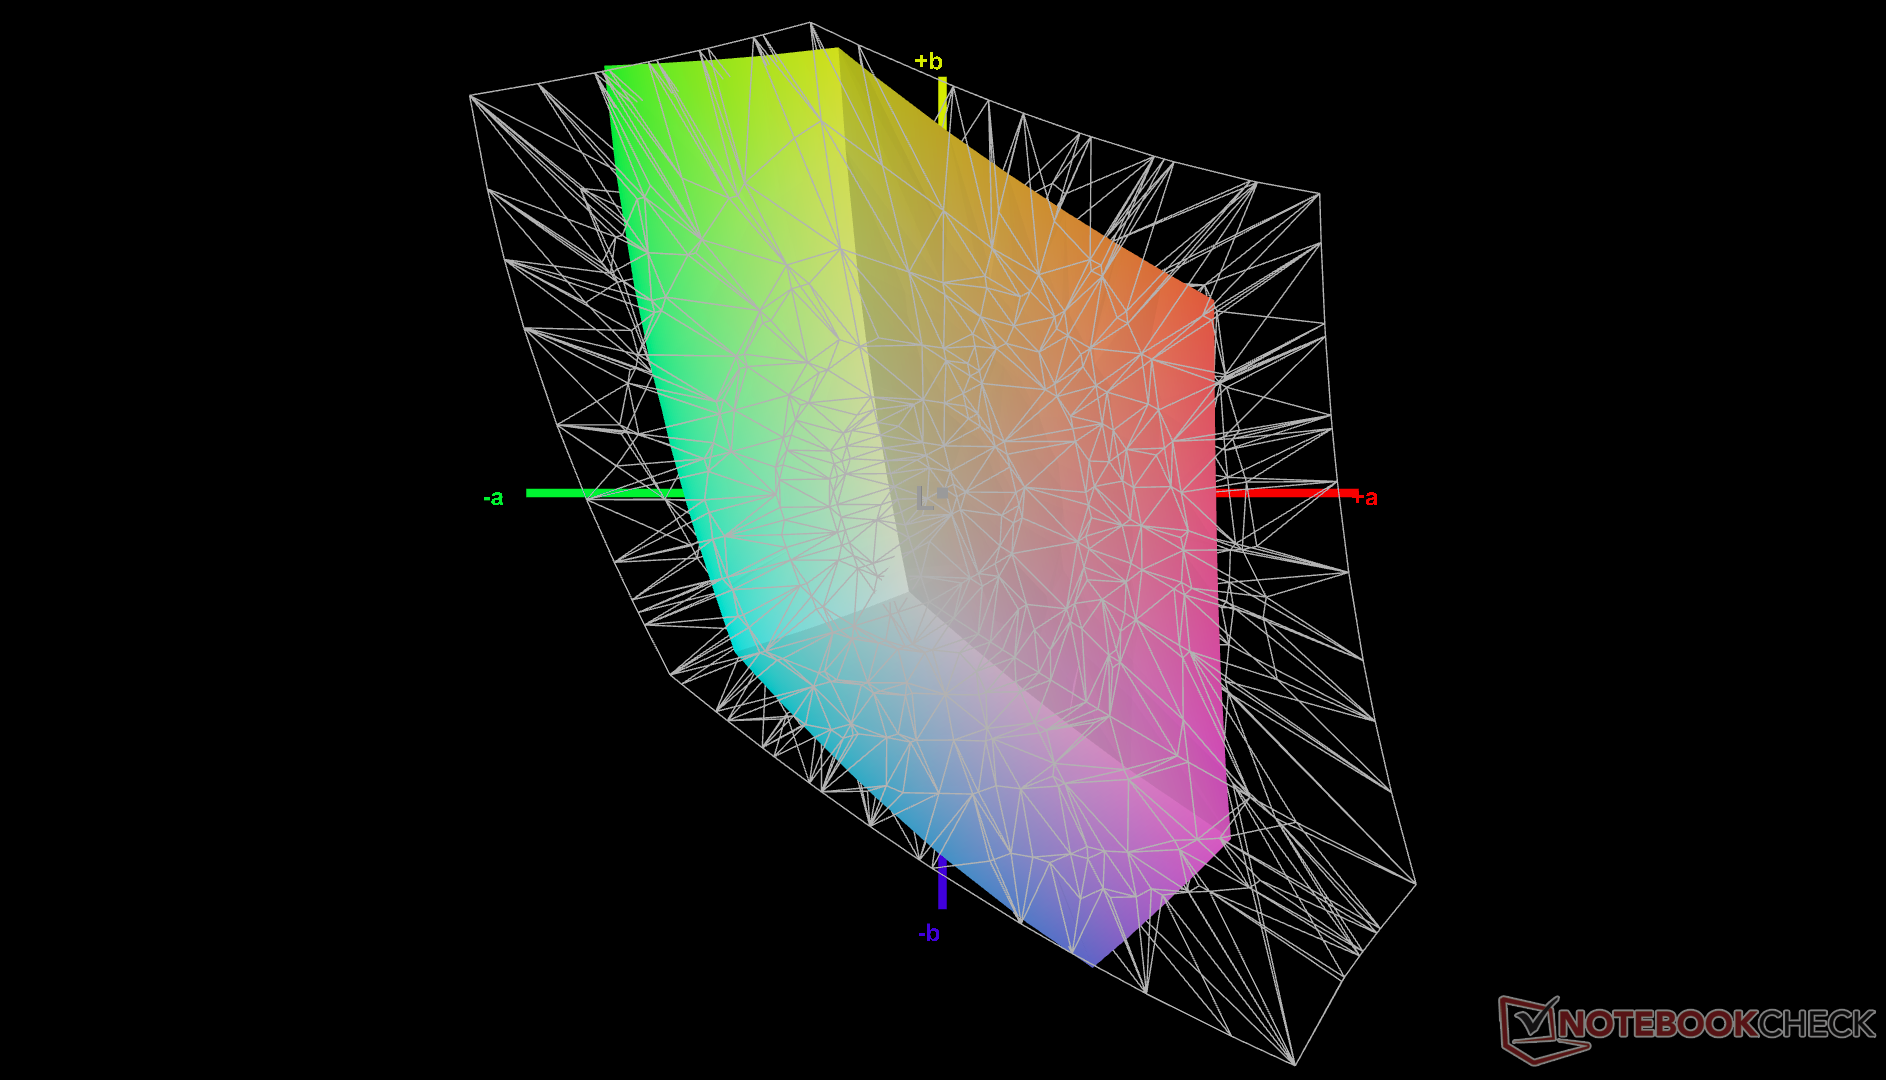
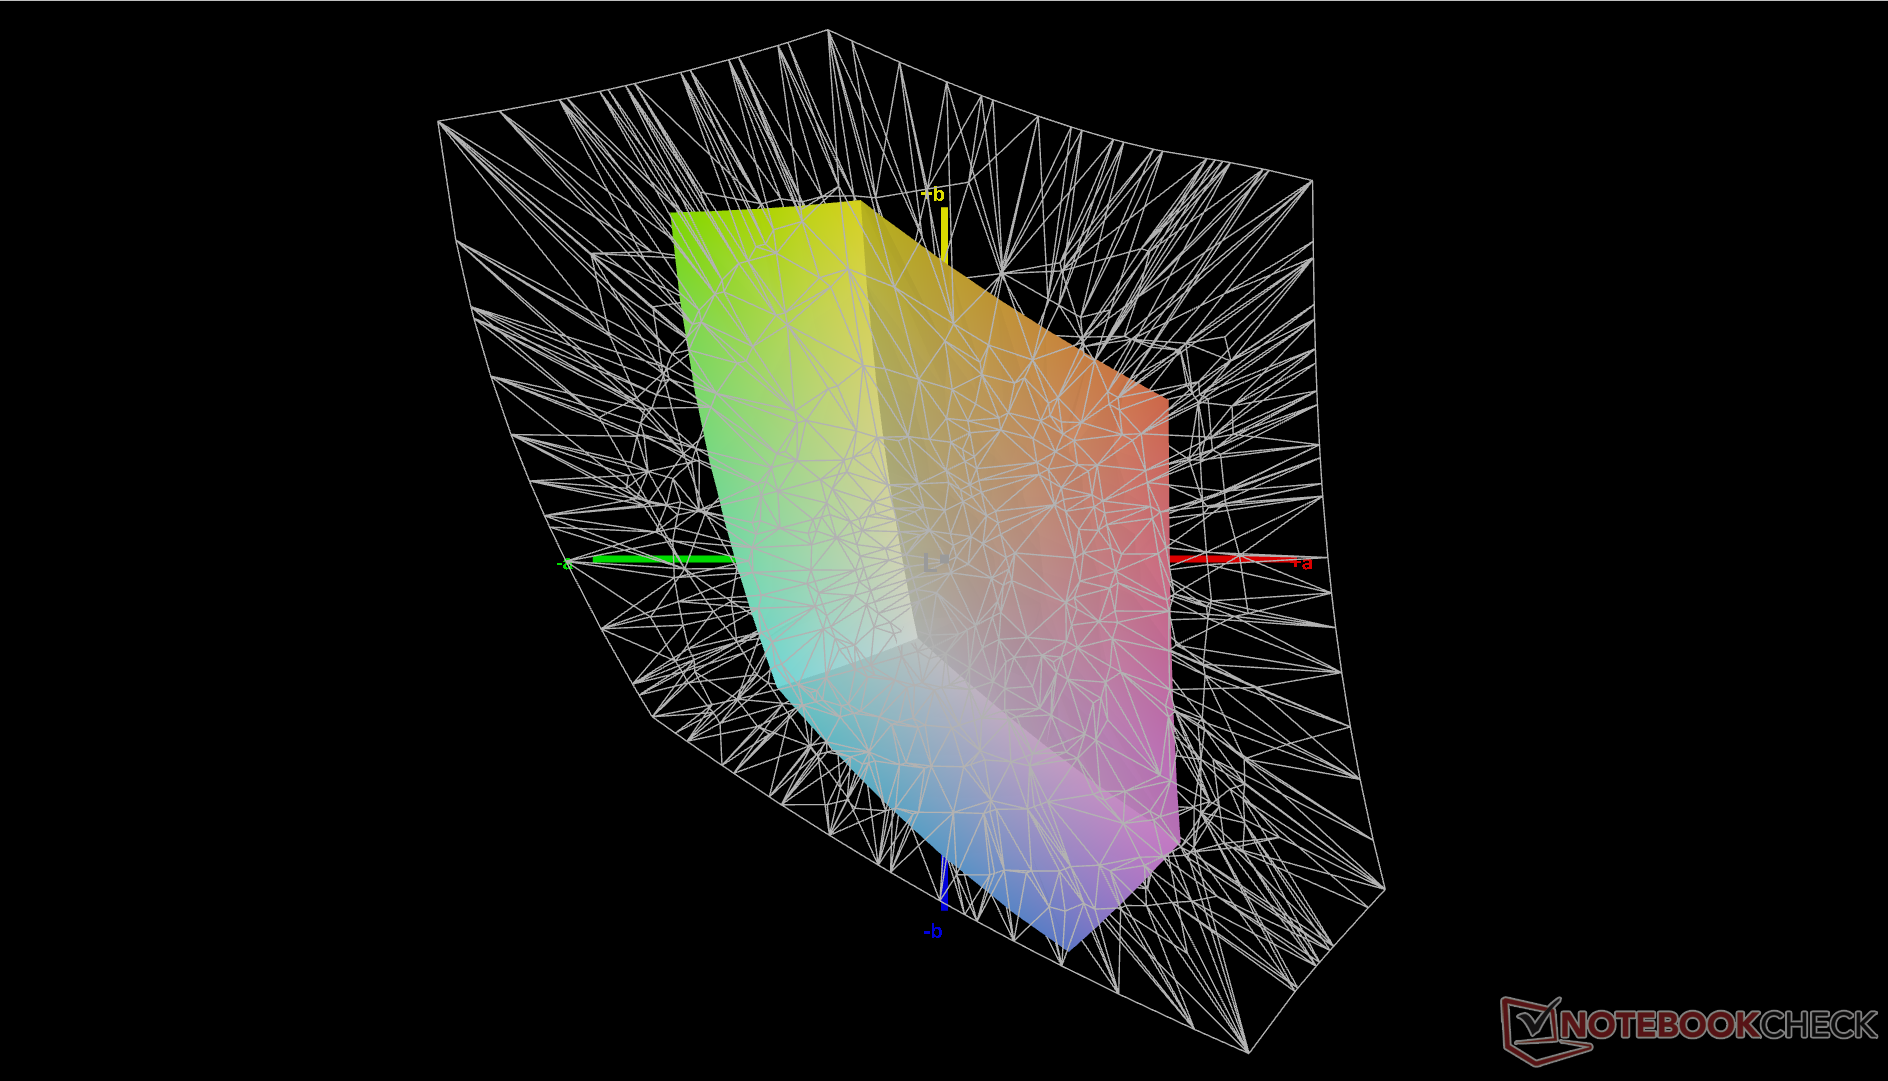
41% AdobeRGB 1998 (Argyll 3D)
59% sRGB (Argyll 3D)
39.7% Display P3 (Argyll 3D)
Gamma: 2.28
CCT: 6163 K
| Lenovo ThinkPad T16 Gen 1 Core i7-1270P B160UAN3.2, IPS, 1920x1200, 16" | Lenovo ThinkPad T16 G1 21CH004MGE MNG007DA1-C, IPS-LED, 2560x1600, 16" | LG Gram 16Z90Q LG LP160WQ1-SPB2 (LGD06EB), IPS, 2560x1600, 16" | HP EliteBook 865 G9 X160NV42, IPS, 1920x1200, 16" | Huawei MateBook 16s i7 BOE XS TV160DKT-NH0, IPS, 2520x1680, 16" | Apple MacBook Pro 16 2021 M1 Pro Liquid Retina XDR, Mini-LED, 3456x2234, 16.2" | |
|---|---|---|---|---|---|---|
| Display | 66% | 106% | 76% | 63% | 111% | |
| Display P3 Coverage (%) | 39.7 | 66.7 68% | 96.8 144% | 71.4 80% | 64.5 62% | 99.1 150% |
| sRGB Coverage (%) | 59 | 95.7 62% | 99.9 69% | 99.3 68% | 96.7 64% | 100 69% |
| AdobeRGB 1998 Coverage (%) | 41 | 69.1 69% | 84.6 106% | 73.2 79% | 66.6 62% | 88 115% |
| Response Times | 7% | -19% | -9% | -9% | -161% | |
| Response Time Grey 50% / Grey 80% * (ms) | 29.2 ? | 32.1 ? -10% | 45.7 ? -57% | 35.5 ? -22% | 35.7 ? -22% | 42.8 ? -47% |
| Response Time Black / White * (ms) | 24.4 ? | 18.9 ? 23% | 19.7 ? 19% | 23.5 ? 4% | 23.2 ? 5% | 91.6 ? -275% |
| PWM Frequency (Hz) | 56.7 | 14880 | ||||
| Screen | 43% | 23% | 73% | 49% | 352% | |
| Brightness middle (cd/m²) | 321.3 | 417 30% | 366 14% | 865 169% | 311 -3% | 514 60% |
| Brightness (cd/m²) | 315 | 388 23% | 347 10% | 771 145% | 319 1% | 497 58% |
| Brightness Distribution (%) | 82 | 81 -1% | 89 9% | 72 -12% | 91 11% | 95 16% |
| Black Level * (cd/m²) | 0.31 | 0.24 23% | 0.32 -3% | 0.3 3% | 0.17 45% | 0.02 94% |
| Contrast (:1) | 1036 | 1738 68% | 1144 10% | 2883 178% | 1829 77% | 25700 2381% |
| Colorchecker dE 2000 * | 5.16 | 1.7 67% | 2.82 45% | 2.4 53% | 1 81% | 1.4 73% |
| Colorchecker dE 2000 max. * | 18.75 | 3.5 81% | 4.65 75% | 5.8 69% | 1.7 91% | 2.8 85% |
| Colorchecker dE 2000 calibrated * | 2.76 | 1.4 49% | 2.69 3% | 1.5 46% | 0.8 71% | |
| Greyscale dE 2000 * | 4.2 | 2.4 43% | 2.3 45% | 3.8 10% | 1.5 64% | 2.3 45% |
| Gamma | 2.28 96% | 2.16 102% | 1.971 112% | 2.36 93% | 2.15 102% | 2.27 97% |
| CCT | 6163 105% | 6924 94% | 6796 96% | 6922 94% | 6432 101% | 6792 96% |
| Totaal Gemiddelde (Programma / Instellingen) | 39% /
43% | 37% /
35% | 47% /
62% | 34% /
44% | 101% /
217% |
* ... kleiner is beter
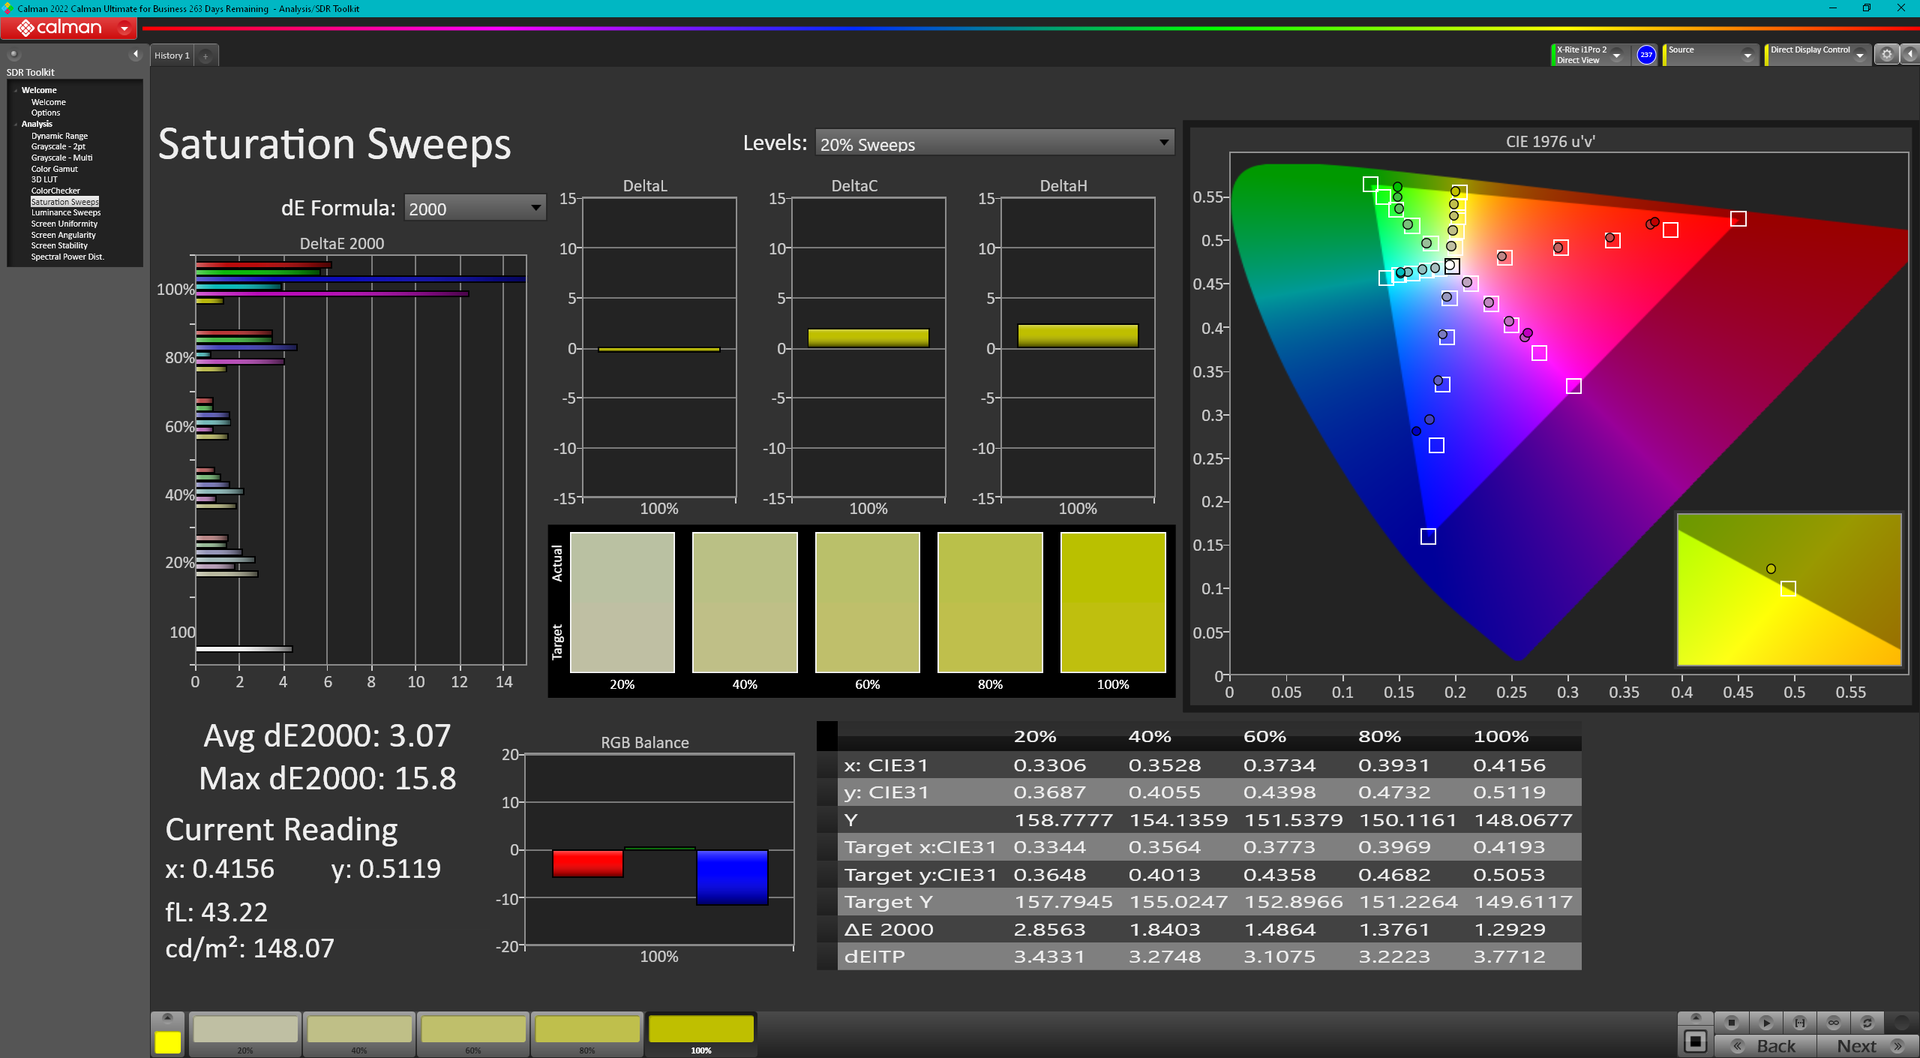
De kleurtemperatuur is te warm uit de doos, wat gelukkig kan worden aangepakt met een goede kalibratie. De gemiddelde kleur DeltaE zou verbeteren van 5,05 naar 2,23, maar kleuren zijn nog steeds onnauwkeurig bij hoge verzadigingsniveaus vanwege de beperkte kleurdekking van het paneel. Wij raden aan ons gekalibreerde ICM-profiel hierboven toe te passen, aangezien het scherm niet in de fabriek is gekalibreerd.
Responstijd Scherm
| ↔ Responstijd Zwart naar Wit | ||
|---|---|---|
| 24.4 ms ... stijging ↗ en daling ↘ gecombineerd | ↗ 14 ms stijging | 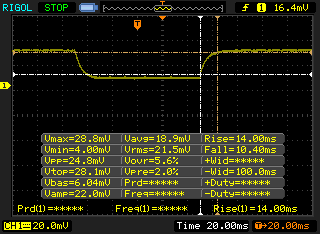 |
| ↘ 10.4 ms daling | ||
| Het scherm vertoonde prima responstijden in onze tests maar is misschien wat te traag voor competitieve games. Ter vergelijking: alle testtoestellen variëren van 0.1 (minimum) tot 240 (maximum) ms. » 58 % van alle toestellen zijn beter. Dit betekent dat de gemeten responstijd slechter is dan het gemiddelde (19.8 ms) van alle geteste toestellen. | ||
| ↔ Responstijd 50% Grijs naar 80% Grijs | ||
| 29.2 ms ... stijging ↗ en daling ↘ gecombineerd | ↗ 15.6 ms stijging | 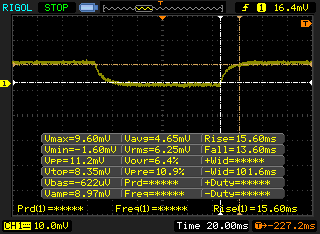 |
| ↘ 13.6 ms daling | ||
| Het scherm vertoonde relatief trage responstijden in onze tests en is misschien te traag voor games. Ter vergelijking: alle testtoestellen variëren van 0.165 (minimum) tot 636 (maximum) ms. » 40 % van alle toestellen zijn beter. Dit betekent dat de gemeten responstijd vergelijkbaar is met het gemiddelde (31 ms) van alle geteste toestellen. | ||
Screen Flickering / PWM (Pulse-Width Modulation)
| Screen flickering / PWM niet waargenomen | 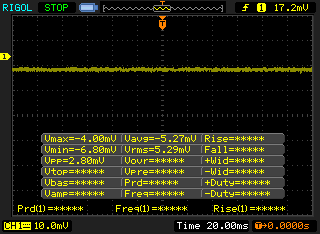 | ||
Ter vergelijking: 52 % van alle geteste toestellen maakten geen gebruik van PWM om de schermhelderheid te verlagen. Als het wel werd gebruikt, werd een gemiddelde van 7754 (minimum: 5 - maximum: 343500) Hz waargenomen. | |||
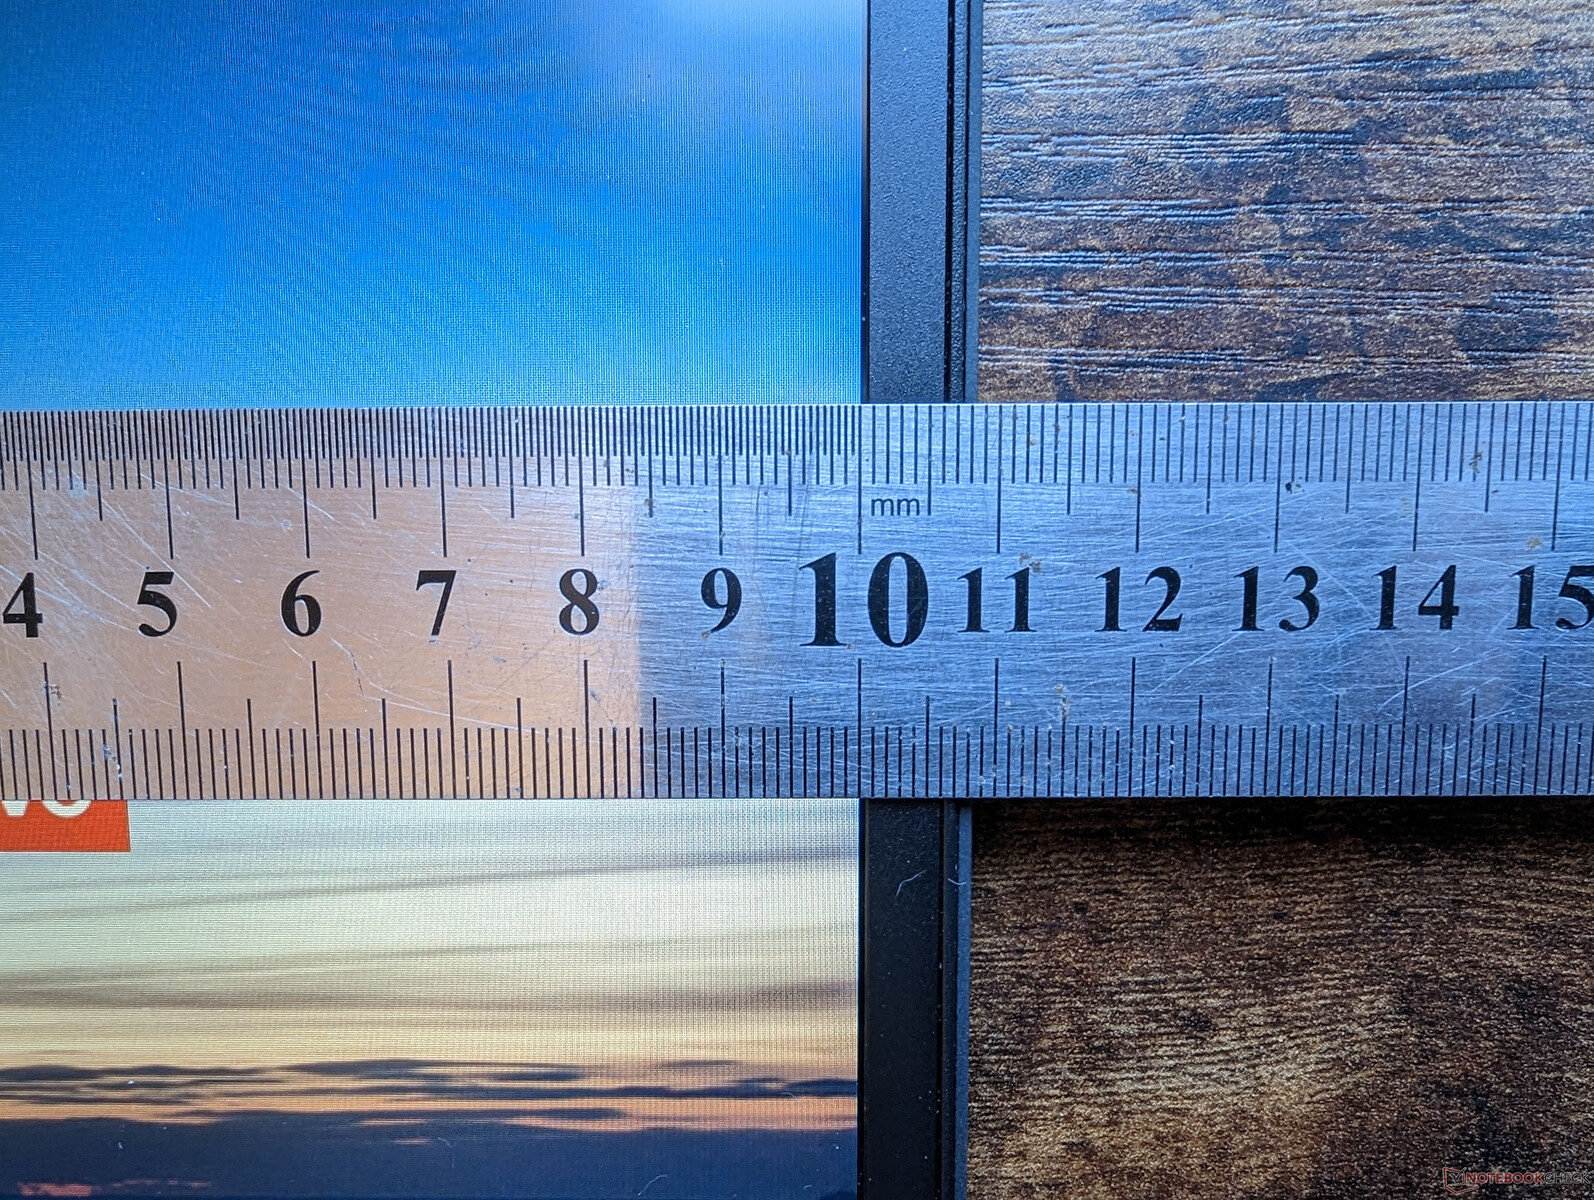
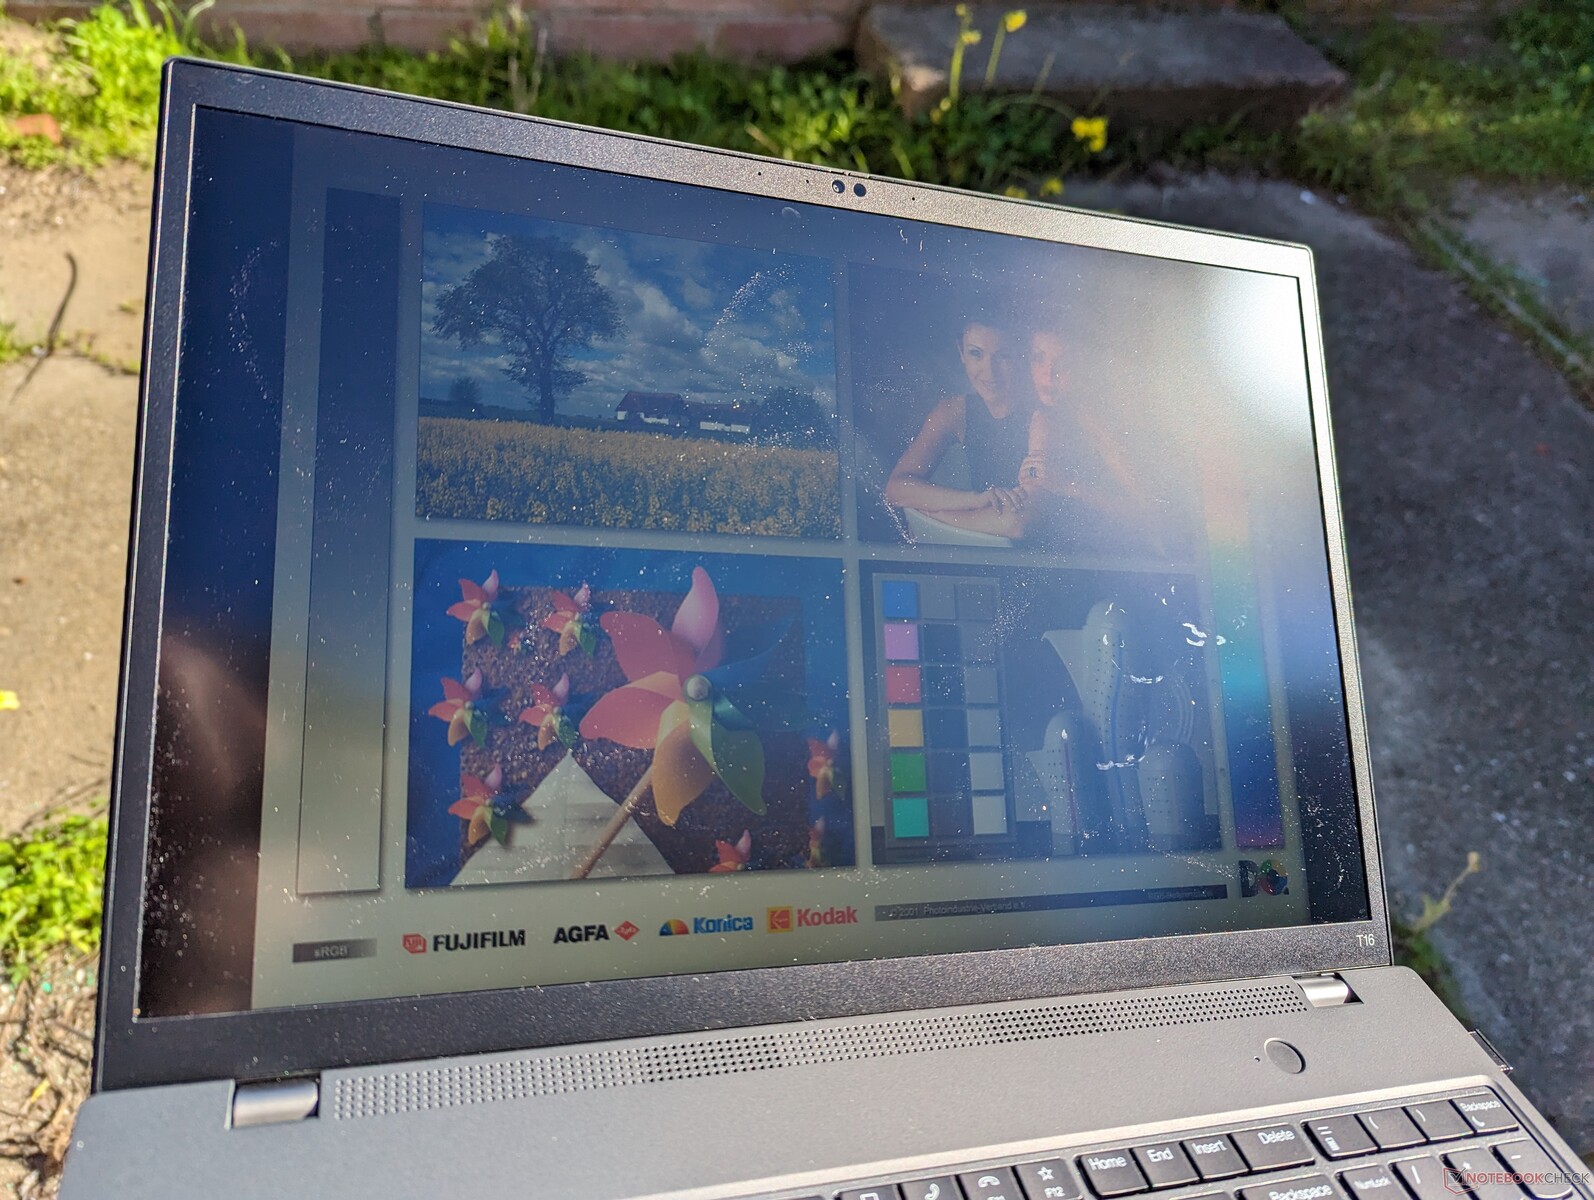
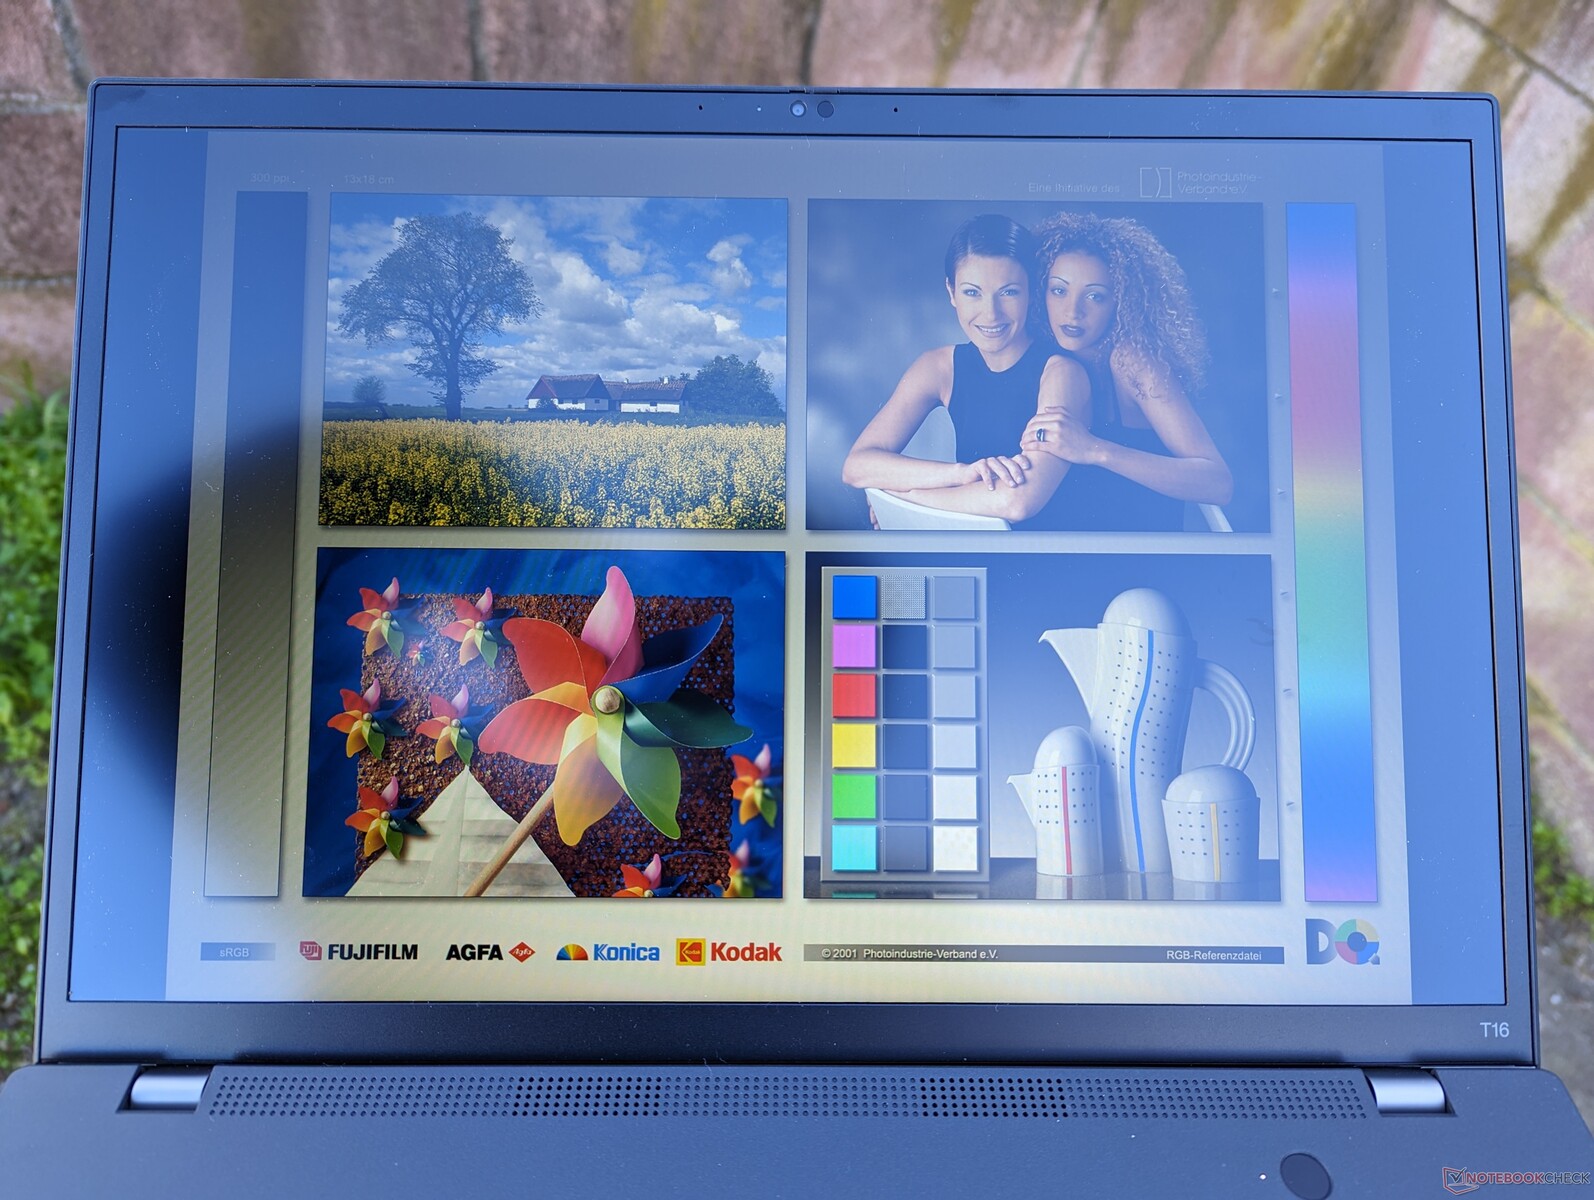
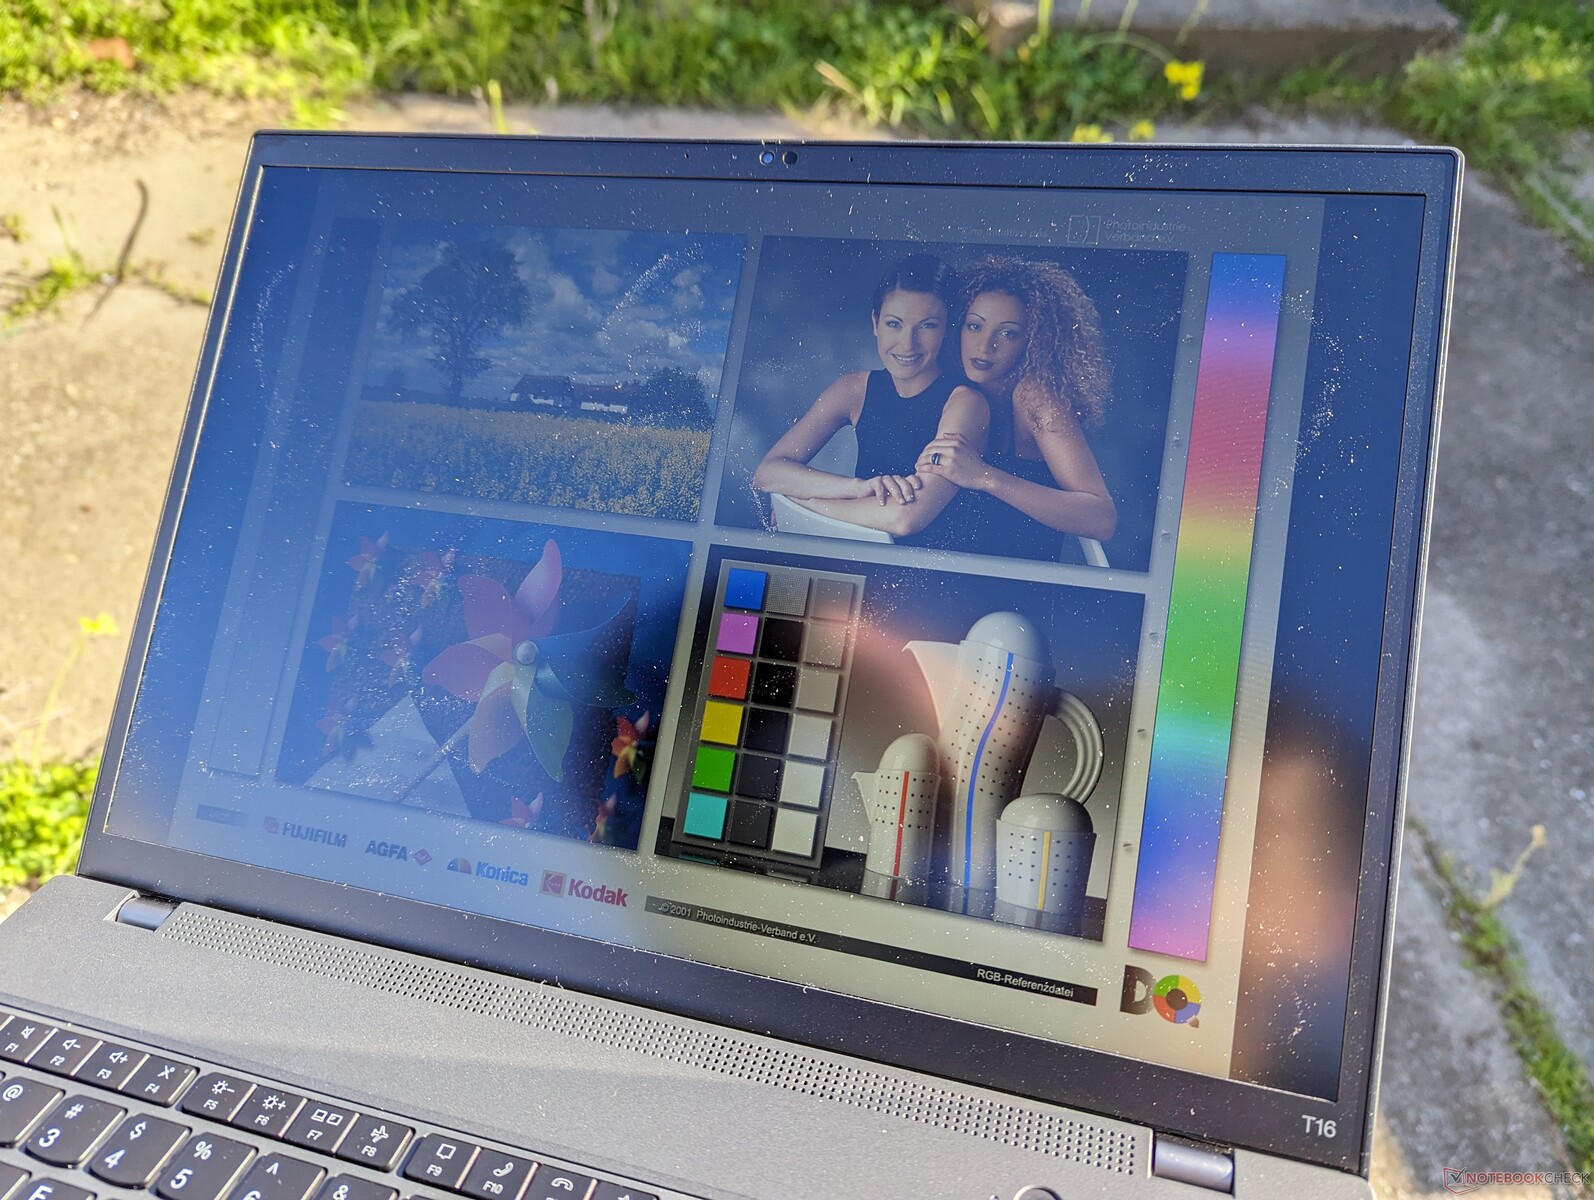
De zichtbaarheid buiten is op zijn best gemiddeld op ons 300-nit paneel. Gebruikers kunnen de 500-nit opties overwegen om de effecten van verblinding te verminderen. Als zichtbaarheid een punt van zorg is, dan raden we aan eens te kijken naar de HP EliteBook 860/865 G9 en zijn veel helderdere 1000-nit paneelopties.
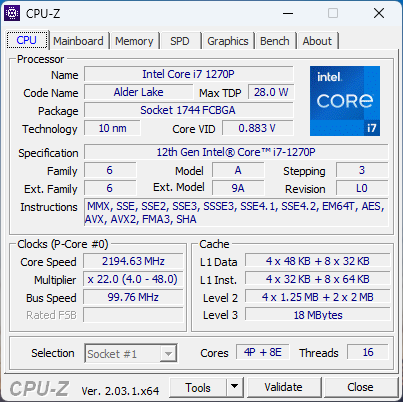
Prestaties - 12e generatie Intel-opties
Testomstandigheden
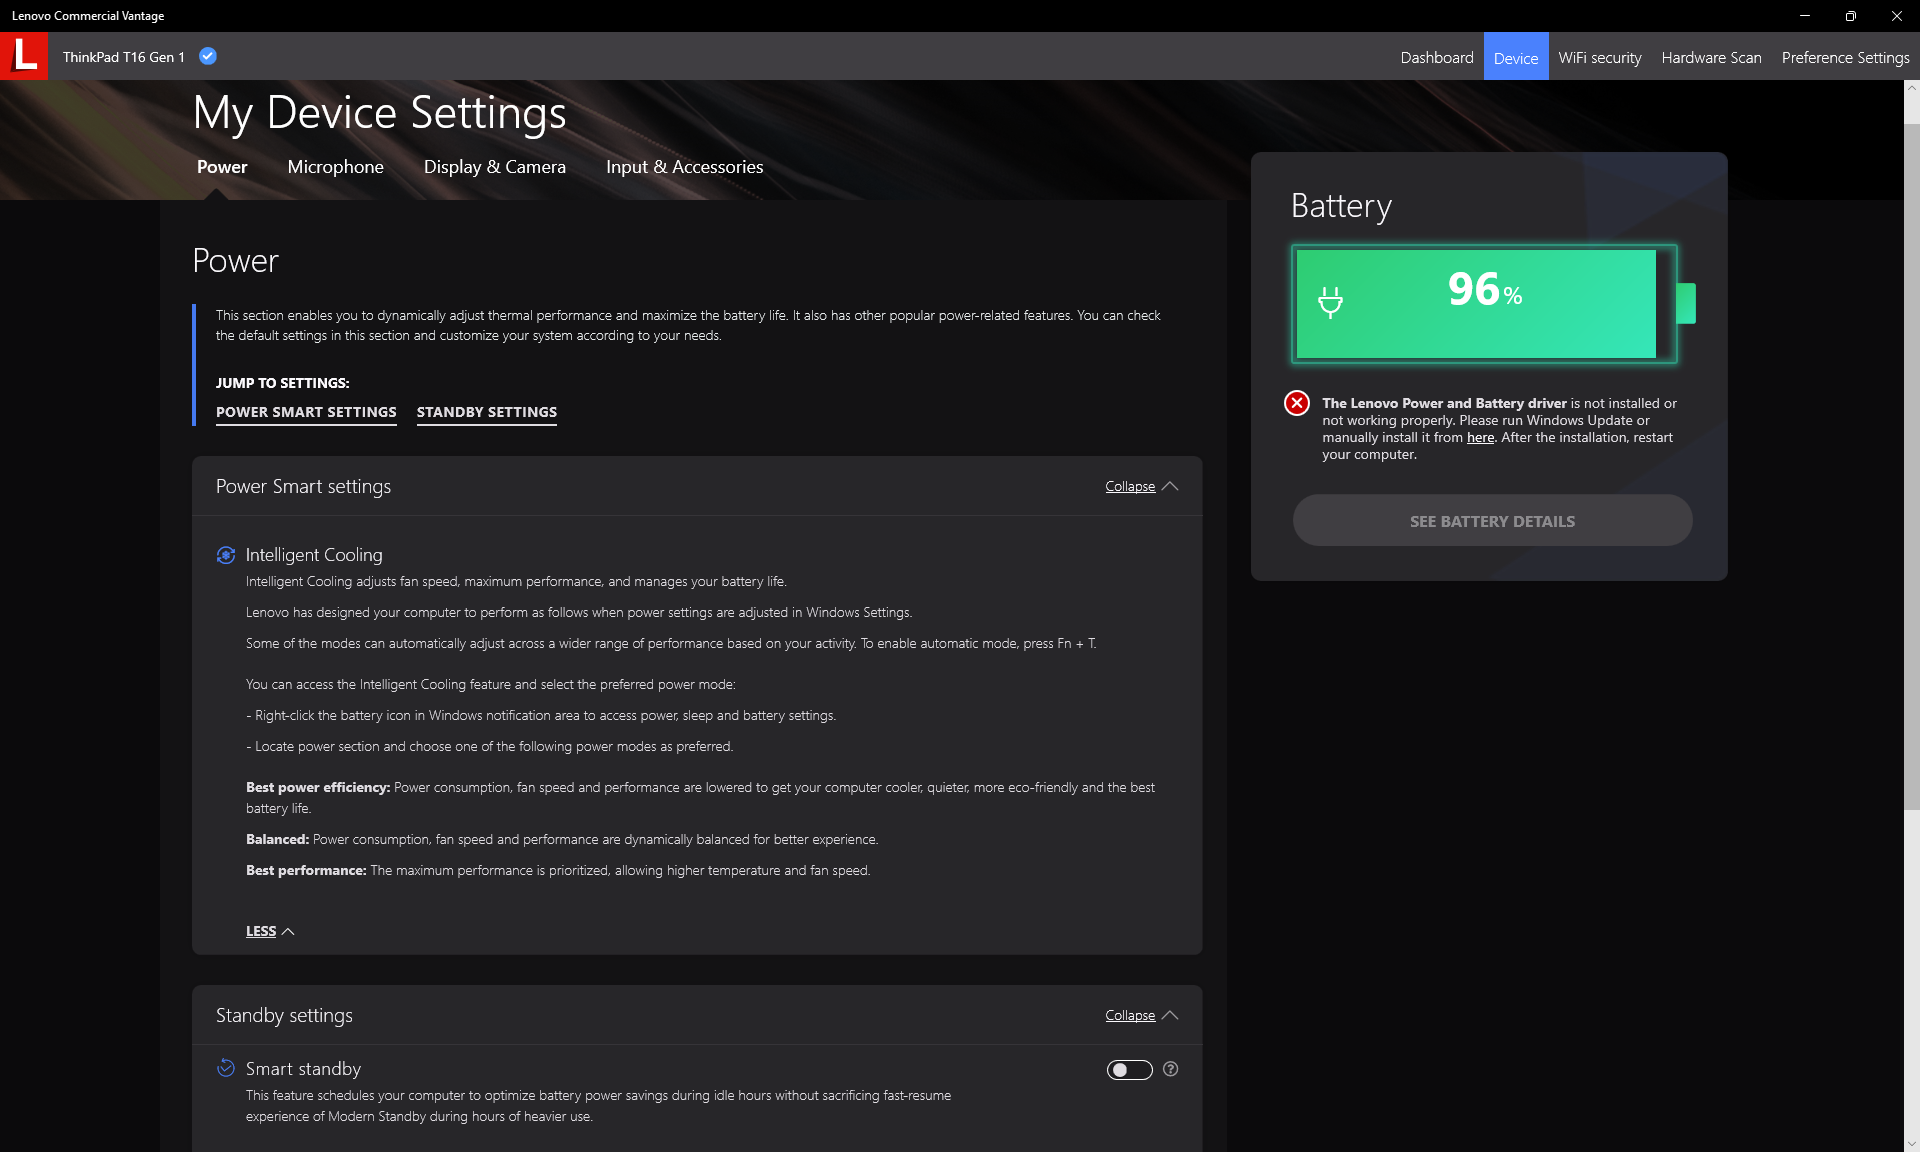
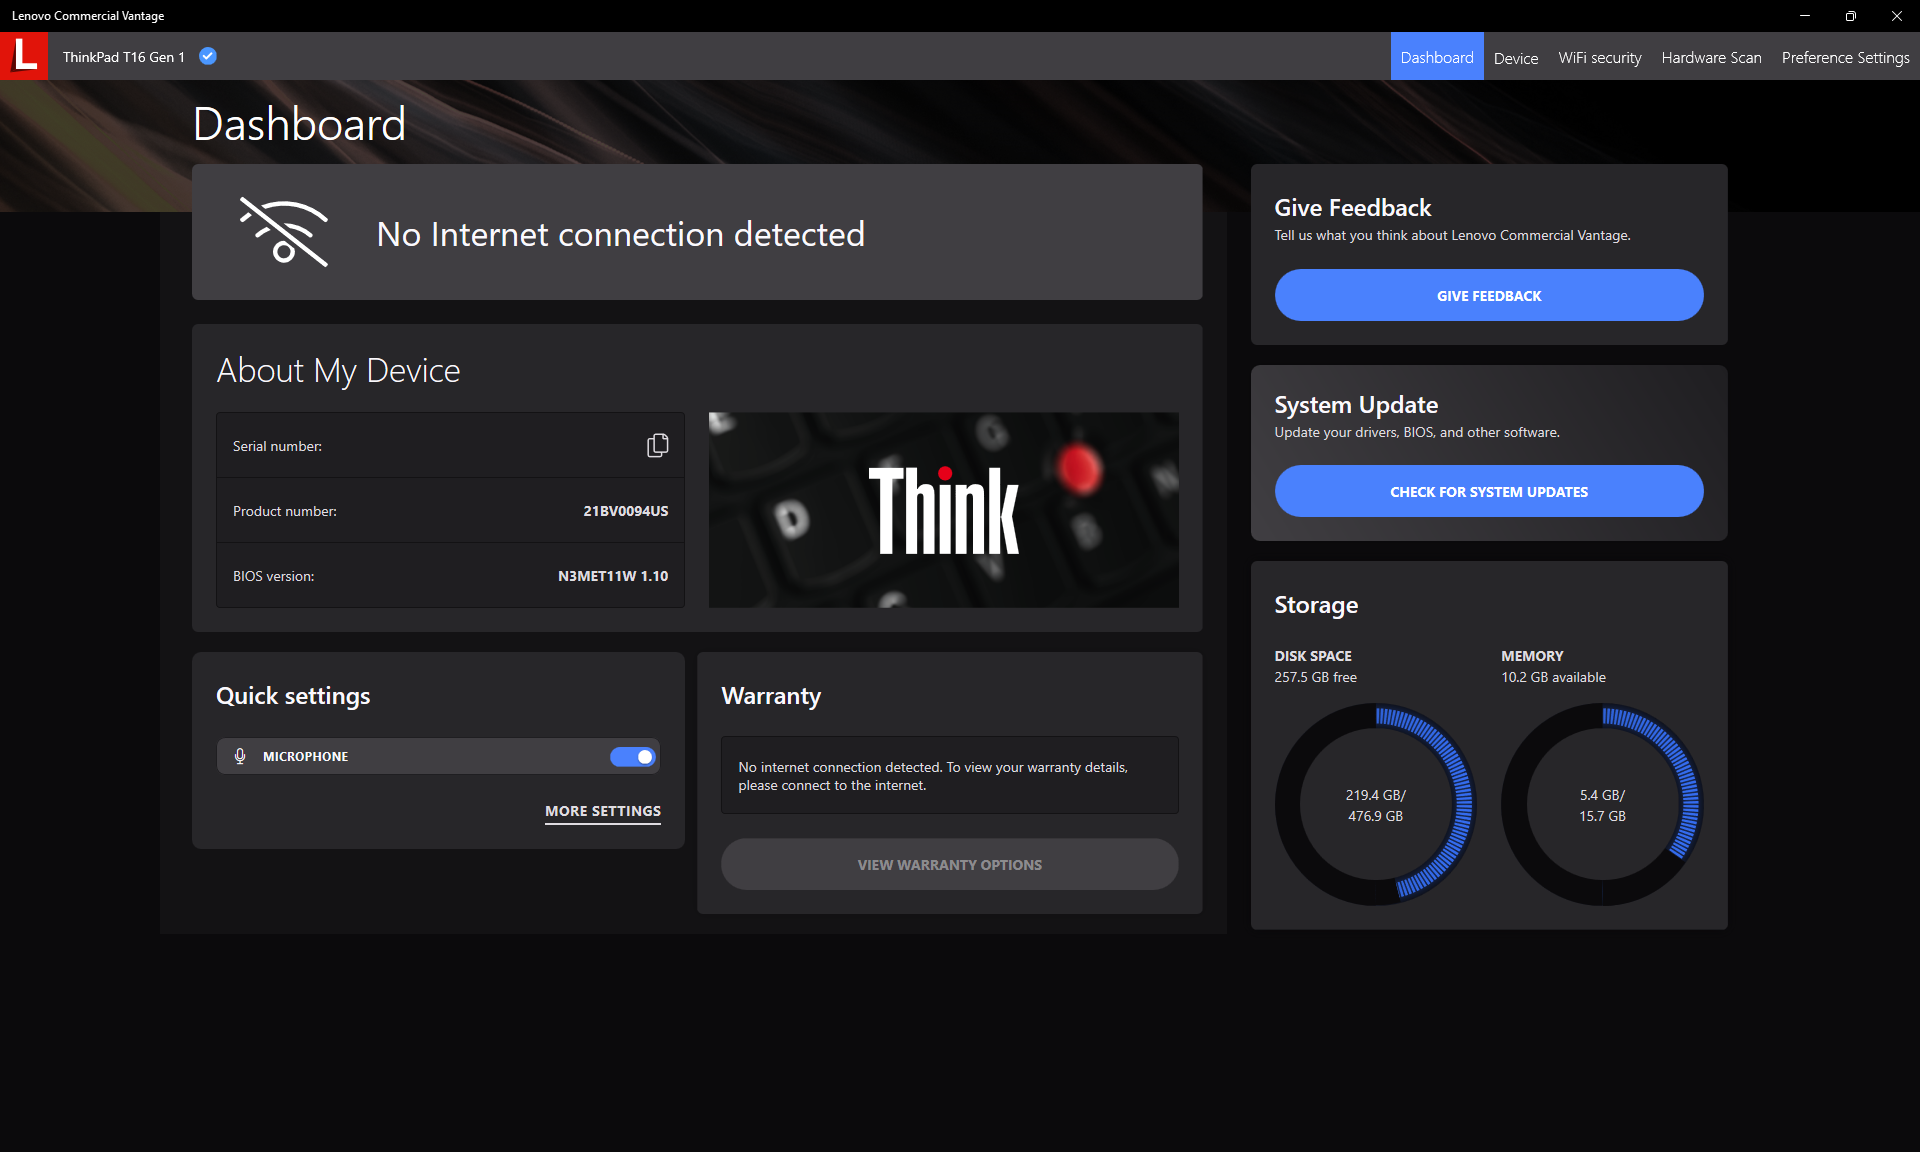
We hebben ons toestel via Windows in de prestatiemodus gezet alvorens onderstaande benchmarks uit te voeren. Gebruikers moeten vertrouwd raken met de Lenovo Commercial Vantage software, omdat dit de hub is voor aanvullende instellingen met betrekking tot updates, garantie, beveiliging en meer. De onderstaande screenshots tonen enkele van de opties.
Processor - Turbo Boost kan beter
Onze Core i7-1270P unit zou vergelijkbaar throttling gedrag vertonen met wat we zagen op de Core i5-1240P SKU. Bij het uitvoeren van CineBench R15 xT in een lus, bijvoorbeeld, zou de oorspronkelijke score van 1782 punten na verloop van tijd met maar liefst 44 procent dalen, wat aanzienlijk meer is dan op de meeste andere laptops. DeRyzen 5 PRO 6650U SKU zou langzamer zijn tijdens de paar minuten van de looptest, maar het is in staat om hogere kloksnelheden en prestaties over langere perioden aan te houden, zoals blijkt uit onze onderstaande grafiek. De Turbo Boost voordelen van de Core i7-1270P zijn dus van zeer korte duur op de ThinkPad T16 G1.
Gebruikers kunnen desgewenst ThrottleStop installeren om de prestatie throttling met ongeveer 20 procent te minimaliseren. Toch is het teleurstellend dat Lenovo een dergelijke prestatie-optie niet aanbiedt zonder zijn toevlucht te nemen tot software van derden.
Cinebench R15 Multi Loop
Cinebench R20: CPU (Multi Core) | CPU (Single Core)
Cinebench R23: Multi Core | Single Core
Cinebench R15: CPU Multi 64Bit | CPU Single 64Bit
Blender: v2.79 BMW27 CPU
7-Zip 18.03: 7z b 4 | 7z b 4 -mmt1
Geekbench 5.5: Multi-Core | Single-Core
HWBOT x265 Benchmark v2.2: 4k Preset
LibreOffice : 20 Documents To PDF
R Benchmark 2.5: Overall mean
| CPU Performance rating | |
| Huawei MateBook 16s i7 | |
| MSI Summit E16 Flip A12UDT-031 | |
| Apple MacBook Pro 16 2021 M1 Pro -5! | |
| Lenovo Yoga 7-14ARB G7 | |
| Lenovo ThinkPad T16 Gen 1 Core i7-1270P | |
| Gemiddeld Intel Core i7-1270P | |
| HP EliteBook 865 G9 | |
| Lenovo ThinkPad T16 G1 21CH004MGE | |
| Lenovo ThinkBook 13s G3 20YA0005GE | |
| LG Gram 16Z90Q | |
| Lenovo ThinkPad T16 G1 21BWS00200 | |
| Asus ZenBook Flip 15 Q508U | |
| LG Gram 16 (2021) | |
| Asus ZenBook 14 UX434FL-DB77 -2! | |
| Cinebench R20 / CPU (Multi Core) | |
| Huawei MateBook 16s i7 | |
| MSI Summit E16 Flip A12UDT-031 | |
| Lenovo Yoga 7-14ARB G7 | |
| Lenovo ThinkPad T16 Gen 1 Core i7-1270P | |
| HP EliteBook 865 G9 | |
| Lenovo ThinkPad T16 G1 21CH004MGE | |
| Asus ZenBook Flip 15 Q508U | |
| Gemiddeld Intel Core i7-1270P (3167 - 3905, n=2) | |
| LG Gram 16Z90Q | |
| Lenovo ThinkBook 13s G3 20YA0005GE | |
| Lenovo ThinkPad T16 G1 21BWS00200 | |
| Apple MacBook Pro 16 2021 M1 Pro | |
| LG Gram 16 (2021) | |
| Asus ZenBook 14 UX434FL-DB77 | |
| Cinebench R20 / CPU (Single Core) | |
| Huawei MateBook 16s i7 | |
| MSI Summit E16 Flip A12UDT-031 | |
| Lenovo ThinkPad T16 Gen 1 Core i7-1270P | |
| Gemiddeld Intel Core i7-1270P (595 - 627, n=2) | |
| LG Gram 16Z90Q | |
| Lenovo Yoga 7-14ARB G7 | |
| HP EliteBook 865 G9 | |
| Lenovo ThinkPad T16 G1 21BWS00200 | |
| Lenovo ThinkPad T16 G1 21CH004MGE | |
| Lenovo ThinkBook 13s G3 20YA0005GE | |
| LG Gram 16 (2021) | |
| Asus ZenBook Flip 15 Q508U | |
| Asus ZenBook 14 UX434FL-DB77 | |
| Apple MacBook Pro 16 2021 M1 Pro | |
| Cinebench R23 / Multi Core | |
| MSI Summit E16 Flip A12UDT-031 | |
| Huawei MateBook 16s i7 | |
| Apple MacBook Pro 16 2021 M1 Pro | |
| Lenovo Yoga 7-14ARB G7 | |
| Lenovo ThinkPad T16 Gen 1 Core i7-1270P | |
| HP EliteBook 865 G9 | |
| Gemiddeld Intel Core i7-1270P (8426 - 11010, n=2) | |
| Lenovo ThinkPad T16 G1 21CH004MGE | |
| Asus ZenBook Flip 15 Q508U | |
| Lenovo ThinkBook 13s G3 20YA0005GE | |
| LG Gram 16Z90Q | |
| Lenovo ThinkPad T16 G1 21BWS00200 | |
| LG Gram 16 (2021) | |
| Cinebench R23 / Single Core | |
| Huawei MateBook 16s i7 | |
| Lenovo ThinkPad T16 Gen 1 Core i7-1270P | |
| MSI Summit E16 Flip A12UDT-031 | |
| Lenovo ThinkPad T16 G1 21BWS00200 | |
| Gemiddeld Intel Core i7-1270P (1552 - 1688, n=2) | |
| LG Gram 16Z90Q | |
| Apple MacBook Pro 16 2021 M1 Pro | |
| Lenovo Yoga 7-14ARB G7 | |
| Lenovo ThinkPad T16 G1 21CH004MGE | |
| Lenovo ThinkBook 13s G3 20YA0005GE | |
| HP EliteBook 865 G9 | |
| LG Gram 16 (2021) | |
| Asus ZenBook Flip 15 Q508U | |
| Cinebench R15 / CPU Multi 64Bit | |
| Huawei MateBook 16s i7 | |
| Huawei MateBook 16s i7 | |
| MSI Summit E16 Flip A12UDT-031 | |
| Lenovo Yoga 7-14ARB G7 | |
| Lenovo ThinkBook 13s G3 20YA0005GE | |
| Lenovo ThinkBook 13s G3 20YA0005GE | |
| Lenovo ThinkPad T16 Gen 1 Core i7-1270P | |
| Lenovo ThinkPad T16 G1 21BWS00200 | |
| Lenovo ThinkPad T16 G1 21BWS00200 | |
| Gemiddeld Intel Core i7-1270P (1695 - 1783, n=2) | |
| Apple MacBook Pro 16 2021 M1 Pro | |
| HP EliteBook 865 G9 | |
| Asus ZenBook Flip 15 Q508U | |
| Lenovo ThinkPad T16 G1 21CH004MGE | |
| LG Gram 16Z90Q | |
| LG Gram 16 (2021) | |
| Asus ZenBook 14 UX434FL-DB77 | |
| Cinebench R15 / CPU Single 64Bit | |
| Huawei MateBook 16s i7 | |
| Lenovo Yoga 7-14ARB G7 | |
| MSI Summit E16 Flip A12UDT-031 | |
| Lenovo ThinkPad T16 Gen 1 Core i7-1270P | |
| Lenovo ThinkPad T16 G1 21CH004MGE | |
| HP EliteBook 865 G9 | |
| Gemiddeld Intel Core i7-1270P (226 - 233, n=2) | |
| Lenovo ThinkBook 13s G3 20YA0005GE | |
| Lenovo ThinkPad T16 G1 21BWS00200 | |
| LG Gram 16Z90Q | |
| Apple MacBook Pro 16 2021 M1 Pro | |
| LG Gram 16 (2021) | |
| Asus ZenBook Flip 15 Q508U | |
| Asus ZenBook 14 UX434FL-DB77 | |
| Blender / v2.79 BMW27 CPU | |
| LG Gram 16 (2021) | |
| Asus ZenBook 14 UX434FL-DB77 | |
| LG Gram 16Z90Q | |
| Lenovo ThinkPad T16 G1 21BWS00200 | |
| Lenovo ThinkBook 13s G3 20YA0005GE | |
| Gemiddeld Intel Core i7-1270P (372 - 375, n=2) | |
| Lenovo ThinkPad T16 Gen 1 Core i7-1270P | |
| Lenovo ThinkPad T16 G1 21CH004MGE | |
| Asus ZenBook Flip 15 Q508U | |
| MSI Summit E16 Flip A12UDT-031 | |
| HP EliteBook 865 G9 | |
| Lenovo Yoga 7-14ARB G7 | |
| Huawei MateBook 16s i7 | |
| Apple MacBook Pro 16 2021 M1 Pro | |
| 7-Zip 18.03 / 7z b 4 | |
| Huawei MateBook 16s i7 | |
| Lenovo Yoga 7-14ARB G7 | |
| MSI Summit E16 Flip A12UDT-031 | |
| HP EliteBook 865 G9 | |
| Asus ZenBook Flip 15 Q508U | |
| Lenovo ThinkPad T16 G1 21CH004MGE | |
| Lenovo ThinkBook 13s G3 20YA0005GE | |
| Lenovo ThinkPad T16 Gen 1 Core i7-1270P | |
| Gemiddeld Intel Core i7-1270P (38099 - 38449, n=2) | |
| LG Gram 16Z90Q | |
| Lenovo ThinkPad T16 G1 21BWS00200 | |
| LG Gram 16 (2021) | |
| Asus ZenBook 14 UX434FL-DB77 | |
| 7-Zip 18.03 / 7z b 4 -mmt1 | |
| Huawei MateBook 16s i7 | |
| Lenovo ThinkPad T16 Gen 1 Core i7-1270P | |
| HP EliteBook 865 G9 | |
| Lenovo Yoga 7-14ARB G7 | |
| Lenovo ThinkBook 13s G3 20YA0005GE | |
| Gemiddeld Intel Core i7-1270P (4874 - 5684, n=2) | |
| Lenovo ThinkPad T16 G1 21CH004MGE | |
| MSI Summit E16 Flip A12UDT-031 | |
| LG Gram 16Z90Q | |
| LG Gram 16 (2021) | |
| Lenovo ThinkPad T16 G1 21BWS00200 | |
| Asus ZenBook Flip 15 Q508U | |
| Asus ZenBook 14 UX434FL-DB77 | |
| Geekbench 5.5 / Multi-Core | |
| Huawei MateBook 16s i7 | |
| Apple MacBook Pro 16 2021 M1 Pro | |
| MSI Summit E16 Flip A12UDT-031 | |
| LG Gram 16Z90Q | |
| Lenovo Yoga 7-14ARB G7 | |
| Gemiddeld Intel Core i7-1270P (8610 - 8710, n=2) | |
| Lenovo ThinkPad T16 Gen 1 Core i7-1270P | |
| Lenovo ThinkPad T16 G1 21CH004MGE | |
| Lenovo ThinkPad T16 G1 21BWS00200 | |
| HP EliteBook 865 G9 | |
| Lenovo ThinkBook 13s G3 20YA0005GE | |
| Asus ZenBook Flip 15 Q508U | |
| LG Gram 16 (2021) | |
| Asus ZenBook 14 UX434FL-DB77 | |
| Geekbench 5.5 / Single-Core | |
| Huawei MateBook 16s i7 | |
| Apple MacBook Pro 16 2021 M1 Pro | |
| Lenovo ThinkPad T16 Gen 1 Core i7-1270P | |
| LG Gram 16Z90Q | |
| Gemiddeld Intel Core i7-1270P (1564 - 1724, n=2) | |
| MSI Summit E16 Flip A12UDT-031 | |
| Lenovo Yoga 7-14ARB G7 | |
| Lenovo ThinkPad T16 G1 21BWS00200 | |
| LG Gram 16 (2021) | |
| Lenovo ThinkPad T16 G1 21CH004MGE | |
| Lenovo ThinkBook 13s G3 20YA0005GE | |
| HP EliteBook 865 G9 | |
| Asus ZenBook Flip 15 Q508U | |
| Asus ZenBook 14 UX434FL-DB77 | |
| HWBOT x265 Benchmark v2.2 / 4k Preset | |
| Huawei MateBook 16s i7 | |
| Lenovo Yoga 7-14ARB G7 | |
| MSI Summit E16 Flip A12UDT-031 | |
| Lenovo ThinkPad T16 G1 21CH004MGE | |
| HP EliteBook 865 G9 | |
| Lenovo ThinkPad T16 Gen 1 Core i7-1270P | |
| Gemiddeld Intel Core i7-1270P (9.56 - 11.3, n=2) | |
| Lenovo ThinkBook 13s G3 20YA0005GE | |
| Asus ZenBook Flip 15 Q508U | |
| Lenovo ThinkPad T16 G1 21BWS00200 | |
| LG Gram 16Z90Q | |
| LG Gram 16 (2021) | |
| Asus ZenBook 14 UX434FL-DB77 | |
| LibreOffice / 20 Documents To PDF | |
| Asus ZenBook 14 UX434FL-DB77 | |
| Asus ZenBook Flip 15 Q508U | |
| Lenovo Yoga 7-14ARB G7 | |
| LG Gram 16Z90Q | |
| HP EliteBook 865 G9 | |
| MSI Summit E16 Flip A12UDT-031 | |
| Lenovo ThinkBook 13s G3 20YA0005GE | |
| Lenovo ThinkPad T16 G1 21CH004MGE | |
| Gemiddeld Intel Core i7-1270P (47.1 - 48.6, n=2) | |
| Lenovo ThinkPad T16 G1 21BWS00200 | |
| Lenovo ThinkPad T16 Gen 1 Core i7-1270P | |
| LG Gram 16 (2021) | |
| Huawei MateBook 16s i7 | |
| R Benchmark 2.5 / Overall mean | |
| Asus ZenBook 14 UX434FL-DB77 | |
| LG Gram 16 (2021) | |
| Asus ZenBook Flip 15 Q508U | |
| Lenovo ThinkBook 13s G3 20YA0005GE | |
| LG Gram 16Z90Q | |
| Gemiddeld Intel Core i7-1270P (0.4926 - 0.575, n=2) | |
| Lenovo ThinkPad T16 G1 21CH004MGE | |
| Lenovo ThinkPad T16 G1 21BWS00200 | |
| HP EliteBook 865 G9 | |
| MSI Summit E16 Flip A12UDT-031 | |
| Lenovo Yoga 7-14ARB G7 | |
| Lenovo ThinkPad T16 Gen 1 Core i7-1270P | |
| Huawei MateBook 16s i7 | |
Cinebench R20: CPU (Multi Core) | CPU (Single Core)
Cinebench R23: Multi Core | Single Core
Cinebench R15: CPU Multi 64Bit | CPU Single 64Bit
Blender: v2.79 BMW27 CPU
7-Zip 18.03: 7z b 4 | 7z b 4 -mmt1
Geekbench 5.5: Multi-Core | Single-Core
HWBOT x265 Benchmark v2.2: 4k Preset
LibreOffice : 20 Documents To PDF
R Benchmark 2.5: Overall mean
* ... kleiner is beter
* ... kleiner is beter
AIDA64: FP32 Ray-Trace | FPU Julia | CPU SHA3 | CPU Queen | FPU SinJulia | FPU Mandel | CPU AES | CPU ZLib | FP64 Ray-Trace | CPU PhotoWorxx
| Performance rating | |
| HP EliteBook 865 G9 | |
| Lenovo ThinkPad T16 G1 21CH004MGE | |
| Huawei MateBook 16s i7 | |
| Lenovo ThinkPad T16 Gen 1 Core i7-1270P | |
| LG Gram 16Z90Q | |
| Gemiddeld Intel Core i7-1270P | |
| AIDA64 / FP32 Ray-Trace | |
| HP EliteBook 865 G9 | |
| Lenovo ThinkPad T16 G1 21CH004MGE | |
| Lenovo ThinkPad T16 Gen 1 Core i7-1270P | |
| LG Gram 16Z90Q | |
| Huawei MateBook 16s i7 | |
| Gemiddeld Intel Core i7-1270P (4789 - 6722, n=2) | |
| AIDA64 / FPU Julia | |
| HP EliteBook 865 G9 | |
| Lenovo ThinkPad T16 G1 21CH004MGE | |
| Lenovo ThinkPad T16 Gen 1 Core i7-1270P | |
| Gemiddeld Intel Core i7-1270P (22017 - 37567, n=2) | |
| Huawei MateBook 16s i7 | |
| LG Gram 16Z90Q | |
| AIDA64 / CPU SHA3 | |
| HP EliteBook 865 G9 | |
| Lenovo ThinkPad T16 G1 21CH004MGE | |
| Huawei MateBook 16s i7 | |
| Lenovo ThinkPad T16 Gen 1 Core i7-1270P | |
| Gemiddeld Intel Core i7-1270P (1543 - 1853, n=2) | |
| LG Gram 16Z90Q | |
| AIDA64 / CPU Queen | |
| Huawei MateBook 16s i7 | |
| HP EliteBook 865 G9 | |
| Lenovo ThinkPad T16 G1 21CH004MGE | |
| Lenovo ThinkPad T16 Gen 1 Core i7-1270P | |
| LG Gram 16Z90Q | |
| Gemiddeld Intel Core i7-1270P (61703 - 76671, n=2) | |
| AIDA64 / FPU SinJulia | |
| HP EliteBook 865 G9 | |
| Lenovo ThinkPad T16 G1 21CH004MGE | |
| Huawei MateBook 16s i7 | |
| Gemiddeld Intel Core i7-1270P (5059 - 5210, n=2) | |
| Lenovo ThinkPad T16 Gen 1 Core i7-1270P | |
| LG Gram 16Z90Q | |
| AIDA64 / FPU Mandel | |
| HP EliteBook 865 G9 | |
| Lenovo ThinkPad T16 G1 21CH004MGE | |
| Lenovo ThinkPad T16 Gen 1 Core i7-1270P | |
| Huawei MateBook 16s i7 | |
| Gemiddeld Intel Core i7-1270P (12876 - 17891, n=2) | |
| LG Gram 16Z90Q | |
| AIDA64 / CPU AES | |
| Lenovo ThinkPad T16 G1 21CH004MGE | |
| Huawei MateBook 16s i7 | |
| HP EliteBook 865 G9 | |
| Lenovo ThinkPad T16 Gen 1 Core i7-1270P | |
| Gemiddeld Intel Core i7-1270P (33137 - 39956, n=2) | |
| LG Gram 16Z90Q | |
| AIDA64 / CPU ZLib | |
| Huawei MateBook 16s i7 | |
| HP EliteBook 865 G9 | |
| Lenovo ThinkPad T16 G1 21CH004MGE | |
| Lenovo ThinkPad T16 Gen 1 Core i7-1270P | |
| Gemiddeld Intel Core i7-1270P (553 - 579, n=2) | |
| LG Gram 16Z90Q | |
| AIDA64 / FP64 Ray-Trace | |
| HP EliteBook 865 G9 | |
| Lenovo ThinkPad T16 G1 21CH004MGE | |
| LG Gram 16Z90Q | |
| Lenovo ThinkPad T16 Gen 1 Core i7-1270P | |
| Huawei MateBook 16s i7 | |
| Gemiddeld Intel Core i7-1270P (2603 - 3521, n=2) | |
| AIDA64 / CPU PhotoWorxx | |
| Huawei MateBook 16s i7 | |
| LG Gram 16Z90Q | |
| Gemiddeld Intel Core i7-1270P (21056 - 34745, n=2) | |
| Lenovo ThinkPad T16 G1 21CH004MGE | |
| Lenovo ThinkPad T16 Gen 1 Core i7-1270P | |
| HP EliteBook 865 G9 | |
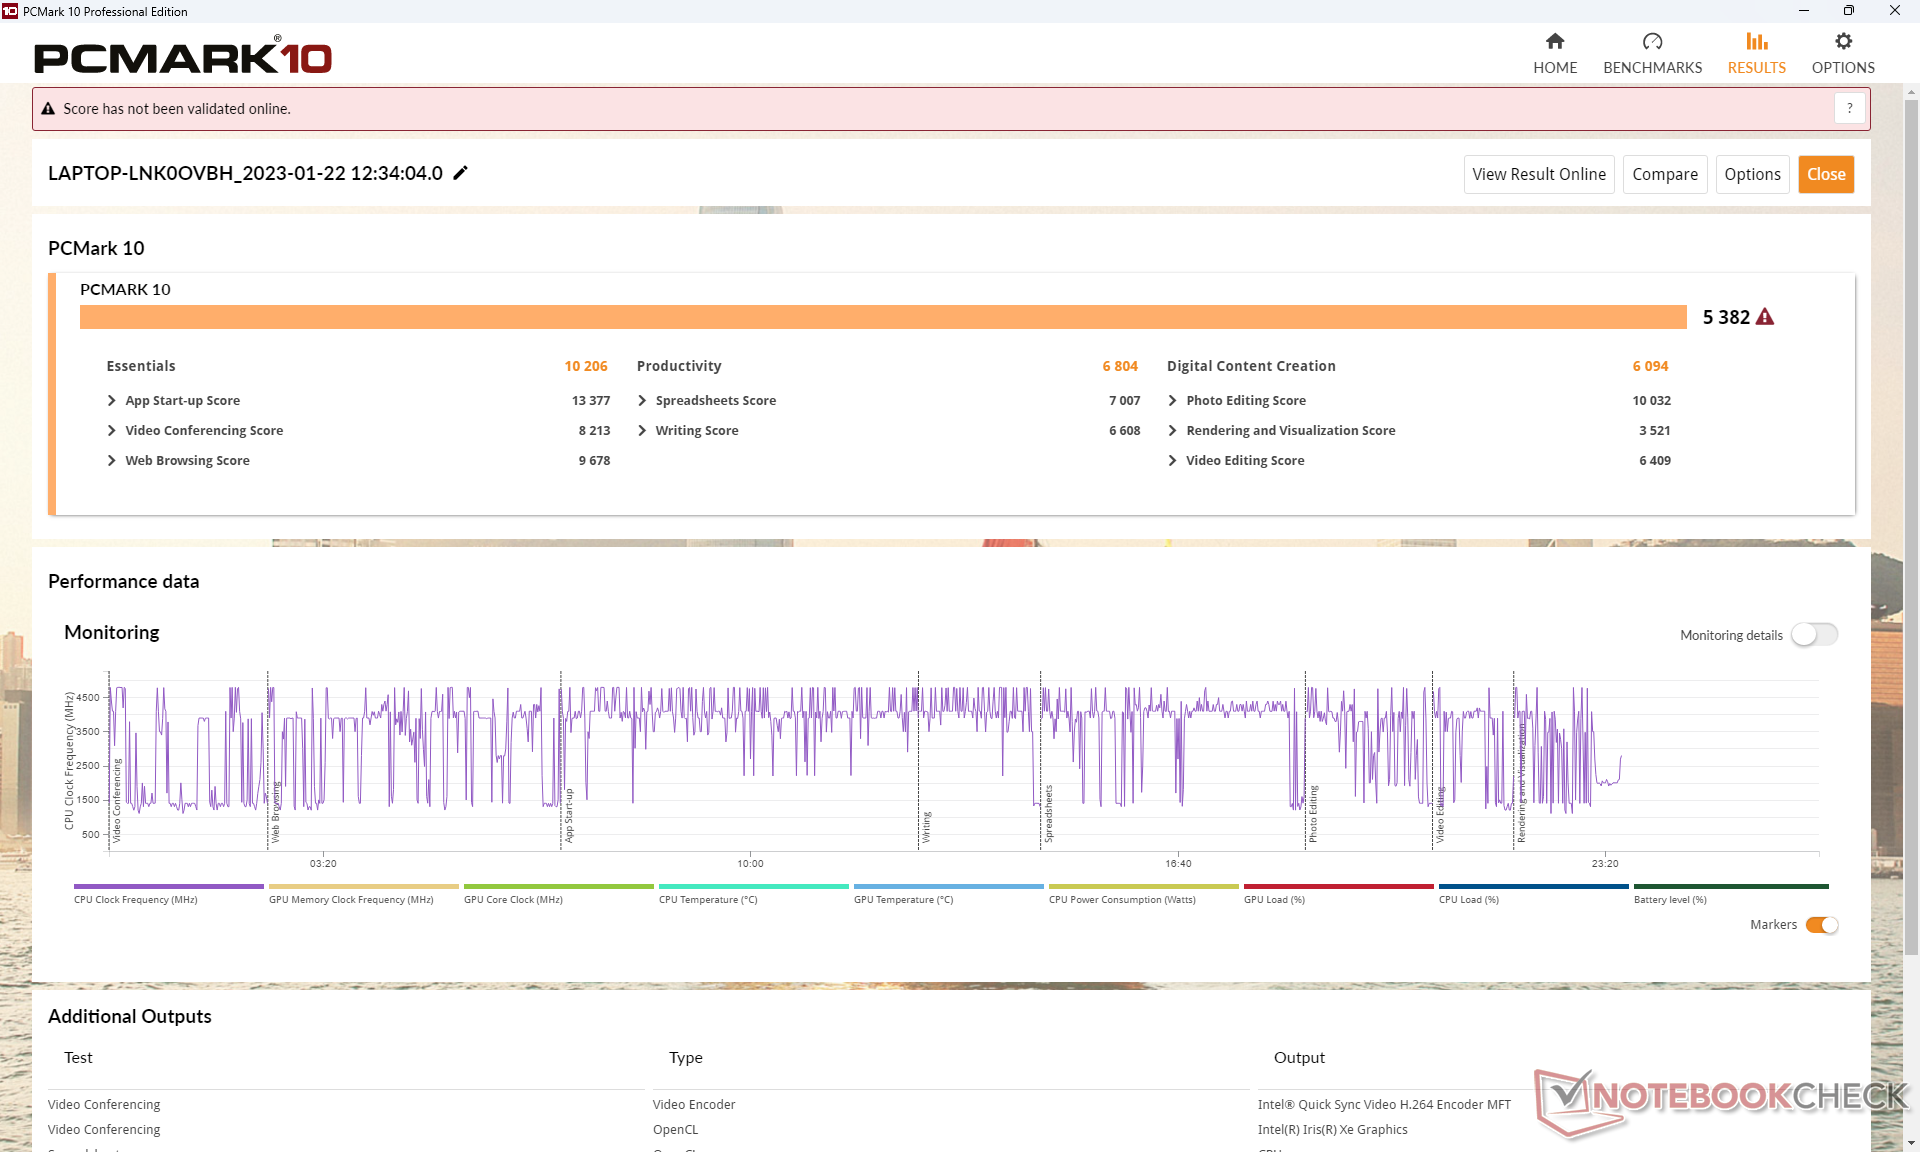
Systeemprestaties
De gemiddelde PCMark-resultaten liggen tussen de langzamere Core i5-aangedreven en de snellere Ryzen 5-aangedreven SKU's, zoals blijkt uit onderstaande vergelijkingstabel. De AMD SKU heeft een duidelijke voorsprong in de Productiviteit subtest, waarschijnlijk door zijn snellere multi-thread prestaties en geïntegreerde GPU in vergelijking met de Intel SKU's.
CrossMark: Overall | Productivity | Creativity | Responsiveness
| PCMark 10 / Score | |
| Huawei MateBook 16s i7 | |
| Lenovo ThinkPad T16 G1 21CH004MGE | |
| HP EliteBook 865 G9 | |
| Gemiddeld Intel Core i7-1270P, Intel Iris Xe Graphics G7 96EUs (5382 - 5647, n=2) | |
| Lenovo ThinkPad T16 Gen 1 Core i7-1270P | |
| LG Gram 16Z90Q | |
| Lenovo ThinkPad T16 G1 21BWS00200 | |
| PCMark 10 / Essentials | |
| Huawei MateBook 16s i7 | |
| Gemiddeld Intel Core i7-1270P, Intel Iris Xe Graphics G7 96EUs (10206 - 11224, n=2) | |
| Lenovo ThinkPad T16 Gen 1 Core i7-1270P | |
| LG Gram 16Z90Q | |
| Lenovo ThinkPad T16 G1 21CH004MGE | |
| Lenovo ThinkPad T16 G1 21BWS00200 | |
| HP EliteBook 865 G9 | |
| PCMark 10 / Productivity | |
| Lenovo ThinkPad T16 G1 21CH004MGE | |
| HP EliteBook 865 G9 | |
| Huawei MateBook 16s i7 | |
| Gemiddeld Intel Core i7-1270P, Intel Iris Xe Graphics G7 96EUs (6804 - 6805, n=2) | |
| Lenovo ThinkPad T16 Gen 1 Core i7-1270P | |
| LG Gram 16Z90Q | |
| Lenovo ThinkPad T16 G1 21BWS00200 | |
| PCMark 10 / Digital Content Creation | |
| Huawei MateBook 16s i7 | |
| HP EliteBook 865 G9 | |
| Lenovo ThinkPad T16 G1 21CH004MGE | |
| Gemiddeld Intel Core i7-1270P, Intel Iris Xe Graphics G7 96EUs (6094 - 6398, n=2) | |
| Lenovo ThinkPad T16 Gen 1 Core i7-1270P | |
| LG Gram 16Z90Q | |
| Lenovo ThinkPad T16 G1 21BWS00200 | |
| CrossMark / Overall | |
| Huawei MateBook 16s i7 | |
| Gemiddeld Intel Core i7-1270P, Intel Iris Xe Graphics G7 96EUs (1585 - 1712, n=2) | |
| Lenovo ThinkPad T16 Gen 1 Core i7-1270P | |
| Apple MacBook Pro 16 2021 M1 Pro | |
| Lenovo ThinkPad T16 G1 21CH004MGE | |
| Lenovo ThinkPad T16 G1 21BWS00200 | |
| HP EliteBook 865 G9 | |
| CrossMark / Productivity | |
| Huawei MateBook 16s i7 | |
| Gemiddeld Intel Core i7-1270P, Intel Iris Xe Graphics G7 96EUs (1567 - 1636, n=2) | |
| Lenovo ThinkPad T16 Gen 1 Core i7-1270P | |
| Lenovo ThinkPad T16 G1 21CH004MGE | |
| Lenovo ThinkPad T16 G1 21BWS00200 | |
| HP EliteBook 865 G9 | |
| Apple MacBook Pro 16 2021 M1 Pro | |
| CrossMark / Creativity | |
| Apple MacBook Pro 16 2021 M1 Pro | |
| Huawei MateBook 16s i7 | |
| Gemiddeld Intel Core i7-1270P, Intel Iris Xe Graphics G7 96EUs (1684 - 1839, n=2) | |
| Lenovo ThinkPad T16 Gen 1 Core i7-1270P | |
| Lenovo ThinkPad T16 G1 21CH004MGE | |
| Lenovo ThinkPad T16 G1 21BWS00200 | |
| HP EliteBook 865 G9 | |
| CrossMark / Responsiveness | |
| Huawei MateBook 16s i7 | |
| Gemiddeld Intel Core i7-1270P, Intel Iris Xe Graphics G7 96EUs (1365 - 1584, n=2) | |
| Lenovo ThinkPad T16 Gen 1 Core i7-1270P | |
| Lenovo ThinkPad T16 G1 21BWS00200 | |
| Lenovo ThinkPad T16 G1 21CH004MGE | |
| HP EliteBook 865 G9 | |
| Apple MacBook Pro 16 2021 M1 Pro | |
| PCMark 10 Score | 5382 punten | |
Help | ||
| AIDA64 / Memory Copy | |
| Huawei MateBook 16s i7 | |
| LG Gram 16Z90Q | |
| Gemiddeld Intel Core i7-1270P (39471 - 62300, n=2) | |
| Lenovo ThinkPad T16 G1 21CH004MGE | |
| Lenovo ThinkPad T16 Gen 1 Core i7-1270P | |
| HP EliteBook 865 G9 | |
| AIDA64 / Memory Read | |
| Huawei MateBook 16s i7 | |
| LG Gram 16Z90Q | |
| Gemiddeld Intel Core i7-1270P (42289 - 72572, n=2) | |
| Lenovo ThinkPad T16 Gen 1 Core i7-1270P | |
| Lenovo ThinkPad T16 G1 21CH004MGE | |
| HP EliteBook 865 G9 | |
| AIDA64 / Memory Write | |
| LG Gram 16Z90Q | |
| Huawei MateBook 16s i7 | |
| Gemiddeld Intel Core i7-1270P (43051 - 61340, n=2) | |
| Lenovo ThinkPad T16 G1 21CH004MGE | |
| Lenovo ThinkPad T16 Gen 1 Core i7-1270P | |
| HP EliteBook 865 G9 | |
| AIDA64 / Memory Latency | |
| Lenovo ThinkPad T16 G1 21CH004MGE | |
| Huawei MateBook 16s i7 | |
| LG Gram 16Z90Q | |
| HP EliteBook 865 G9 | |
| Lenovo ThinkPad T16 Gen 1 Core i7-1270P | |
| Gemiddeld Intel Core i7-1270P (89.3 - 89.3, n=2) | |
* ... kleiner is beter
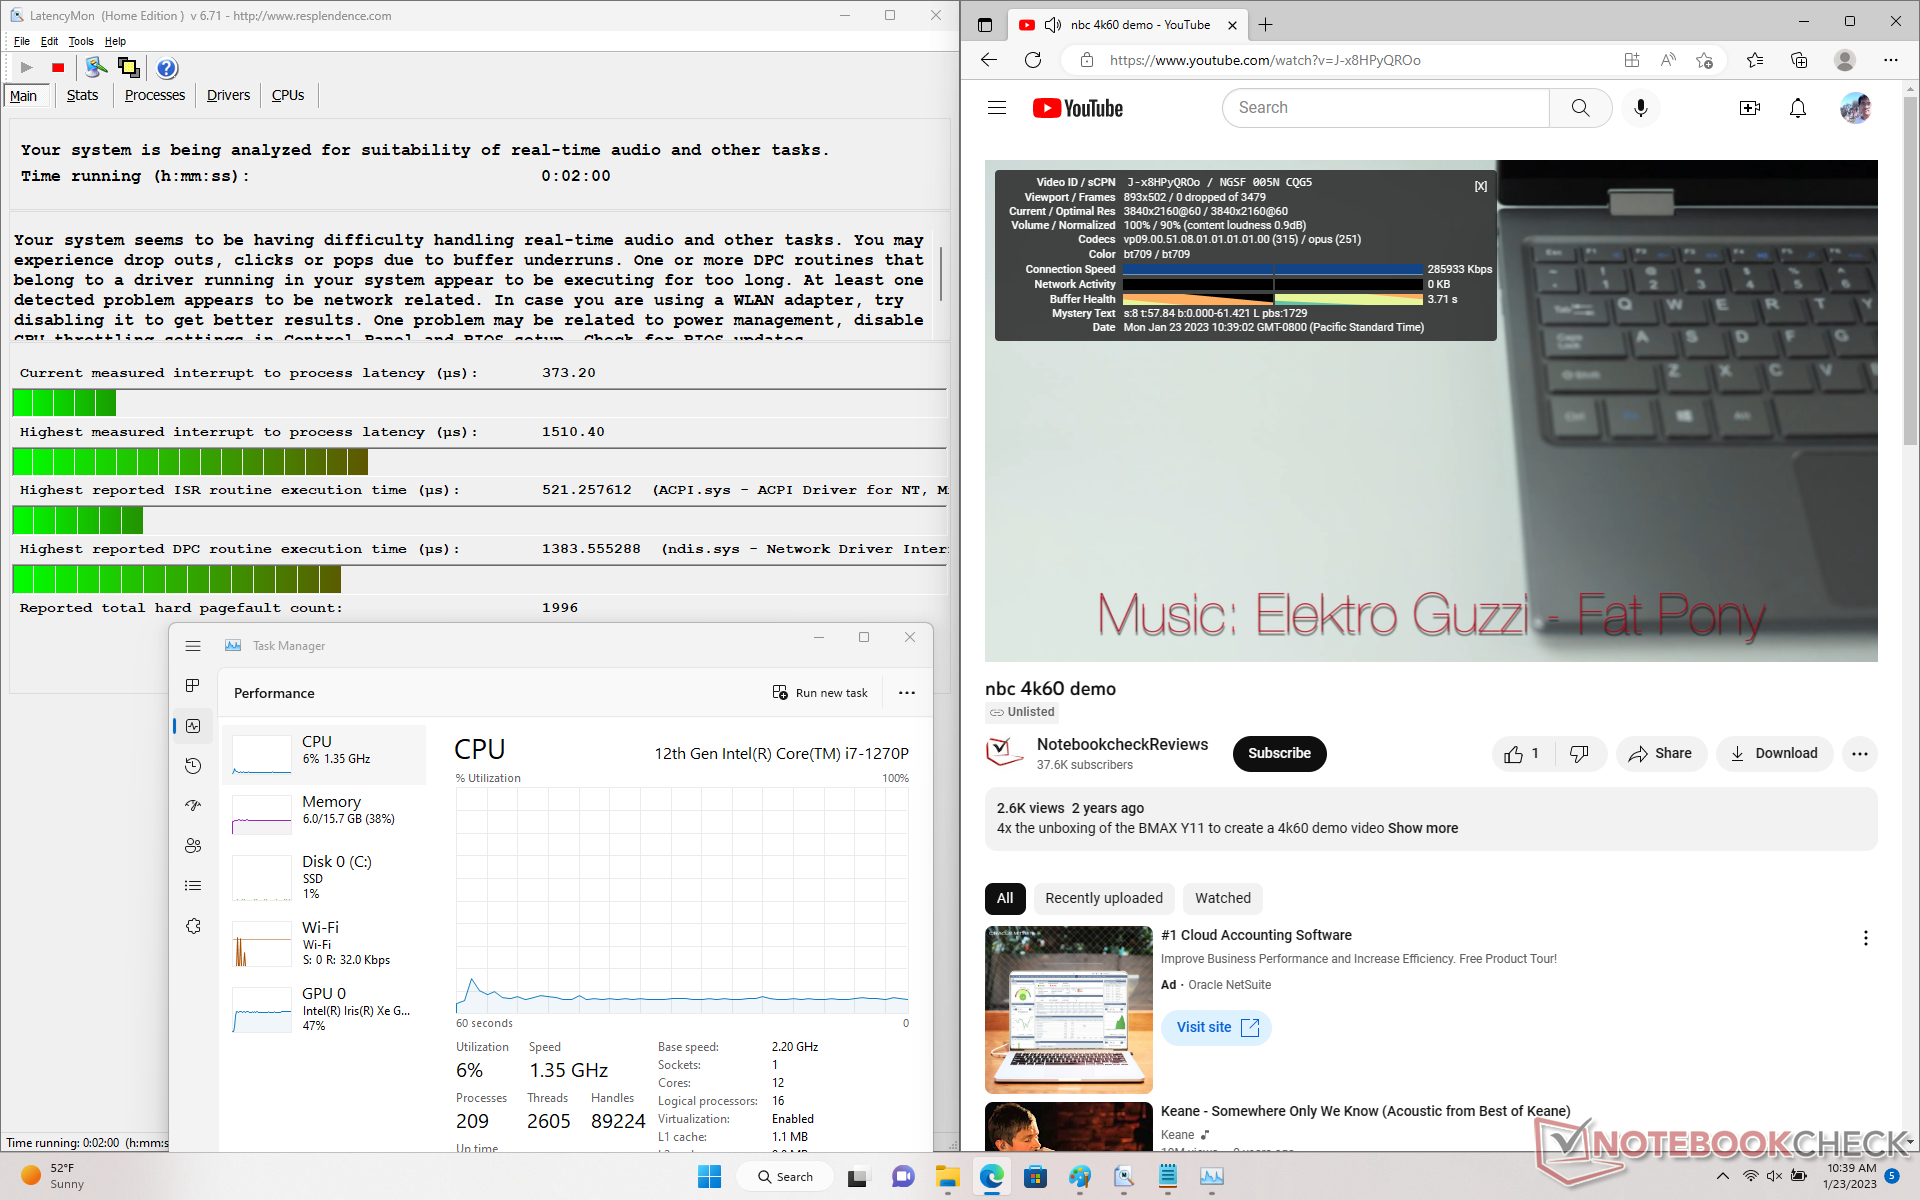
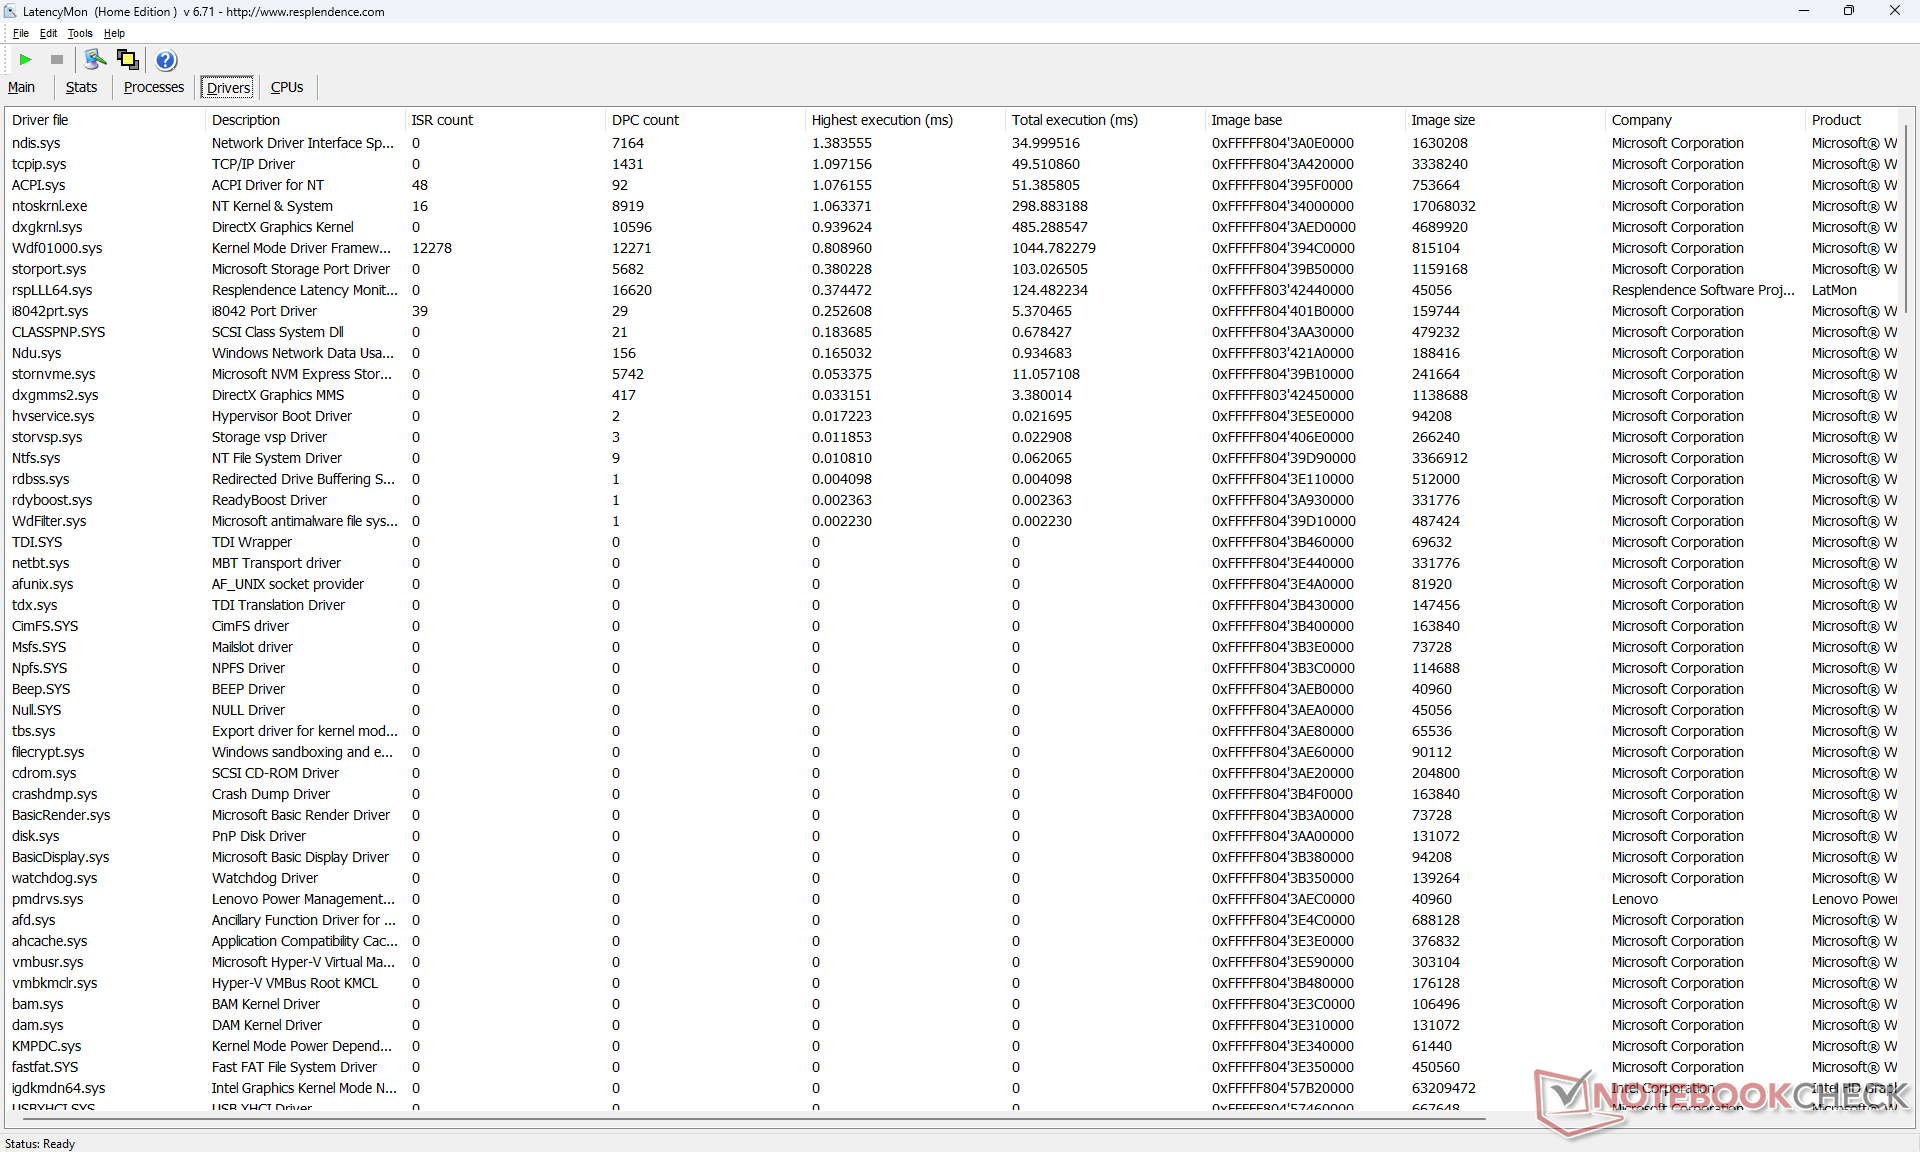
DPC latentie
LatencyMon toont DPC-problemen bij het openen van meerdere browsertabbladen van onze homepage. 4K-videoweergave bij 60 FPS is verder perfect en zonder dropped frames.
| DPC Latencies / LatencyMon - interrupt to process latency (max), Web, Youtube, Prime95 | |
| LG Gram 16Z90Q | |
| Lenovo ThinkPad T16 Gen 1 Core i7-1270P | |
| Lenovo ThinkPad T16 G1 21CH004MGE | |
| HP EliteBook 865 G9 | |
* ... kleiner is beter
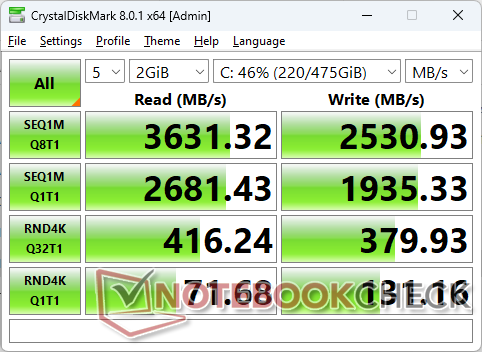
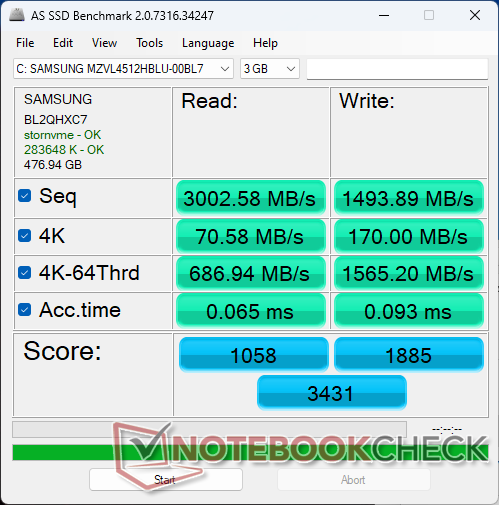
Opslagapparaten
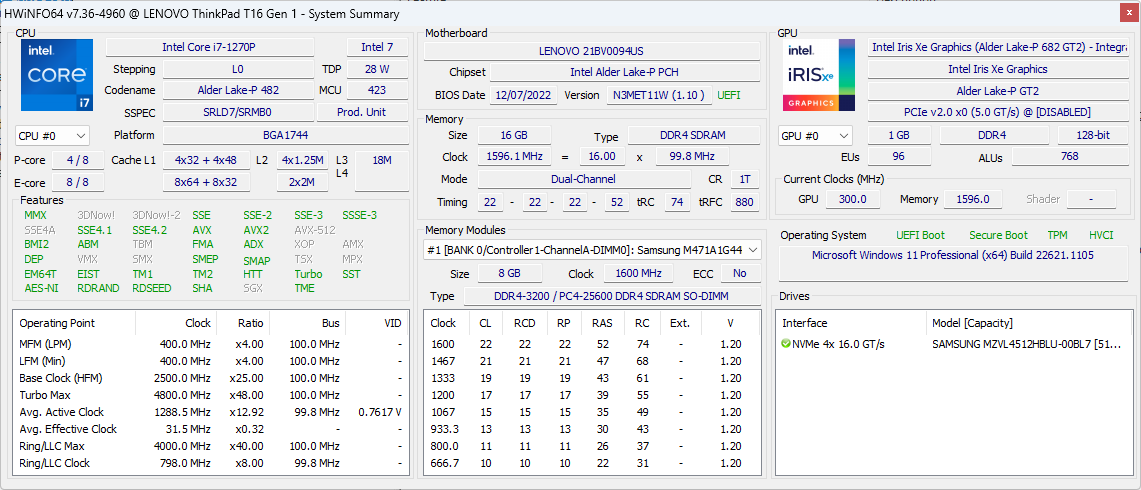
Ons toestel wordt geleverd met een 512 GB Samsung PM9B1 PCIe4 x4 NVMe SSD in plaats van de meer gebruikelijke Samsung PM9A1. De PM9B1-serie biedt bijna de helft lagere overdrachtsnelheden; sequentiële leessnelheden komen uit op ~3600 MB/s op ons apparaat, vergeleken met ~6300 MB/s op de LG Gram 16 met de Samsung PM9A1.

| Drive Performance rating - Percent | |
| Huawei MateBook 16s i7 | |
| LG Gram 16Z90Q | |
| Lenovo ThinkPad T16 G1 21CH004MGE | |
| Lenovo ThinkPad T16 Gen 1 Core i7-1270P | |
| HP EliteBook 865 G9 | |
* ... kleiner is beter
Disk Throttling: DiskSpd Read Loop, Queue Depth 8
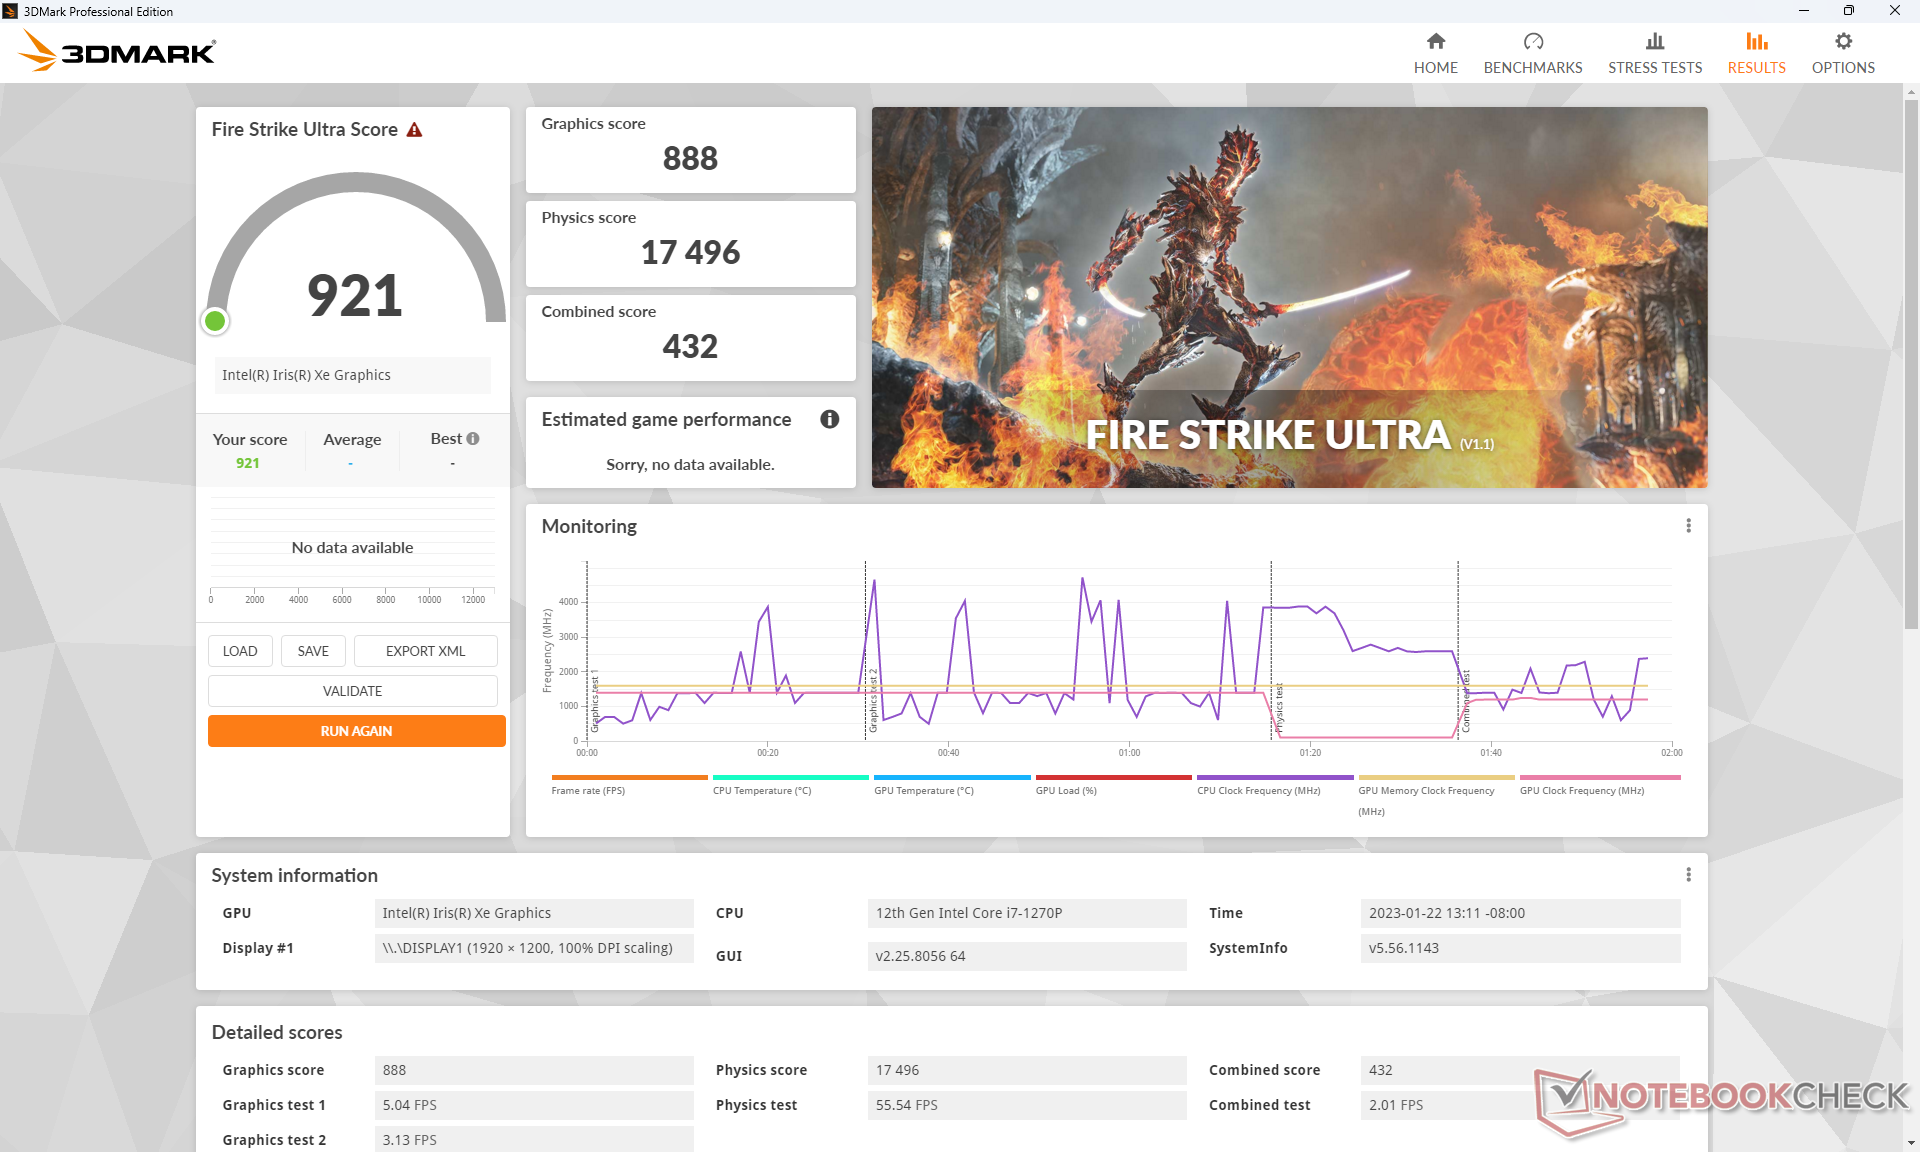
GPU-prestaties - afgeremd door traag RAM-geheugen
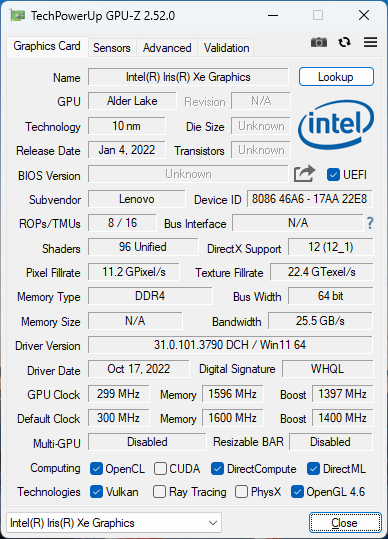
De grafische prestaties zijn ongeveer 10 procent langzamer dan de gemiddelde laptop in onze database die is uitgerust met dezelfde Iris Xe 96 EUs GPU. De ondermaatse prestaties kunnen deels worden toegeschreven aan het trage DDR4-3200 RAM ten opzichte van de meeste andere laptops met 12e generatie Intel CPU's. De LG Gram 16wordt bijvoorbeeld standaard geleverd met sneller LPDDR5-5200 RAM.
Bovendien kunnen de grafische prestaties geleidelijk langzamer worden wanneer gedurende langere tijd hoge belastingen worden uitgevoerd. Bij stationair draaien op Witcher 3 op lage instellingen, bijvoorbeeld, zou de framerate dalen van 84 FPS tijdens het begin van de test tot ~70 FPS na een paar minuten, zoals blijkt uit de onderstaande grafiek als gevolg van het beperkte Turbo Boost potentieel van het systeem.
Opwaarderen naar de Ryzen 5 Radeon 660M SKU van hetzelfde model zal de grafische prestaties met ongeveer 10 tot 15 procent verbeteren.
| 3DMark Performance rating - Percent | |
| MSI Summit E16 Flip A12UDT-031 | |
| Lenovo Yoga 7-14ARB G7 | |
| Asus ZenBook Flip 15 Q508U | |
| Huawei MateBook 16s i7 | |
| LG Gram 16 (2021) | |
| Lenovo ThinkPad T16 G1 21CH004MGE | |
| Gemiddeld Intel Iris Xe Graphics G7 96EUs | |
| LG Gram 16Z90Q | |
| HP EliteBook 865 G9 | |
| Lenovo ThinkPad T16 Gen 1 Core i7-1270P | |
| Lenovo ThinkBook 13s G3 20YA0005GE | |
| Lenovo ThinkPad T16 G1 21BWS00200 | |
| Asus ZenBook 14 UX434FL-DB77 | |
| 3DMark 11 - 1280x720 Performance GPU | |
| MSI Summit E16 Flip A12UDT-031 | |
| Lenovo Yoga 7-14ARB G7 | |
| Asus ZenBook Flip 15 Q508U | |
| Lenovo ThinkPad T16 G1 21CH004MGE | |
| HP EliteBook 865 G9 | |
| Huawei MateBook 16s i7 | |
| Gemiddeld Intel Iris Xe Graphics G7 96EUs (2867 - 7676, n=209) | |
| LG Gram 16 (2021) | |
| Lenovo ThinkBook 13s G3 20YA0005GE | |
| LG Gram 16Z90Q | |
| Lenovo ThinkPad T16 Gen 1 Core i7-1270P | |
| Lenovo ThinkPad T16 G1 21BWS00200 | |
| Asus ZenBook 14 UX434FL-DB77 | |
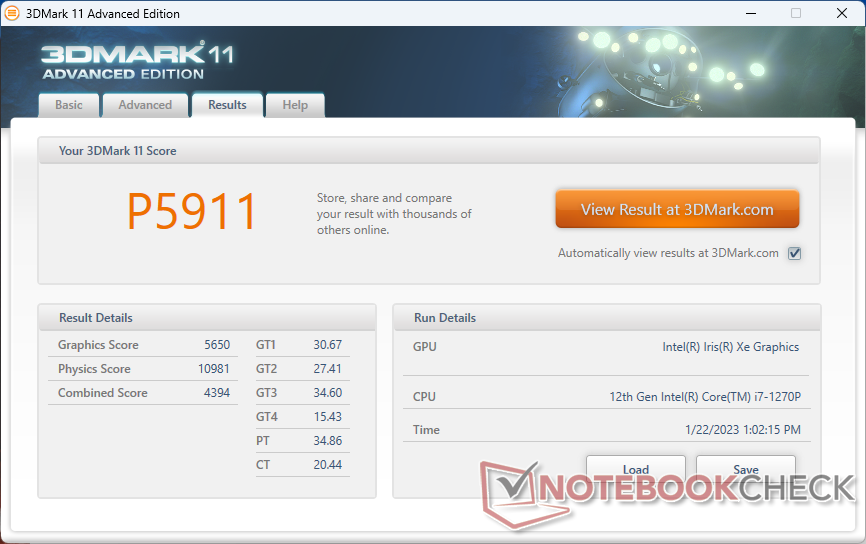
| 3DMark 11 Performance | 5911 punten | |
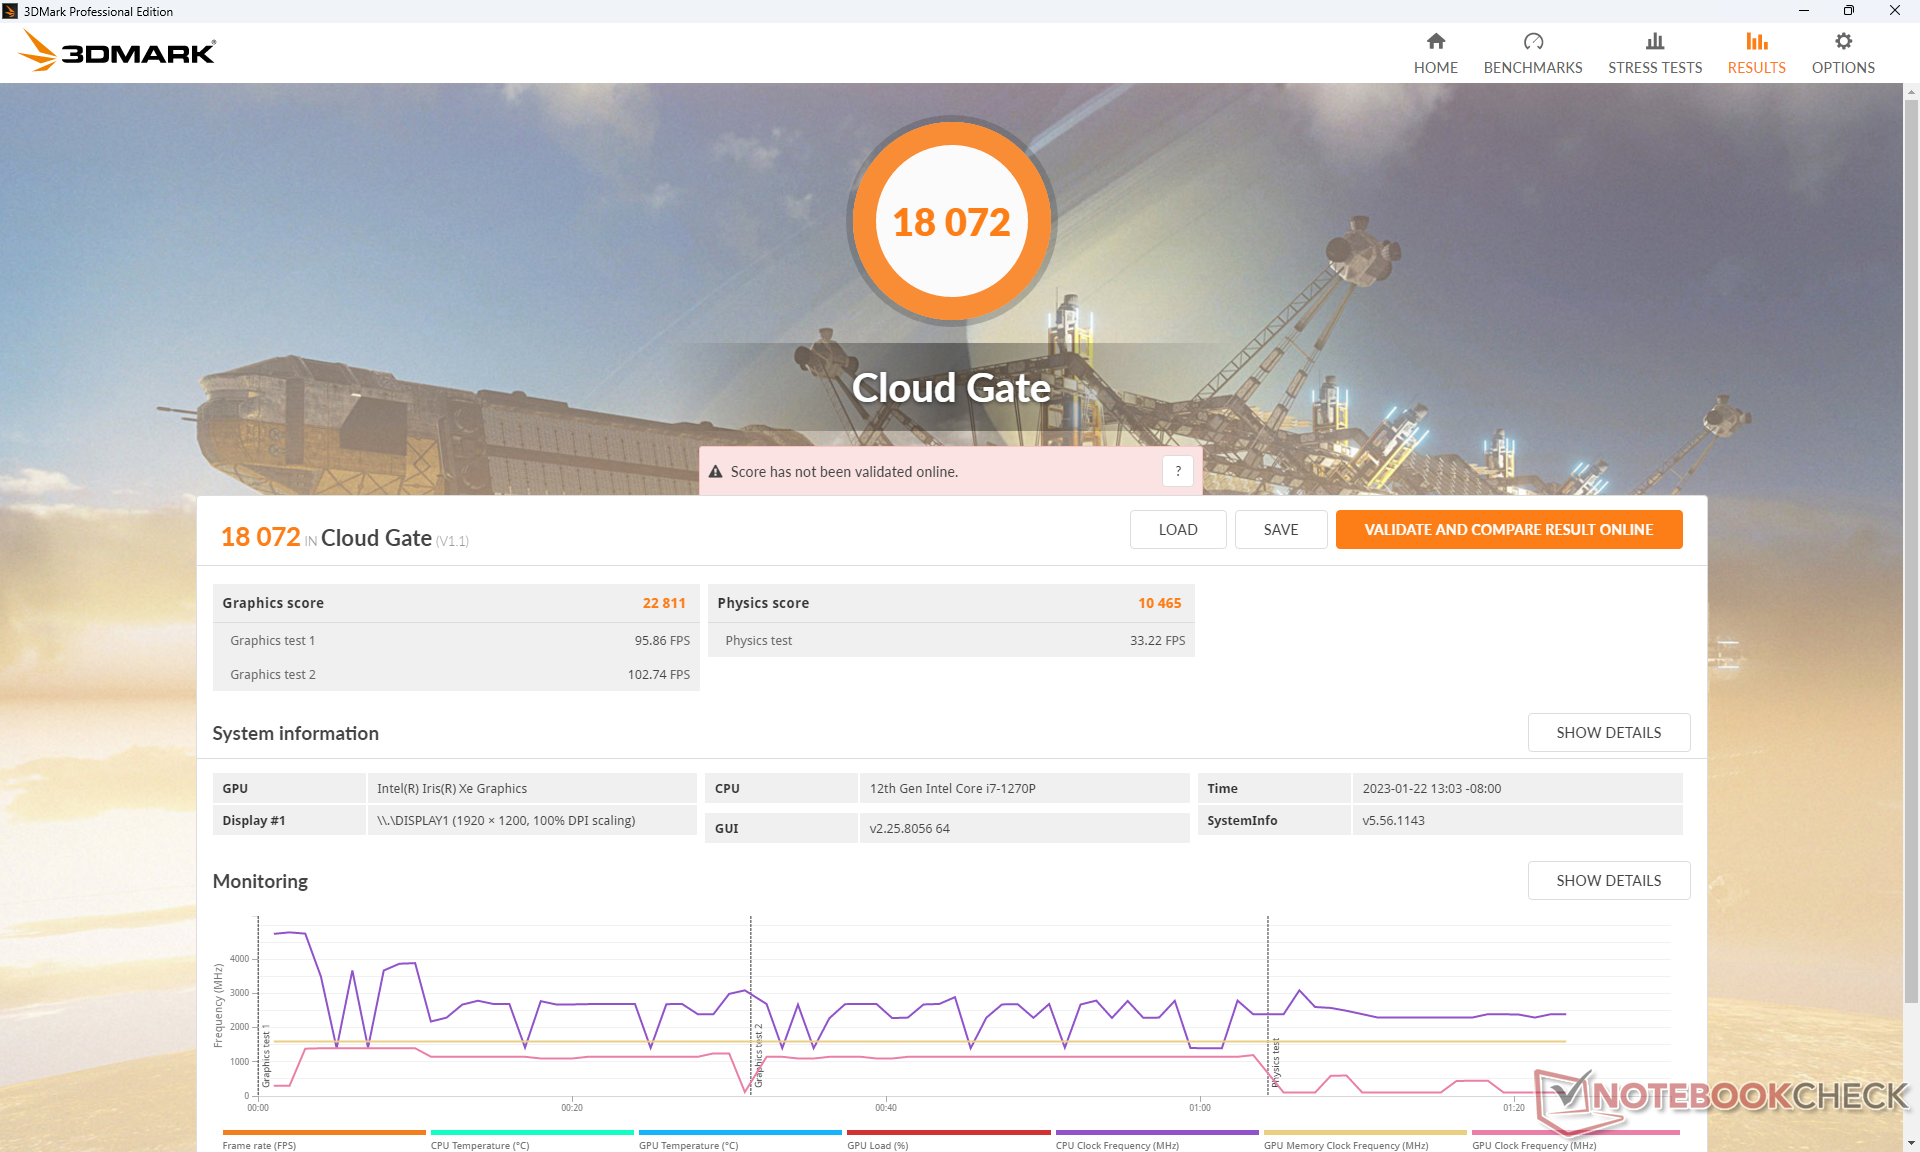
| 3DMark Cloud Gate Standard Score | 18072 punten | |
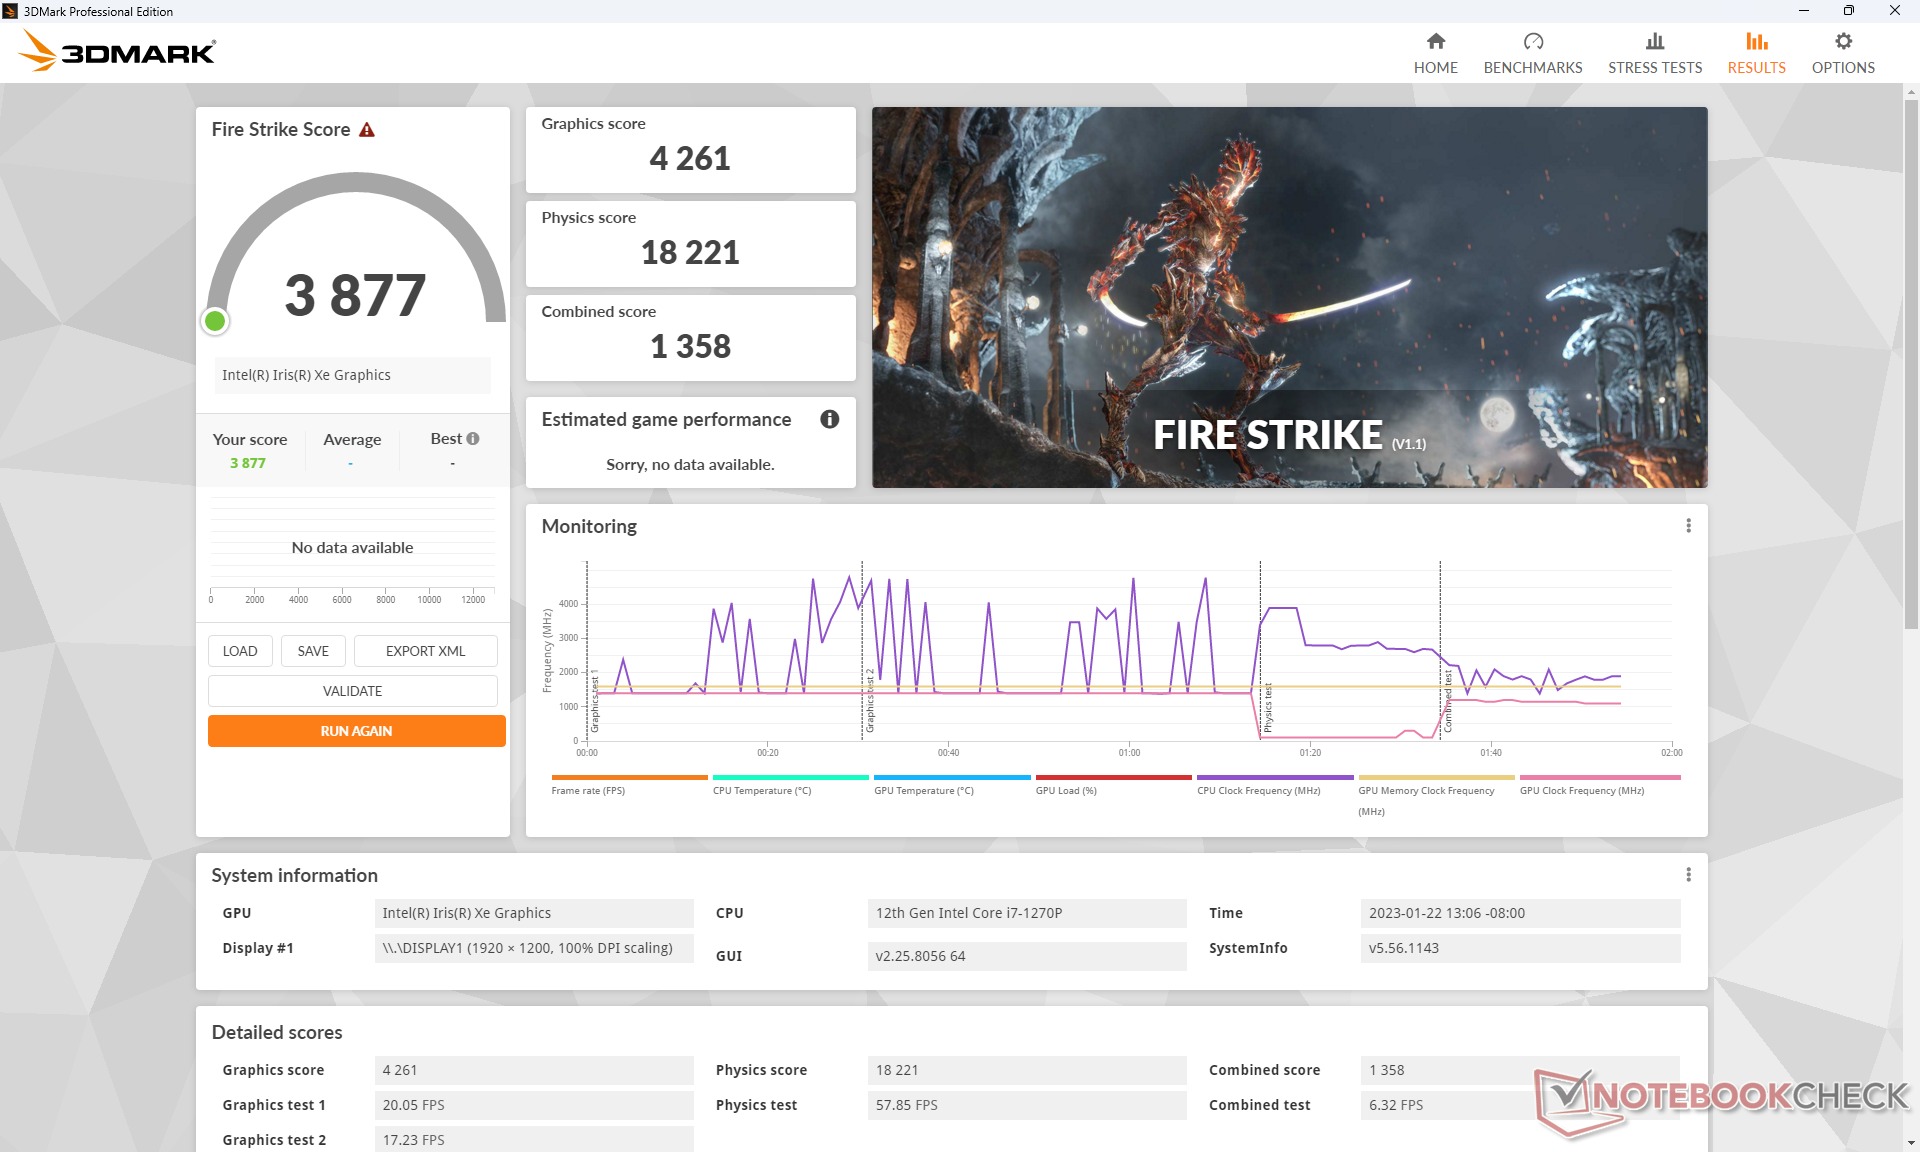
| 3DMark Fire Strike Score | 3877 punten | |
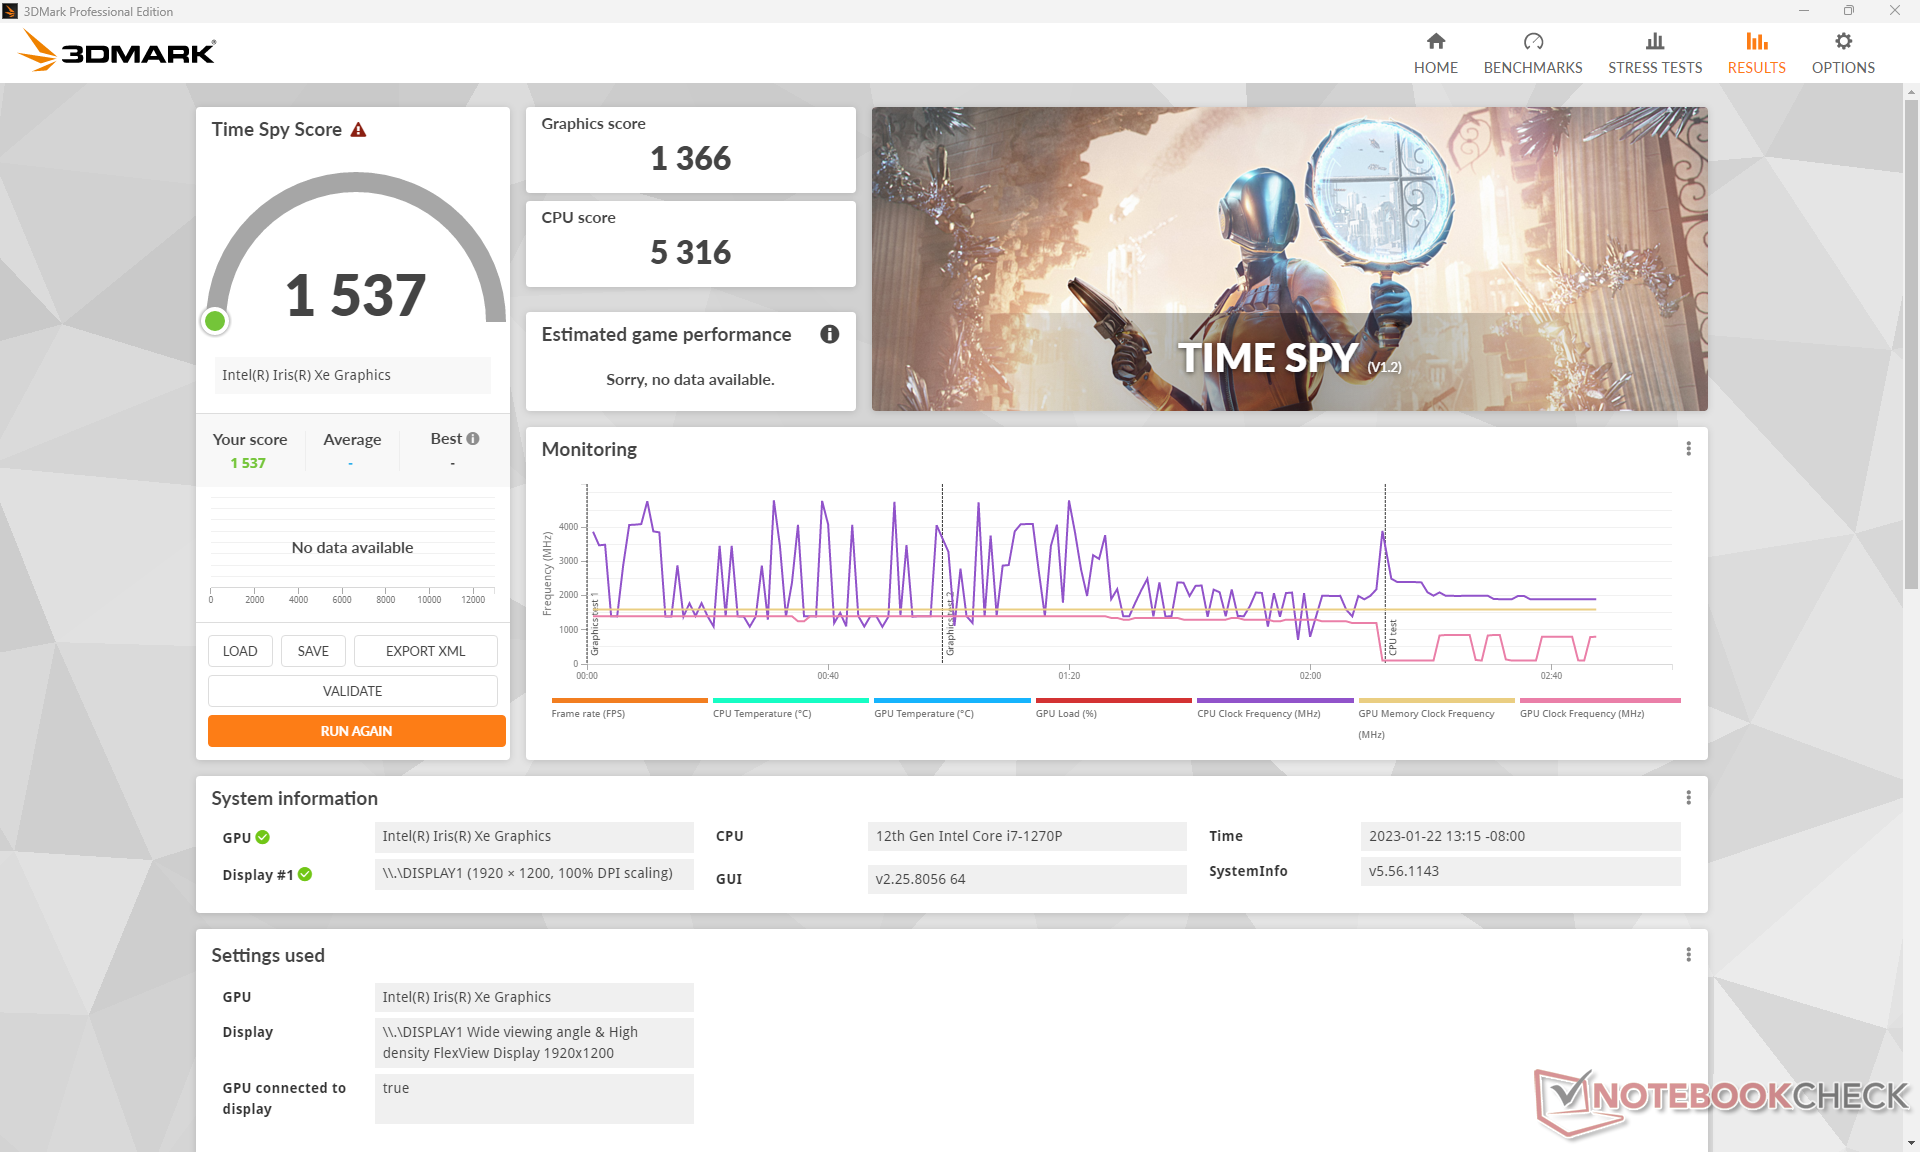
| 3DMark Time Spy Score | 1537 punten | |
Help | ||
| Cyberpunk 2077 1.6 - 1920x1080 Low Preset | |
| Lenovo Yoga 7-14ARB G7 | |
| Asus ZenBook Flip 15 Q508U | |
| Gemiddeld Intel Iris Xe Graphics G7 96EUs (13 - 25.9, n=42) | |
| Lenovo ThinkPad T16 Gen 1 Core i7-1270P | |
Witcher 3 FPS Chart
| lage | gem. | hoge | ultra | |
|---|---|---|---|---|
| GTA V (2015) | 97.8 | 74.8 | 14.1 | 4.85 |
| The Witcher 3 (2015) | 82.1 | 50.4 | 24.4 | 11.2 |
| Dota 2 Reborn (2015) | 110.6 | 71.9 | 48.9 | 44.6 |
| Final Fantasy XV Benchmark (2018) | 31.4 | 16.8 | 12.6 | |
| X-Plane 11.11 (2018) | 39.7 | 31.9 | 29.2 | |
| Strange Brigade (2018) | 79.2 | 29.8 | 24.2 | 19.1 |
| Cyberpunk 2077 1.6 (2022) | 18.4 |
Emissies
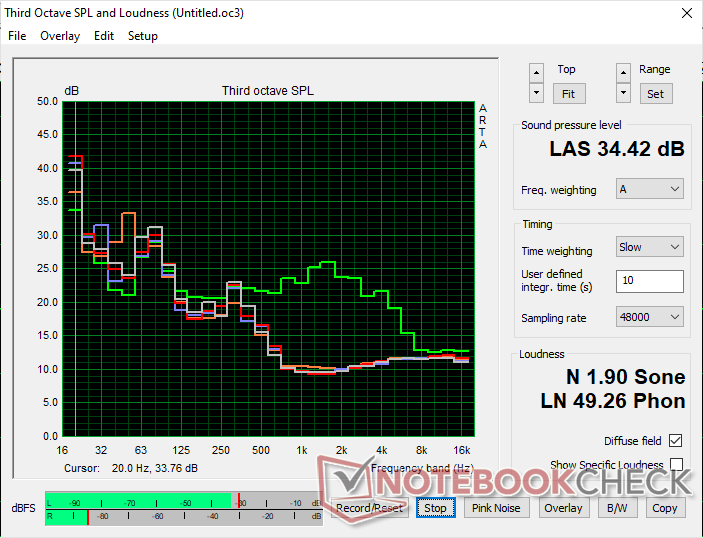
Systeemgeluid - bijna altijd stil
Het ventilatorgeluid is een van de stilste voor het schermformaat, wat gedeeltelijk de slechte prestatieduurzaamheid van de processor in de bovenstaande benchmarks verklaart. De interne ventilator is nauwelijks hoorbaar, zelfs als hij in de modus Prestaties staat en veeleisende belastingen zoals games draait. Hij kan af en toe gedurende korte periodes pulseren tot 34 dB(A) voordat hij terugkeert naar bijna stilte, maar zelfs dit maximum is stiller dan op de meeste laptops. DeHP EliteBook 865 G9 heeft een soortgelijke aanpak van het ventilatorgeluid voor een zeer stille gebruikerservaring. Er is weinig reden om een andere modus dan Prestaties te selecteren voor ventilator geluid controle als een resultaat.
Geluidsniveau
| Onbelast |
| 24.7 / 24.7 / 24.7 dB (A) |
| Belasting |
| 24.5 / 34.4 dB (A) |
 | ||
30 dB stil 40 dB(A) hoorbaar 50 dB(A) luid |
||
min: | ||
| Lenovo ThinkPad T16 Gen 1 Core i7-1270P Iris Xe G7 96EUs, i7-1270P, Samsung PM9B1 512GB MZAL4512HBLU | Lenovo ThinkPad T16 G1 21CH004MGE Radeon 660M, R5 PRO 6650U, Micron 2450 512GB MTFDKBA512TFK | LG Gram 16Z90Q Iris Xe G7 96EUs, i7-1260P, Samsung PM9A1 MZVL21T0HCLR | HP EliteBook 865 G9 Radeon 680M, R7 PRO 6850U, Samsung PM991 MZVLQ512HBLU | Huawei MateBook 16s i7 Iris Xe G7 96EUs, i7-12700H, Silicon Motion PCIe-8 SSD | Apple MacBook Pro 16 2021 M1 Pro M1 Pro 16-Core GPU, M1 Pro, Apple SSD AP1024R | |
|---|---|---|---|---|---|---|
| Noise | -6% | -21% | -1% | -15% | -3% | |
| uit / omgeving * (dB) | 24.7 | 23.1 6% | 25 -1% | 23 7% | 24 3% | 24.7 -0% |
| Idle Minimum * (dB) | 24.7 | 23.1 6% | 26 -5% | 23 7% | 24 3% | 24.7 -0% |
| Idle Average * (dB) | 24.7 | 23.1 6% | 27 -9% | 23 7% | 25.2 -2% | 24.7 -0% |
| Idle Maximum * (dB) | 24.7 | 23.1 6% | 28 -13% | 23 7% | 27.2 -10% | 24.7 -0% |
| Load Average * (dB) | 24.5 | 25.4 -4% | 38 -55% | 29.1 -19% | 34.8 -42% | 26.1 -7% |
| Witcher 3 ultra * (dB) | 24.3 | 35.93 -48% | 37 -52% | 29.1 -20% | 34.8 -43% | |
| Load Maximum * (dB) | 34.4 | 39.1 -14% | 38 -10% | 32.9 4% | 39 -13% | 37.4 -9% |
* ... kleiner is beter
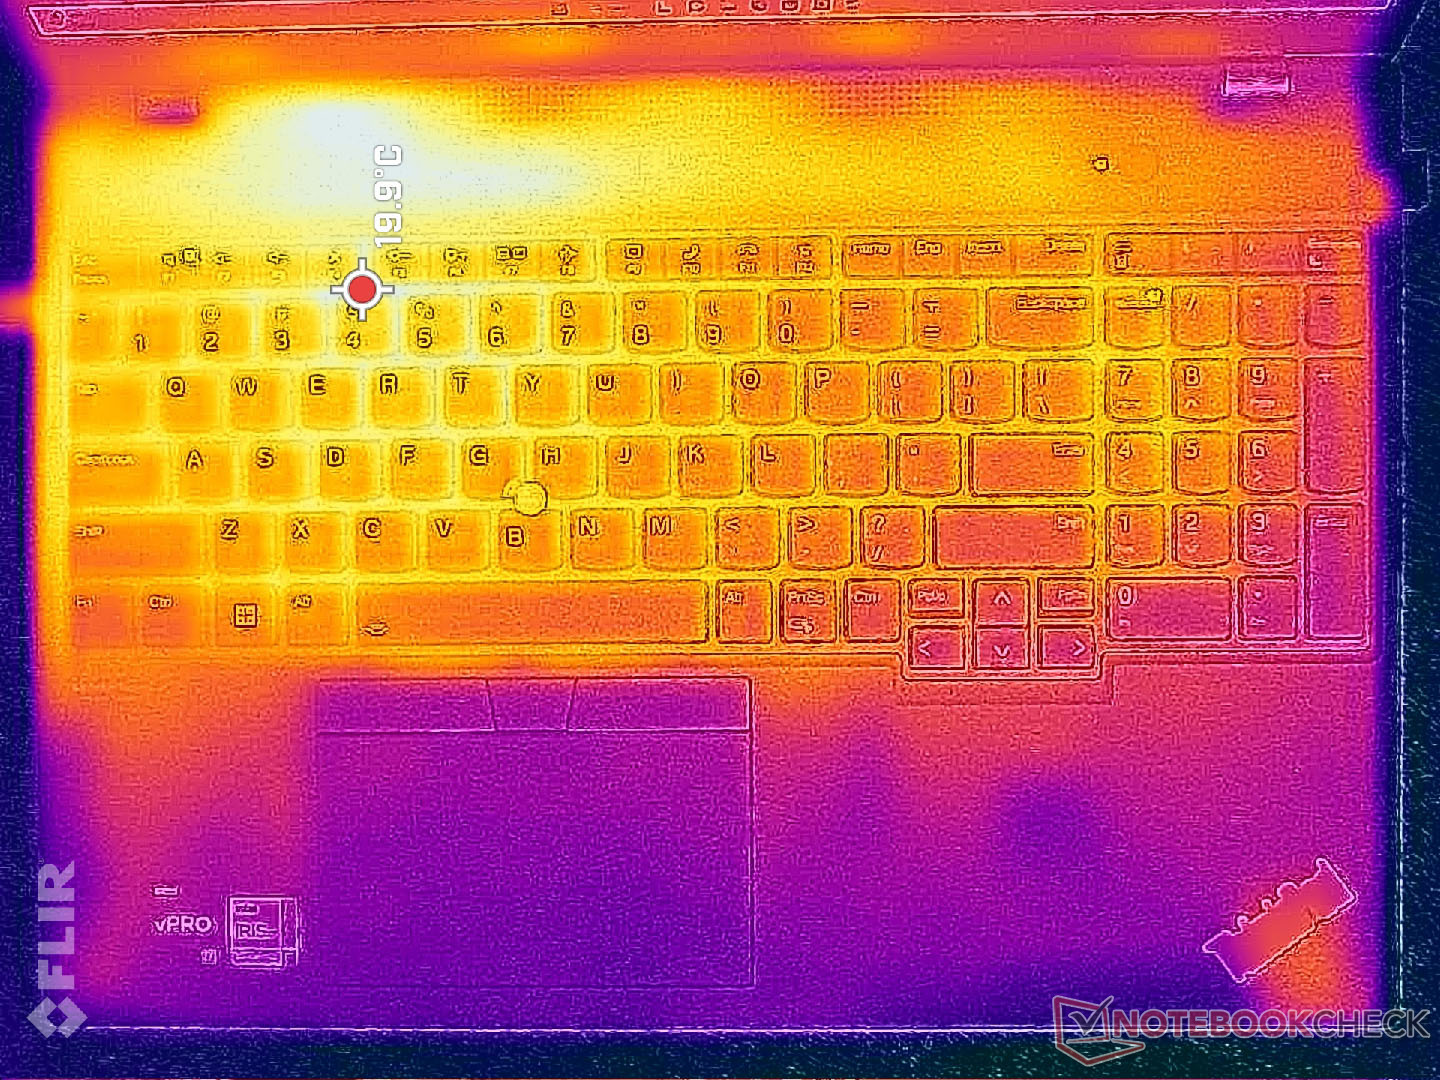
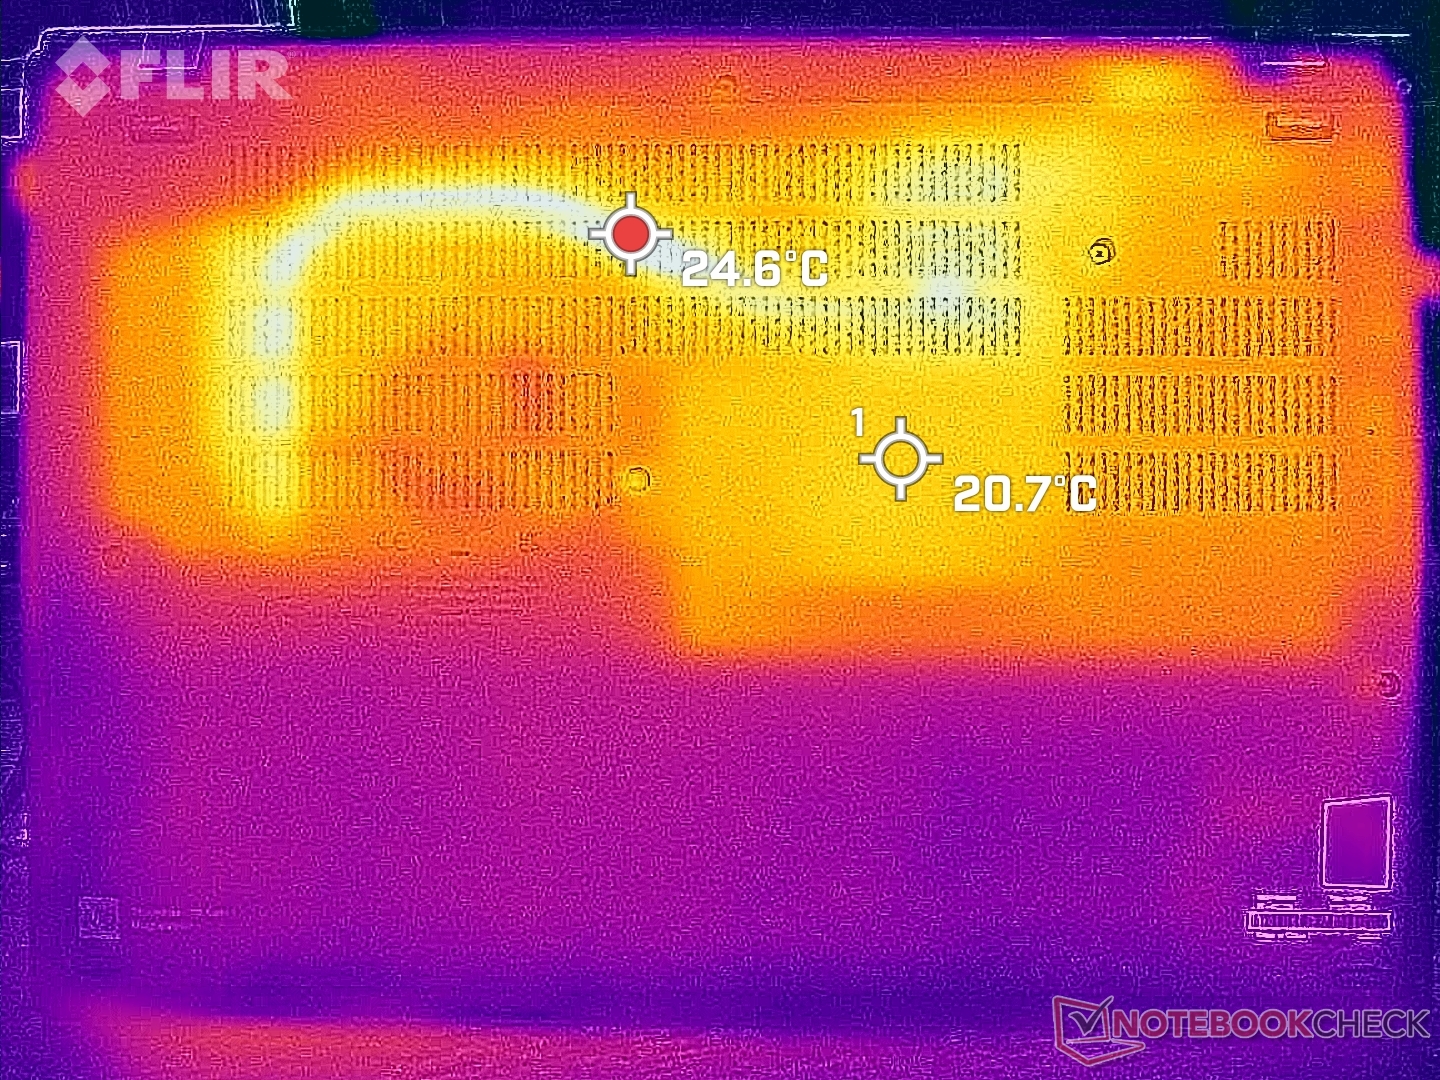
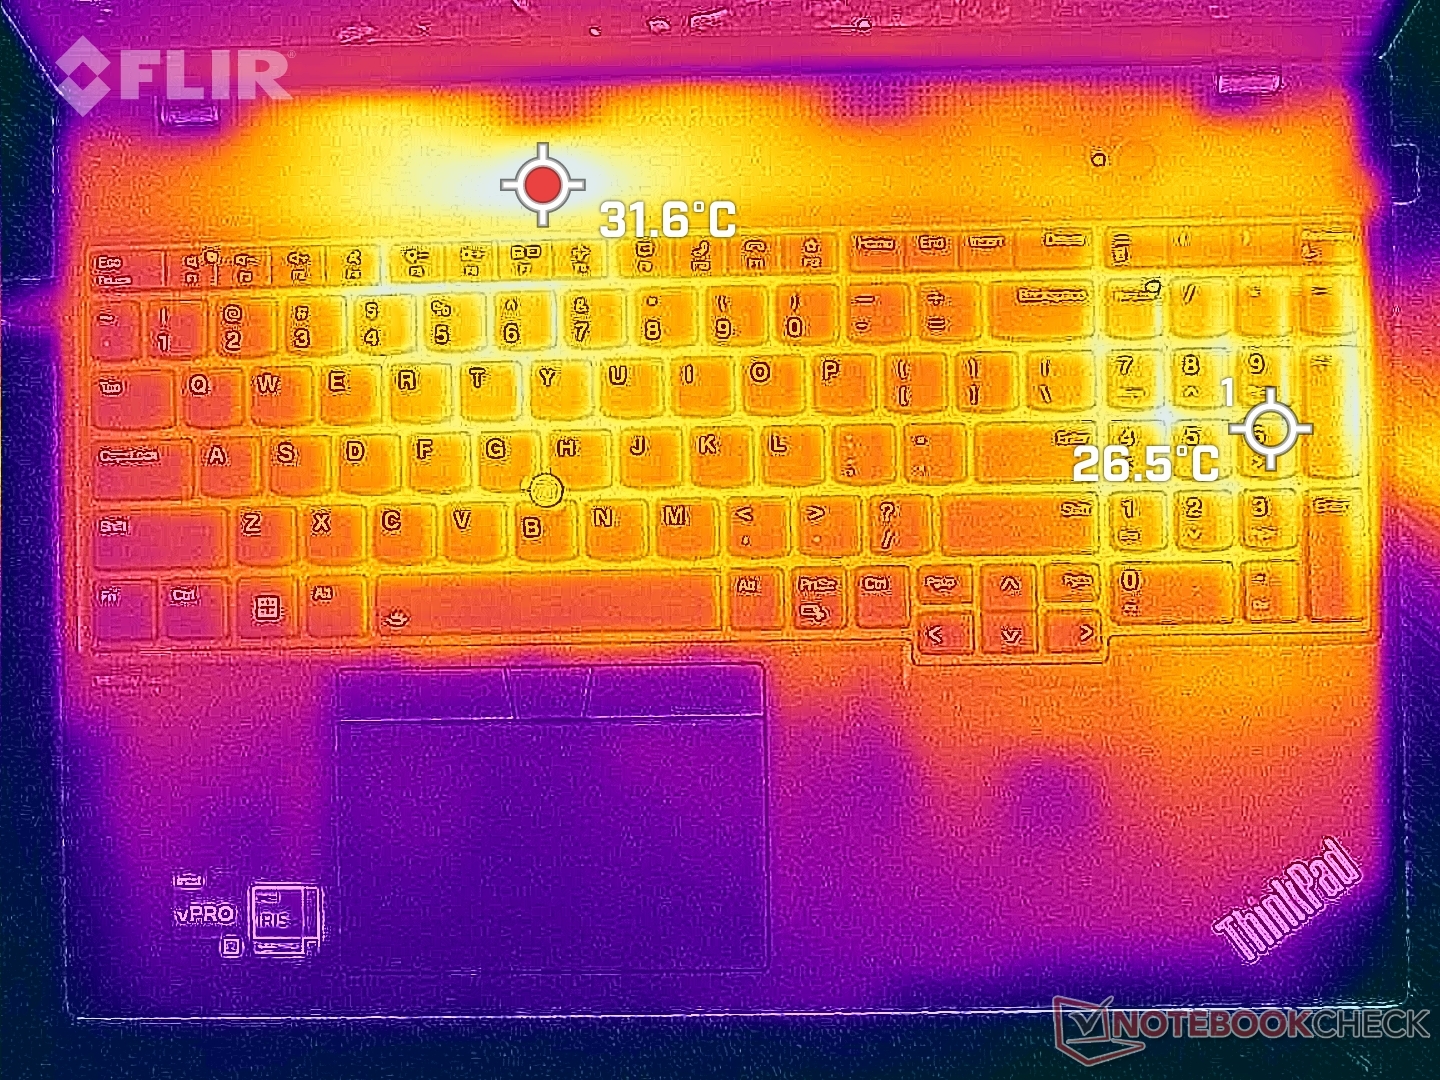
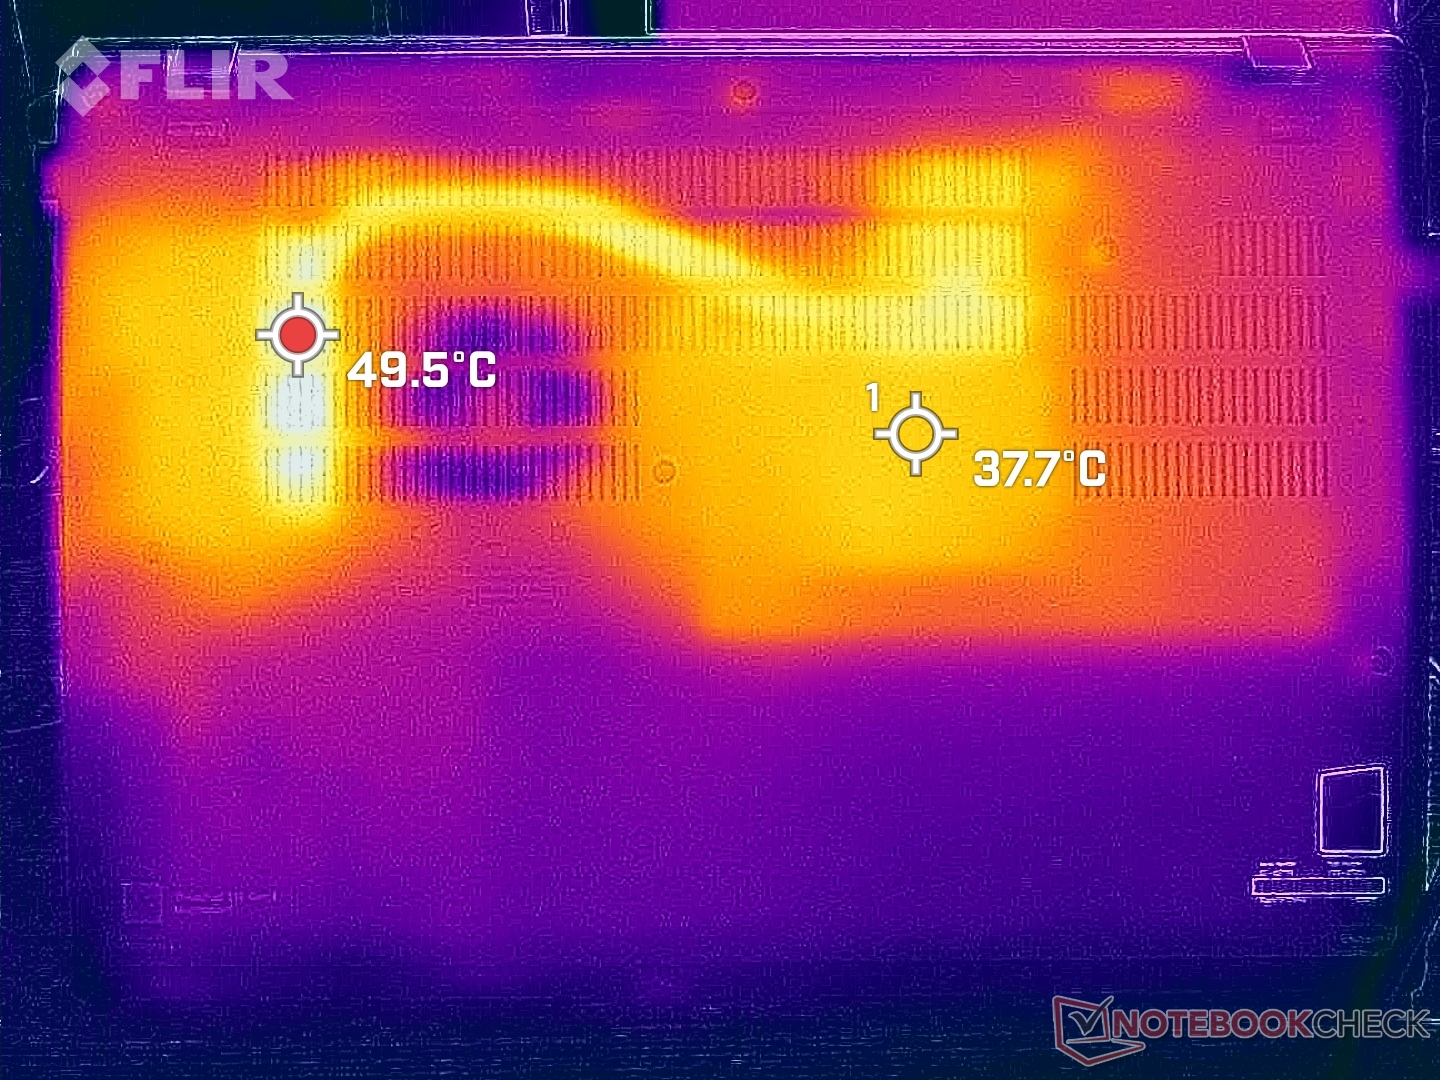
Temperatuur
De oppervlaktetemperaturen zijn veel koeler op het bovendek dan op de onderkant. De gemiddelde temperatuur op het toetsenbord en de palmsteunen is ongeveer 29 C bij zware belasting, vergeleken met 36 C aan de onderkant. Dit in tegenstelling tot de meeste andere laptops zoals de LG Gram 16 waar het midden van het toetsenbord 44 C kan bereiken en dus meer dan 10 C warmer is dan op onze ThinkPad T16 G1.

(+) De maximumtemperatuur aan de bovenzijde bedraagt 33.8 °C / 93 F, vergeleken met het gemiddelde van 34.3 °C / 94 F, variërend van 21.2 tot 62.5 °C voor de klasse Office.
(-) De bodem warmt op tot een maximum van 47 °C / 117 F, vergeleken met een gemiddelde van 36.8 °C / 98 F
(+) Bij onbelast gebruik bedraagt de gemiddelde temperatuur voor de bovenzijde 22.6 °C / 73 F, vergeleken met het apparaatgemiddelde van 29.5 °C / 85 F.
(+) De palmsteunen en het touchpad zijn met een maximum van ###max## °C / 76.3 F koeler dan de huidtemperatuur en voelen daarom koel aan.
(+) De gemiddelde temperatuur van de handpalmsteun van soortgelijke toestellen bedroeg 27.5 °C / 81.5 F (+2.9 °C / 5.2 F).
| Lenovo ThinkPad T16 Gen 1 Core i7-1270P Intel Core i7-1270P, Intel Iris Xe Graphics G7 96EUs | Lenovo ThinkPad T16 G1 21BWS00200 Intel Core i5-1240P, Intel Iris Xe Graphics G7 80EUs | LG Gram 16Z90Q Intel Core i7-1260P, Intel Iris Xe Graphics G7 96EUs | HP EliteBook 865 G9 AMD Ryzen 7 PRO 6850U, AMD Radeon 680M | Huawei MateBook 16s i7 Intel Core i7-12700H, Intel Iris Xe Graphics G7 96EUs | Apple MacBook Pro 16 2021 M1 Pro Apple M1 Pro, Apple M1 Pro 16-Core GPU | |
|---|---|---|---|---|---|---|
| Heat | -19% | -6% | 0% | -13% | 3% | |
| Maximum Upper Side * (°C) | 33.8 | 45 -33% | 45 -33% | 39.4 -17% | 40.9 -21% | 41 -21% |
| Maximum Bottom * (°C) | 47 | 42.8 9% | 43 9% | 47.6 -1% | 48.3 -3% | 39 17% |
| Idle Upper Side * (°C) | 24.6 | 33 -34% | 26 -6% | 23.6 4% | 29.2 -19% | 24 2% |
| Idle Bottom * (°C) | 28.2 | 33.6 -19% | 26 8% | 24.1 15% | 30.4 -8% | 24 15% |
* ... kleiner is beter
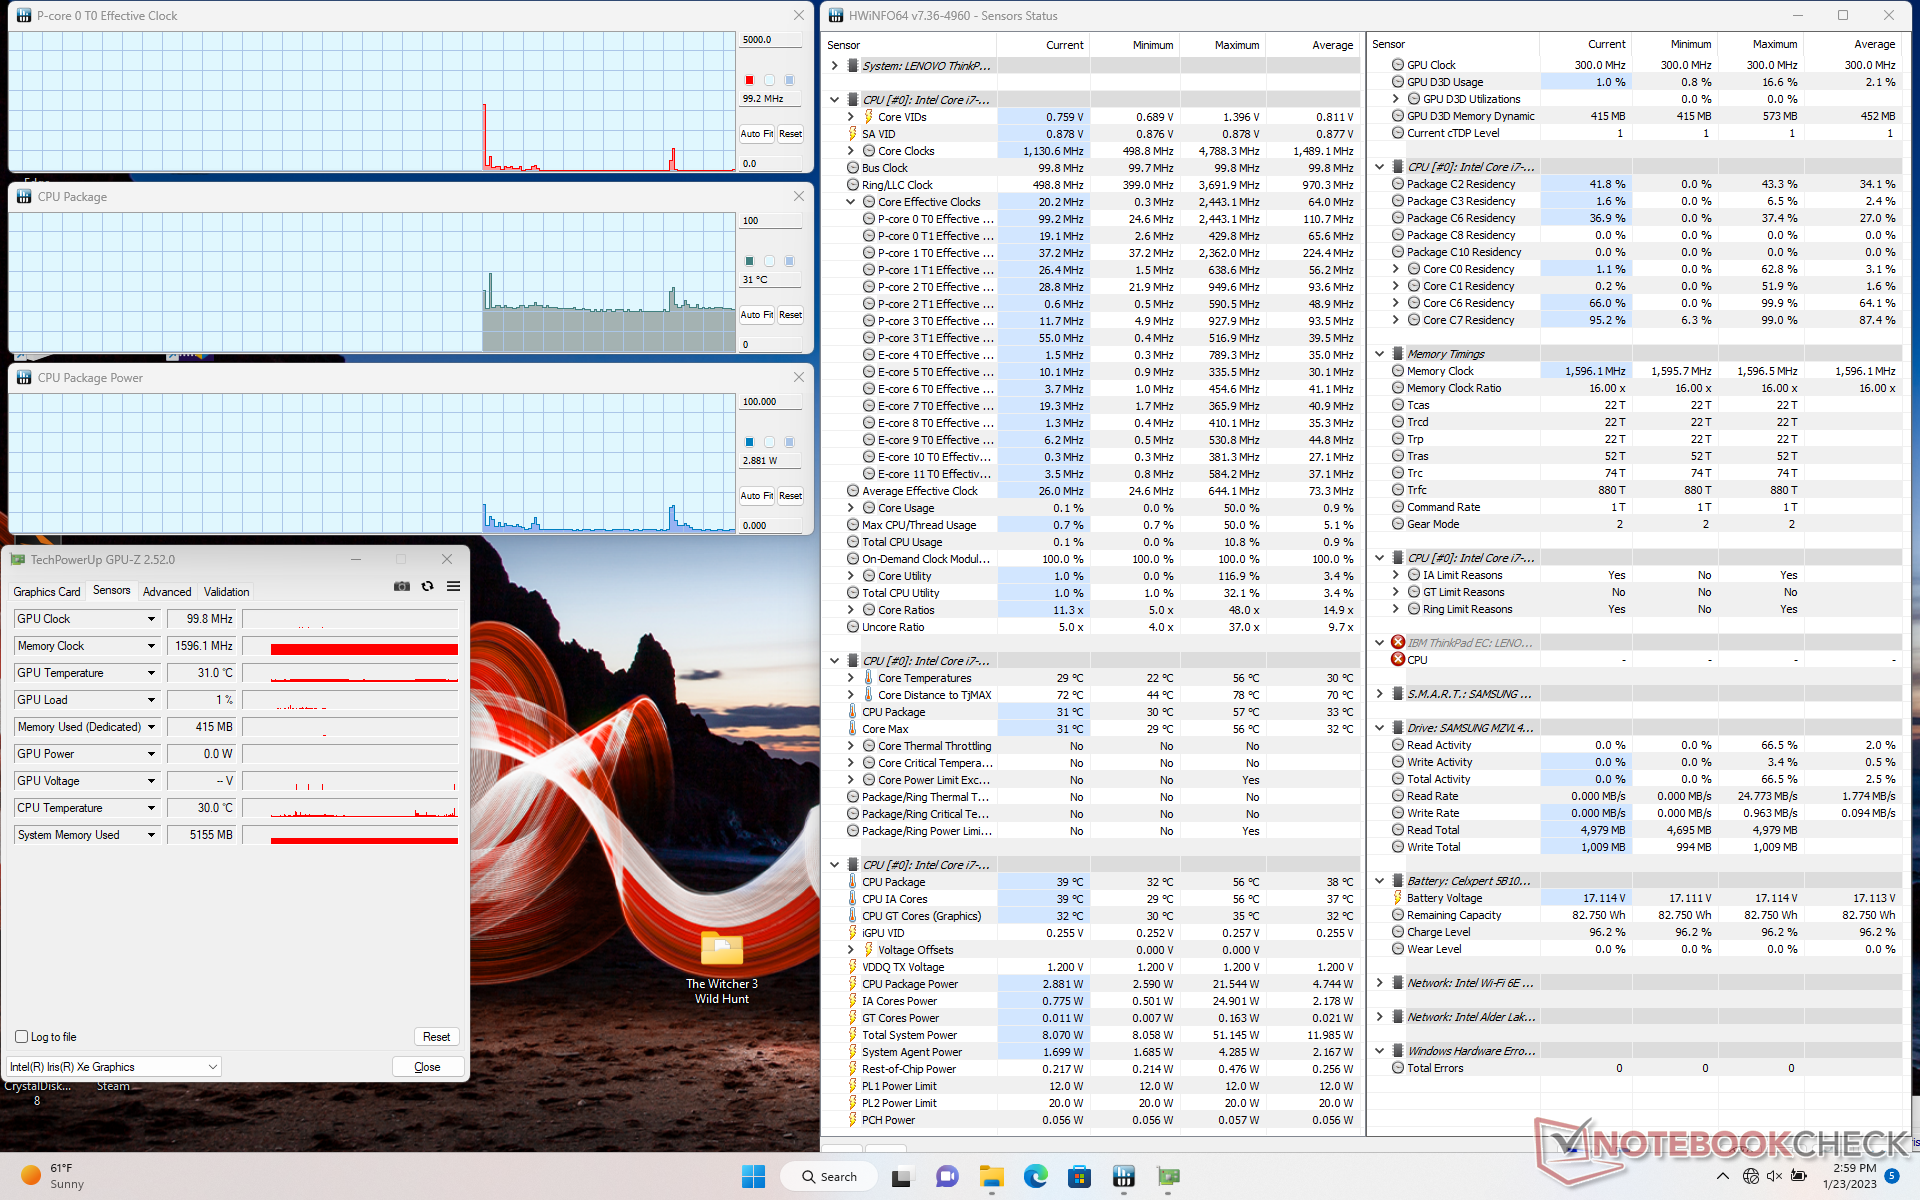
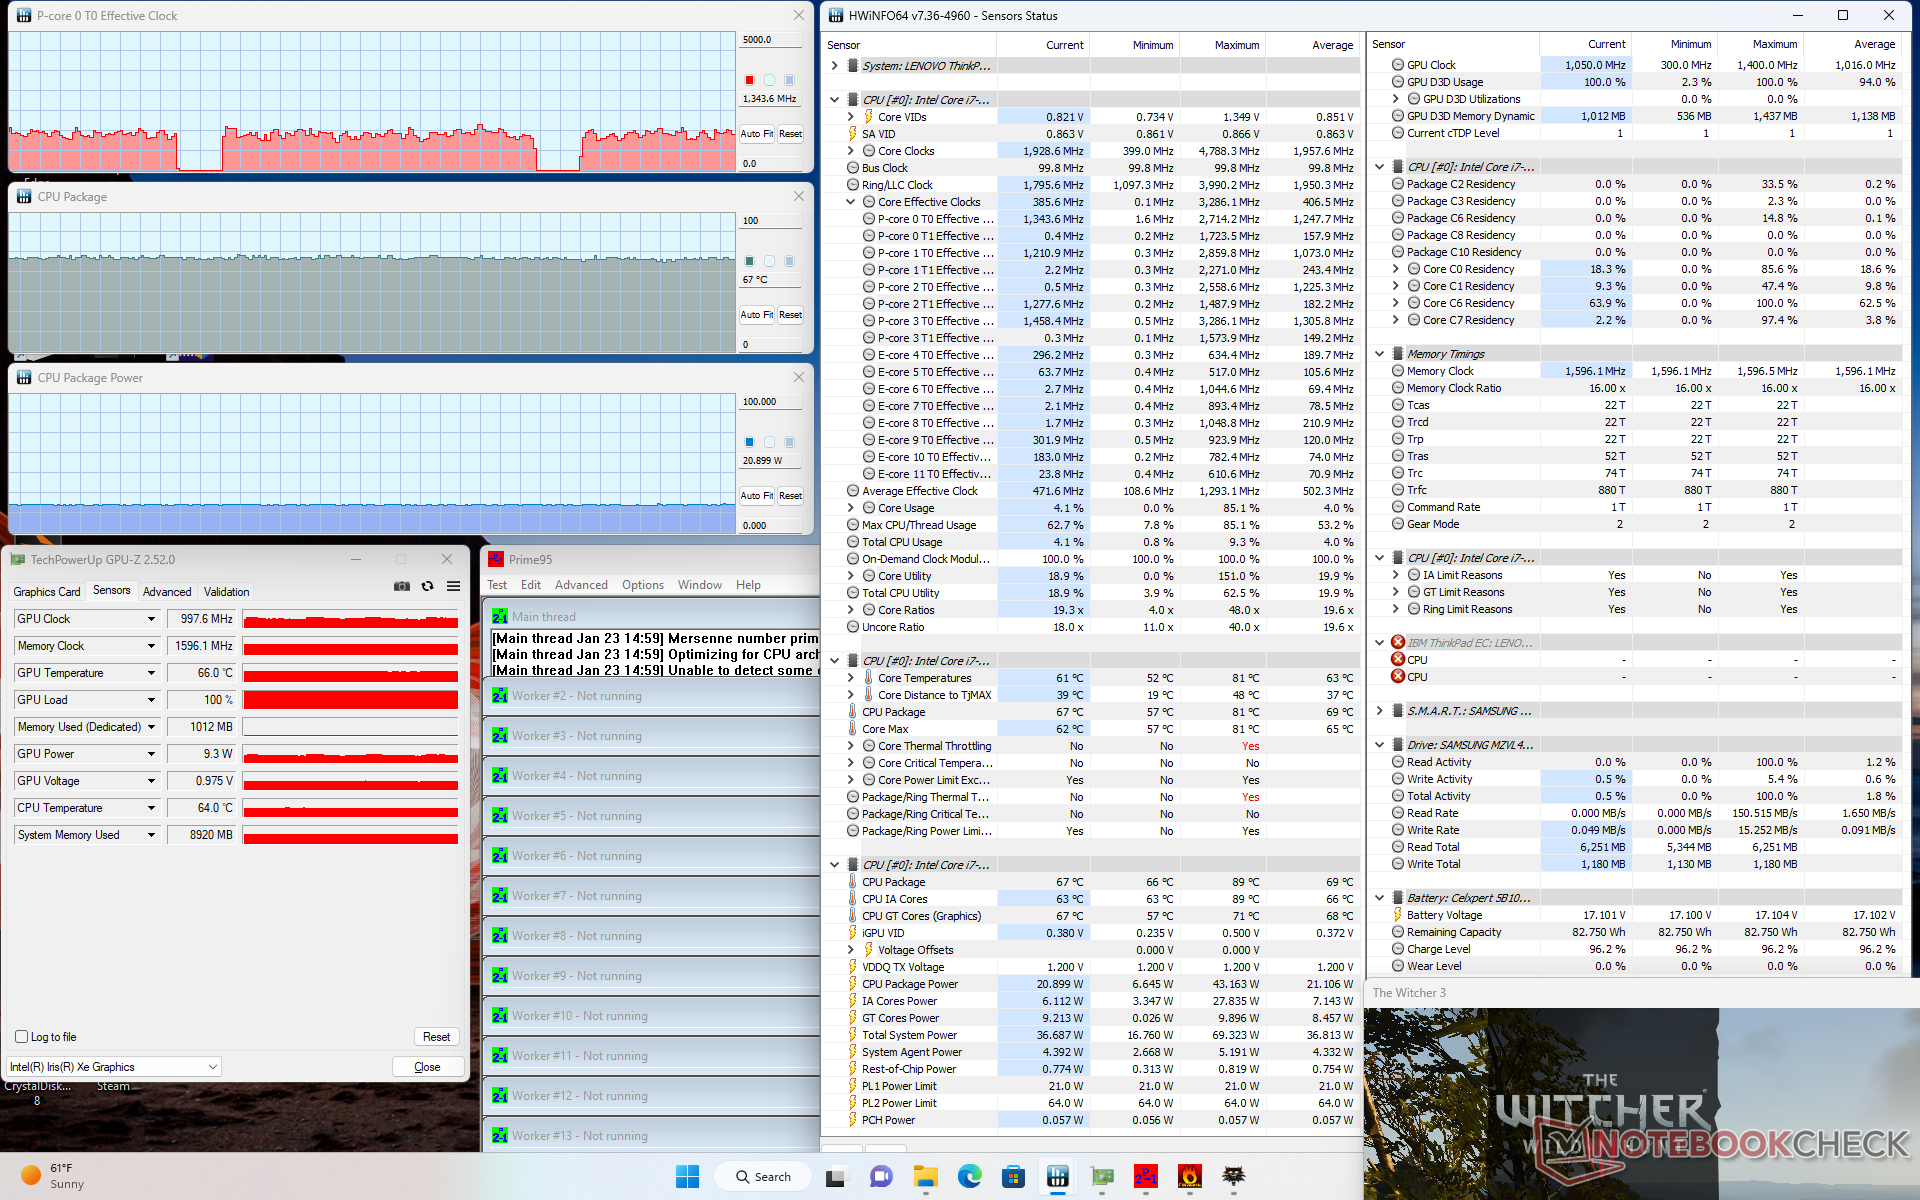
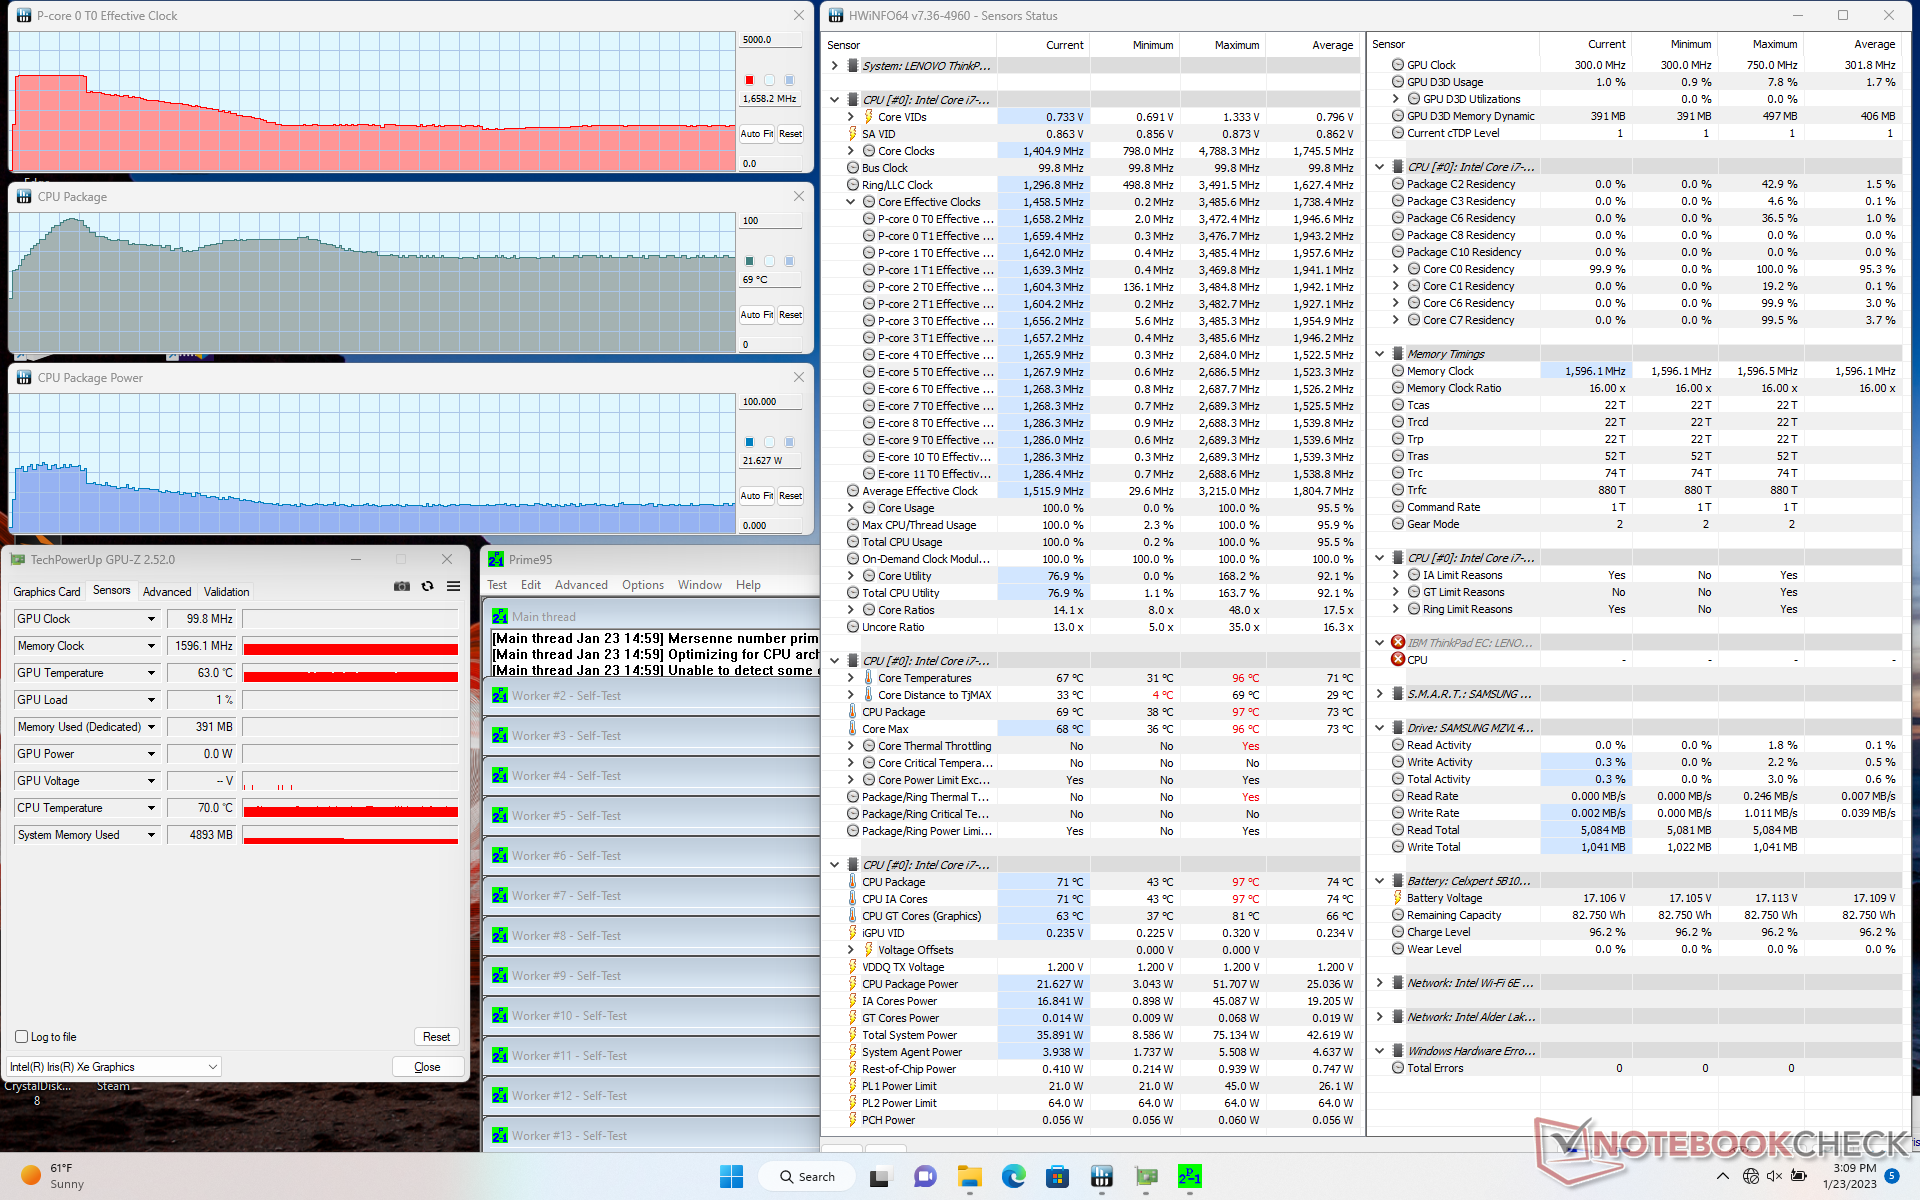
Stresstest
De sterke prestatiedalingen tijdens onze Witcher 3 en CineBench R15 xT loop tests hierboven kunnen worden waargenomen via HWiNFO. Wanneer bijvoorbeeld Prime95 wordt uitgevoerd, stijgen de CPU kloksnelheden en het opgenomen vermogen tot respectievelijk 3,5 GHz en 48 W. Zodra de kerntemperatuur een paar seconden later 97 C bereikt, beginnen de kloksnelheden en het opgenomen vermogen op het bord echter gestaag te dalen tot respectievelijk 1,7 GHz en 22 W, om een koelere kerntemperatuur van 69 C aan te houden.
GPU-kloksnelheid en -temperatuur tijdens het draaien Witcher 3 zouden zich stabiliseren op respectievelijk 998 MHz en 67 C, vergeleken met 1100 MHz en 58 C op de kleinere HP Dragonfly Folio 13.5 G3. Werken op de batterij lijkt de prestaties niet te beïnvloeden.
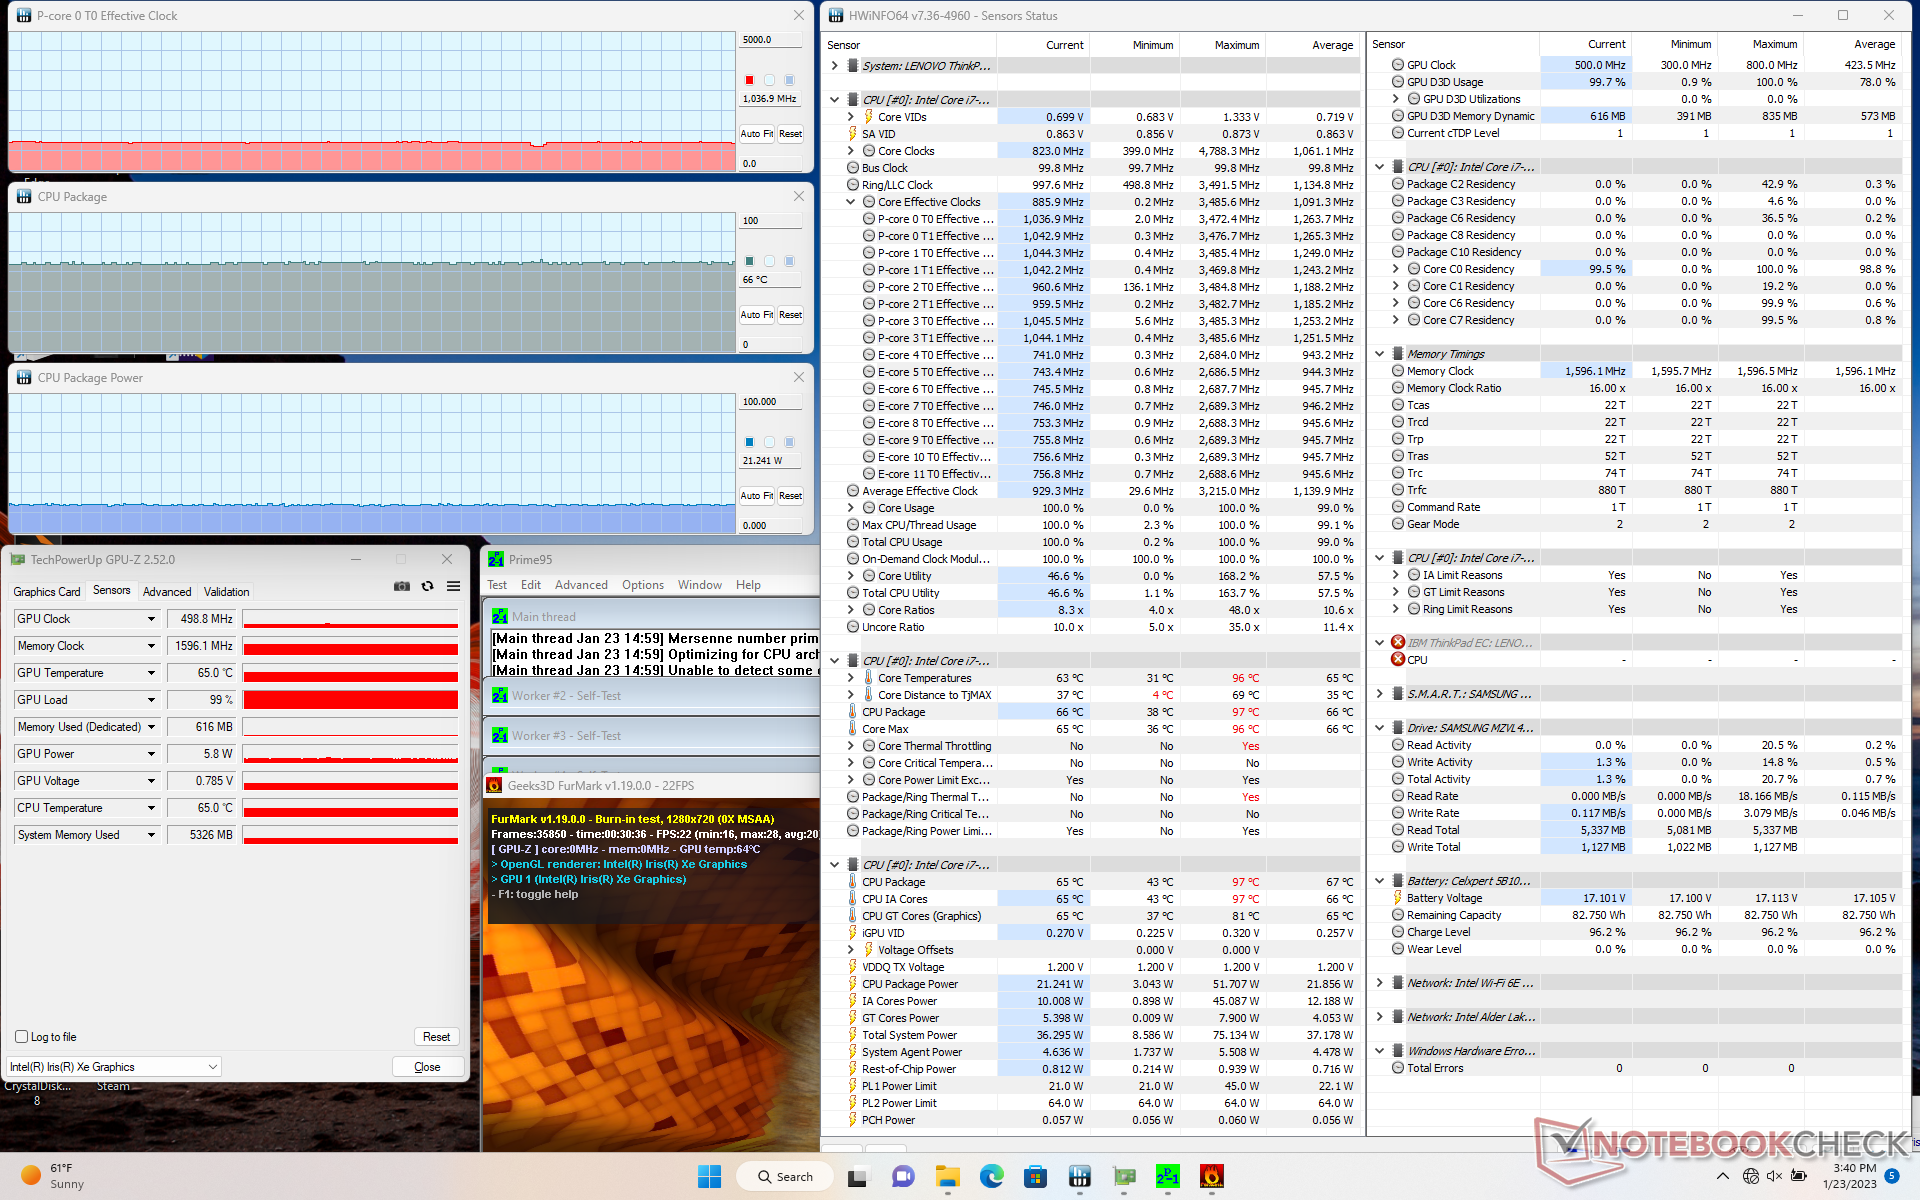
| CPU Klok (GHz) | GPU Klok (MHz) | Gemiddelde CPU Temperatuur (°C) | |
| Systeem Idle | -- | -- | 31 |
| Prime95 Stress | 1.7 | -- | 69 |
| Prime95 + FurMark Stress | 1.0 | 499 | 66 |
| Witcher 3 Stress | ~1.3 | 998 | 67 |
Luidsprekers
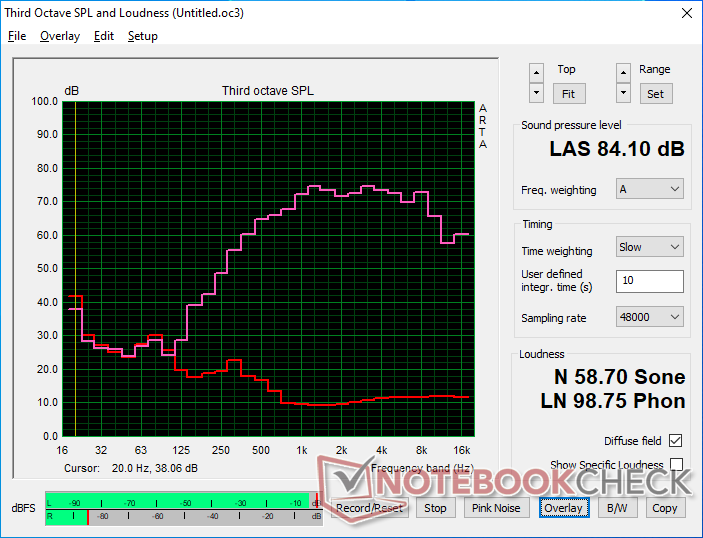
Lenovo ThinkPad T16 Gen 1 Core i7-1270P audioanalyse
(+) | luidsprekers kunnen relatief luid spelen (84.1 dB)
Bas 100 - 315 Hz
(-) | bijna geen lage tonen - gemiddeld 26.3% lager dan de mediaan
(±) | lineariteit van de lage tonen is gemiddeld (11.1% delta ten opzichte van de vorige frequentie)
Midden 400 - 2000 Hz
(+) | evenwichtige middens - slechts 4.5% verwijderd van de mediaan
(+) | de middentonen zijn lineair (5.1% delta ten opzichte van de vorige frequentie)
Hoog 2 - 16 kHz
(±) | higher highs - on average 5.8% higher than median
(+) | de hoge tonen zijn lineair (4.8% delta naar de vorige frequentie)
Algemeen 100 - 16.000 Hz
(±) | lineariteit van het totale geluid is gemiddeld (20.1% verschil met de mediaan)
Vergeleken met dezelfde klasse
» 43% van alle geteste apparaten in deze klasse waren beter, 10% vergelijkbaar, 47% slechter
» De beste had een delta van 7%, het gemiddelde was 21%, de slechtste was 53%
Vergeleken met alle geteste toestellen
» 52% van alle geteste apparaten waren beter, 8% gelijk, 40% slechter
» De beste had een delta van 4%, het gemiddelde was 23%, de slechtste was 134%
Apple MacBook Pro 16 2021 M1 Pro audioanalyse
(+) | luidsprekers kunnen relatief luid spelen (84.7 dB)
Bas 100 - 315 Hz
(+) | goede baars - slechts 3.8% verwijderd van de mediaan
(+) | de lage tonen zijn lineair (5.2% delta naar de vorige frequentie)
Midden 400 - 2000 Hz
(+) | evenwichtige middens - slechts 1.3% verwijderd van de mediaan
(+) | de middentonen zijn lineair (2.1% delta ten opzichte van de vorige frequentie)
Hoog 2 - 16 kHz
(+) | evenwichtige hoogtepunten - slechts 1.9% verwijderd van de mediaan
(+) | de hoge tonen zijn lineair (2.7% delta naar de vorige frequentie)
Algemeen 100 - 16.000 Hz
(+) | het totale geluid is lineair (4.6% verschil met de mediaan)
Vergeleken met dezelfde klasse
» 0% van alle geteste apparaten in deze klasse waren beter, 0% vergelijkbaar, 100% slechter
» De beste had een delta van 5%, het gemiddelde was 17%, de slechtste was 45%
Vergeleken met alle geteste toestellen
» 0% van alle geteste apparaten waren beter, 0% gelijk, 100% slechter
» De beste had een delta van 4%, het gemiddelde was 23%, de slechtste was 134%
Energiebeheer
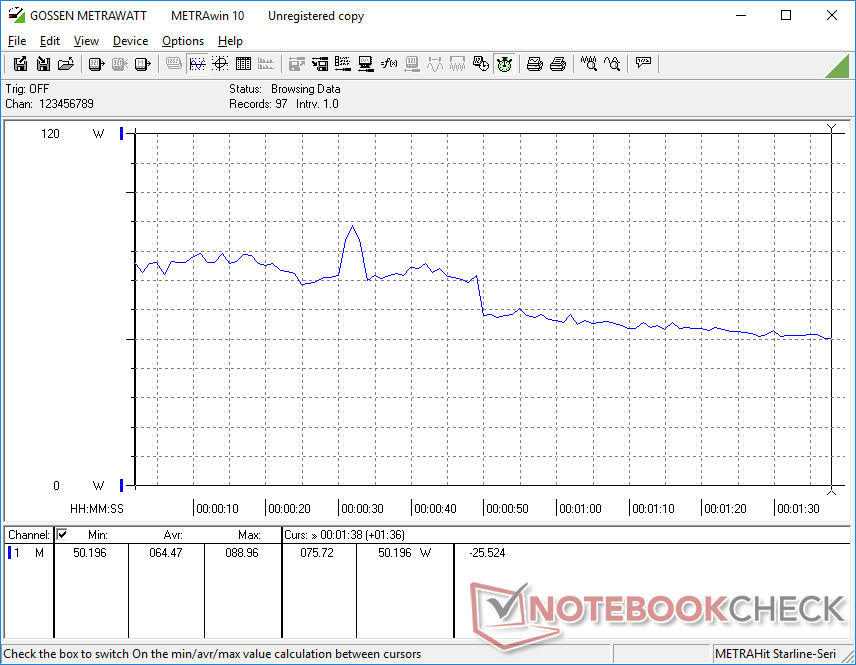
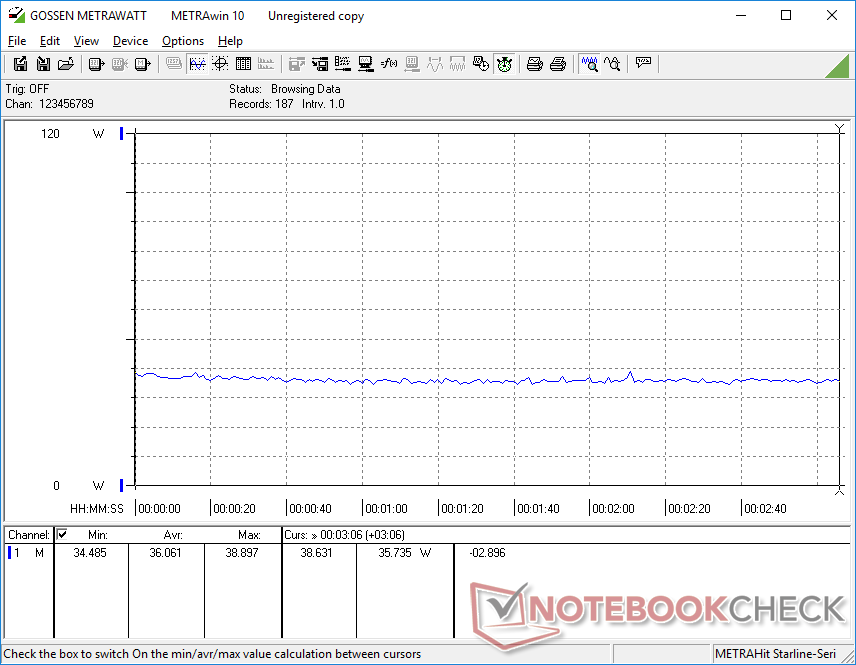
Stroomverbruik
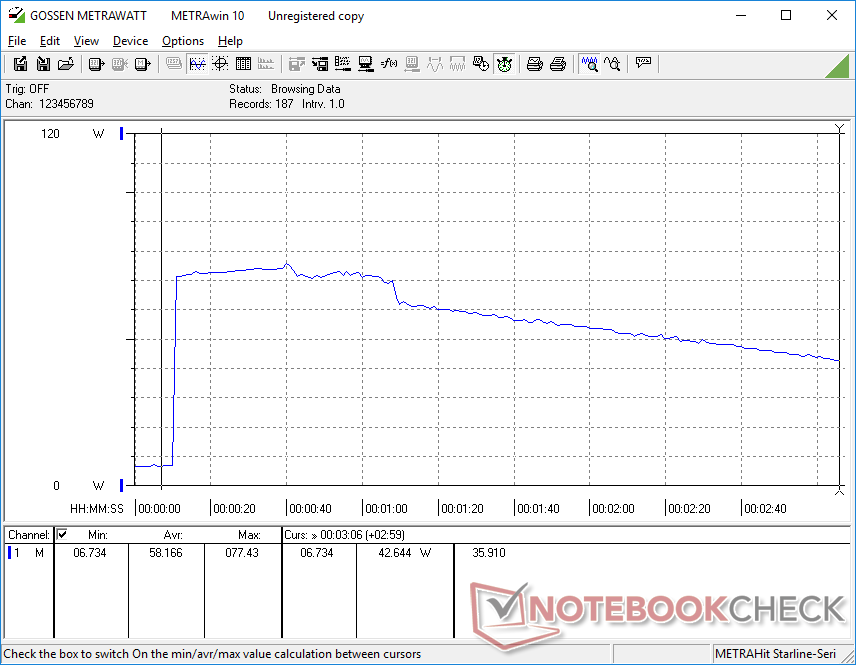
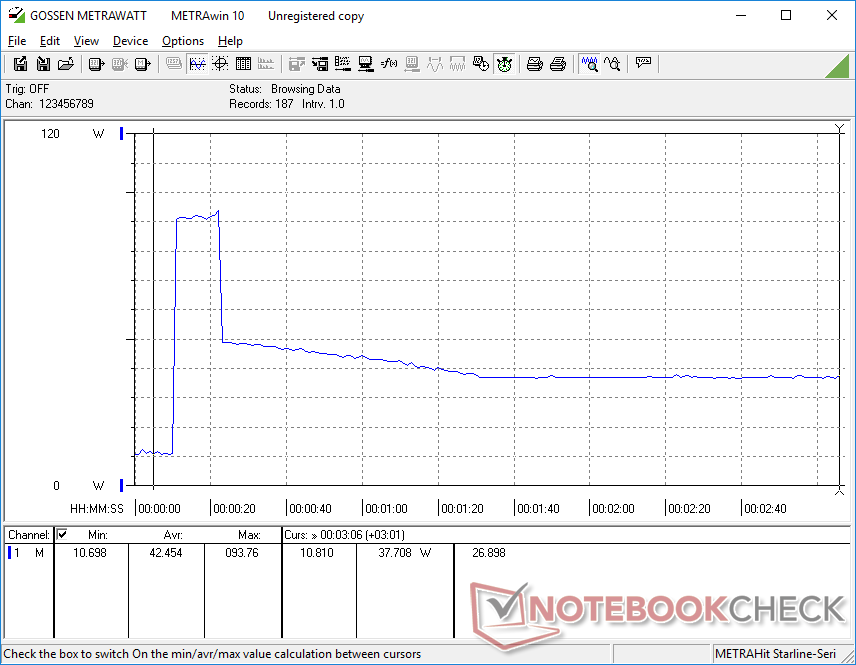
Het stroomverbruik bij hogere belasting weerspiegelt onze bovenstaande waarnemingen over kloksnelheid en prestaties. Namelijk, het kan hoog zijn tijdens de eerste momenten van belasting alvorens af te nemen naar lagere niveaus als gevolg van prestatiebeperking. Wanneer bijvoorbeeld Prime95 wordt uitgevoerd, is het verbruik gedurende ongeveer 60 seconden hoog met ongeveer 77 W, voordat het na verloop van tijd daalt tot 42 W of lager. Dit gebeurde zelfs in de modus High Performance.
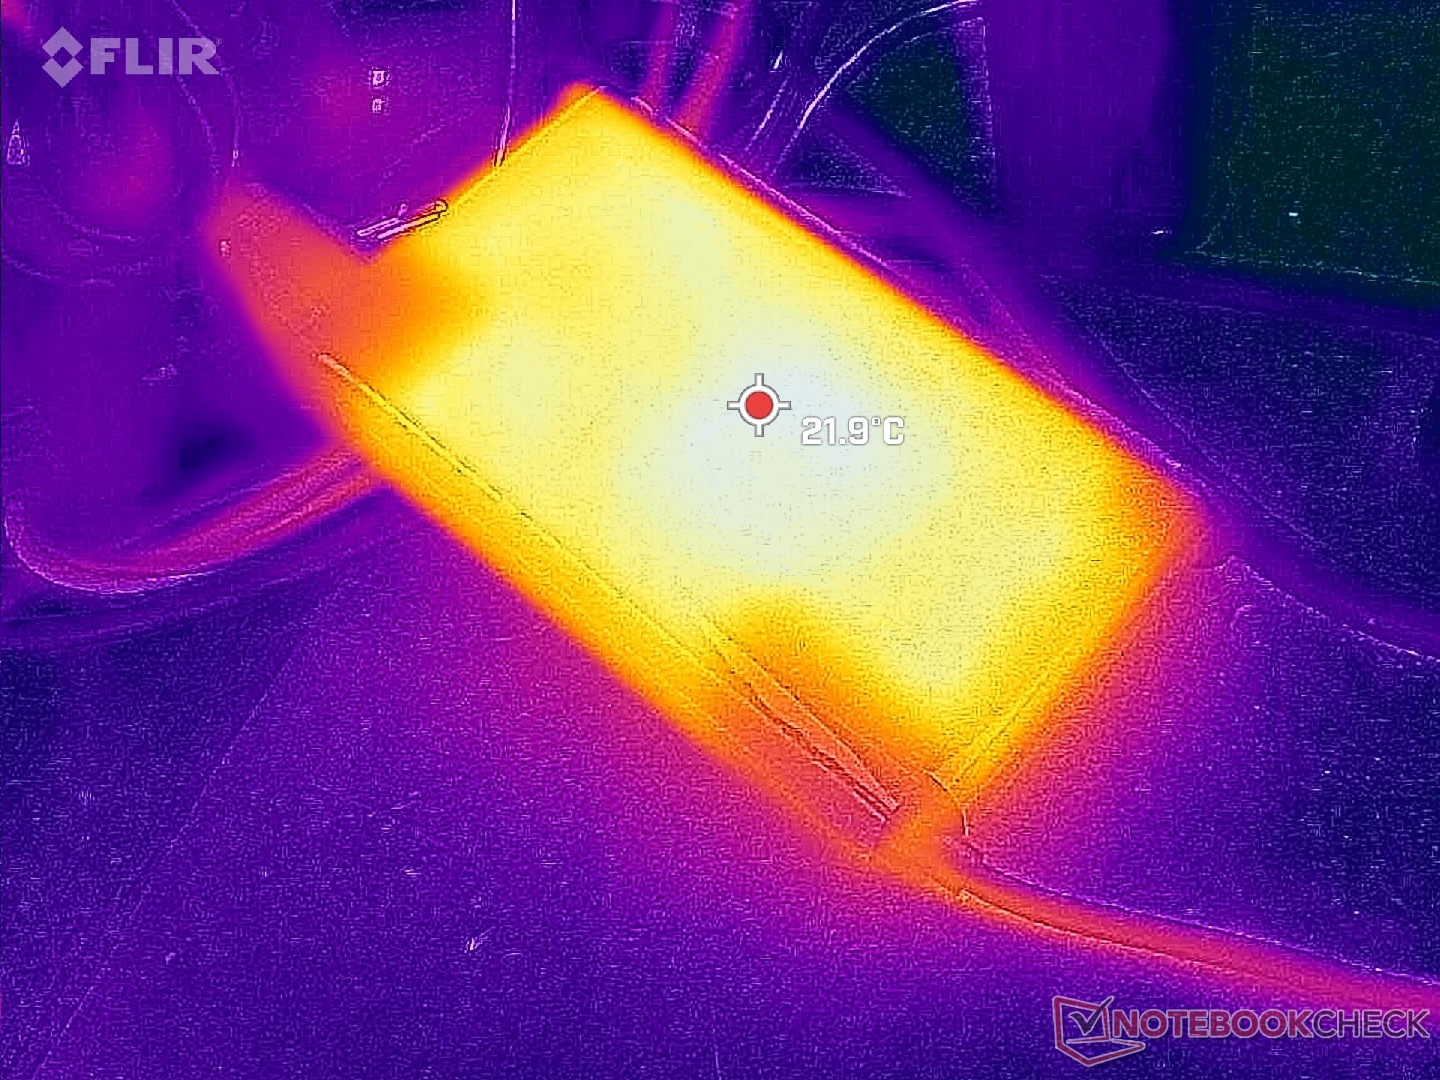
We zijn in staat om een maximale opname van 94 W te registreren van de kleine-medium (~14,6 x 7,7 x 2,5 cm) 135 W USB-C AC-adapter wanneer de CPU en geïntegreerde GPU elk op 100 procent gebruik zijn. Dit percentage is echter slechts tijdelijk, zoals blijkt uit onderstaande grafiek. De relatief hoge overhead stelt de laptop in staat om meer veeleisende Thunderbolt-apparaten, zoals bepaalde docks en monitoren, van stroom te voorzien. Lenovo biedt een kleinere en meer draagbare 65 W AC adapter als alternatief.
| Uit / Standby | |
| Inactief | |
| Belasting |
|
Key:
min: | |
| Lenovo ThinkPad T16 Gen 1 Core i7-1270P i7-1270P, Iris Xe G7 96EUs, Samsung PM9B1 512GB MZAL4512HBLU, IPS, 1920x1200, 16" | Lenovo ThinkPad T16 G1 21BWS00200 i5-1240P, Iris Xe G7 80EUs, Samsung PM9A1 MZVL2512HCJQ, IPS, 1920x1200, 16" | LG Gram 16Z90Q i7-1260P, Iris Xe G7 96EUs, Samsung PM9A1 MZVL21T0HCLR, IPS, 2560x1600, 16" | HP EliteBook 865 G9 R7 PRO 6850U, Radeon 680M, Samsung PM991 MZVLQ512HBLU, IPS, 1920x1200, 16" | Huawei MateBook 16s i7 i7-12700H, Iris Xe G7 96EUs, Silicon Motion PCIe-8 SSD, IPS, 2520x1680, 16" | Apple MacBook Pro 16 2021 M1 Pro M1 Pro, M1 Pro 16-Core GPU, Apple SSD AP1024R, Mini-LED, 3456x2234, 16.2" | |
|---|---|---|---|---|---|---|
| Power Consumption | 21% | -3% | -21% | -45% | -34% | |
| Idle Minimum * (Watt) | 3.5 | 2.9 17% | 5 -43% | 5.3 -51% | 6.8 -94% | 5 -43% |
| Idle Average * (Watt) | 7.4 | 6 19% | 8 -8% | 12.8 -73% | 13.2 -78% | 15.1 -104% |
| Idle Maximum * (Watt) | 10.7 | 6.9 36% | 14 -31% | 14.1 -32% | 13.8 -29% | 15.5 -45% |
| Load Average * (Watt) | 64.5 | 27.3 58% | 47 27% | 48.5 25% | 75.2 -17% | 54 16% |
| Witcher 3 ultra * (Watt) | 36.1 | 42.6 -18% | 37.8 -5% | 48.7 -35% | 56.1 -55% | |
| Load Maximum * (Watt) | 93.8 | 81.53 13% | 56 40% | 56.6 40% | 90.6 3% | 90 4% |
* ... kleiner is beter
Power Consumption Witcher 3 / Stresstest
Power Consumption external Monitor
Batterijduur - De hele dag surfen op het web
De WLAN runtime is aanzienlijk korter dan wat we registreerden op de Core i5 SKU van de Thinkpad T16 G1, zoals blijkt uit de onderstaande tabel. We zorgden ervoor om de test uit te voeren op dezelfde Balanced power profile instellingen tussen de twee configuraties en de resultaten veranderen niet. Toch is 8 uur echt browsen waarschijnlijk voldoende voor de meeste gebruikers.
Opladen van leeg naar vol duurt ongeveer 90 minuten met de meegeleverde AC-adapter.
| Lenovo ThinkPad T16 Gen 1 Core i7-1270P i7-1270P, Iris Xe G7 96EUs, 86 Wh | Lenovo ThinkPad T16 G1 21BWS00200 i5-1240P, Iris Xe G7 80EUs, 86 Wh | LG Gram 16Z90Q i7-1260P, Iris Xe G7 96EUs, 80 Wh | HP EliteBook 865 G9 R7 PRO 6850U, Radeon 680M, 76 Wh | Huawei MateBook 16s i7 i7-12700H, Iris Xe G7 96EUs, 84 Wh | Apple MacBook Pro 16 2021 M1 Pro M1 Pro, M1 Pro 16-Core GPU, 99.6 Wh | |
|---|---|---|---|---|---|---|
| Batterijduur | 76% | 26% | 88% | 1% | 111% | |
| WiFi v1.3 (h) | 8 | 14.1 76% | 10.1 26% | 15 88% | 8.1 1% | 16.9 111% |
| H.264 (h) | 10.4 | 18.5 | 9.3 | 17.5 | ||
| Load (h) | 3.5 | 2.6 | 1.8 | 1.9 | ||
| Reader / Idle (h) | 18.1 |
Pro
Contra
Verdict - Niet voor gebruikers met extreme prestaties
Hoewel de ThinkPad T16 G1 niet is ontworpen voor gebruikers met hoge prestaties, is het toch teleurstellend om zulke steile CPU throttling rates te zien bij het uitvoeren van meer veeleisende belastingen. De throttling is significant genoeg dat de prestaties van onze Core i7-1270P na een bepaalde periode even traag kunnen worden als de goedkopere Core i5-1240P SKU. Een dergelijk gedrag betekent dat de Core i7-1270P optie alleen op zijn best is voor korte uitbarstingen van hoge prestaties, zoals bij het starten van toepassingen of het verwerken van afbeeldingen, in plaats van voor langdurige video-codering of zwaar grafisch werk, waar throttling kan optreden na verloop van tijd.
Een ingebouwde optie om de processorprestaties te verhogen ten koste van luider ventilatorgeluid en/of warmere temperaturen zou het throttlen enigszins hebben verzacht.
De Ryzen 5 Pro 6650U optie biedt meer consistente prestaties dan de Core i7-1270P optie. Prestatie throttling is zwaarder van het configureren met een Core P serie CPU.
Naast de processor moeten gebruikers ook oppassen voor het trage systeem-RAM en sommige van de beschikbare beeldschermopties. De eerste beïnvloedt de grafische prestaties met maximaal 10 procent, terwijl sommige panelen mogelijk niet de kleuren hebben die grafische professionals eisen. De concurrerendeHP EliteBook 865 G9 is een slanker alternatief met opties die niet beschikbaar zijn op de ThinkPad T16 G1, waaronder een helderder 1000-nit scherm en een 5 MP webcam met hogere resolutie.
Prijs en beschikbaarheid
De ThinkPad T16 G1 wordt nu rechtstreeks door Lenovo verzonden vanaf $1050 USD voor de Core i5-1235U basisconfiguratie tot $2040 USD voor de Core i7-1270P configuratie. Newegg en Amazon hebben het model ook op voorraad in verschillende configuraties vanaf ongeveer $1500 indien geconfigureerd met de Core i7-1270P.
Lenovo ThinkPad T16 Gen 1 Core i7-1270P
- 25-01-2023 v7 (old)
Allen Ngo
Transparantie
De selectie van te beoordelen apparaten wordt gemaakt door onze redactie. Het testexemplaar werd ten behoeve van deze beoordeling door de fabrikant of detailhandelaar in bruikleen aan de auteur verstrekt. De kredietverstrekker had geen invloed op deze recensie, noch ontving de fabrikant vóór publicatie een exemplaar van deze recensie. Er bestond geen verplichting om deze recensie te publiceren. Als onafhankelijk mediabedrijf is Notebookcheck niet onderworpen aan het gezag van fabrikanten, detailhandelaren of uitgevers.
[transparency_disclaimer]Dit is hoe Notebookcheck test
Elk jaar beoordeelt Notebookcheck onafhankelijk honderden laptops en smartphones met behulp van gestandaardiseerde procedures om ervoor te zorgen dat alle resultaten vergelijkbaar zijn. We hebben onze testmethoden al zo'n 20 jaar voortdurend ontwikkeld en daarbij de industriestandaard bepaald. In onze testlaboratoria wordt gebruik gemaakt van hoogwaardige meetapparatuur door ervaren technici en redacteuren. Deze tests omvatten een validatieproces in meerdere fasen. Ons complexe beoordelingssysteem is gebaseerd op honderden goed onderbouwde metingen en benchmarks, waardoor de objectiviteit behouden blijft. Meer informatie over onze testmethoden kunt u hier vinden.
Price comparison

