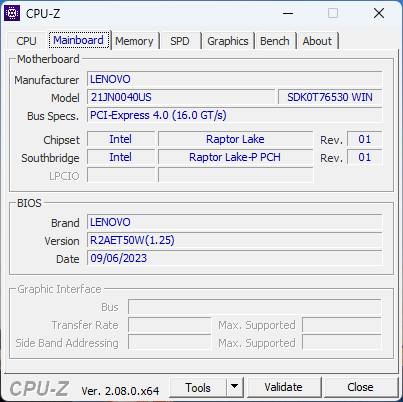
Lenovo ThinkPad E16 G1 Intel beoordeling: Core i5 is nek-aan-nek met AMD Ryzen 7

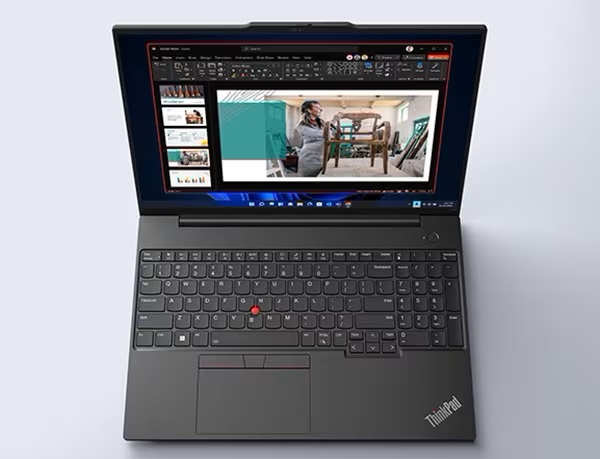
De ThinkPad E-serie bestaat uit betaalbare modellen voor zakelijke gebruikers, in tegenstelling tot de luxere ThinkPad T-serie of de scherpere ThinkPad X-serie. Dit jaar wordt de 16-inch ThinkPad E16-serie geïntroduceerd als aanvulling op de bestaande 14-inch ThinkPad E14 en 15-inch ThinkPad E15 opties. Bij de introductie zijn er twee versies van de ThinkPad E16 beschikbaar met Intel- of AMD-processors. We hebben onlangs de ThinkPad E16 AMD Ryzen 7-versie beoordeeld en daarom is het nu tijd om de ThinkPad E16 Intel Core i5-versie te bekijken om te zien hoe de verschillen zijn.
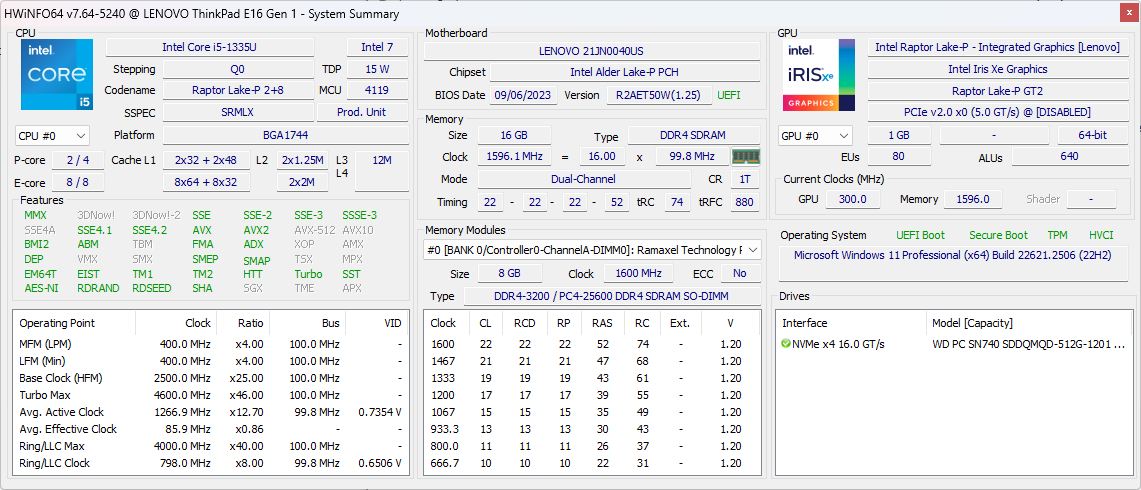
Onze specifieke Intel-reviewunit is een configuratie in het lagere segment met de Core i5-1335U en een 1200p touchscreen voor een verkoopprijs van ongeveer $800 tot $900 USD. Andere configuraties kunnen gaan tot de Core i7-1365U, Core i7-1360P, of zelfs de Core i7-13700H met discrete GeForce MX550 grafische afbeeldingen en een 1600p beeldscherm met hogere resolutie voor veel hogere prijzen. Dergelijke opties zijn op het moment van publicatie nog niet beschikbaar.
Alternatieven voor de ThinkPad E16 zijn andere 16-inch multimedia- of zakelijke laptops zoals de Acer TravelMate P4, Samsung Galaxy Book3 Pro 16, of LG Gram 16. We raden u aan onze bestaande review van de ThinkPad E16 G1 AMD-versie te bekijken, aangezien onze Intel-versie hetzelfde chassisontwerp en dezelfde fysieke kenmerken heeft.
Meer Lenovo beoordelingen:
Potentiële concurrenten in vergelijking
Evaluatie | Datum | Model | Gewicht | Hoogte | Formaat | Resolutie | Beste prijs |
|---|---|---|---|---|---|---|---|
| 85.5 % v7 (old) | 11-2023 | Lenovo ThinkPad E16 G1 Core i5-1335U i5-1335U, Iris Xe G7 80EUs | 1.8 kg | 19.85 mm | 16.00" | 1920x1200 | |
| 88.1 % v7 (old) | 09-2023 | Lenovo ThinkPad E16 G1-21JUS08X00 R7 7730U, Vega 8 | 1.8 kg | 19.85 mm | 16.00" | 2560x1600 | |
| 84.6 % v7 (old) | 07-2023 | Dell Inspiron 16 7635 2-in-1 R5 7530U, Vega 7 | 2 kg | 18.99 mm | 16.00" | 1920x1200 | |
| 86 % v7 (old) | 04-2023 | Acer TravelMate P4 TMP416-51-55KN i5-1240P, Iris Xe G7 80EUs | 1.6 kg | 18.5 mm | 16.00" | 1920x1200 | |
| 85.6 % v7 (old) | 05-2023 | Samsung Galaxy Book3 Pro 16 i5-1340P, Iris Xe G7 80EUs | 1.6 kg | 12.5 mm | 16.00" | 2880x1800 | |
| 86.6 % v7 (old) | 01-2023 | LG Gram 16Z90Q i7-1260P, Iris Xe G7 96EUs | 1.2 kg | 16.8 mm | 16.00" | 2560x1600 |
Zaak
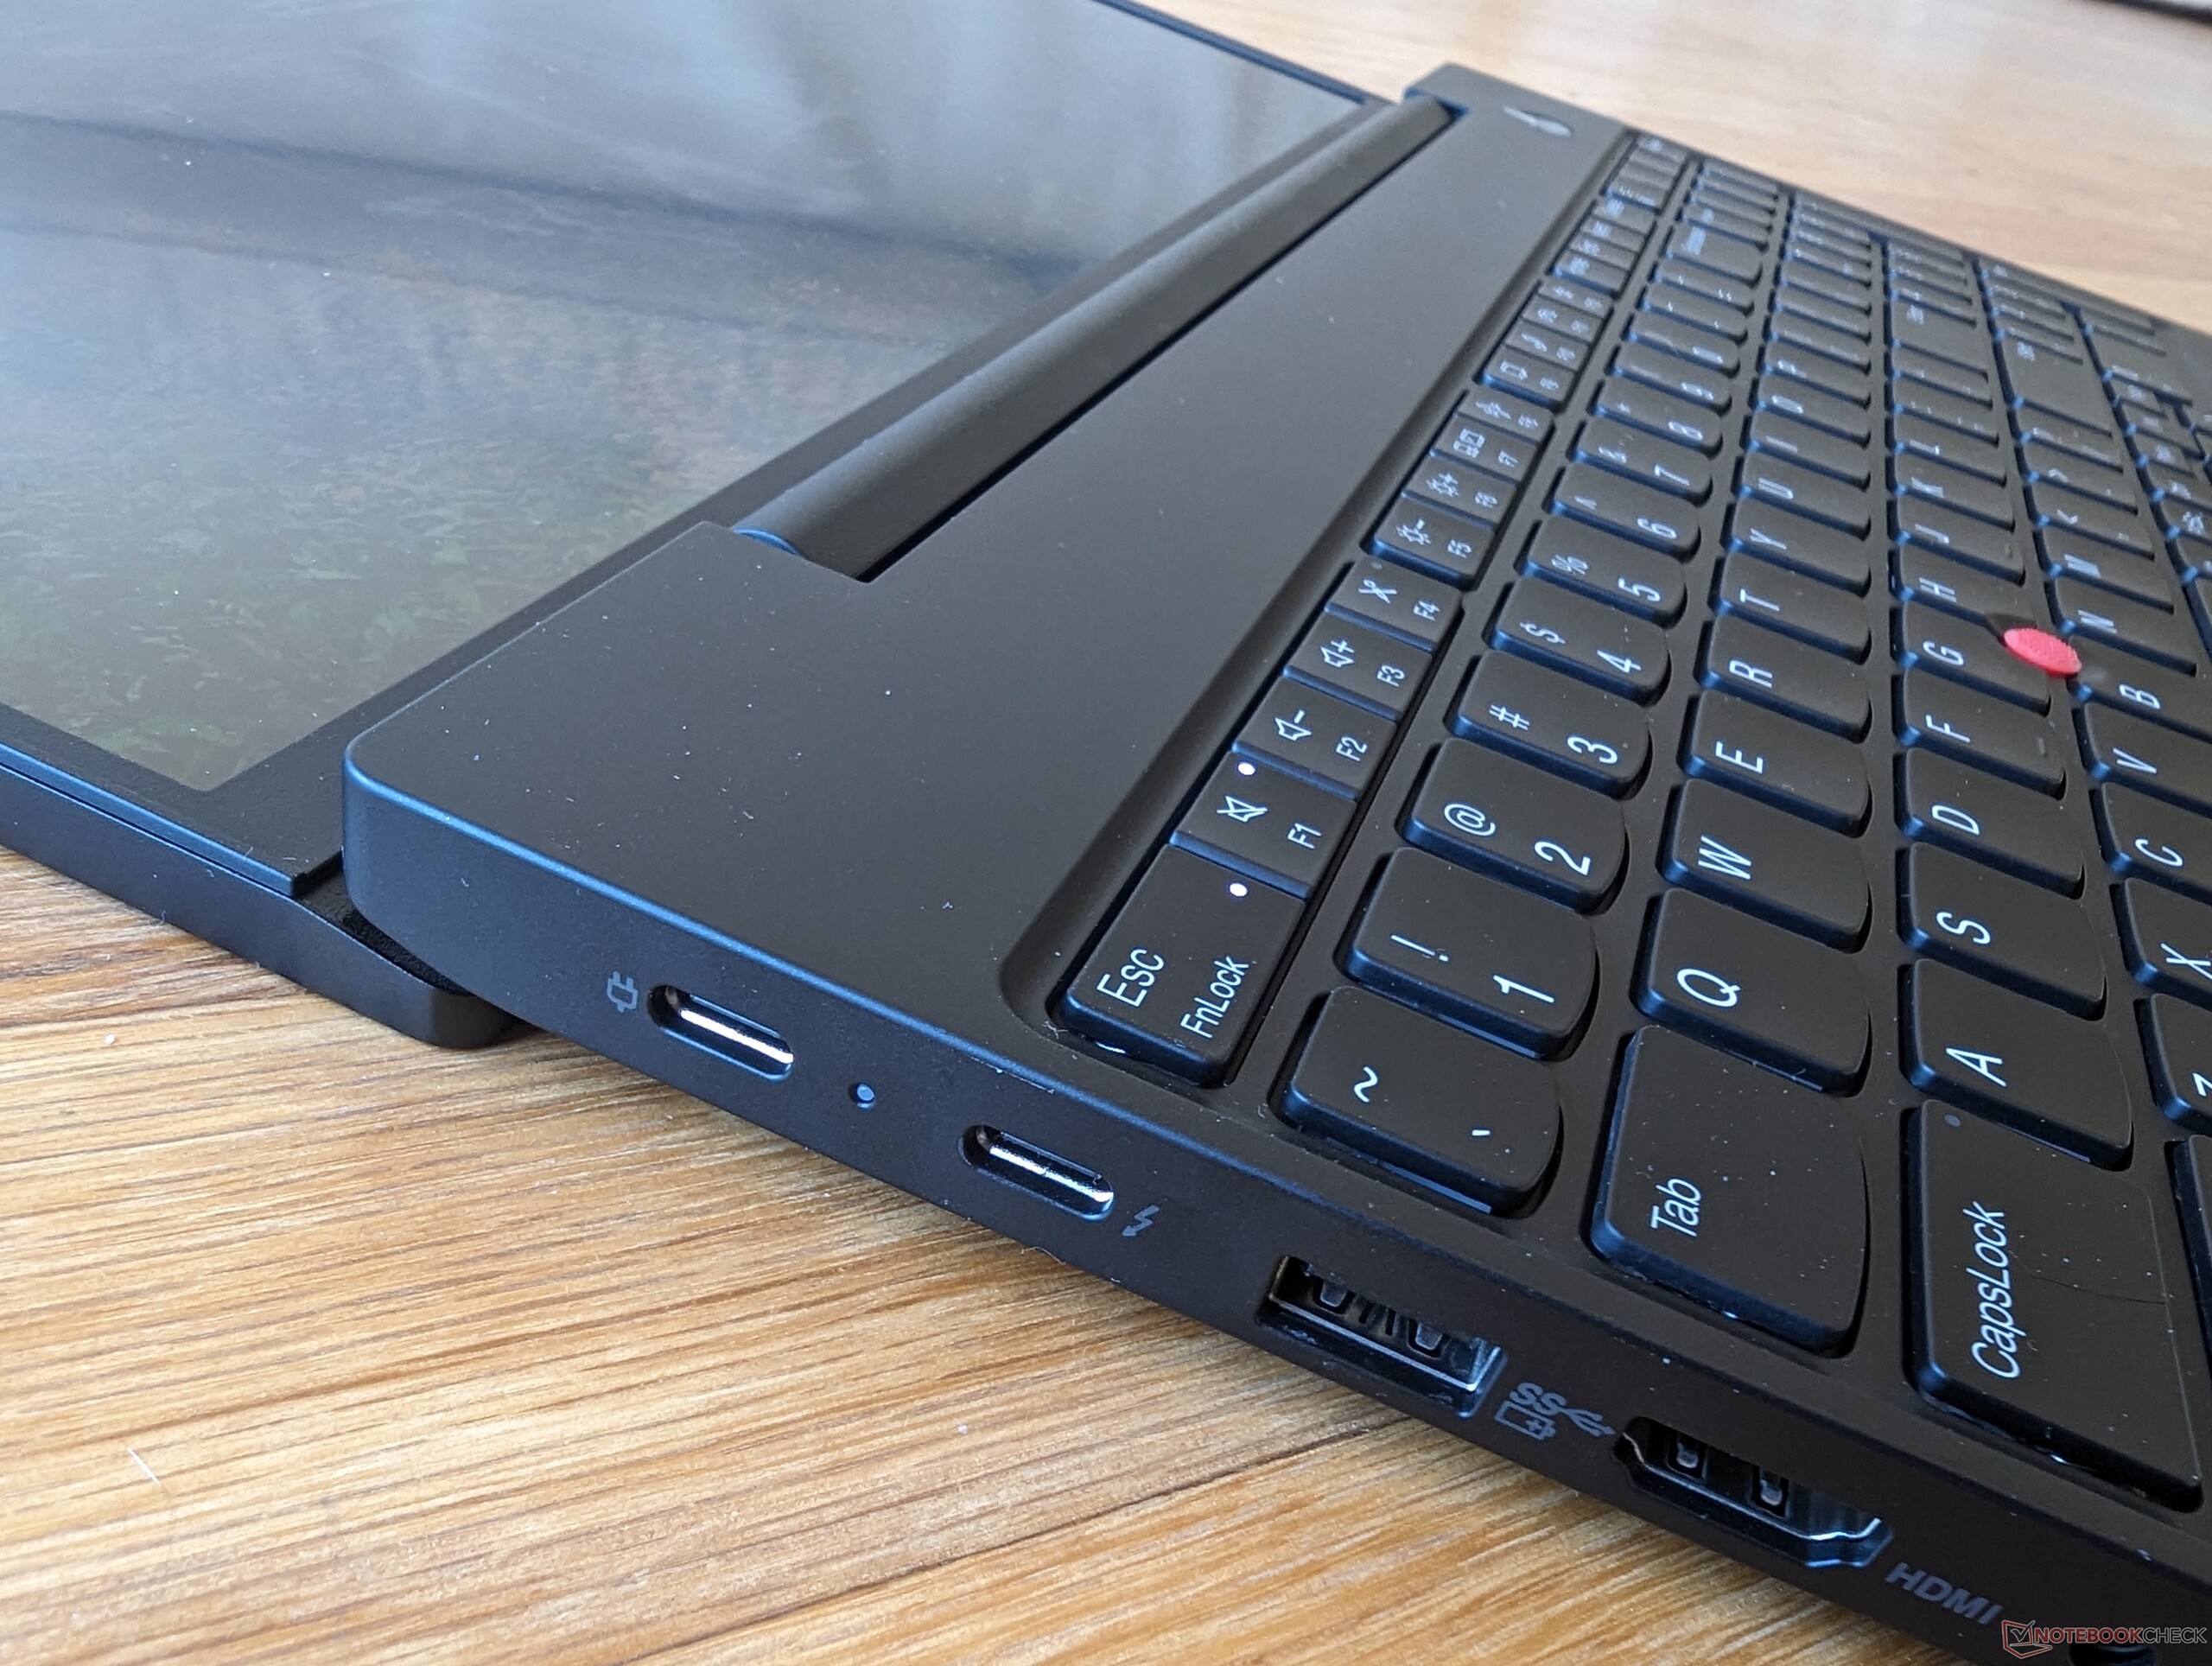
De eenvoudigste manier om een Intel-versie van een AMD-versie te onderscheiden is door naar het Thunderbolt-logo langs de linkerrand te zoeken. Thunderbolt wordt alleen ondersteund op de Intel-versies, omdat de huidige AMD-versies niet met USB4 worden geleverd.
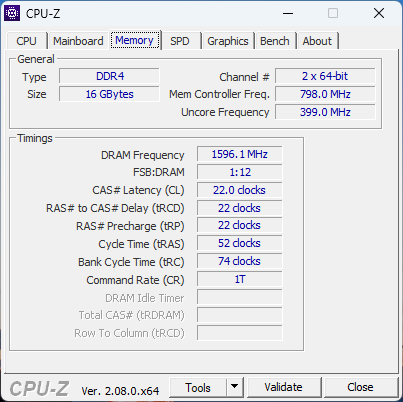
Communicatie
Webcam


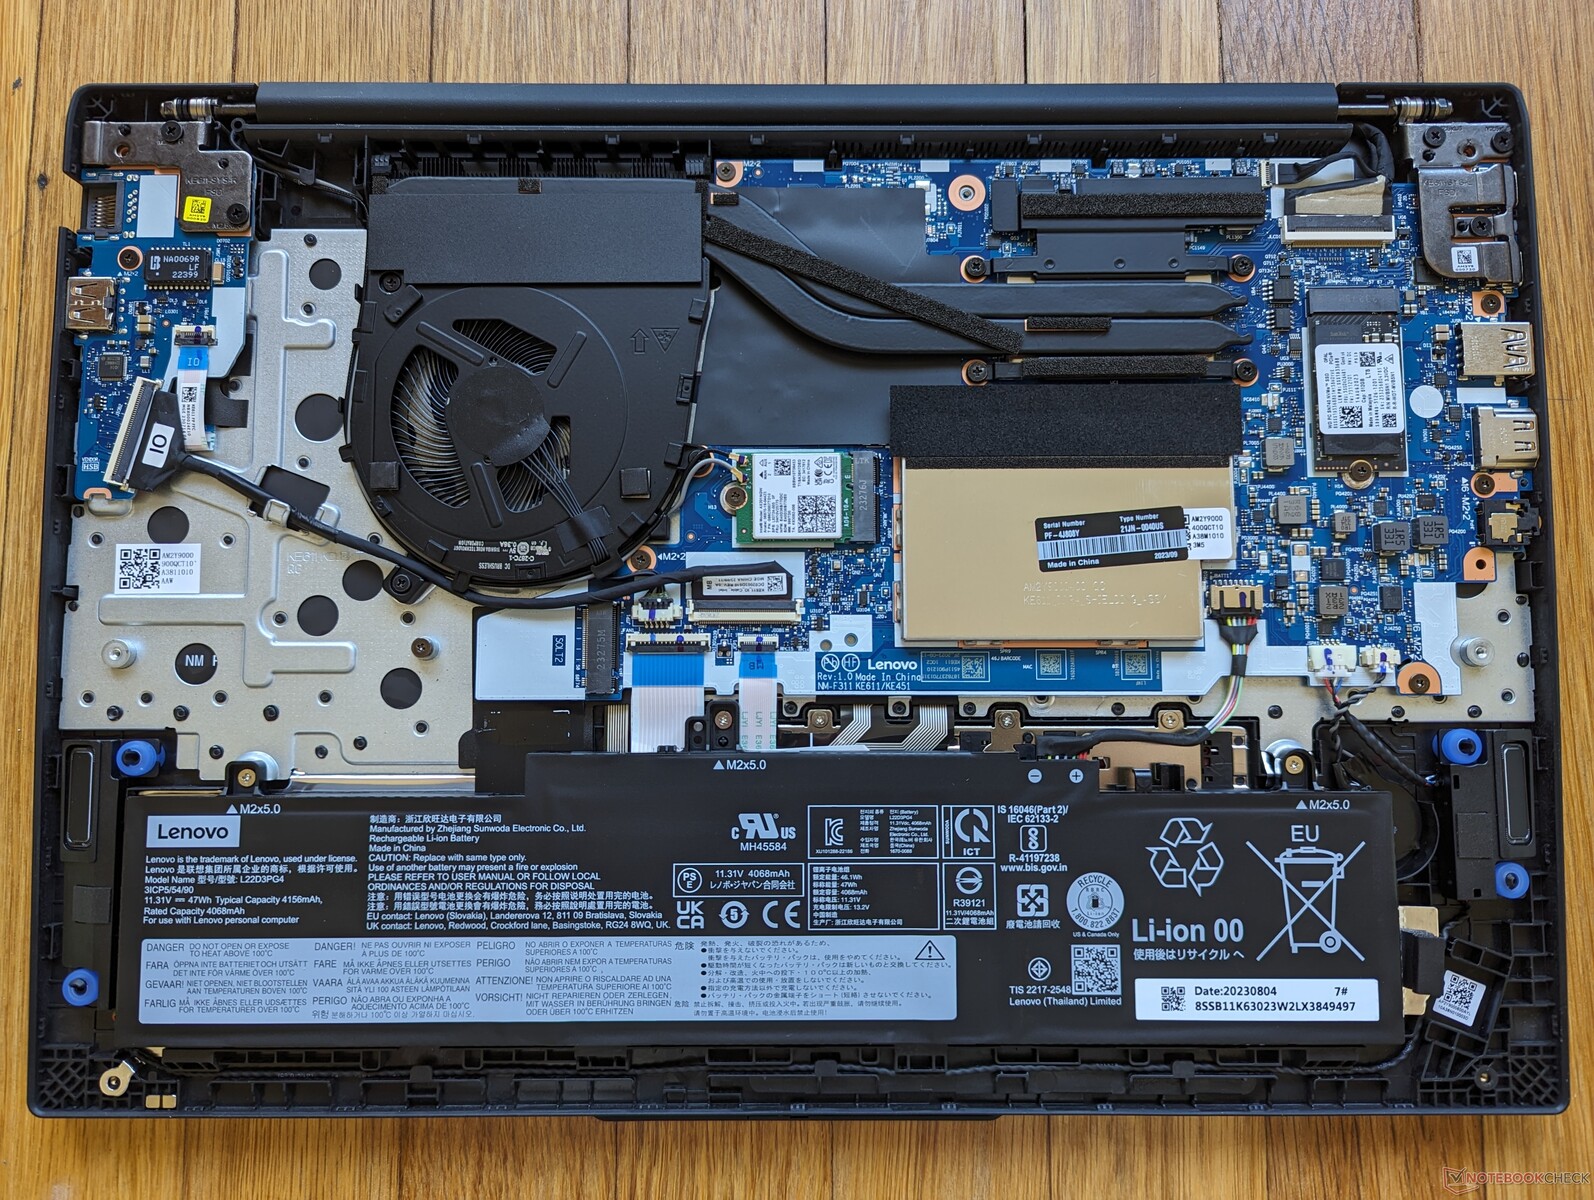
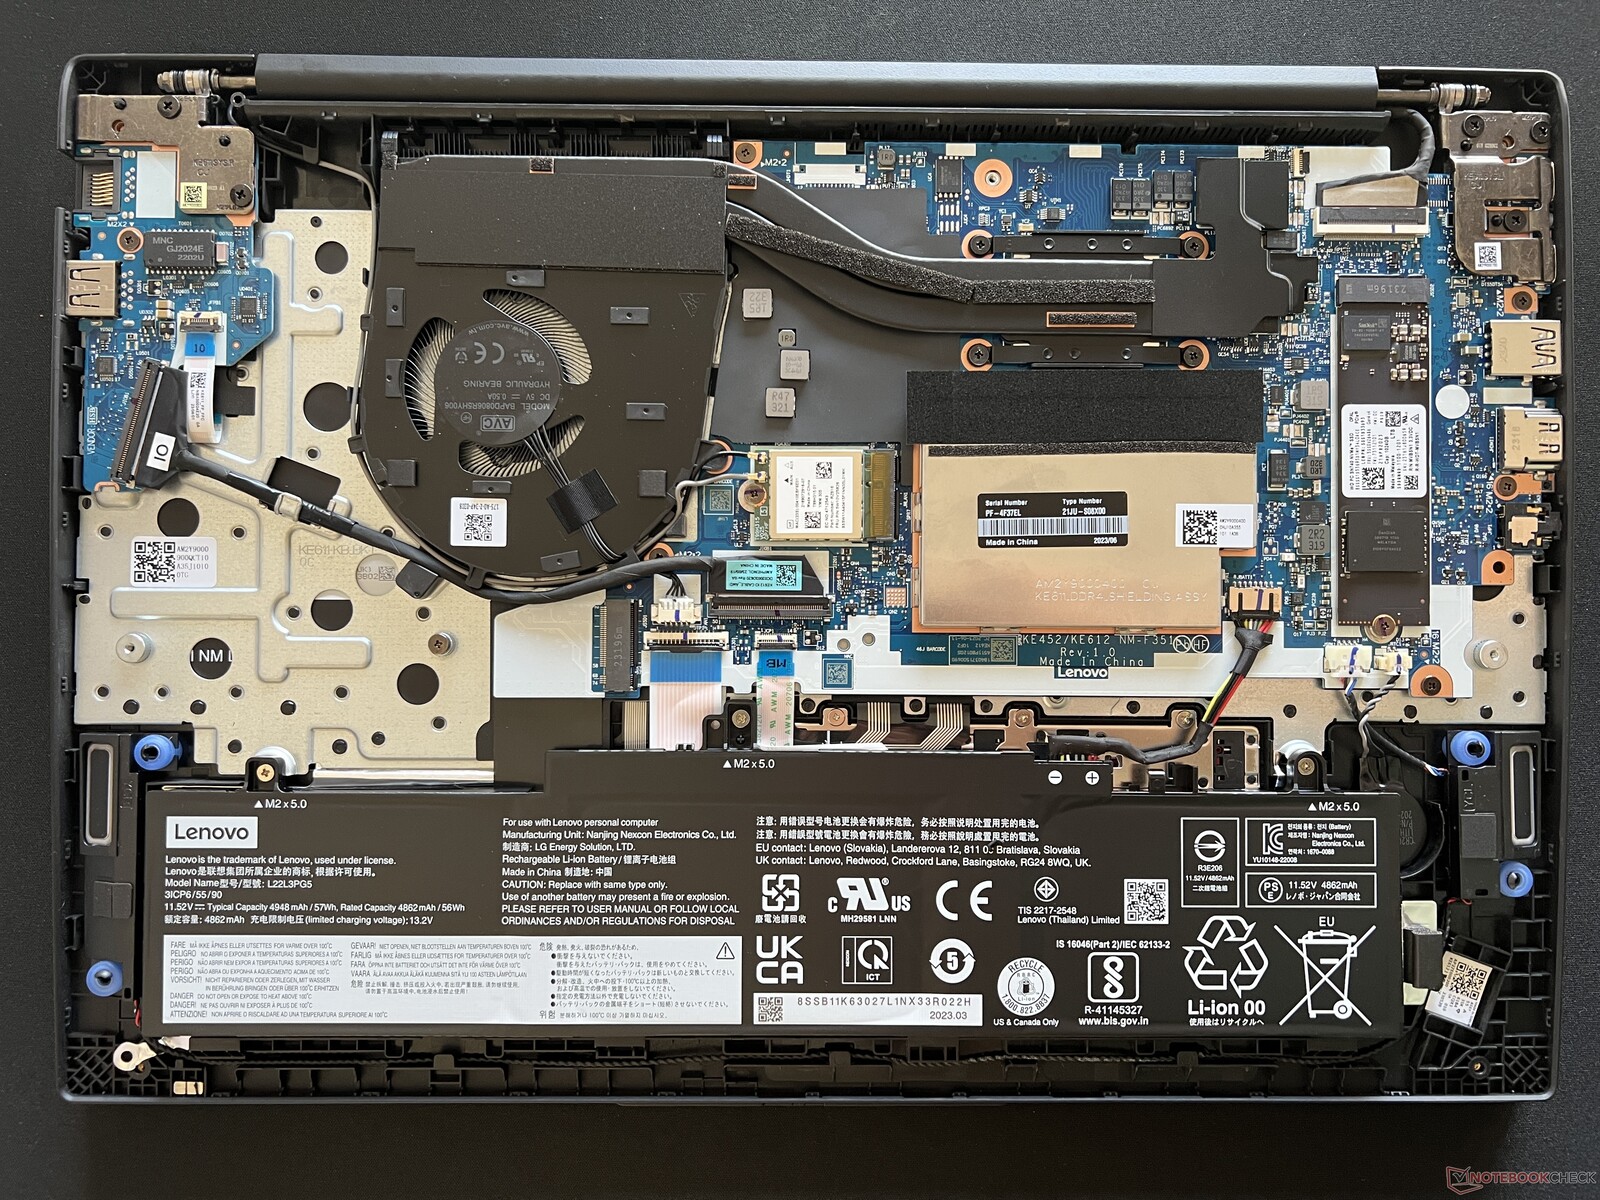
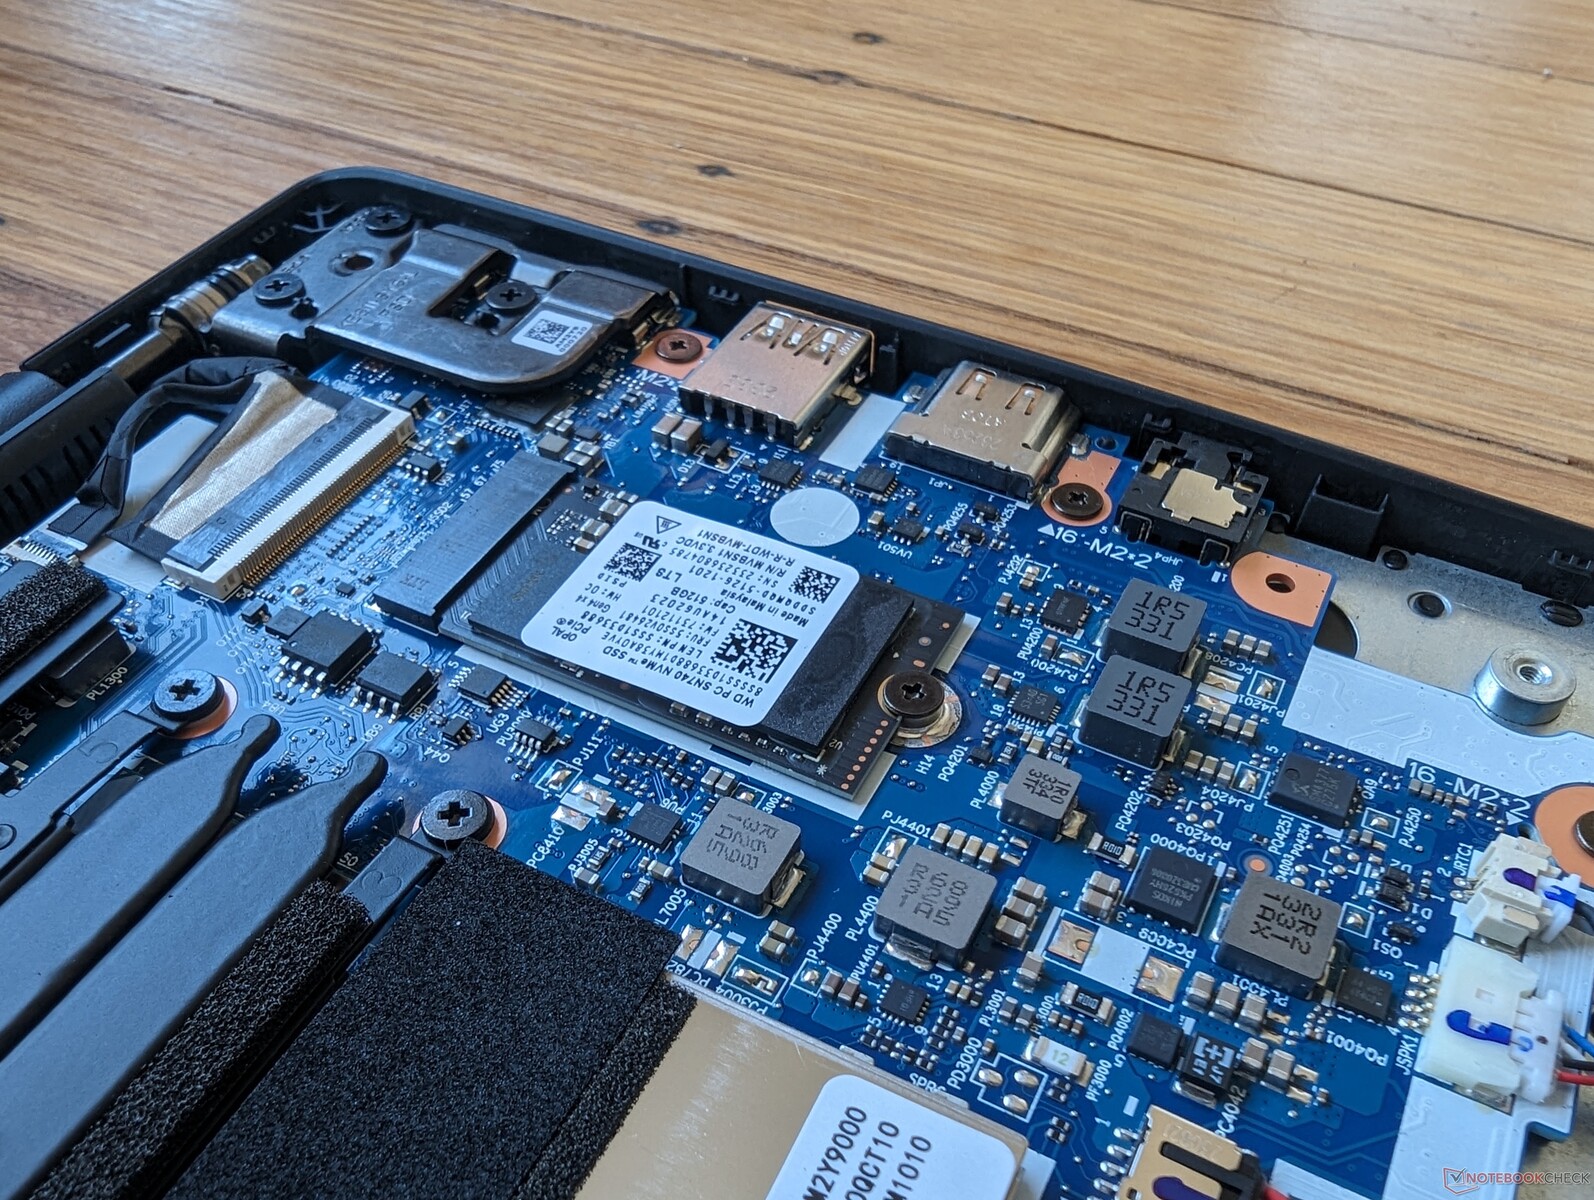
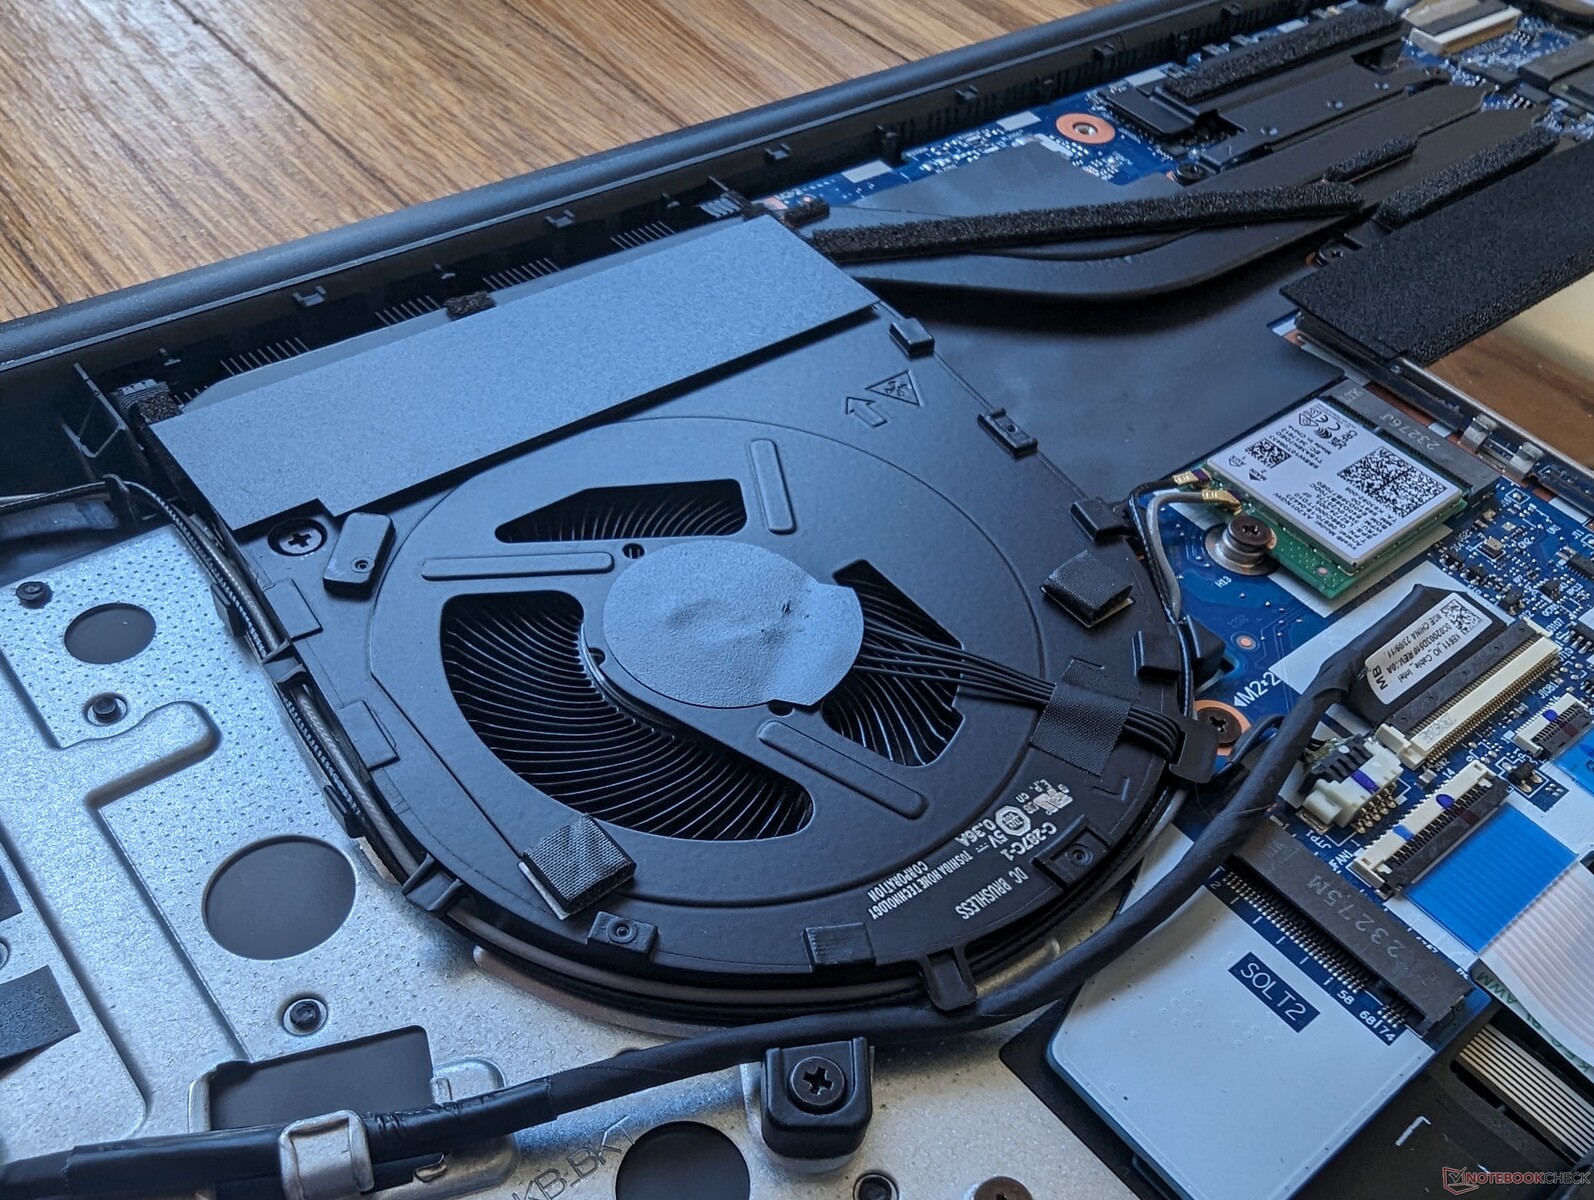
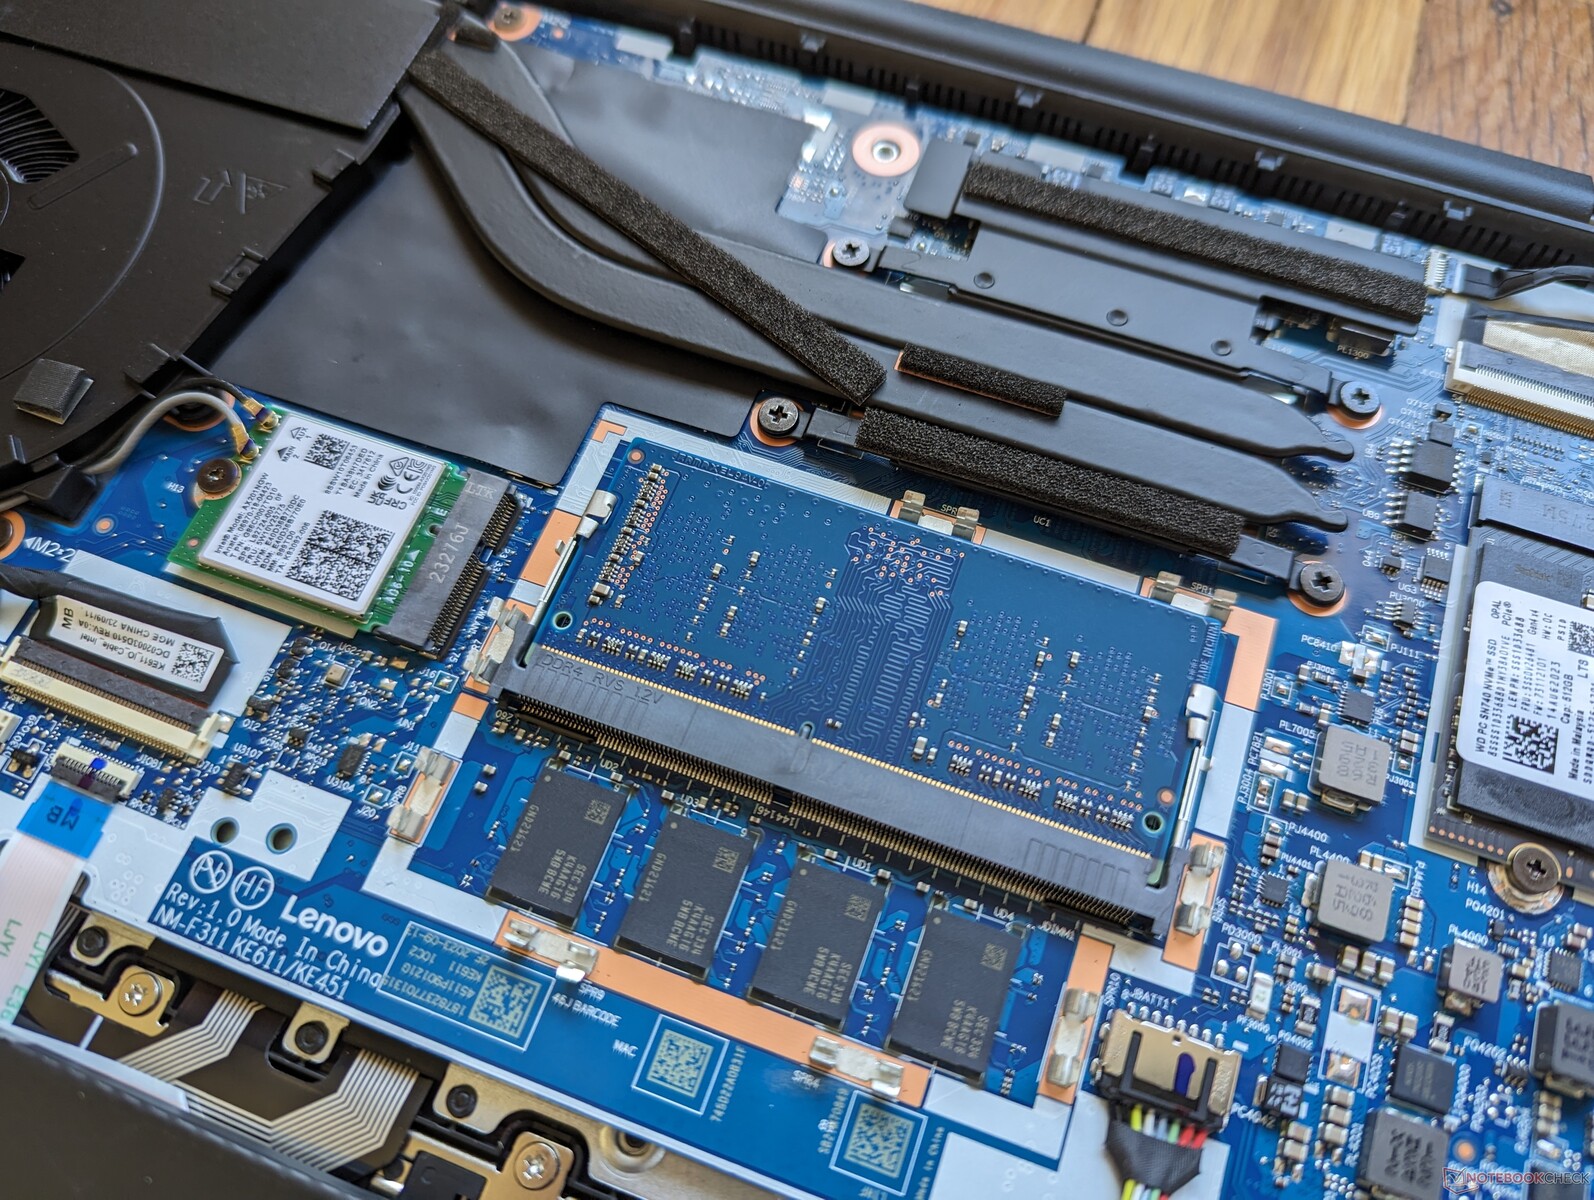
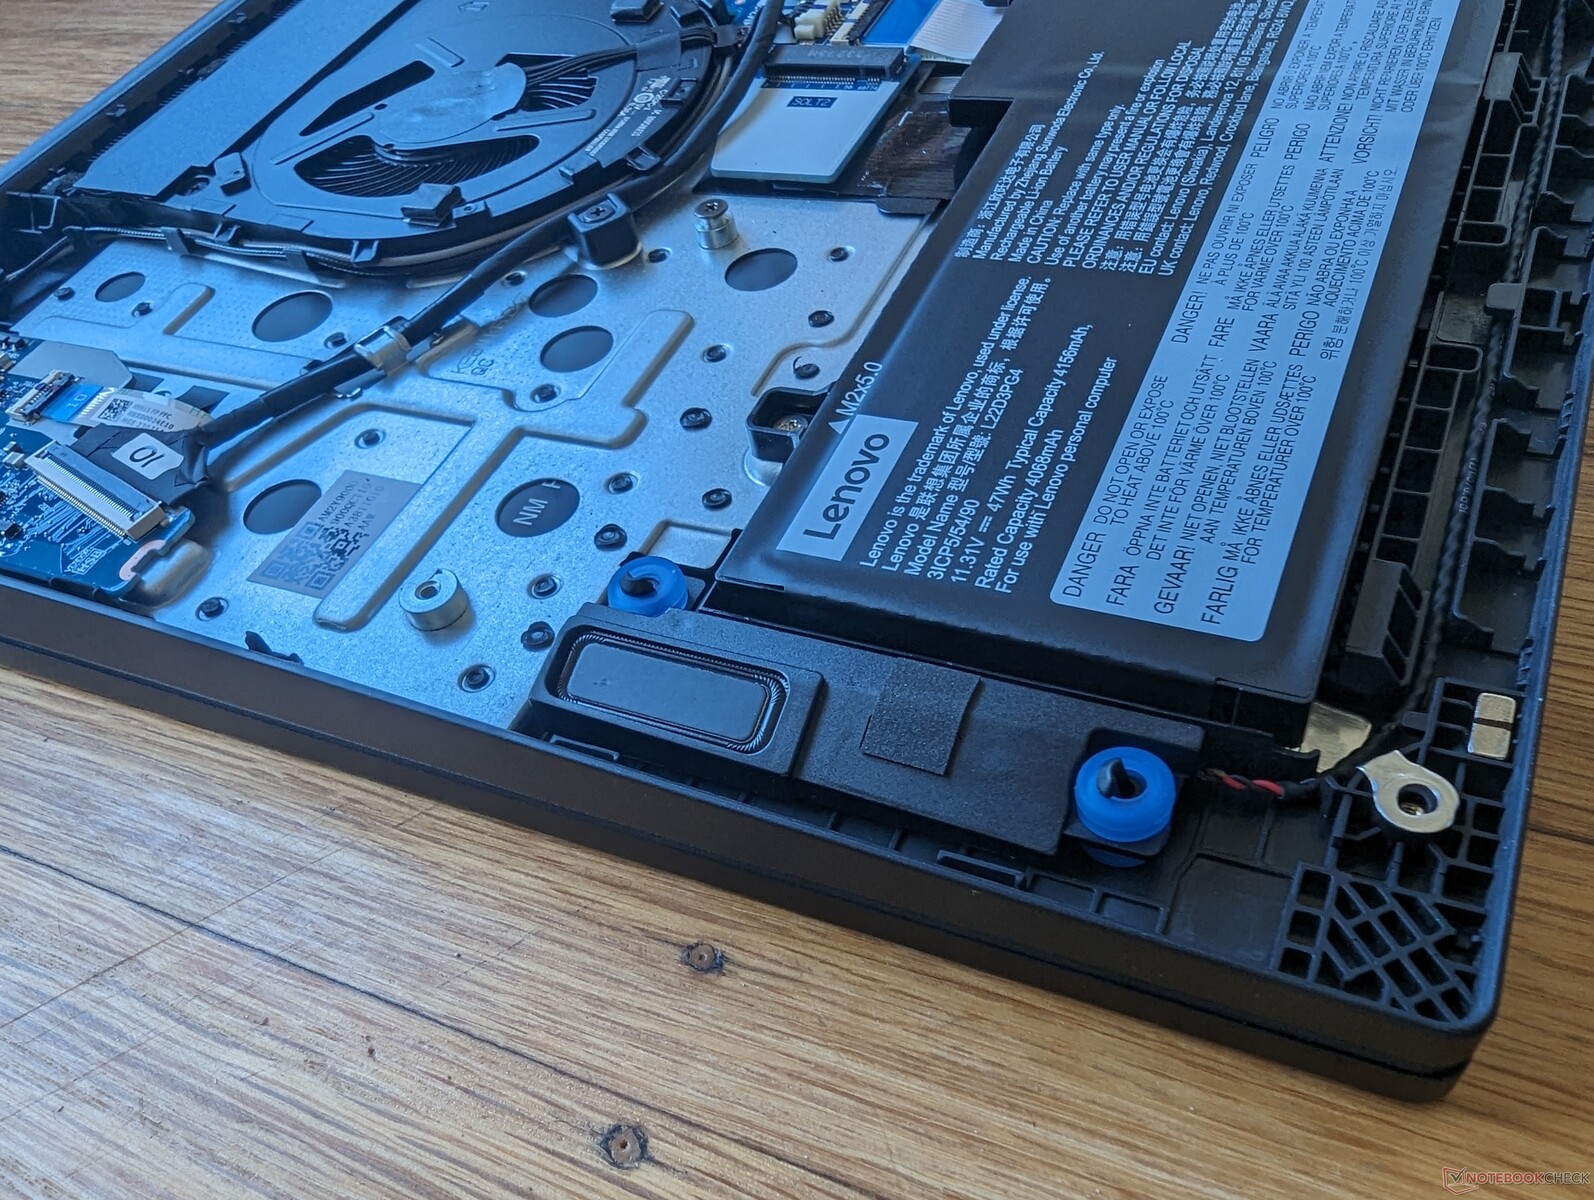
Onderhoud
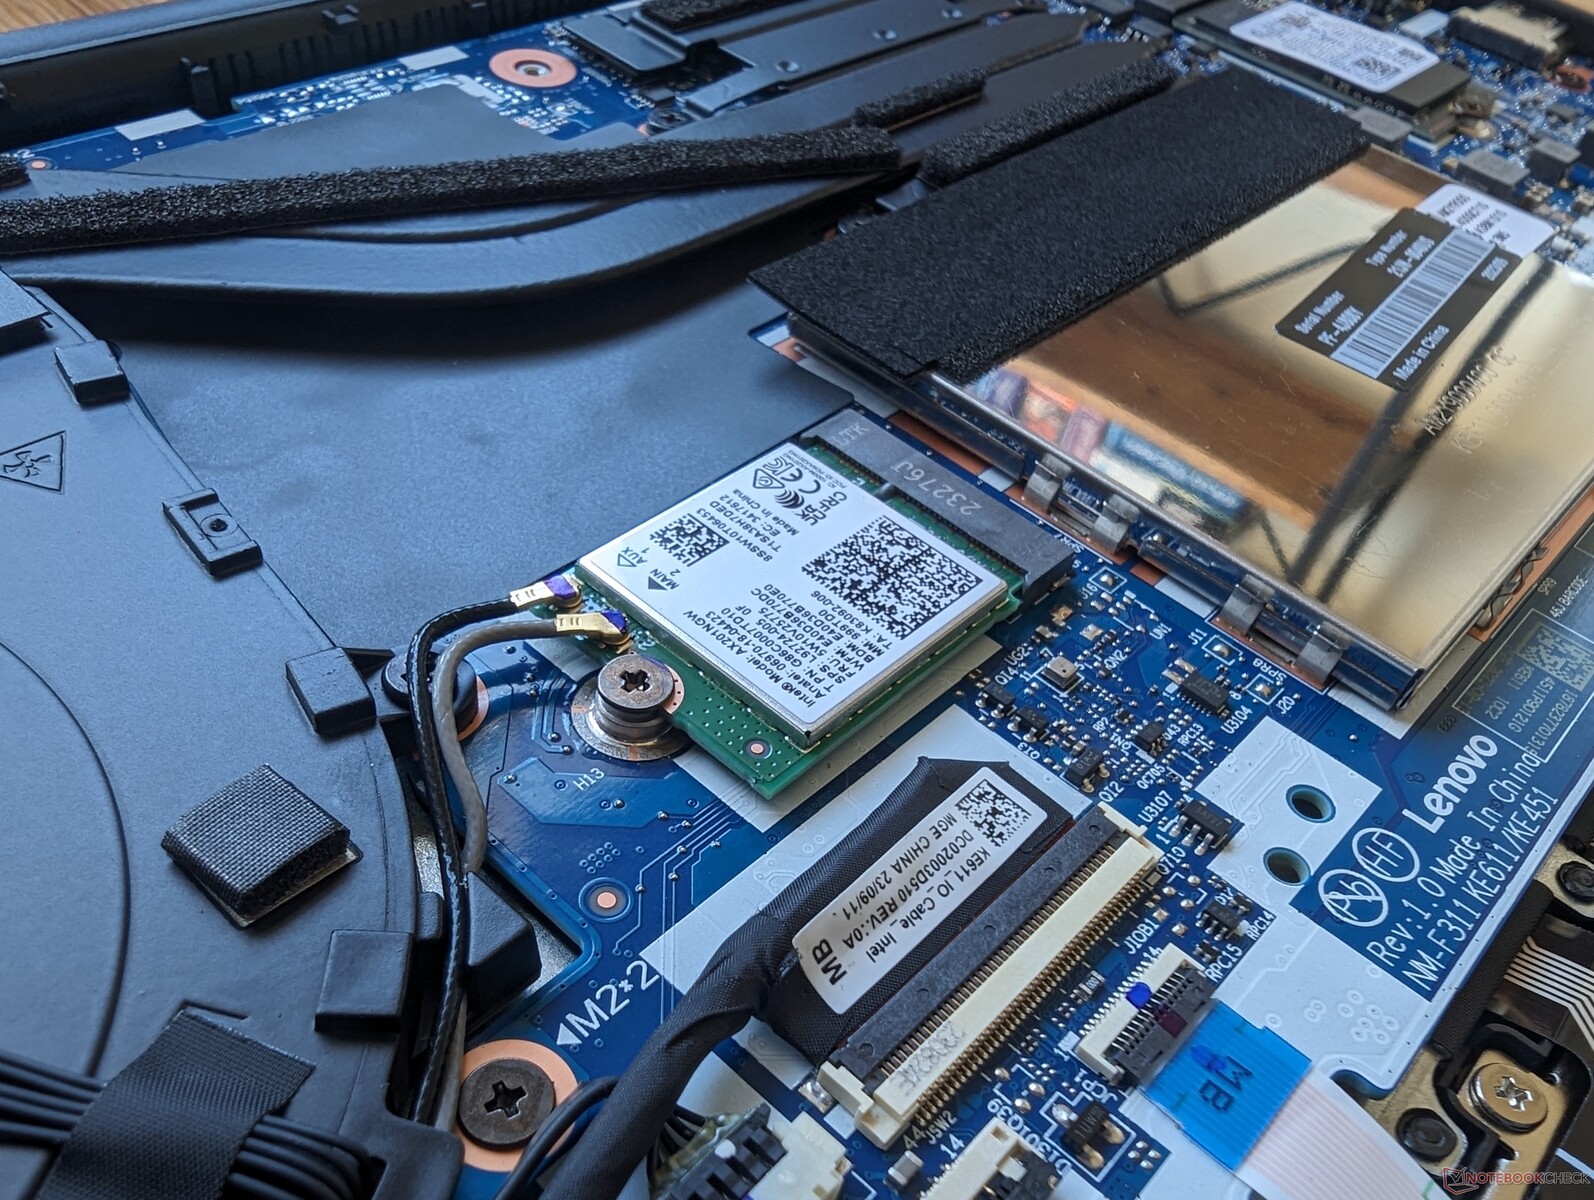
Zowel de Intel- als de AMD-versie ondersteunen elk maximaal twee M.2 SSD's. De Intel-versie ondersteunt echter alleen schijven van maximaal 42 mm lang, terwijl de AMD-versie één schijf van maximaal 80 mm kan ondersteunen. Dit is vergelijkbaar met wat we zagen tussen de kleinere 14-inch ThinkPad E14 G5 Intel- en AMD-versie.
Garantie
Bij aankoop in de VS geldt een beperkte fabrieksgarantie van één jaar. De duurdere ThinkPad-modellen uit de T-serie of X-serie hebben standaard een garantie van drie jaar.
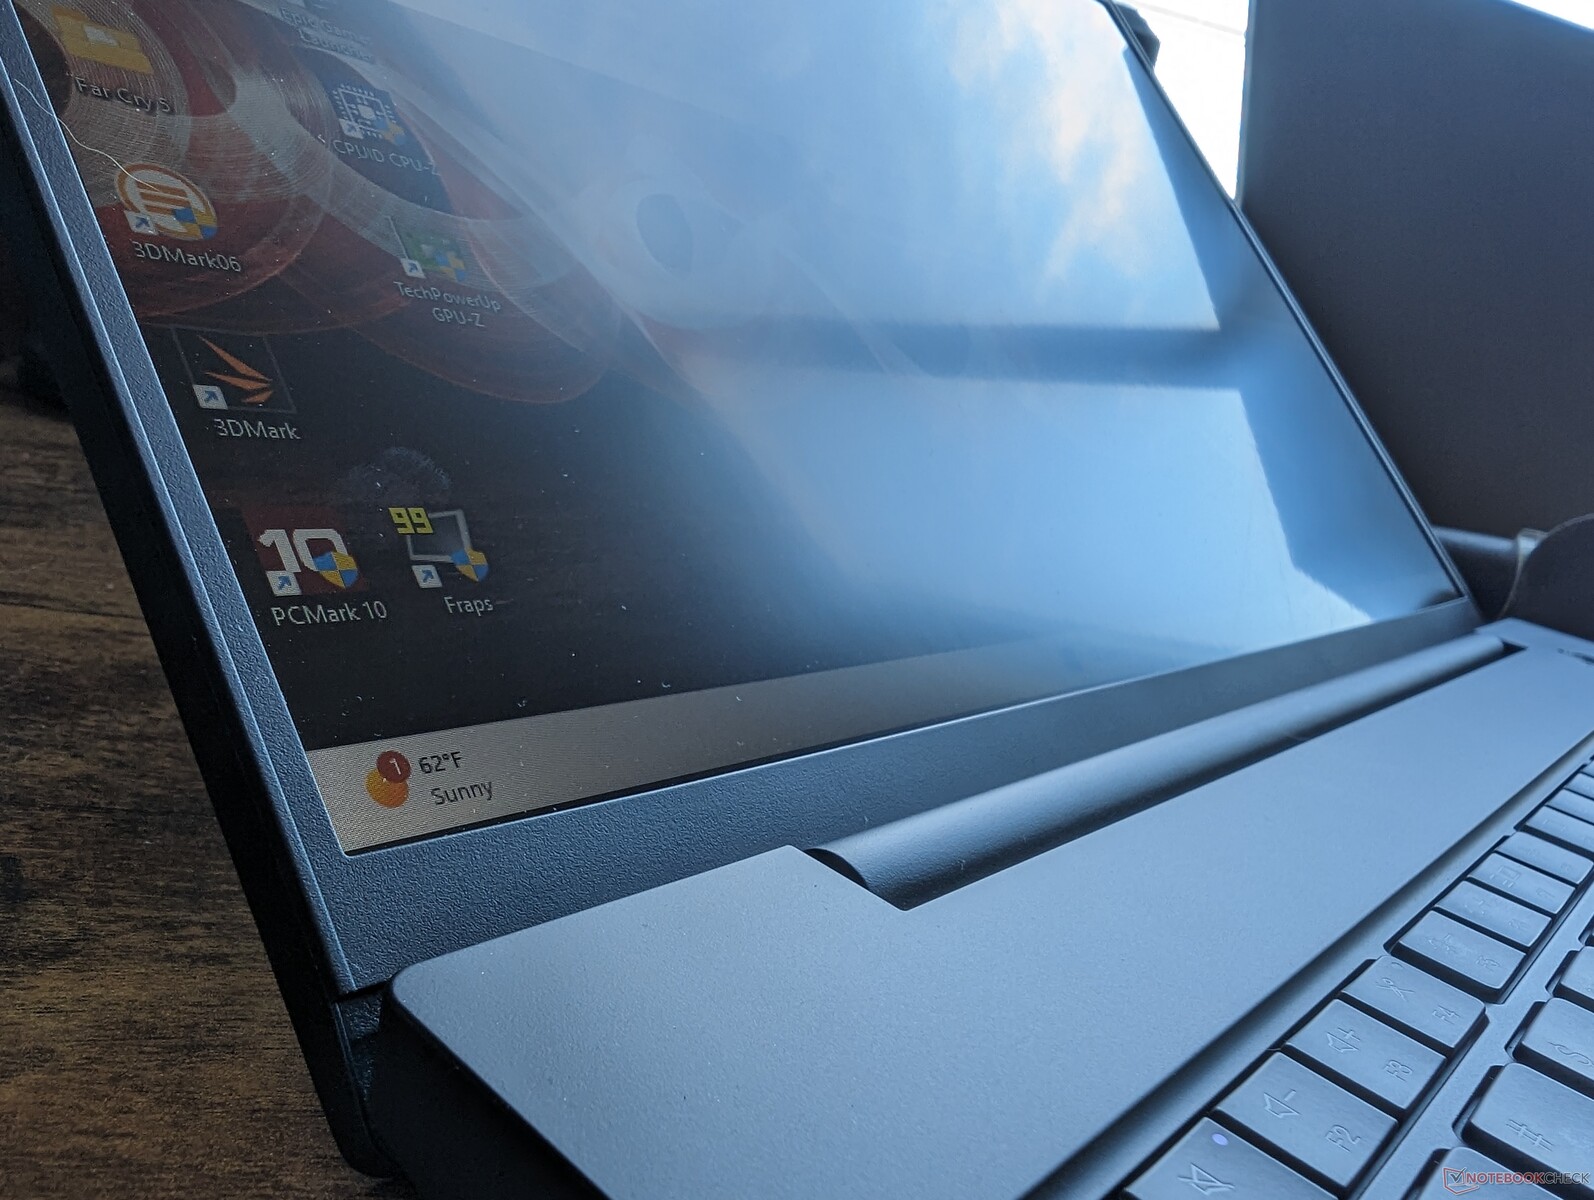
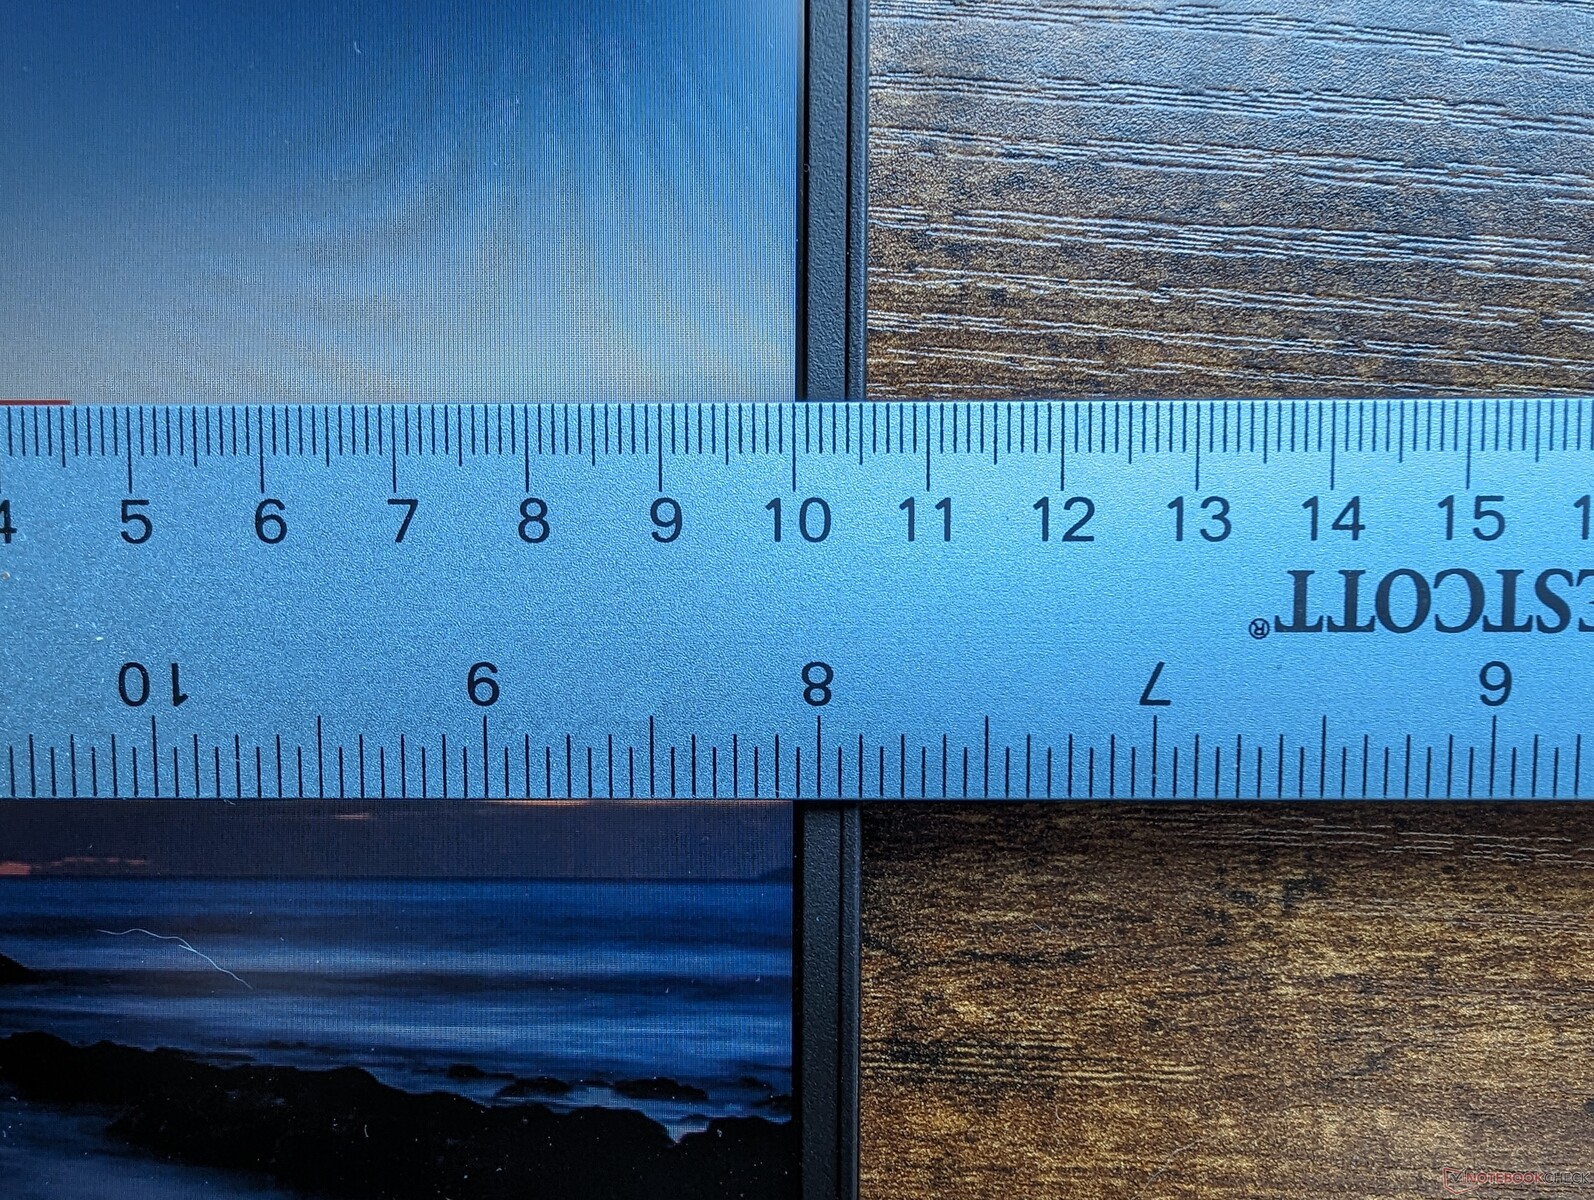
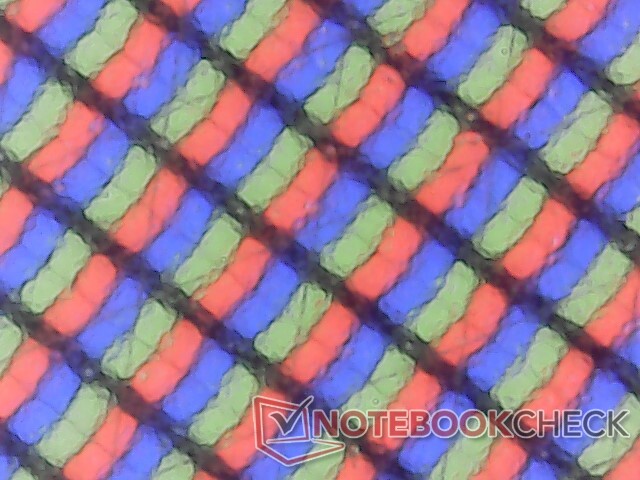
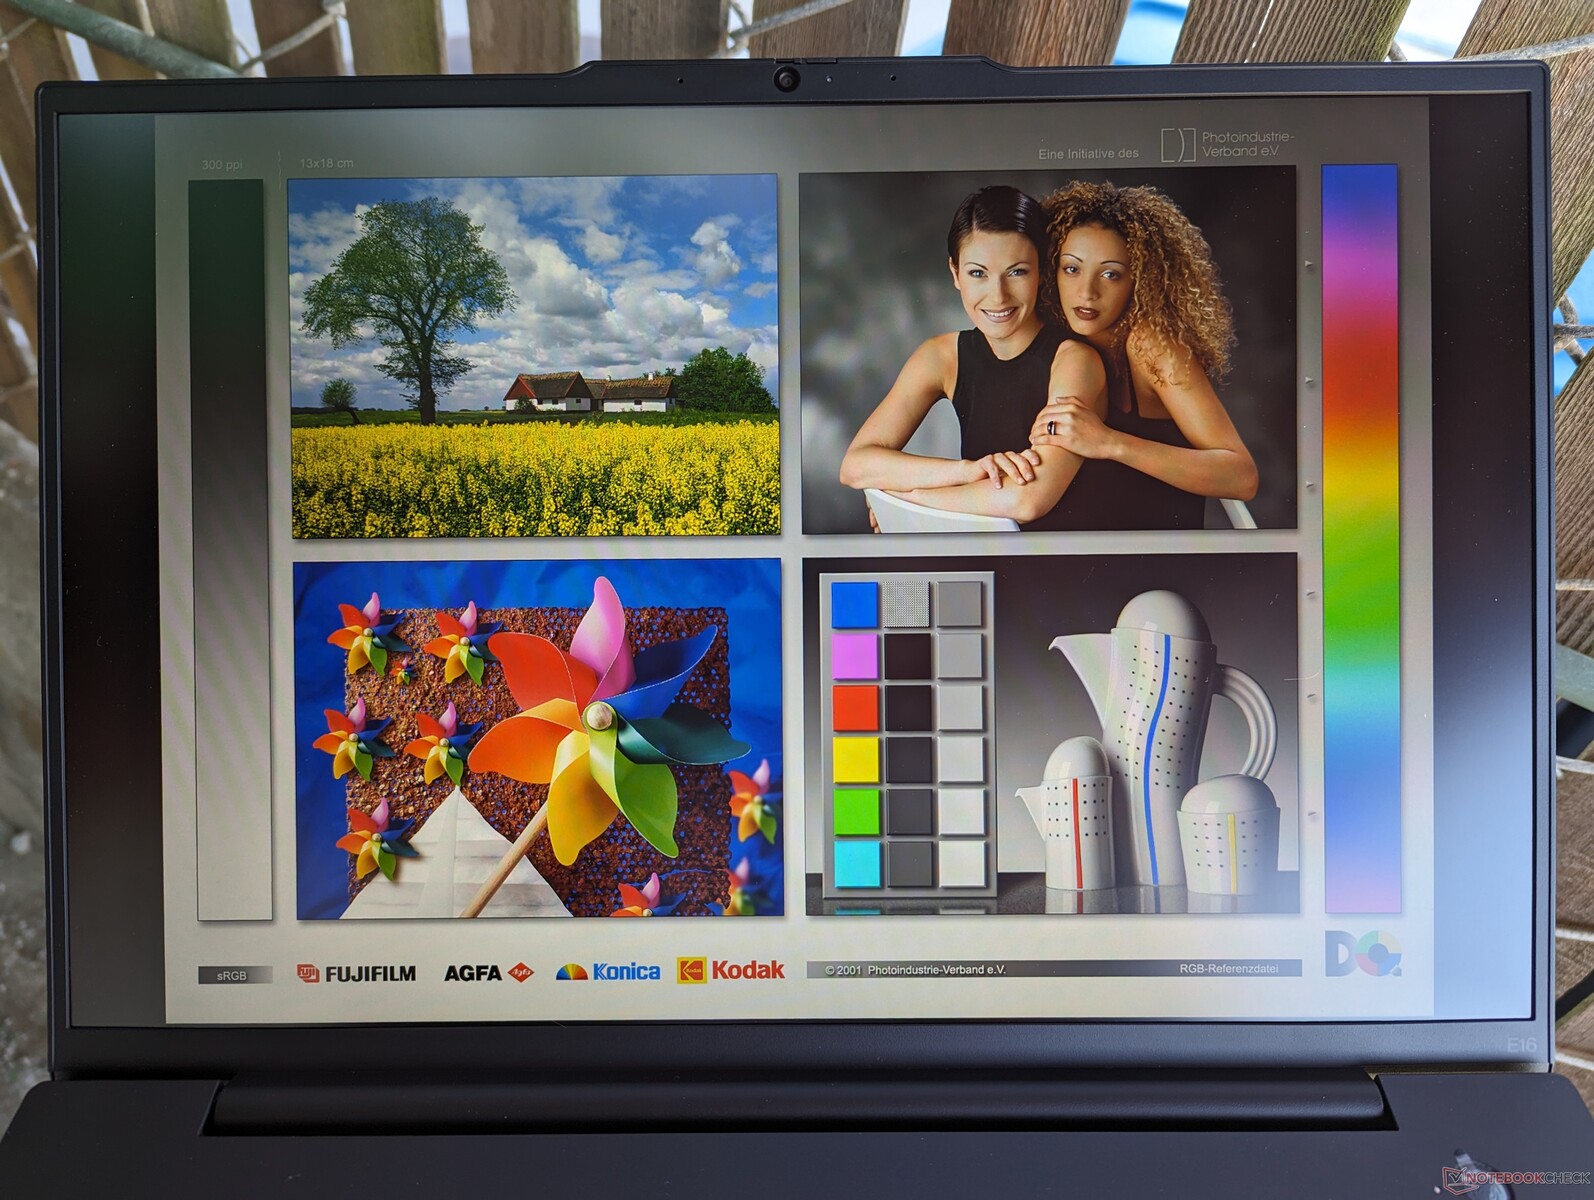
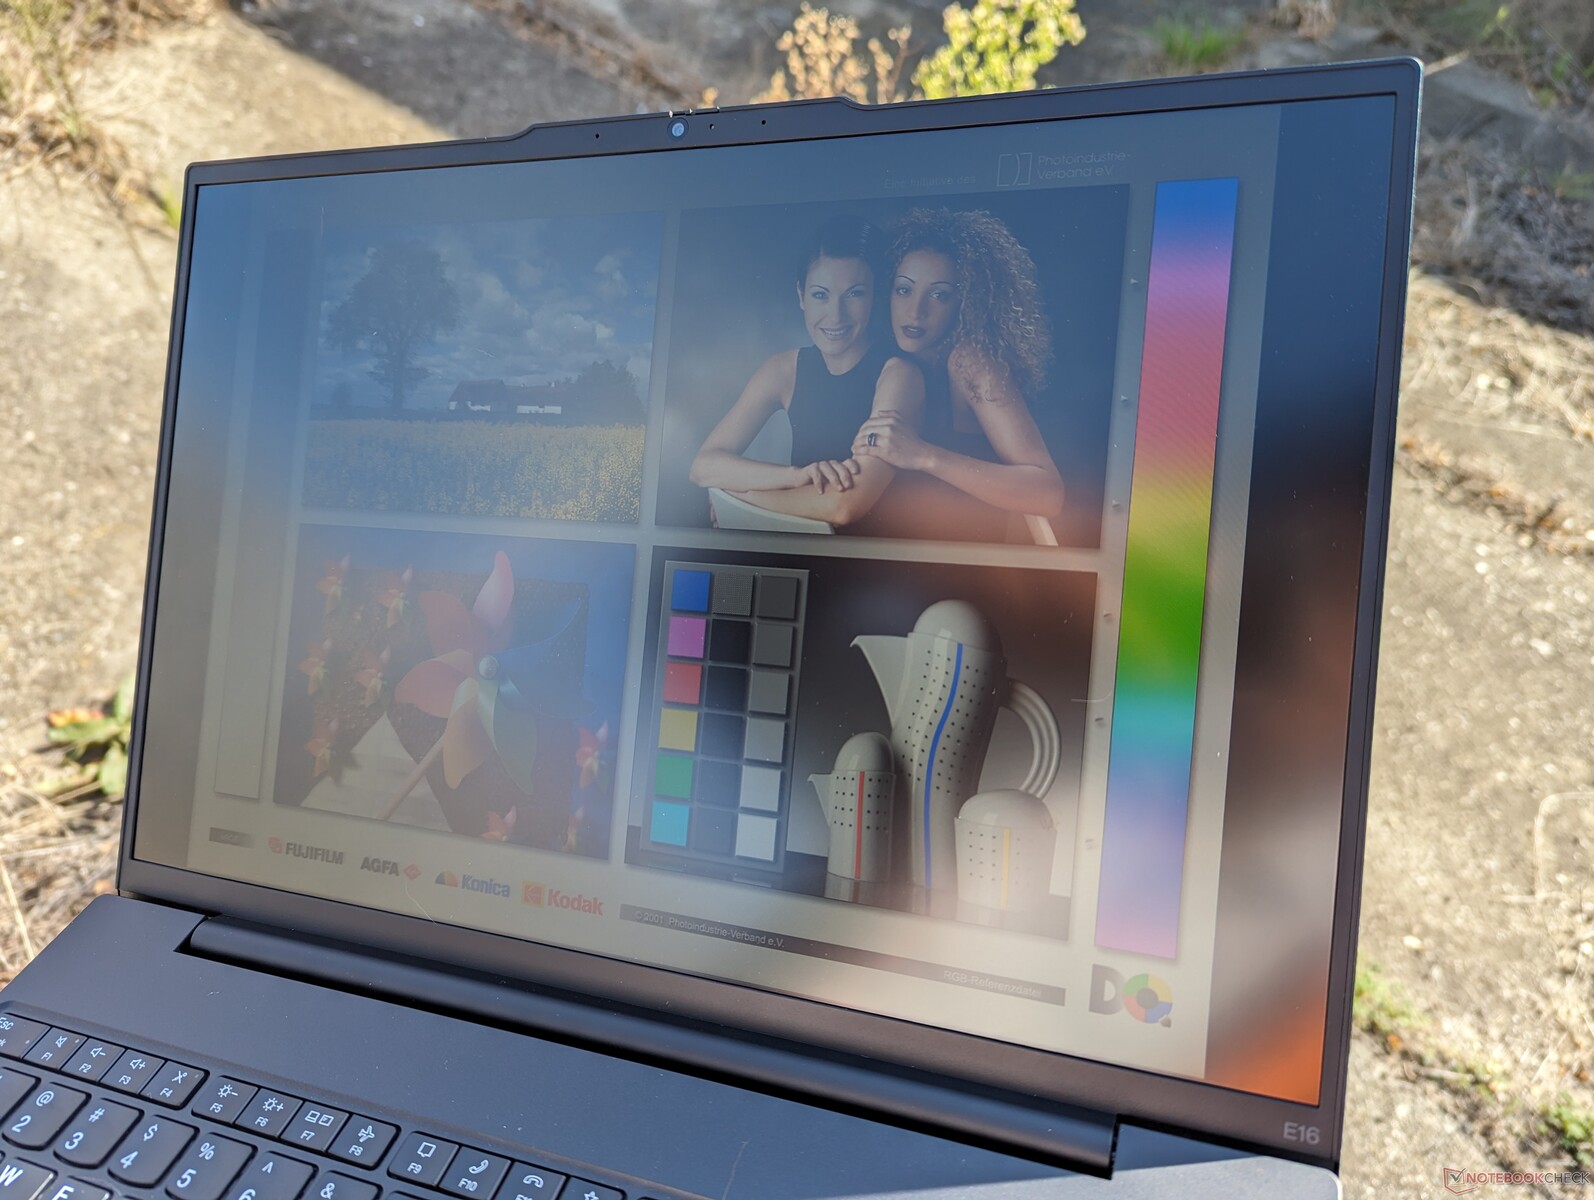
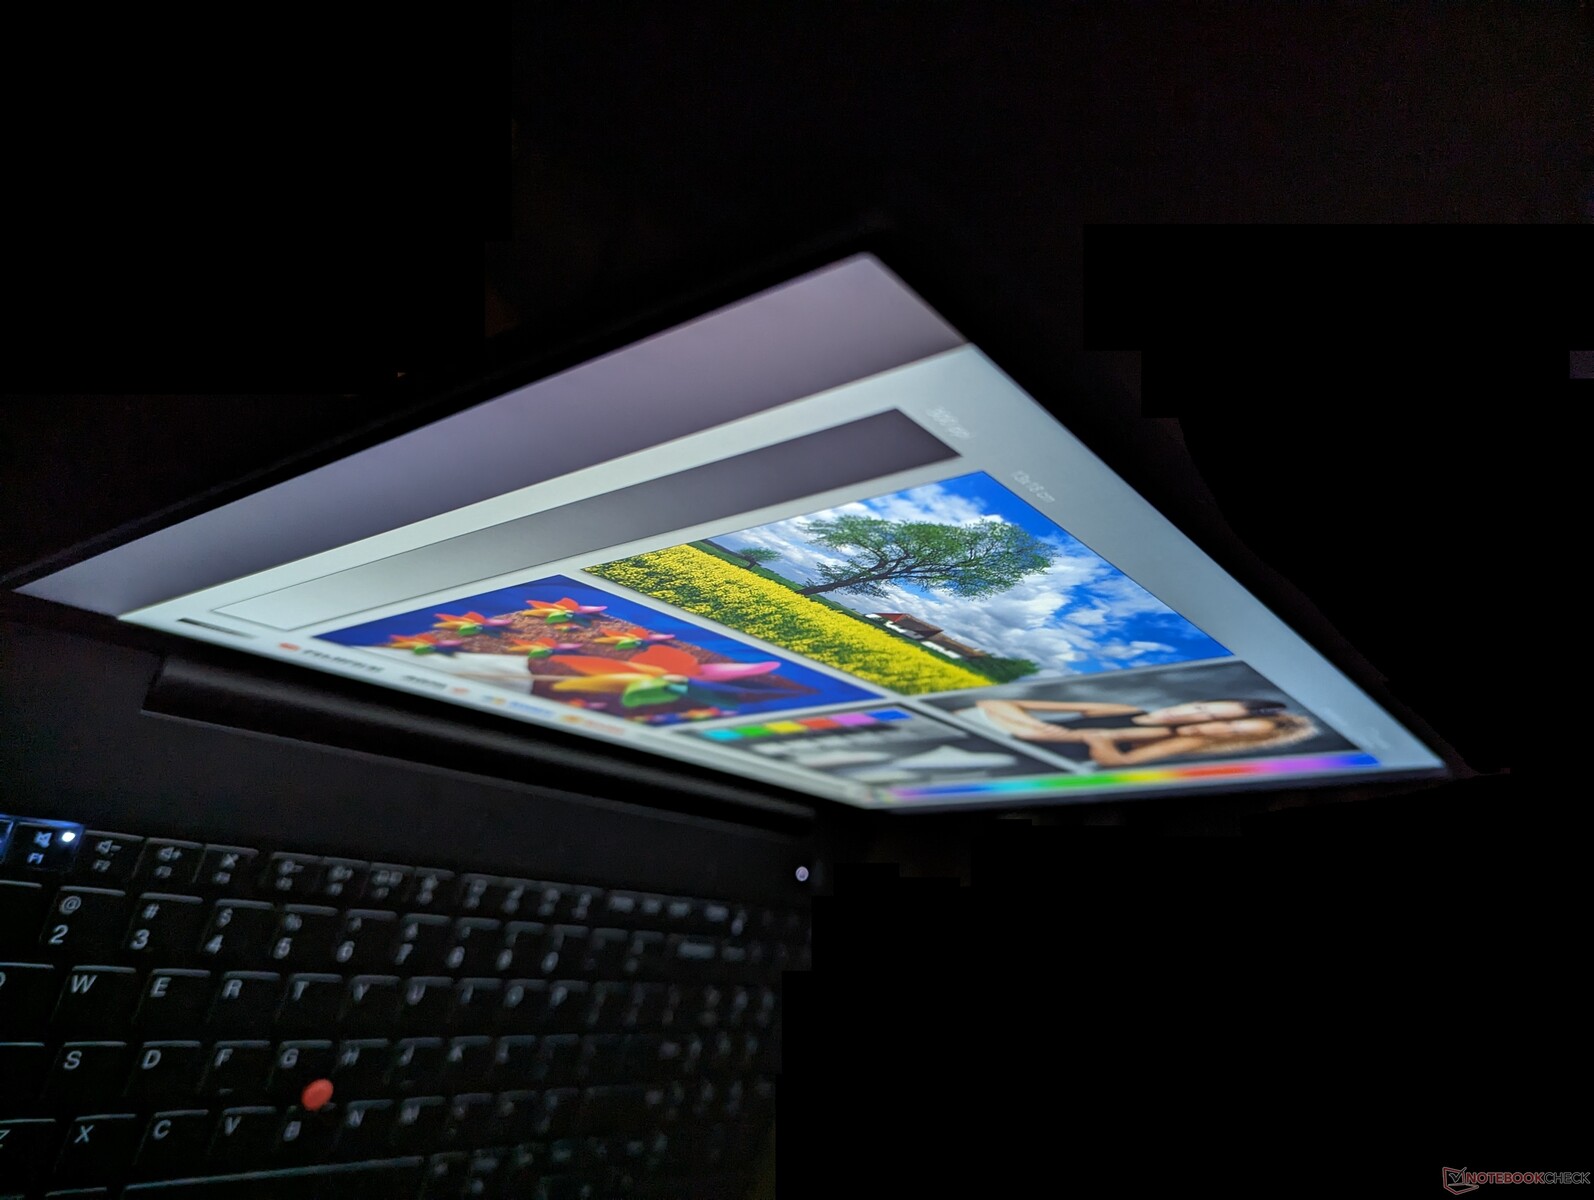
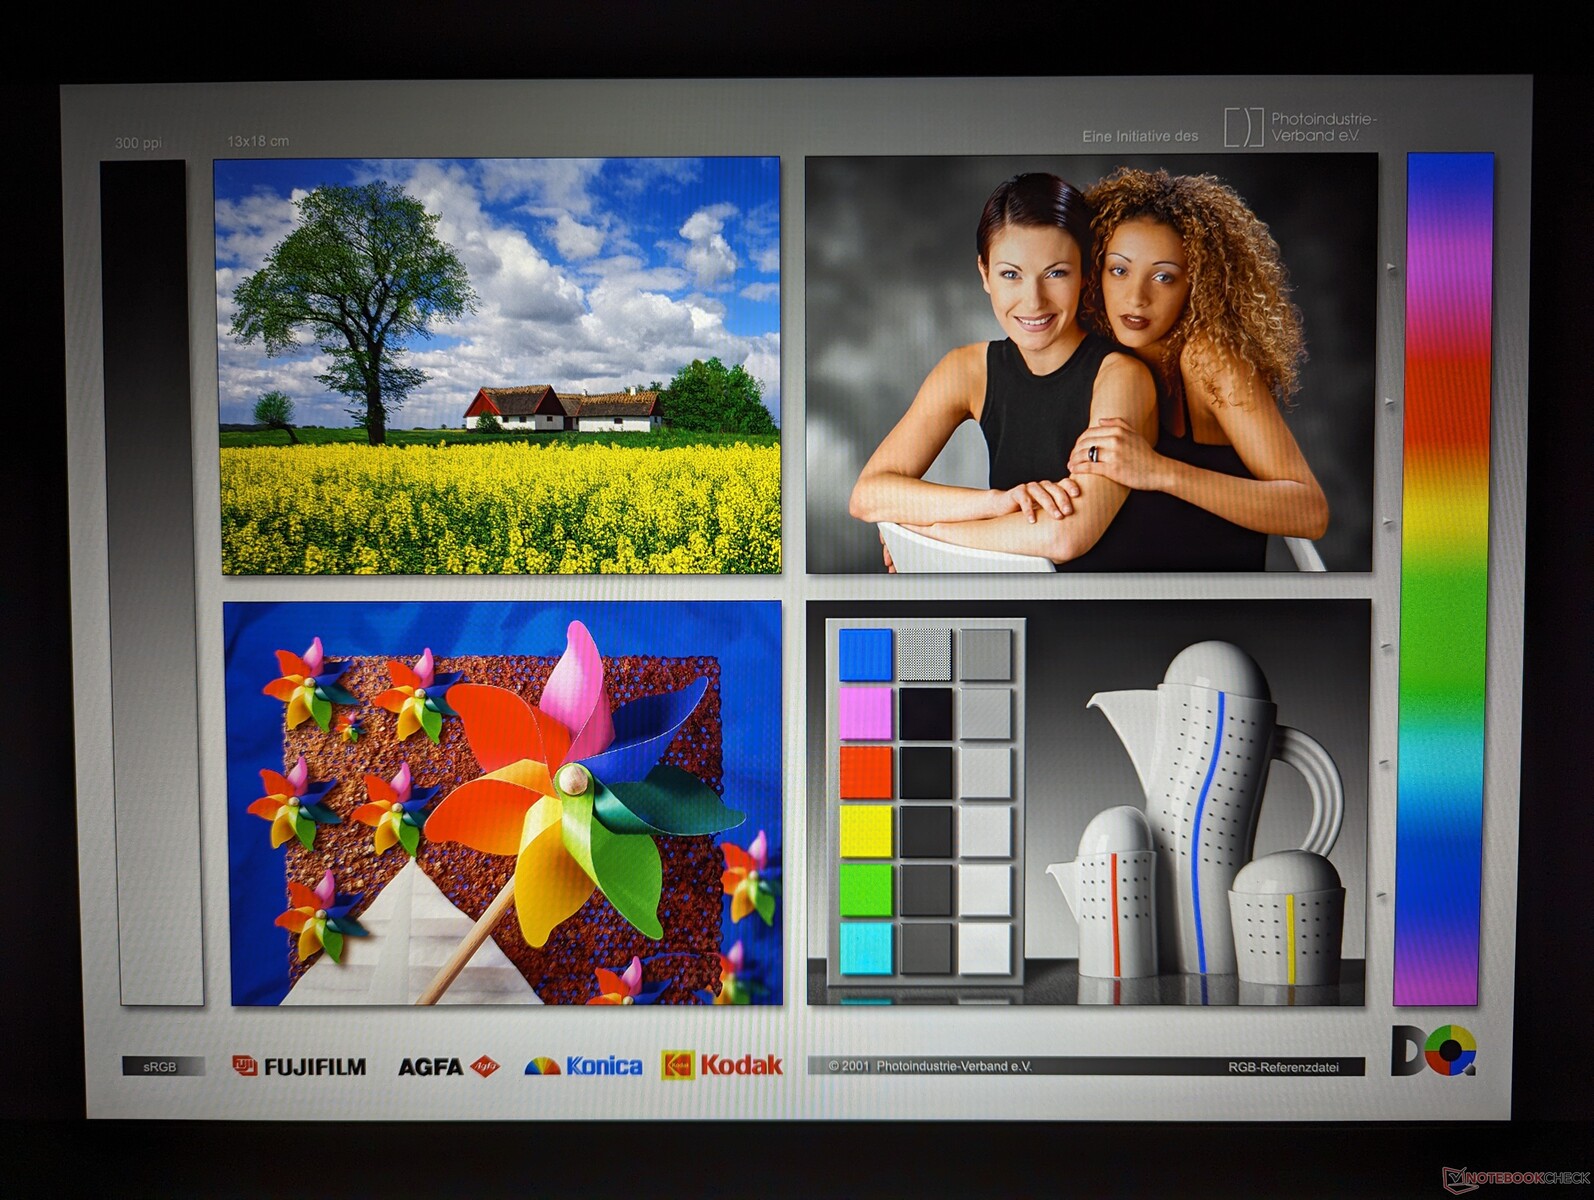
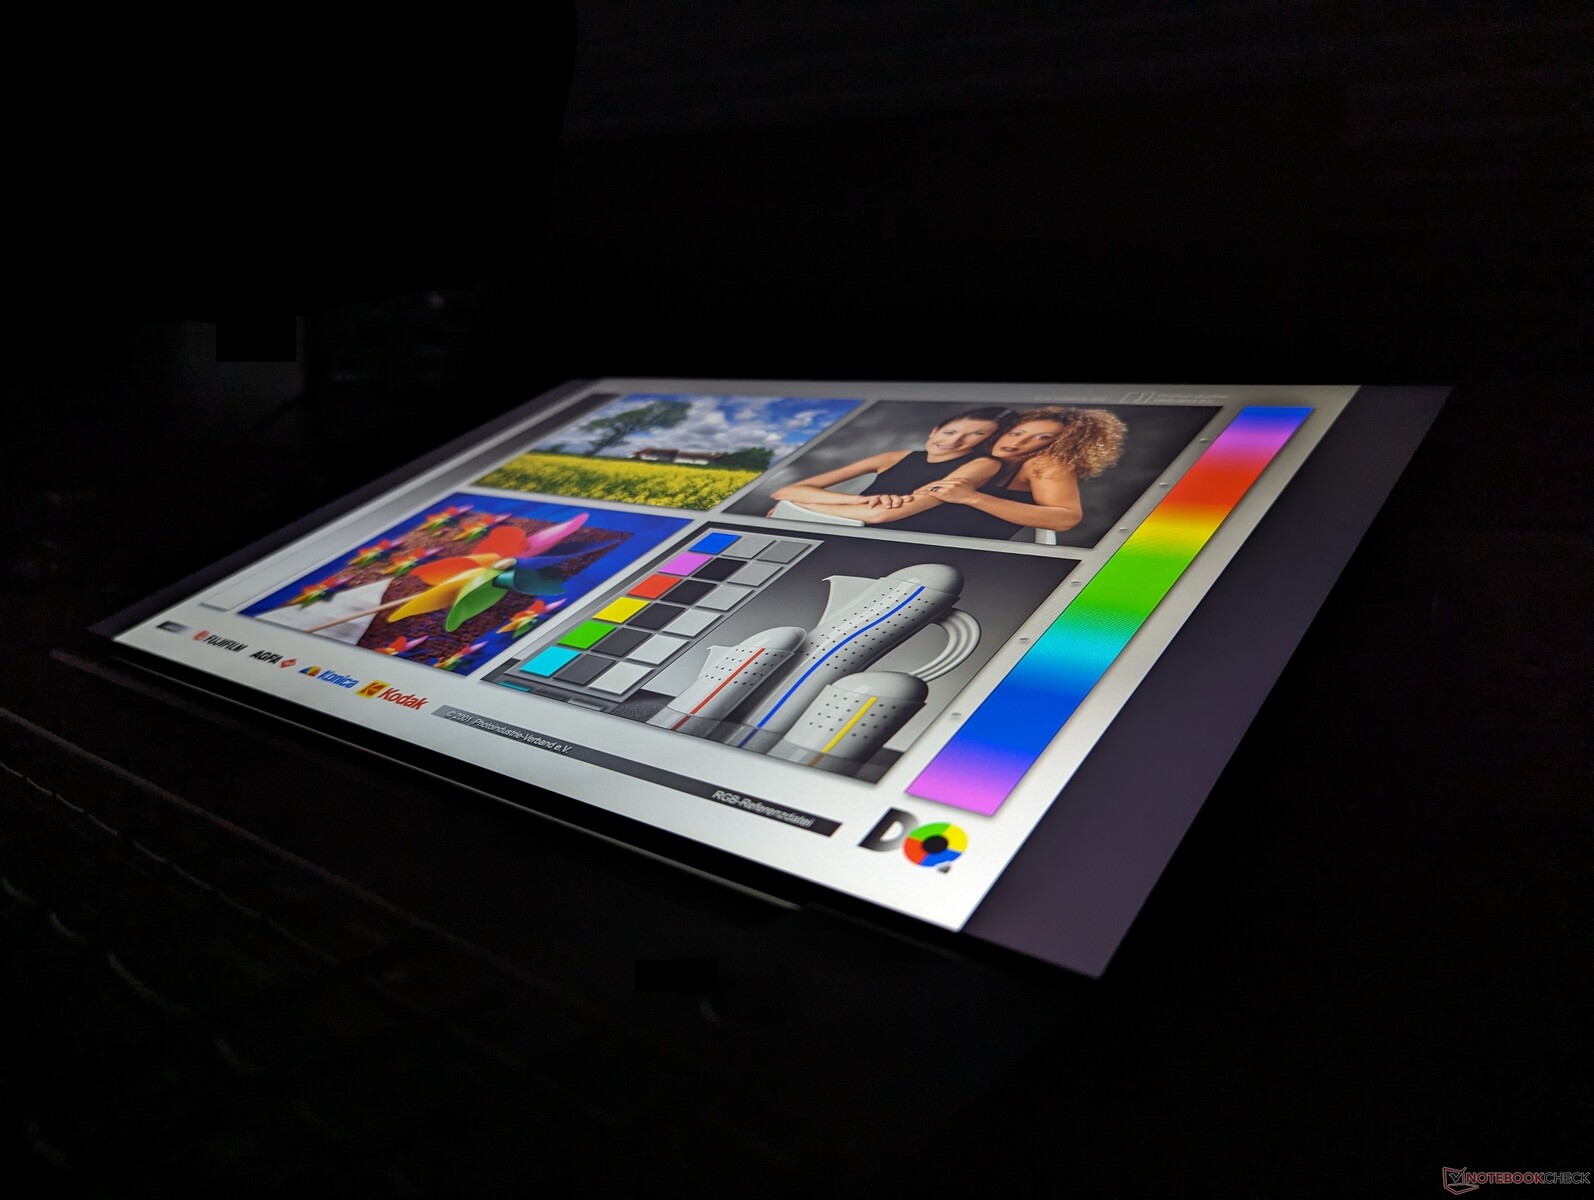
Weergave
Er zijn vier matte IPS-opties beschikbaar:
- 1200p, 60% sRGB, 300 nits, 60 Hz, niet-touch
- 1200p, 60% sRGB, 300 nits, 60 Hz, aanraakgevoelig
- 1200p, 100% sRGB, 300 nits, 60 Hz, zonder aanraken
- 1600p, 100% sRGB, 400 nits, 60 Hz, zonder aanraken
Ons specifieke Intel-reviewtoestel wordt geleverd met de vetgedrukte optie hierboven, terwijl ons AMD-toestel wordt geleverd met de 1600p-optie. De beeldkwaliteit is als dag en nacht tussen onze Intel- en AMD-units, want de laatste is scherper, levendiger en heeft snellere reactietijden voor een merkbaar betere kijkervaring. Wij raden aan om onze specifieke paneeloptie te vermijden, tenzij de touchscreen-functionaliteit een must is.
| |||||||||||||||||||||||||
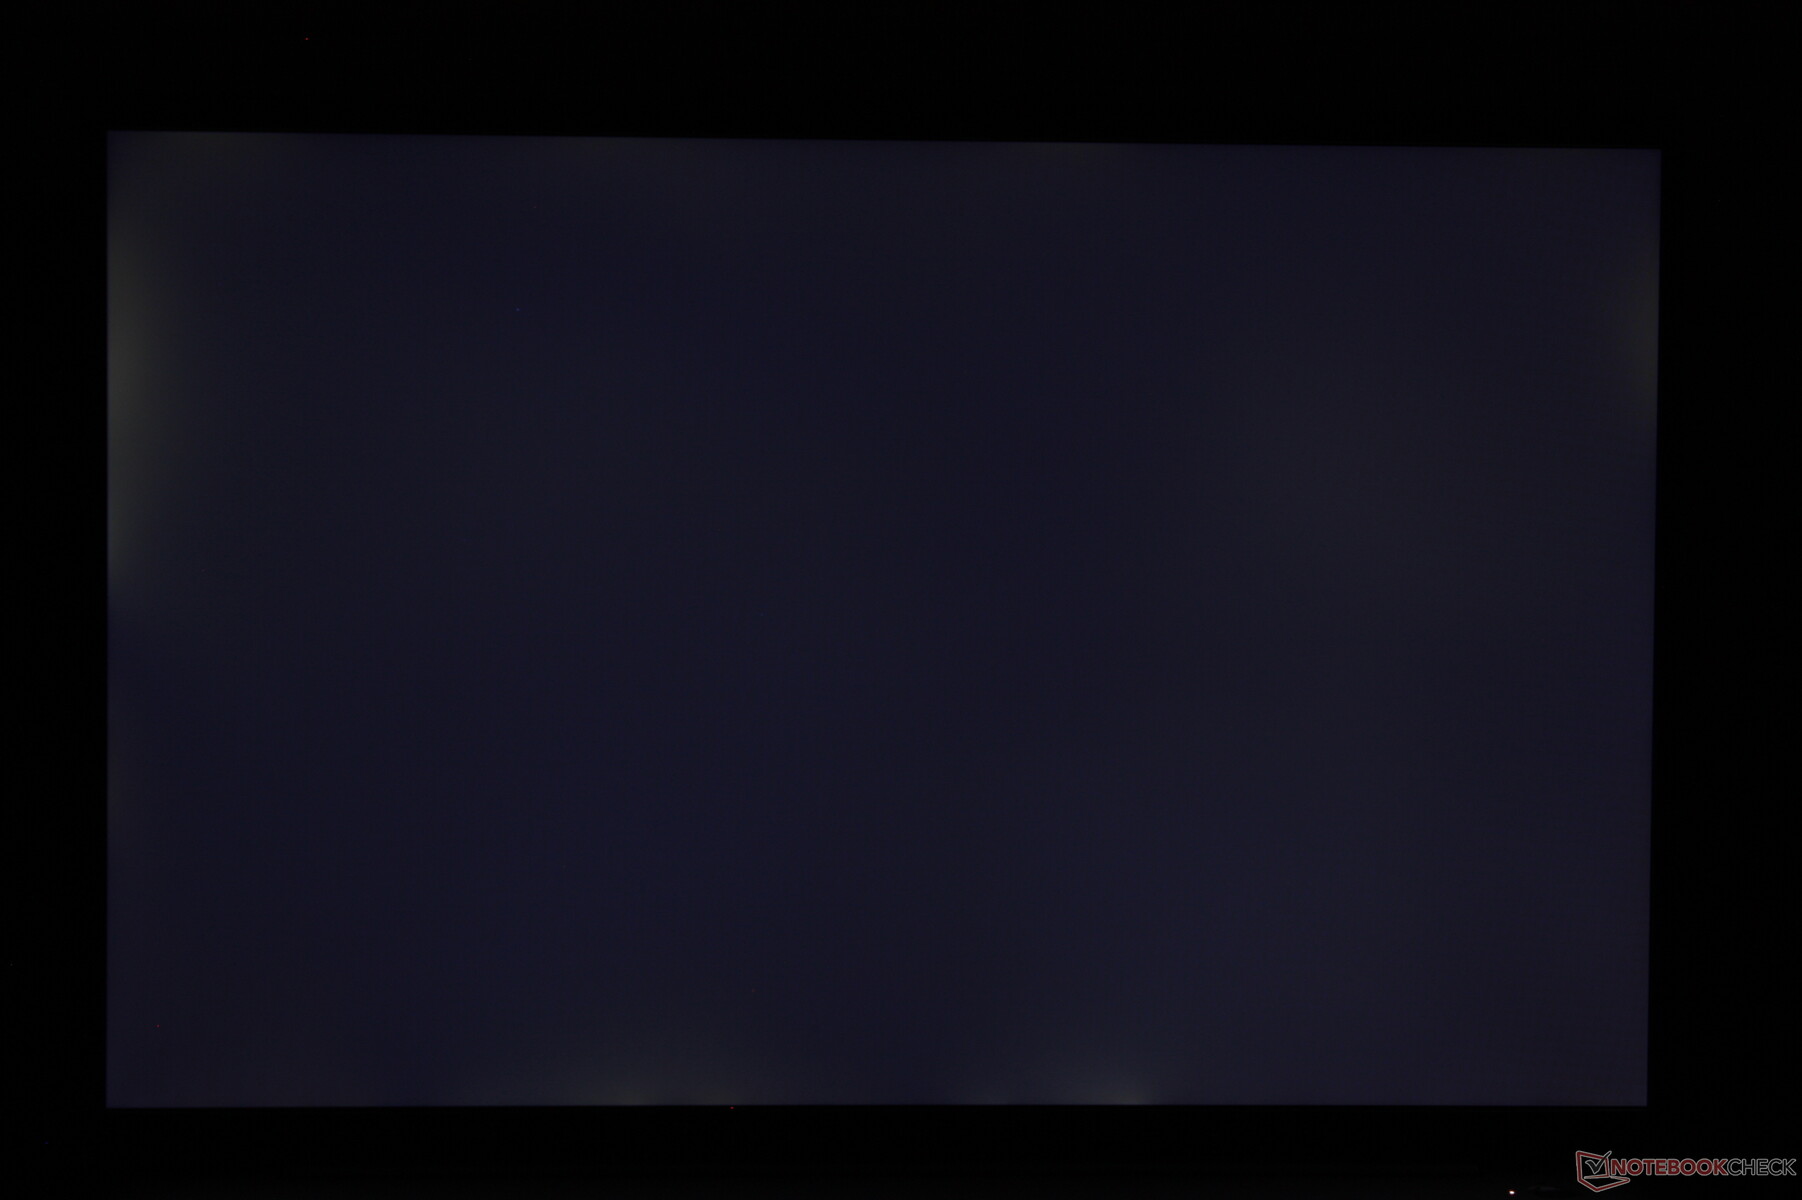
Helderheidsverdeling: 91 %
Helderheid in Batterij-modus: 318.6 cd/m²
Contrast: 1099:1 (Zwart: 0.29 cd/m²)
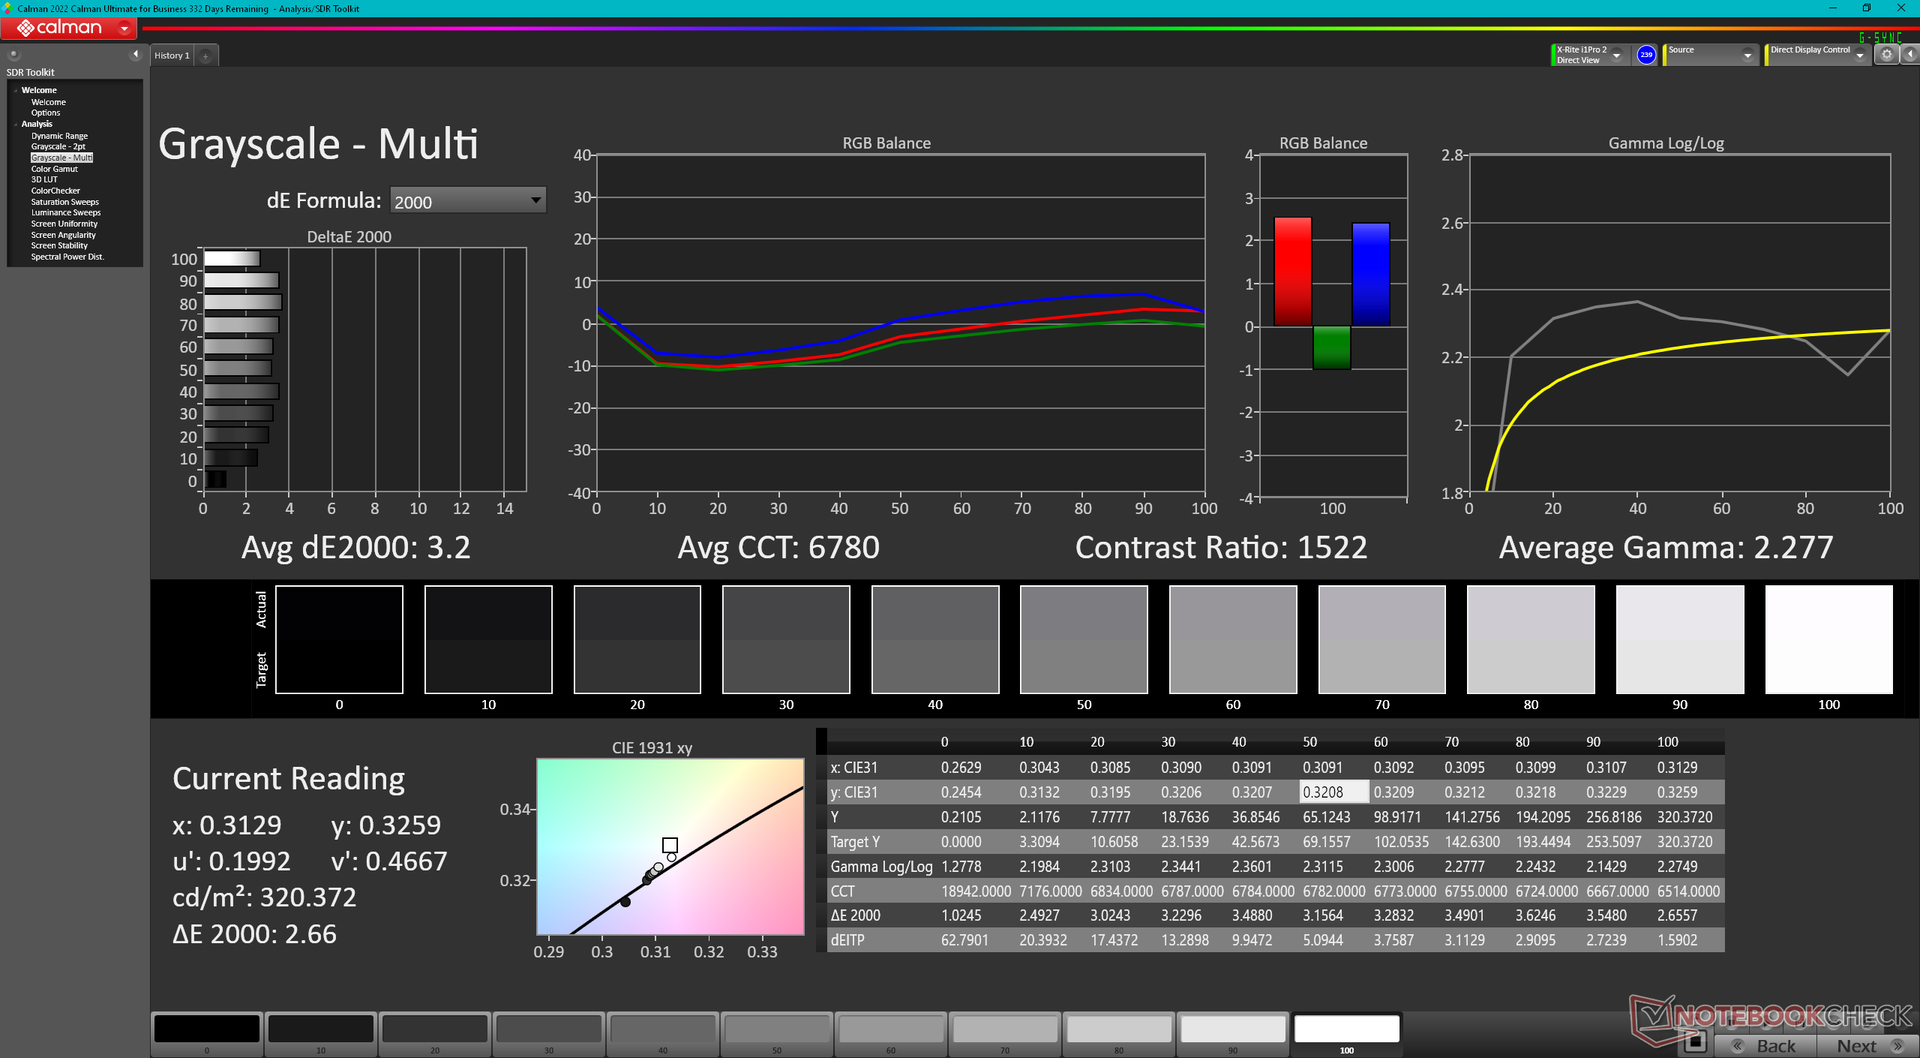
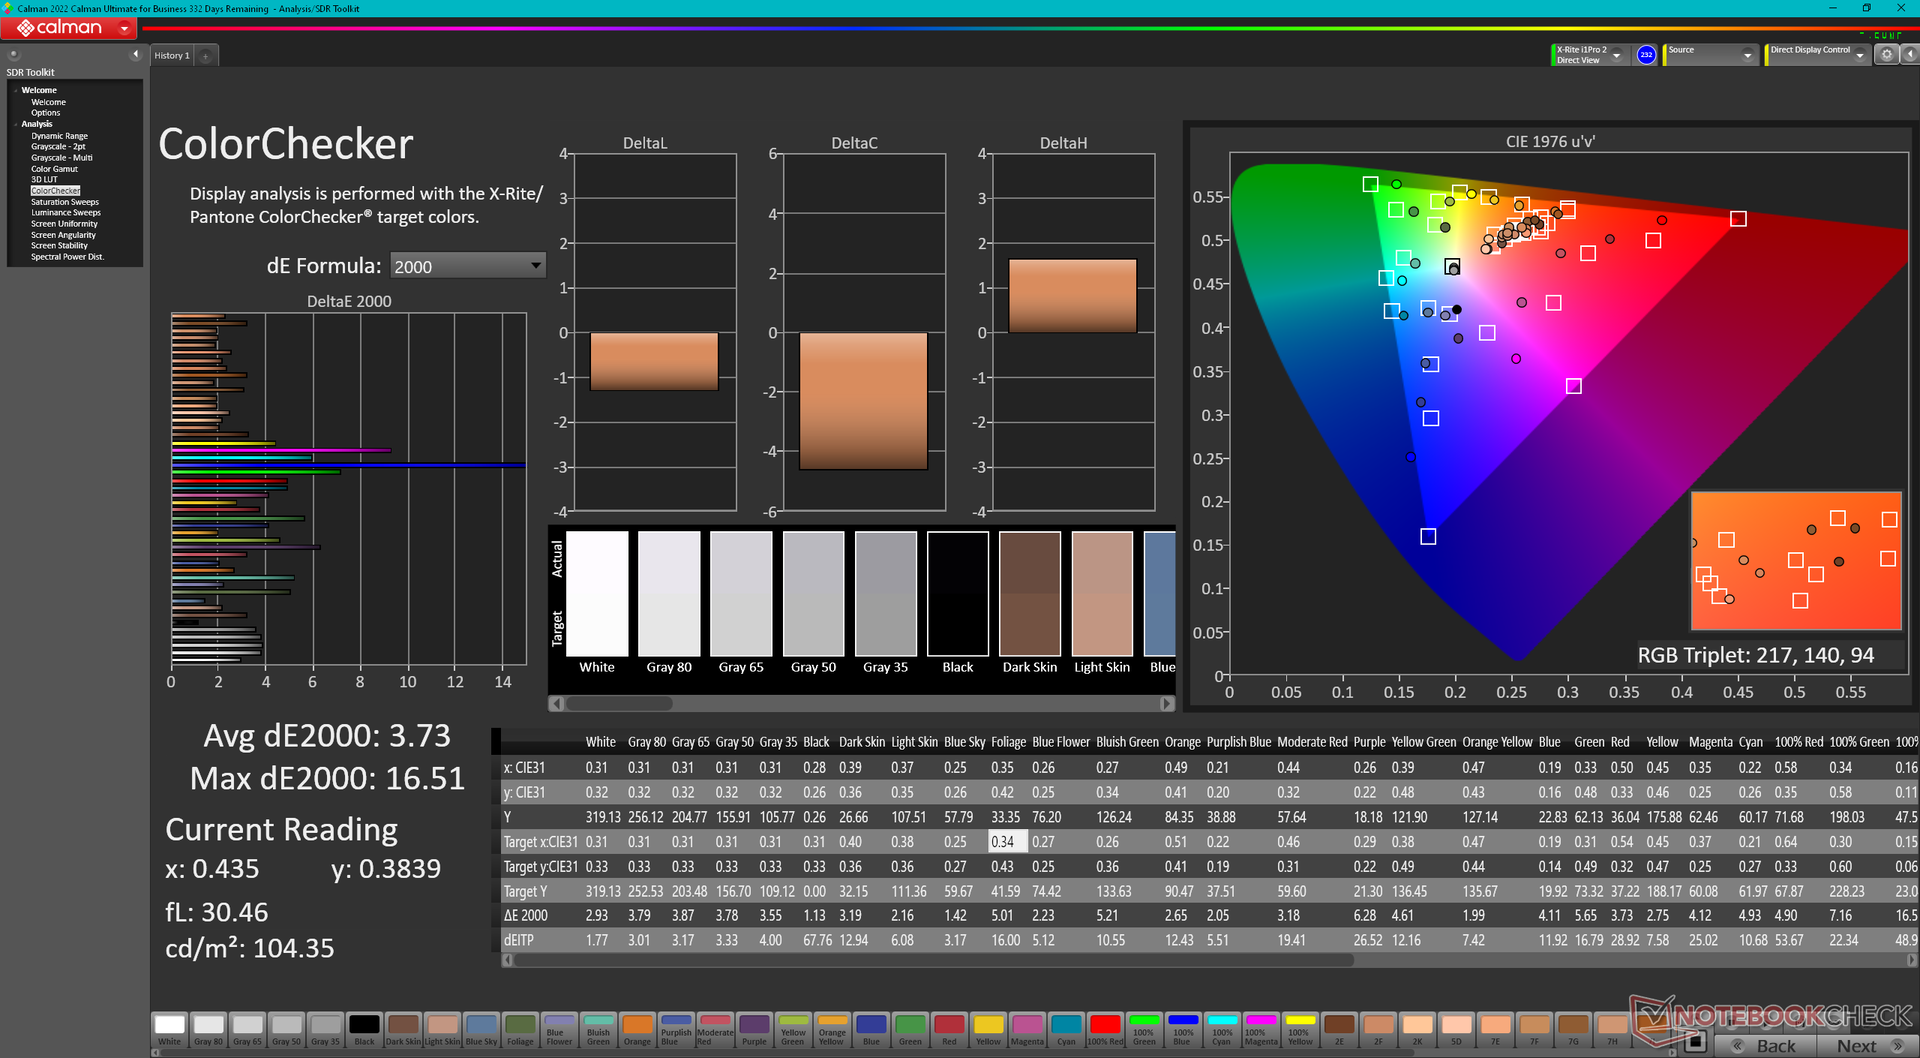
ΔE ColorChecker Calman: 3.73 | ∀{0.5-29.43 Ø4.71}
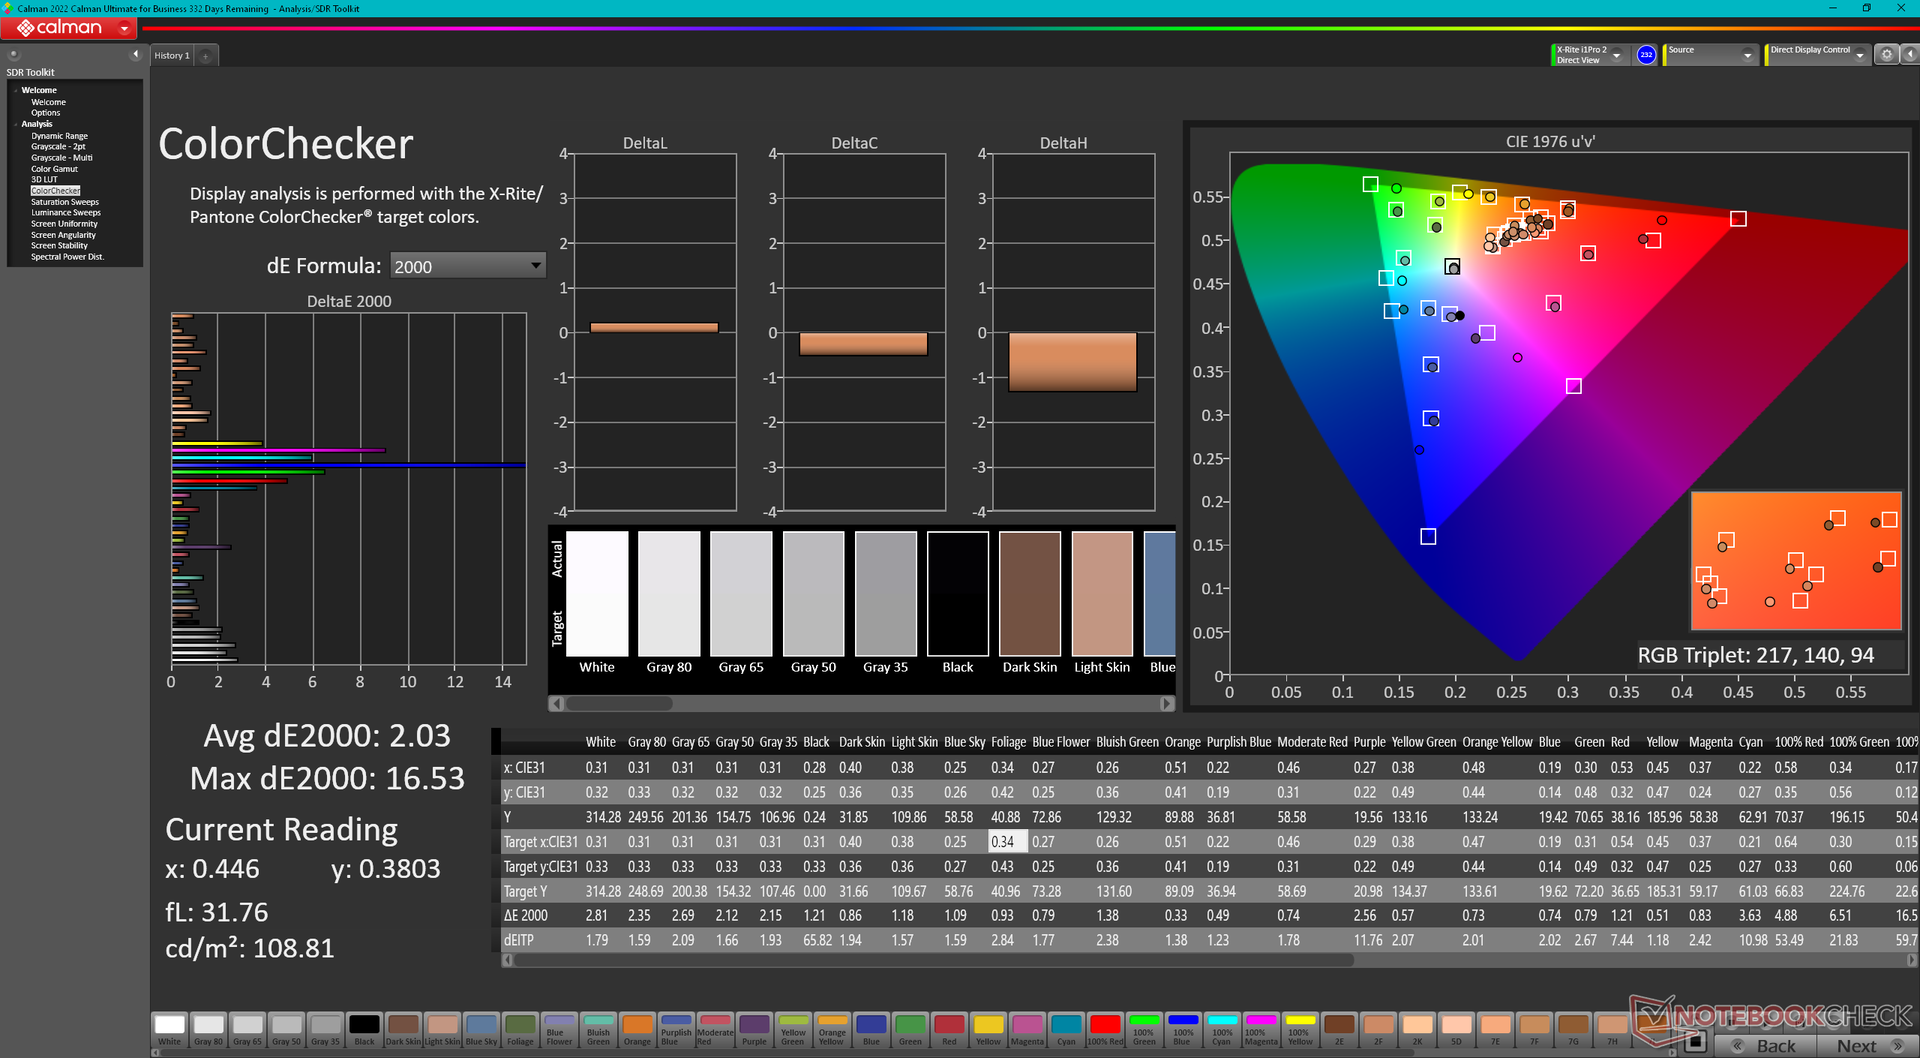
calibrated: 2.03
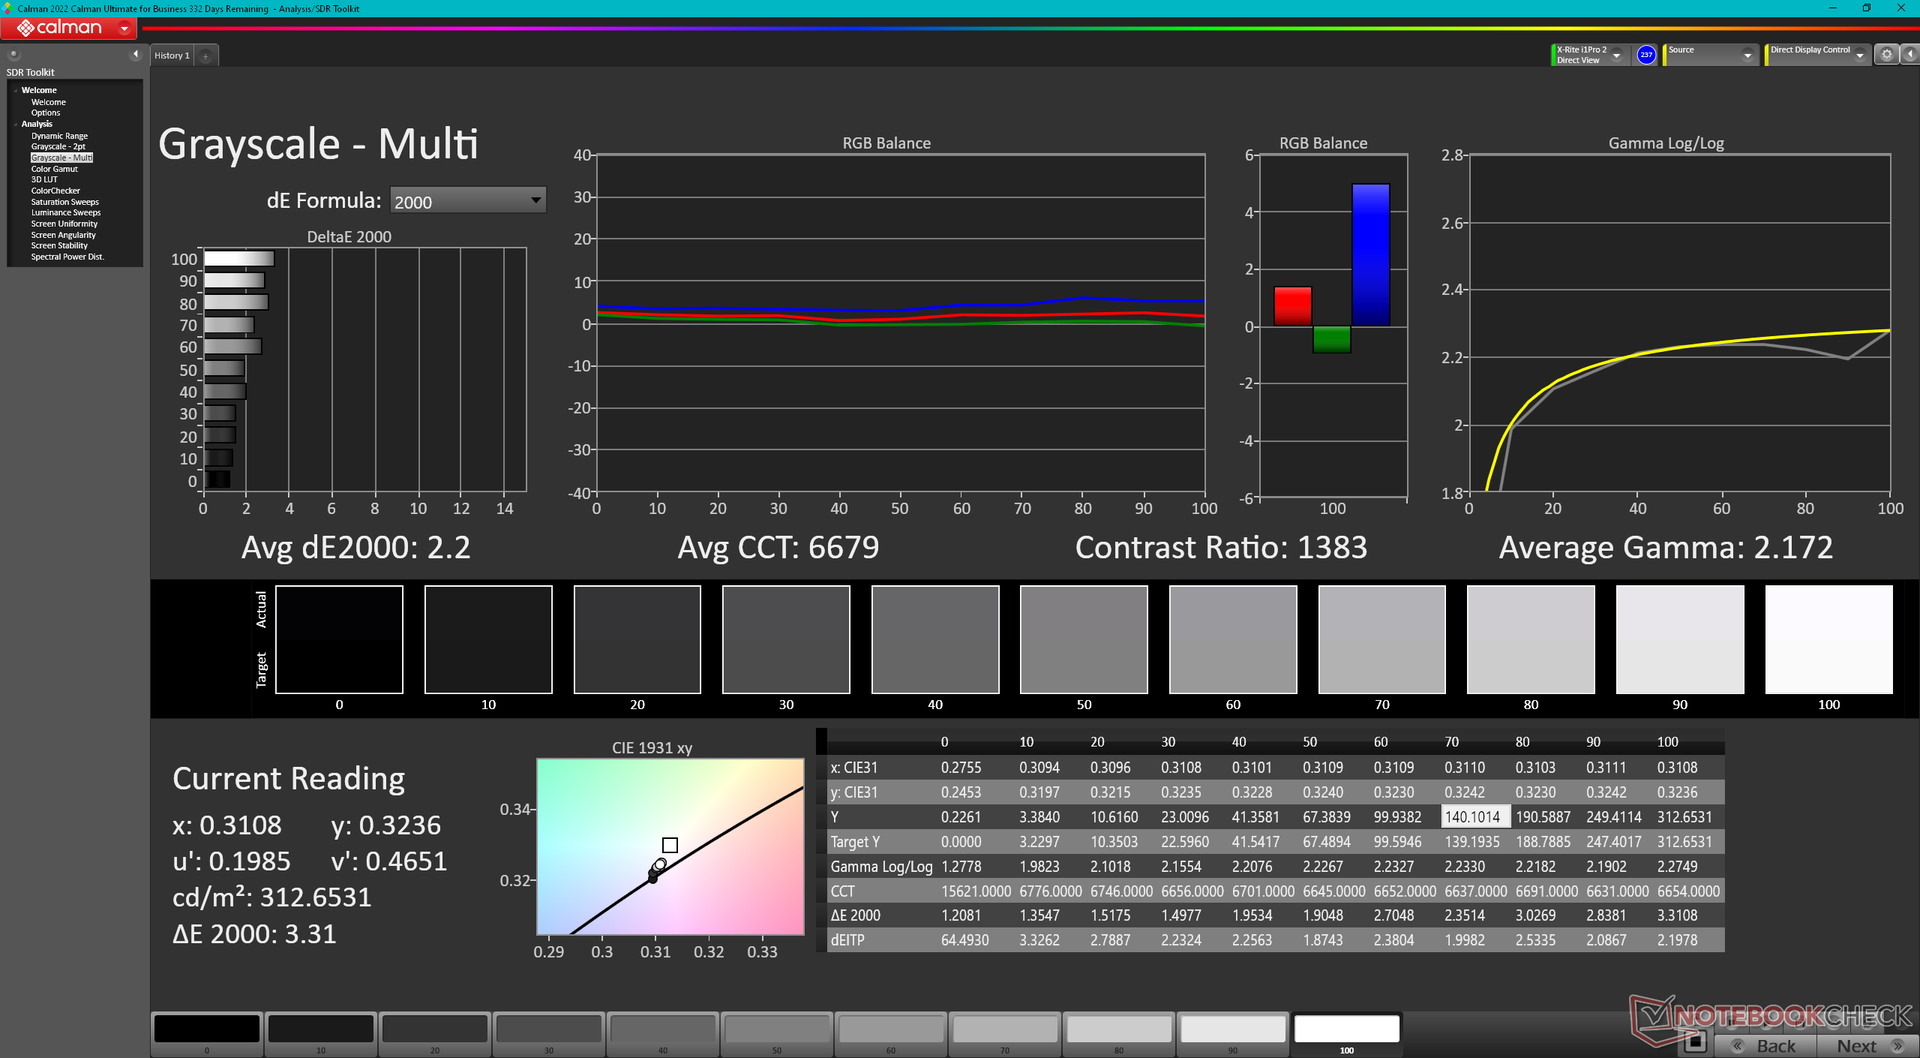
ΔE Greyscale Calman: 3.2 | ∀{0.09-98 Ø4.96}
43.3% AdobeRGB 1998 (Argyll 3D)
62.6% sRGB (Argyll 3D)
42% Display P3 (Argyll 3D)
Gamma: 2.28
CCT: 6780 K
| Lenovo ThinkPad E16 G1 Core i5-1335U R160NW41 R2, IPS, 1920x1200, 16" | Lenovo ThinkPad E16 G1-21JUS08X00 MNG007DA1-C, IPS, 2560x1600, 16" | Dell Inspiron 16 7635 2-in-1 Chi Mei 160JCA, IPS, 1920x1200, 16" | Acer TravelMate P4 TMP416-51-55KN BOE BOE0A32, IPS, 1920x1200, 16" | Samsung Galaxy Book3 Pro 16 Samsung ATNA60CL03-0, AMOLED, 2880x1800, 16" | LG Gram 16Z90Q LG LP160WQ1-SPB2 (LGD06EB), IPS, 2560x1600, 16" | |
|---|---|---|---|---|---|---|
| Display | 58% | 59% | -7% | 107% | 95% | |
| Display P3 Coverage (%) | 42 | 67.6 61% | 67.4 60% | 38.9 -7% | 99.7 137% | 96.8 130% |
| sRGB Coverage (%) | 62.6 | 95.3 52% | 98.2 57% | 58.1 -7% | 100 60% | 99.9 60% |
| AdobeRGB 1998 Coverage (%) | 43.3 | 70 62% | 69.5 61% | 40.2 -7% | 97 124% | 84.6 95% |
| Response Times | 30% | 38% | 62% | 95% | 16% | |
| Response Time Grey 50% / Grey 80% * (ms) | 46.4 ? | 32.4 ? 30% | 27.6 ? 41% | 20 ? 57% | 2 ? 96% | 45.7 ? 2% |
| Response Time Black / White * (ms) | 27.6 ? | 19.6 ? 29% | 18.2 ? 34% | 9 ? 67% | 2 ? 93% | 19.7 ? 29% |
| PWM Frequency (Hz) | ||||||
| Screen | 30% | 12% | -20% | 295% | 13% | |
| Brightness middle (cd/m²) | 318.6 | 404 27% | 301.3 -5% | 269 -16% | 412 29% | 366 15% |
| Brightness (cd/m²) | 302 | 389 29% | 269 -11% | 265 -12% | 412 36% | 347 15% |
| Brightness Distribution (%) | 91 | 91 0% | 79 -13% | 94 3% | 98 8% | 89 -2% |
| Black Level * (cd/m²) | 0.29 | 0.24 17% | 0.28 3% | 0.305 -5% | 0.015 95% | 0.32 -10% |
| Contrast (:1) | 1099 | 1683 53% | 1076 -2% | 882 -20% | 27467 2399% | 1144 4% |
| Colorchecker dE 2000 * | 3.73 | 2.1 44% | 3.1 17% | 4.89 -31% | 2.34 37% | 2.82 24% |
| Colorchecker dE 2000 max. * | 16.51 | 4.2 75% | 5.5 67% | 8.81 47% | 3.34 80% | 4.65 72% |
| Colorchecker dE 2000 calibrated * | 2.03 | 1.4 31% | 0.49 76% | 5.12 -152% | 2.95 -45% | 2.69 -33% |
| Greyscale dE 2000 * | 3.2 | 3.3 -3% | 3.9 -22% | 2.91 9% | 2.78 13% | 2.3 28% |
| Gamma | 2.28 96% | 2.24 98% | 2.19 100% | 2.28 96% | 2.5 88% | 1.971 112% |
| CCT | 6780 96% | 7038 92% | 6186 105% | 6920 94% | 6879 94% | 6796 96% |
| Totaal Gemiddelde (Programma / Instellingen) | 39% /
36% | 36% /
26% | 12% /
-5% | 166% /
226% | 41% /
31% |
* ... kleiner is beter
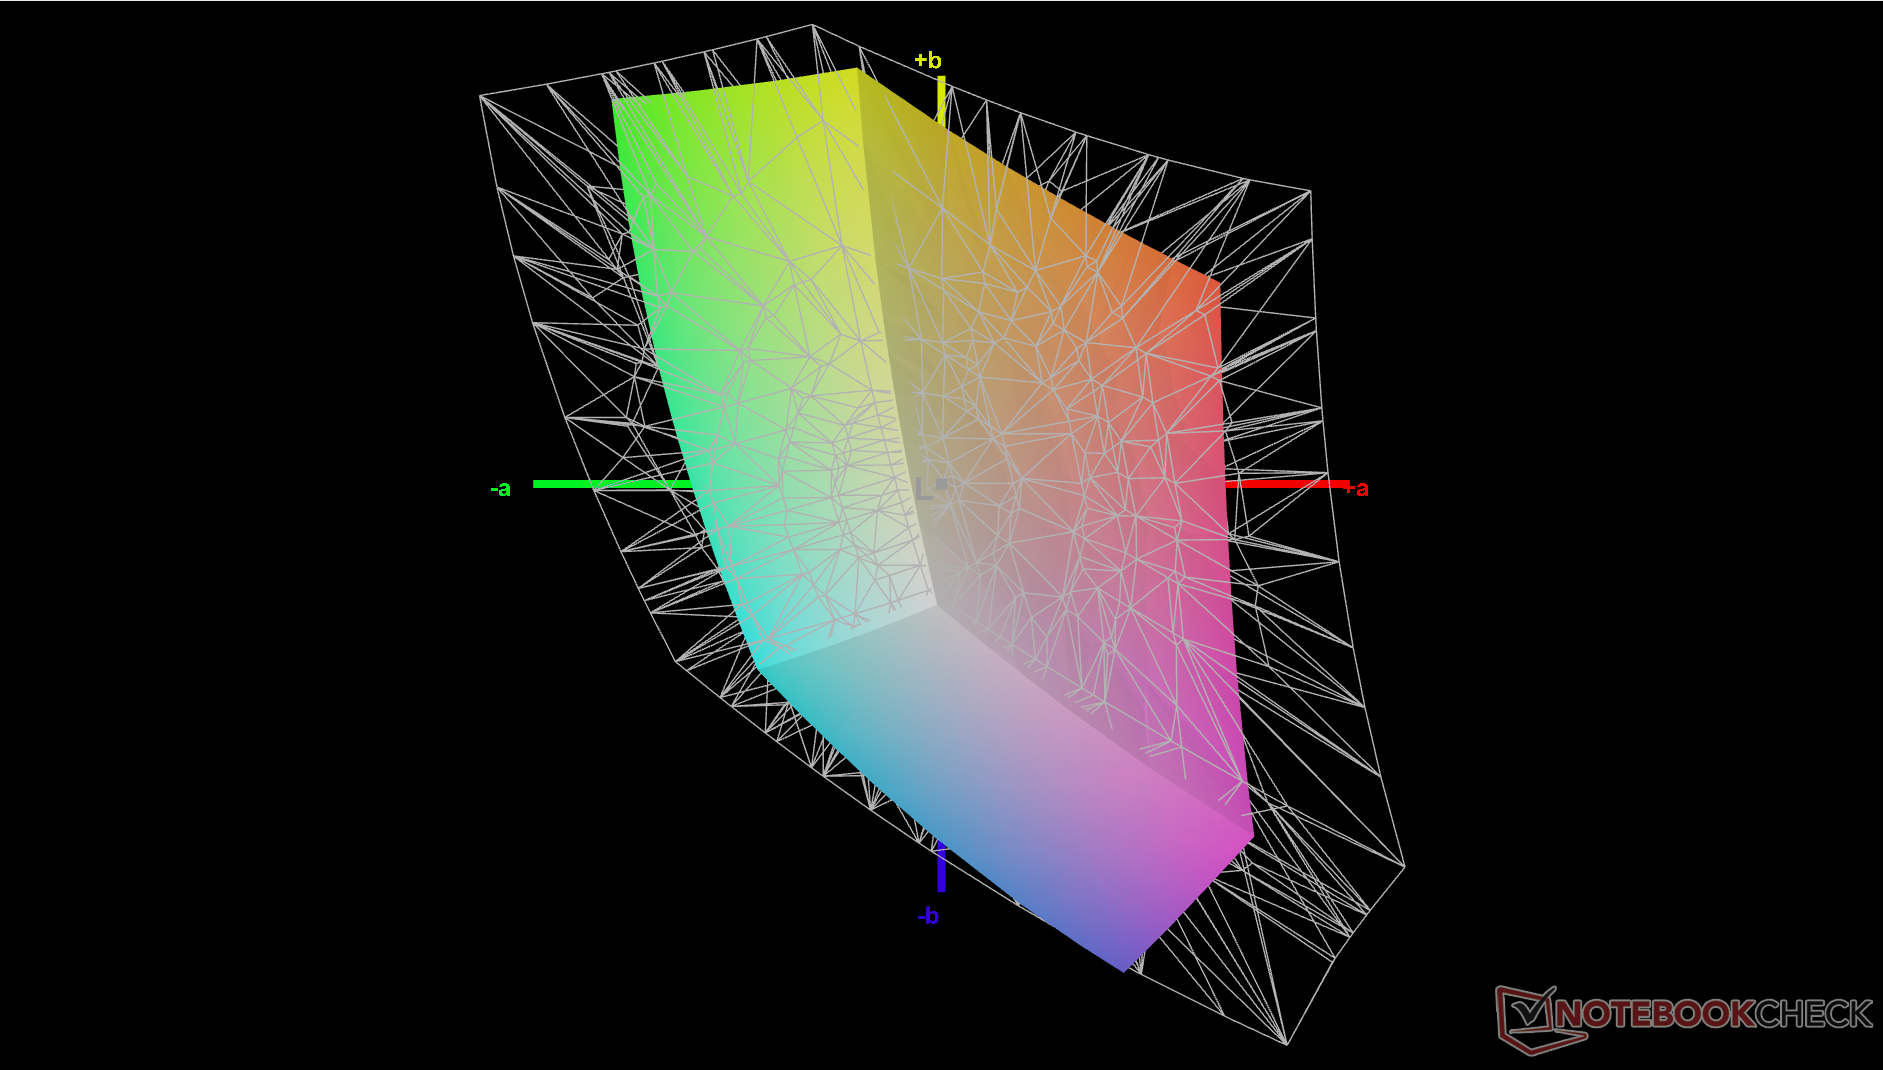
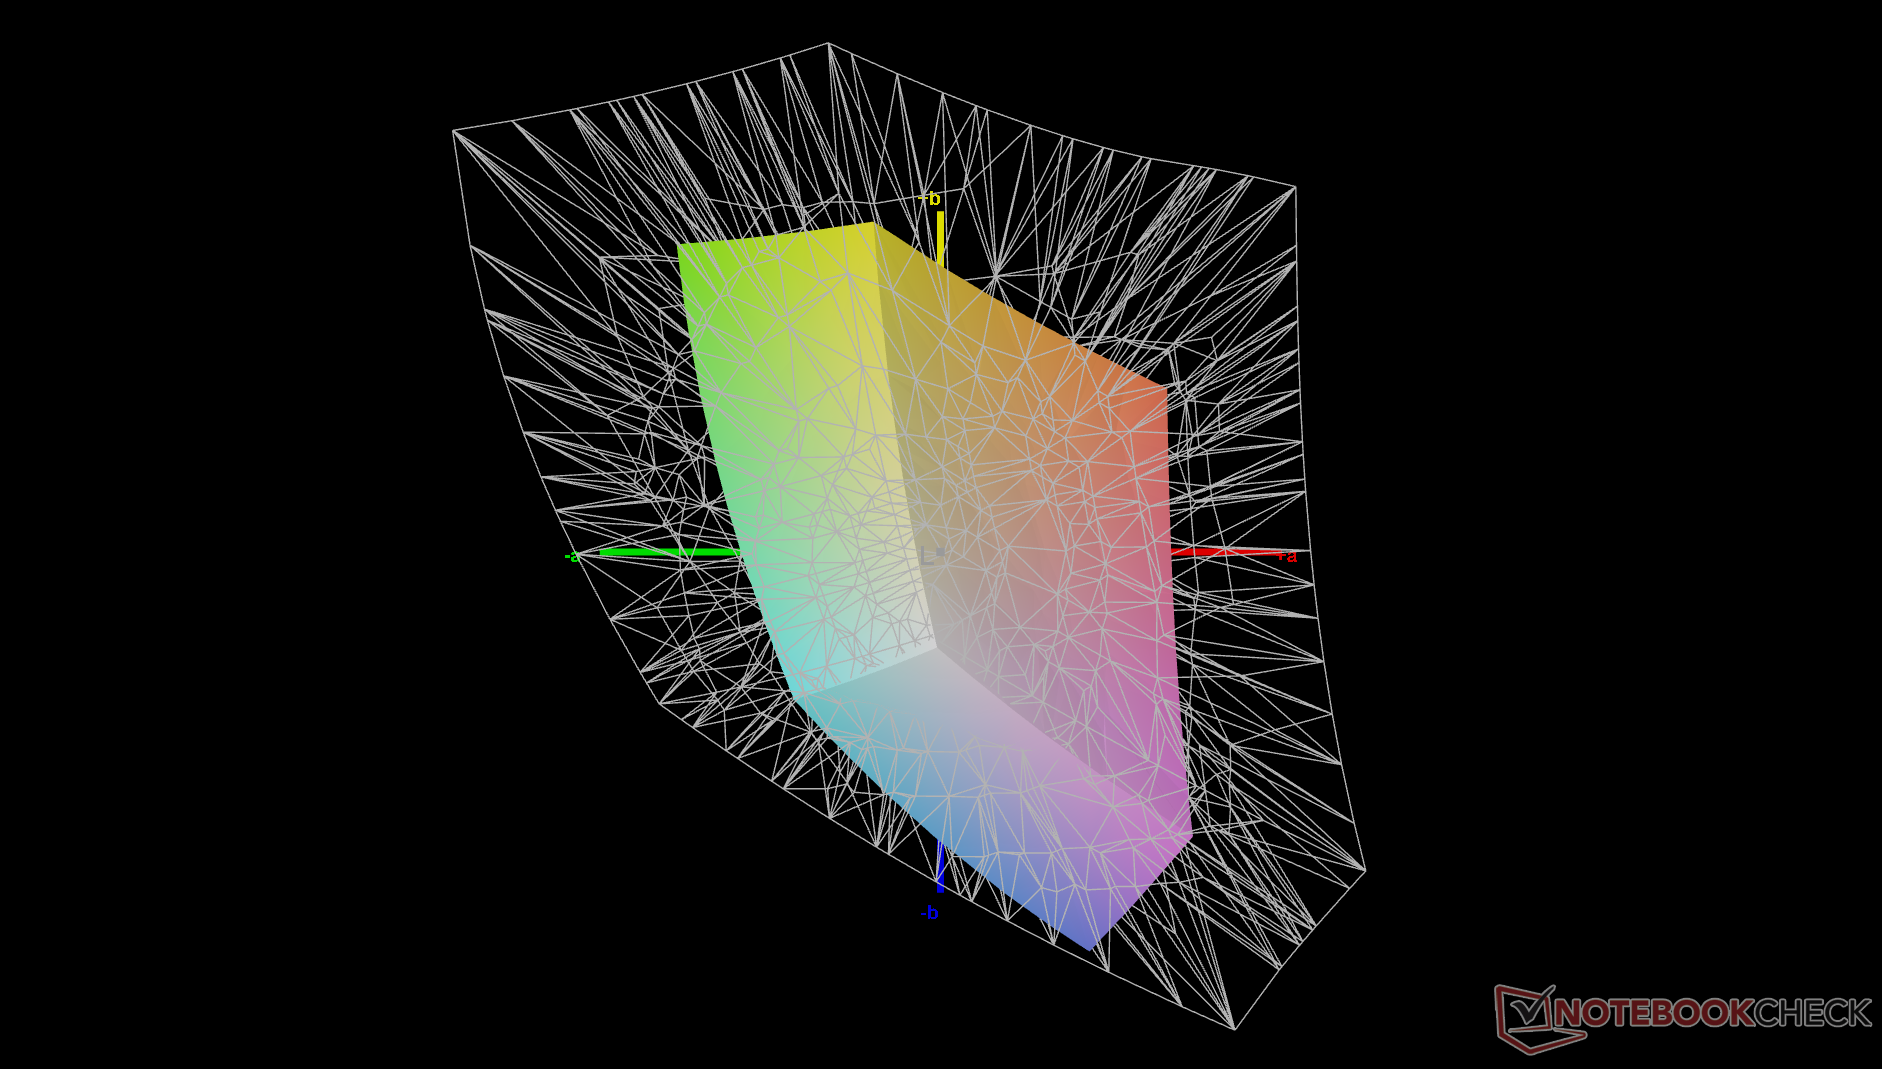
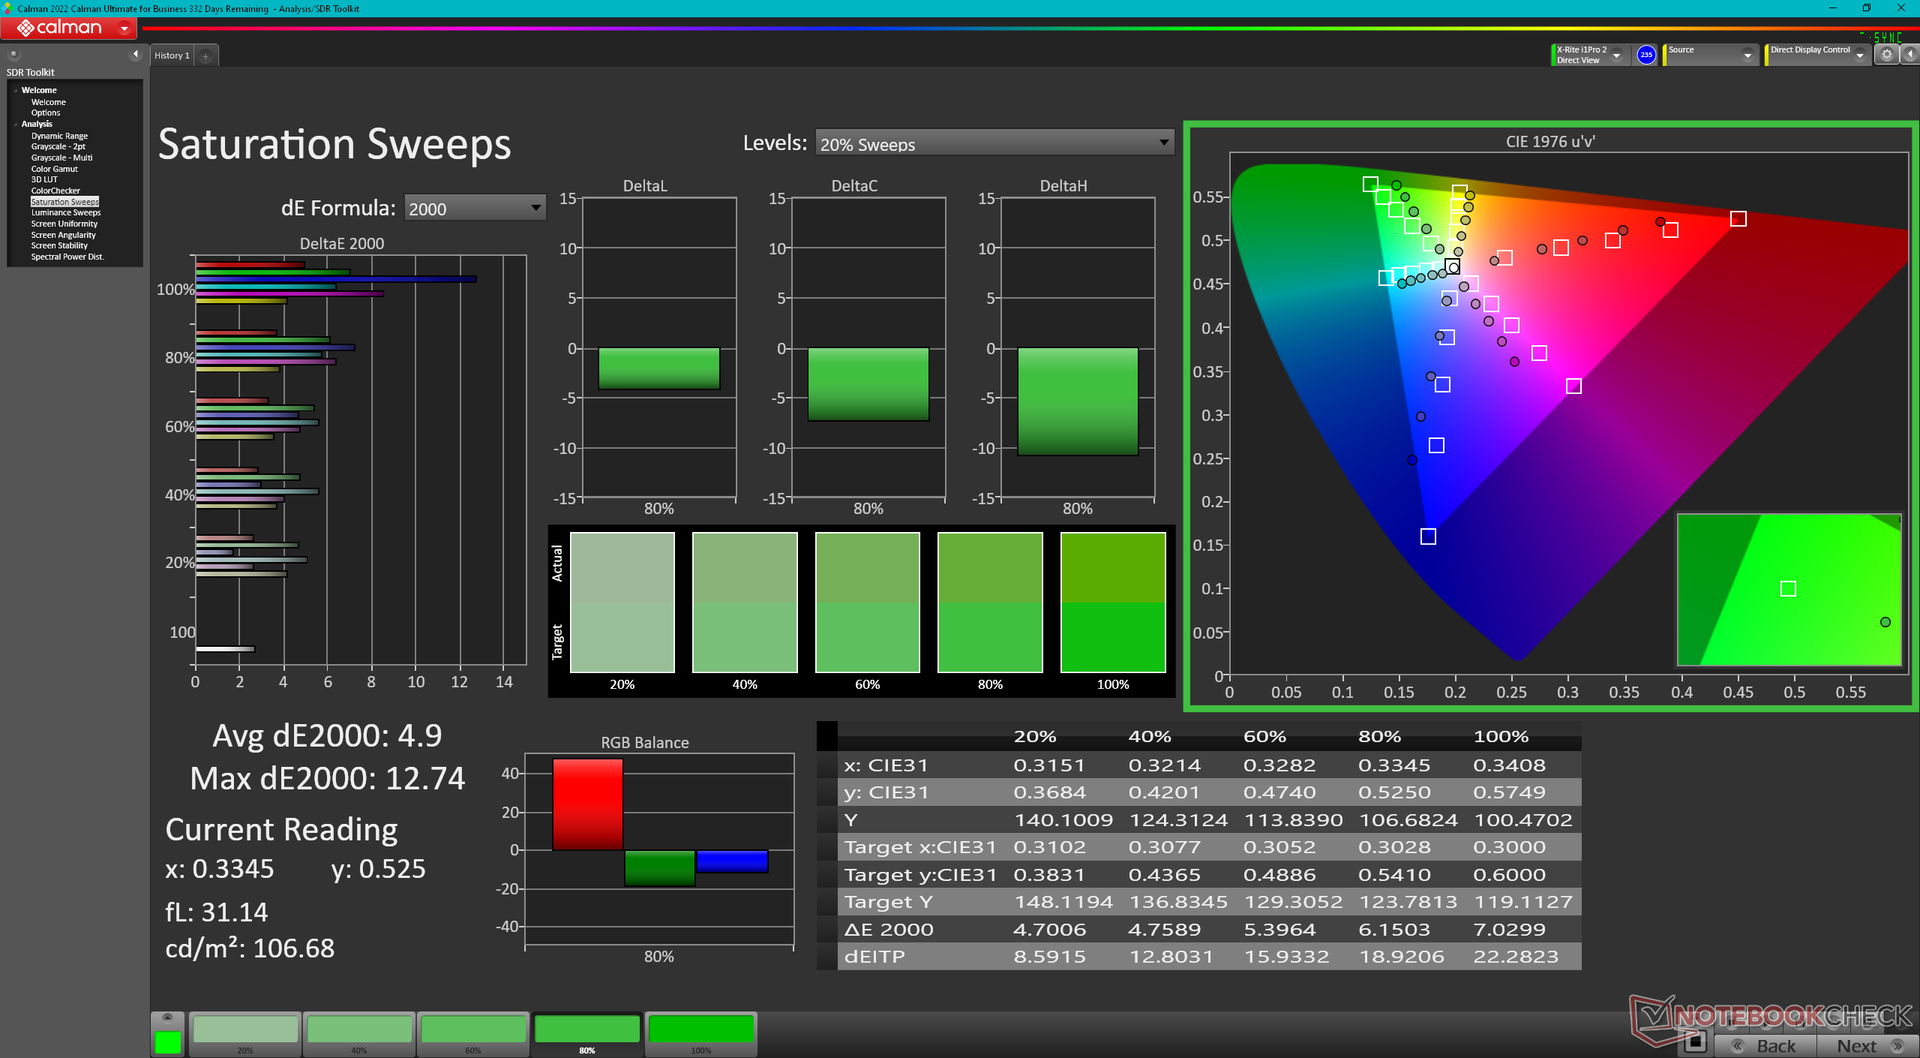
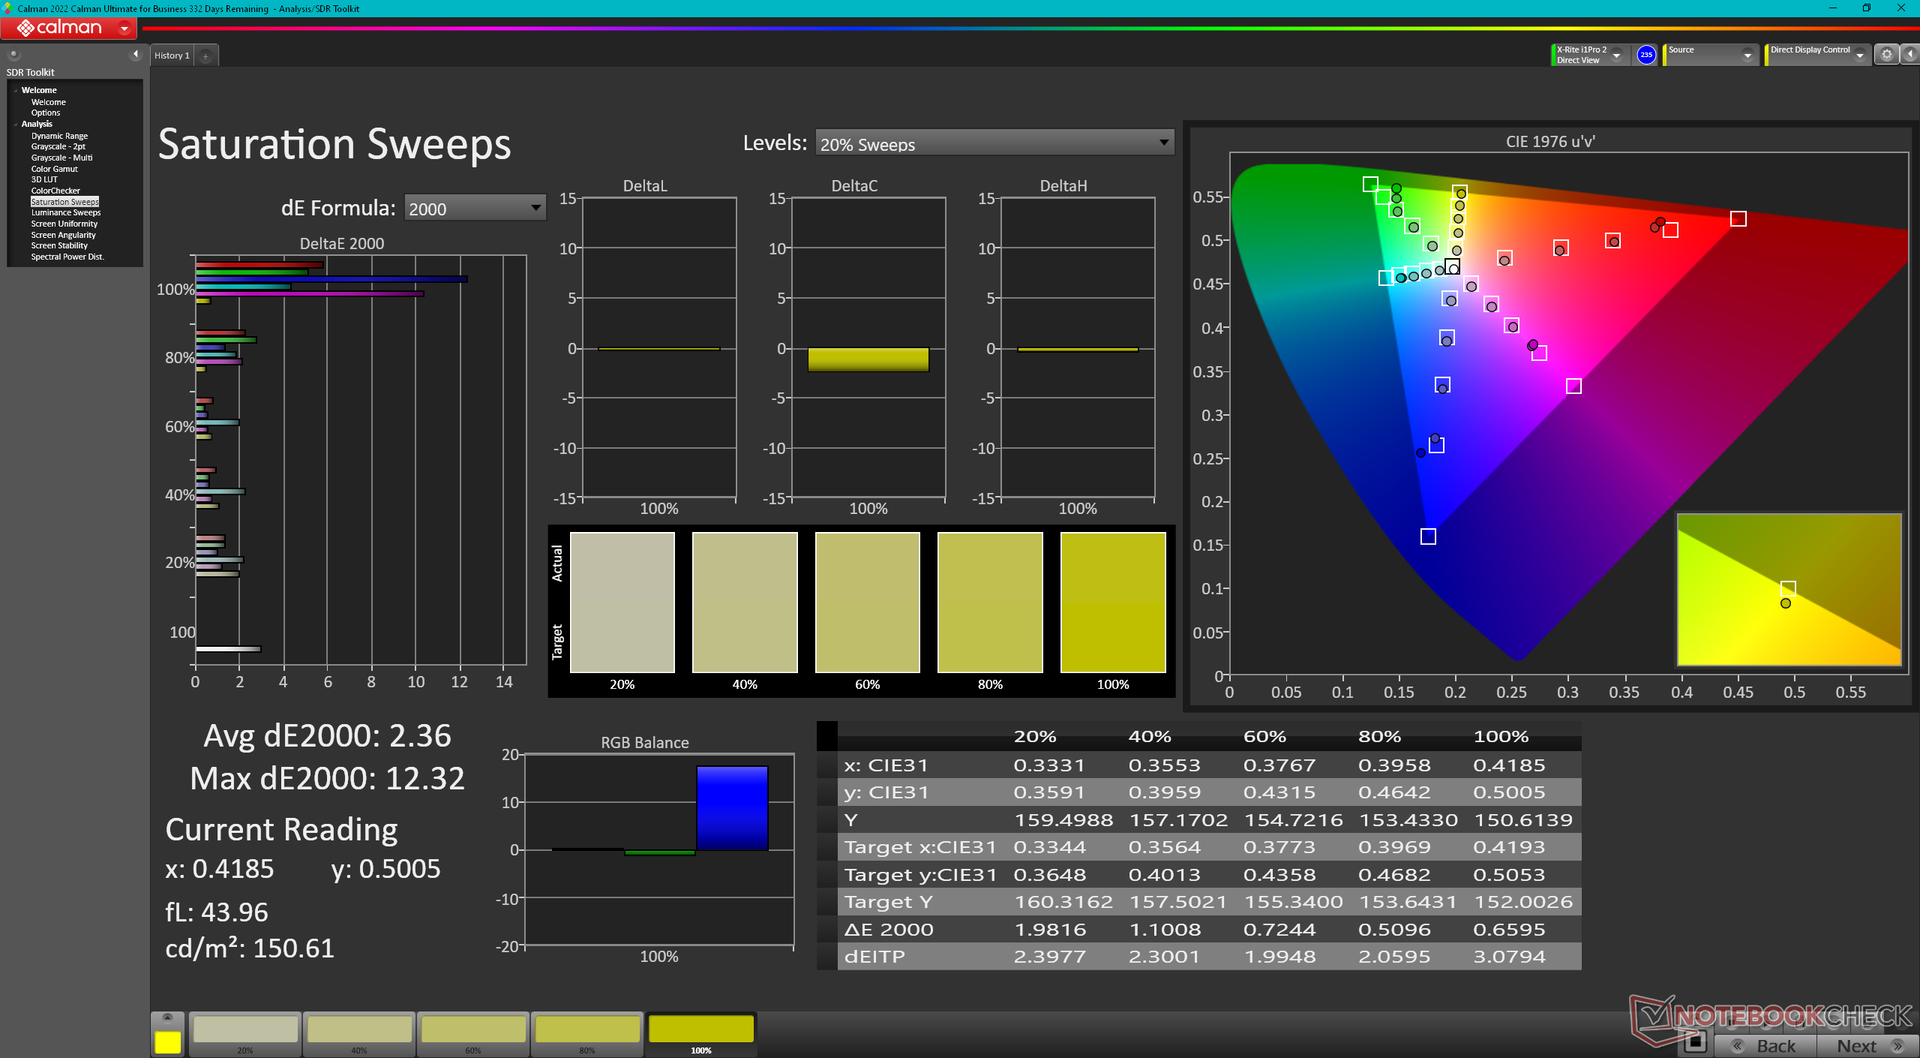
Het kalibreren van het beeldscherm met een X-Rite colorimeter zou de gemiddelde deltaE-waarden voor grijswaarden en kleuren iets verbeteren, van respectievelijk 3,2 en 3,73 naar 2,2 en 2,03. Kleuren worden echter steeds onnauwkeuriger bij hogere verzadigingsniveaus. Kleuren worden echter hoe dan ook steeds onnauwkeuriger bij hogere verzadigingsniveaus vanwege de smalle sRGB-kleurdekking die hierboven is genoemd.
Responstijd Scherm
| ↔ Responstijd Zwart naar Wit | ||
|---|---|---|
| 27.6 ms ... stijging ↗ en daling ↘ gecombineerd | ↗ 12.9 ms stijging | 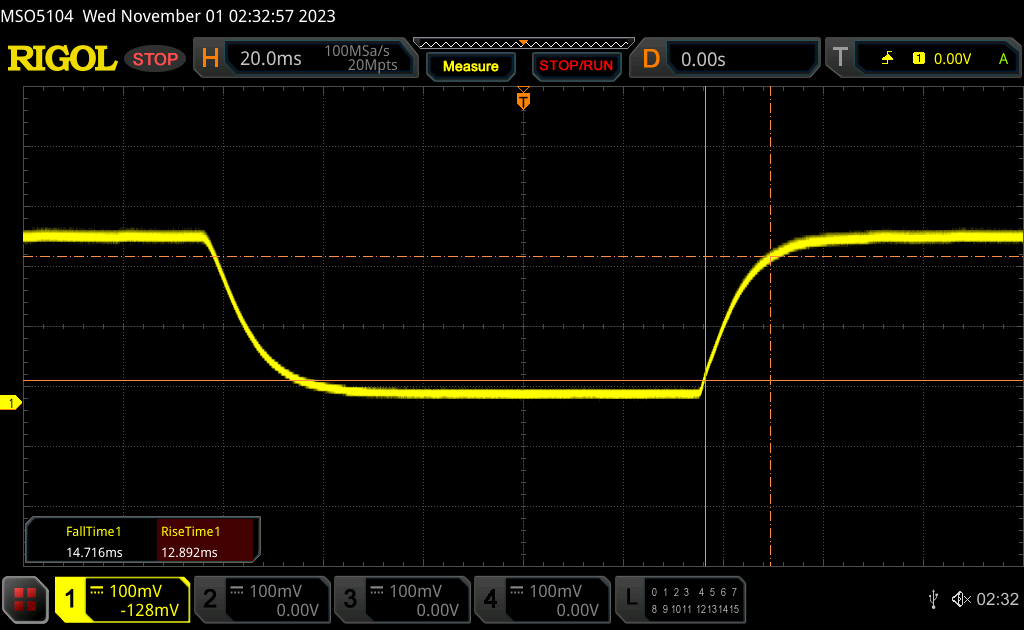 |
| ↘ 14.7 ms daling | ||
| Het scherm vertoonde relatief trage responstijden in onze tests en is misschien te traag voor games. Ter vergelijking: alle testtoestellen variëren van 0.1 (minimum) tot 240 (maximum) ms. » 70 % van alle toestellen zijn beter. Dit betekent dat de gemeten responstijd slechter is dan het gemiddelde (19.8 ms) van alle geteste toestellen. | ||
| ↔ Responstijd 50% Grijs naar 80% Grijs | ||
| 46.4 ms ... stijging ↗ en daling ↘ gecombineerd | ↗ 19.5 ms stijging | 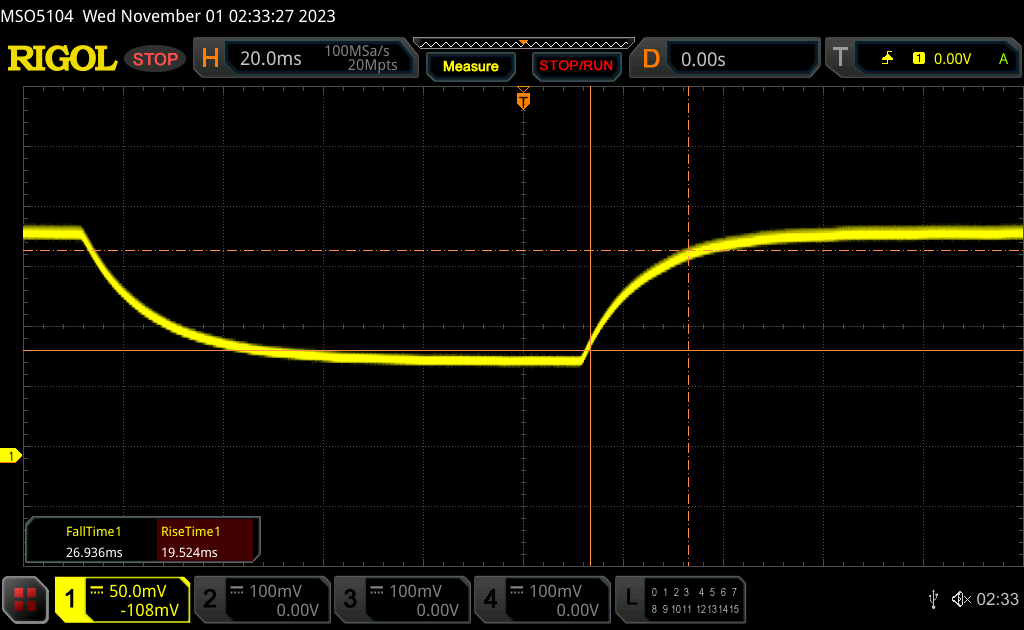 |
| ↘ 26.9 ms daling | ||
| Het scherm vertoonde trage responstijden in onze tests en is misschien te traag voor games. Ter vergelijking: alle testtoestellen variëren van 0.165 (minimum) tot 636 (maximum) ms. » 80 % van alle toestellen zijn beter. Dit betekent dat de gemeten responstijd slechter is dan het gemiddelde (31 ms) van alle geteste toestellen. | ||
Screen Flickering / PWM (Pulse-Width Modulation)
| Screen flickering / PWM niet waargenomen | 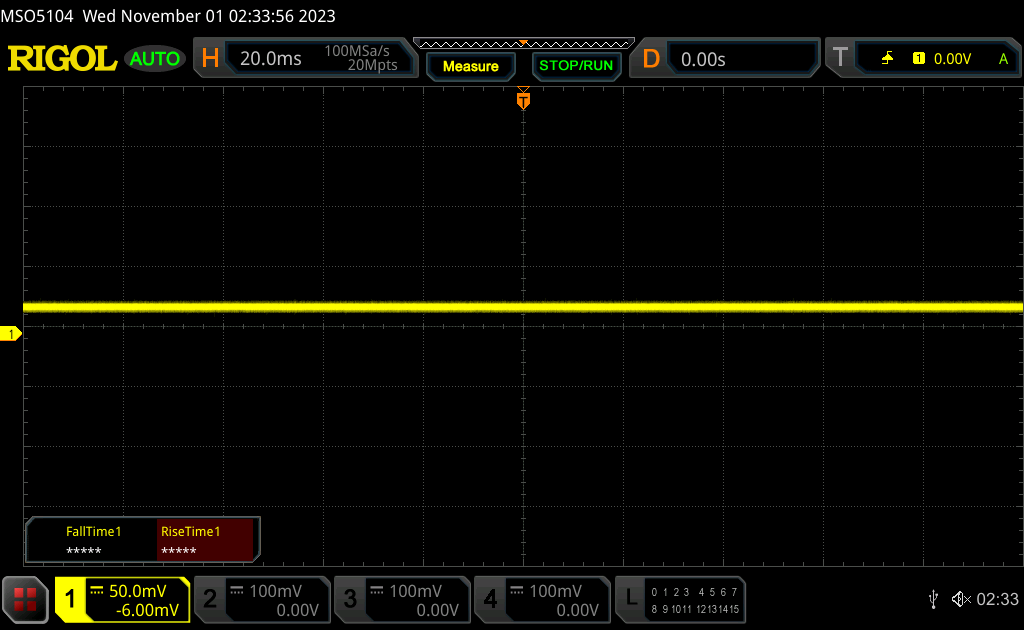 | ||
Ter vergelijking: 52 % van alle geteste toestellen maakten geen gebruik van PWM om de schermhelderheid te verlagen. Als het wel werd gebruikt, werd een gemiddelde van 7754 (minimum: 5 - maximum: 343500) Hz waargenomen. | |||
Prestaties
Testomstandigheden
We hebben Windows in de prestatiemodus gezet voordat we de onderstaande benchmarks uitvoerden. Gebruikers moeten vertrouwd raken met de ingebouwde Vantage software, omdat dit de centrale hub is voor Lenovo-specifieke functies en BIOS-updates.


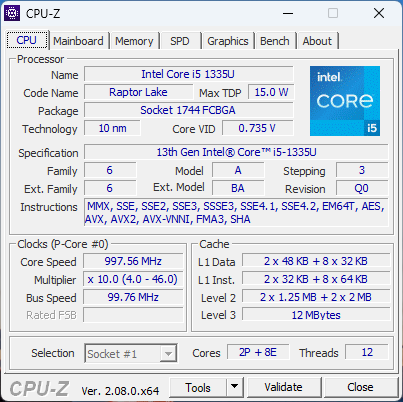
Processor
In tegenstelling tot de meeste andere Core i5 en Core i7 CPU's, is de Core i5-1335U presteert de Core i5-1335U veel beter dan de duurdere Core i7-1355U dan men in eerste instantie zou verwachten. Benchmarks geven aan dat onze Core i5-1335U slechts 5 tot 10 procent langzamer is dan de Core i7-1355U, wat betekent dat u honderden euro's kunt besparen door voor de Core i5-configuratie te kiezen als u het kleine tekort aan CPU-prestaties niet erg vindt. De grootste reden om voor de Core i7-optie te kiezen heeft te maken met de geïntegreerde grafische processor, zoals hieronder in het gedeelte over GPU-prestaties wordt aangetoond.
In vergelijking met de Ryzen 7 7730U versie is onze Intel Core i5-versie ongeveer 10 tot 15 procent langzamer in multi-thread prestaties, terwijl het tegenovergestelde waar is wat betreft single-thread prestaties.
Cinebench R15 Multi Loop
Cinebench R23: Multi Core | Single Core
Cinebench R20: CPU (Multi Core) | CPU (Single Core)
Cinebench R15: CPU Multi 64Bit | CPU Single 64Bit
Blender: v2.79 BMW27 CPU
7-Zip 18.03: 7z b 4 | 7z b 4 -mmt1
Geekbench 5.5: Multi-Core | Single-Core
HWBOT x265 Benchmark v2.2: 4k Preset
LibreOffice : 20 Documents To PDF
R Benchmark 2.5: Overall mean
* ... kleiner is beter
AIDA64: FP32 Ray-Trace | FPU Julia | CPU SHA3 | CPU Queen | FPU SinJulia | FPU Mandel | CPU AES | CPU ZLib | FP64 Ray-Trace | CPU PhotoWorxx
| Performance rating | |
| Lenovo ThinkPad E16 G1-21JUS08X00 | |
| Samsung Galaxy Book3 Pro 16 | |
| Dell Inspiron 16 7635 2-in-1 | |
| Acer TravelMate P4 TMP416-51-55KN | |
| Lenovo ThinkPad E16 G1 Core i5-1335U | |
| Gemiddeld Intel Core i5-1335U | |
| LG Gram 16Z90Q | |
| AIDA64 / FP32 Ray-Trace | |
| Lenovo ThinkPad E16 G1-21JUS08X00 | |
| Dell Inspiron 16 7635 2-in-1 | |
| Acer TravelMate P4 TMP416-51-55KN | |
| Samsung Galaxy Book3 Pro 16 | |
| Lenovo ThinkPad E16 G1 Core i5-1335U | |
| Gemiddeld Intel Core i5-1335U (5661 - 7809, n=11) | |
| LG Gram 16Z90Q | |
| AIDA64 / FPU Julia | |
| Lenovo ThinkPad E16 G1-21JUS08X00 | |
| Dell Inspiron 16 7635 2-in-1 | |
| Samsung Galaxy Book3 Pro 16 | |
| Acer TravelMate P4 TMP416-51-55KN | |
| Lenovo ThinkPad E16 G1 Core i5-1335U | |
| Gemiddeld Intel Core i5-1335U (29483 - 43636, n=11) | |
| LG Gram 16Z90Q | |
| AIDA64 / CPU SHA3 | |
| Samsung Galaxy Book3 Pro 16 | |
| Lenovo ThinkPad E16 G1-21JUS08X00 | |
| Acer TravelMate P4 TMP416-51-55KN | |
| Lenovo ThinkPad E16 G1 Core i5-1335U | |
| Dell Inspiron 16 7635 2-in-1 | |
| Gemiddeld Intel Core i5-1335U (1515 - 2278, n=11) | |
| LG Gram 16Z90Q | |
| AIDA64 / CPU Queen | |
| Lenovo ThinkPad E16 G1-21JUS08X00 | |
| Samsung Galaxy Book3 Pro 16 | |
| Acer TravelMate P4 TMP416-51-55KN | |
| LG Gram 16Z90Q | |
| Dell Inspiron 16 7635 2-in-1 | |
| Lenovo ThinkPad E16 G1 Core i5-1335U | |
| Gemiddeld Intel Core i5-1335U (53839 - 60992, n=11) | |
| AIDA64 / FPU SinJulia | |
| Lenovo ThinkPad E16 G1-21JUS08X00 | |
| Dell Inspiron 16 7635 2-in-1 | |
| Samsung Galaxy Book3 Pro 16 | |
| Acer TravelMate P4 TMP416-51-55KN | |
| Lenovo ThinkPad E16 G1 Core i5-1335U | |
| LG Gram 16Z90Q | |
| Gemiddeld Intel Core i5-1335U (3873 - 5008, n=11) | |
| AIDA64 / FPU Mandel | |
| Lenovo ThinkPad E16 G1-21JUS08X00 | |
| Dell Inspiron 16 7635 2-in-1 | |
| Samsung Galaxy Book3 Pro 16 | |
| Acer TravelMate P4 TMP416-51-55KN | |
| Lenovo ThinkPad E16 G1 Core i5-1335U | |
| Gemiddeld Intel Core i5-1335U (14376 - 20553, n=11) | |
| LG Gram 16Z90Q | |
| AIDA64 / CPU AES | |
| Samsung Galaxy Book3 Pro 16 | |
| Acer TravelMate P4 TMP416-51-55KN | |
| Lenovo ThinkPad E16 G1 Core i5-1335U | |
| Lenovo ThinkPad E16 G1-21JUS08X00 | |
| Gemiddeld Intel Core i5-1335U (31154 - 65997, n=11) | |
| Dell Inspiron 16 7635 2-in-1 | |
| LG Gram 16Z90Q | |
| AIDA64 / CPU ZLib | |
| Samsung Galaxy Book3 Pro 16 | |
| Acer TravelMate P4 TMP416-51-55KN | |
| Lenovo ThinkPad E16 G1 Core i5-1335U | |
| Lenovo ThinkPad E16 G1-21JUS08X00 | |
| Dell Inspiron 16 7635 2-in-1 | |
| Gemiddeld Intel Core i5-1335U (378 - 676, n=11) | |
| LG Gram 16Z90Q | |
| AIDA64 / FP64 Ray-Trace | |
| Lenovo ThinkPad E16 G1-21JUS08X00 | |
| Dell Inspiron 16 7635 2-in-1 | |
| Acer TravelMate P4 TMP416-51-55KN | |
| Samsung Galaxy Book3 Pro 16 | |
| Lenovo ThinkPad E16 G1 Core i5-1335U | |
| LG Gram 16Z90Q | |
| Gemiddeld Intel Core i5-1335U (2878 - 4214, n=11) | |
| AIDA64 / CPU PhotoWorxx | |
| Samsung Galaxy Book3 Pro 16 | |
| LG Gram 16Z90Q | |
| Gemiddeld Intel Core i5-1335U (13584 - 41123, n=11) | |
| Acer TravelMate P4 TMP416-51-55KN | |
| Lenovo ThinkPad E16 G1 Core i5-1335U | |
| Dell Inspiron 16 7635 2-in-1 | |
| Lenovo ThinkPad E16 G1-21JUS08X00 | |
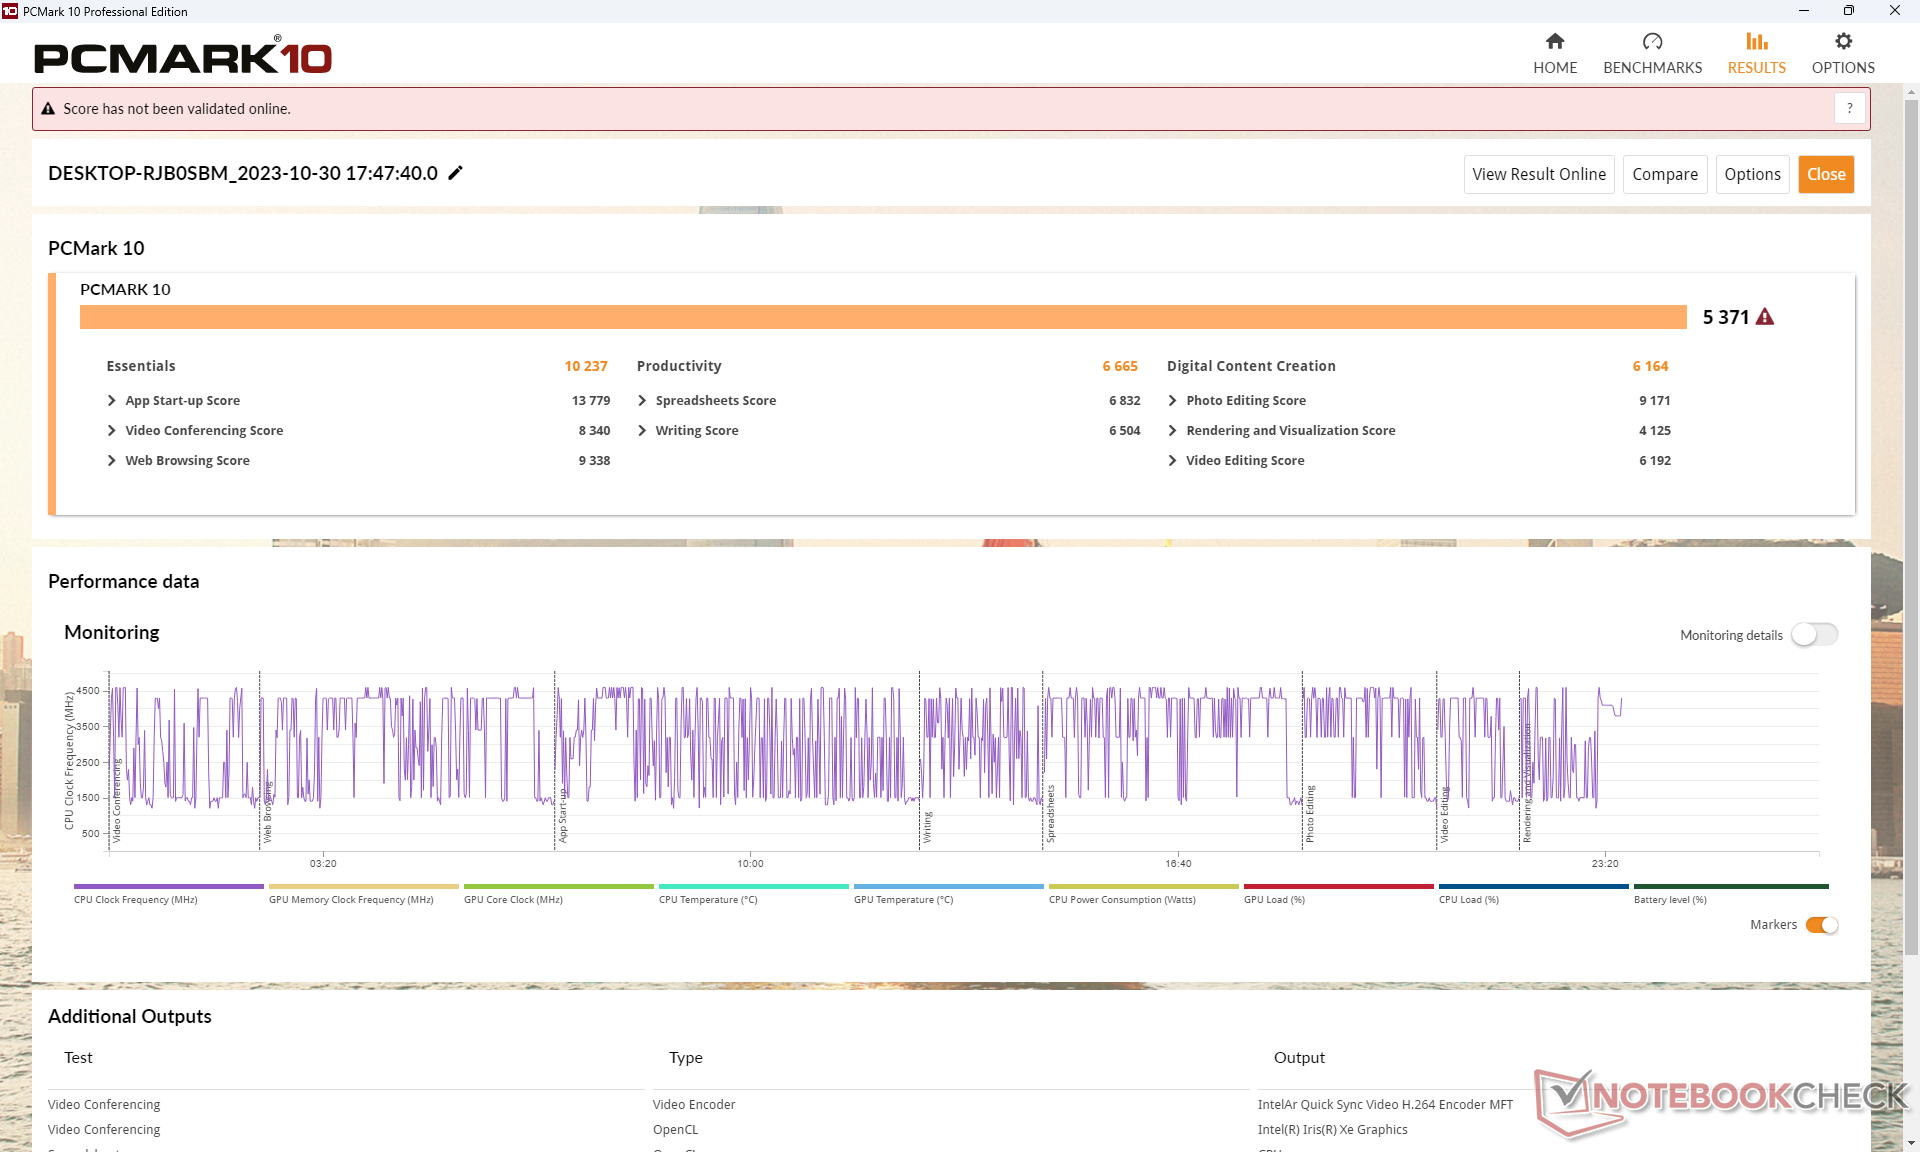
Systeemprestaties
PCMark-resultaten zijn nek-aan-nek met het Ryzen 7 AMD-alternatief, behalve in de subtest Productiviteit vanwege de superieure multi-thread prestaties van de Ryzen 7 7730U ten opzichte van onze Core i5-1335U.
CrossMark: Overall | Productivity | Creativity | Responsiveness
| PCMark 10 / Score | |
| Dell Inspiron 16 7635 2-in-1 | |
| Lenovo ThinkPad E16 G1-21JUS08X00 | |
| Samsung Galaxy Book3 Pro 16 | |
| Lenovo ThinkPad E16 G1 Core i5-1335U | |
| Gemiddeld Intel Core i5-1335U, Intel Iris Xe Graphics G7 80EUs (5068 - 5600, n=11) | |
| Acer TravelMate P4 TMP416-51-55KN | |
| LG Gram 16Z90Q | |
| PCMark 10 / Essentials | |
| Dell Inspiron 16 7635 2-in-1 | |
| Samsung Galaxy Book3 Pro 16 | |
| Lenovo ThinkPad E16 G1-21JUS08X00 | |
| Gemiddeld Intel Core i5-1335U, Intel Iris Xe Graphics G7 80EUs (9828 - 11912, n=11) | |
| Lenovo ThinkPad E16 G1 Core i5-1335U | |
| LG Gram 16Z90Q | |
| Acer TravelMate P4 TMP416-51-55KN | |
| PCMark 10 / Productivity | |
| Dell Inspiron 16 7635 2-in-1 | |
| Lenovo ThinkPad E16 G1-21JUS08X00 | |
| Gemiddeld Intel Core i5-1335U, Intel Iris Xe Graphics G7 80EUs (6196 - 7261, n=11) | |
| Acer TravelMate P4 TMP416-51-55KN | |
| Samsung Galaxy Book3 Pro 16 | |
| Lenovo ThinkPad E16 G1 Core i5-1335U | |
| LG Gram 16Z90Q | |
| PCMark 10 / Digital Content Creation | |
| Samsung Galaxy Book3 Pro 16 | |
| Acer TravelMate P4 TMP416-51-55KN | |
| Lenovo ThinkPad E16 G1 Core i5-1335U | |
| Lenovo ThinkPad E16 G1-21JUS08X00 | |
| LG Gram 16Z90Q | |
| Dell Inspiron 16 7635 2-in-1 | |
| Gemiddeld Intel Core i5-1335U, Intel Iris Xe Graphics G7 80EUs (5361 - 6164, n=11) | |
| CrossMark / Overall | |
| Samsung Galaxy Book3 Pro 16 | |
| Acer TravelMate P4 TMP416-51-55KN | |
| Gemiddeld Intel Core i5-1335U, Intel Iris Xe Graphics G7 80EUs (1339 - 1599, n=11) | |
| Lenovo ThinkPad E16 G1 Core i5-1335U | |
| Lenovo ThinkPad E16 G1-21JUS08X00 | |
| Dell Inspiron 16 7635 2-in-1 | |
| CrossMark / Productivity | |
| Samsung Galaxy Book3 Pro 16 | |
| Acer TravelMate P4 TMP416-51-55KN | |
| Gemiddeld Intel Core i5-1335U, Intel Iris Xe Graphics G7 80EUs (1337 - 1638, n=11) | |
| Lenovo ThinkPad E16 G1 Core i5-1335U | |
| Lenovo ThinkPad E16 G1-21JUS08X00 | |
| Dell Inspiron 16 7635 2-in-1 | |
| CrossMark / Creativity | |
| Samsung Galaxy Book3 Pro 16 | |
| Acer TravelMate P4 TMP416-51-55KN | |
| Gemiddeld Intel Core i5-1335U, Intel Iris Xe Graphics G7 80EUs (1315 - 1620, n=11) | |
| Lenovo ThinkPad E16 G1 Core i5-1335U | |
| Lenovo ThinkPad E16 G1-21JUS08X00 | |
| Dell Inspiron 16 7635 2-in-1 | |
| CrossMark / Responsiveness | |
| Acer TravelMate P4 TMP416-51-55KN | |
| Samsung Galaxy Book3 Pro 16 | |
| Gemiddeld Intel Core i5-1335U, Intel Iris Xe Graphics G7 80EUs (1023 - 1868, n=11) | |
| Lenovo ThinkPad E16 G1 Core i5-1335U | |
| Lenovo ThinkPad E16 G1-21JUS08X00 | |
| Dell Inspiron 16 7635 2-in-1 | |
| PCMark 10 Score | 5371 punten | |
Help | ||
| AIDA64 / Memory Copy | |
| LG Gram 16Z90Q | |
| Samsung Galaxy Book3 Pro 16 | |
| Gemiddeld Intel Core i5-1335U (22417 - 60884, n=11) | |
| Acer TravelMate P4 TMP416-51-55KN | |
| Dell Inspiron 16 7635 2-in-1 | |
| Lenovo ThinkPad E16 G1 Core i5-1335U | |
| Lenovo ThinkPad E16 G1-21JUS08X00 | |
| AIDA64 / Memory Read | |
| LG Gram 16Z90Q | |
| Samsung Galaxy Book3 Pro 16 | |
| Acer TravelMate P4 TMP416-51-55KN | |
| Gemiddeld Intel Core i5-1335U (23104 - 61555, n=11) | |
| Dell Inspiron 16 7635 2-in-1 | |
| Lenovo ThinkPad E16 G1-21JUS08X00 | |
| Lenovo ThinkPad E16 G1 Core i5-1335U | |
| AIDA64 / Memory Write | |
| Samsung Galaxy Book3 Pro 16 | |
| LG Gram 16Z90Q | |
| Gemiddeld Intel Core i5-1335U (22936 - 72584, n=11) | |
| Acer TravelMate P4 TMP416-51-55KN | |
| Lenovo ThinkPad E16 G1 Core i5-1335U | |
| Dell Inspiron 16 7635 2-in-1 | |
| Lenovo ThinkPad E16 G1-21JUS08X00 | |
| AIDA64 / Memory Latency | |
| Dell Inspiron 16 7635 2-in-1 | |
| LG Gram 16Z90Q | |
| Gemiddeld Intel Core i5-1335U (78.6 - 112.8, n=11) | |
| Samsung Galaxy Book3 Pro 16 | |
| Lenovo ThinkPad E16 G1-21JUS08X00 | |
| Lenovo ThinkPad E16 G1 Core i5-1335U | |
| Acer TravelMate P4 TMP416-51-55KN | |
* ... kleiner is beter
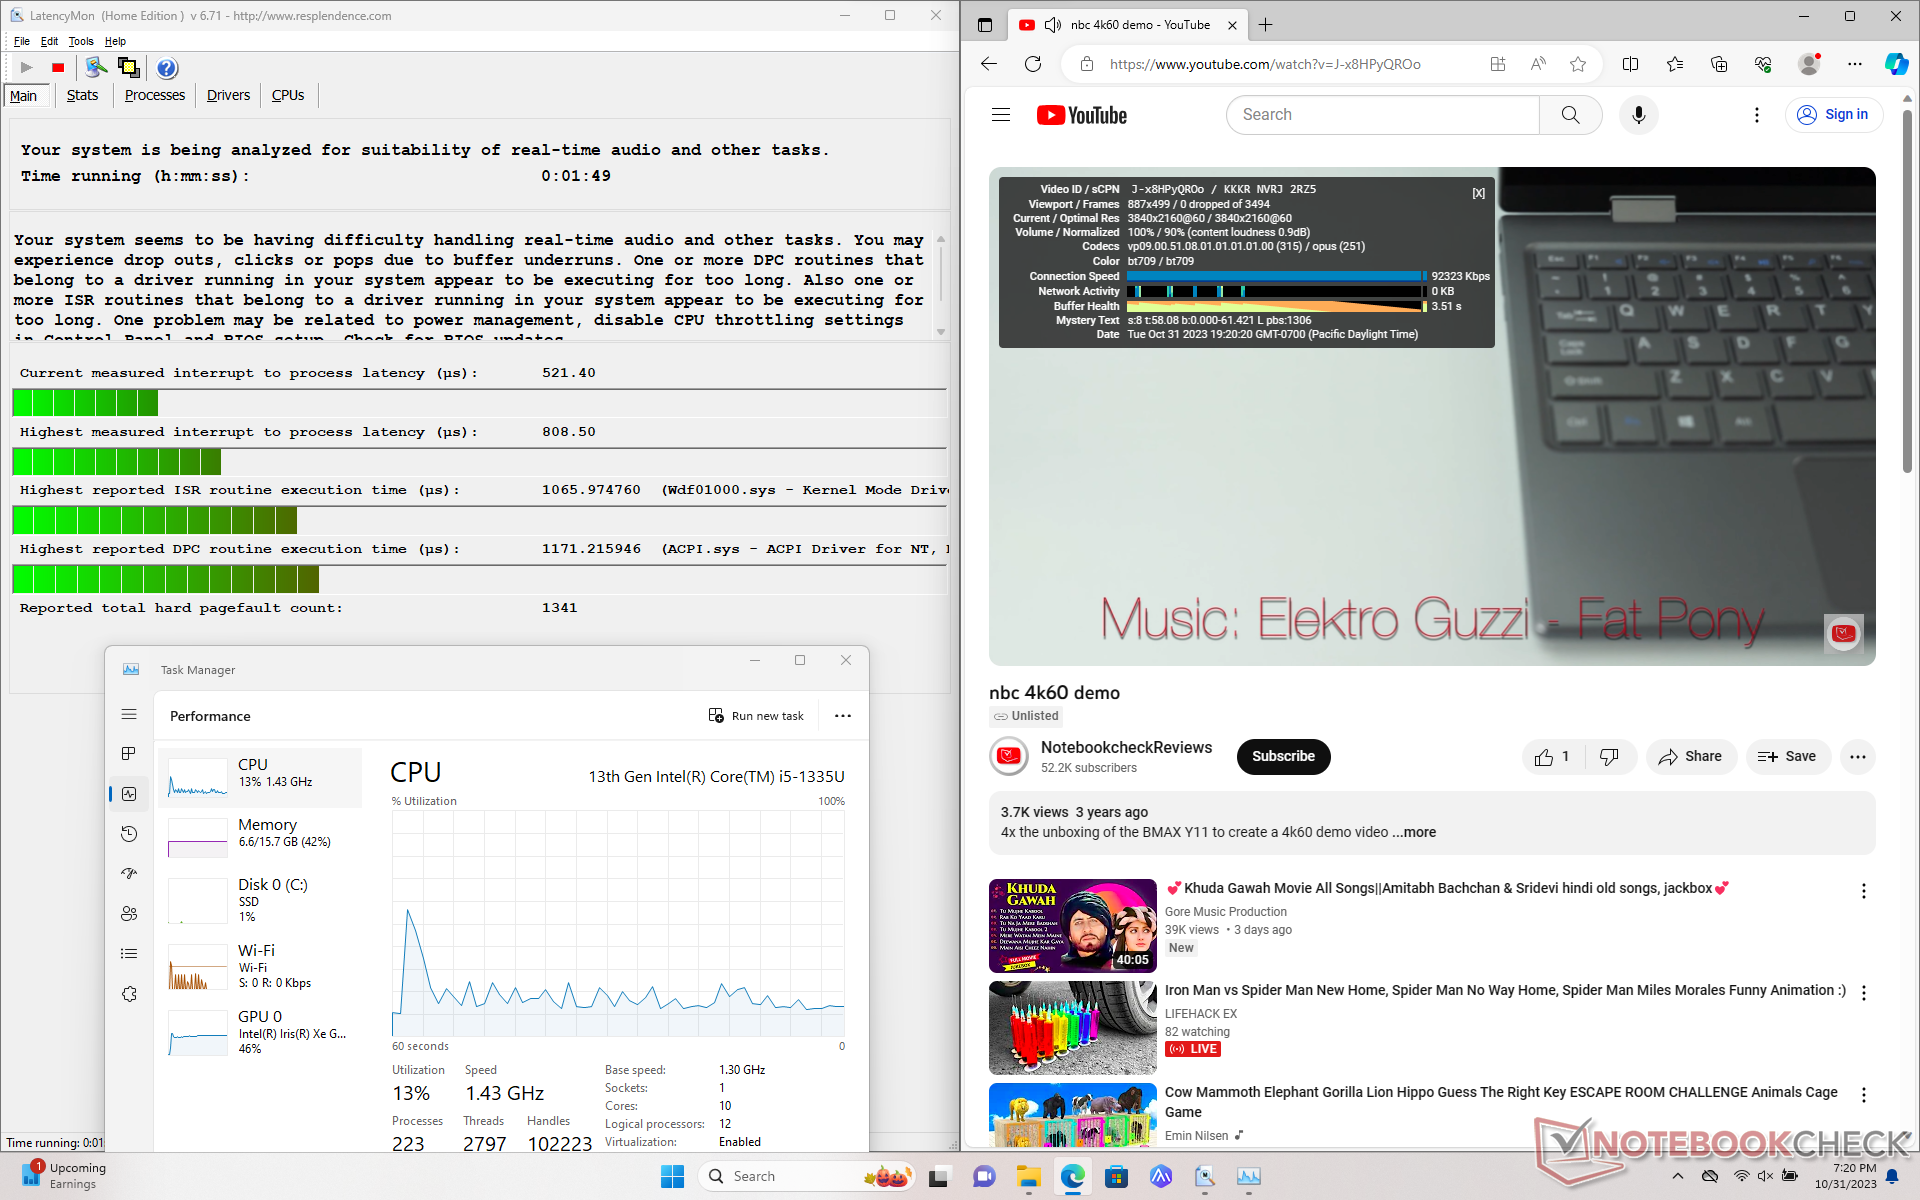
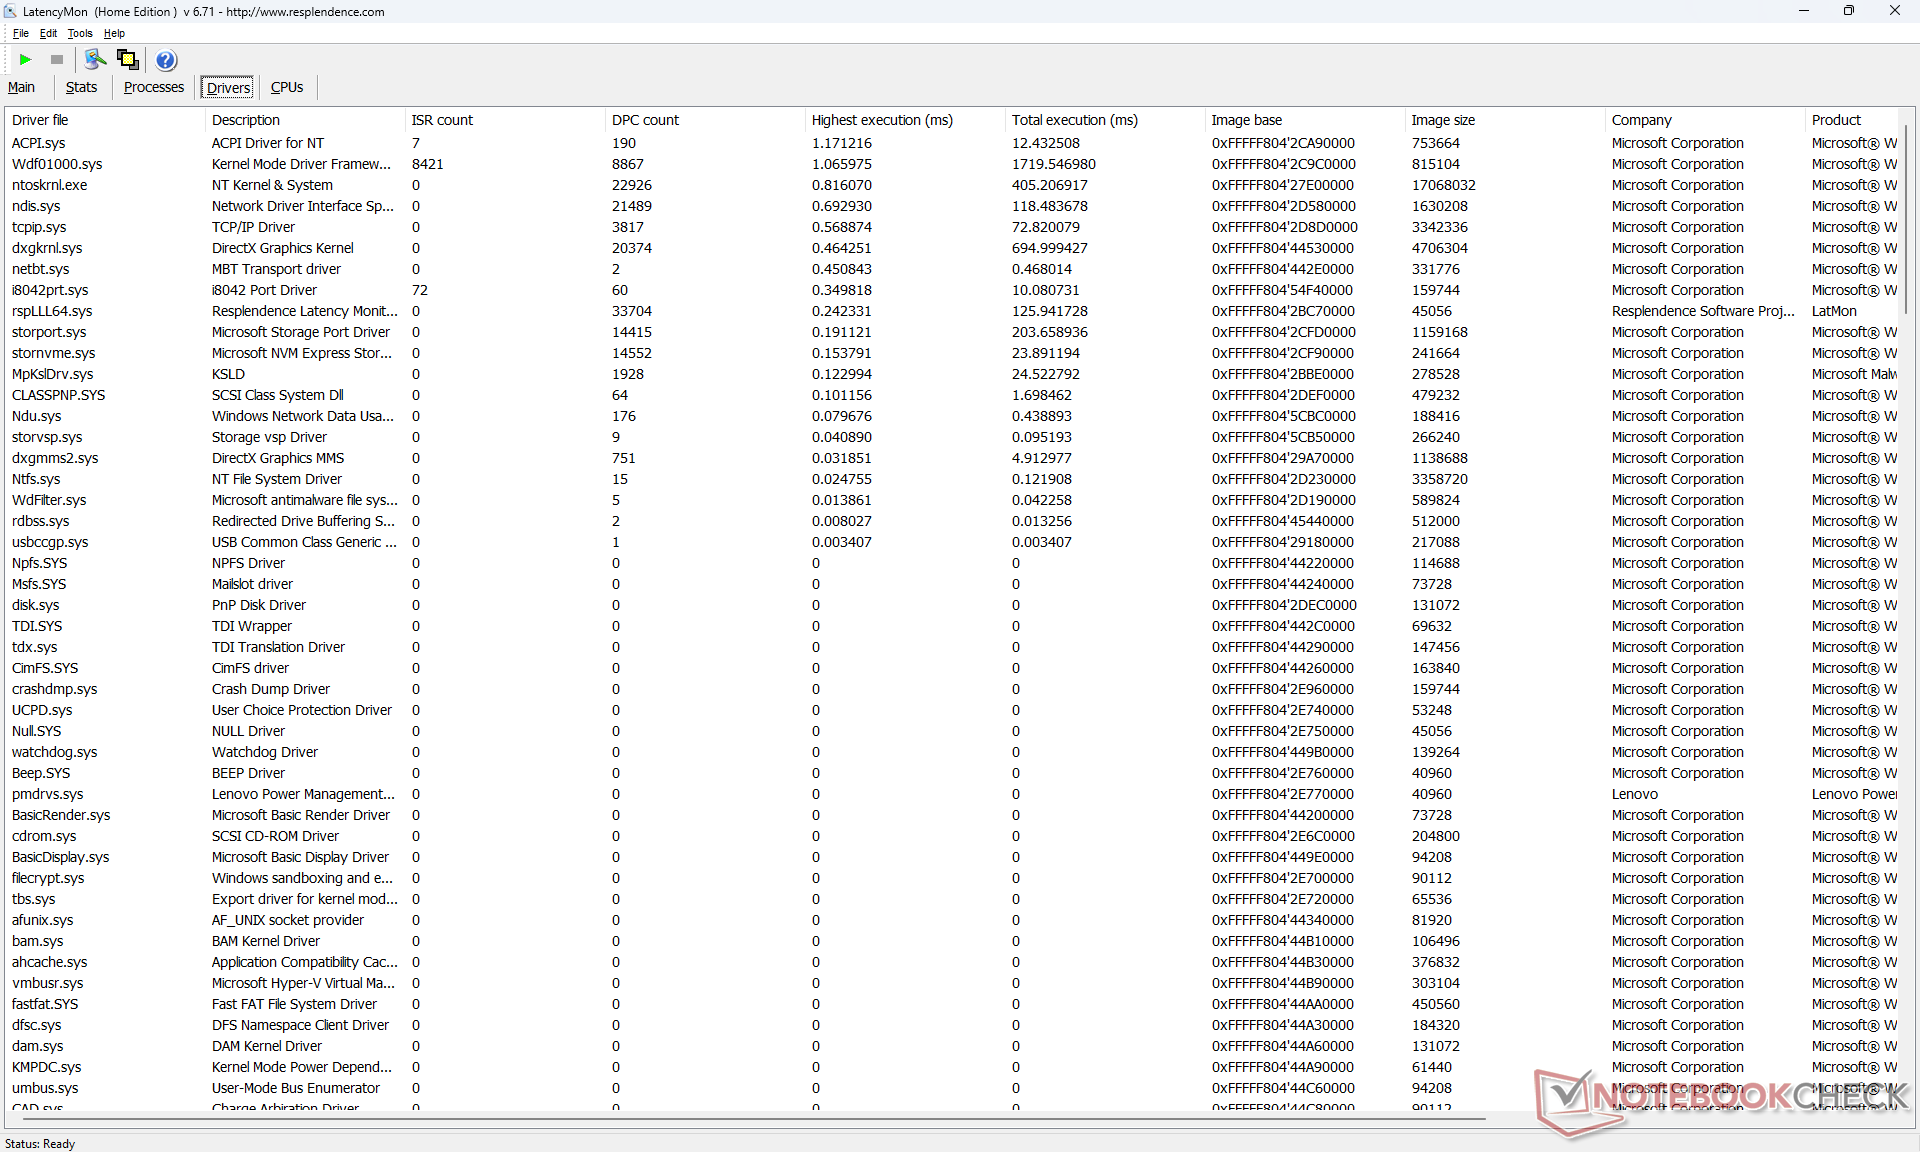
DPC latentie
LatencyMon laat slechts kleine DPC-problemen zien bij het openen van meerdere browsertabbladen van onze startpagina. het afspelen van 4K-video's met 60 FPS verloopt verder perfect vloeiend en er zijn geen dropped frames geregistreerd.
| DPC Latencies / LatencyMon - interrupt to process latency (max), Web, Youtube, Prime95 | |
| Acer TravelMate P4 TMP416-51-55KN | |
| LG Gram 16Z90Q | |
| Lenovo ThinkPad E16 G1-21JUS08X00 | |
| Lenovo ThinkPad E16 G1 Core i5-1335U | |
| Dell Inspiron 16 7635 2-in-1 | |
| Samsung Galaxy Book3 Pro 16 | |
* ... kleiner is beter
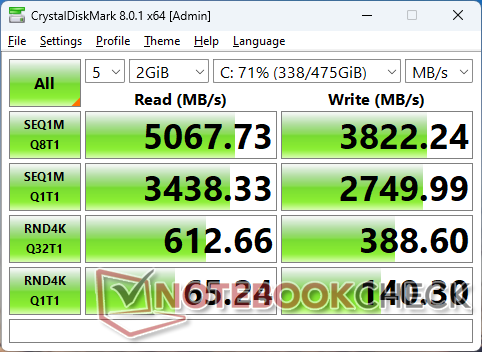
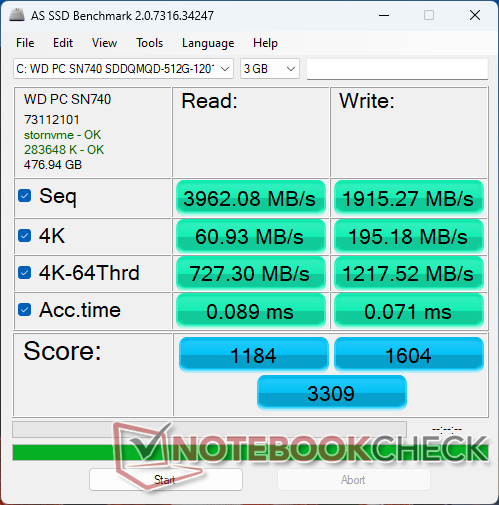
Opslagapparaten
Onze testeenheid bevat de Western Digital SN740 wat een PCIe4 x4 NVMe SSD uit het middensegment is met real-world sequentiële lees- en schrijfsnelheden tot 5100 MB/s en 3900 MB/s, respectievelijk. De 2242 schijf heeft geen problemen om deze maximale snelheden te handhaven, ondanks het ontbreken van thermische pads of koelhulpmiddelen.

* ... kleiner is beter
Disk Throttling: DiskSpd Read Loop, Queue Depth 8
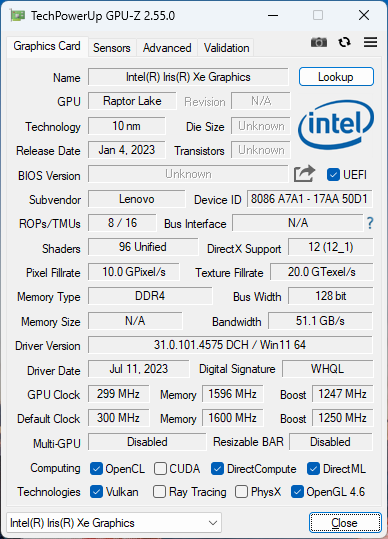
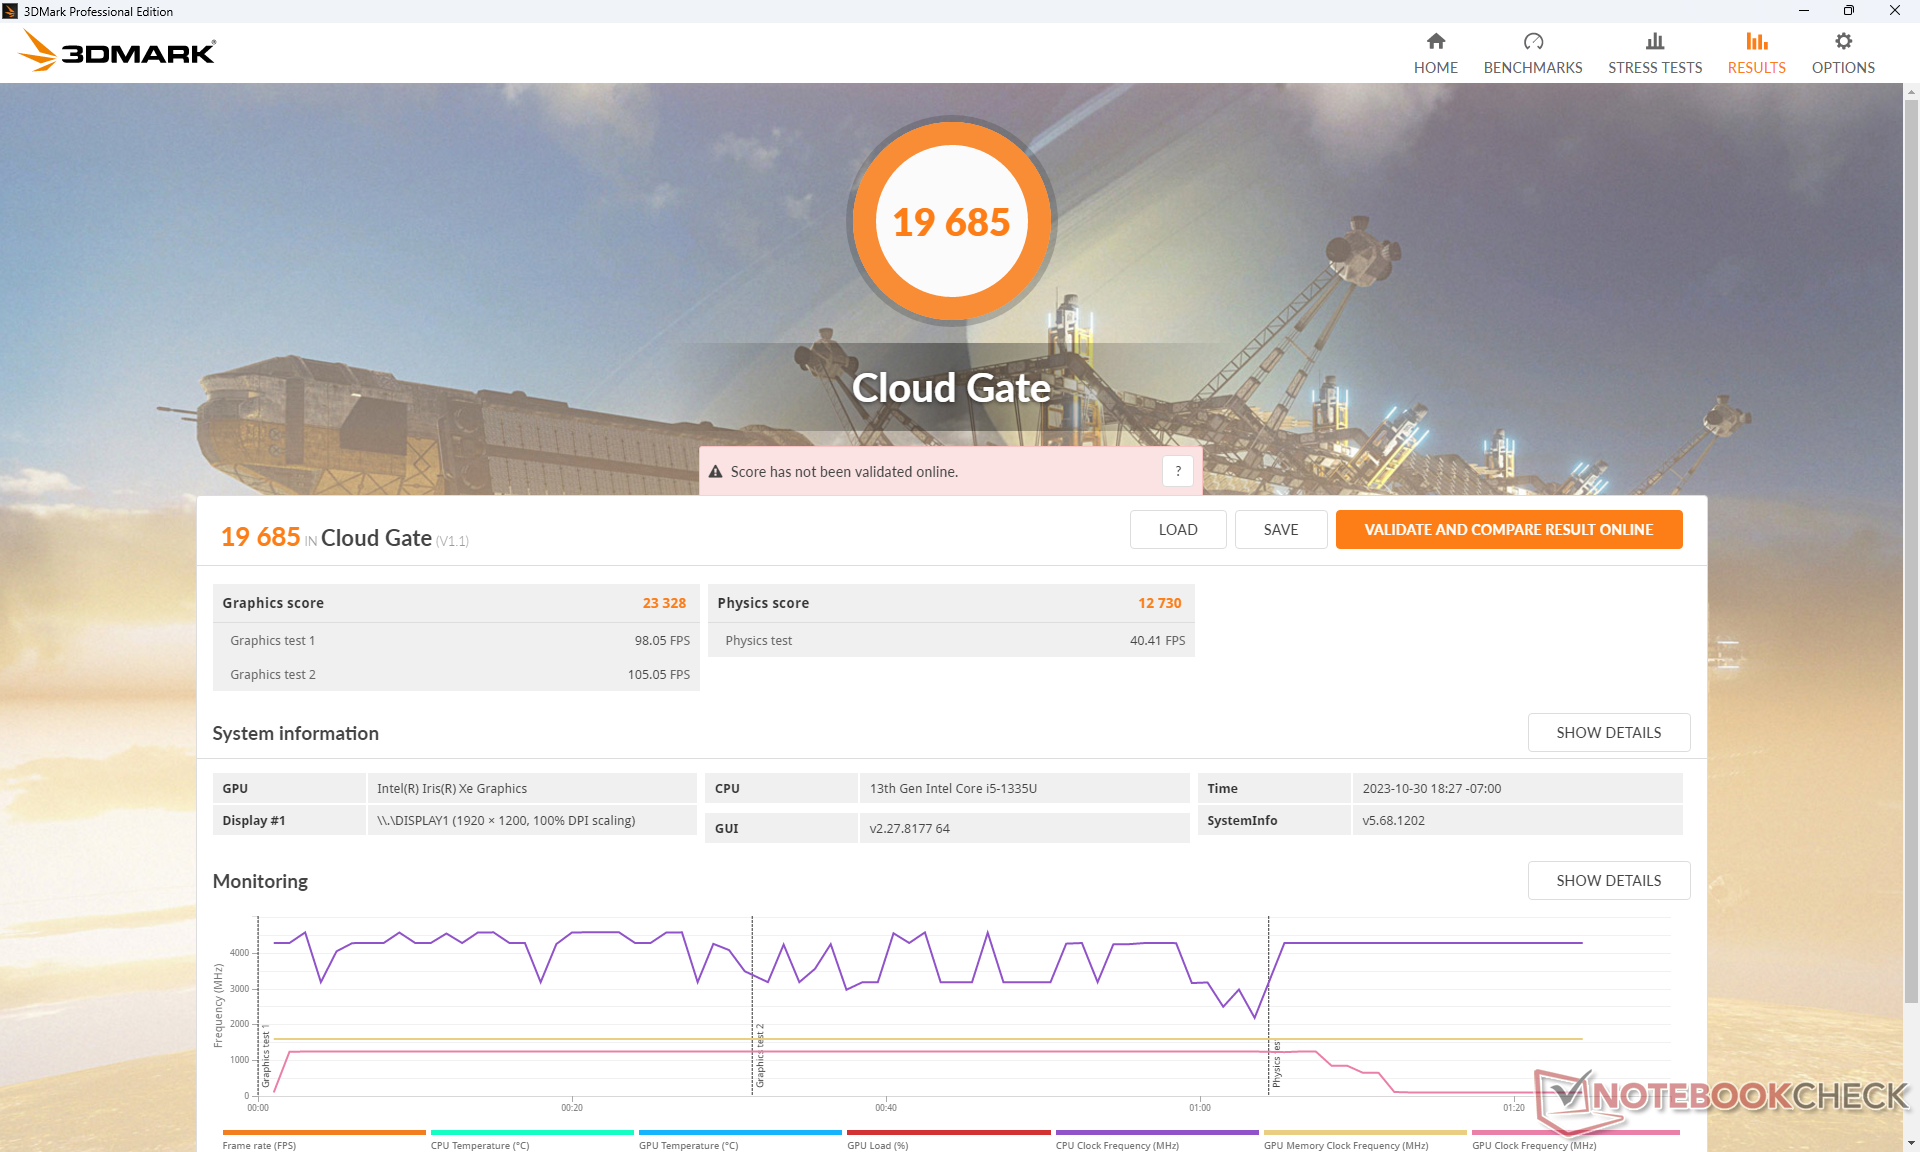
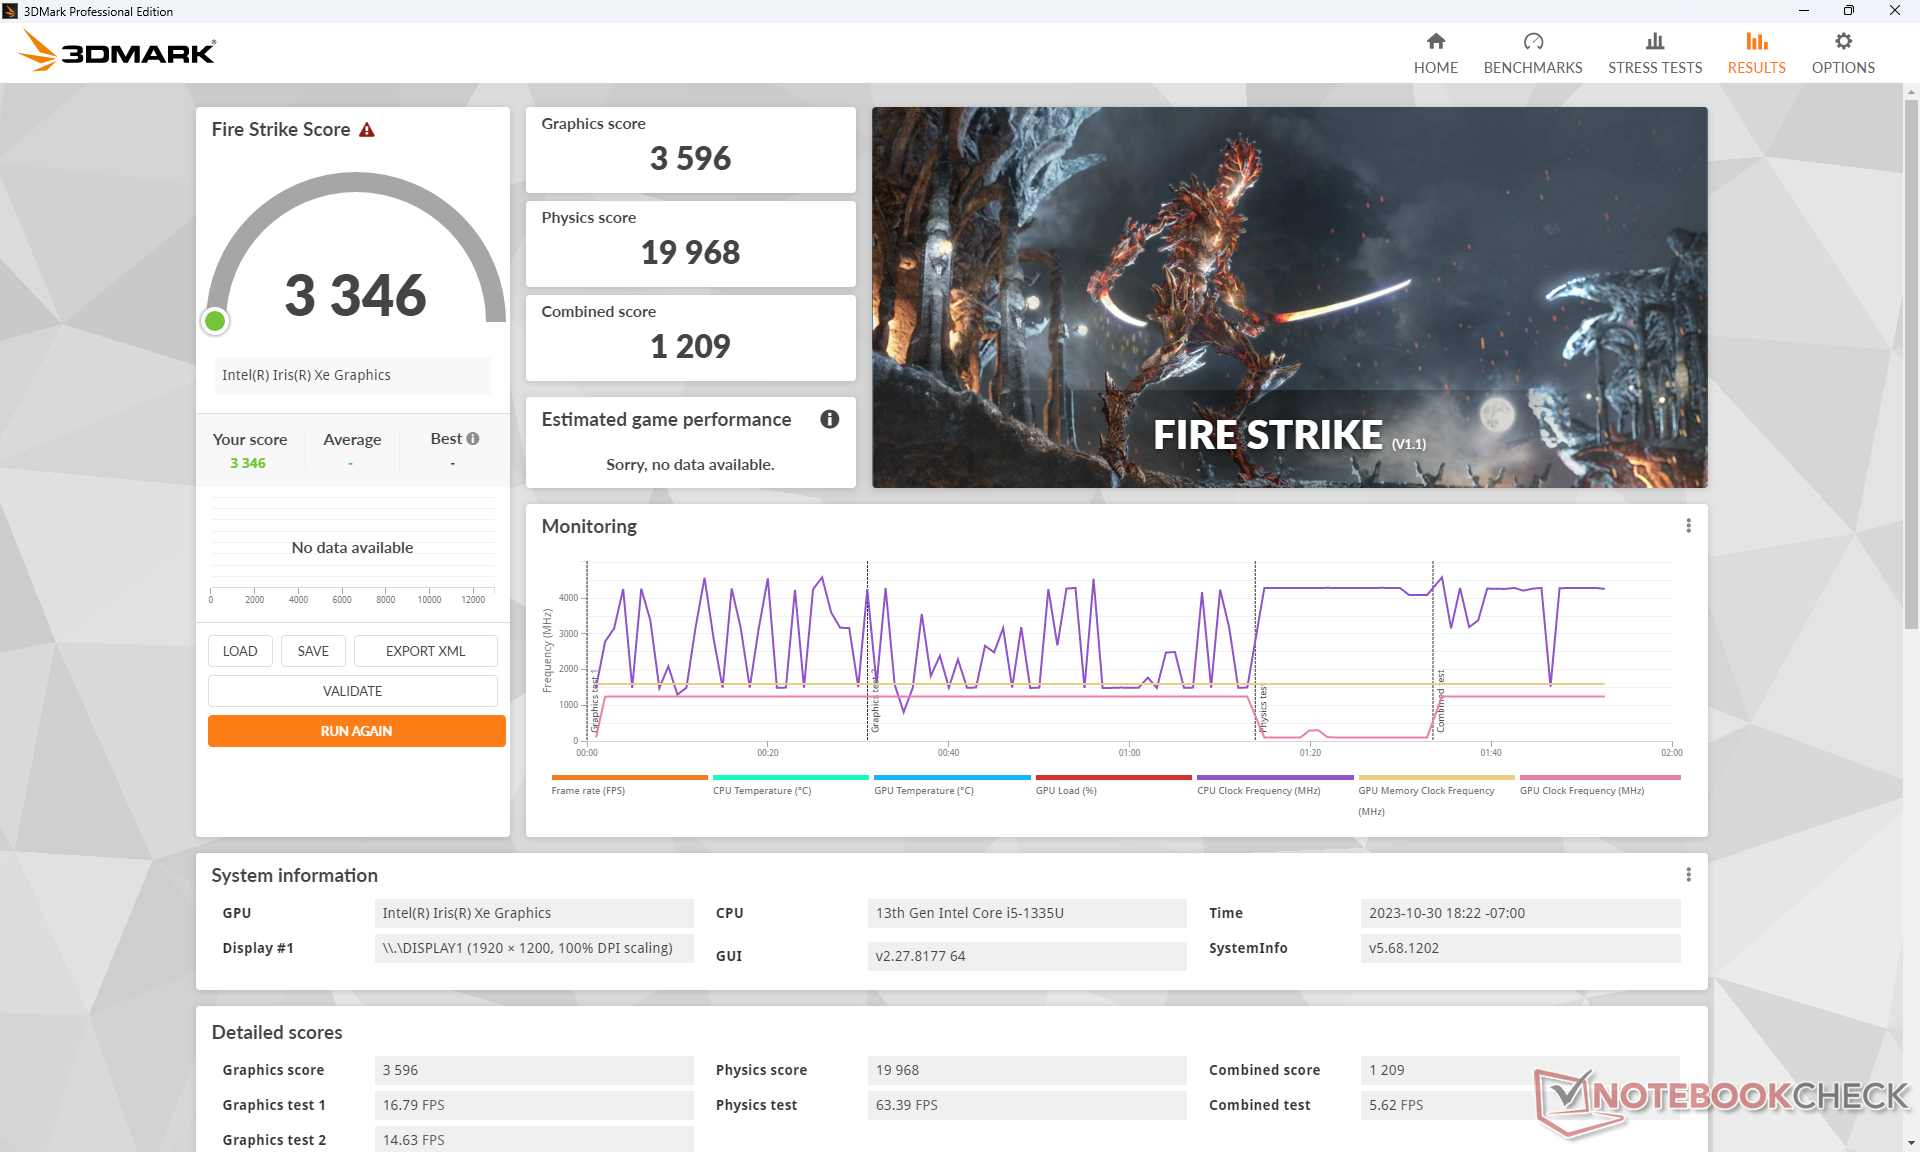
GPU-prestaties
Onze geïntegreerde Iris Xe 80 EUs presteert waar we het verwachten ten opzichte van andere laptops met dezelfde GPU, zo niet iets langzamer. Upgraden naar de Core i7-configuratie met de Iris Xe 96 EUs of GeForce MX550 zou de prestaties met respectievelijk 25 tot 30 procent of 70 tot 100 procent verbeteren.
Zorg ervoor dat u configureert met dual-channel RAM, anders lijden de iGPU-prestaties aanzienlijk.
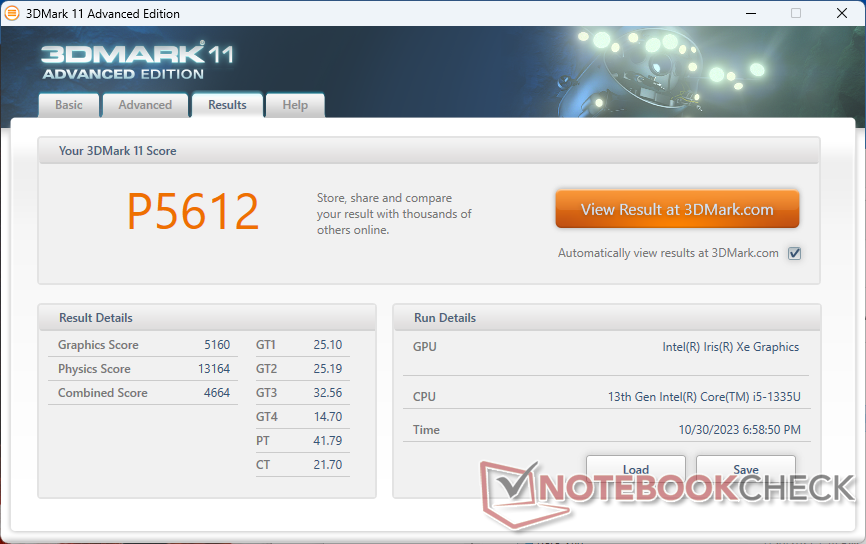
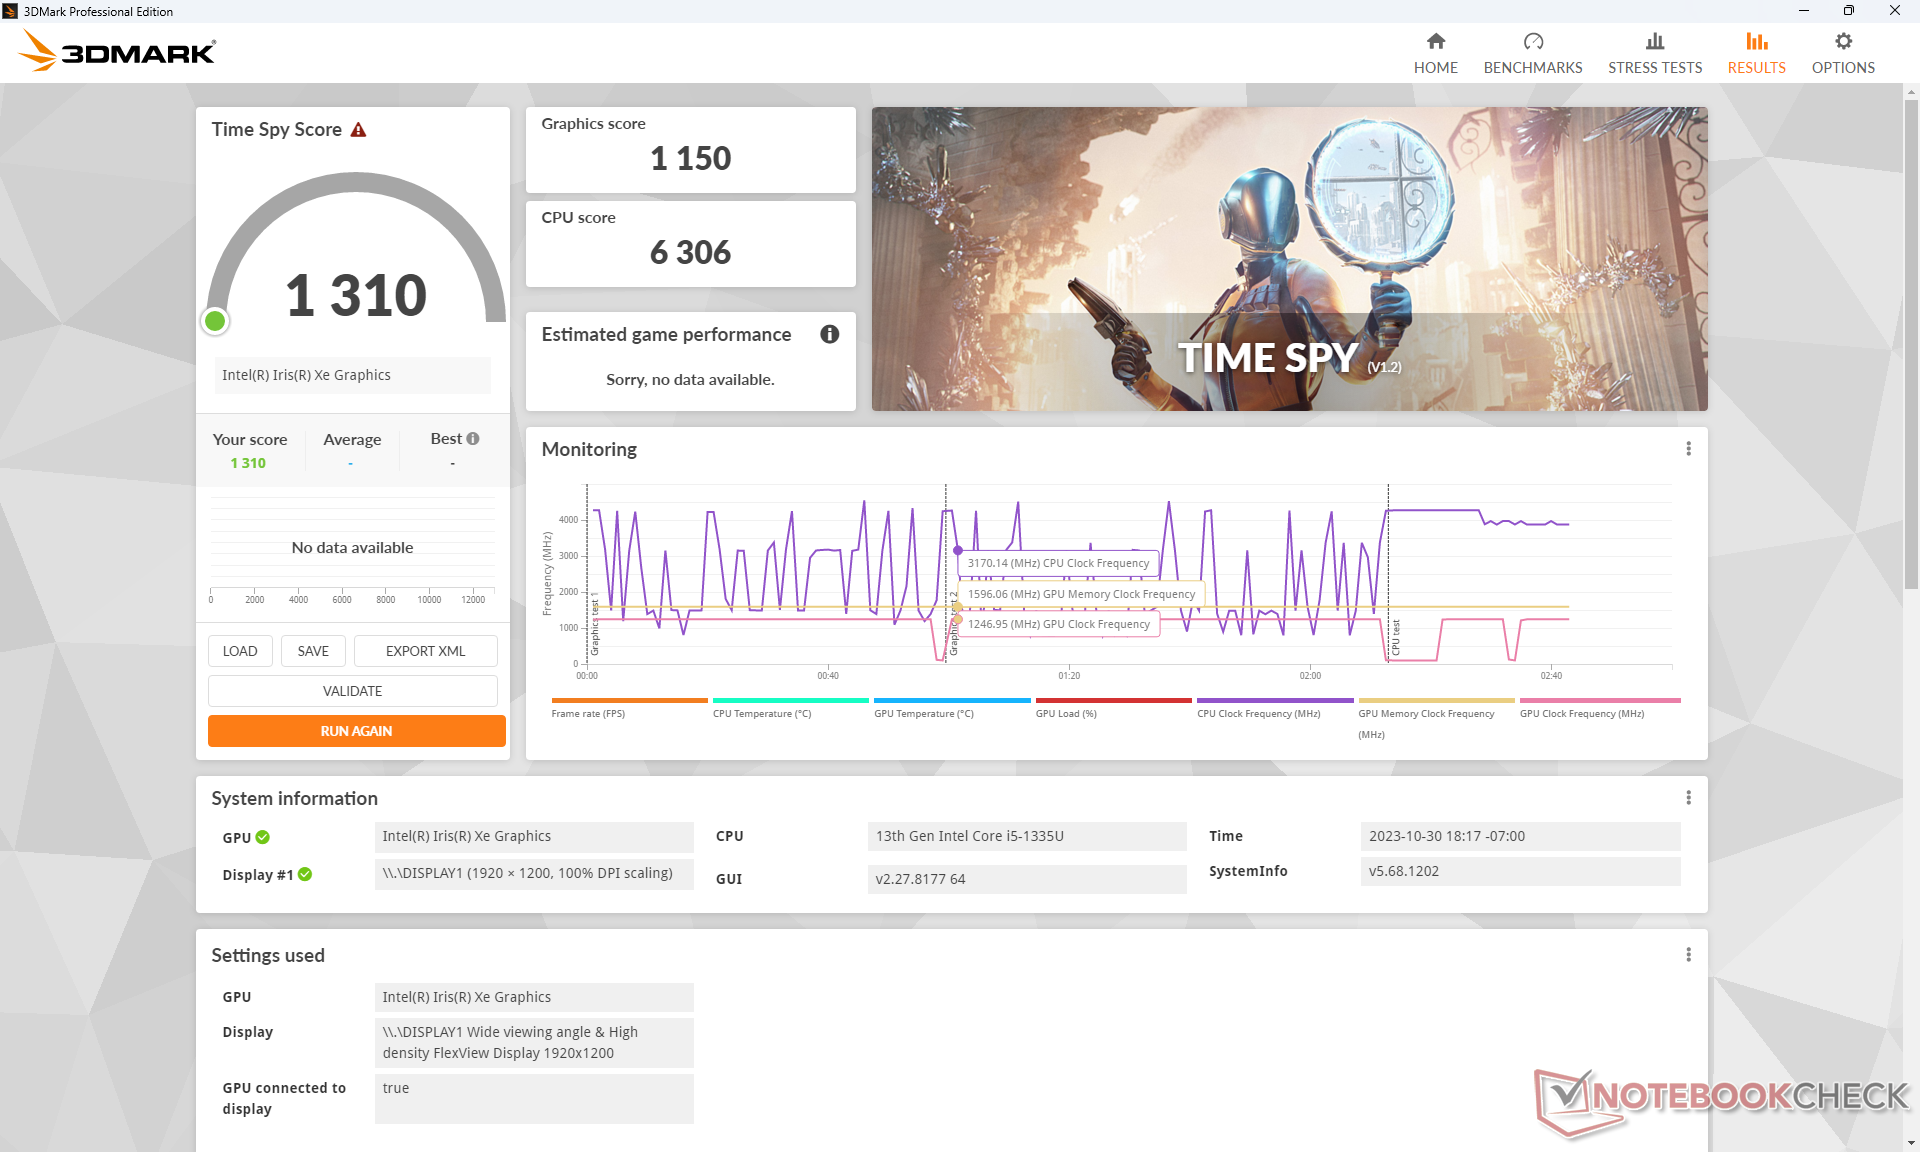
| 3DMark 11 Performance | 5612 punten | |
| 3DMark Cloud Gate Standard Score | 19685 punten | |
| 3DMark Fire Strike Score | 3346 punten | |
| 3DMark Time Spy Score | 1310 punten | |
Help | ||
* ... kleiner is beter
De framerates tijdens het stationair draaien op Witcher 3 vertoonden tijdens het begin van de test een behoorlijke dip, wat duidt op een onderbrekende achtergrondactiviteit. Dit gebeurde gelukkig niet meer tijdens de rest van de test.
Witcher 3 FPS Chart
| lage | gem. | hoge | ultra | |
|---|---|---|---|---|
| GTA V (2015) | 84.5 | 68.8 | 13.2 | 5.41 |
| The Witcher 3 (2015) | 73.6 | 45.1 | 22.1 | 11.1 |
| Dota 2 Reborn (2015) | 100.7 | 75.2 | 49.2 | 45 |
| Final Fantasy XV Benchmark (2018) | 31 | 16.9 | 12.1 | |
| X-Plane 11.11 (2018) | 28.6 | 22.5 | 21 | |
| Far Cry 5 (2018) | 40 | 19 | 18 | 17 |
| Strange Brigade (2018) | 70.3 | 27.3 | 22.4 | 18.3 |
| Cyberpunk 2077 1.6 (2022) | 14.1 | |||
| Tiny Tina's Wonderlands (2022) | 20.6 | 15.3 | 10.4 | 8.1 |
| F1 22 (2022) | 32.8 | 29.1 | 21.3 | 16.5 |
Uitstoot
Systeemgeluid
Het ventilatorgeluid is over het algemeen luider dan wat we op de Ryzen 7-versie hebben ervaren, waarschijnlijk door de hogere stroomvereisten van onze Intel-versie. De AMD-versie is in staat om gedurende langere periodes stiller te blijven wanneer er stress wordt geïntroduceerd. Bij het uitvoeren van 3DMark 06, bijvoorbeeld, bleef het ventilatorgeluid relatief stil op iets minder dan 25 dB(A) in vergelijking met bijna 33 dB(A) op onze Intel-versie.
Geluidsniveau
| Onbelast |
| 24.6 / 24.6 / 24.6 dB (A) |
| Belasting |
| 32.7 / 39.2 dB (A) |
 | ||
30 dB stil 40 dB(A) hoorbaar 50 dB(A) luid |
||
min: | ||
| Lenovo ThinkPad E16 G1 Core i5-1335U Iris Xe G7 80EUs, i5-1335U | Lenovo ThinkPad E16 G1-21JUS08X00 Vega 8, R7 7730U, WD PC SN740 SDDPNQD-1T00 | Dell Inspiron 16 7635 2-in-1 Vega 7, R5 7530U, Kioxia BG5 KBG50ZNS512G | Acer TravelMate P4 TMP416-51-55KN Iris Xe G7 80EUs, i5-1240P, Micron 2450 512GB MTFDKBA512TFK | Samsung Galaxy Book3 Pro 16 Iris Xe G7 80EUs, i5-1340P, WD PC SN740 256GB SDDPNQD-256G | LG Gram 16Z90Q Iris Xe G7 96EUs, i7-1260P, Samsung PM9A1 MZVL21T0HCLR | |
|---|---|---|---|---|---|---|
| Noise | 11% | -7% | -10% | -14% | -7% | |
| uit / omgeving * (dB) | 24.6 | 22.4 9% | 23.6 4% | 25.4 -3% | 25.2 -2% | 25 -2% |
| Idle Minimum * (dB) | 24.6 | 22.4 9% | 23.6 4% | 25.4 -3% | 25.2 -2% | 26 -6% |
| Idle Average * (dB) | 24.6 | 22.4 9% | 23.6 4% | 25.4 -3% | 25.2 -2% | 27 -10% |
| Idle Maximum * (dB) | 24.6 | 23.7 4% | 23.6 4% | 25.4 -3% | 29.3 -19% | 28 -14% |
| Load Average * (dB) | 32.7 | 24.8 24% | 40.3 -23% | 43.9 -34% | 46.4 -42% | 38 -16% |
| Witcher 3 ultra * (dB) | 34.7 | 29.8 14% | 44.2 -27% | 37 -7% | ||
| Load Maximum * (dB) | 39.2 | 36.1 8% | 44.2 -13% | 43.7 -11% | 46.4 -18% | 38 3% |
* ... kleiner is beter
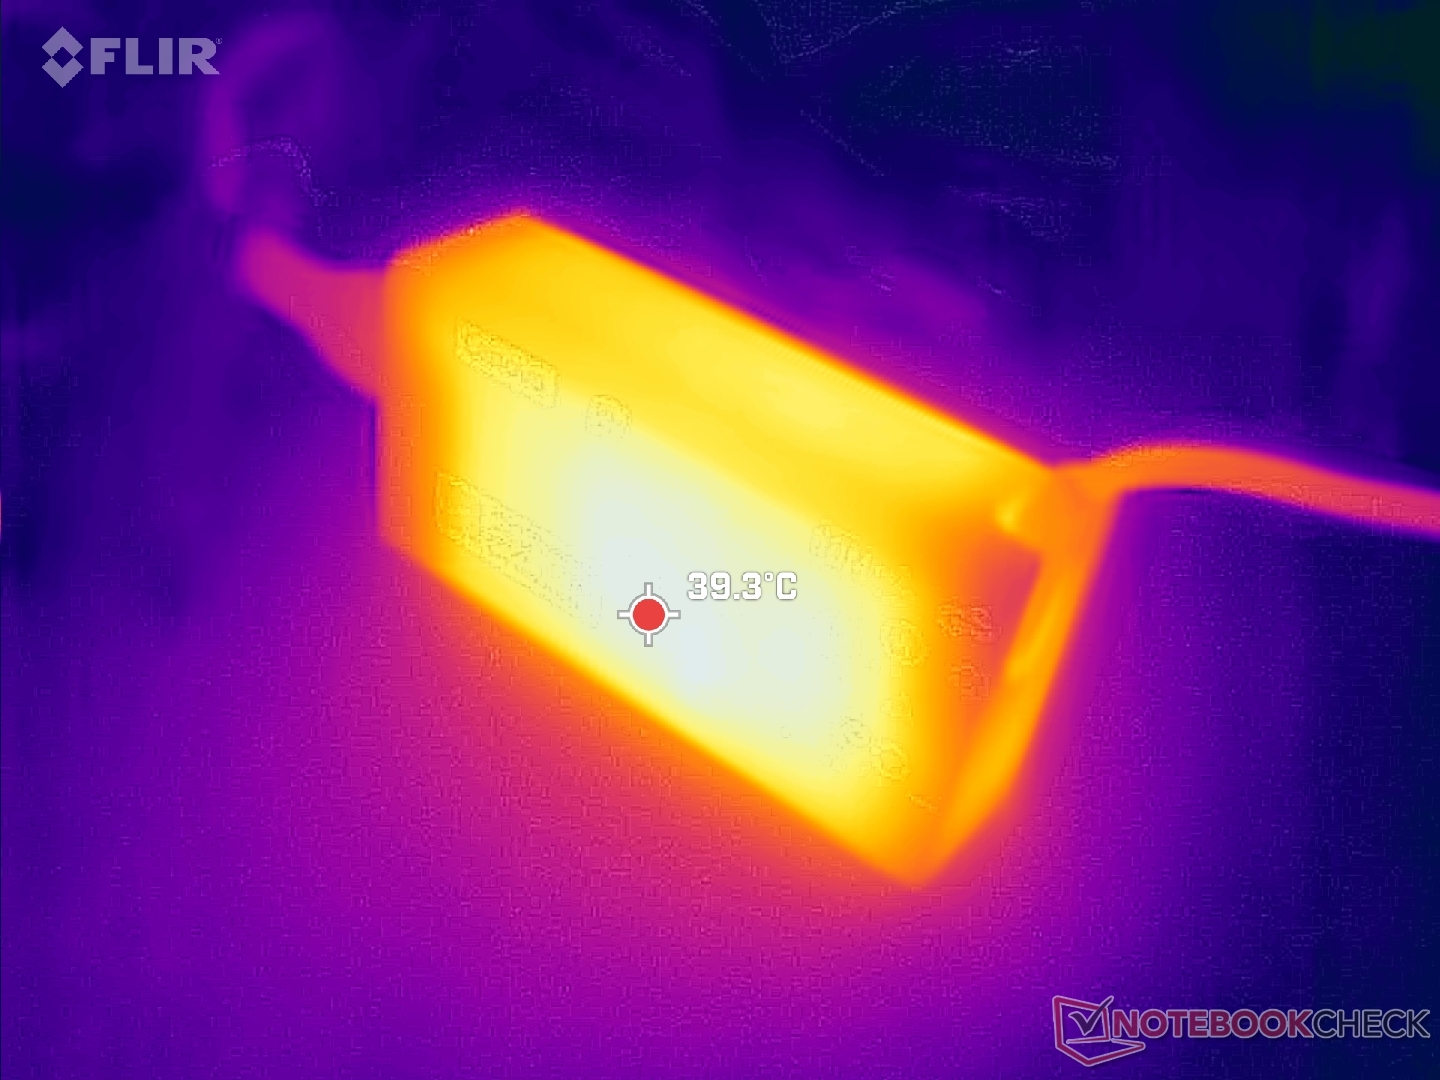
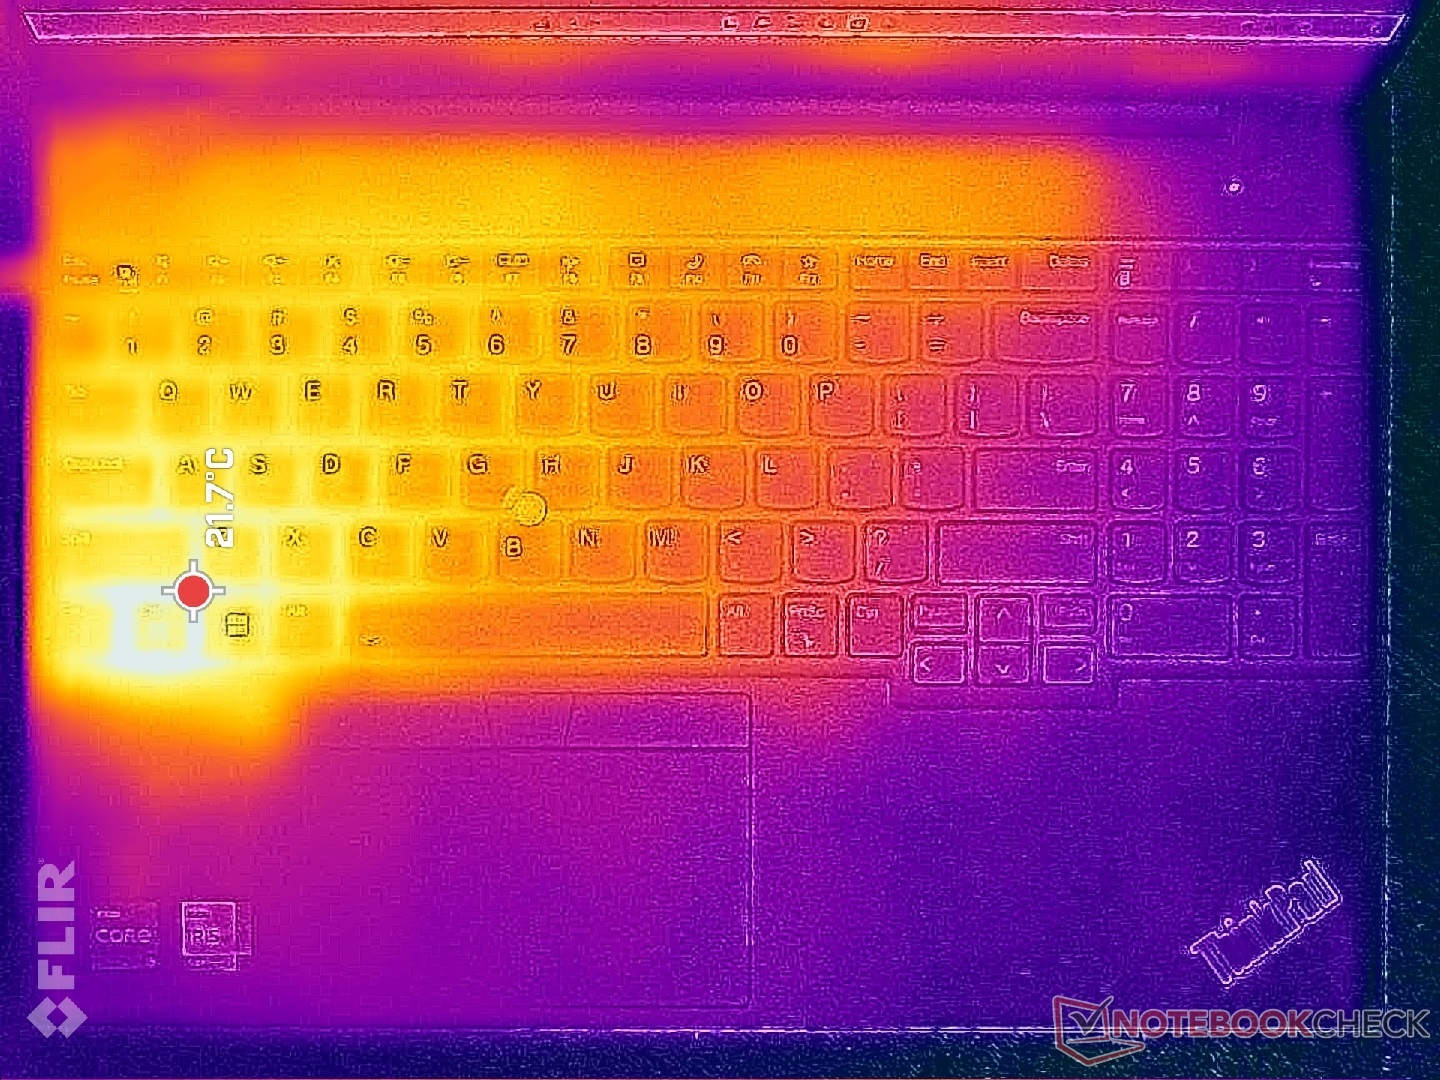
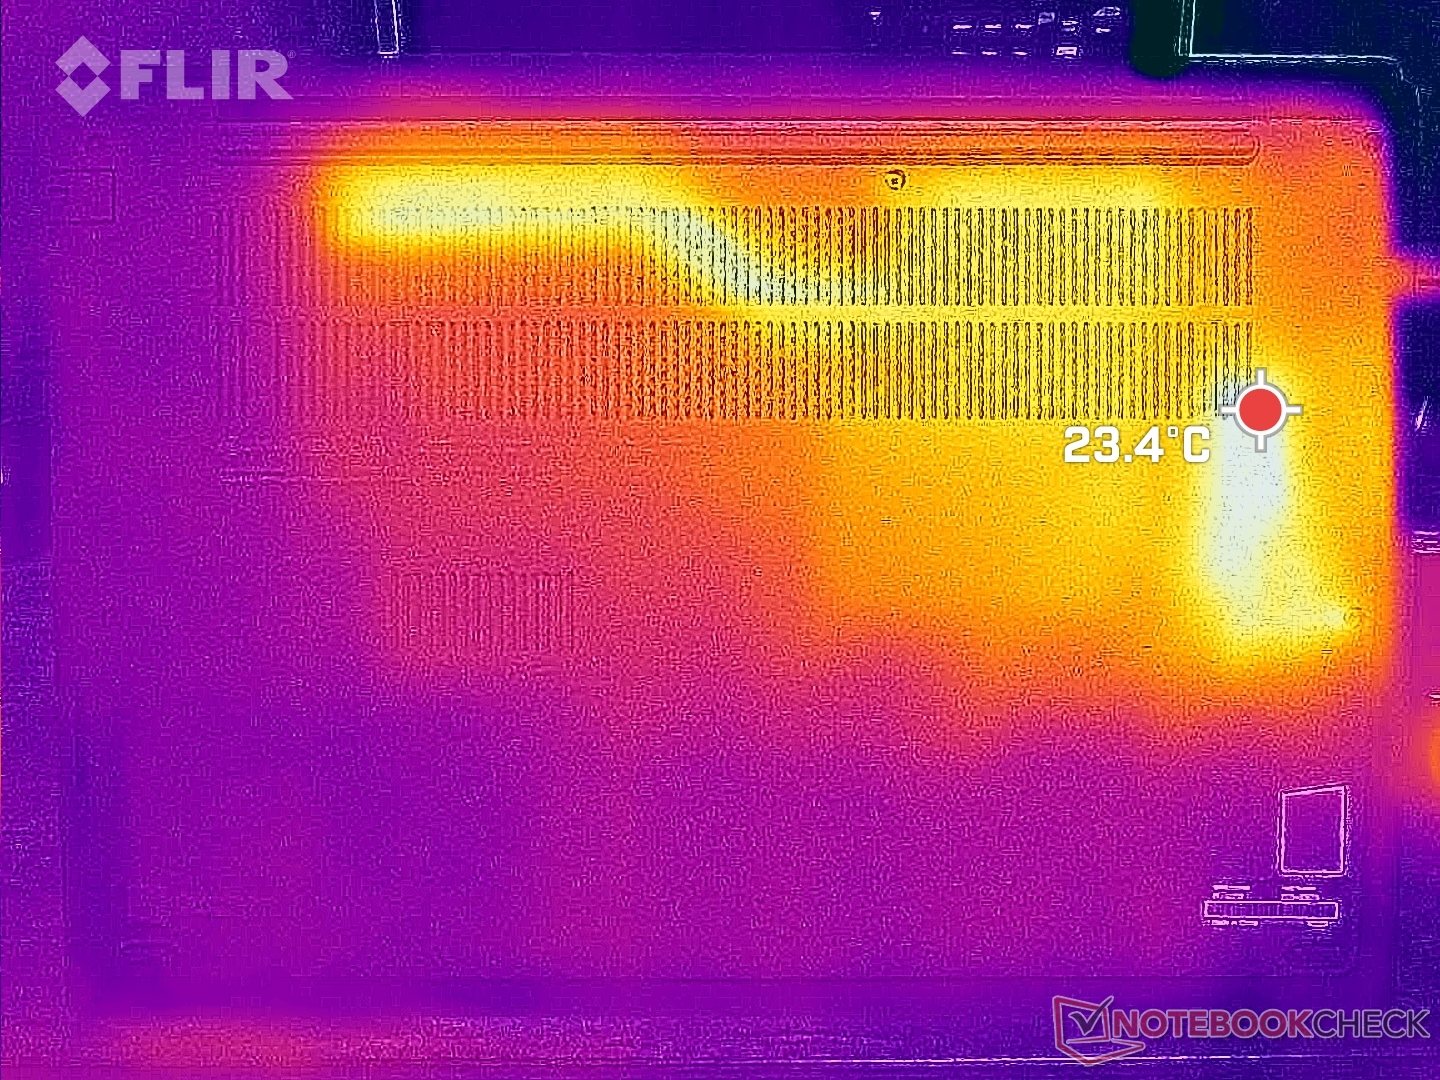
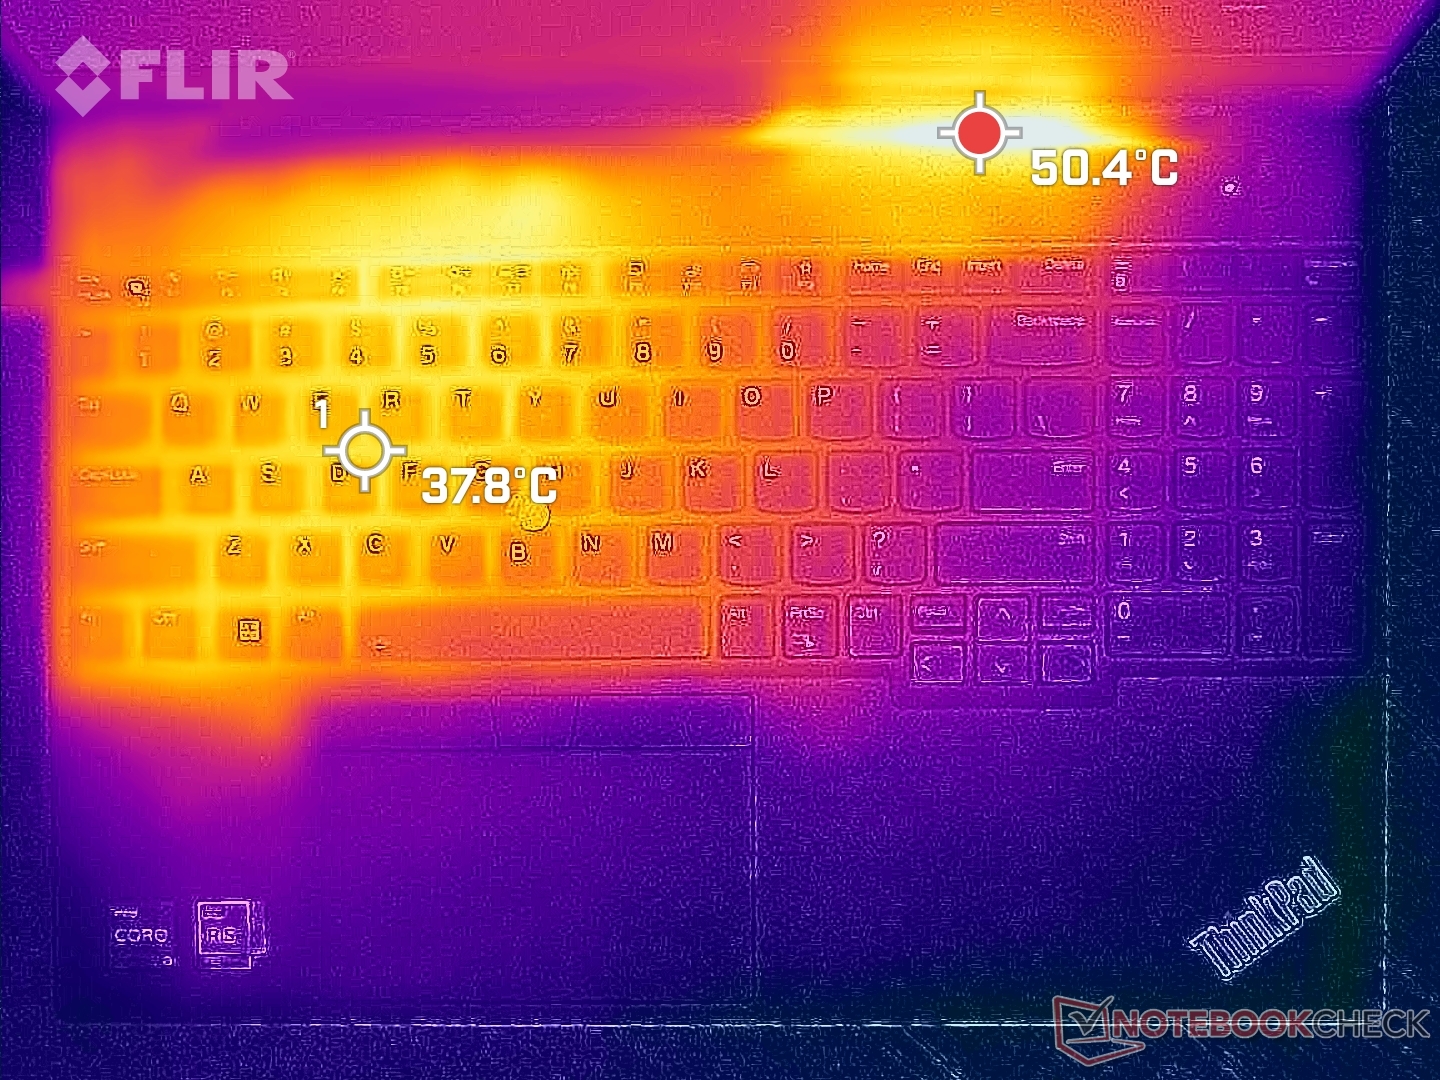
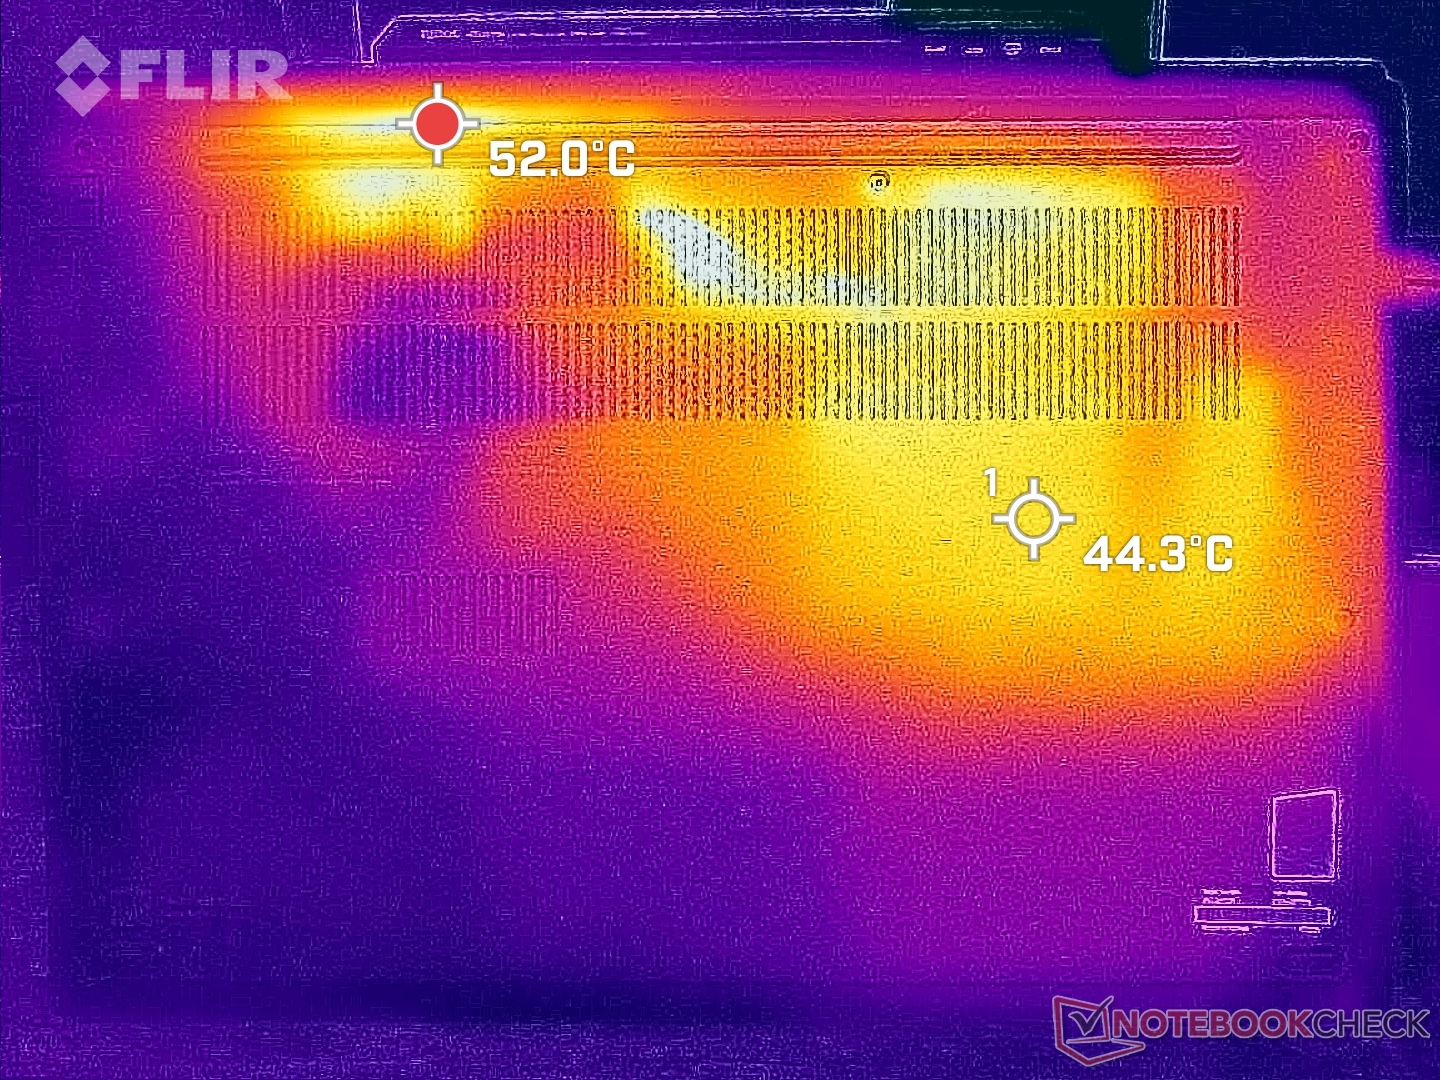
Temperatuur
De oppervlaktetemperaturen zijn warmer op de linkerhelft van de laptop dan op de rechterhelft, simpelweg door de plaatsing van de processor en de koeloplossing binnenin. Hete plekken bij zware belastingen kunnen oplopen tot respectievelijk 38 C en 45 C aan de boven- en onderkant, zoals blijkt uit de onderstaande temperatuurkaarten. De resultaten zijn eigenlijk een paar graden C koeler dan wat we registreerden op de AMD-configuratie, misschien als gevolg van de hierboven genoemde luidere ventilator. Hoewel de temperatuurverschillen tussen de warmere en koelere kwadranten voelbaar zijn, zijn ze niet oncomfortabel of storend tijdens het gebruik.
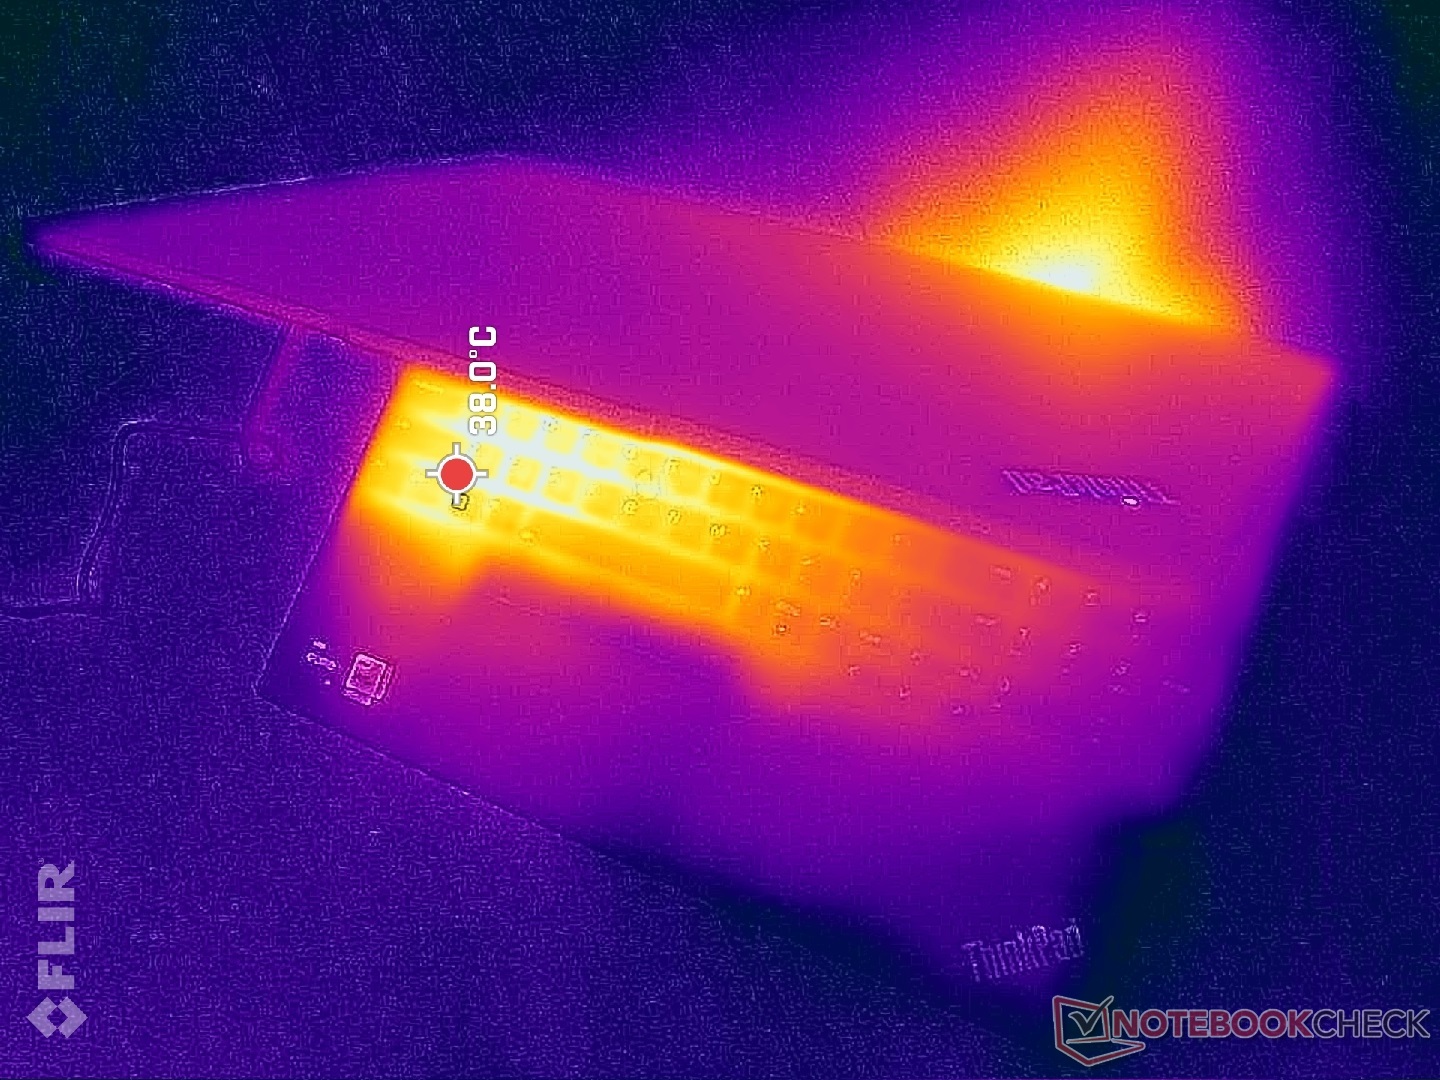
(±) De maximumtemperatuur aan de bovenzijde bedraagt 44 °C / 111 F, vergeleken met het gemiddelde van 34.3 °C / 94 F, variërend van 21.2 tot 62.5 °C voor de klasse Office.
(-) De bodem warmt op tot een maximum van 50.4 °C / 123 F, vergeleken met een gemiddelde van 36.8 °C / 98 F
(+) Bij onbelast gebruik bedraagt de gemiddelde temperatuur voor de bovenzijde 24.3 °C / 76 F, vergeleken met het apparaatgemiddelde van 29.5 °C / 85 F.
(+) De palmsteunen en het touchpad zijn met een maximum van ###max## °C / 80.6 F koeler dan de huidtemperatuur en voelen daarom koel aan.
(±) De gemiddelde temperatuur van de handpalmsteun van soortgelijke toestellen bedroeg 27.5 °C / 81.5 F (+0.5 °C / 0.9 F).
| Lenovo ThinkPad E16 G1 Core i5-1335U Intel Core i5-1335U, Intel Iris Xe Graphics G7 80EUs | Lenovo ThinkPad E16 G1-21JUS08X00 AMD Ryzen 7 7730U, AMD Radeon RX Vega 8 (Ryzen 4000/5000) | Dell Inspiron 16 7635 2-in-1 AMD Ryzen 5 7530U, AMD Radeon RX Vega 7 | Acer TravelMate P4 TMP416-51-55KN Intel Core i5-1240P, Intel Iris Xe Graphics G7 80EUs | Samsung Galaxy Book3 Pro 16 Intel Core i5-1340P, Intel Iris Xe Graphics G7 80EUs | LG Gram 16Z90Q Intel Core i7-1260P, Intel Iris Xe Graphics G7 96EUs | |
|---|---|---|---|---|---|---|
| Heat | 0% | 4% | -1% | -5% | 6% | |
| Maximum Upper Side * (°C) | 44 | 46.1 -5% | 41.6 5% | 38.6 12% | 41.6 5% | 45 -2% |
| Maximum Bottom * (°C) | 50.4 | 52.2 -4% | 39 23% | 44.4 12% | 45 11% | 43 15% |
| Idle Upper Side * (°C) | 27.2 | 25.7 6% | 29.4 -8% | 28.9 -6% | 31 -14% | 26 4% |
| Idle Bottom * (°C) | 27.8 | 26.7 4% | 28.6 -3% | 34 -22% | 33.6 -21% | 26 6% |
* ... kleiner is beter
Stresstest
Tijdens het uitvoeren van Prime95 piekte de CPU alleen de eerste paar seconden naar 4 GHz, 50 W en 94 C, voordat hij gestaag daalde en zich stabiliseerde op 2,4 GHz, 86 C en 28 W, omdat Turbo Boost op piekniveau niet vol te houden is. Het hoge bereik van 80 C is behoorlijk warm voor een 16-inch Core U-serie laptop. Het uitvoeren van dezelfde test op deAcer Swift Edge 16 met de Ryzen 7 7840U zou de CPU in vergelijking stabiliseren op slechts 64 C.
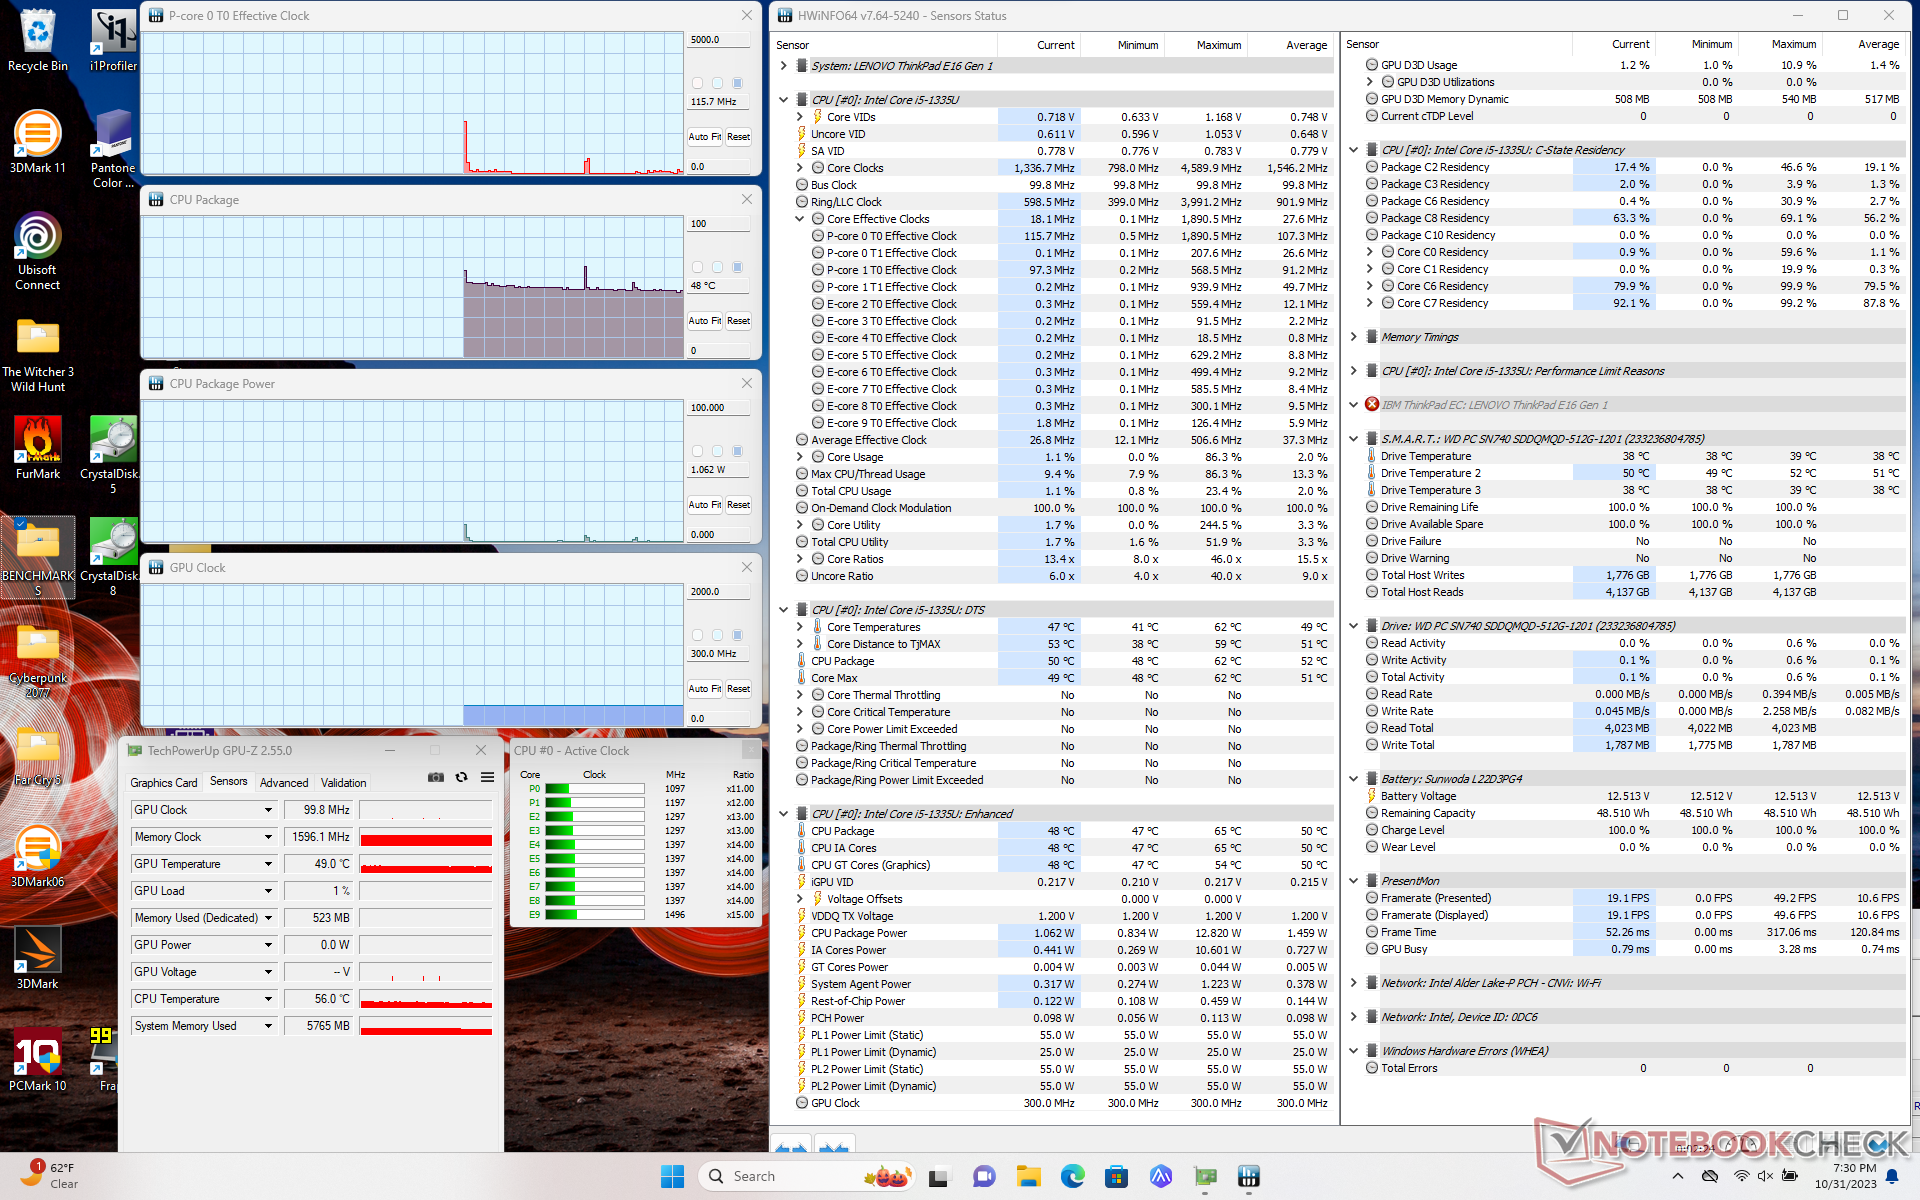
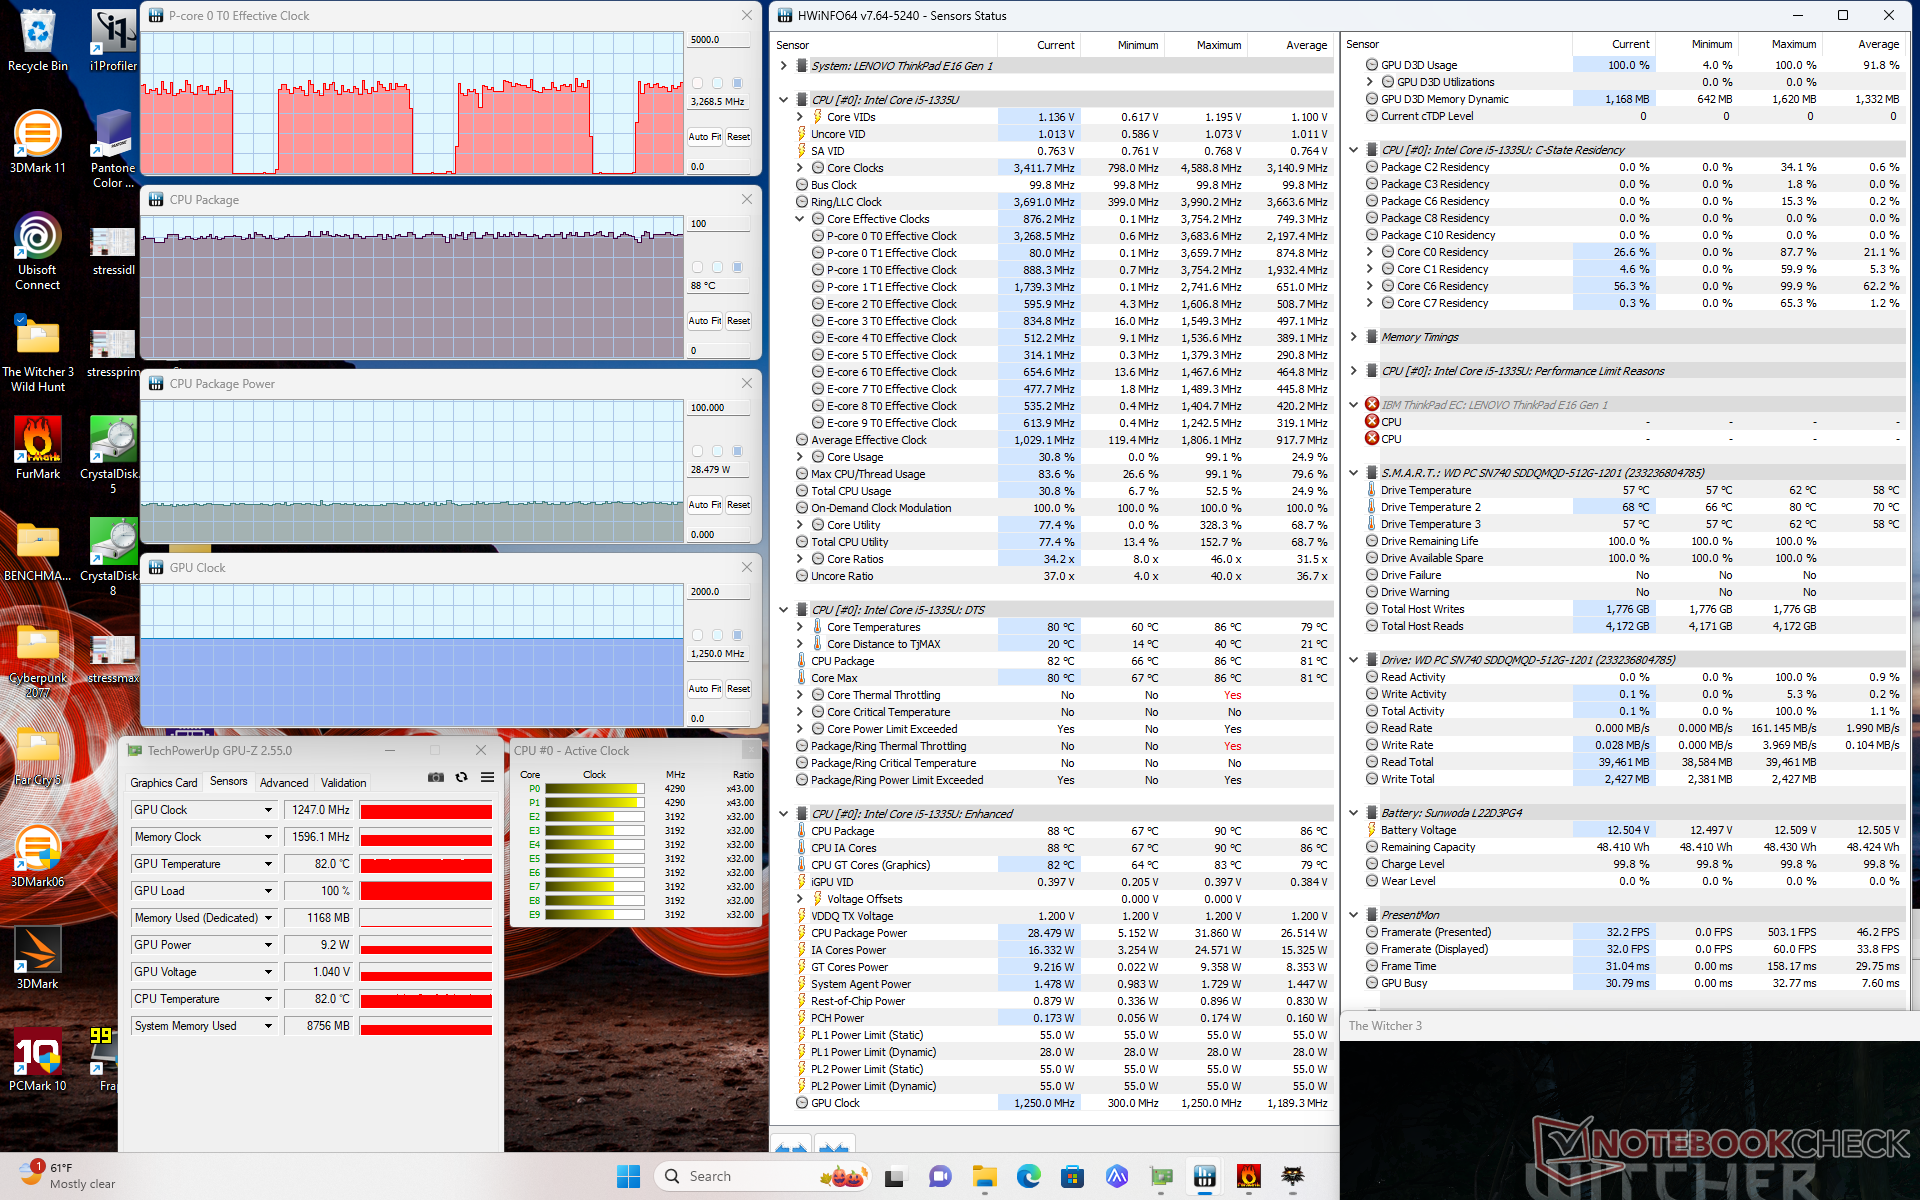
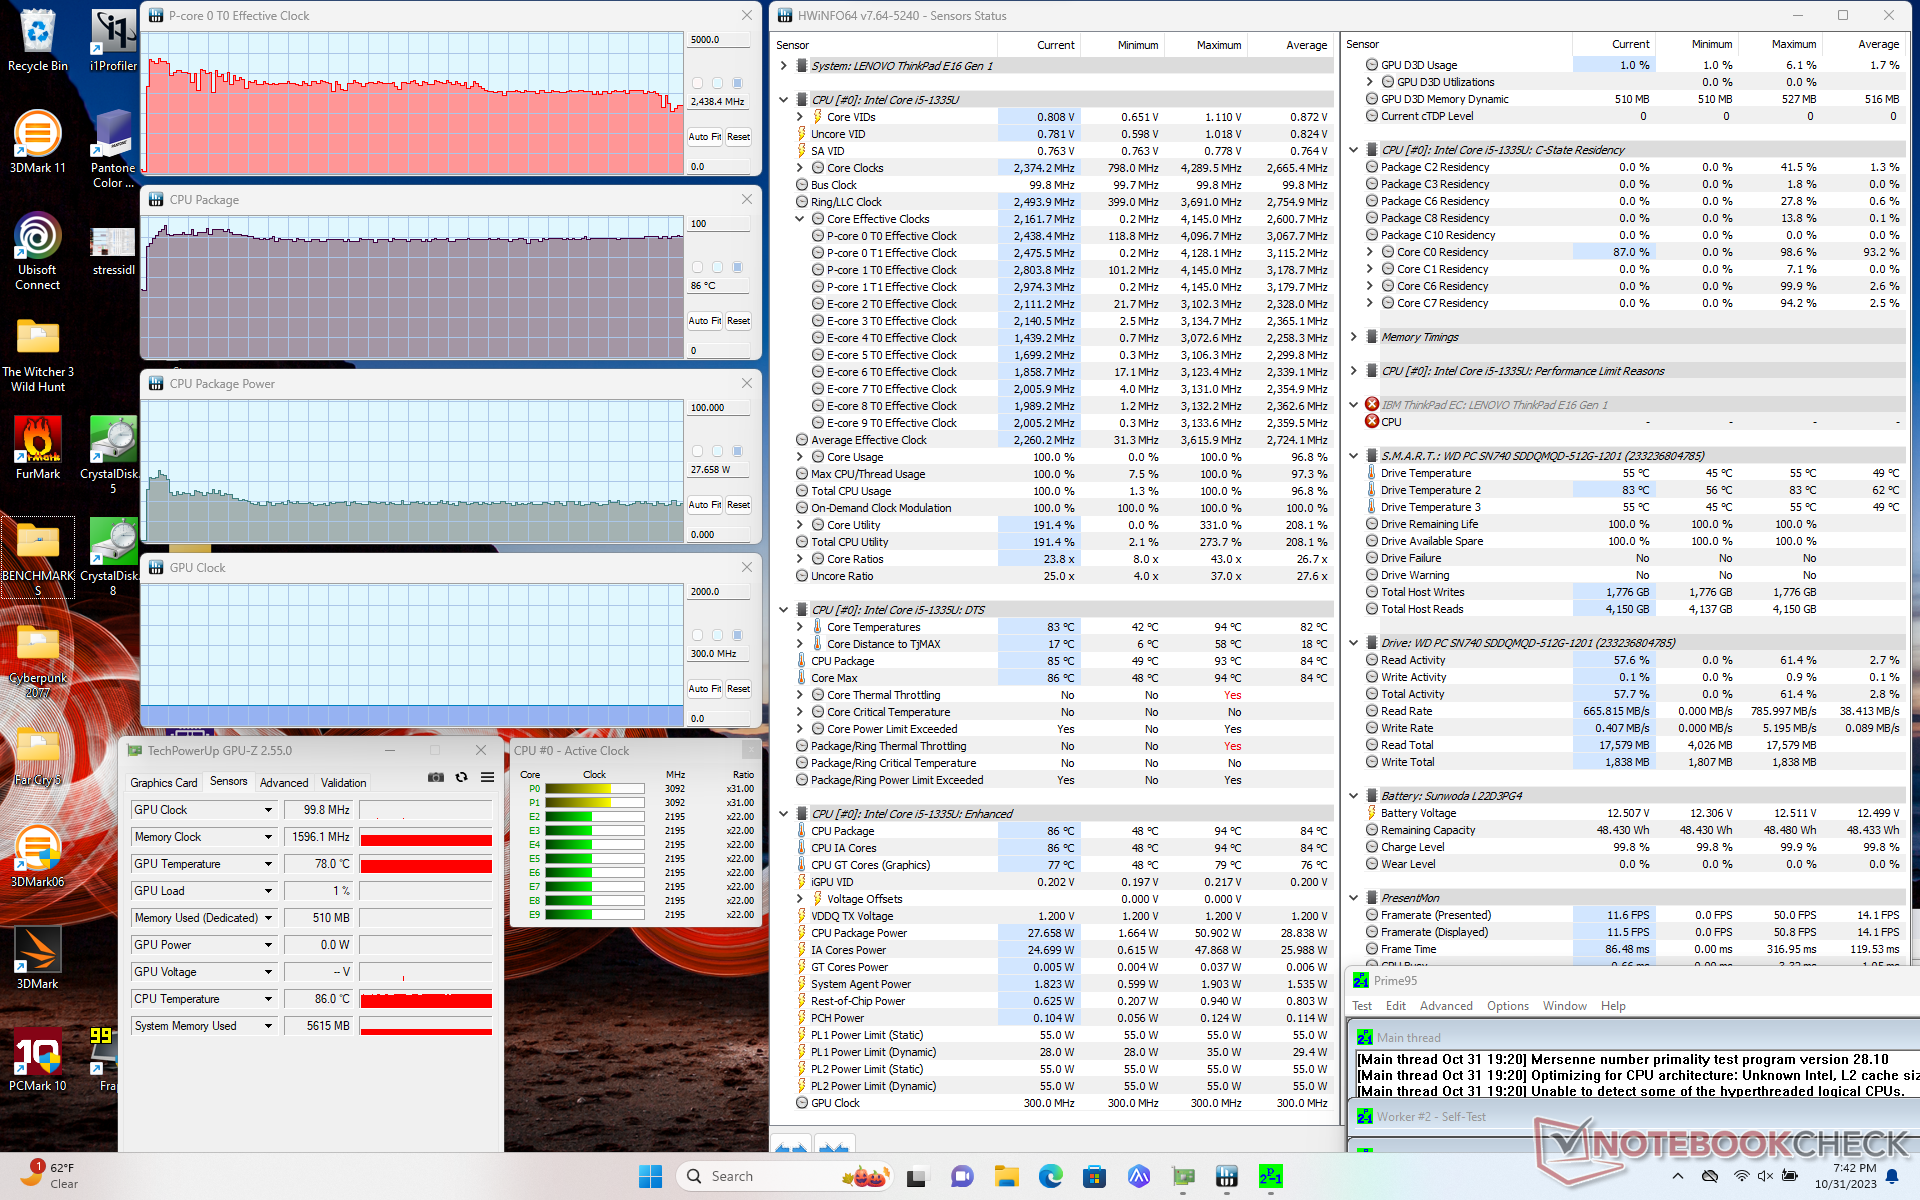
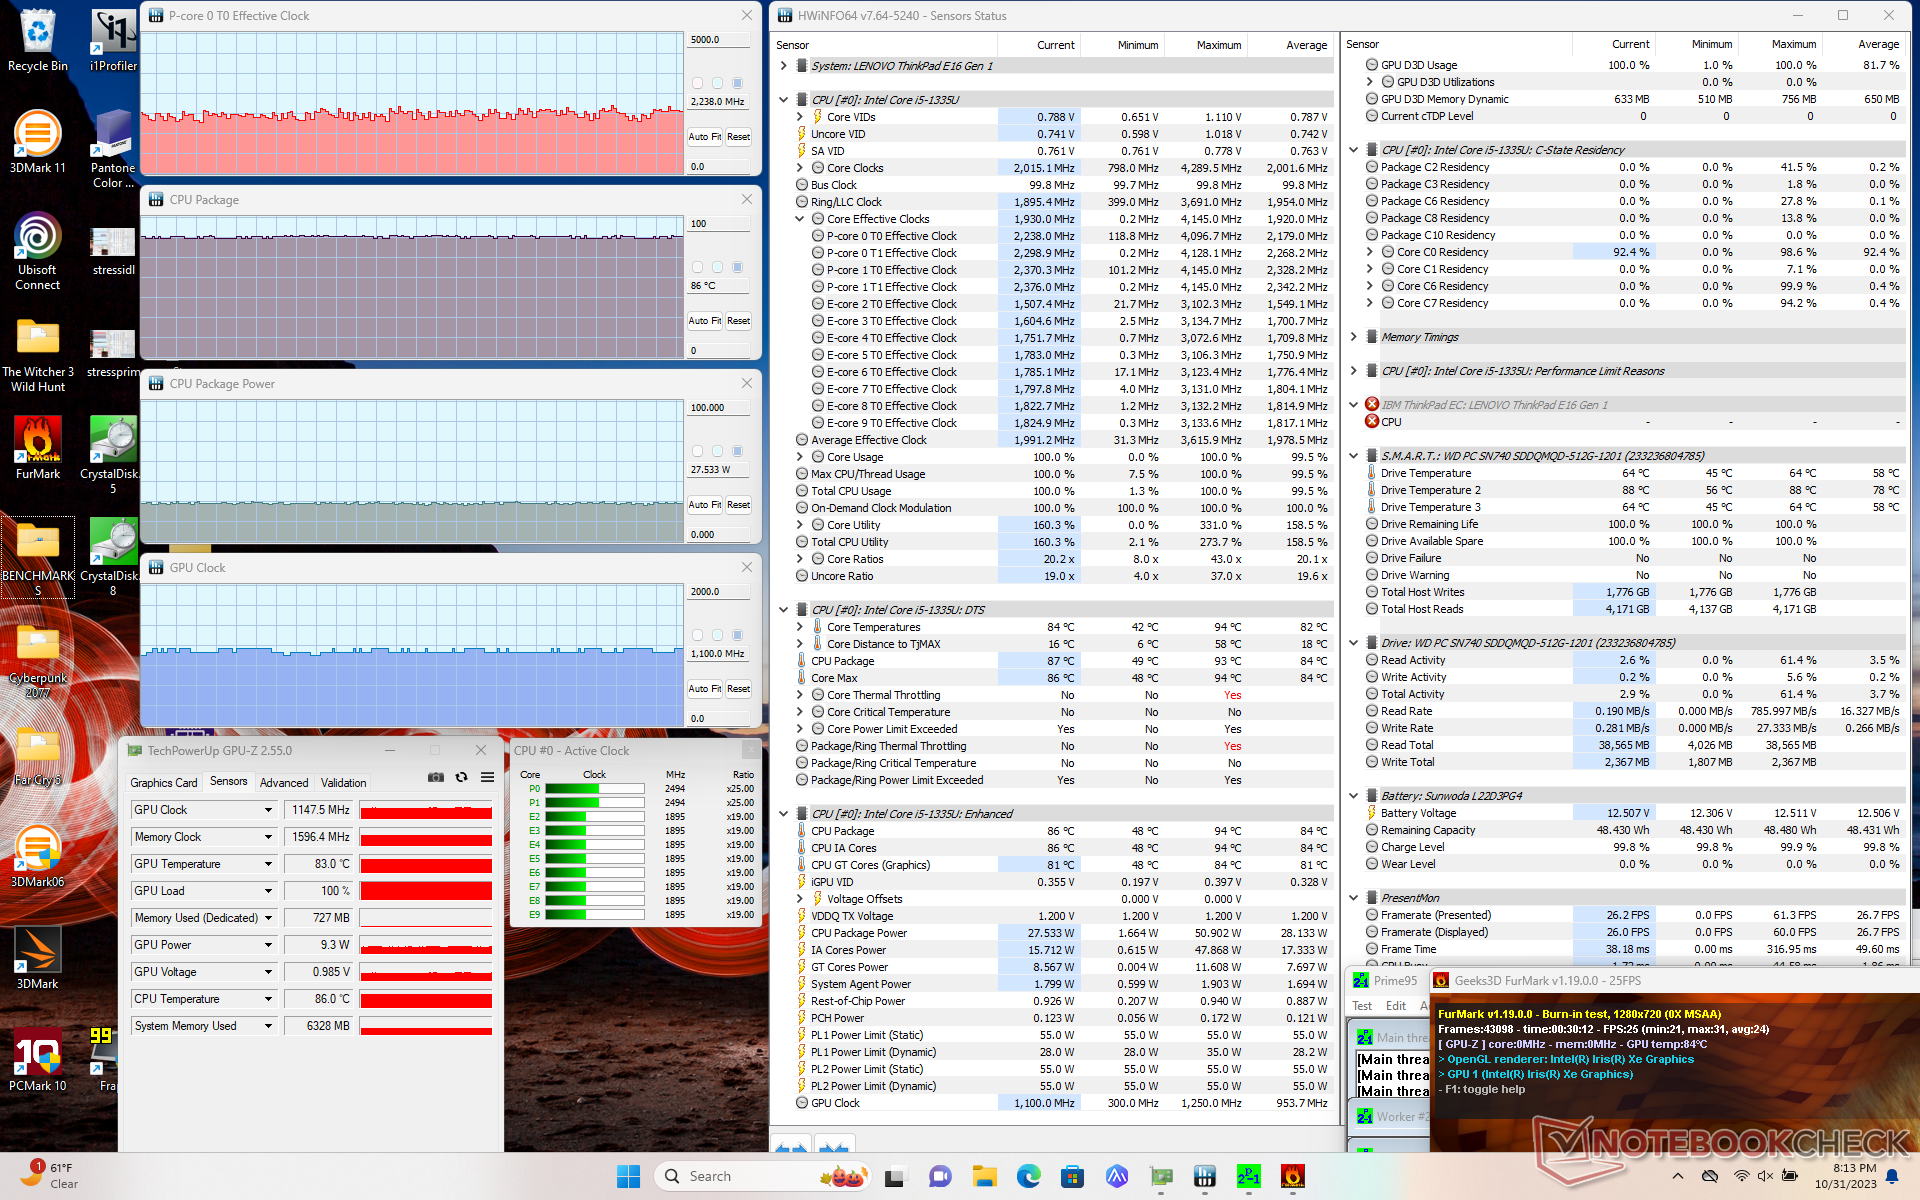
| CPU Klok (GHz) | GPU Klok (MHz) | Gemiddelde CPU Temperatuur (°C) | |
| Inactief systeem | -- | -- | 48 |
| Prime95 Stress | 2.4 | -- | 86 |
| Prime95 + FurMark Stress | ~2.2 | 1100 | 86 |
| Witcher 3 Belasting | ~3.2 | 1250 | 88 |
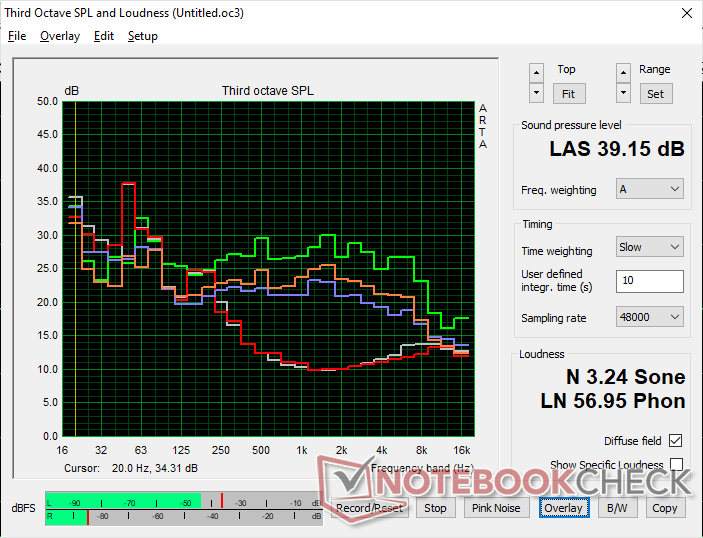
Luidsprekers
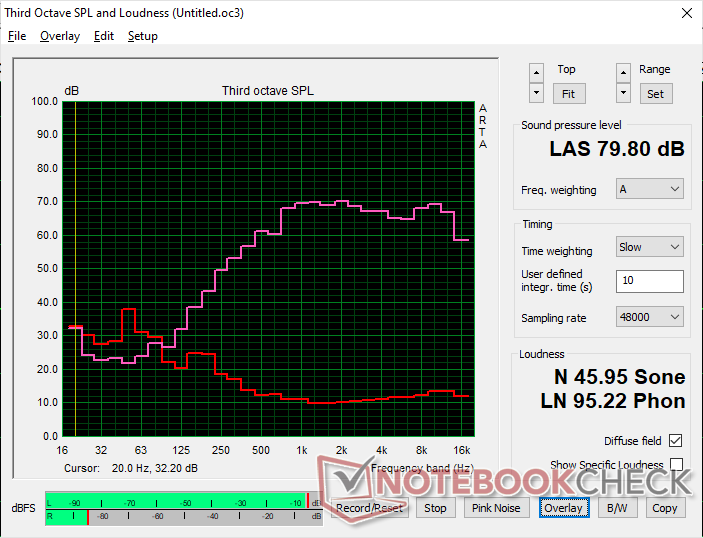
Lenovo ThinkPad E16 G1 Core i5-1335U audioanalyse
(±) | luidspreker luidheid is gemiddeld maar goed (79.8 dB)
Bas 100 - 315 Hz
(-) | bijna geen lage tonen - gemiddeld 24.7% lager dan de mediaan
(±) | lineariteit van de lage tonen is gemiddeld (8.8% delta ten opzichte van de vorige frequentie)
Midden 400 - 2000 Hz
(+) | evenwichtige middens - slechts 4.8% verwijderd van de mediaan
(+) | de middentonen zijn lineair (4.8% delta ten opzichte van de vorige frequentie)
Hoog 2 - 16 kHz
(+) | evenwichtige hoogtepunten - slechts 2.1% verwijderd van de mediaan
(+) | de hoge tonen zijn lineair (2.7% delta naar de vorige frequentie)
Algemeen 100 - 16.000 Hz
(±) | lineariteit van het totale geluid is gemiddeld (18.4% verschil met de mediaan)
Vergeleken met dezelfde klasse
» 33% van alle geteste apparaten in deze klasse waren beter, 7% vergelijkbaar, 59% slechter
» De beste had een delta van 7%, het gemiddelde was 21%, de slechtste was 53%
Vergeleken met alle geteste toestellen
» 41% van alle geteste apparaten waren beter, 8% gelijk, 51% slechter
» De beste had een delta van 4%, het gemiddelde was 23%, de slechtste was 134%
Apple MacBook Pro 16 2021 M1 Pro audioanalyse
(+) | luidsprekers kunnen relatief luid spelen (84.7 dB)
Bas 100 - 315 Hz
(+) | goede baars - slechts 3.8% verwijderd van de mediaan
(+) | de lage tonen zijn lineair (5.2% delta naar de vorige frequentie)
Midden 400 - 2000 Hz
(+) | evenwichtige middens - slechts 1.3% verwijderd van de mediaan
(+) | de middentonen zijn lineair (2.1% delta ten opzichte van de vorige frequentie)
Hoog 2 - 16 kHz
(+) | evenwichtige hoogtepunten - slechts 1.9% verwijderd van de mediaan
(+) | de hoge tonen zijn lineair (2.7% delta naar de vorige frequentie)
Algemeen 100 - 16.000 Hz
(+) | het totale geluid is lineair (4.6% verschil met de mediaan)
Vergeleken met dezelfde klasse
» 0% van alle geteste apparaten in deze klasse waren beter, 0% vergelijkbaar, 100% slechter
» De beste had een delta van 5%, het gemiddelde was 17%, de slechtste was 45%
Vergeleken met alle geteste toestellen
» 0% van alle geteste apparaten waren beter, 0% gelijk, 100% slechter
» De beste had een delta van 4%, het gemiddelde was 23%, de slechtste was 134%
Energiebeheer
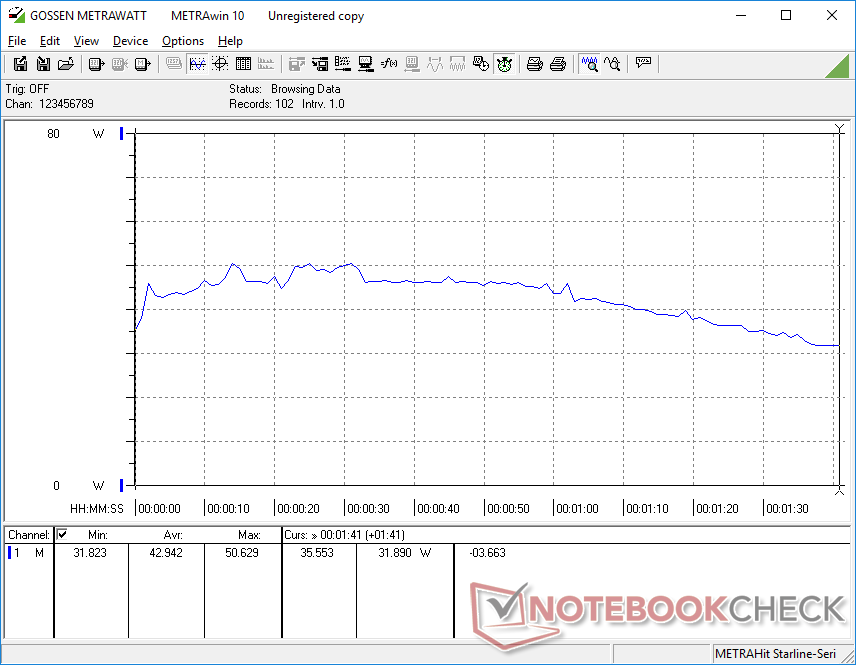
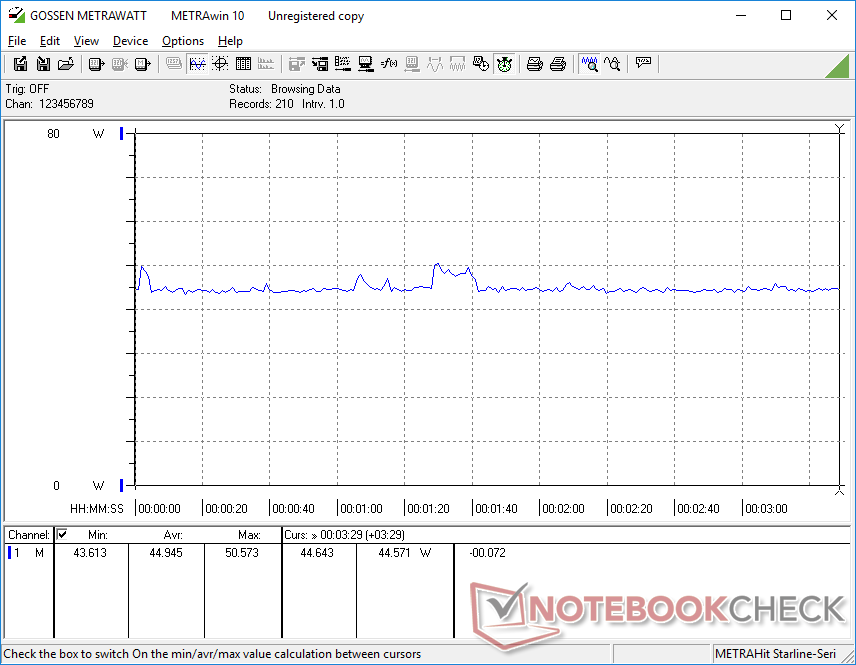
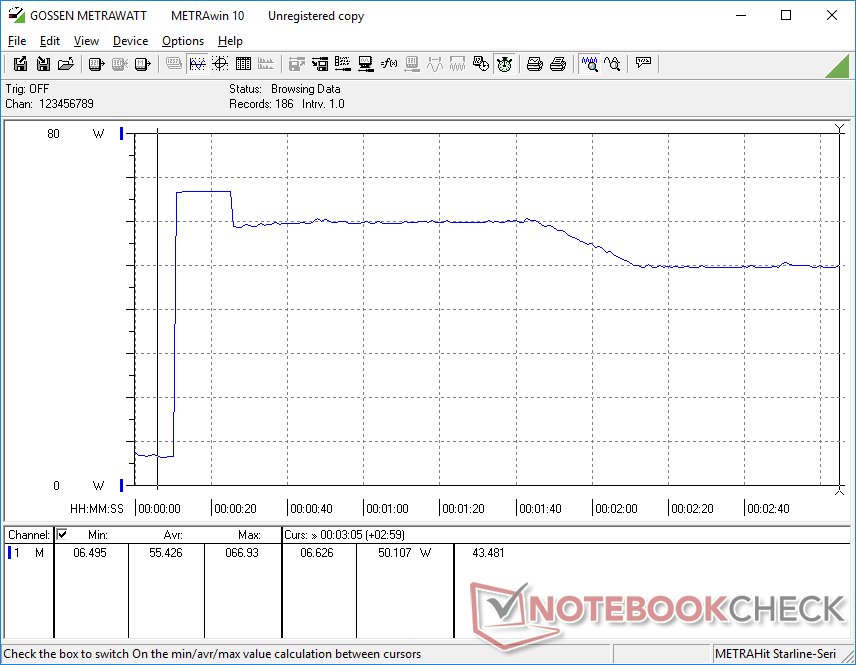
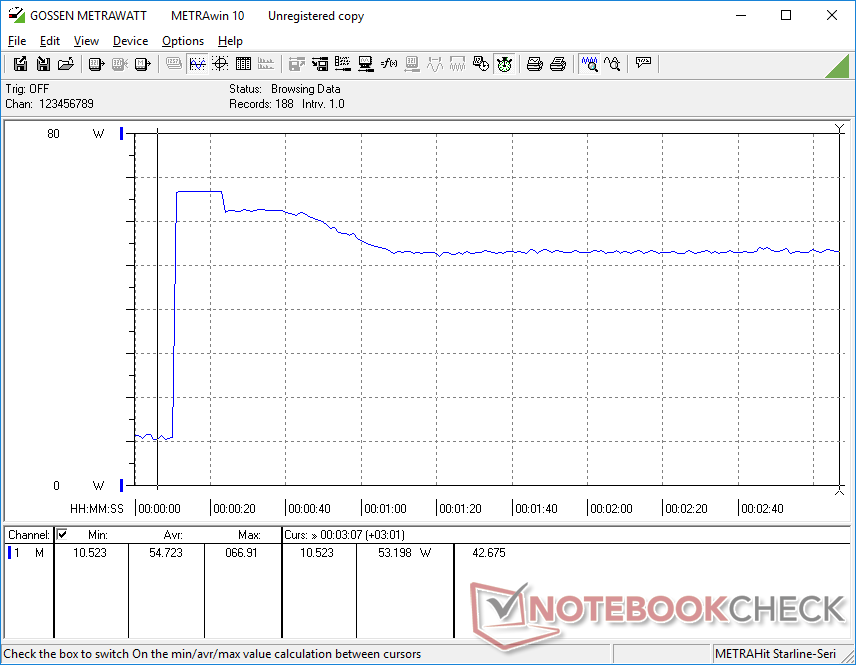
Stroomverbruik
Het Intel-systeem is over het algemeen veeleisender dan de AMD-versie bij het uitvoeren van CPU-intensieve taken, ook al is de AMD-processor over het algemeen sneller dan Intel als het aankomt op multi-threaded belastingen. Bij het starten van CineBench R15 xT, bijvoorbeeld, was het verbruik maar liefst 68 W op ons Intel-systeem, vergeleken met slechts 45 W op het AMD-systeem. Soortgelijke resultaten kunnen ook worden waargenomen bij het uitvoeren van Prime95. Het totale verbruik bij stationair draaien op de desktop of bij GPU-intensieve taken zoals Witcher 3 is verder ongeveer gelijk tussen de Intel- en AMD-versies.
| Uit / Standby | |
| Inactief | |
| Belasting |
|
Key:
min: | |
| Lenovo ThinkPad E16 G1 Core i5-1335U i5-1335U, Iris Xe G7 80EUs, , IPS, 1920x1200, 16" | Lenovo ThinkPad E16 G1-21JUS08X00 R7 7730U, Vega 8, WD PC SN740 SDDPNQD-1T00, IPS, 2560x1600, 16" | Dell Inspiron 16 7635 2-in-1 R5 7530U, Vega 7, Kioxia BG5 KBG50ZNS512G, IPS, 1920x1200, 16" | Acer TravelMate P4 TMP416-51-55KN i5-1240P, Iris Xe G7 80EUs, Micron 2450 512GB MTFDKBA512TFK, IPS, 1920x1200, 16" | Samsung Galaxy Book3 Pro 16 i5-1340P, Iris Xe G7 80EUs, WD PC SN740 256GB SDDPNQD-256G, AMOLED, 2880x1800, 16" | LG Gram 16Z90Q i7-1260P, Iris Xe G7 96EUs, Samsung PM9A1 MZVL21T0HCLR, IPS, 2560x1600, 16" | |
|---|---|---|---|---|---|---|
| Power Consumption | -3% | 2% | 1% | 9% | -7% | |
| Idle Minimum * (Watt) | 4.9 | 4.1 16% | 4.8 2% | 5.2 -6% | 3.9 20% | 5 -2% |
| Idle Average * (Watt) | 8.3 | 9.6 -16% | 7.6 8% | 7.1 14% | 4.8 42% | 8 4% |
| Idle Maximum * (Watt) | 8.6 | 10.2 -19% | 8.7 -1% | 9.6 -12% | 10 -16% | 14 -63% |
| Load Average * (Watt) | 42.9 | 47.3 -10% | 47.1 -10% | 47 -10% | 44 -3% | 47 -10% |
| Witcher 3 ultra * (Watt) | 44.9 | 46.7 -4% | 46.6 -4% | 43.3 4% | 42.3 6% | 37.8 16% |
| Load Maximum * (Watt) | 67 | 55.7 17% | 56.4 16% | 56 16% | 63 6% | 56 16% |
* ... kleiner is beter
Power Consumption Witcher 3 / Stresstest
Power Consumption external Monitor
Levensduur batterij
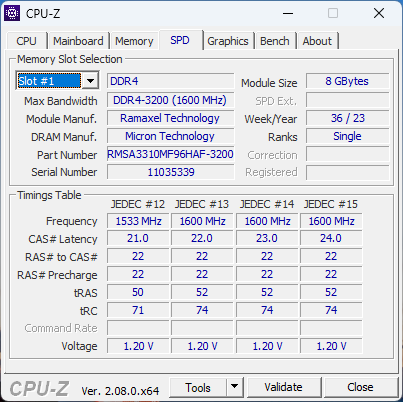
Het model wordt geleverd met twee opties voor de batterijcapaciteit: 47 Wh en 57 Wh. Ons Intel-toestel wordt geleverd met de kleinste optie, terwijl ons AMD-toestel met de grootste wordt geleverd. De batterijlevensduur is slechts half zo lang als op ons AMD-toestel voor slechts 5 uur echt browsen. Voor een 16-inch laptop is de 47 Wh optie veel kleiner dan verwacht en een duidelijke bezuiniging.
Het opladen van leeg naar vol gaat gelukkig vrij snel (iets meer dan een uur).
| Lenovo ThinkPad E16 G1 Core i5-1335U i5-1335U, Iris Xe G7 80EUs, 47 Wh | Lenovo ThinkPad E16 G1-21JUS08X00 R7 7730U, Vega 8, 57 Wh | Dell Inspiron 16 7635 2-in-1 R5 7530U, Vega 7, 64 Wh | Acer TravelMate P4 TMP416-51-55KN i5-1240P, Iris Xe G7 80EUs, 56 Wh | Samsung Galaxy Book3 Pro 16 i5-1340P, Iris Xe G7 80EUs, 76 Wh | LG Gram 16Z90Q i7-1260P, Iris Xe G7 96EUs, 80 Wh | |
|---|---|---|---|---|---|---|
| Batterijduur | 117% | 179% | 81% | 96% | 94% | |
| WiFi v1.3 (h) | 5.2 | 11.3 117% | 14.5 179% | 9.4 81% | 10.2 96% | 10.1 94% |
| H.264 (h) | 11.7 | 14.4 | ||||
| Load (h) | 1.3 | 1.9 | 2 | 2.6 | ||
| Reader / Idle (h) | 26 | 30.4 | 18.1 |
Pro
Contra
Verdict - AMD wint met batterijduur
Als u kiest voor de Intel ThinkPad E16 G1 in plaats van AMD, krijgt u Thunderbolt-ondersteuning, snellere single-thread prestaties en snellere geïntegreerde grafische prestaties als u de Core i7-1355U kiest. Deze voordelen verbleken echter bij wat de AMD-versie biedt: een merkbaar langere batterijlevensduur, hogere prestaties per watt, snellere multi-thread prestaties en ondersteuning voor M.2 2280 SSD's. U zult dus echt waarde moeten hechten aan de superieure dockingmogelijkheden van de Intel-versie als u besluit om de AMD-opties over te slaan.
Als u niet van plan bent om Thunderbolt-monitoren of eGPU's op uw ThinkPad E16 G1 aan te sluiten, dan kunnen de AMD-versies zowel een langere batterijlevensduur als snellere multi-thread prestaties bieden dan de Intel-opties voor ongeveer dezelfde prijs.
Ongeacht de versievoorkeur, zullen gebruikers nog steeds goed moeten opletten op het beeldscherm en de batterijgrootte voordat ze tot aanschaf overgaan. Helaas geeft niet elke verkoper een overzicht van de kleurdekking of de batterijcapaciteit, dus het is gemakkelijk om per ongeluk een configuratie te kopen met een beeldscherm uit het lagere segment of een kleinere batterij van 47 Wh. Wij raden u aan om indien mogelijk te streven naar volledige sRGB-dekking en de grotere 57 Wh batterij, omdat dit aanzienlijke sprongen zijn ten opzichte van de basisconfiguratie.
Prijs en beschikbaarheid
Lenovo levert de ThinkPad E16 G1 nu vanaf 638 USD voor de Core i3-configuratie of 724 USD voor de Core i5-configuratie.
Lenovo ThinkPad E16 G1 Core i5-1335U
- 02-11-2023 v7 (old)
Allen Ngo
Transparantie
De selectie van te beoordelen apparaten wordt gemaakt door onze redactie. Het testexemplaar werd ten behoeve van deze beoordeling door de fabrikant of detailhandelaar in bruikleen aan de auteur verstrekt. De kredietverstrekker had geen invloed op deze recensie, noch ontving de fabrikant vóór publicatie een exemplaar van deze recensie. Er bestond geen verplichting om deze recensie te publiceren. Als onafhankelijk mediabedrijf is Notebookcheck niet onderworpen aan het gezag van fabrikanten, detailhandelaren of uitgevers.
[transparency_disclaimer]Dit is hoe Notebookcheck test
Elk jaar beoordeelt Notebookcheck onafhankelijk honderden laptops en smartphones met behulp van gestandaardiseerde procedures om ervoor te zorgen dat alle resultaten vergelijkbaar zijn. We hebben onze testmethoden al zo'n 20 jaar voortdurend ontwikkeld en daarbij de industriestandaard bepaald. In onze testlaboratoria wordt gebruik gemaakt van hoogwaardige meetapparatuur door ervaren technici en redacteuren. Deze tests omvatten een validatieproces in meerdere fasen. Ons complexe beoordelingssysteem is gebaseerd op honderden goed onderbouwde metingen en benchmarks, waardoor de objectiviteit behouden blijft. Meer informatie over onze testmethoden kunt u hier vinden.
Price comparison

