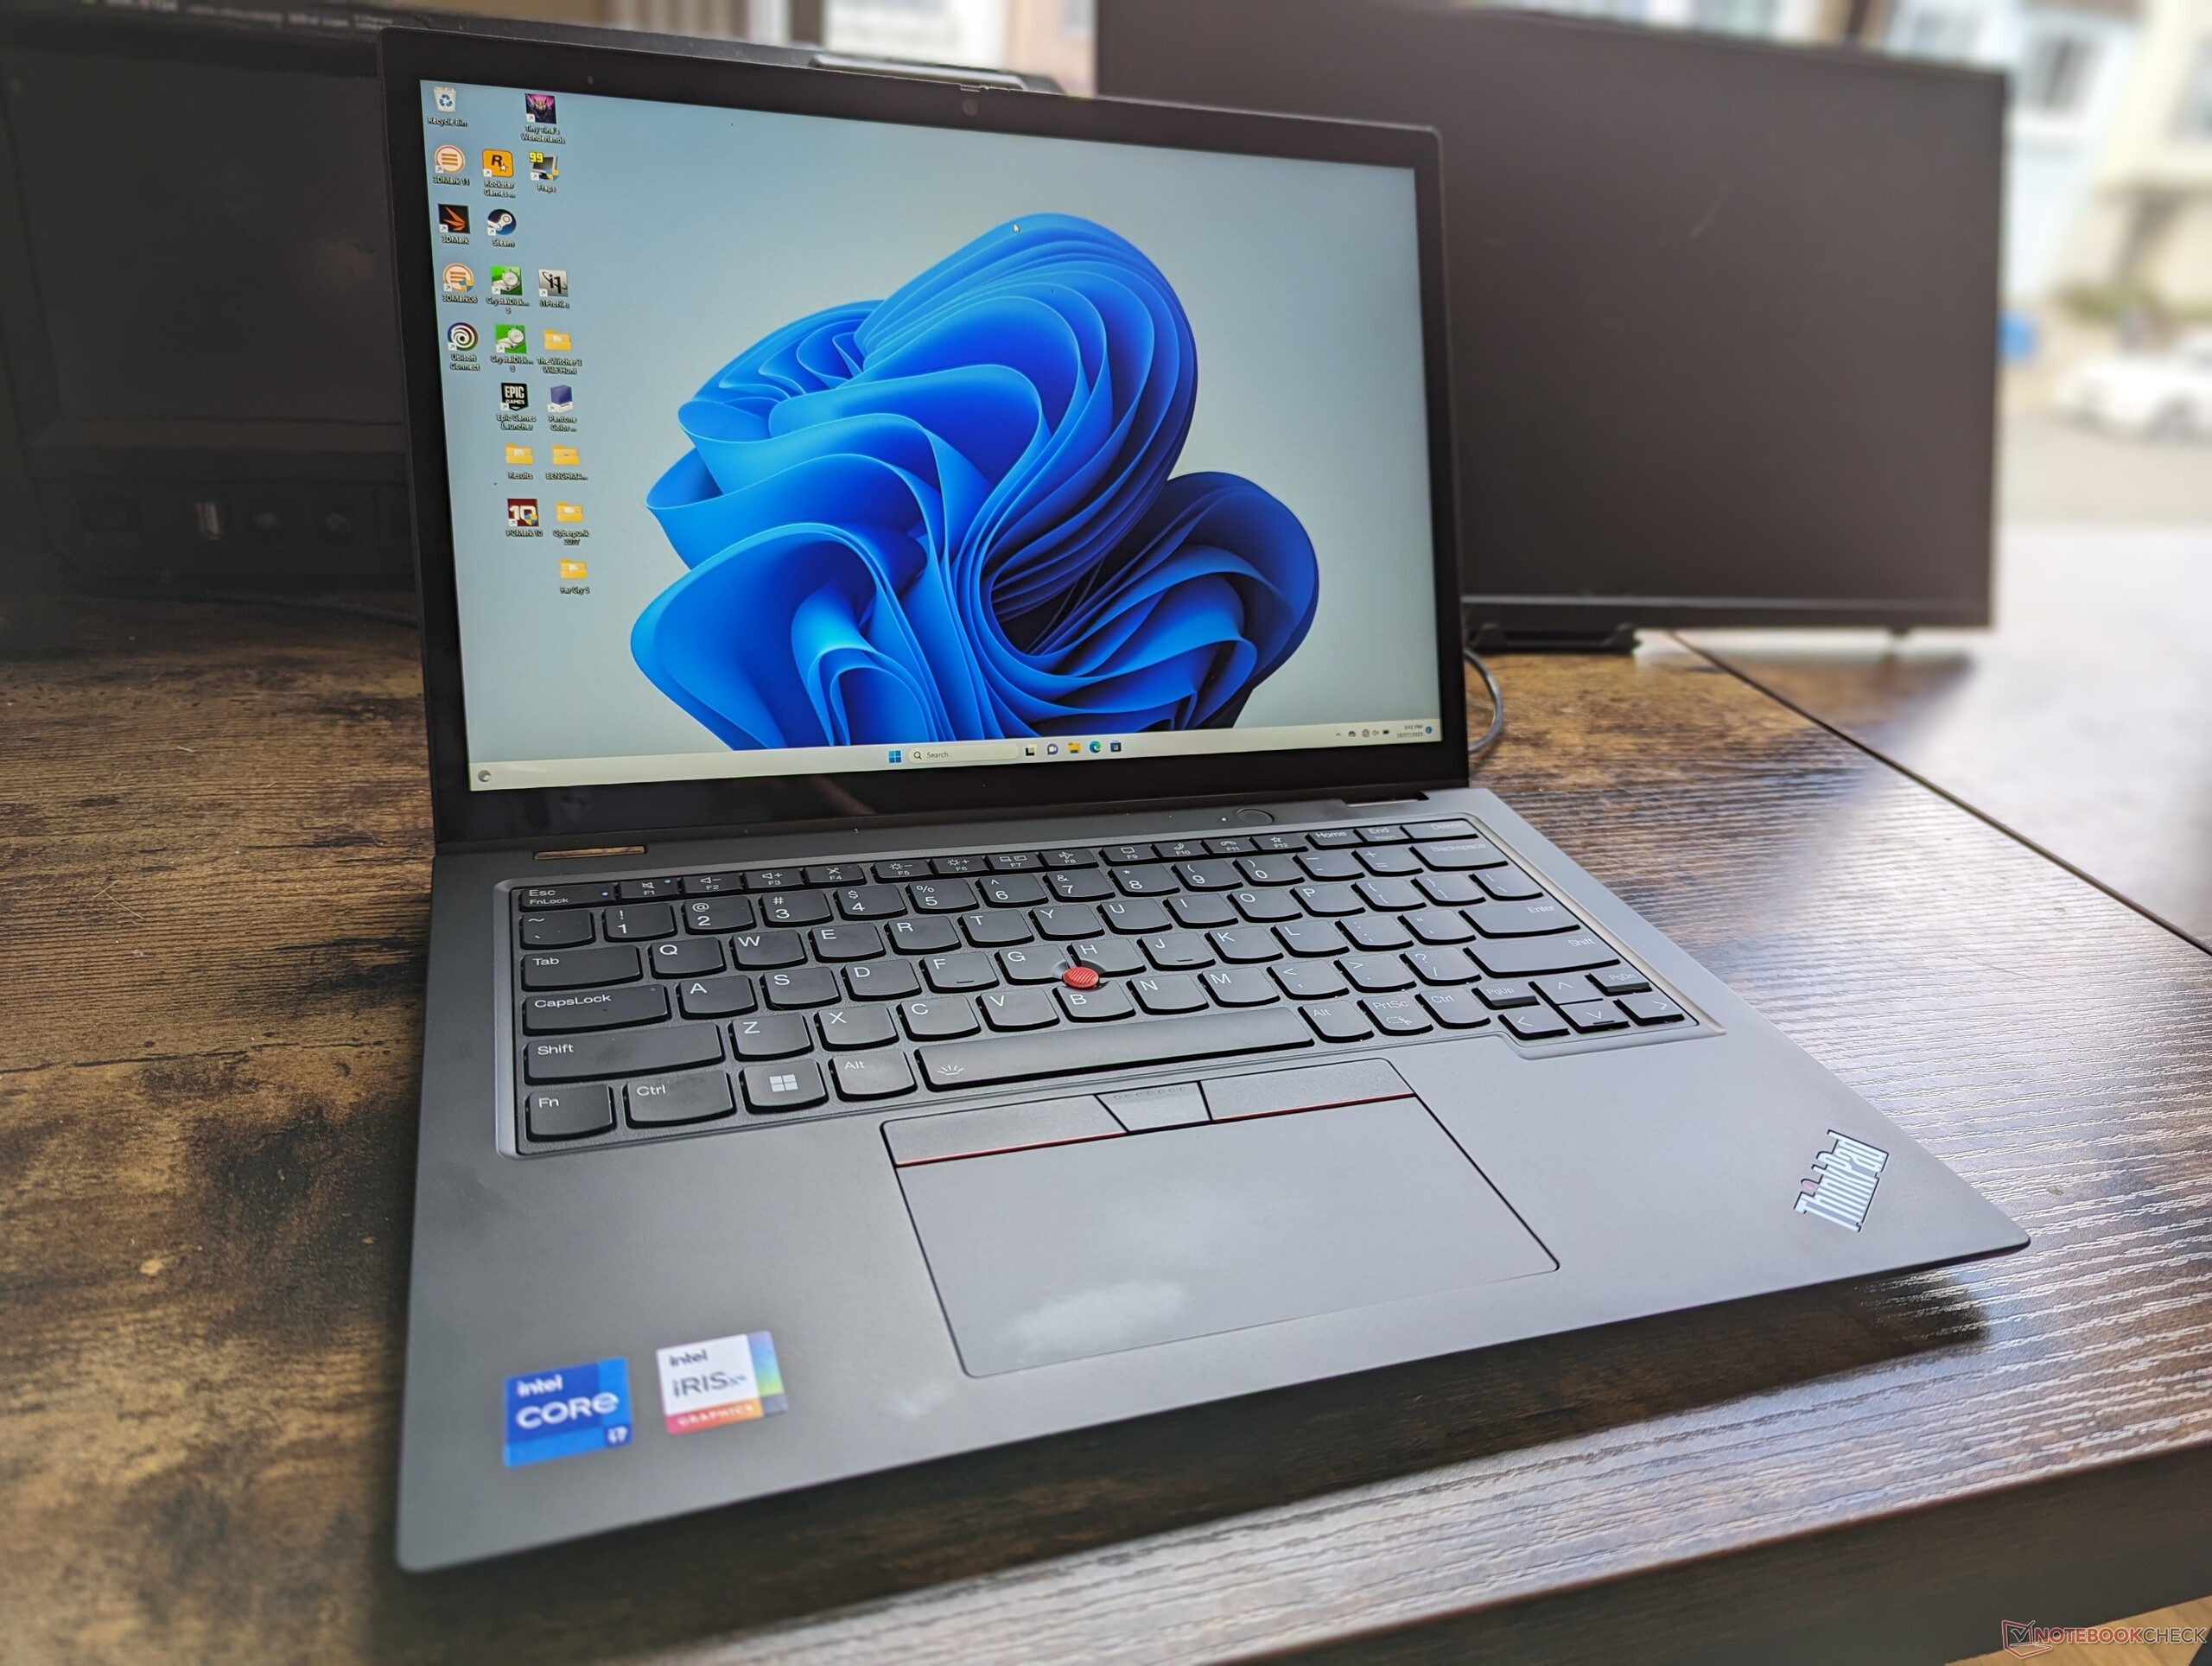
Lenovo ThinkPad L13 Yoga G4 Intel convertible beoordeling: Kortere batterijduur dan AMD
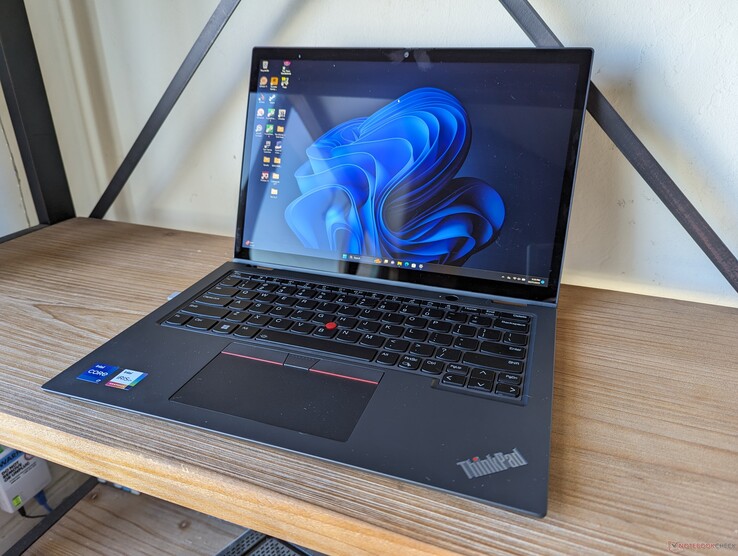
De ThinkPad L13 Yoga Gen 4 is verkrijgbaar in zowel Intel- als AMD-versies om gebruikers aan beide kanten van het hek aan te trekken. Deze beoordelingspagina zal zich richten op de Intel-versie, omdat we onlangs de AMD-versie in augustus. Al onze opmerkingen over de fysieke kenmerken van de AMD-versie zijn hier van toepassing, aangezien de twee versies visueel identiek zijn.
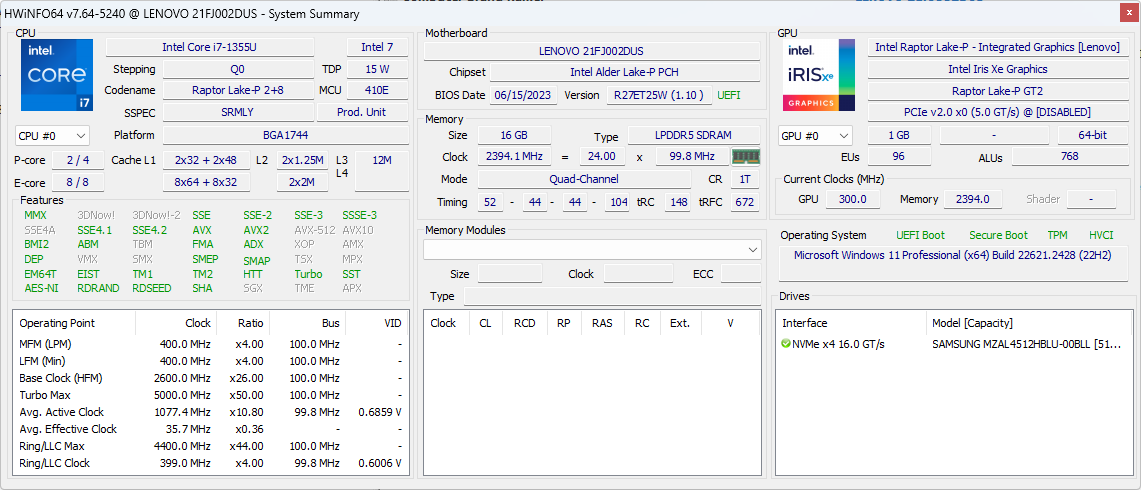
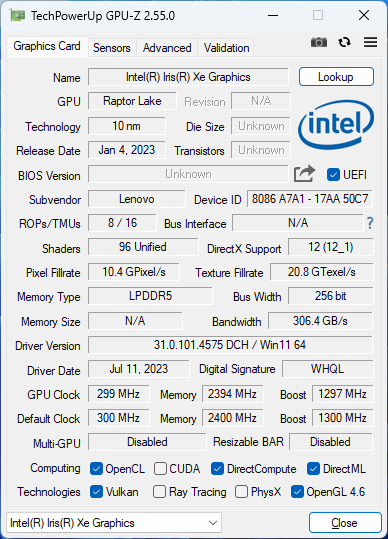
Onze Intel-reviewer is een configuratie in het hogere segment met de 13e generatie Raptor Lake-U Core i7-1355U CPU, 16 GB RAM en een 1200p IPS aanraakscherm voor een verkoopprijs van ongeveer 1400 tot 600 USD. Andere configuraties variëren van de Core i3-1315U tot de Core i7-1365U met vPro, maar alle opties zijn verder beperkt tot geïntegreerde graphics en een 1200p beeldscherm.
Alternatieven voor de ThinkPad L13 Yoga G4 zijn andere zakelijke convertibles zoals de MSI Summit E13 Flip Evo,HP Elite Dragonfly Folio 13.5of de Dell Latitude 7330 2-in-1.
Meer Lenovo beoordelingen:
Potentiële concurrenten in vergelijking
Evaluatie | Datum | Model | Gewicht | Hoogte | Formaat | Resolutie | Beste prijs |
|---|---|---|---|---|---|---|---|
| 88.1 % v7 (old) | 11-2023 | Lenovo ThinkPad L13 Yoga G4 i7-1355U i7-1355U, Iris Xe G7 96EUs | 1.4 kg | 17.1 mm | 13.30" | 1920x1200 | |
| 88.7 % v7 (old) | 08-2023 | Lenovo ThinkPad L13 Yoga G4 21FSS00100 R5 7530U, Vega 7 | 1.4 kg | 17.1 mm | 13.30" | 1920x1200 | |
| 90.3 % v7 (old) | 12-2022 | HP Elite Dragonfly Folio 13.5 G3 i7-1265U, Iris Xe G7 96EUs | 1.4 kg | 17.8 mm | 13.50" | 1920x1280 | |
| 89 % v7 (old) | 11-2022 | Dell Latitude 9330 i7-1260U, Iris Xe G7 96EUs | 1.2 kg | 14.1 mm | 13.30" | 2560x1600 | |
| 86.9 % v7 (old) | 04-2021 | MSI Summit E13 Flip Evo A11MT i7-1185G7, Iris Xe G7 96EUs | 1.4 kg | 14.9 mm | 13.40" | 1920x1200 | |
| 87.5 % v7 (old) | 10-2023 | Framework Laptop 13.5 Ryzen 7 7840U R7 7840U, Radeon 780M | 1.3 kg | 15.85 mm | 13.50" | 2256x1504 |
Zaak
Net als bij de recente ThinkPad E14 G5 kunt u de Intel-versie het snelst onderscheiden van de AMD-versie door te kijken naar het Thunderbolt-logo langs de linkerrand, aangezien de AMD-opties deze functie missen. Merk op dat hoewel het model geleverd wordt met twee USB-C poorten, alleen de linkerpoort compatibel is met Thunderbolt-apparaten zoals eGPU's.
Communicatie
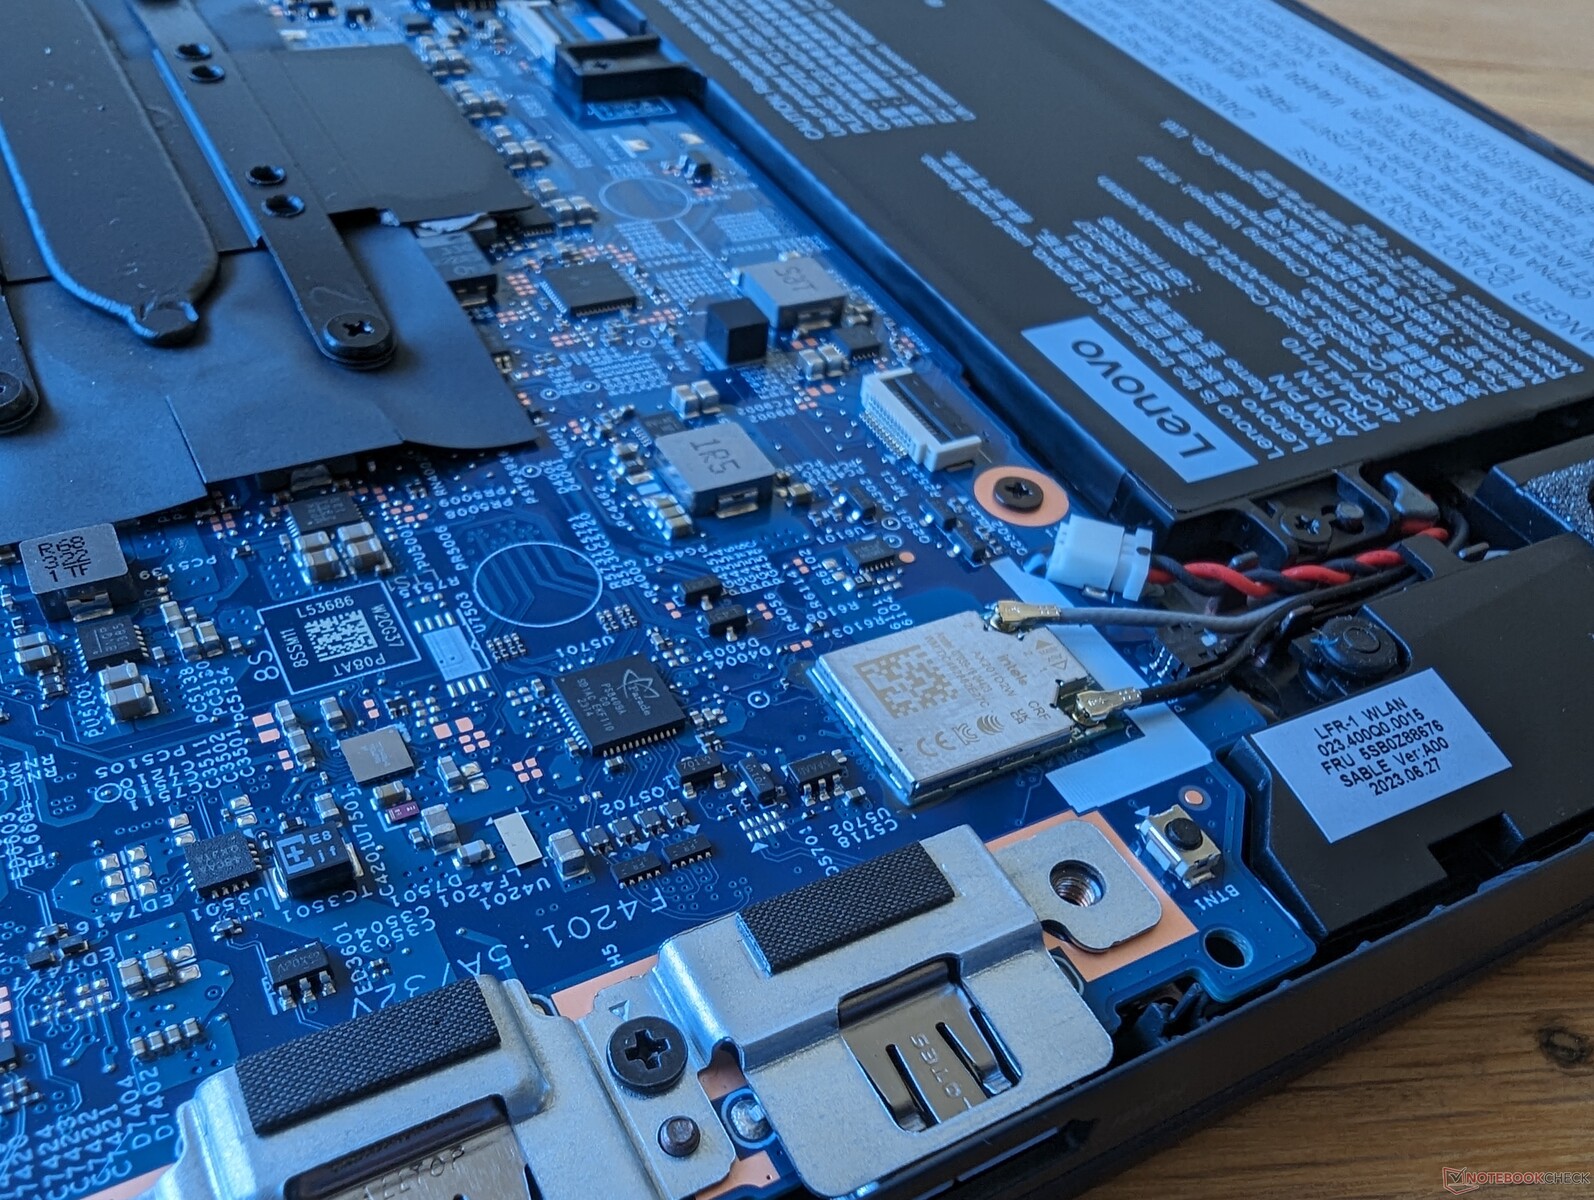
Een Intel AX201 wordt standaard geleverd met Wi-Fi 6 en Bluetooth 5.1 ondersteuning, terwijl de Intel AX211 met Wi-Fi 6E optioneel is.
| Networking | |
| iperf3 transmit AX12 | |
| MSI Summit E13 Flip Evo A11MT | |
| iperf3 receive AX12 | |
| MSI Summit E13 Flip Evo A11MT | |
| iperf3 transmit AXE11000 | |
| Framework Laptop 13.5 Ryzen 7 7840U | |
| Lenovo ThinkPad L13 Yoga G4 i7-1355U | |
| HP Elite Dragonfly Folio 13.5 G3 | |
| Dell Latitude 9330 | |
| Lenovo ThinkPad L13 Yoga G4 21FSS00100 | |
| iperf3 receive AXE11000 | |
| Lenovo ThinkPad L13 Yoga G4 21FSS00100 | |
| Framework Laptop 13.5 Ryzen 7 7840U | |
| Lenovo ThinkPad L13 Yoga G4 i7-1355U | |
| HP Elite Dragonfly Folio 13.5 G3 | |
| Dell Latitude 9330 | |
| iperf3 transmit AXE11000 6GHz | |
| Framework Laptop 13.5 Ryzen 7 7840U | |
| HP Elite Dragonfly Folio 13.5 G3 | |
| Dell Latitude 9330 | |
| Lenovo ThinkPad L13 Yoga G4 21FSS00100 | |
| iperf3 receive AXE11000 6GHz | |
| Lenovo ThinkPad L13 Yoga G4 21FSS00100 | |
| HP Elite Dragonfly Folio 13.5 G3 | |
| Framework Laptop 13.5 Ryzen 7 7840U | |
| Dell Latitude 9330 | |
Webcam
IR is optioneel, terwijl de privacy shutter standaard is. De goedkopere SKU's worden alleen geleverd met een 720p webcam, terwijl de duurdere SKU's 1080p bieden.


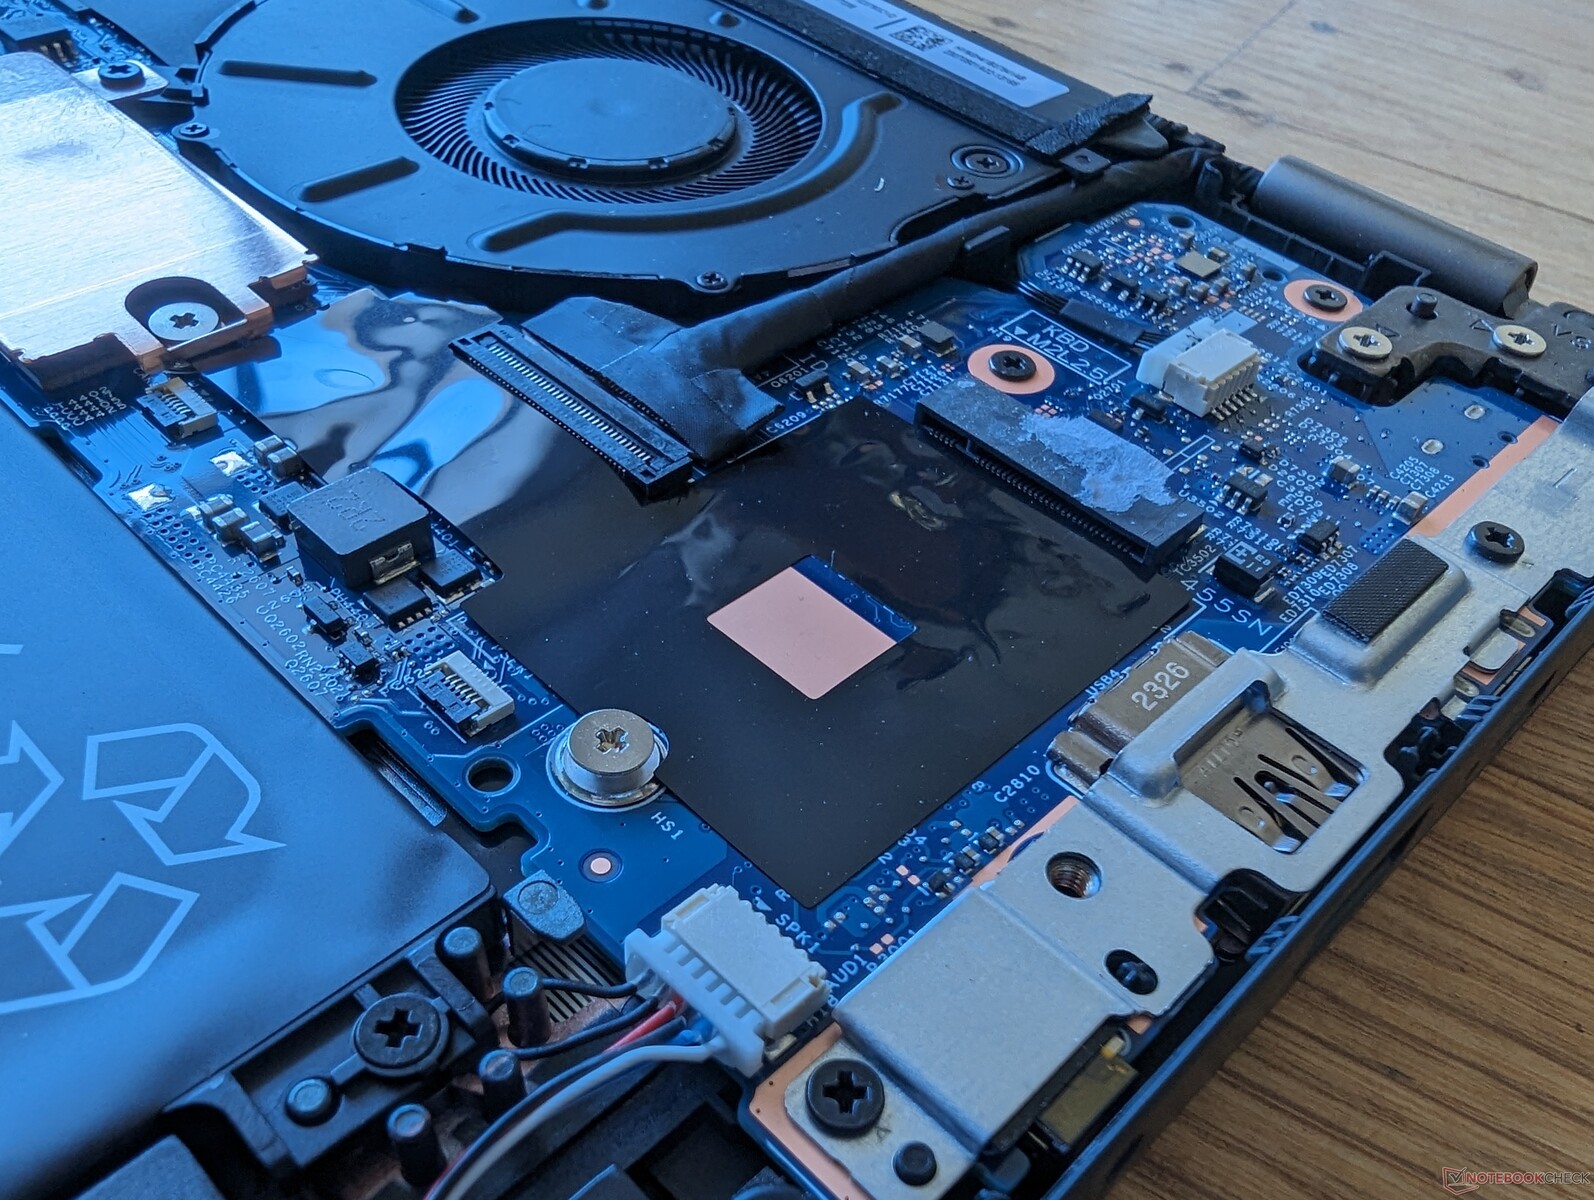
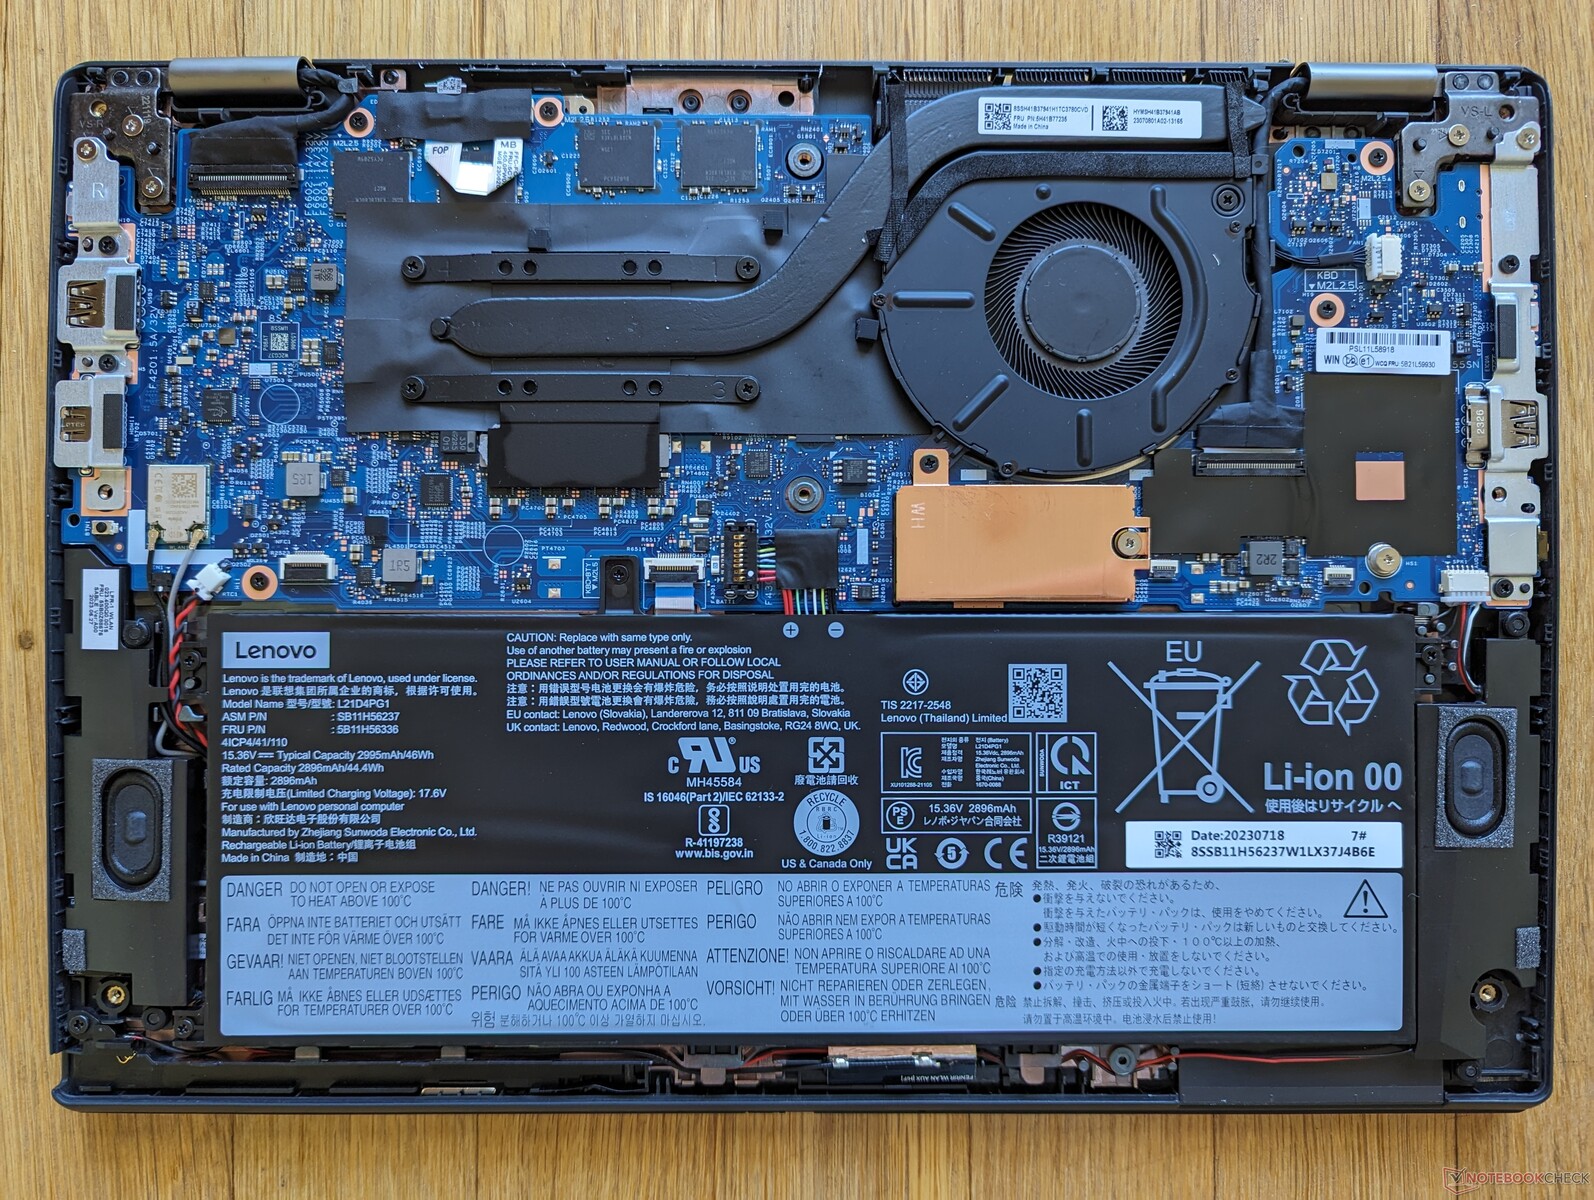
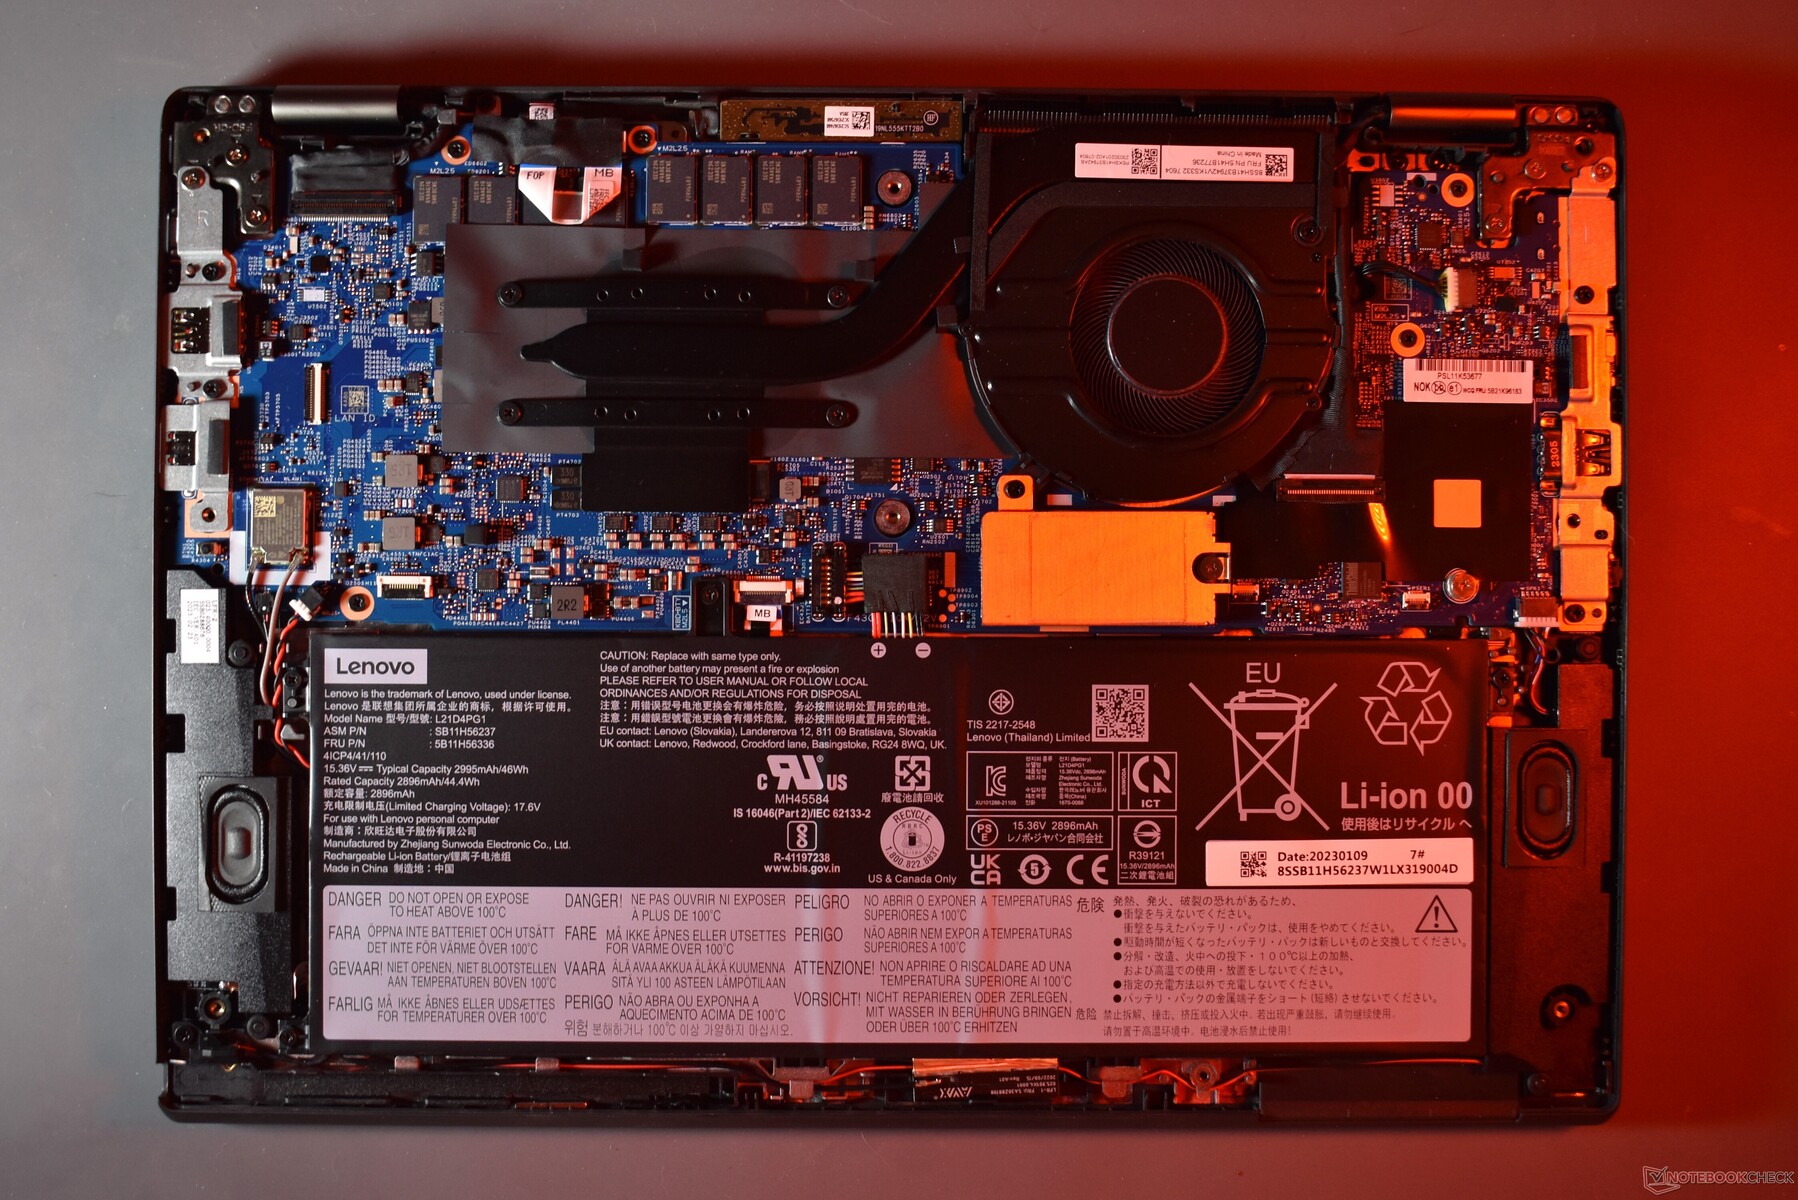
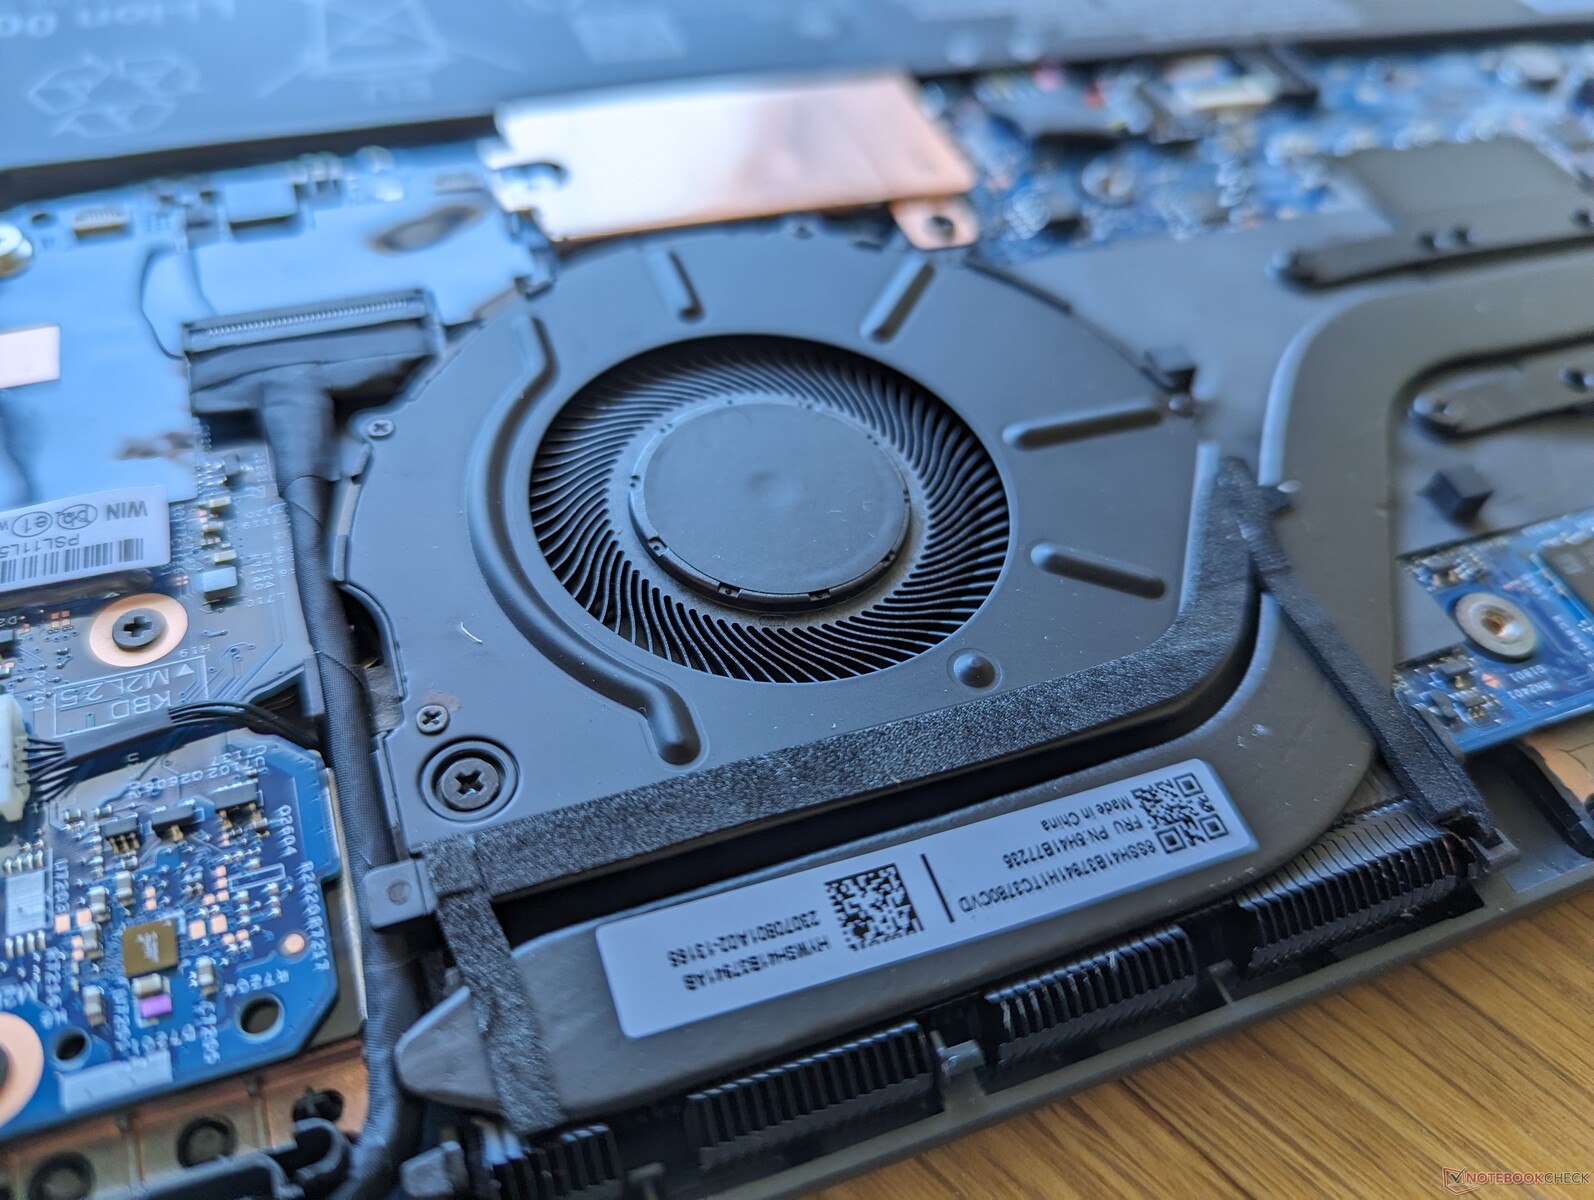
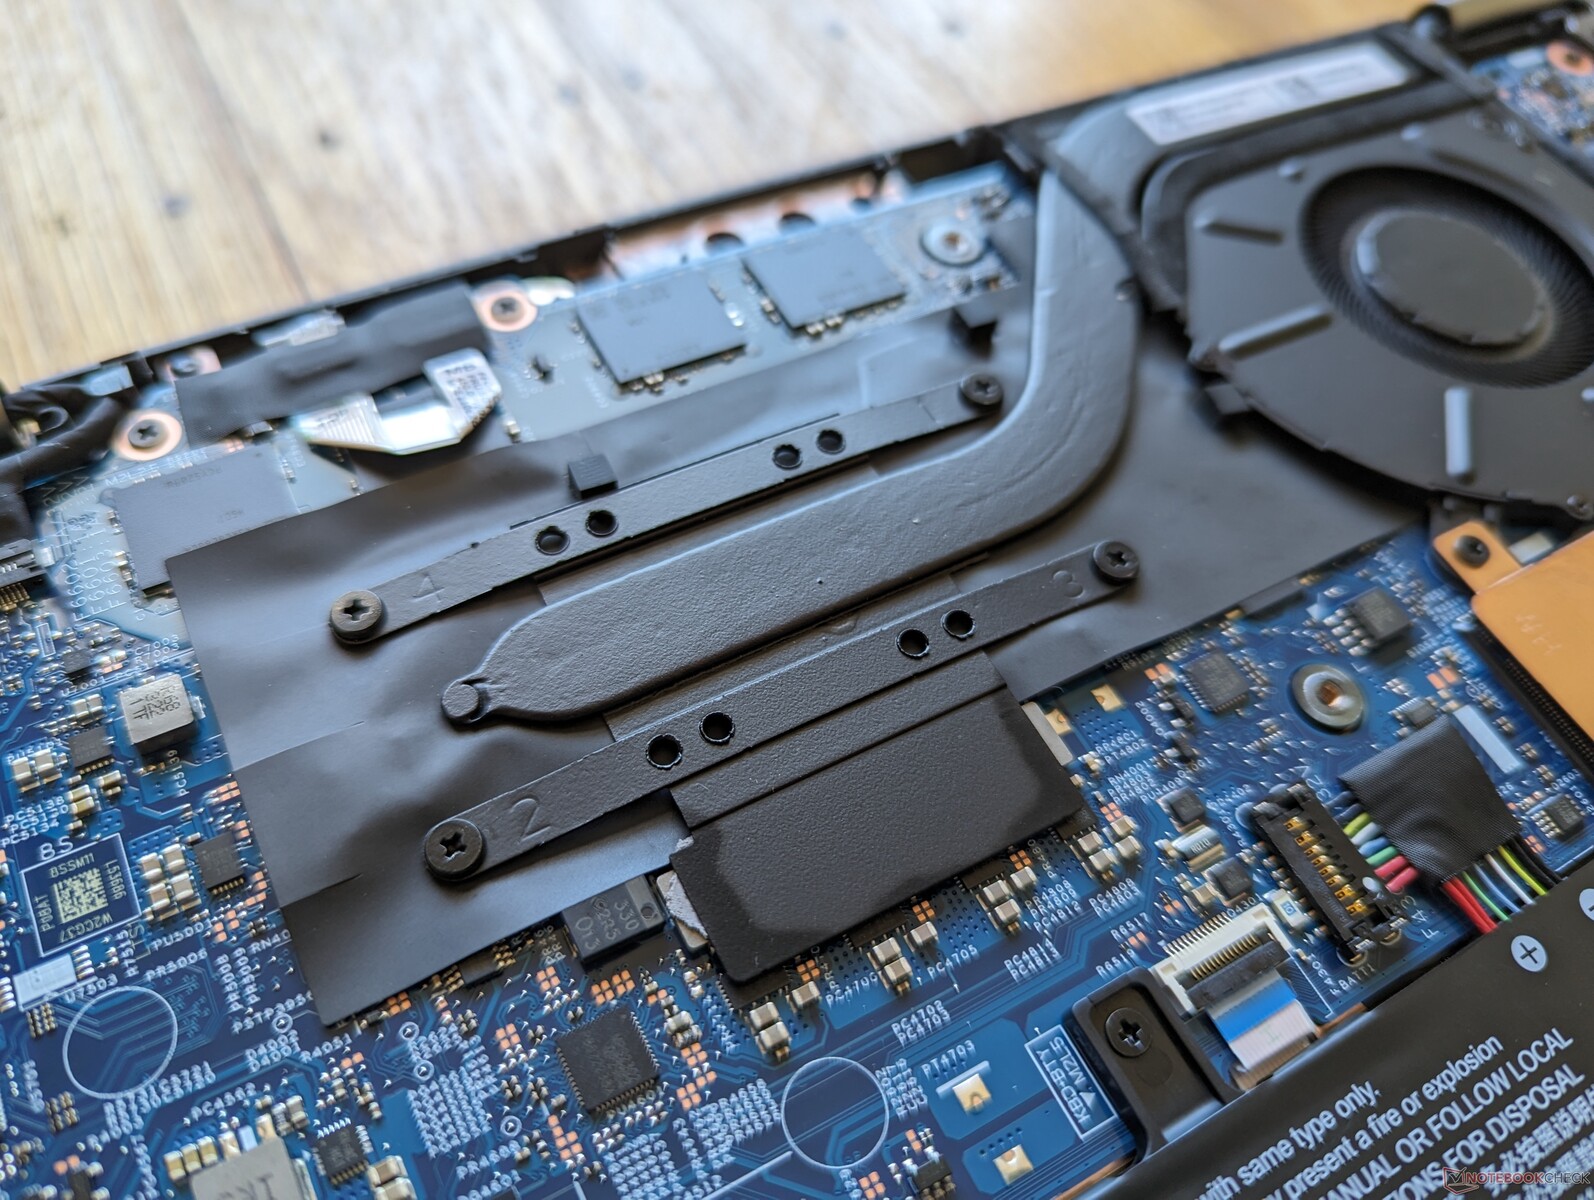
Onderhoud
Er zijn geen grote interne verschillen wat betreft de upgradebaarheid tussen de AMD- en Intel-versies, zoals blijkt uit de onderstaande vergelijkingsafbeeldingen.
Accessoires en garantie
De verpakking bevat een AC-adapter en een actieve styluspen. De pen zit in de laptop zelf voor zowel gemak als opladen.
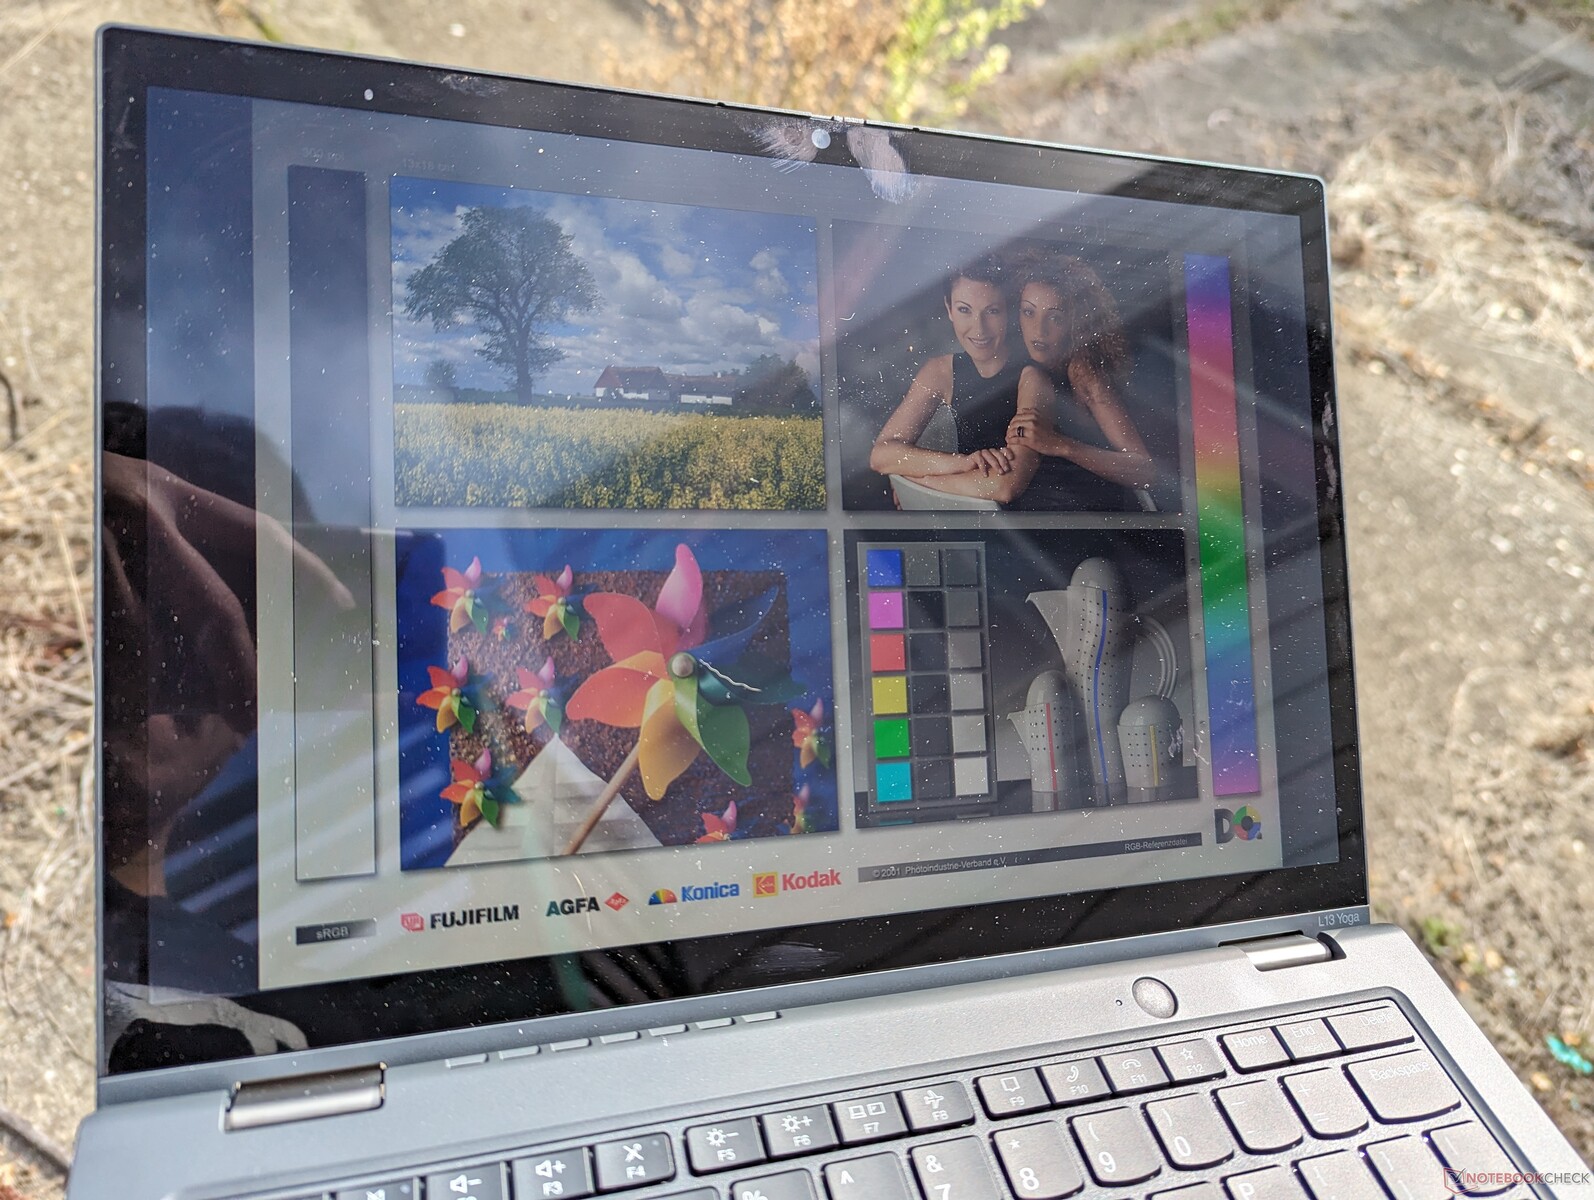
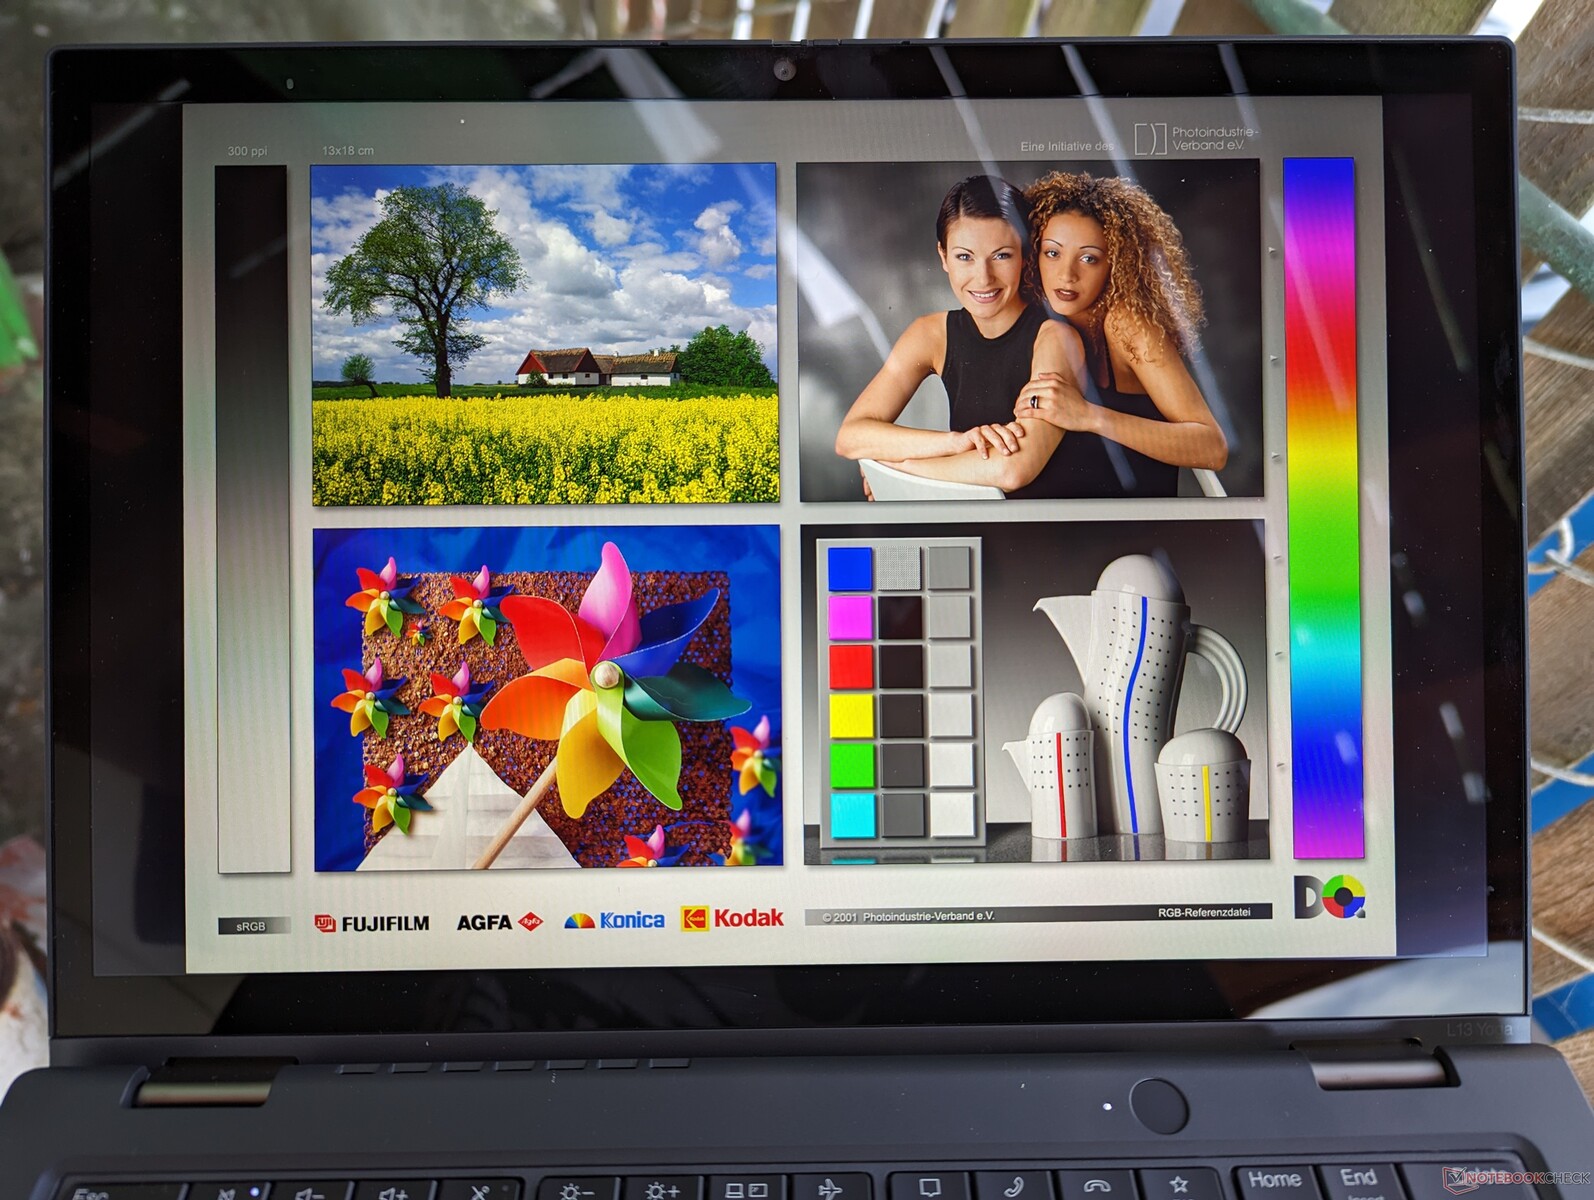
Weergave
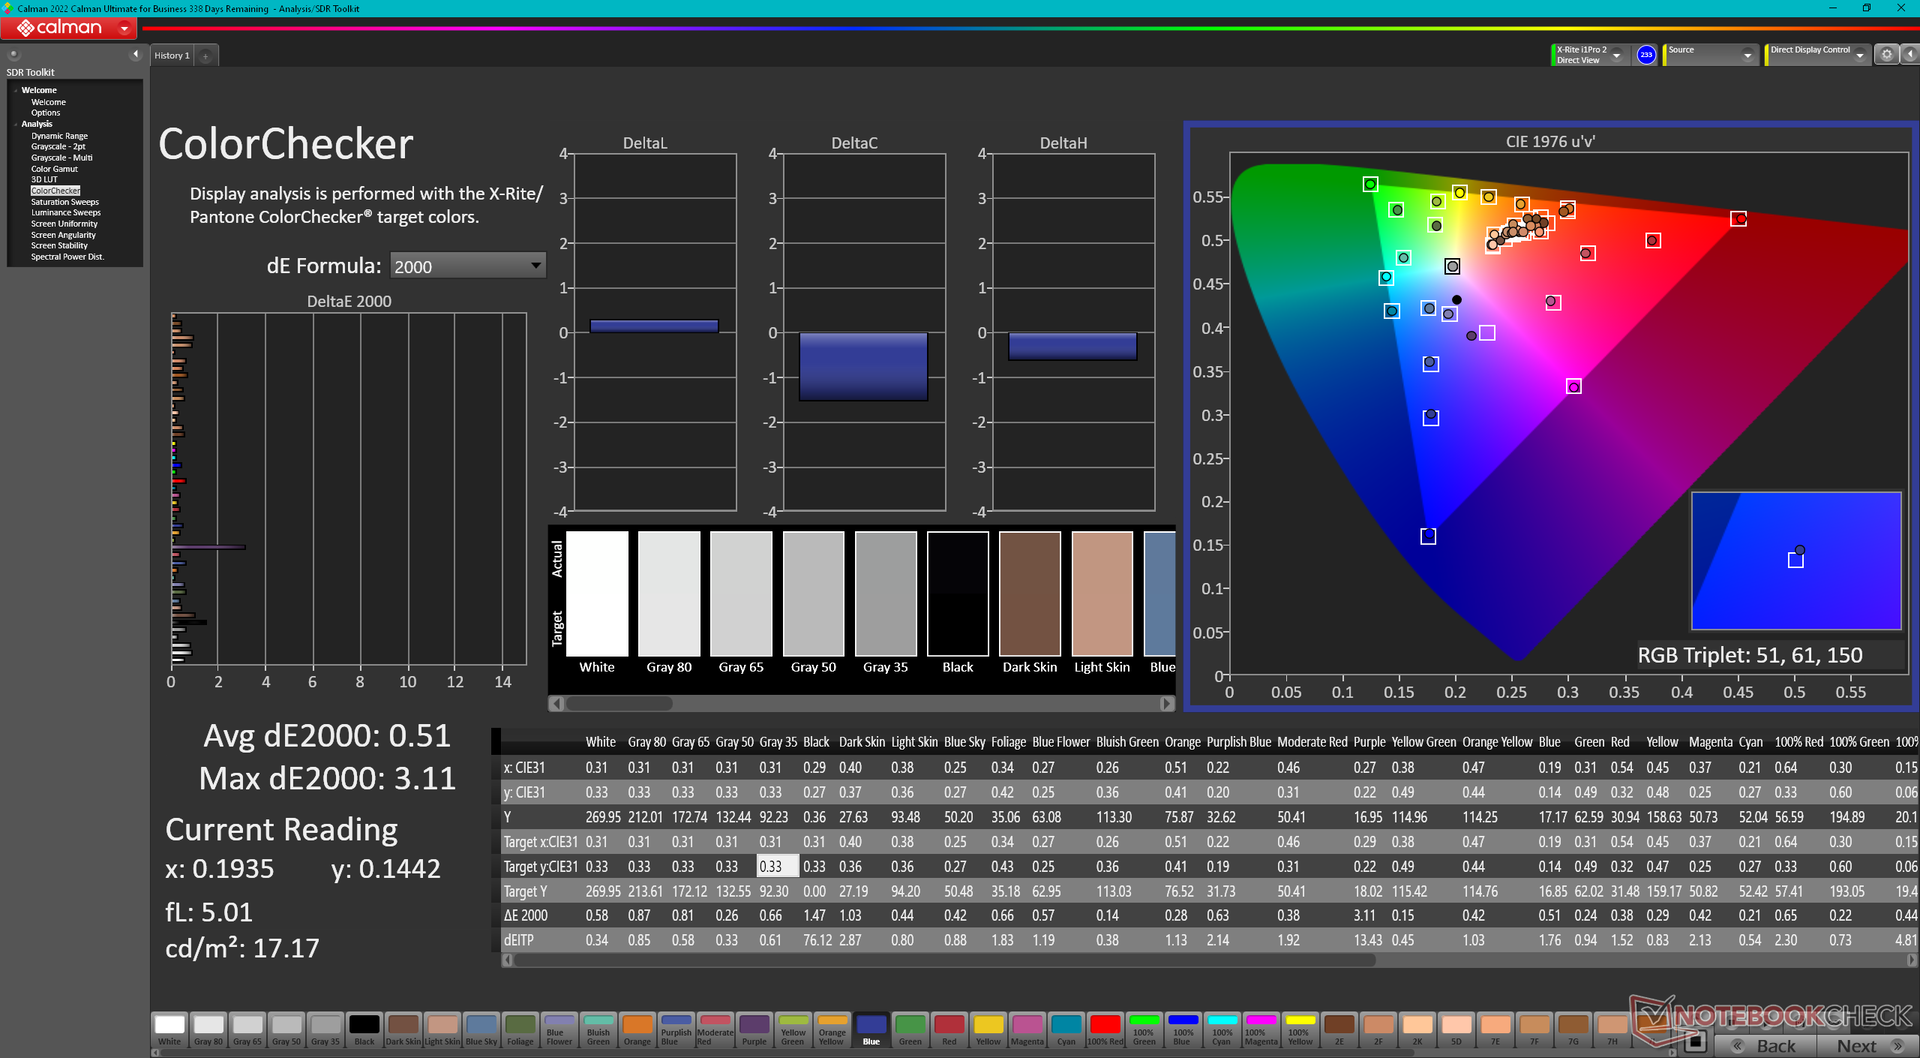
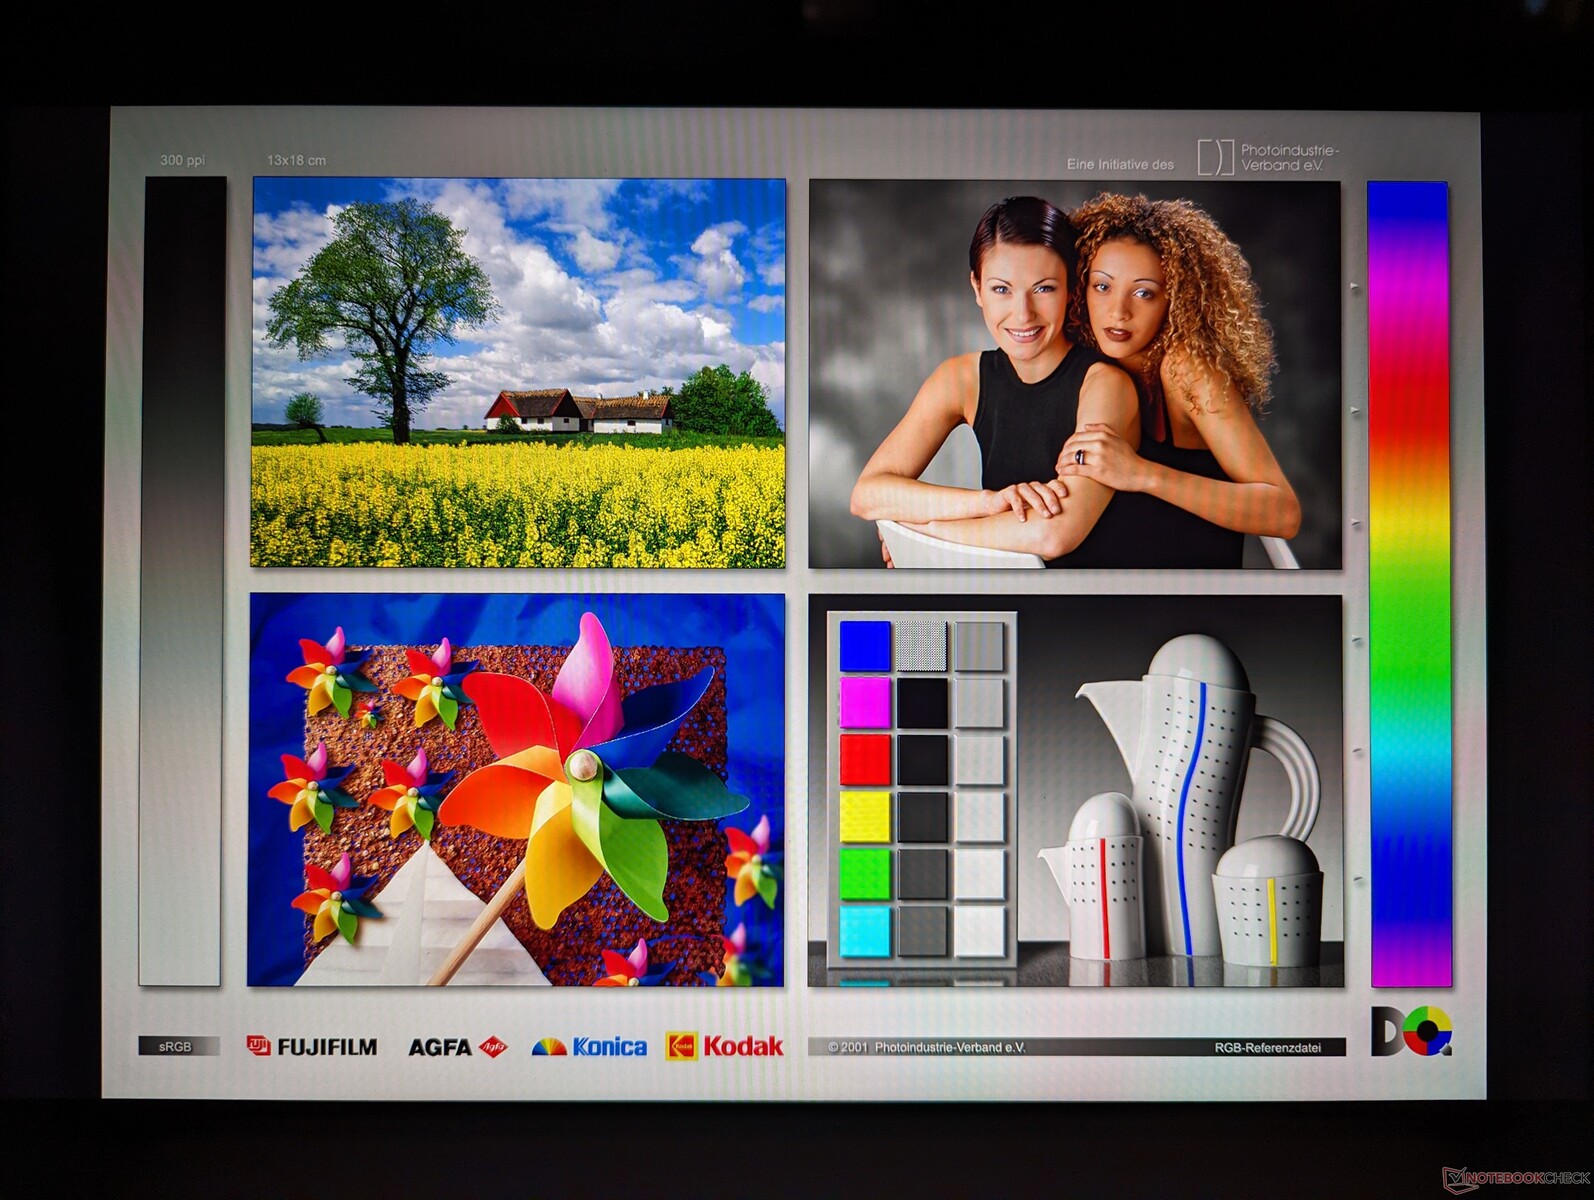
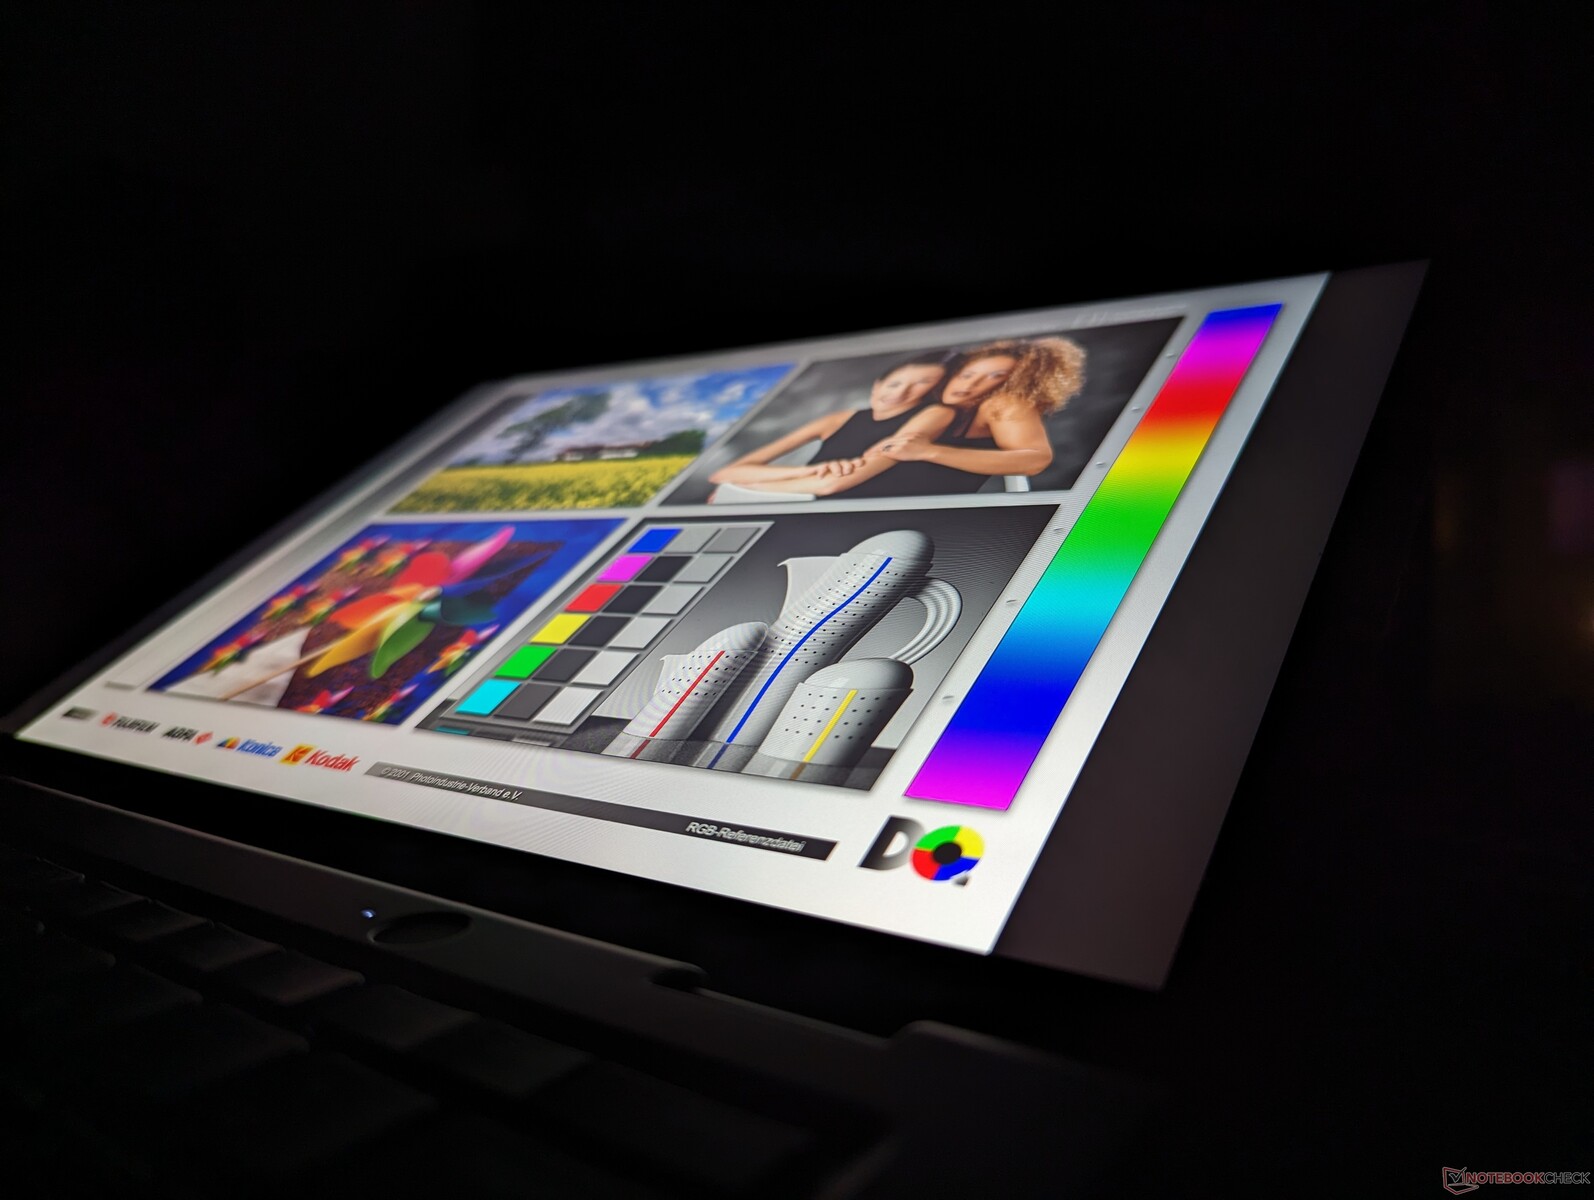
Ons Intel-toestel wordt geleverd met een ander 1200p IPS-paneel dan ons AMD-toestel (NV133WUM-N61 vs. B133UAN01.2). Dit specifieke paneel lijkt ongeveer 50 tot 60 nits donkerder te zijn, terwijl het snellere zwart-wit en grijs-grijs responstijden biedt om ghosting te minimaliseren. Kleur en beeldkwaliteit zijn verder zeer vergelijkbaar tussen de twee modellen.
Het is jammer dat Lenovo geen 90 Hz of 120 Hz verversingsfrequentie opties biedt gezien de hoge vraagprijs van $1500+.

| |||||||||||||||||||||||||
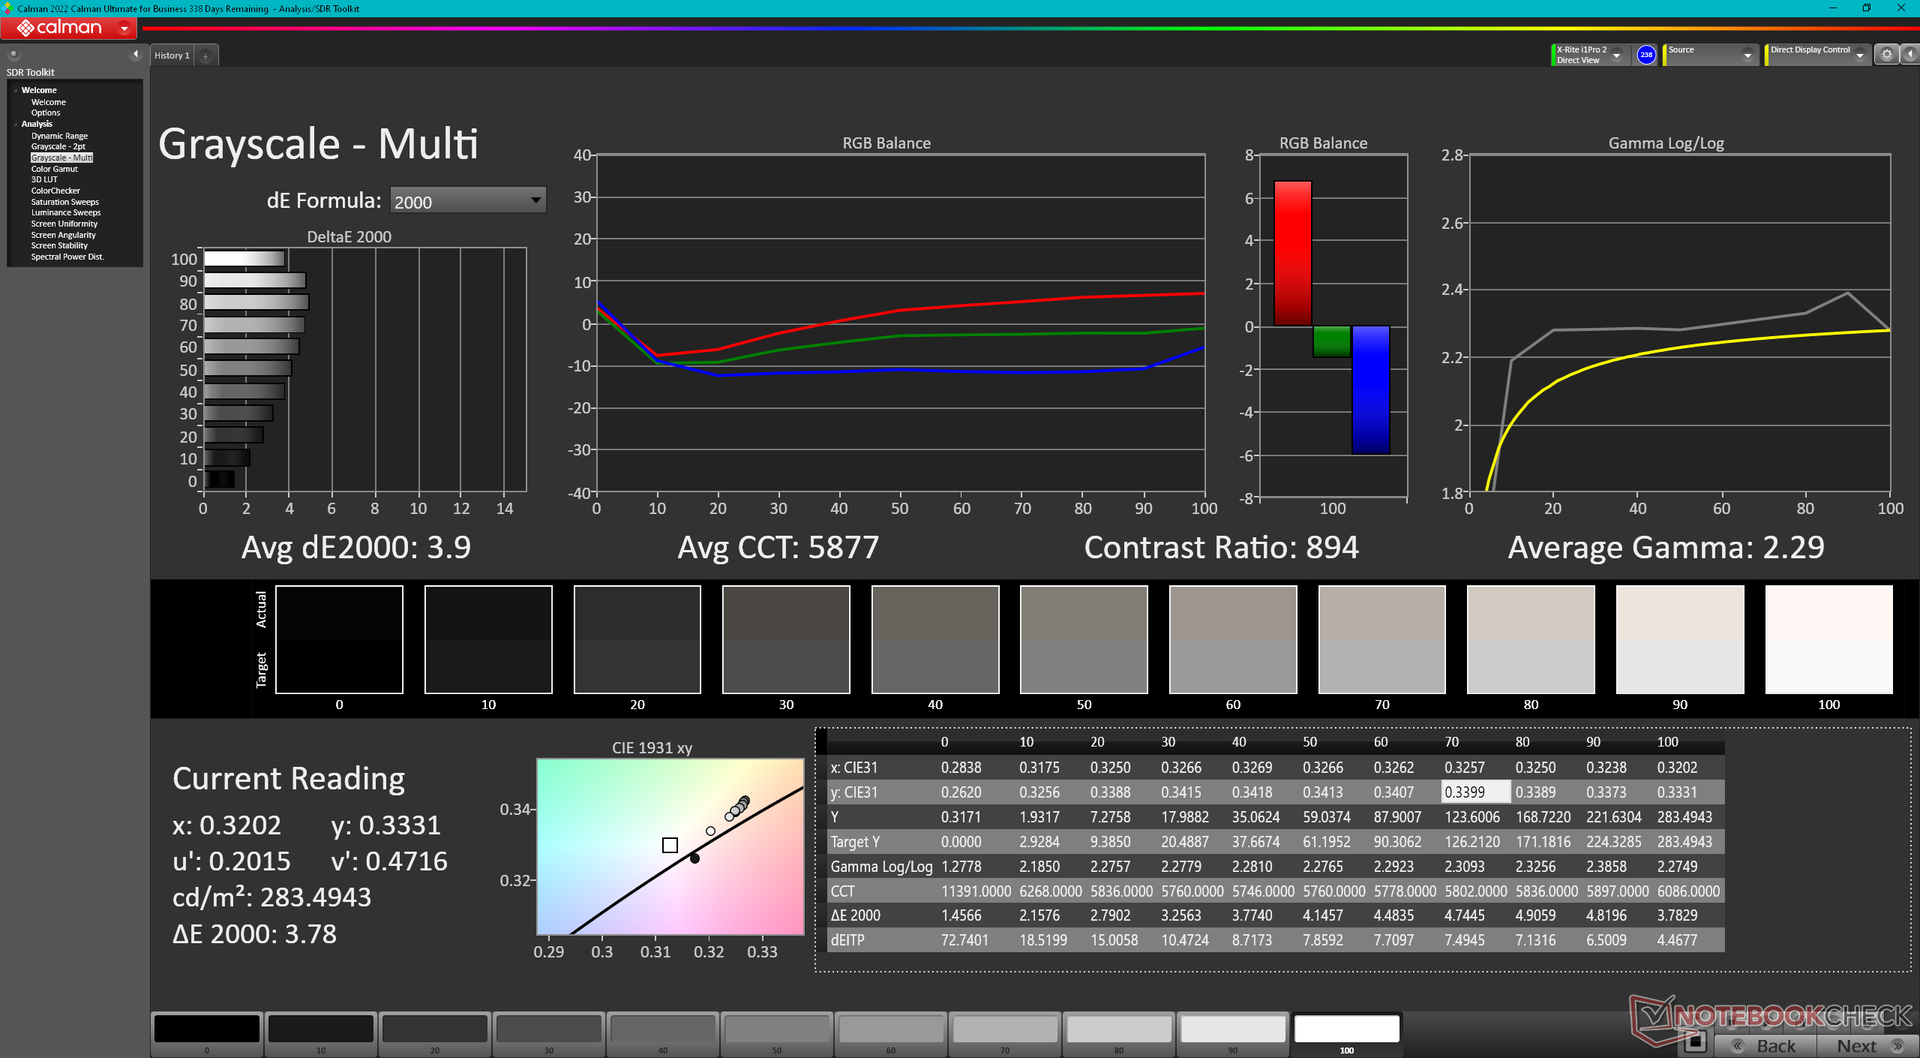
Helderheidsverdeling: 92 %
Helderheid in Batterij-modus: 278.1 cd/m²
Contrast: 818:1 (Zwart: 0.34 cd/m²)
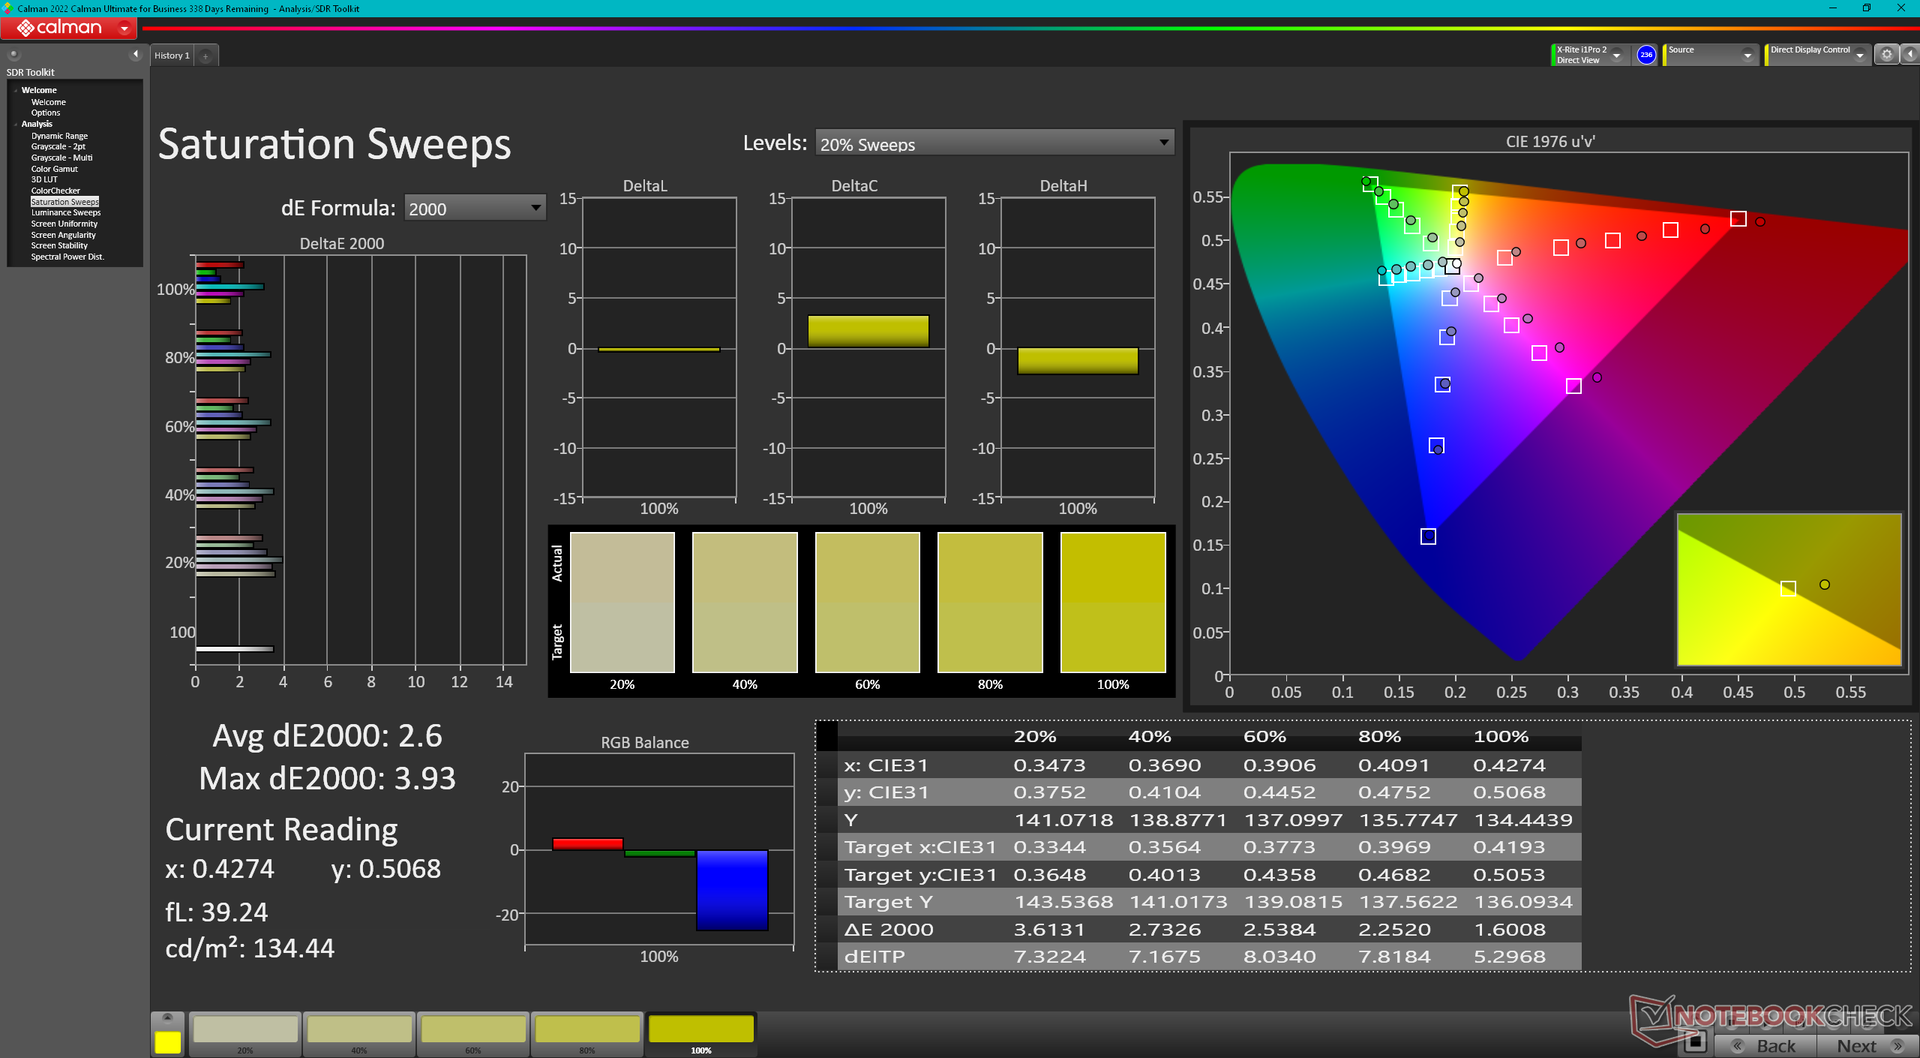
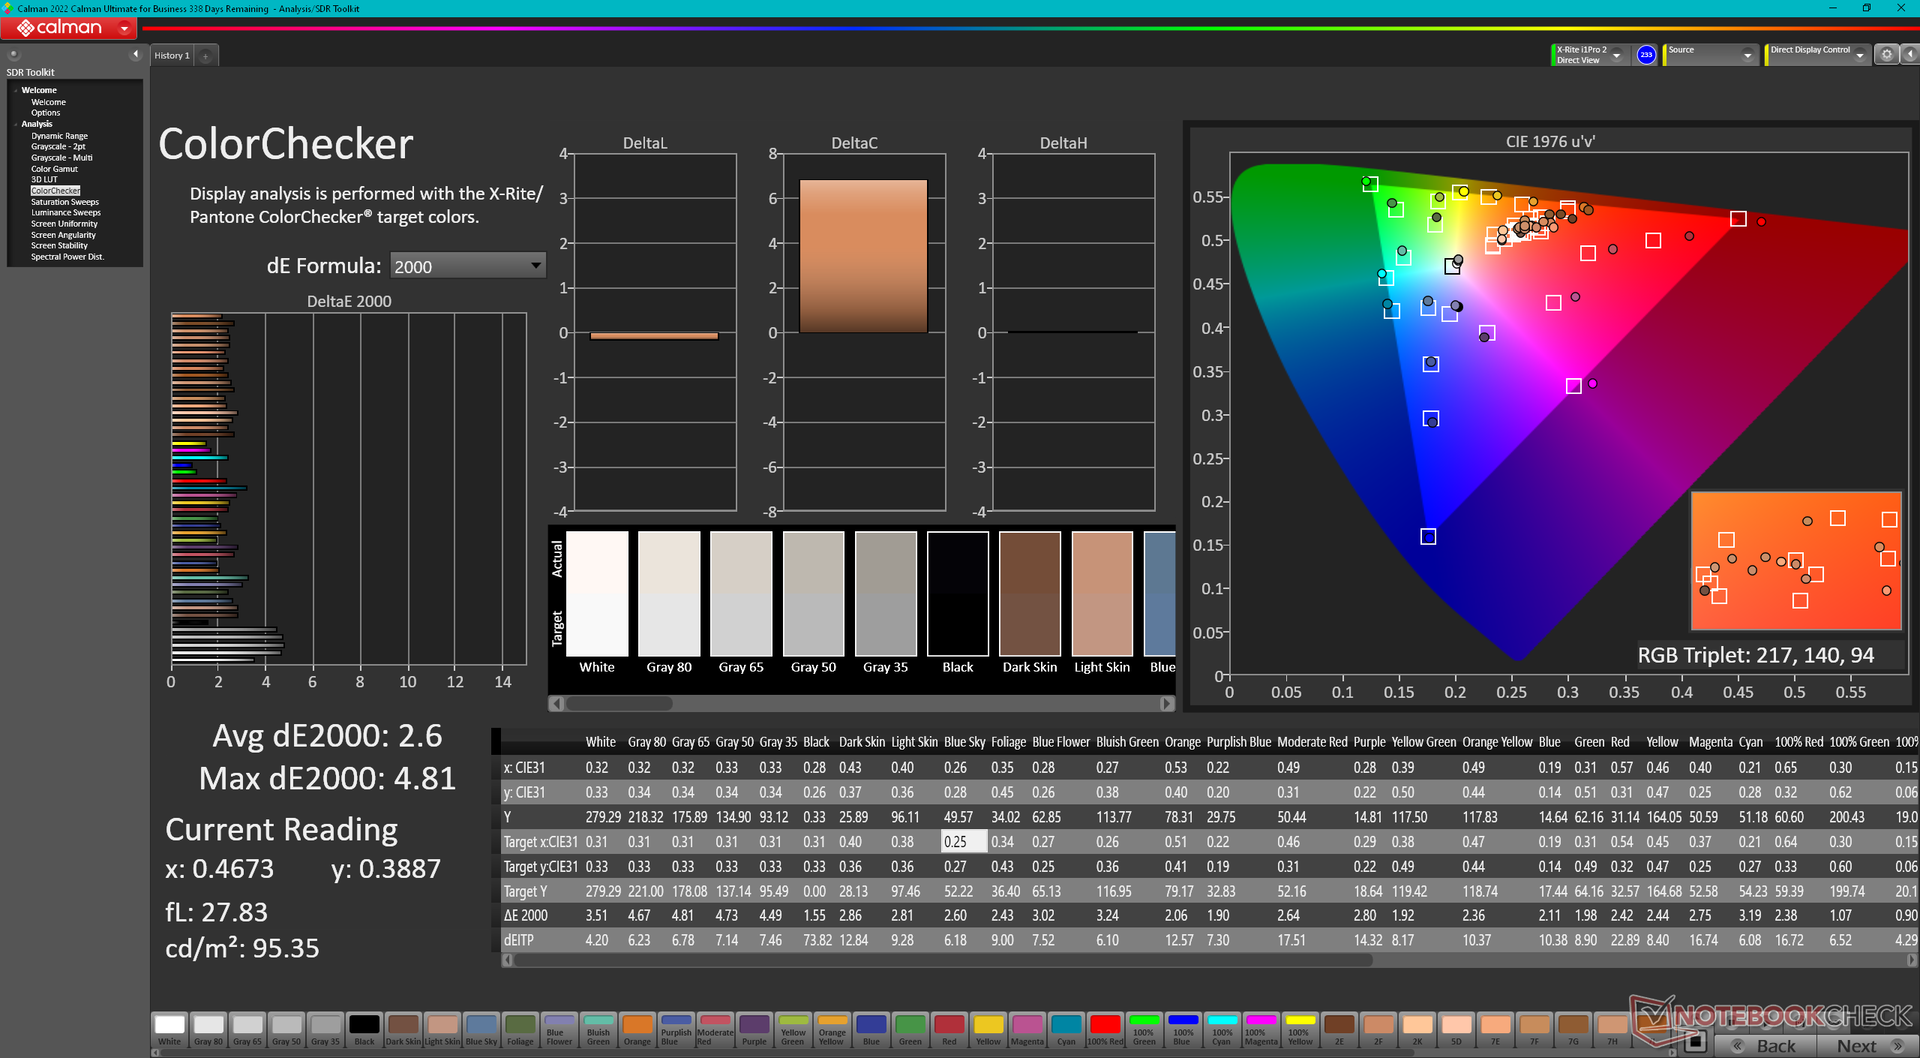
ΔE ColorChecker Calman: 2.6 | ∀{0.5-29.43 Ø4.71}
calibrated: 0.51
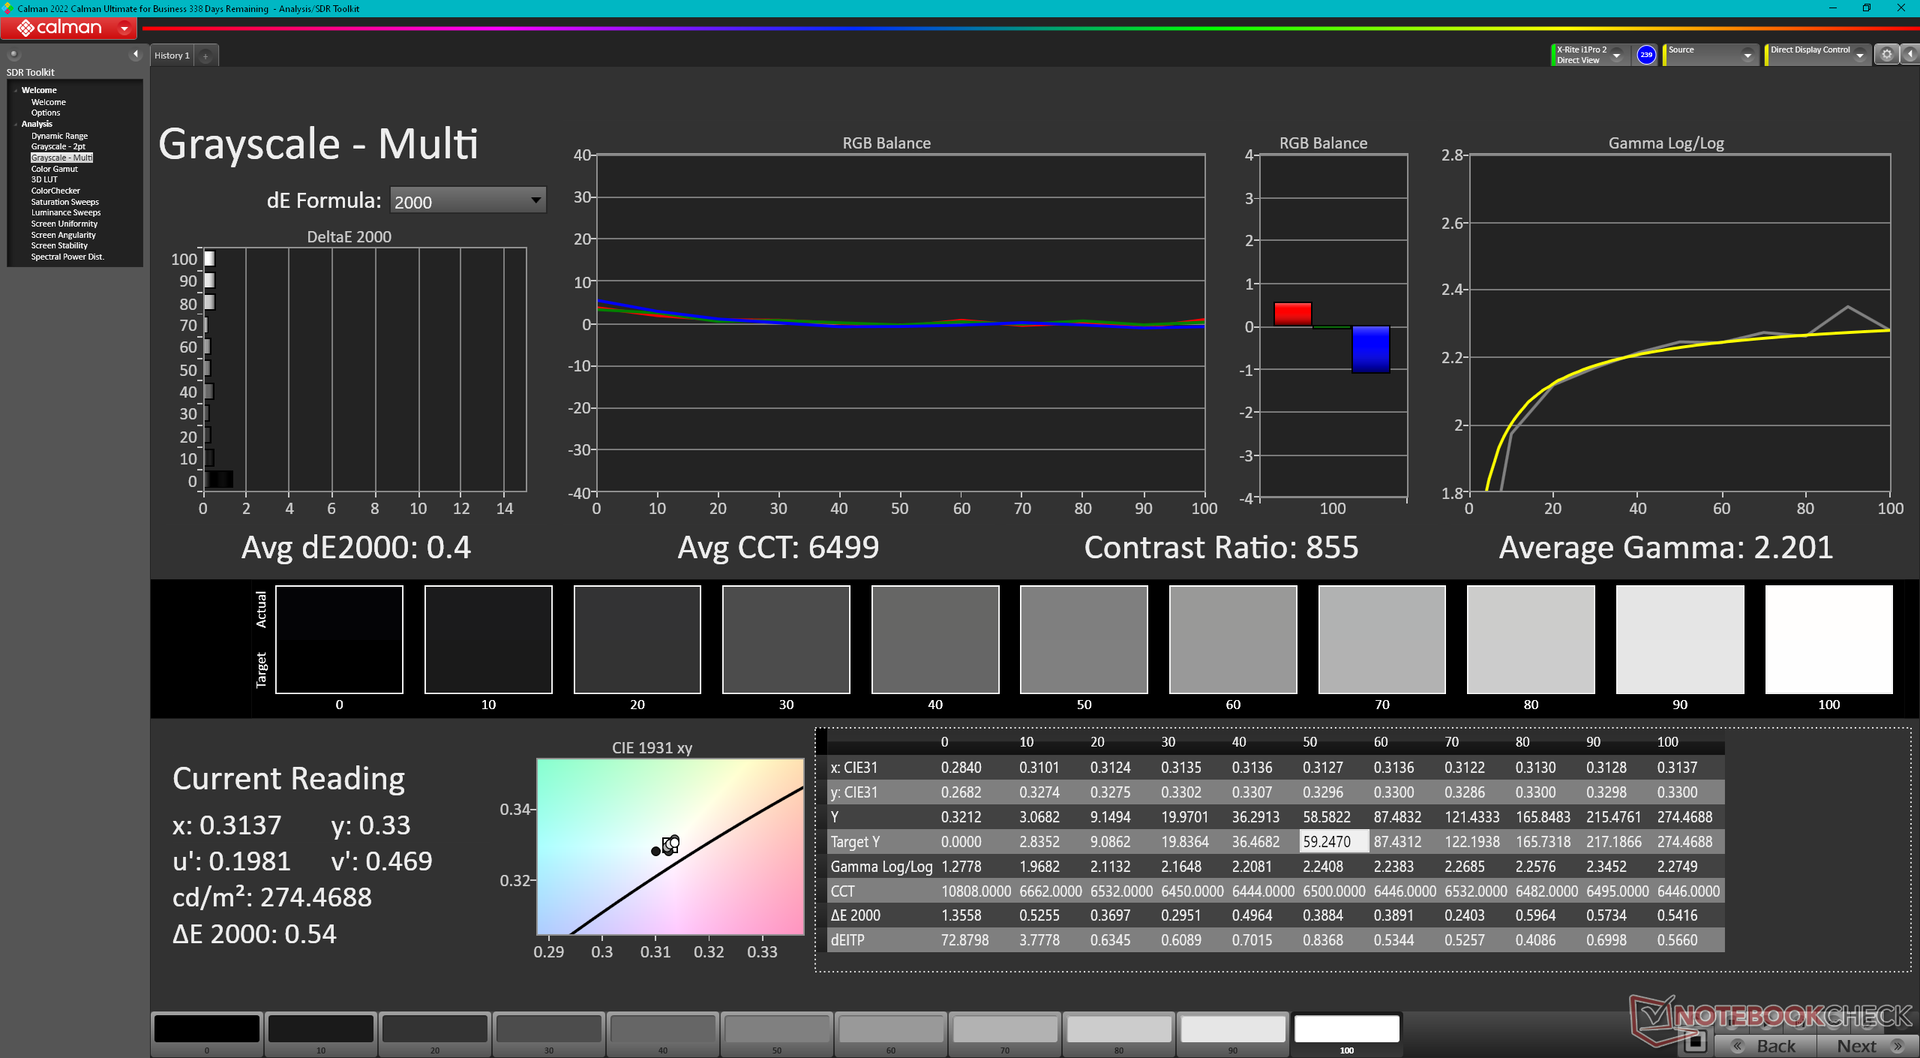
ΔE Greyscale Calman: 3.9 | ∀{0.09-98 Ø4.96}
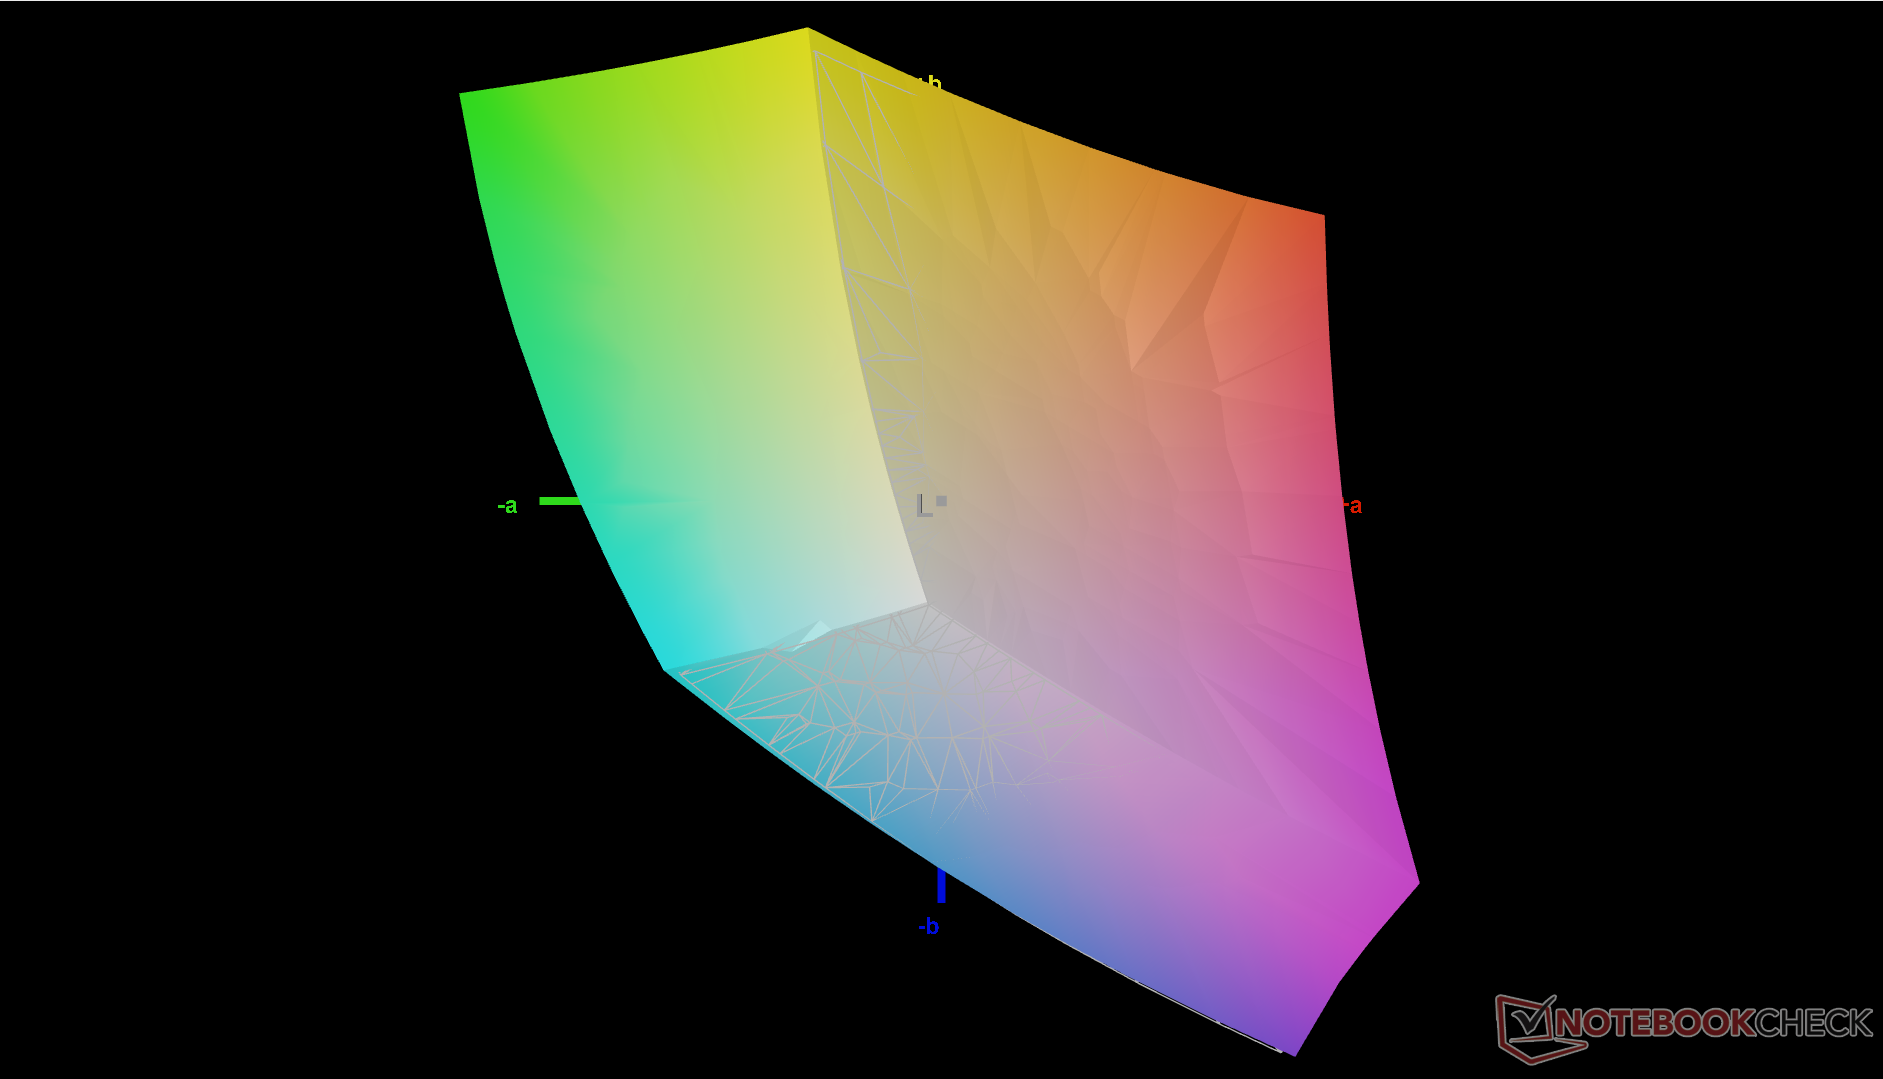
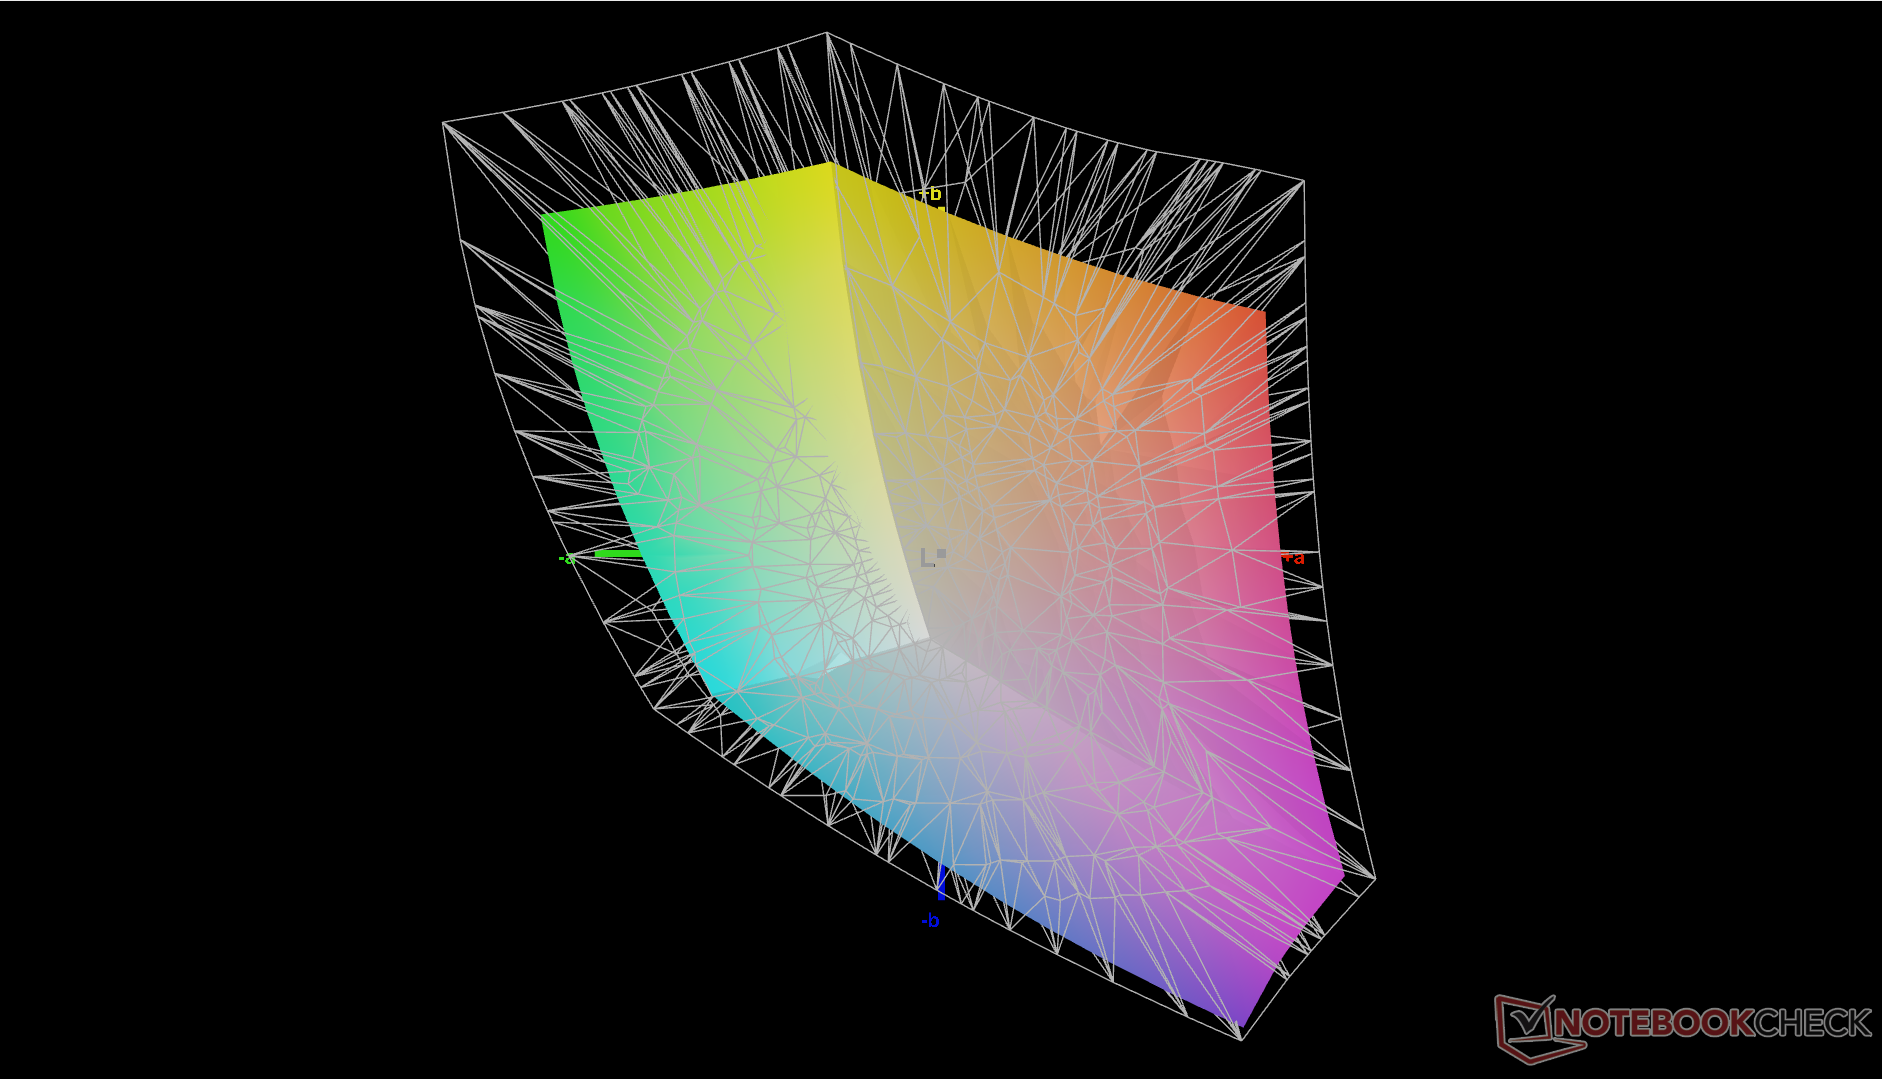
71.9% AdobeRGB 1998 (Argyll 3D)
99.8% sRGB (Argyll 3D)
71.6% Display P3 (Argyll 3D)
Gamma: 2.29
CCT: 5877 K
| Lenovo ThinkPad L13 Yoga G4 i7-1355U NV133WUM-N61, IPS, 1920x1200, 13.3" | Lenovo ThinkPad L13 Yoga G4 21FSS00100 B133UAN01.2 , IPS LED, 1920x1200, 13.3" | HP Elite Dragonfly Folio 13.5 G3 Chi Mei CMN13C0, IPS, 1920x1280, 13.5" | Dell Latitude 9330 AU Optronics B133QAA, IPS, 2560x1600, 13.3" | MSI Summit E13 Flip Evo A11MT Sharp LQ134N1JW53, IPS, 1920x1200, 13.4" | Framework Laptop 13.5 Ryzen 7 7840U BOE CQ NE135FBM-N41, IPS, 2256x1504, 13.5" | |
|---|---|---|---|---|---|---|
| Display | 2% | -3% | 6% | -2% | -2% | |
| Display P3 Coverage (%) | 71.6 | 74.1 3% | 68.3 -5% | 77.8 9% | 69.8 -3% | 69 -4% |
| sRGB Coverage (%) | 99.8 | 99.3 -1% | 98.6 -1% | 99.9 0% | 98.8 -1% | 99.1 -1% |
| AdobeRGB 1998 Coverage (%) | 71.9 | 74.5 4% | 70.2 -2% | 77.5 8% | 70.6 -2% | 71.1 -1% |
| Response Times | -58% | -147% | -165% | -140% | -81% | |
| Response Time Grey 50% / Grey 80% * (ms) | 27.3 ? | 43.3 ? -59% | 66.8 ? -145% | 67.6 ? -148% | 64 ? -134% | 50.4 ? -85% |
| Response Time Black / White * (ms) | 17.9 ? | 28 ? -56% | 44.4 ? -148% | 50.4 ? -182% | 44 ? -146% | 31.5 ? -76% |
| PWM Frequency (Hz) | ||||||
| Screen | -8% | 22% | 19% | 19% | 24% | |
| Brightness middle (cd/m²) | 278.1 | 336 21% | 369.5 33% | 542.3 95% | 551.3 98% | 436 57% |
| Brightness (cd/m²) | 280 | 321 15% | 350 25% | 516 84% | 517 85% | 416 49% |
| Brightness Distribution (%) | 92 | 88 -4% | 87 -5% | 85 -8% | 91 -1% | 89 -3% |
| Black Level * (cd/m²) | 0.34 | 0.22 35% | 0.24 29% | 0.38 -12% | 0.37 -9% | 0.36 -6% |
| Contrast (:1) | 818 | 1527 87% | 1540 88% | 1427 74% | 1490 82% | 1211 48% |
| Colorchecker dE 2000 * | 2.6 | 2.8 -8% | 2.3 12% | 3.18 -22% | 1.45 44% | 1.81 30% |
| Colorchecker dE 2000 max. * | 4.81 | 6.9 -43% | 4.34 10% | 6.05 -26% | 2.86 41% | 4.73 2% |
| Colorchecker dE 2000 calibrated * | 0.51 | 1.4 -175% | 0.6 -18% | 0.67 -31% | 1.7 -233% | 0.45 12% |
| Greyscale dE 2000 * | 3.9 | 3.8 3% | 3.1 21% | 3.1 21% | 1.3 67% | 2.9 26% |
| Gamma | 2.29 96% | 2.15 102% | 2.1 105% | 2.08 106% | 2.14 103% | 2.27 97% |
| CCT | 5877 111% | 6664 98% | 6248 104% | 6140 106% | 6580 99% | 6784 96% |
| Color Space (Percent of AdobeRGB 1998) (%) | 65 | |||||
| Color Space (Percent of sRGB) (%) | 99 | |||||
| Totaal Gemiddelde (Programma / Instellingen) | -21% /
-13% | -43% /
-8% | -47% /
-10% | -41% /
-8% | -20% /
3% |
* ... kleiner is beter
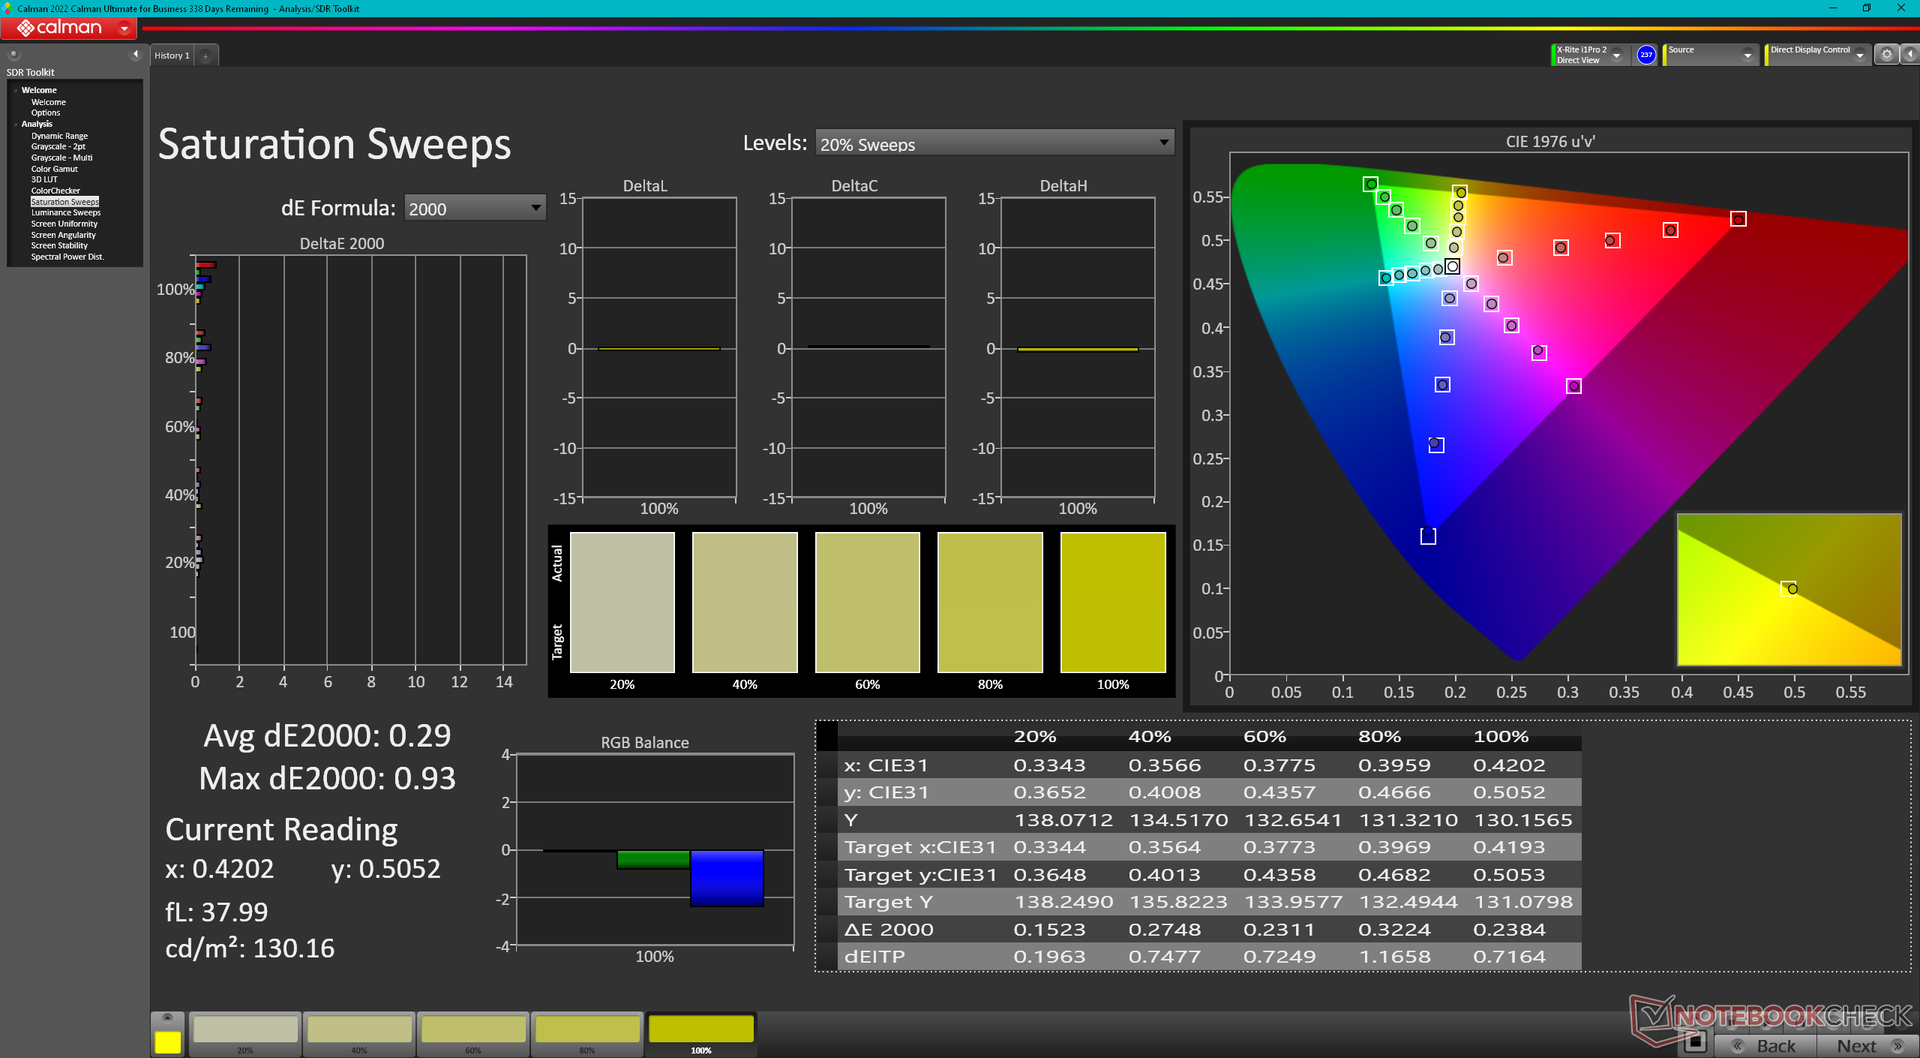
Door het paneel zelf te kalibreren met een X-Rite colorimeter zouden de gemiddelde DeltaE-waarden voor grijswaarden en kleuren verbeteren van 3,9 en 2,6 naar respectievelijk slechts 0,4 en 0,51. Ons gekalibreerde ICM-profiel kunt u hierboven gratis downloaden.
Responstijd Scherm
| ↔ Responstijd Zwart naar Wit | ||
|---|---|---|
| 17.9 ms ... stijging ↗ en daling ↘ gecombineerd | ↗ 9 ms stijging | 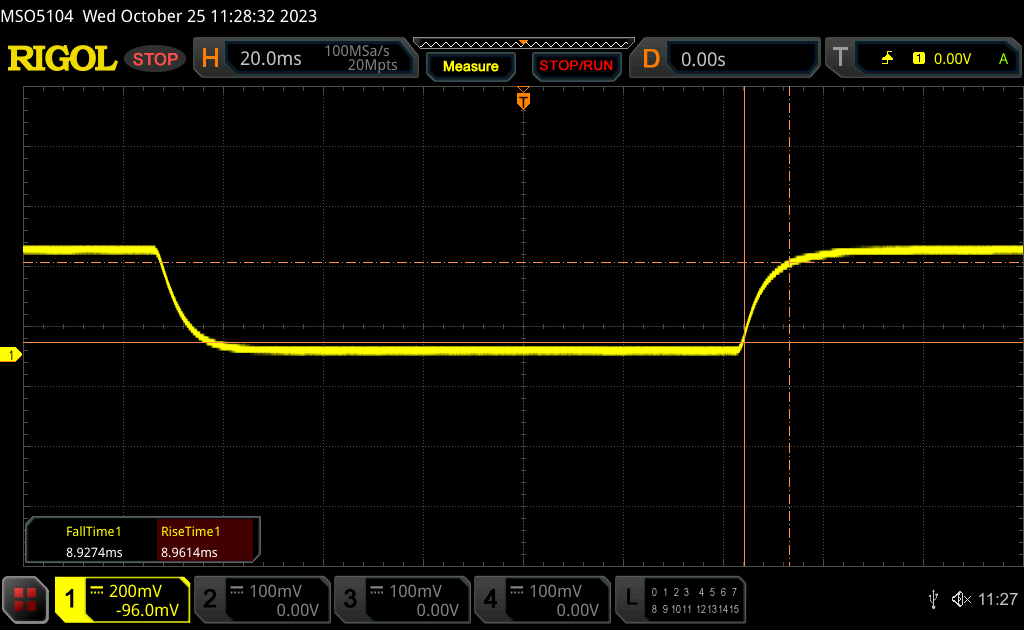 |
| ↘ 8.9 ms daling | ||
| Het scherm vertoonde prima responstijden in onze tests maar is misschien wat te traag voor competitieve games. Ter vergelijking: alle testtoestellen variëren van 0.1 (minimum) tot 240 (maximum) ms. » 40 % van alle toestellen zijn beter. Dit betekent dat de gemeten responstijd vergelijkbaar is met het gemiddelde (19.8 ms) van alle geteste toestellen. | ||
| ↔ Responstijd 50% Grijs naar 80% Grijs | ||
| 27.3 ms ... stijging ↗ en daling ↘ gecombineerd | ↗ 12.7 ms stijging | 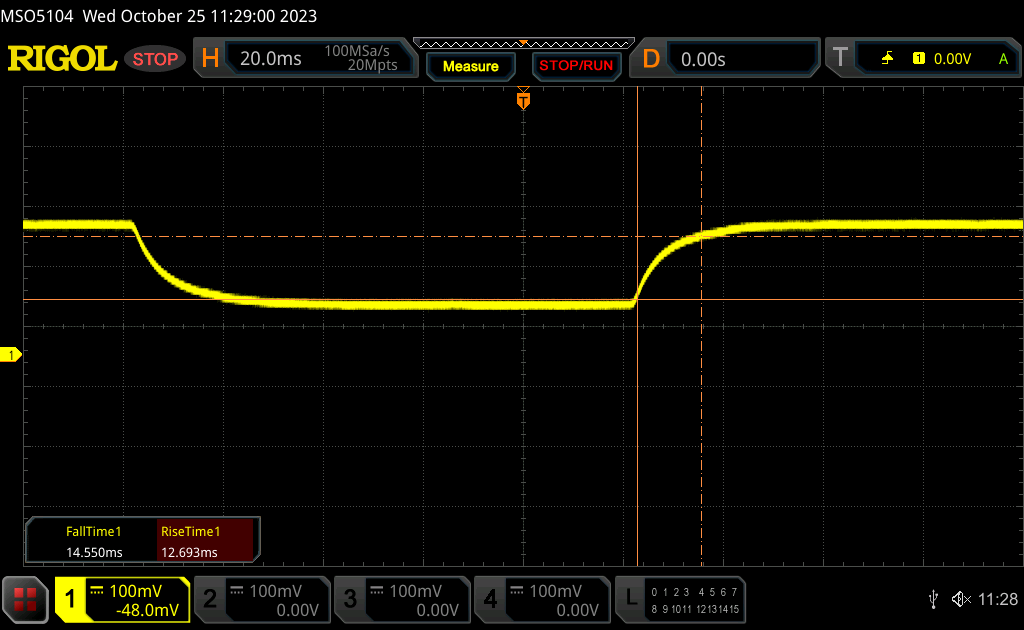 |
| ↘ 14.6 ms daling | ||
| Het scherm vertoonde relatief trage responstijden in onze tests en is misschien te traag voor games. Ter vergelijking: alle testtoestellen variëren van 0.165 (minimum) tot 636 (maximum) ms. » 37 % van alle toestellen zijn beter. Dit betekent dat de gemeten responstijd beter is dan het gemiddelde (31 ms) van alle geteste toestellen. | ||
Screen Flickering / PWM (Pulse-Width Modulation)
| Screen flickering / PWM niet waargenomen | 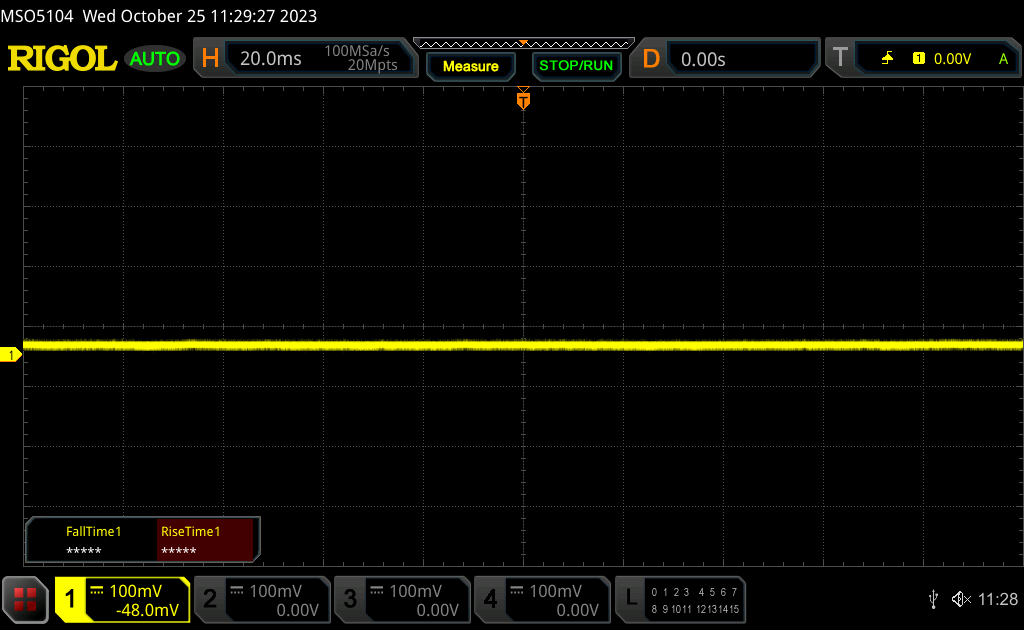 | ||
Ter vergelijking: 52 % van alle geteste toestellen maakten geen gebruik van PWM om de schermhelderheid te verlagen. Als het wel werd gebruikt, werd een gemiddelde van 7751 (minimum: 5 - maximum: 343500) Hz waargenomen. | |||
Prestaties
Testomstandigheden
We hebben Windows ingesteld op de modus Prestaties voordat we de onderstaande benchmarks uitvoerden. Er zijn geen extra energieprofielen naast de standaard Windows-profielen (Energiebesparing, Gebalanceerd en Prestaties).
Processor
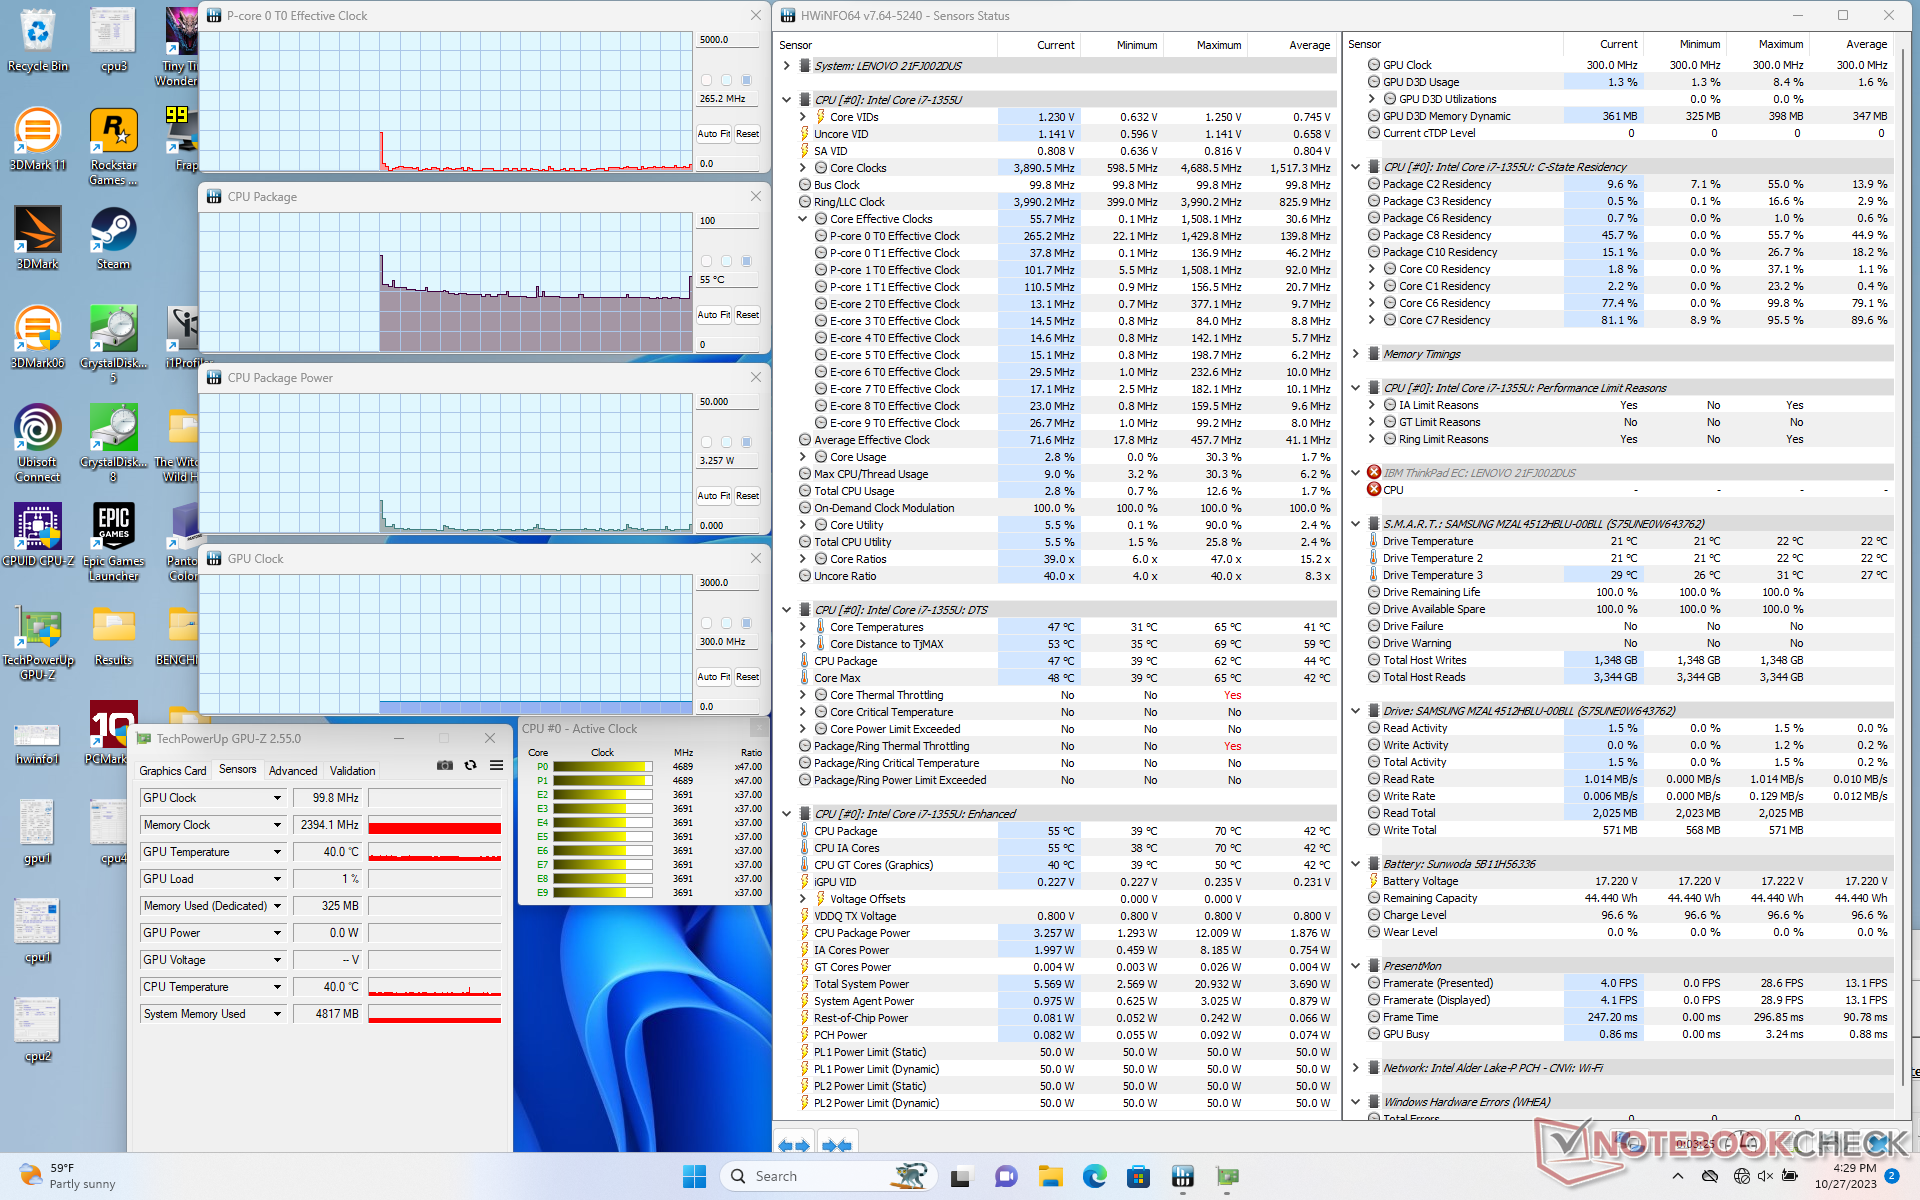
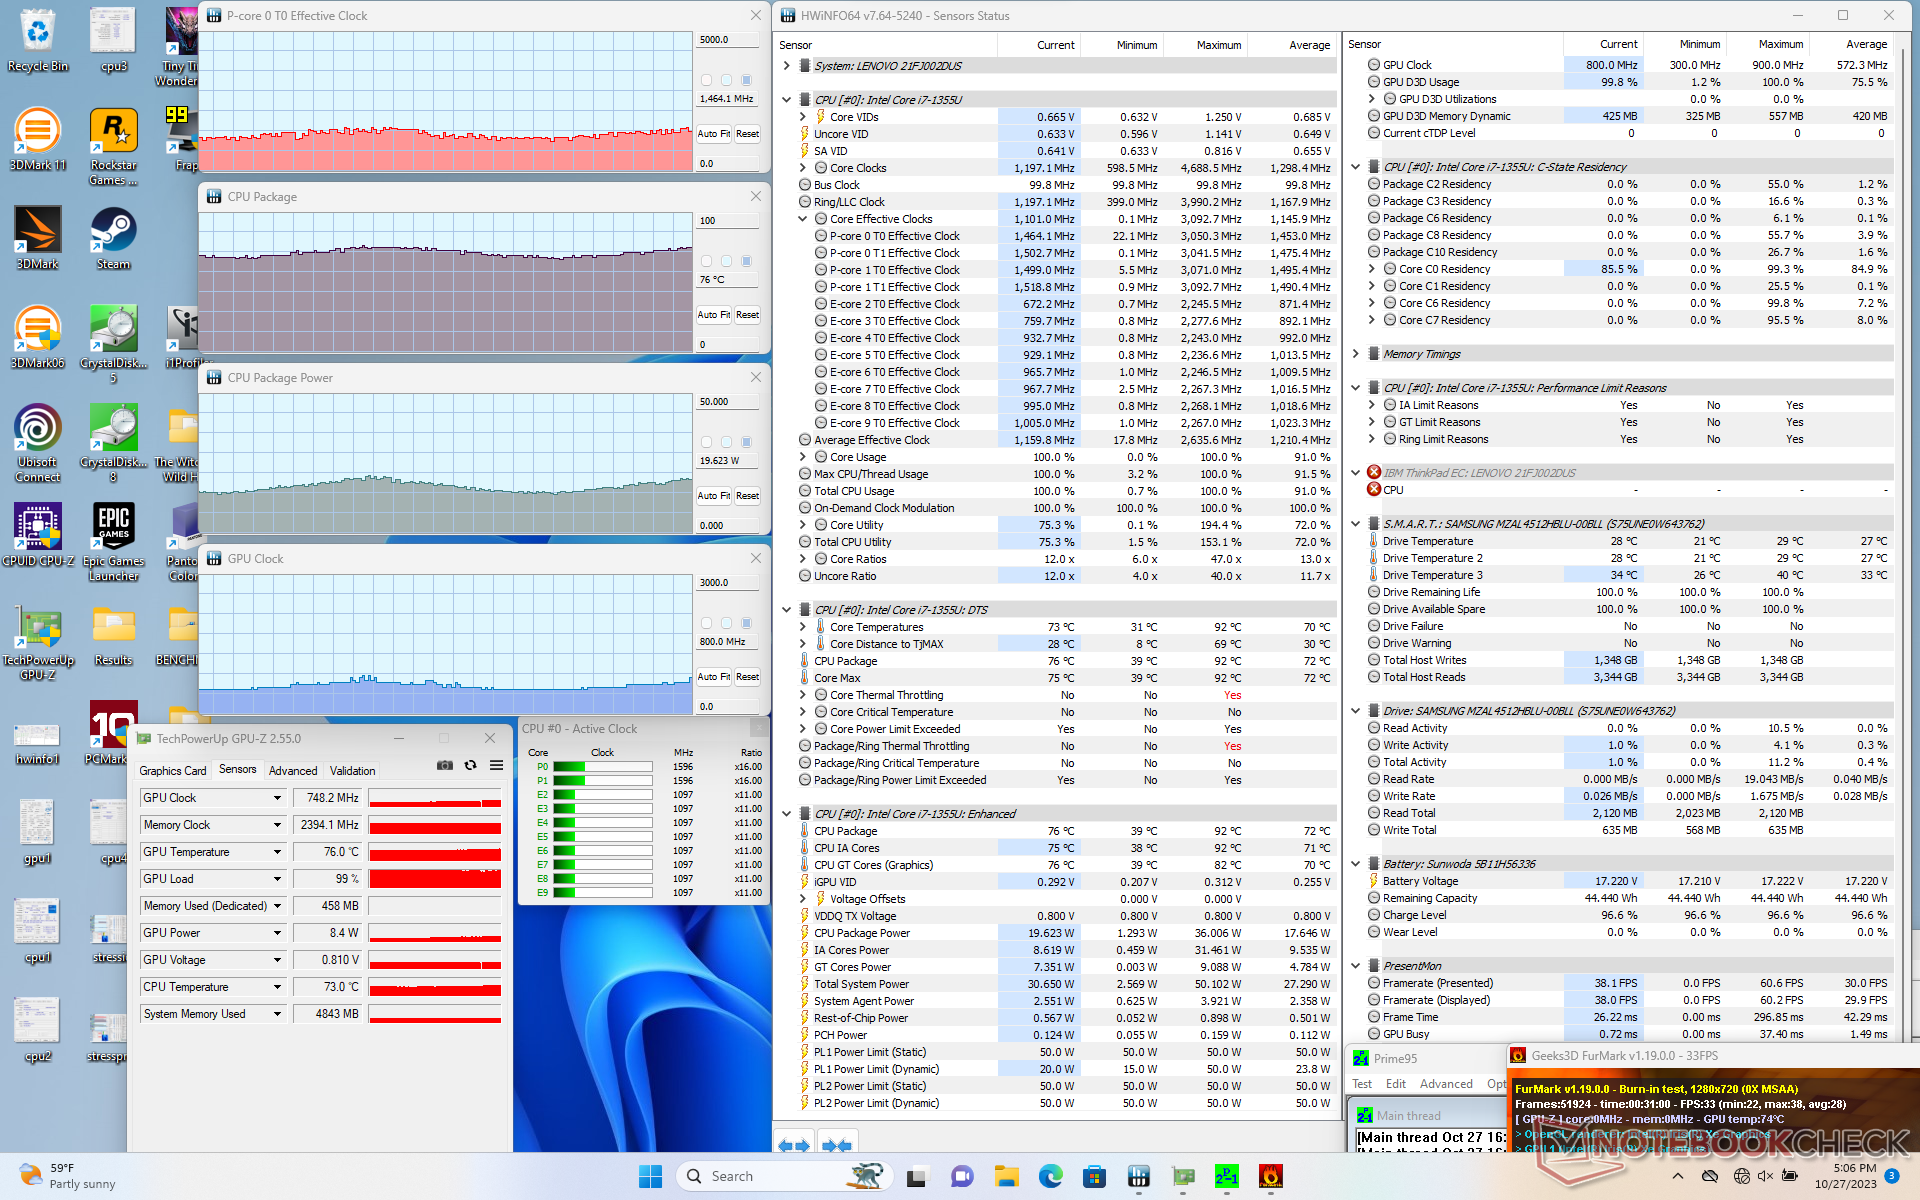
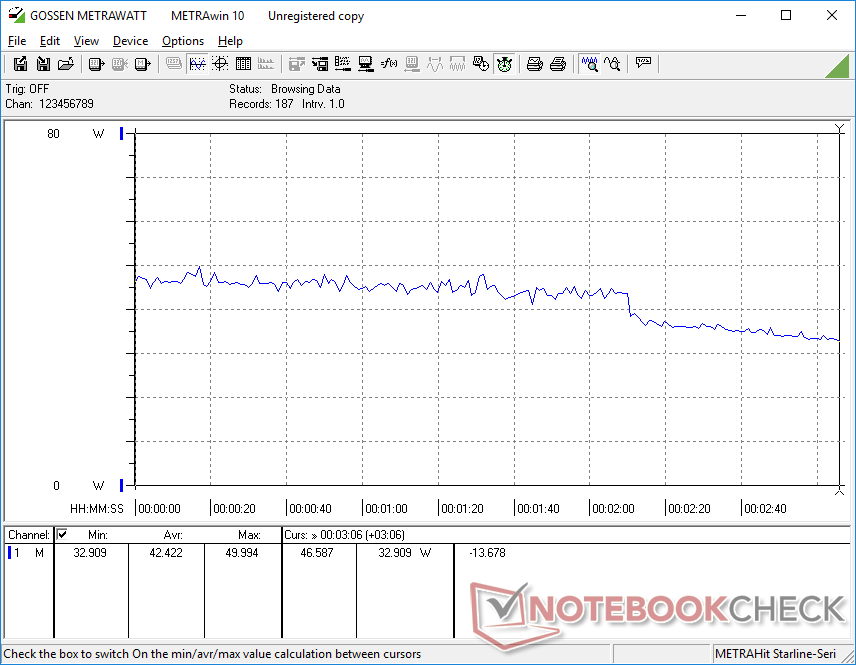
De CPU-prestaties zijn iets langzamer dan die van de meeste andere laptops met dezelfde Core i7-1355U door throttling. Wanneer CineBench R15 xT bijvoorbeeld in een lus wordt uitgevoerd, daalt de oorspronkelijke score van 1274 punten na verloop van tijd met maar liefst 35 procent, zoals de grafiek hieronder laat zien. De multi-thread prestaties zijn dus maar een klein beetje beter dan die van de concurrerende Ryzen 5 7530U configuratie nadat rekening is gehouden met de hogere throttling op de Intel-versie.
Het grootste voordeel voor Intel blijft de single-thread prestatie, waar onze Core i7 een voorsprong van 20 tot 25 procent heeft op de Ryzen 5 7530U.
Cinebench R15 Multi Loop
Cinebench R23: Multi Core | Single Core
Cinebench R20: CPU (Multi Core) | CPU (Single Core)
Cinebench R15: CPU Multi 64Bit | CPU Single 64Bit
Blender: v2.79 BMW27 CPU
7-Zip 18.03: 7z b 4 | 7z b 4 -mmt1
Geekbench 5.5: Multi-Core | Single-Core
HWBOT x265 Benchmark v2.2: 4k Preset
LibreOffice : 20 Documents To PDF
R Benchmark 2.5: Overall mean
| CPU Performance rating | |
| Framework Laptop 13.5 Ryzen 7 7840U | |
| Dell XPS 13 Plus 9320 Core i7-1360P | |
| Gemiddeld Intel Core i7-1355U | |
| Lenovo ThinkPad L13 Yoga G4 i7-1355U | |
| HP Elite Dragonfly Folio 13.5 G3 | |
| Lenovo ThinkBook 13s G3 20YA0005GE | |
| Lenovo Yoga 6 13 83B2001SGE | |
| Dell Latitude 9330 | |
| Lenovo ThinkPad L13 Yoga G4 21FSS00100 | |
| Lenovo Yoga 6 13ALC6 -2! | |
| MSI Summit E13 Flip Evo A11MT | |
| Cinebench R23 / Multi Core | |
| Framework Laptop 13.5 Ryzen 7 7840U | |
| Dell XPS 13 Plus 9320 Core i7-1360P | |
| Gemiddeld Intel Core i7-1355U (6936 - 10252, n=18) | |
| Lenovo ThinkPad L13 Yoga G4 i7-1355U | |
| Lenovo ThinkBook 13s G3 20YA0005GE | |
| HP Elite Dragonfly Folio 13.5 G3 | |
| Lenovo Yoga 6 13ALC6 | |
| Dell Latitude 9330 | |
| Lenovo Yoga 6 13 83B2001SGE | |
| Lenovo ThinkPad L13 Yoga G4 21FSS00100 | |
| MSI Summit E13 Flip Evo A11MT | |
| Cinebench R23 / Single Core | |
| Dell XPS 13 Plus 9320 Core i7-1360P | |
| Gemiddeld Intel Core i7-1355U (1687 - 1889, n=18) | |
| Lenovo ThinkPad L13 Yoga G4 i7-1355U | |
| HP Elite Dragonfly Folio 13.5 G3 | |
| Framework Laptop 13.5 Ryzen 7 7840U | |
| Dell Latitude 9330 | |
| MSI Summit E13 Flip Evo A11MT | |
| Lenovo ThinkBook 13s G3 20YA0005GE | |
| Lenovo ThinkPad L13 Yoga G4 21FSS00100 | |
| Lenovo Yoga 6 13 83B2001SGE | |
| Lenovo Yoga 6 13ALC6 | |
| Cinebench R20 / CPU (Multi Core) | |
| Framework Laptop 13.5 Ryzen 7 7840U | |
| Dell XPS 13 Plus 9320 Core i7-1360P | |
| Gemiddeld Intel Core i7-1355U (2849 - 3907, n=18) | |
| Lenovo ThinkPad L13 Yoga G4 i7-1355U | |
| Lenovo ThinkBook 13s G3 20YA0005GE | |
| HP Elite Dragonfly Folio 13.5 G3 | |
| Lenovo Yoga 6 13ALC6 | |
| Lenovo Yoga 6 13 83B2001SGE | |
| Dell Latitude 9330 | |
| Lenovo ThinkPad L13 Yoga G4 21FSS00100 | |
| MSI Summit E13 Flip Evo A11MT | |
| Cinebench R20 / CPU (Single Core) | |
| Dell XPS 13 Plus 9320 Core i7-1360P | |
| Gemiddeld Intel Core i7-1355U (654 - 725, n=18) | |
| Lenovo ThinkPad L13 Yoga G4 i7-1355U | |
| HP Elite Dragonfly Folio 13.5 G3 | |
| Framework Laptop 13.5 Ryzen 7 7840U | |
| Dell Latitude 9330 | |
| Lenovo ThinkBook 13s G3 20YA0005GE | |
| MSI Summit E13 Flip Evo A11MT | |
| Lenovo Yoga 6 13 83B2001SGE | |
| Lenovo ThinkPad L13 Yoga G4 21FSS00100 | |
| Lenovo Yoga 6 13ALC6 | |
| Cinebench R15 / CPU Multi 64Bit | |
| Framework Laptop 13.5 Ryzen 7 7840U | |
| Dell XPS 13 Plus 9320 Core i7-1360P | |
| Lenovo ThinkBook 13s G3 20YA0005GE | |
| Lenovo ThinkBook 13s G3 20YA0005GE | |
| Lenovo Yoga 6 13 83B2001SGE | |
| Gemiddeld Intel Core i7-1355U (1206 - 1735, n=18) | |
| HP Elite Dragonfly Folio 13.5 G3 | |
| Lenovo ThinkPad L13 Yoga G4 21FSS00100 | |
| Lenovo ThinkPad L13 Yoga G4 i7-1355U | |
| Lenovo Yoga 6 13ALC6 | |
| Dell Latitude 9330 | |
| MSI Summit E13 Flip Evo A11MT | |
| Cinebench R15 / CPU Single 64Bit | |
| Dell XPS 13 Plus 9320 Core i7-1360P | |
| Gemiddeld Intel Core i7-1355U (237 - 267, n=18) | |
| Framework Laptop 13.5 Ryzen 7 7840U | |
| HP Elite Dragonfly Folio 13.5 G3 | |
| Lenovo ThinkPad L13 Yoga G4 i7-1355U | |
| Lenovo ThinkBook 13s G3 20YA0005GE | |
| Dell Latitude 9330 | |
| Lenovo Yoga 6 13 83B2001SGE | |
| MSI Summit E13 Flip Evo A11MT | |
| Lenovo ThinkPad L13 Yoga G4 21FSS00100 | |
| Lenovo Yoga 6 13ALC6 | |
| Blender / v2.79 BMW27 CPU | |
| MSI Summit E13 Flip Evo A11MT | |
| Lenovo ThinkPad L13 Yoga G4 i7-1355U | |
| Lenovo ThinkPad L13 Yoga G4 21FSS00100 | |
| Dell Latitude 9330 | |
| HP Elite Dragonfly Folio 13.5 G3 | |
| Gemiddeld Intel Core i7-1355U (328 - 503, n=18) | |
| Lenovo ThinkBook 13s G3 20YA0005GE | |
| Lenovo Yoga 6 13ALC6 | |
| Lenovo Yoga 6 13 83B2001SGE | |
| Dell XPS 13 Plus 9320 Core i7-1360P | |
| Framework Laptop 13.5 Ryzen 7 7840U | |
| 7-Zip 18.03 / 7z b 4 | |
| Framework Laptop 13.5 Ryzen 7 7840U | |
| Dell XPS 13 Plus 9320 Core i7-1360P | |
| Lenovo Yoga 6 13 83B2001SGE | |
| Lenovo ThinkBook 13s G3 20YA0005GE | |
| Lenovo Yoga 6 13ALC6 | |
| Gemiddeld Intel Core i7-1355U (30255 - 42092, n=18) | |
| HP Elite Dragonfly Folio 13.5 G3 | |
| Lenovo ThinkPad L13 Yoga G4 i7-1355U | |
| Lenovo ThinkPad L13 Yoga G4 21FSS00100 | |
| Dell Latitude 9330 | |
| MSI Summit E13 Flip Evo A11MT | |
| 7-Zip 18.03 / 7z b 4 -mmt1 | |
| Framework Laptop 13.5 Ryzen 7 7840U | |
| Gemiddeld Intel Core i7-1355U (5301 - 5911, n=18) | |
| Dell XPS 13 Plus 9320 Core i7-1360P | |
| Lenovo ThinkPad L13 Yoga G4 i7-1355U | |
| Lenovo ThinkBook 13s G3 20YA0005GE | |
| Lenovo Yoga 6 13 83B2001SGE | |
| HP Elite Dragonfly Folio 13.5 G3 | |
| MSI Summit E13 Flip Evo A11MT | |
| Lenovo ThinkPad L13 Yoga G4 21FSS00100 | |
| Dell Latitude 9330 | |
| Lenovo Yoga 6 13ALC6 | |
| Geekbench 5.5 / Multi-Core | |
| Dell XPS 13 Plus 9320 Core i7-1360P | |
| Framework Laptop 13.5 Ryzen 7 7840U | |
| HP Elite Dragonfly Folio 13.5 G3 | |
| Gemiddeld Intel Core i7-1355U (7507 - 9328, n=18) | |
| Lenovo ThinkPad L13 Yoga G4 i7-1355U | |
| Lenovo Yoga 6 13 83B2001SGE | |
| Dell Latitude 9330 | |
| Lenovo ThinkBook 13s G3 20YA0005GE | |
| Lenovo ThinkPad L13 Yoga G4 21FSS00100 | |
| MSI Summit E13 Flip Evo A11MT | |
| Geekbench 5.5 / Single-Core | |
| Framework Laptop 13.5 Ryzen 7 7840U | |
| Lenovo ThinkPad L13 Yoga G4 i7-1355U | |
| Dell XPS 13 Plus 9320 Core i7-1360P | |
| Gemiddeld Intel Core i7-1355U (1678 - 1872, n=18) | |
| HP Elite Dragonfly Folio 13.5 G3 | |
| Dell Latitude 9330 | |
| MSI Summit E13 Flip Evo A11MT | |
| Lenovo Yoga 6 13 83B2001SGE | |
| Lenovo ThinkBook 13s G3 20YA0005GE | |
| Lenovo ThinkPad L13 Yoga G4 21FSS00100 | |
| HWBOT x265 Benchmark v2.2 / 4k Preset | |
| Framework Laptop 13.5 Ryzen 7 7840U | |
| Dell XPS 13 Plus 9320 Core i7-1360P | |
| Lenovo Yoga 6 13 83B2001SGE | |
| Lenovo ThinkBook 13s G3 20YA0005GE | |
| Gemiddeld Intel Core i7-1355U (7.83 - 11.4, n=18) | |
| Lenovo ThinkPad L13 Yoga G4 i7-1355U | |
| Lenovo Yoga 6 13ALC6 | |
| HP Elite Dragonfly Folio 13.5 G3 | |
| Dell Latitude 9330 | |
| Lenovo ThinkPad L13 Yoga G4 21FSS00100 | |
| MSI Summit E13 Flip Evo A11MT | |
| LibreOffice / 20 Documents To PDF | |
| Lenovo Yoga 6 13ALC6 | |
| Lenovo ThinkPad L13 Yoga G4 21FSS00100 | |
| Gemiddeld Intel Core i7-1355U (41.1 - 108.6, n=18) | |
| Dell Latitude 9330 | |
| Lenovo ThinkBook 13s G3 20YA0005GE | |
| HP Elite Dragonfly Folio 13.5 G3 | |
| Lenovo Yoga 6 13 83B2001SGE | |
| Lenovo ThinkPad L13 Yoga G4 i7-1355U | |
| MSI Summit E13 Flip Evo A11MT | |
| Dell XPS 13 Plus 9320 Core i7-1360P | |
| Framework Laptop 13.5 Ryzen 7 7840U | |
| R Benchmark 2.5 / Overall mean | |
| MSI Summit E13 Flip Evo A11MT | |
| Lenovo Yoga 6 13ALC6 | |
| Lenovo ThinkPad L13 Yoga G4 21FSS00100 | |
| Lenovo ThinkBook 13s G3 20YA0005GE | |
| Lenovo Yoga 6 13 83B2001SGE | |
| Dell Latitude 9330 | |
| Gemiddeld Intel Core i7-1355U (0.4481 - 0.832, n=18) | |
| HP Elite Dragonfly Folio 13.5 G3 | |
| Lenovo ThinkPad L13 Yoga G4 i7-1355U | |
| Dell XPS 13 Plus 9320 Core i7-1360P | |
| Framework Laptop 13.5 Ryzen 7 7840U | |
* ... kleiner is beter
AIDA64: FP32 Ray-Trace | FPU Julia | CPU SHA3 | CPU Queen | FPU SinJulia | FPU Mandel | CPU AES | CPU ZLib | FP64 Ray-Trace | CPU PhotoWorxx
| Performance rating | |
| Framework Laptop 13.5 Ryzen 7 7840U | |
| Lenovo ThinkPad L13 Yoga G4 21FSS00100 | |
| Gemiddeld Intel Core i7-1355U | |
| HP Elite Dragonfly Folio 13.5 G3 | |
| MSI Summit E13 Flip Evo A11MT | |
| Lenovo ThinkPad L13 Yoga G4 i7-1355U | |
| Dell Latitude 9330 | |
| AIDA64 / FP32 Ray-Trace | |
| Framework Laptop 13.5 Ryzen 7 7840U | |
| Lenovo ThinkPad L13 Yoga G4 21FSS00100 | |
| Gemiddeld Intel Core i7-1355U (5673 - 8424, n=18) | |
| MSI Summit E13 Flip Evo A11MT | |
| Dell Latitude 9330 | |
| HP Elite Dragonfly Folio 13.5 G3 | |
| Lenovo ThinkPad L13 Yoga G4 i7-1355U | |
| AIDA64 / FPU SinJulia | |
| Framework Laptop 13.5 Ryzen 7 7840U | |
| Lenovo ThinkPad L13 Yoga G4 21FSS00100 | |
| MSI Summit E13 Flip Evo A11MT | |
| Gemiddeld Intel Core i7-1355U (4045 - 5426, n=18) | |
| HP Elite Dragonfly Folio 13.5 G3 | |
| Lenovo ThinkPad L13 Yoga G4 i7-1355U | |
| Dell Latitude 9330 | |
| AIDA64 / FPU Mandel | |
| Framework Laptop 13.5 Ryzen 7 7840U | |
| Lenovo ThinkPad L13 Yoga G4 21FSS00100 | |
| Gemiddeld Intel Core i7-1355U (14596 - 21627, n=18) | |
| MSI Summit E13 Flip Evo A11MT | |
| HP Elite Dragonfly Folio 13.5 G3 | |
| Dell Latitude 9330 | |
| Lenovo ThinkPad L13 Yoga G4 i7-1355U | |
| AIDA64 / FP64 Ray-Trace | |
| Framework Laptop 13.5 Ryzen 7 7840U | |
| Lenovo ThinkPad L13 Yoga G4 21FSS00100 | |
| MSI Summit E13 Flip Evo A11MT | |
| Gemiddeld Intel Core i7-1355U (2991 - 4453, n=18) | |
| Dell Latitude 9330 | |
| HP Elite Dragonfly Folio 13.5 G3 | |
| Lenovo ThinkPad L13 Yoga G4 i7-1355U | |
| AIDA64 / CPU PhotoWorxx | |
| HP Elite Dragonfly Folio 13.5 G3 | |
| MSI Summit E13 Flip Evo A11MT | |
| Dell Latitude 9330 | |
| Lenovo ThinkPad L13 Yoga G4 i7-1355U | |
| Gemiddeld Intel Core i7-1355U (21800 - 46154, n=18) | |
| Framework Laptop 13.5 Ryzen 7 7840U | |
| Lenovo ThinkPad L13 Yoga G4 21FSS00100 | |
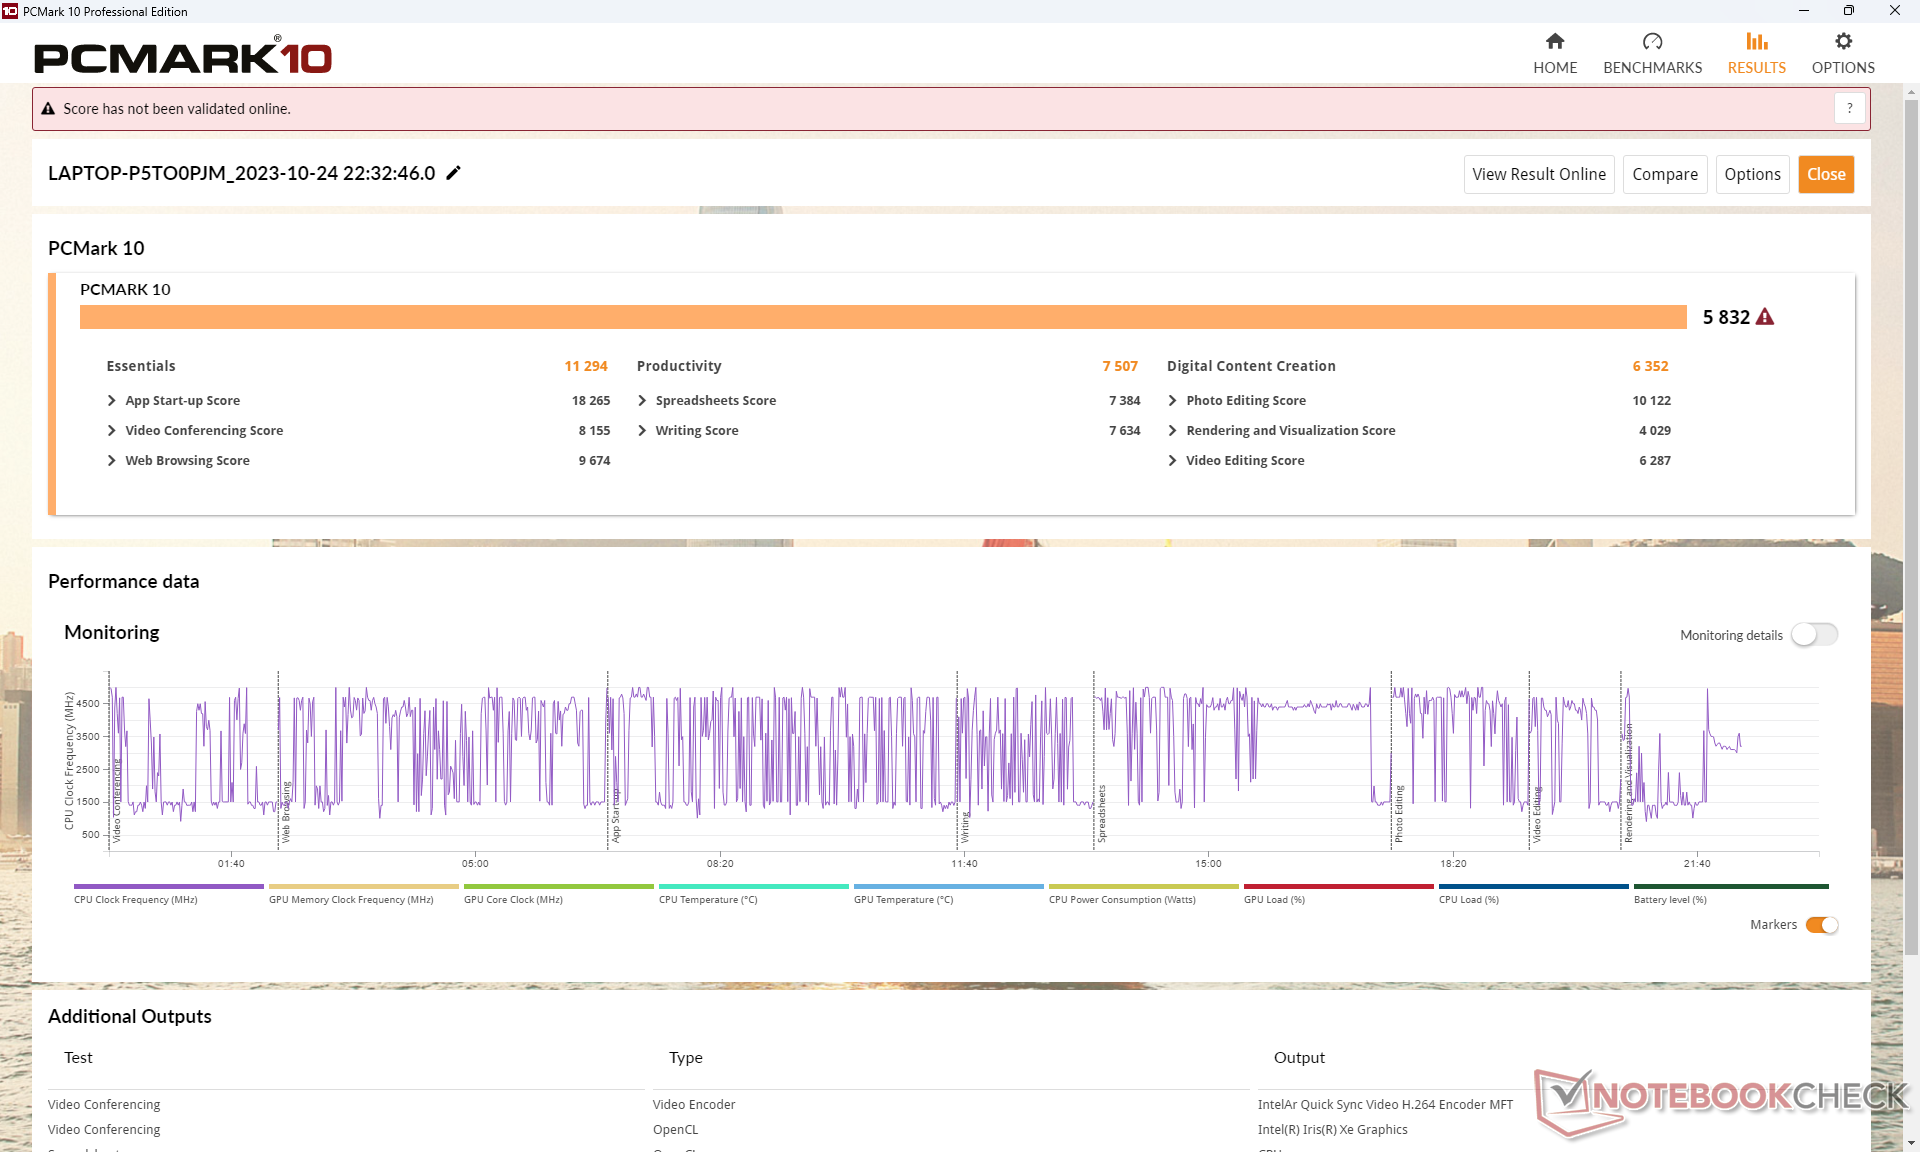
Systeemprestaties
PCMark-scores zijn hoger in de GPU-zware subtest voor het maken van digitale inhoud, terwijl de CPU-zware productiviteitstest in het voordeel van de AMD-versie uitvalt. Dit suggereert dat onze Intel-versie betere geïntegreerde grafische prestaties biedt, maar langzamere CPU multi-thread prestaties dan de AMD-versie.
CrossMark: Overall | Productivity | Creativity | Responsiveness
| PCMark 10 / Score | |
| Framework Laptop 13.5 Ryzen 7 7840U | |
| Lenovo ThinkPad L13 Yoga G4 i7-1355U | |
| HP Elite Dragonfly Folio 13.5 G3 | |
| Gemiddeld Intel Core i7-1355U, Intel Iris Xe Graphics G7 96EUs (5455 - 5933, n=15) | |
| Lenovo ThinkPad L13 Yoga G4 21FSS00100 | |
| Dell Latitude 9330 | |
| MSI Summit E13 Flip Evo A11MT | |
| PCMark 10 / Essentials | |
| HP Elite Dragonfly Folio 13.5 G3 | |
| Lenovo ThinkPad L13 Yoga G4 i7-1355U | |
| Lenovo ThinkPad L13 Yoga G4 21FSS00100 | |
| Framework Laptop 13.5 Ryzen 7 7840U | |
| Gemiddeld Intel Core i7-1355U, Intel Iris Xe Graphics G7 96EUs (10203 - 11822, n=15) | |
| Dell Latitude 9330 | |
| MSI Summit E13 Flip Evo A11MT | |
| PCMark 10 / Productivity | |
| Framework Laptop 13.5 Ryzen 7 7840U | |
| Lenovo ThinkPad L13 Yoga G4 21FSS00100 | |
| Lenovo ThinkPad L13 Yoga G4 i7-1355U | |
| HP Elite Dragonfly Folio 13.5 G3 | |
| Gemiddeld Intel Core i7-1355U, Intel Iris Xe Graphics G7 96EUs (6763 - 7536, n=15) | |
| Dell Latitude 9330 | |
| MSI Summit E13 Flip Evo A11MT | |
| PCMark 10 / Digital Content Creation | |
| Framework Laptop 13.5 Ryzen 7 7840U | |
| Lenovo ThinkPad L13 Yoga G4 i7-1355U | |
| Gemiddeld Intel Core i7-1355U, Intel Iris Xe Graphics G7 96EUs (5723 - 6712, n=15) | |
| HP Elite Dragonfly Folio 13.5 G3 | |
| Dell Latitude 9330 | |
| MSI Summit E13 Flip Evo A11MT | |
| Lenovo ThinkPad L13 Yoga G4 21FSS00100 | |
| CrossMark / Overall | |
| Framework Laptop 13.5 Ryzen 7 7840U | |
| HP Elite Dragonfly Folio 13.5 G3 | |
| Gemiddeld Intel Core i7-1355U, Intel Iris Xe Graphics G7 96EUs (1478 - 1643, n=15) | |
| Lenovo ThinkPad L13 Yoga G4 i7-1355U | |
| Lenovo ThinkPad L13 Yoga G4 21FSS00100 | |
| CrossMark / Productivity | |
| Framework Laptop 13.5 Ryzen 7 7840U | |
| HP Elite Dragonfly Folio 13.5 G3 | |
| Gemiddeld Intel Core i7-1355U, Intel Iris Xe Graphics G7 96EUs (1444 - 1665, n=15) | |
| Lenovo ThinkPad L13 Yoga G4 i7-1355U | |
| Lenovo ThinkPad L13 Yoga G4 21FSS00100 | |
| CrossMark / Creativity | |
| Framework Laptop 13.5 Ryzen 7 7840U | |
| HP Elite Dragonfly Folio 13.5 G3 | |
| Lenovo ThinkPad L13 Yoga G4 i7-1355U | |
| Gemiddeld Intel Core i7-1355U, Intel Iris Xe Graphics G7 96EUs (1563 - 1732, n=15) | |
| Lenovo ThinkPad L13 Yoga G4 21FSS00100 | |
| CrossMark / Responsiveness | |
| HP Elite Dragonfly Folio 13.5 G3 | |
| Framework Laptop 13.5 Ryzen 7 7840U | |
| Gemiddeld Intel Core i7-1355U, Intel Iris Xe Graphics G7 96EUs (1217 - 1681, n=15) | |
| Lenovo ThinkPad L13 Yoga G4 i7-1355U | |
| Lenovo ThinkPad L13 Yoga G4 21FSS00100 | |
| PCMark 10 Score | 5823 punten | |
Help | ||
| AIDA64 / Memory Copy | |
| Dell Latitude 9330 | |
| HP Elite Dragonfly Folio 13.5 G3 | |
| Framework Laptop 13.5 Ryzen 7 7840U | |
| Gemiddeld Intel Core i7-1355U (35017 - 71600, n=18) | |
| Lenovo ThinkPad L13 Yoga G4 i7-1355U | |
| MSI Summit E13 Flip Evo A11MT | |
| Lenovo ThinkPad L13 Yoga G4 21FSS00100 | |
| AIDA64 / Memory Read | |
| HP Elite Dragonfly Folio 13.5 G3 | |
| Framework Laptop 13.5 Ryzen 7 7840U | |
| Dell Latitude 9330 | |
| MSI Summit E13 Flip Evo A11MT | |
| Gemiddeld Intel Core i7-1355U (38551 - 73377, n=18) | |
| Lenovo ThinkPad L13 Yoga G4 i7-1355U | |
| Lenovo ThinkPad L13 Yoga G4 21FSS00100 | |
| AIDA64 / Memory Write | |
| Framework Laptop 13.5 Ryzen 7 7840U | |
| HP Elite Dragonfly Folio 13.5 G3 | |
| Lenovo ThinkPad L13 Yoga G4 i7-1355U | |
| Gemiddeld Intel Core i7-1355U (35910 - 93342, n=18) | |
| Dell Latitude 9330 | |
| MSI Summit E13 Flip Evo A11MT | |
| Lenovo ThinkPad L13 Yoga G4 21FSS00100 | |
| AIDA64 / Memory Latency | |
| HP Elite Dragonfly Folio 13.5 G3 | |
| Lenovo ThinkPad L13 Yoga G4 21FSS00100 | |
| Gemiddeld Intel Core i7-1355U (72.2 - 346, n=18) | |
| Dell Latitude 9330 | |
| Lenovo ThinkPad L13 Yoga G4 i7-1355U | |
| MSI Summit E13 Flip Evo A11MT | |
| Framework Laptop 13.5 Ryzen 7 7840U | |
* ... kleiner is beter
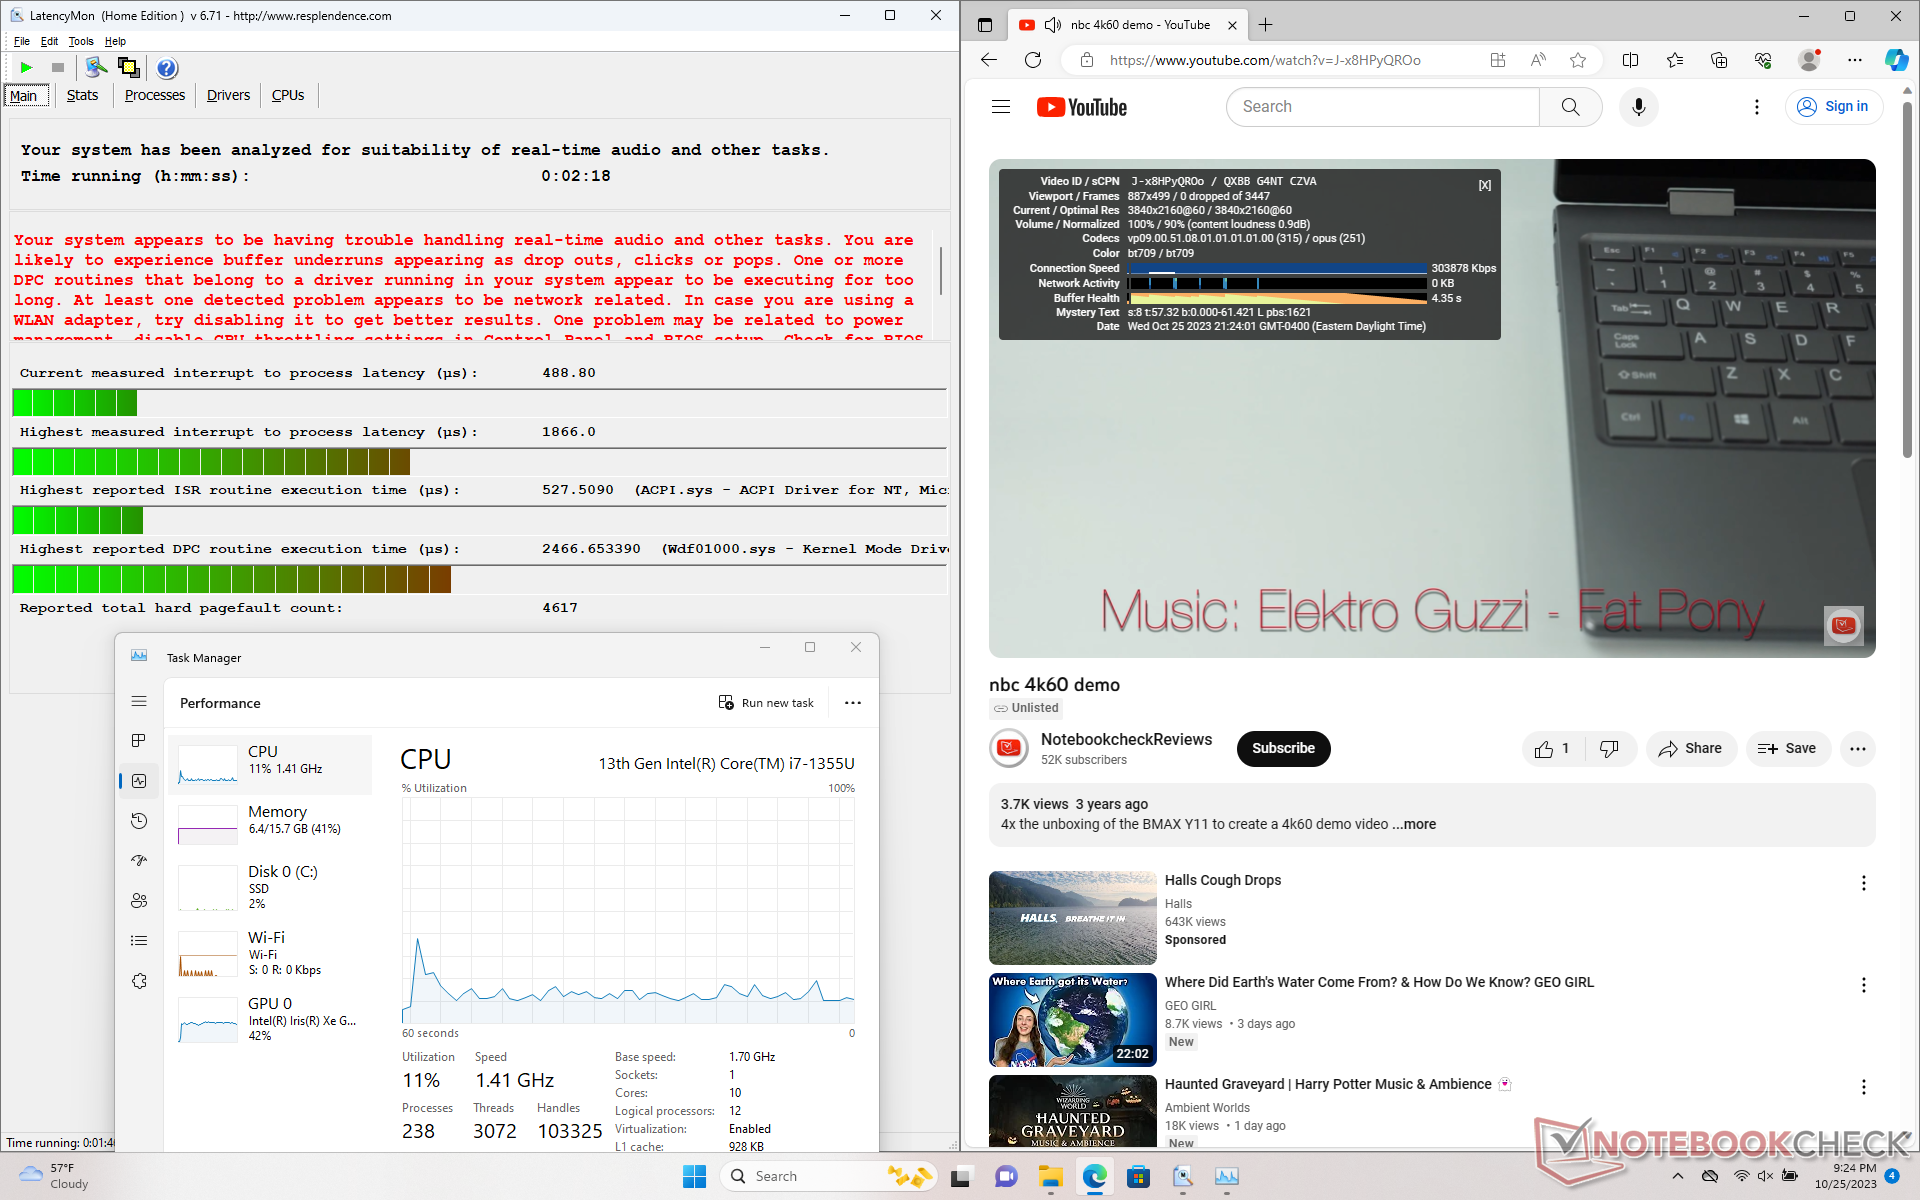
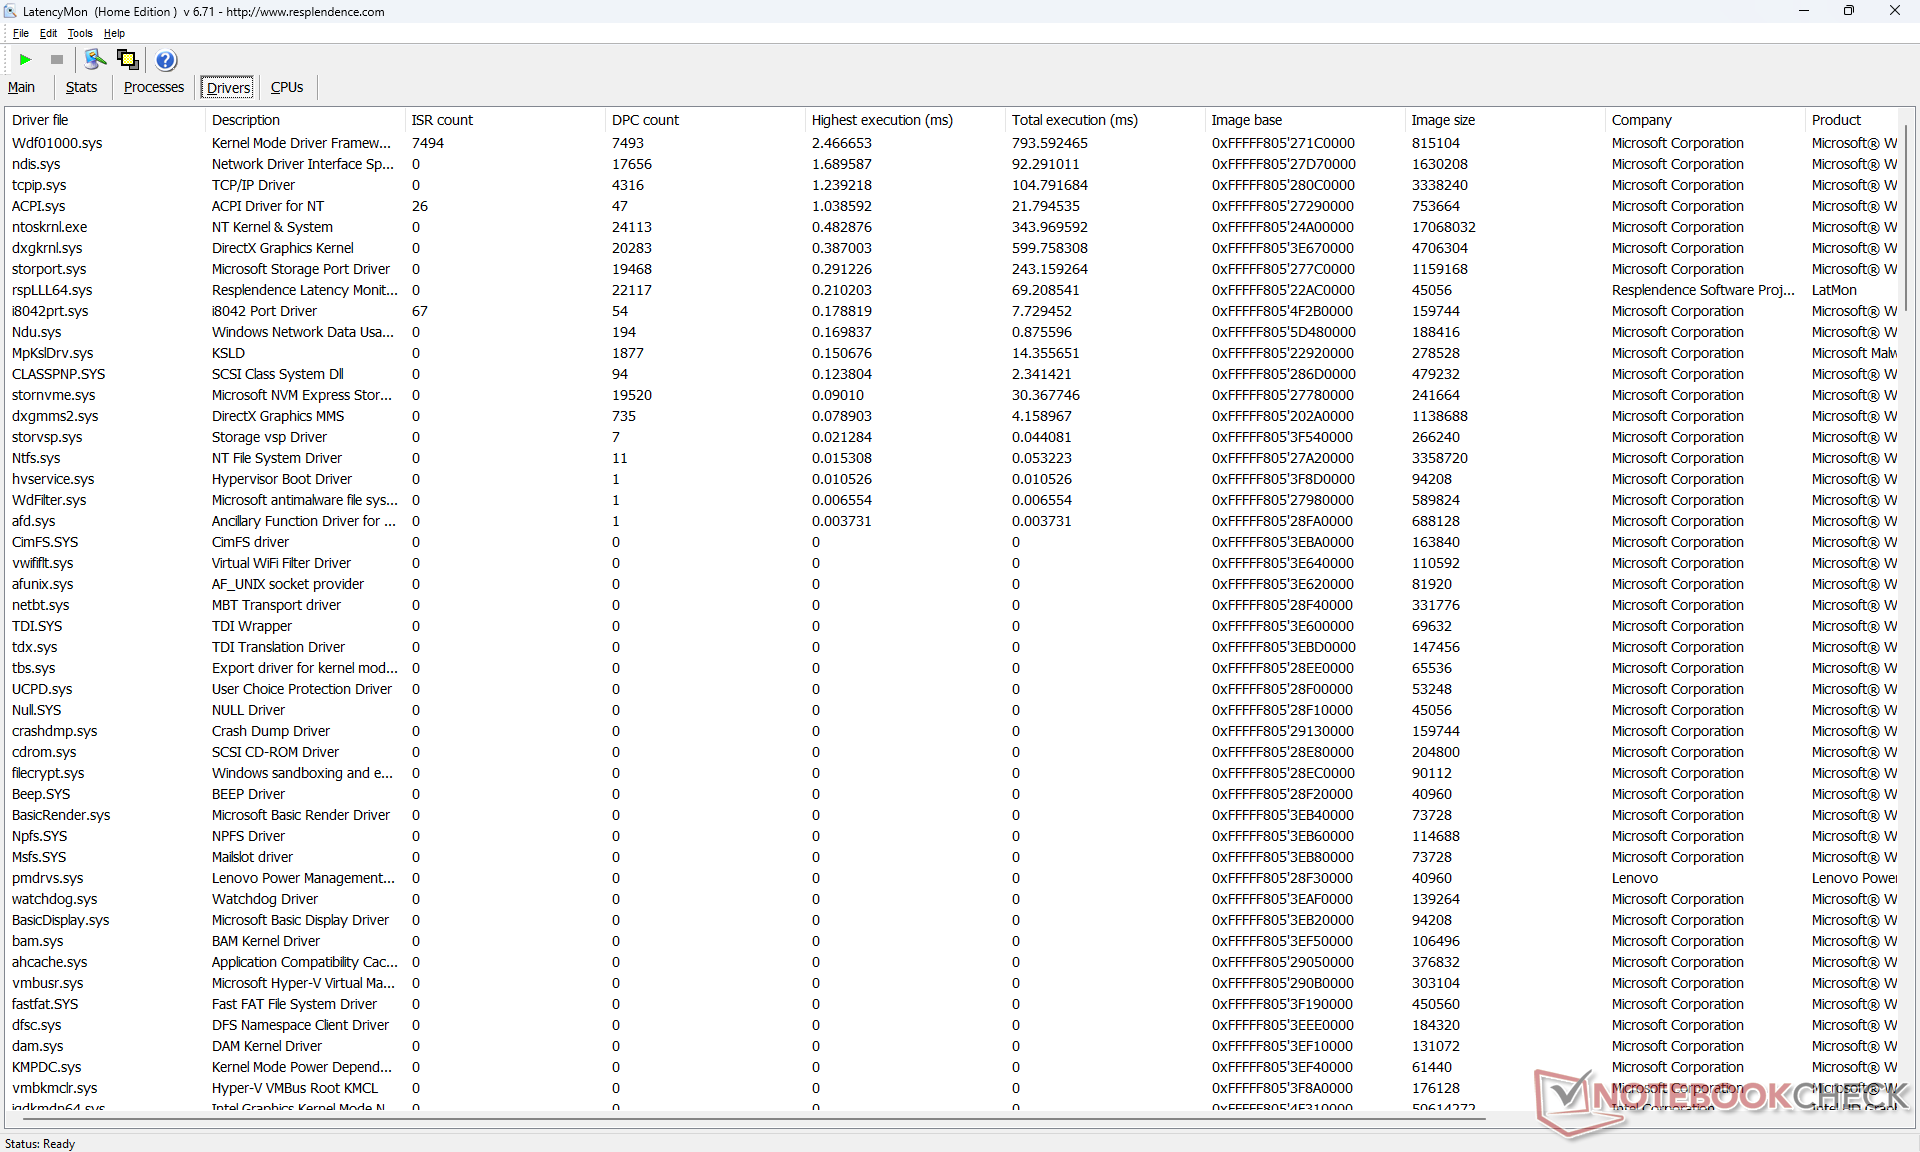
DPC latentie
LatencyMon laat lichte DPC-problemen zien bij het openen van meerdere browsertabbladen van onze startpagina. het afspelen van 4K-video's met 60 FPS verloopt verder soepel en er zijn geen dropped frames opgenomen.
| DPC Latencies / LatencyMon - interrupt to process latency (max), Web, Youtube, Prime95 | |
| Dell Latitude 9330 | |
| HP Elite Dragonfly Folio 13.5 G3 | |
| MSI Summit E13 Flip Evo A11MT | |
| Lenovo ThinkPad L13 Yoga G4 i7-1355U | |
| Framework Laptop 13.5 Ryzen 7 7840U | |
| Lenovo ThinkPad L13 Yoga G4 21FSS00100 | |
* ... kleiner is beter
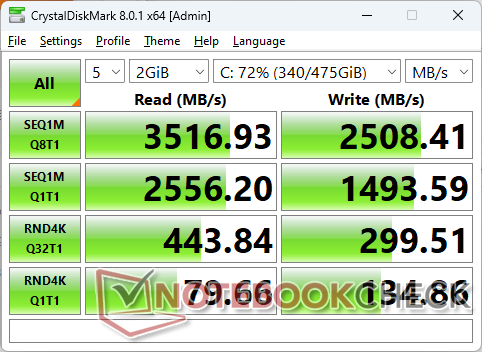
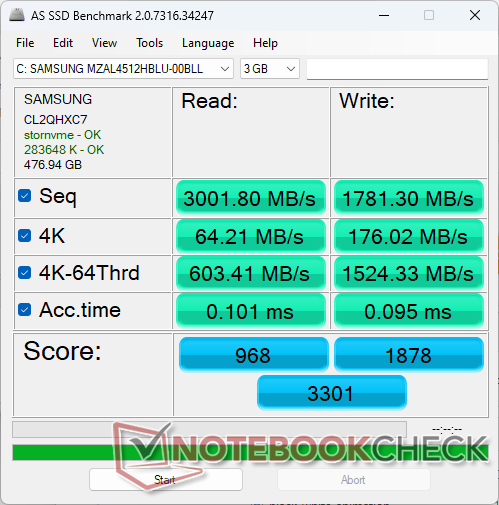
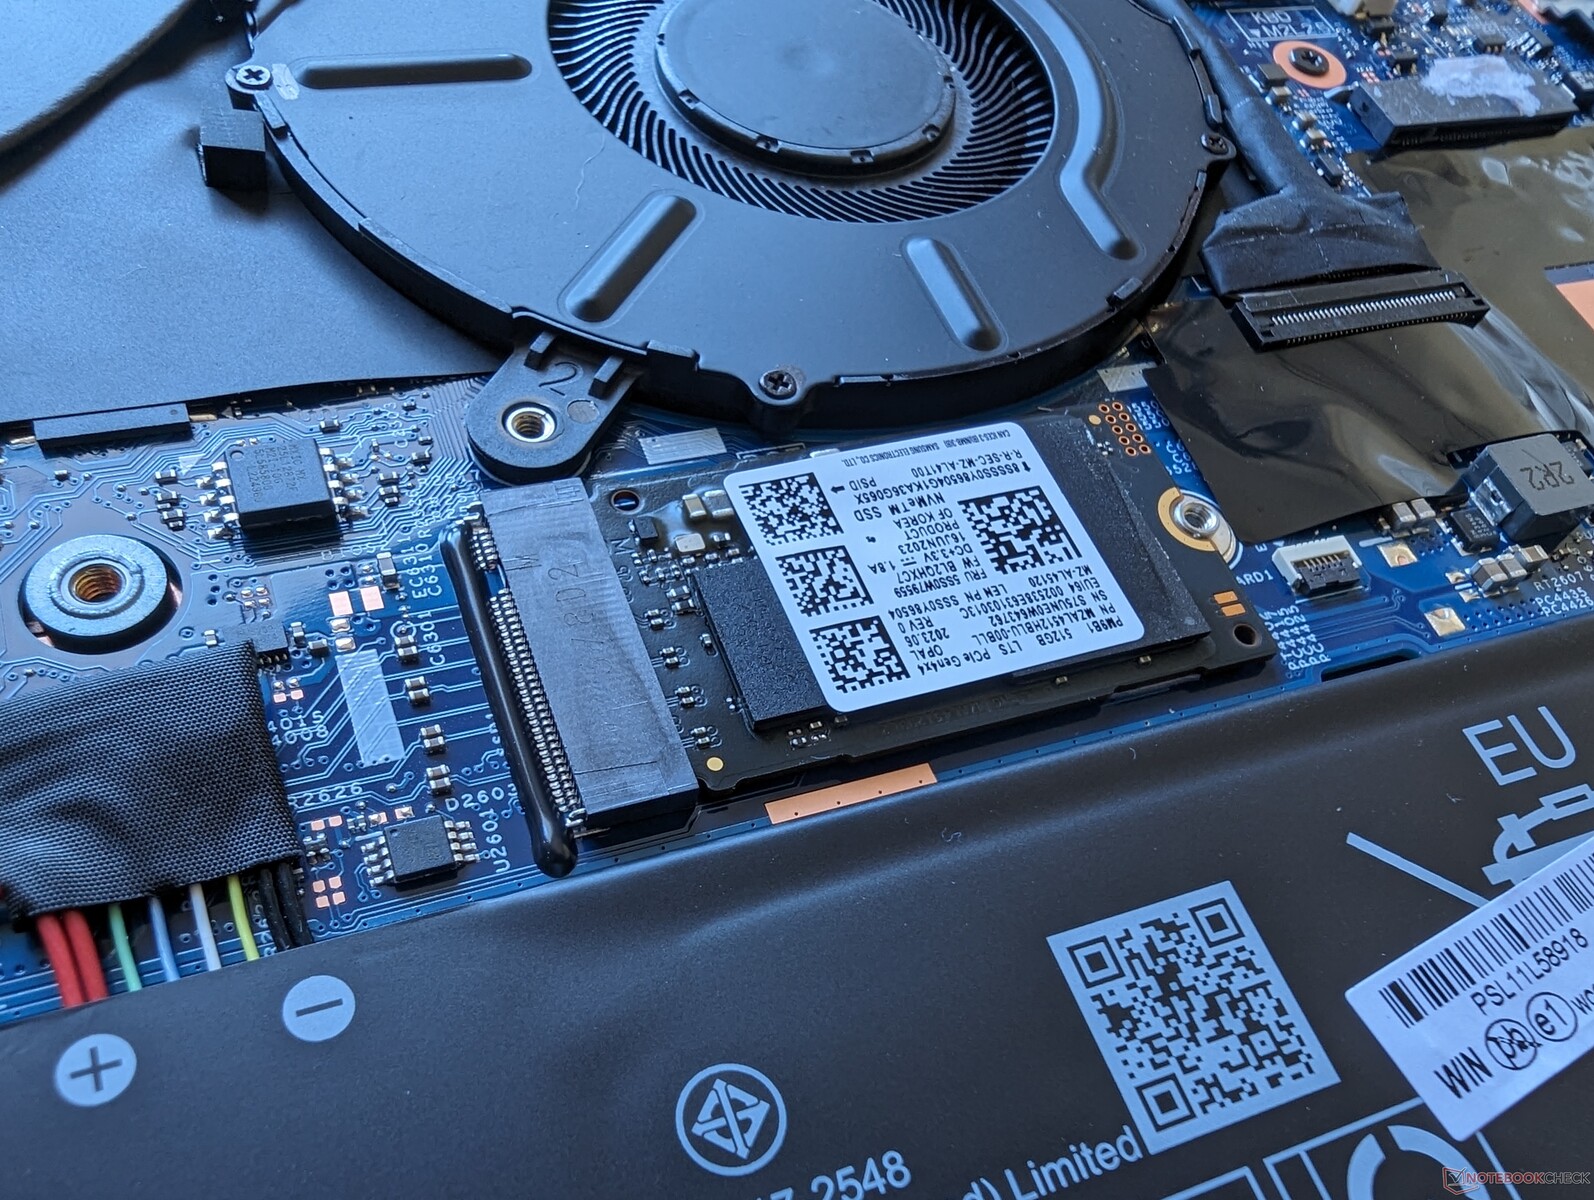
Opslagapparaten
Ons apparaat wordt geleverd met een middenklasse 512 GBSamsung PM9B1 in plaats van de Kioxia BG5 op onze AMD-versie. De overdrachtsnelheden bereiken een top van ongeveer 3600 MB/s voordat de throttling na een paar minuten stress begint, in welk geval de overdrachtsnelheden kunnen oplopen tot 2200 MB/s.

| Drive Performance rating - Percent | |
| HP Elite Dragonfly Folio 13.5 G3 -11! | |
| MSI Summit E13 Flip Evo A11MT | |
| Framework Laptop 13.5 Ryzen 7 7840U -11! | |
| Dell Latitude 9330 | |
| Lenovo ThinkPad L13 Yoga G4 21FSS00100 | |
| Lenovo ThinkPad L13 Yoga G4 i7-1355U | |
* ... kleiner is beter
Disk Throttling: DiskSpd Read Loop, Queue Depth 8
GPU-prestaties
Onze Iris Xe 96 EUs heeft een duidelijk voordeel ten opzichte van deRadeon RX Vega 7 in de Ryzen 5 7530U in DX11- en DX12-toepassingen. 3DMark Fire Strike en Time Spy resultaten zijn bijvoorbeeld 50 tot 60 procent sneller met onze Intel configuratie.
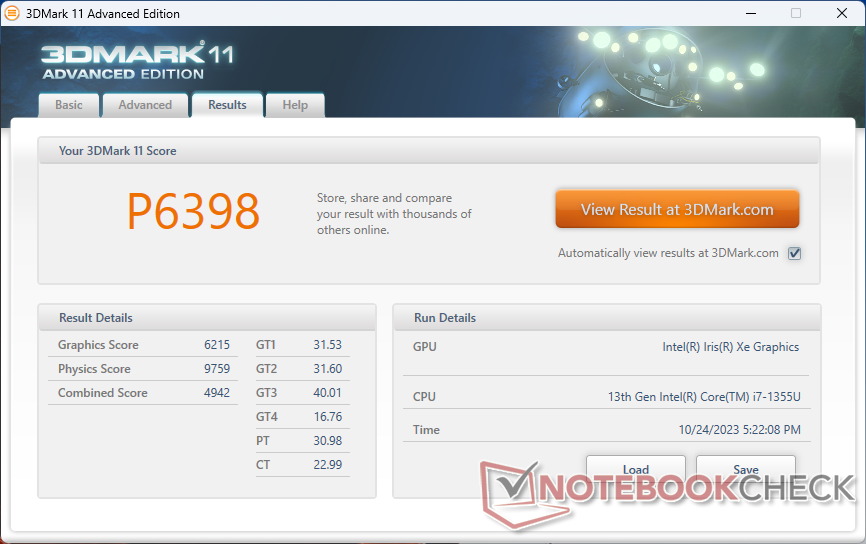
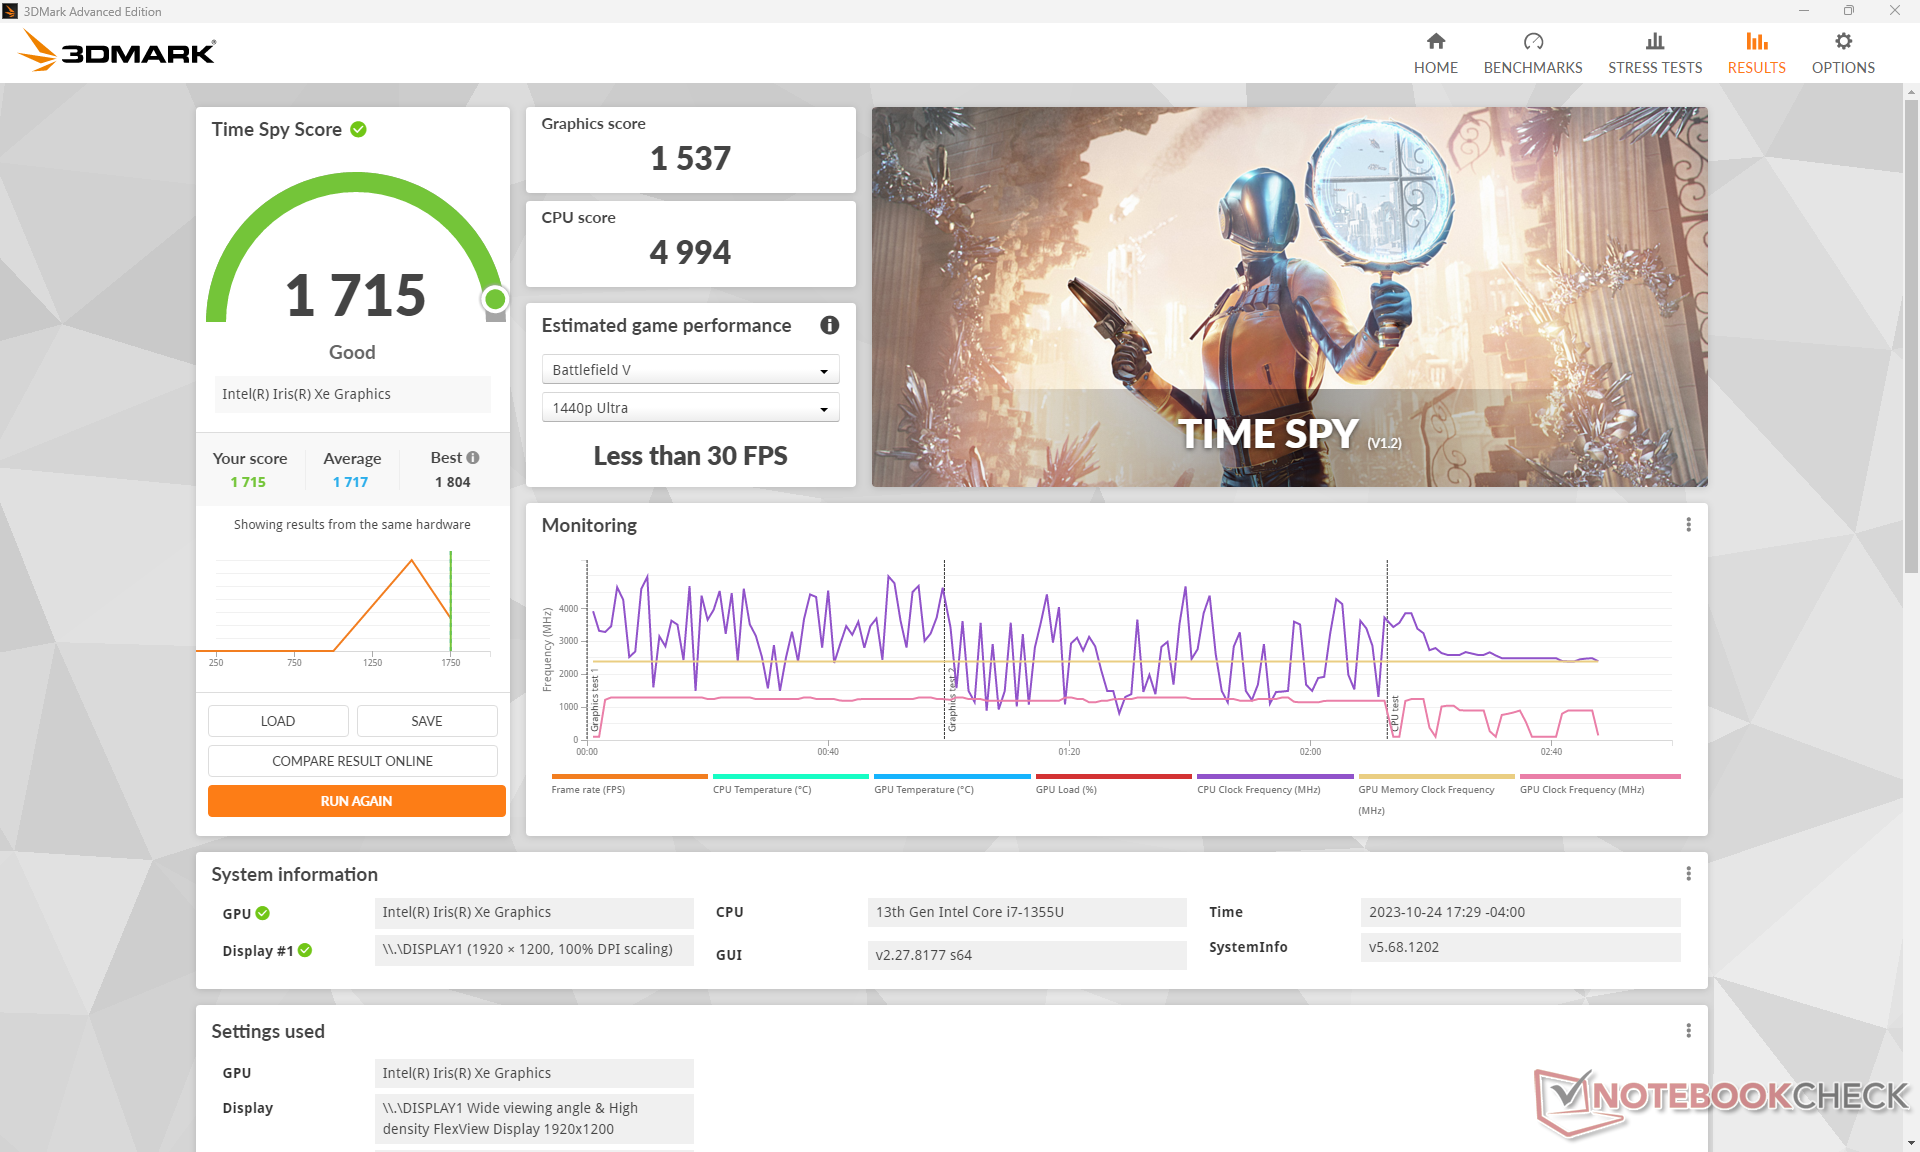
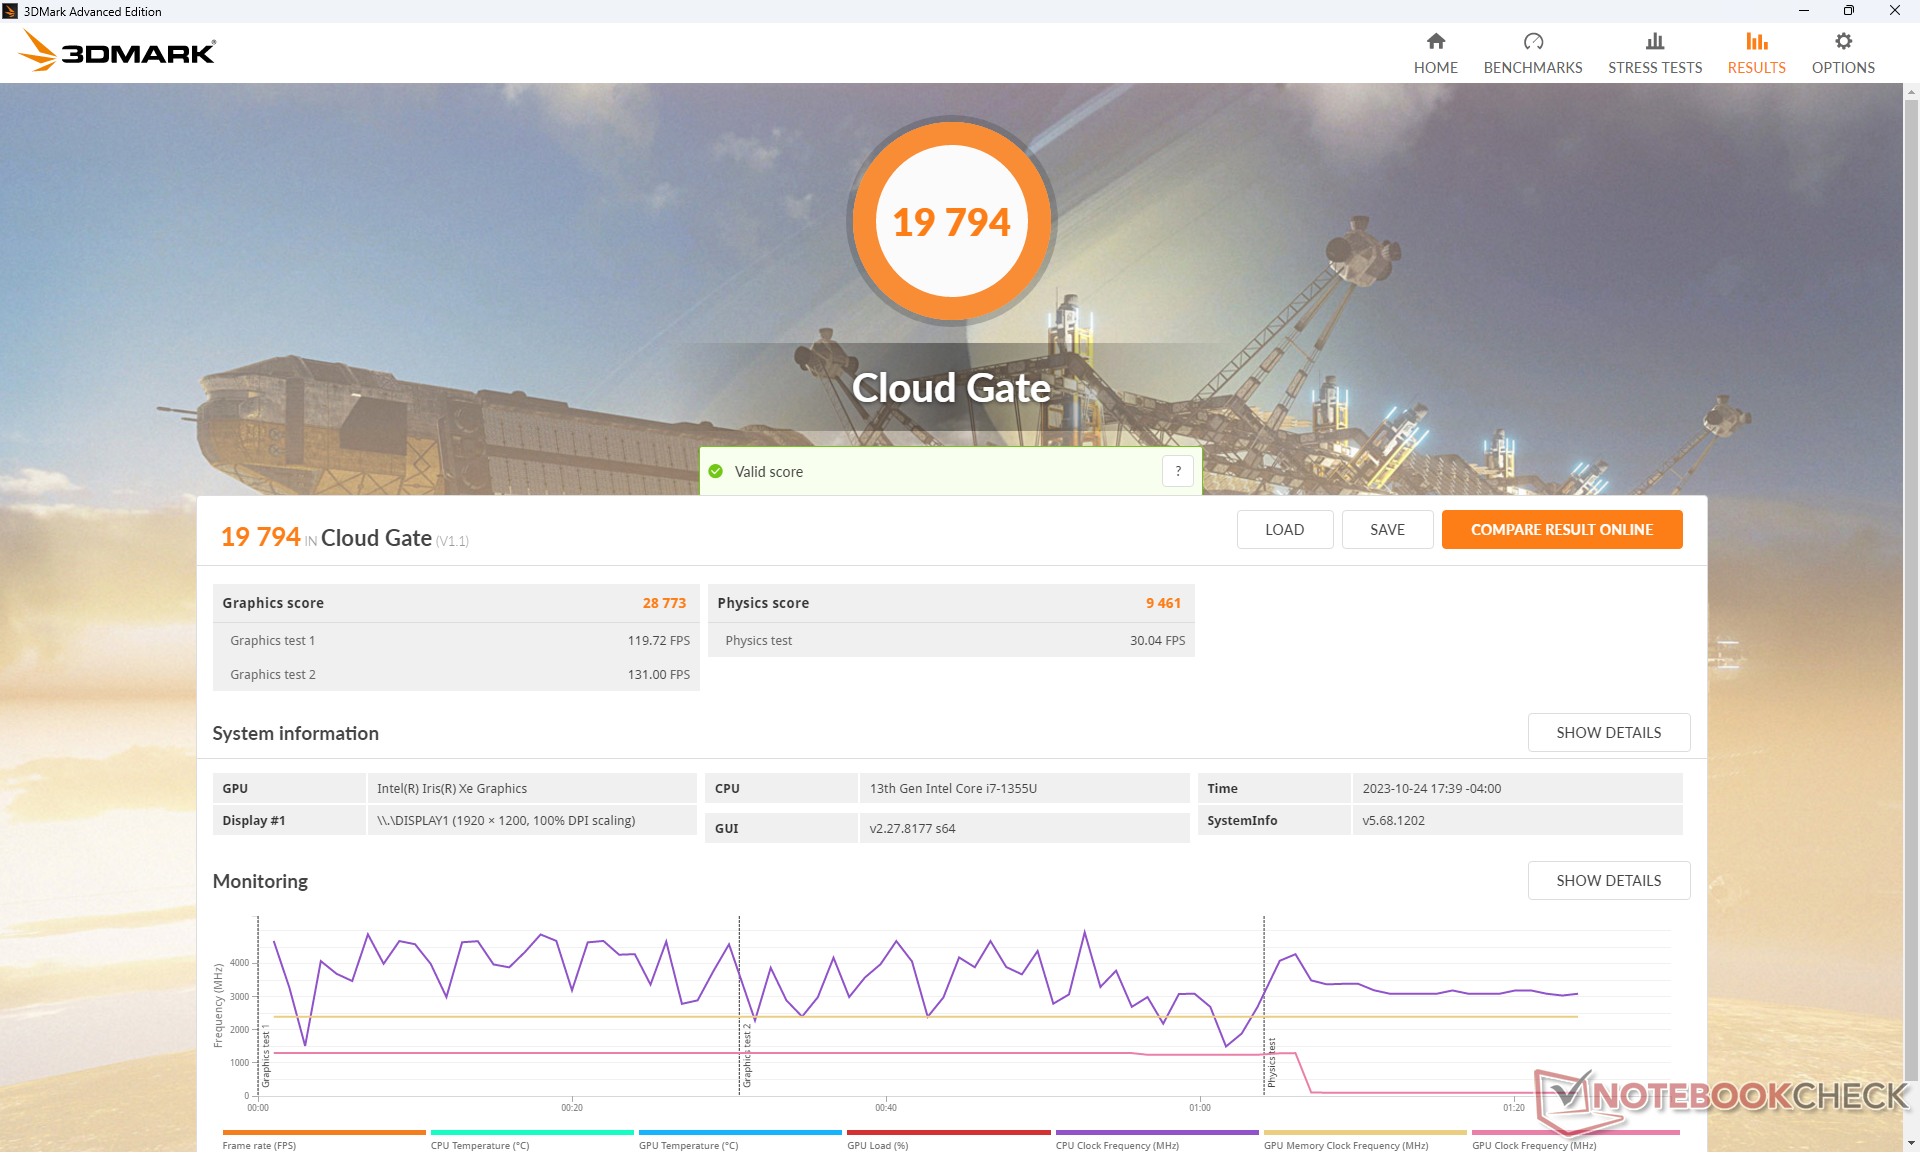
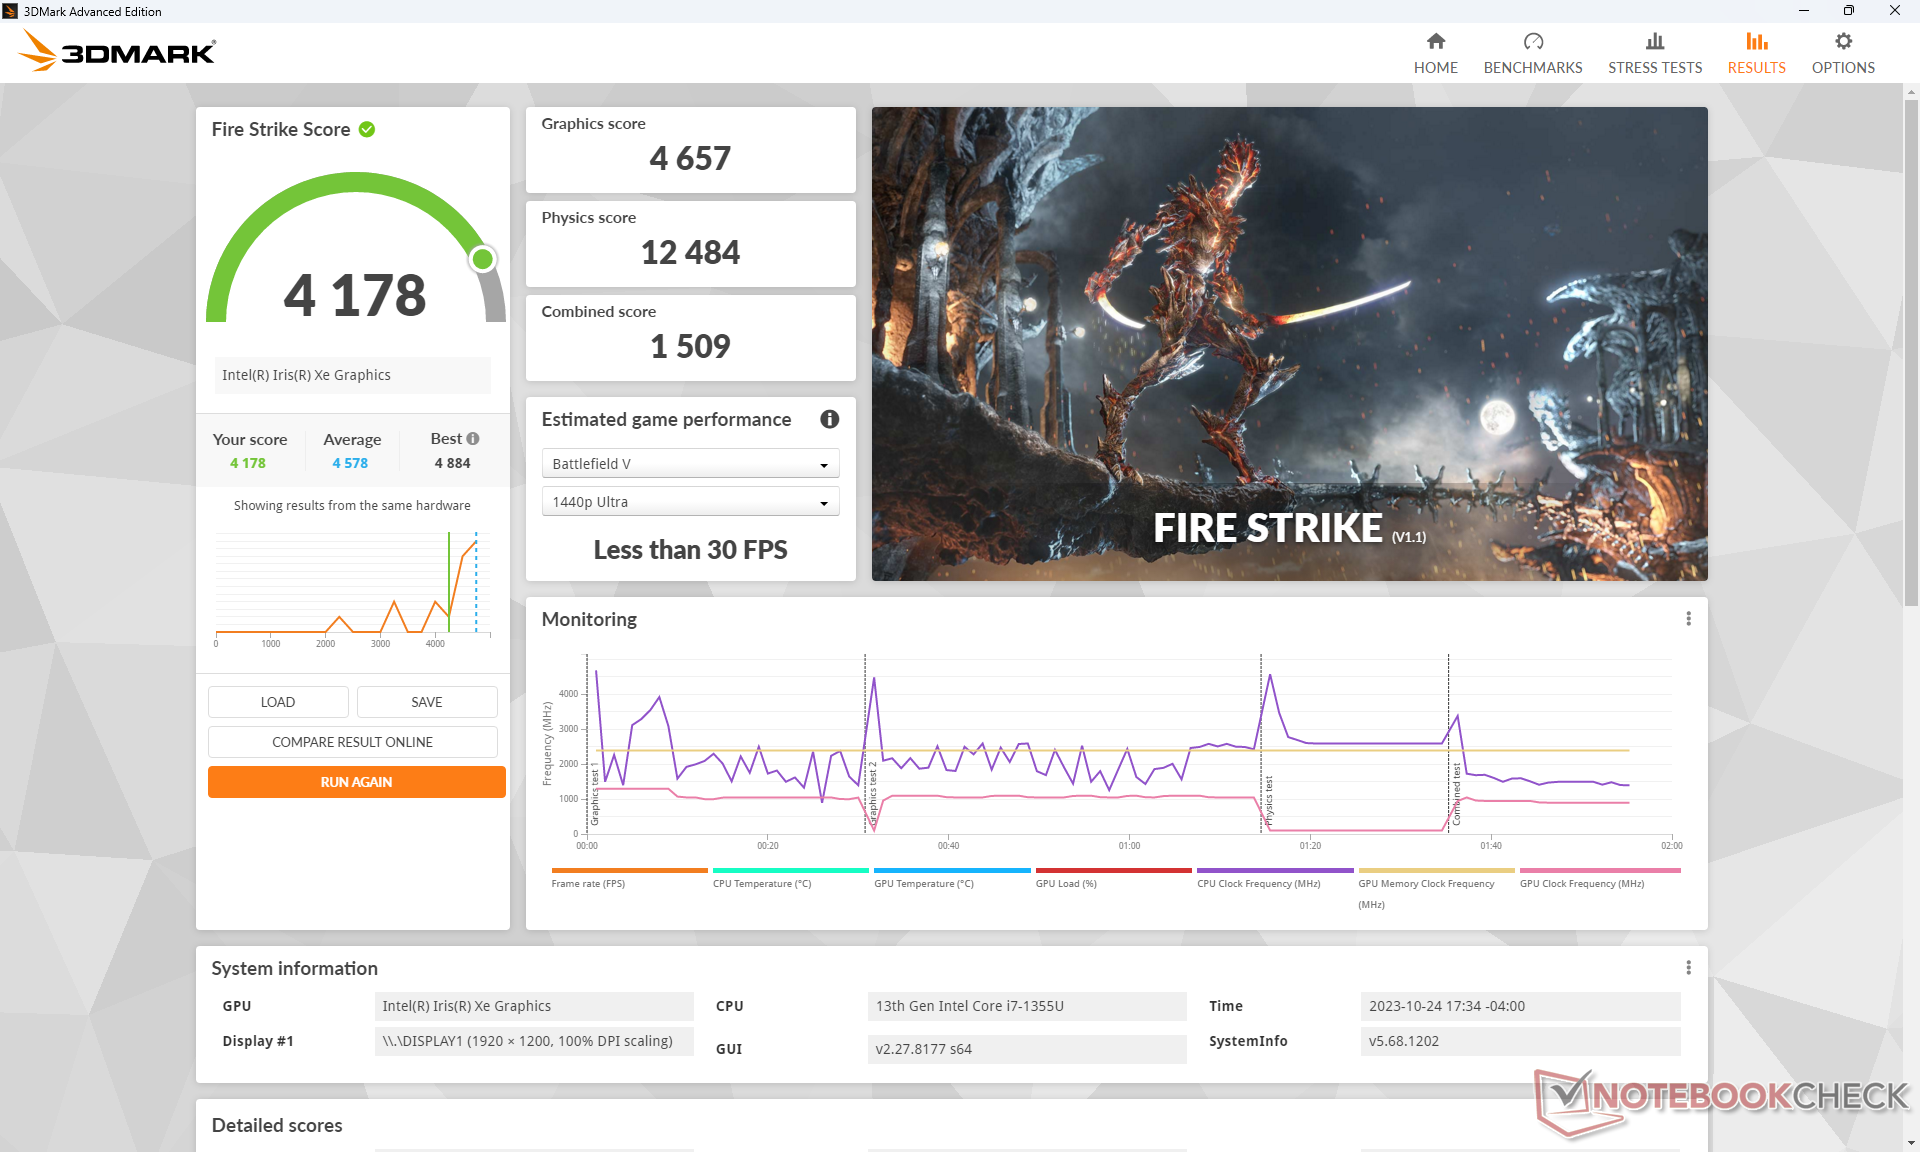
| 3DMark 11 Performance | 6398 punten | |
| 3DMark Cloud Gate Standard Score | 19794 punten | |
| 3DMark Fire Strike Score | 4178 punten | |
| 3DMark Time Spy Score | 1715 punten | |
Help | ||
* ... kleiner is beter
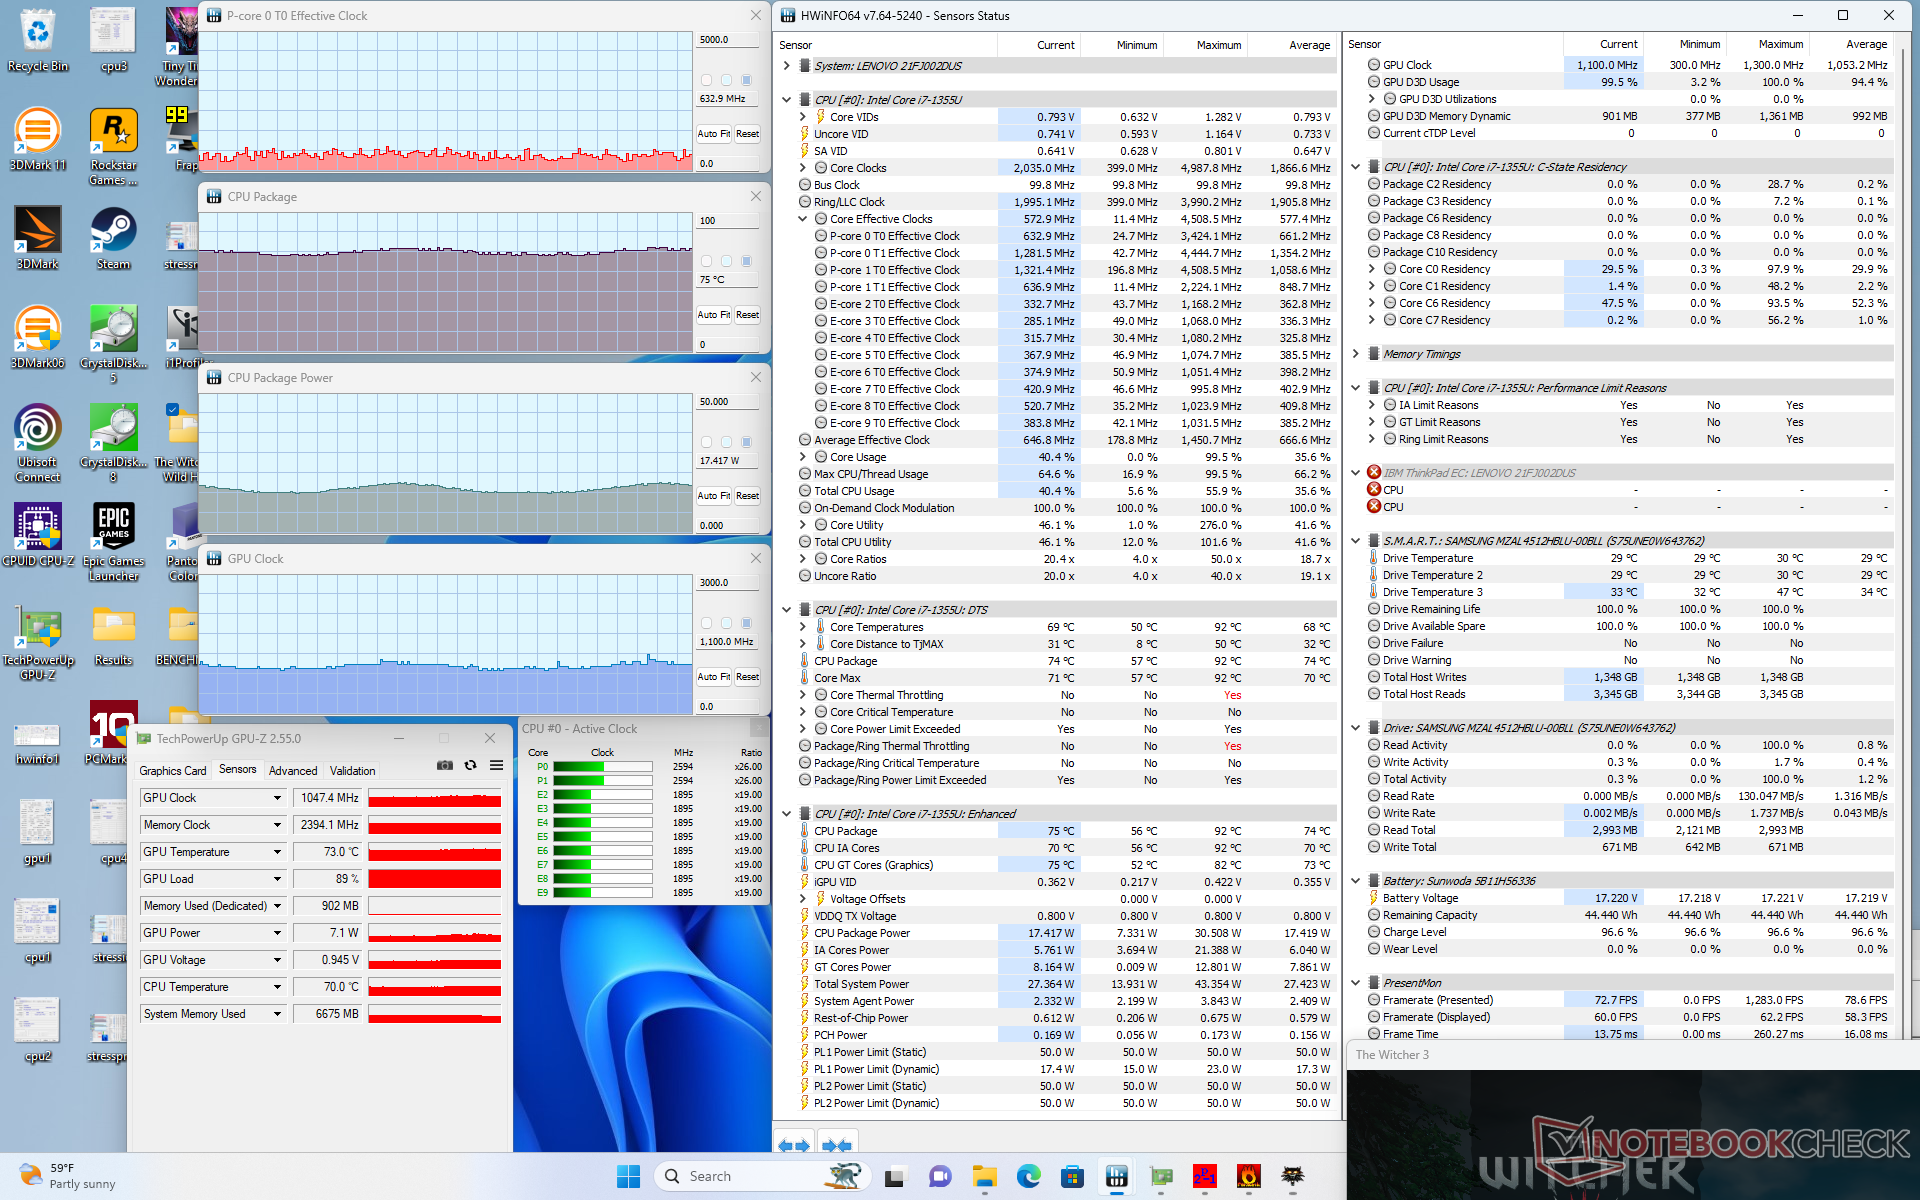
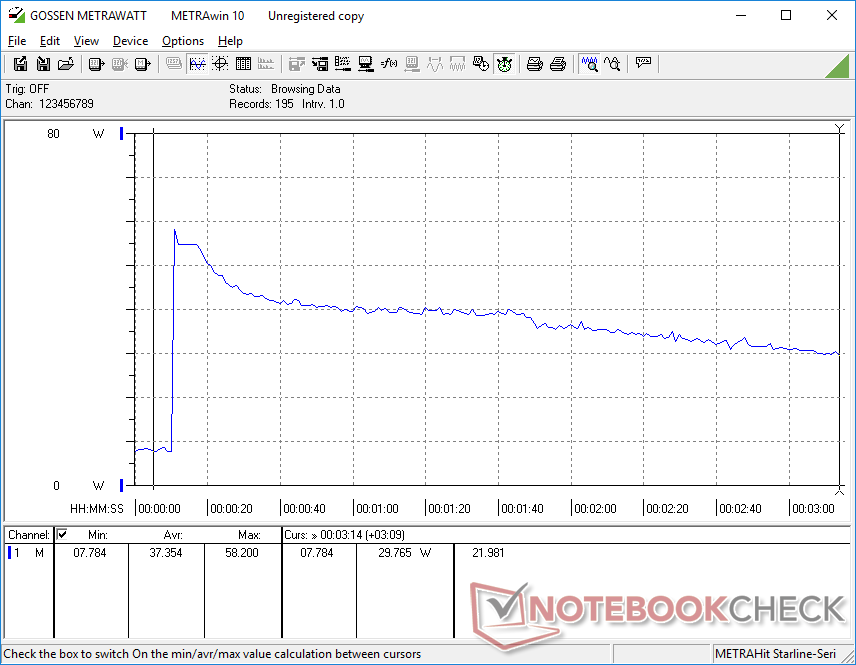
De framerate stabiliteit tijdens het gamen is helaas onregelmatig. Bij stationair draaien op Witcher 3 op lage instellingen, bijvoorbeeld, schommelt de framerate tussen 70 en 85 FPS, zoals de grafiek hieronder laat zien, om fluctuerende kloksnelheden in de loop van de tijd te suggereren. De ThinkPad L13 is gelukkig geen gaming-laptop, dus dit specifieke nadeel zou geen spelbreker moeten zijn voor de doelgroep. Streamtoepassingen draaien nog steeds probleemloos op de machine.
Witcher 3 FPS Chart
| lage | gem. | hoge | ultra | |
|---|---|---|---|---|
| GTA V (2015) | 106.7 | 84.1 | 9.99 | |
| The Witcher 3 (2015) | 92.8 | 56.7 | 31 | 13.8 |
| Dota 2 Reborn (2015) | 94.3 | 65.3 | 52.4 | 46.2 |
| Final Fantasy XV Benchmark (2018) | 36.6 | 20.1 | 15 | |
| X-Plane 11.11 (2018) | 39.8 | 27.3 | 25.1 | |
| Far Cry 5 (2018) | 45 | 24 | 22 | 21 |
| Strange Brigade (2018) | 87.2 | 38.1 | 30.5 | 23 |
| Cyberpunk 2077 1.6 (2022) | 17.8 | |||
| Tiny Tina's Wonderlands (2022) | 23.3 | 17.7 | 10.9 | 8.6 |
| F1 22 (2022) | 45 | 41.1 | 29.8 | 22.6 |
Uitstoot
Systeemgeluid
Het ventilatorgeluid kan luider zijn op de Intel-versie dan op de AMD-versie bij veeleisende belastingen zoals 3DMark, wat kan worden toegeschreven aan de snellere grafische prestaties en het algehele stroomverbruik van de Intel-versie. Verder schommelt het ventilatorgeluid meestal rond de 30 dB(A) wanneer u op het web surft of streamt, zodat het in de meeste kantoor- of conferentieomgevingen gemakkelijk te horen is.
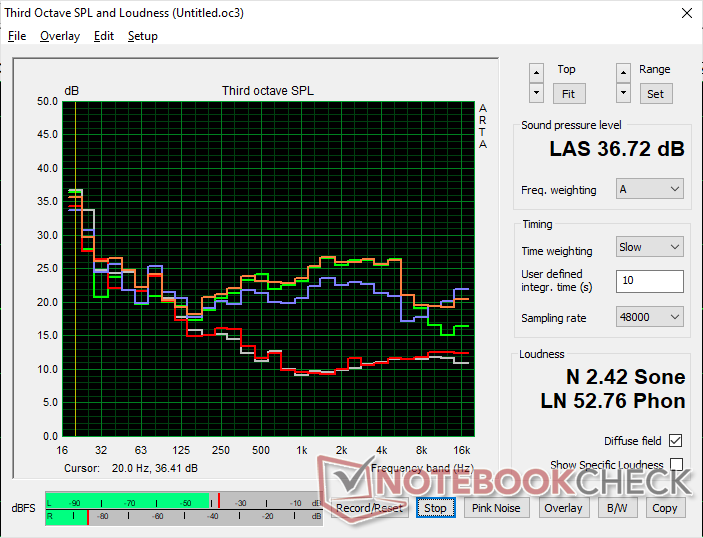
Geluidsniveau
| Onbelast |
| 23.4 / 23.4 / 23.4 dB (A) |
| Belasting |
| 33.9 / 36.9 dB (A) |
 | ||
30 dB stil 40 dB(A) hoorbaar 50 dB(A) luid |
||
min: | ||
| Lenovo ThinkPad L13 Yoga G4 i7-1355U Iris Xe G7 96EUs, i7-1355U, Samsung PM9B1 512GB MZAL4512HBLU | Lenovo ThinkPad L13 Yoga G4 21FSS00100 Vega 7, R5 7530U, Kioxia BG5 KBG5AZNT512G | HP Elite Dragonfly Folio 13.5 G3 Iris Xe G7 96EUs, i7-1265U, Samsung PM9A1 MZVL2512HCJQ | Dell Latitude 9330 Iris Xe G7 96EUs, i7-1260U | MSI Summit E13 Flip Evo A11MT Iris Xe G7 96EUs, i7-1185G7, Phison 1TB SM2801T24GKBB4S-E162 | Framework Laptop 13.5 Ryzen 7 7840U Radeon 780M, R7 7840U, WD PC SN740 512GB SDDPNQD-512G | |
|---|---|---|---|---|---|---|
| Noise | 9% | 2% | -4% | -12% | -9% | |
| uit / omgeving * (dB) | 23.1 | 23.4 -1% | 24.6 -6% | 23 -0% | 24.5 -6% | 22.6 2% |
| Idle Minimum * (dB) | 23.4 | 23.4 -0% | 24.6 -5% | 23 2% | 24.7 -6% | 22.6 3% |
| Idle Average * (dB) | 23.4 | 23.4 -0% | 24.6 -5% | 23.1 1% | 24.7 -6% | 22.6 3% |
| Idle Maximum * (dB) | 23.4 | 23.4 -0% | 24.6 -5% | 23.1 1% | 26.4 -13% | 24.2 -3% |
| Load Average * (dB) | 33.9 | 24 29% | 27.8 18% | 37.1 -9% | 37.8 -12% | 35.8 -6% |
| Witcher 3 ultra * (dB) | 36.9 | 30.8 17% | 33.4 9% | 40.6 -10% | 41.4 -12% | 46.5 -26% |
| Load Maximum * (dB) | 36.9 | 30.1 18% | 33.4 9% | 40.5 -10% | 48.8 -32% | 48.9 -33% |
* ... kleiner is beter
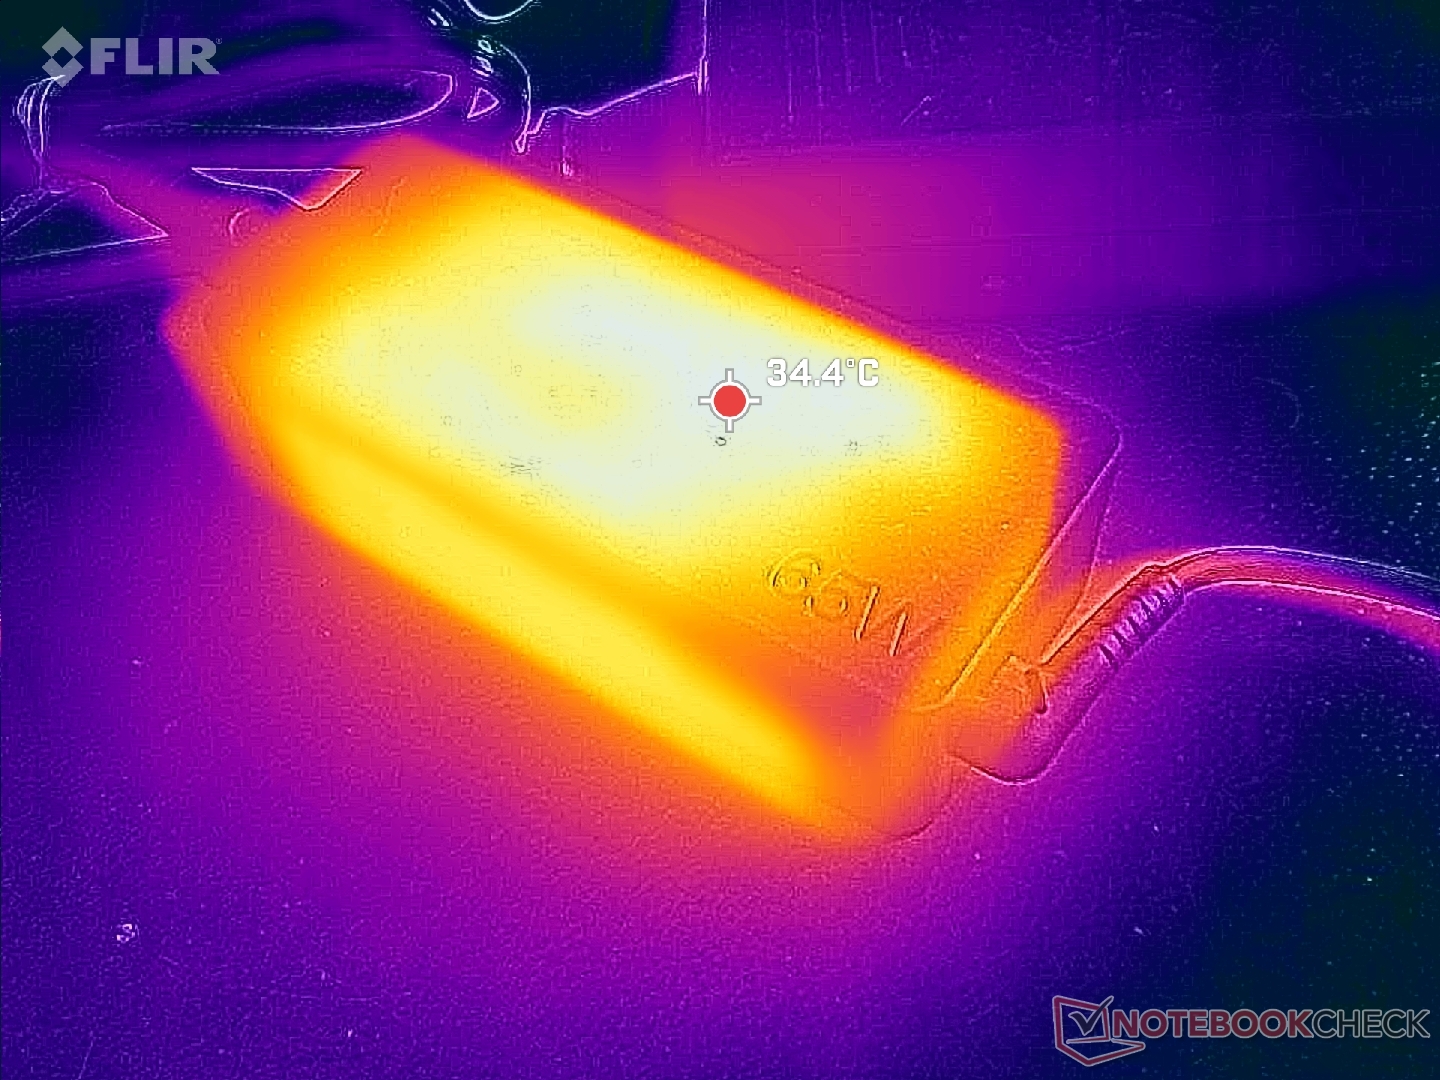
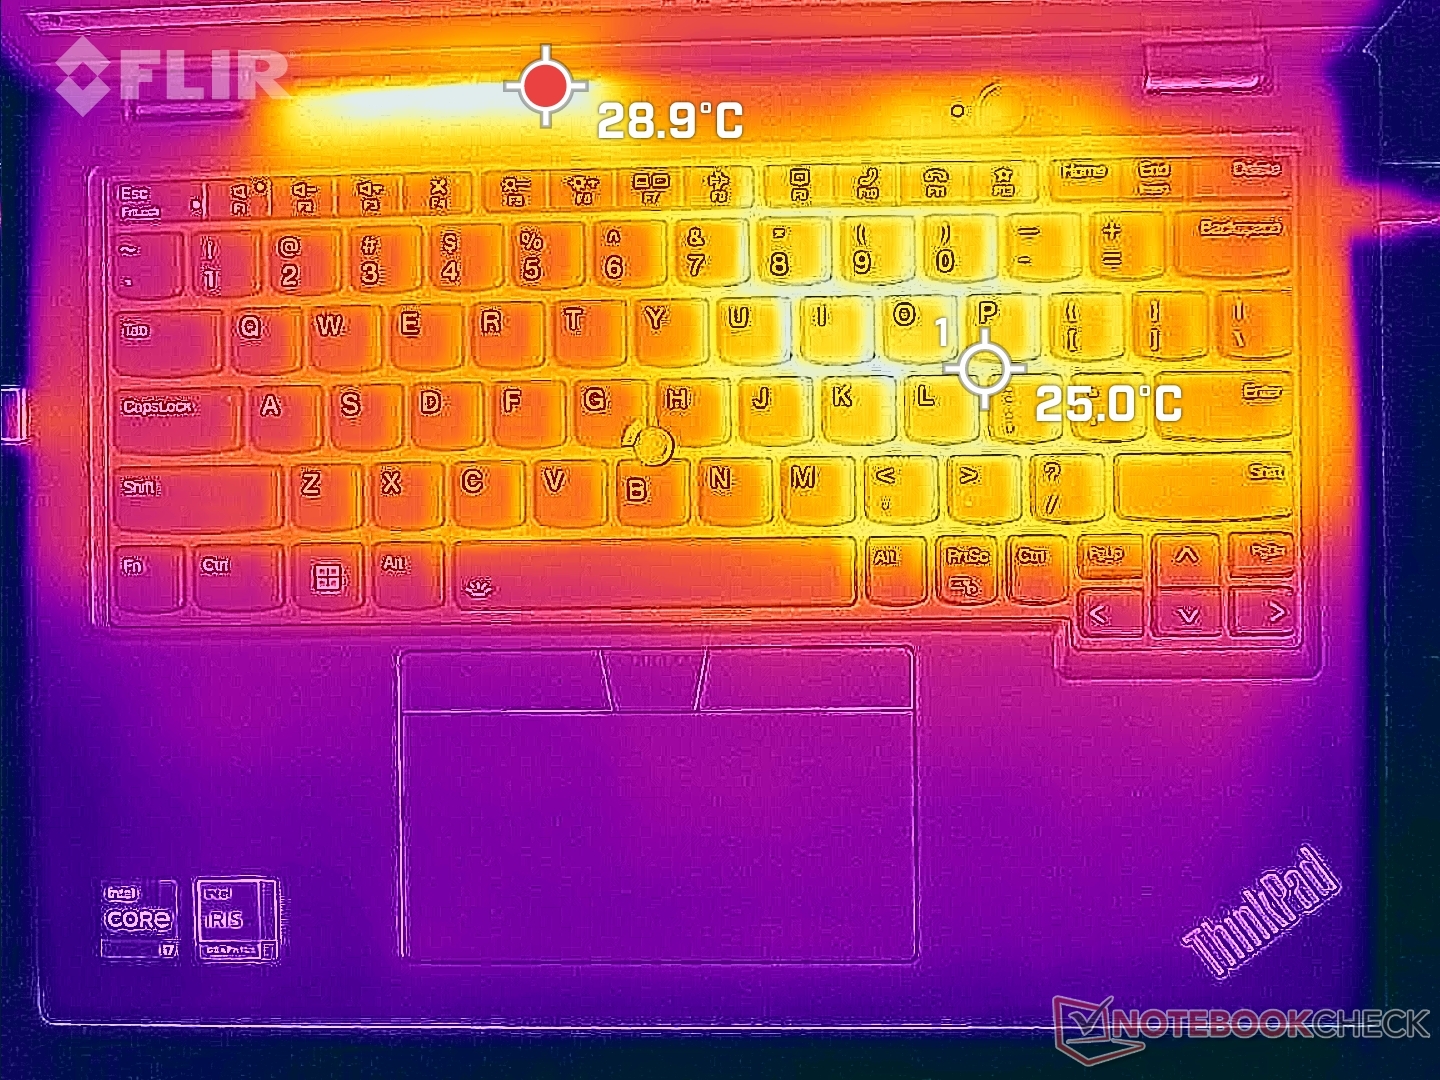
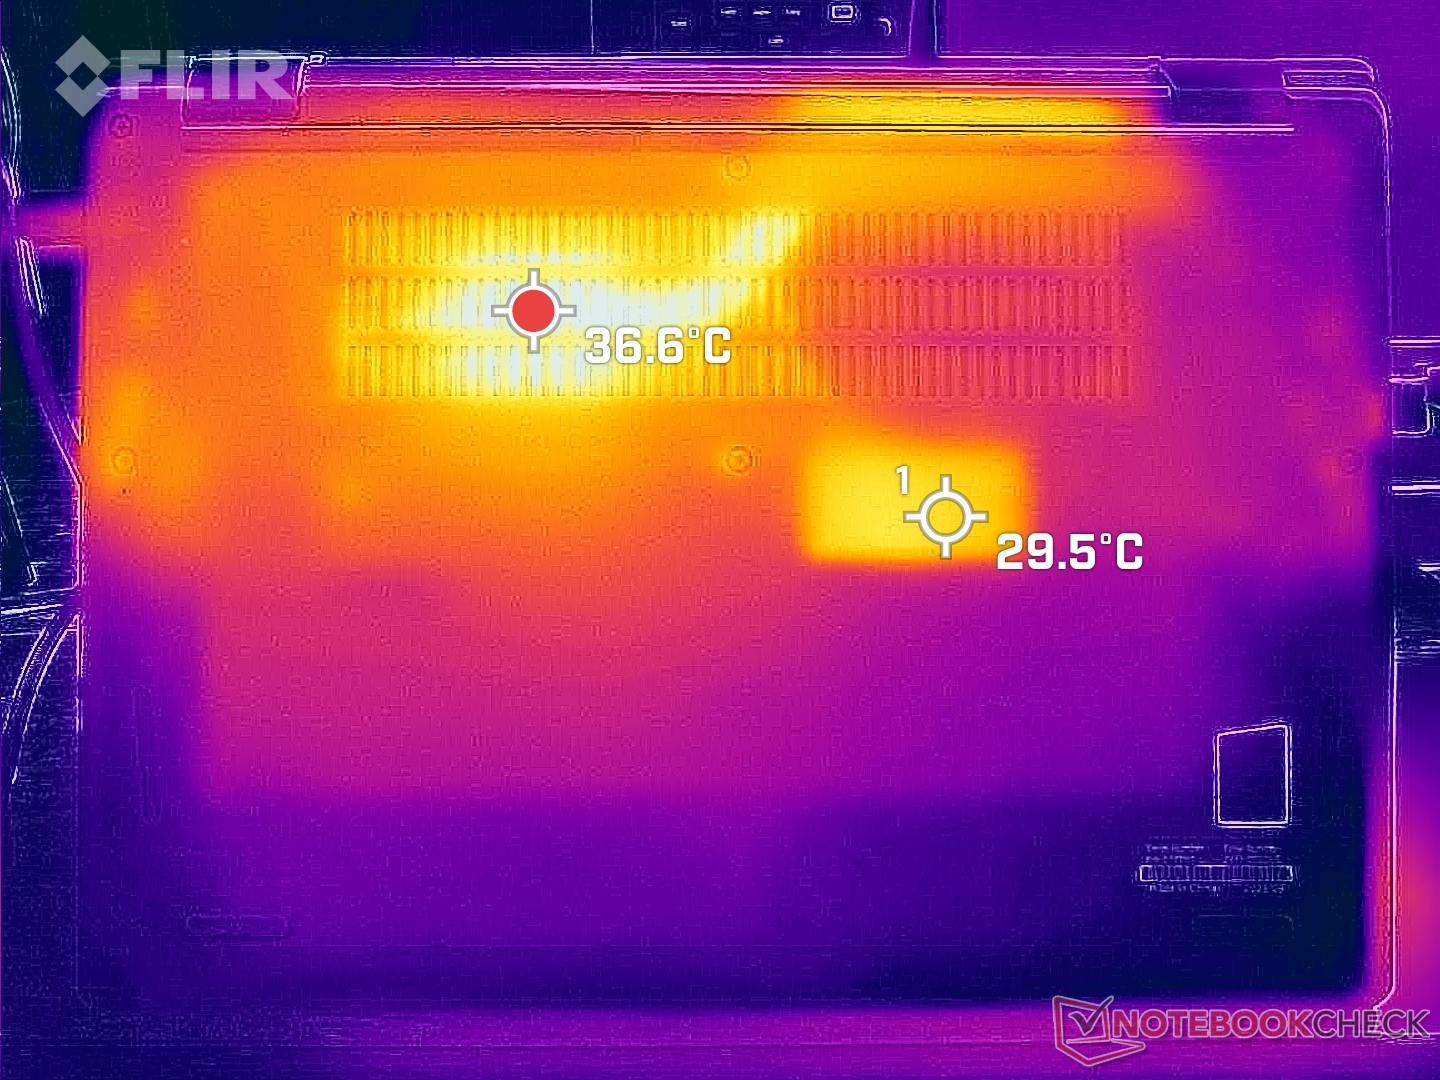
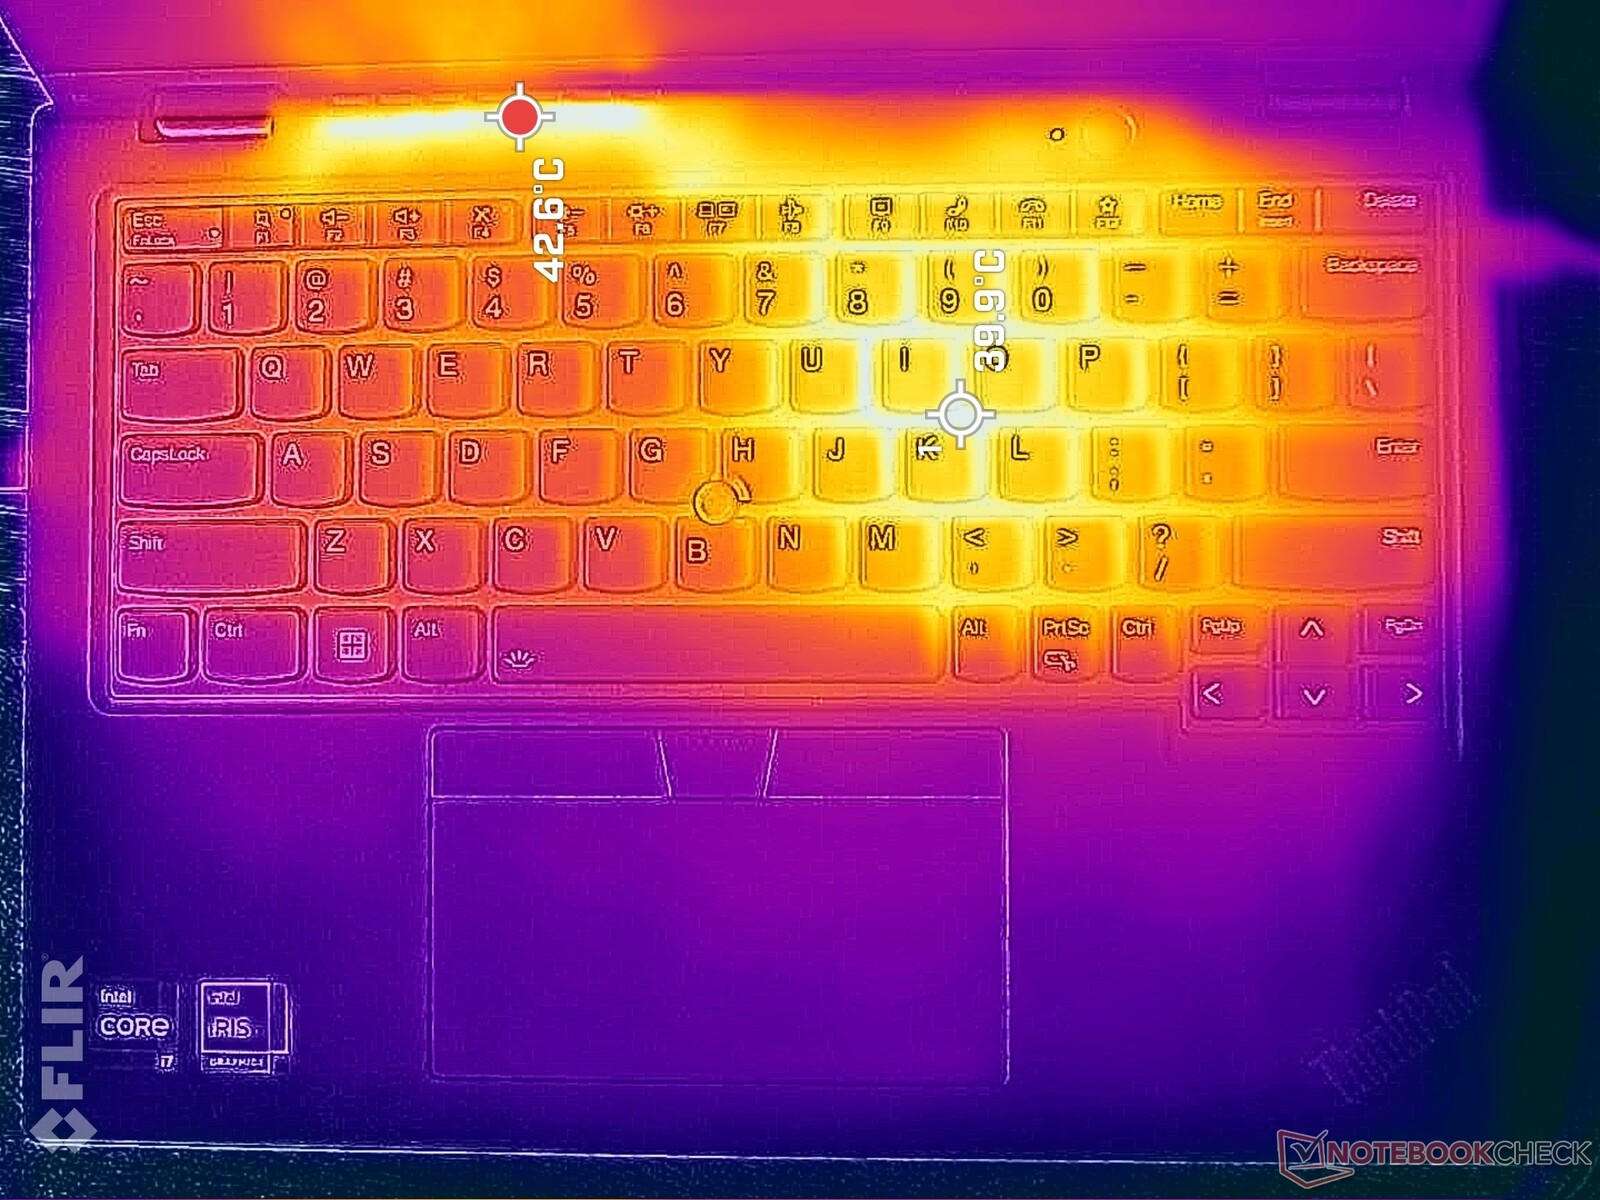
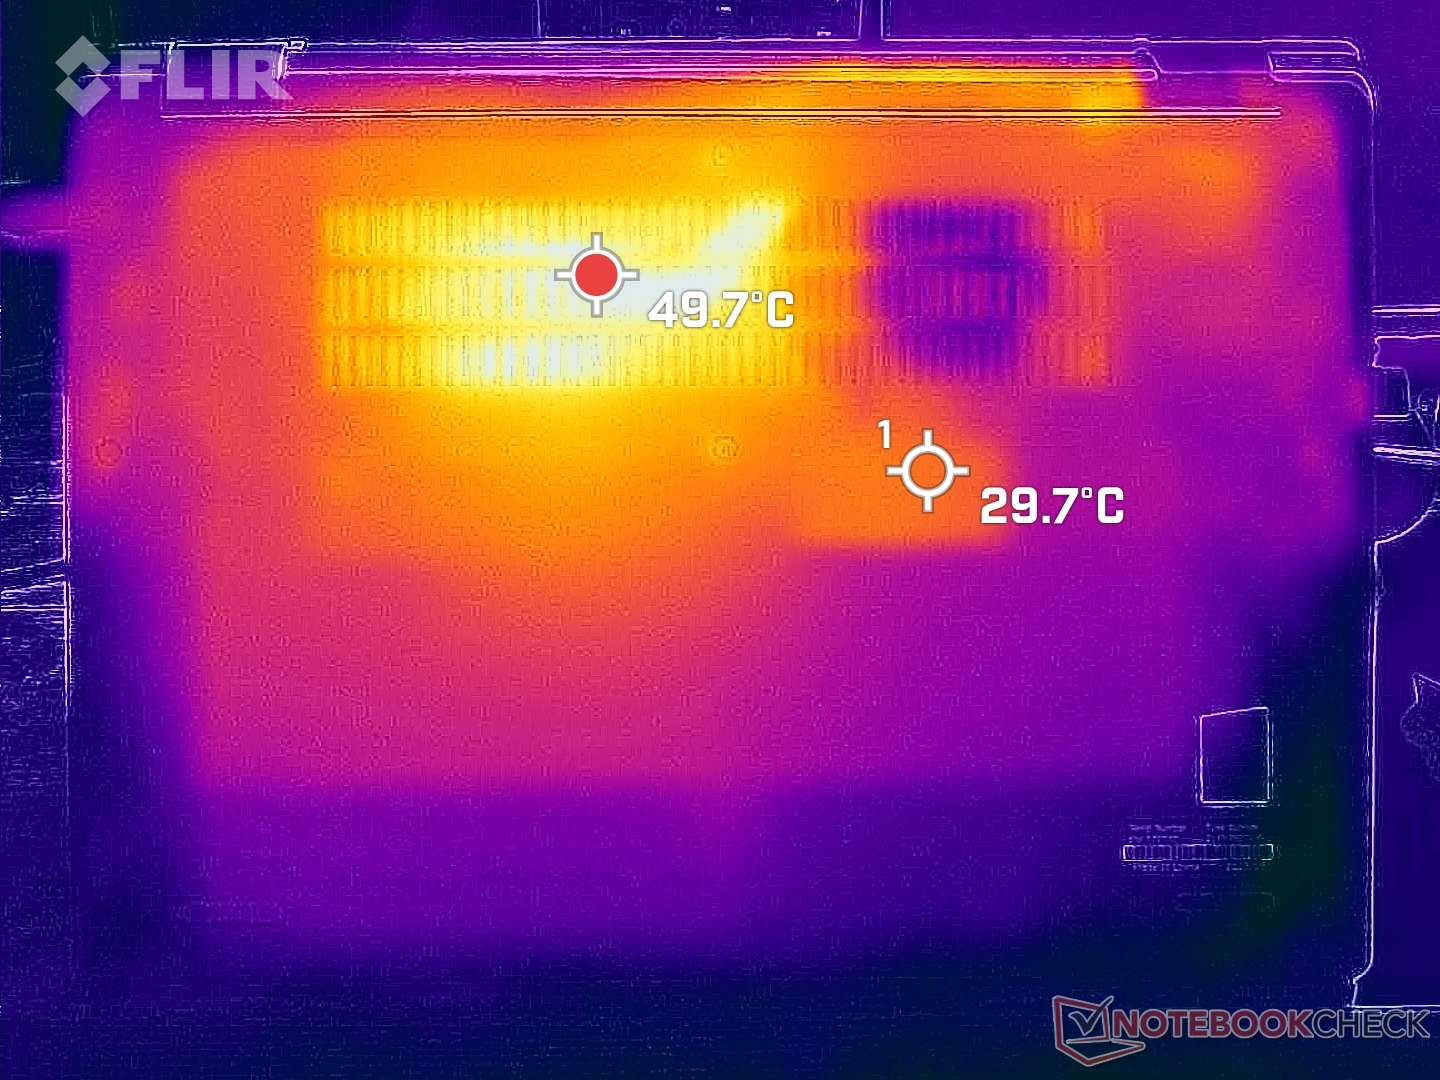
Temperatuur
Hete plekken kunnen oplopen tot 40 C aan de rechterkant van het toetsenbord, vergelijkbaar met wat we vaststelden op de AMD-configuratie. Het Intel-toestel werkt dus niet significant koeler of warmer, ondanks de prestatieverschillen.
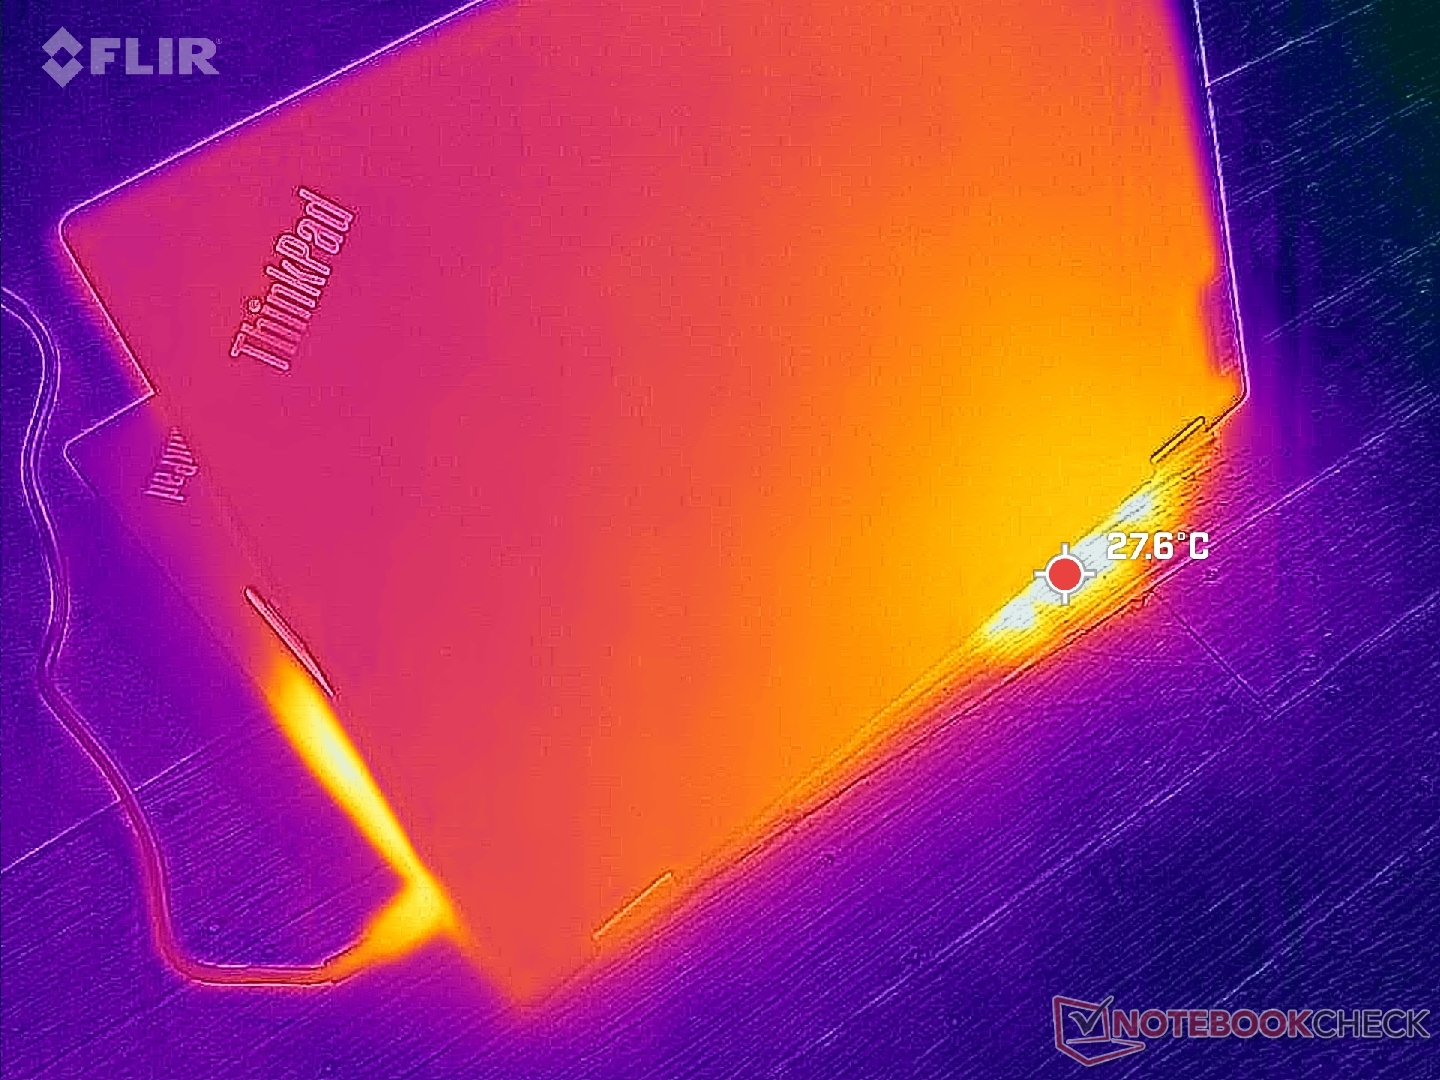
(+) De maximumtemperatuur aan de bovenzijde bedraagt 38.4 °C / 101 F, vergeleken met het gemiddelde van 35.4 °C / 96 F, variërend van 19.6 tot 60 °C voor de klasse Convertible.
(-) De bodem warmt op tot een maximum van 46 °C / 115 F, vergeleken met een gemiddelde van 36.9 °C / 98 F
(+) Bij onbelast gebruik bedraagt de gemiddelde temperatuur voor de bovenzijde 27.2 °C / 81 F, vergeleken met het apparaatgemiddelde van 30.3 °C / 87 F.
(+) De palmsteunen en het touchpad zijn met een maximum van ###max## °C / 74.5 F koeler dan de huidtemperatuur en voelen daarom koel aan.
(+) De gemiddelde temperatuur van de handpalmsteun van soortgelijke toestellen bedroeg 28 °C / 82.4 F (+4.4 °C / 7.9 F).
| Lenovo ThinkPad L13 Yoga G4 i7-1355U Intel Core i7-1355U, Intel Iris Xe Graphics G7 96EUs | Lenovo ThinkPad L13 Yoga G4 21FSS00100 AMD Ryzen 5 7530U, AMD Radeon RX Vega 7 | HP Elite Dragonfly Folio 13.5 G3 Intel Core i7-1265U, Intel Iris Xe Graphics G7 96EUs | Dell Latitude 9330 Intel Core i7-1260U, Intel Iris Xe Graphics G7 96EUs | MSI Summit E13 Flip Evo A11MT Intel Core i7-1185G7, Intel Iris Xe Graphics G7 96EUs | Framework Laptop 13.5 Ryzen 7 7840U AMD Ryzen 7 7840U, AMD Radeon 780M | |
|---|---|---|---|---|---|---|
| Heat | -3% | 23% | 7% | -14% | 3% | |
| Maximum Upper Side * (°C) | 38.4 | 43.3 -13% | 32.8 15% | 40.6 -6% | 52 -35% | 42 -9% |
| Maximum Bottom * (°C) | 46 | 46.5 -1% | 33.4 27% | 50.2 -9% | 57.4 -25% | 47.4 -3% |
| Idle Upper Side * (°C) | 31.2 | 31.9 -2% | 24.6 21% | 25 20% | 30.4 3% | 28.8 8% |
| Idle Bottom * (°C) | 34.8 | 33.1 5% | 24.6 29% | 27.6 21% | 34.2 2% | 29.6 15% |
* ... kleiner is beter
Stresstest
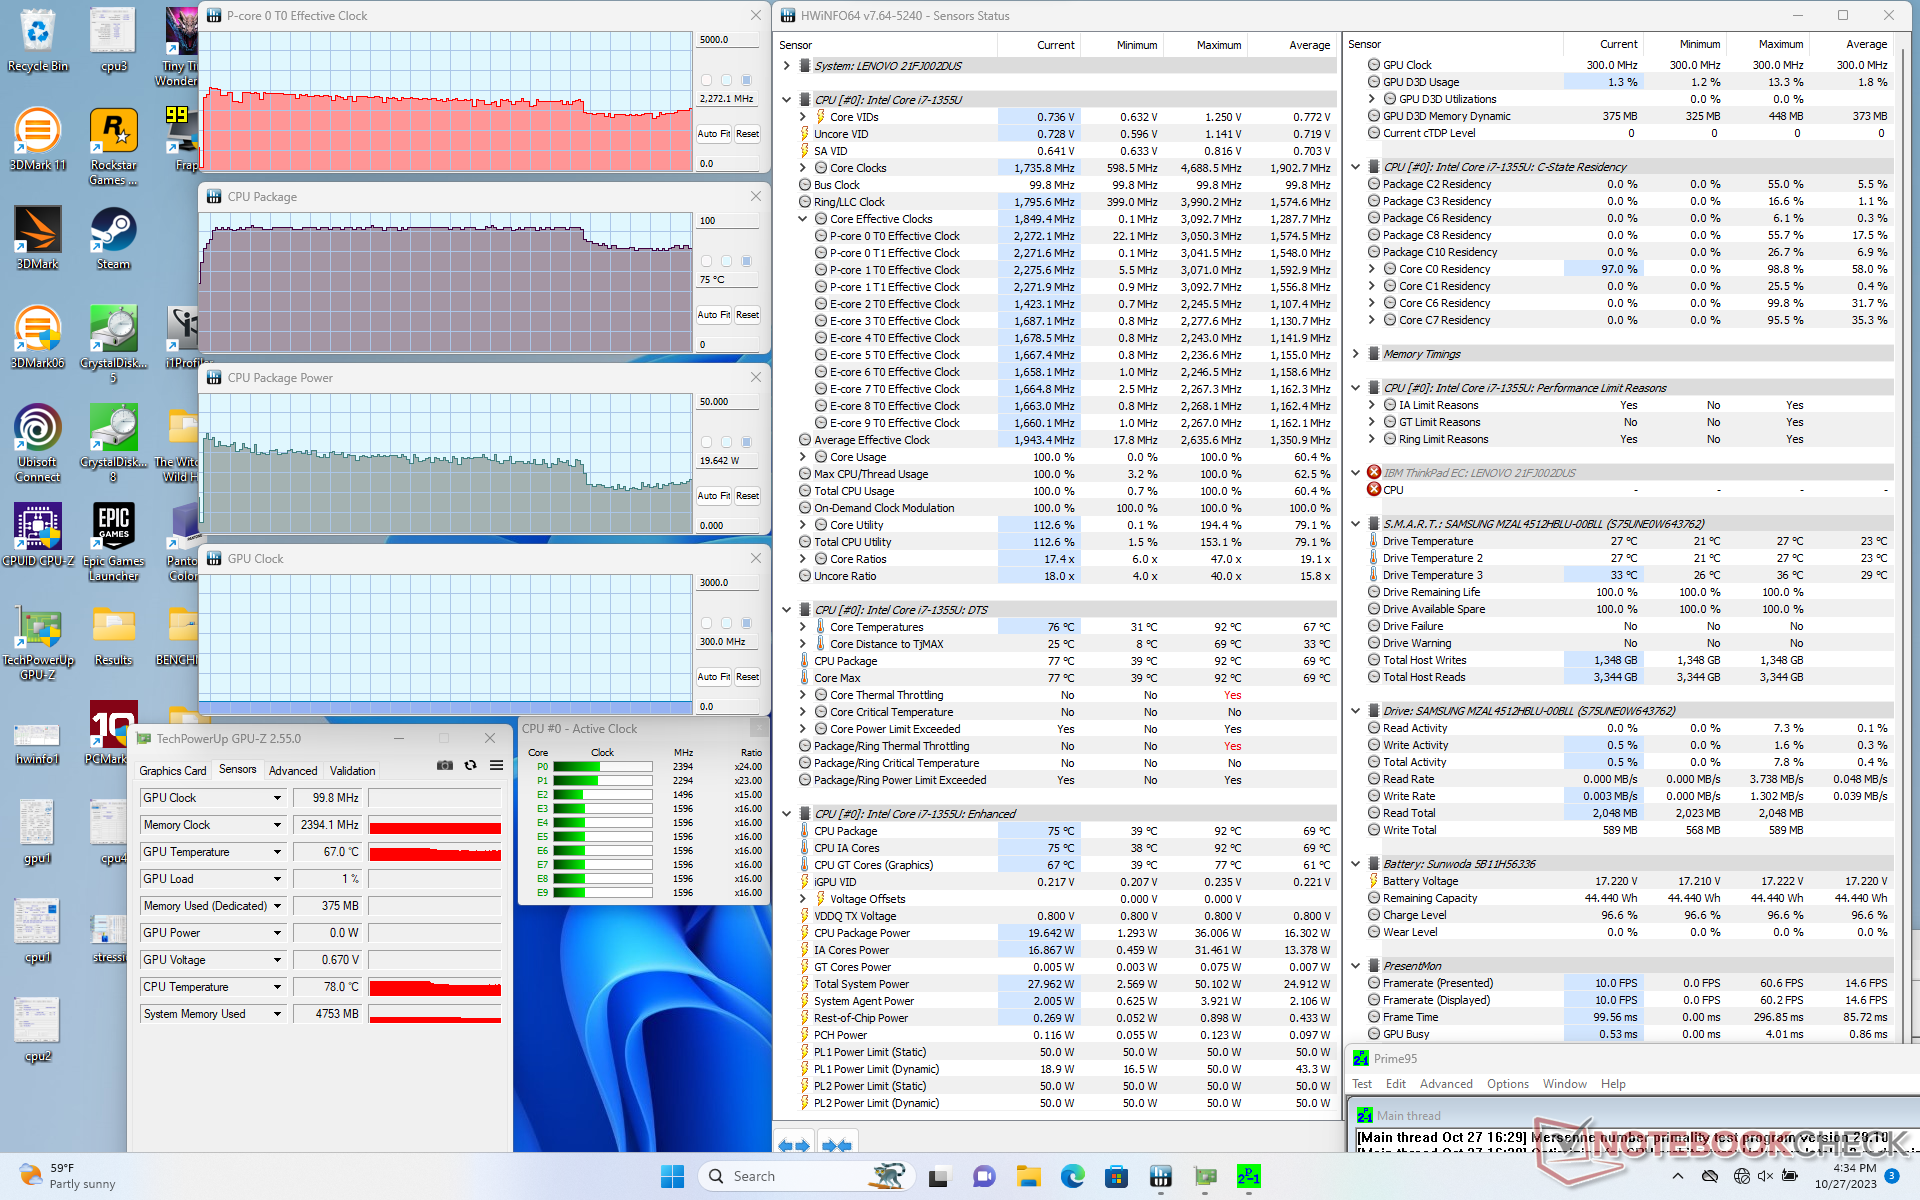
Bij het starten van Prime95 stress, steeg de CPU alleen de eerste paar seconden naar 3 GHz, 89 C en 35 W, voordat hij gestaag daalde en zich stabiliseerde op 2,2 GHz, 75 C en 19 W. Dit gedrag komt overeen met onze CineBench R15 xT observaties hierboven, waar de prestaties het hoogst waren aan het begin van de test en daarna afnamen.
GPU kloksnelheden tijdens het uitvoeren Witcher 3 schommelden tussen 950 en 1150 MHz, wat bijdraagt aan de hierboven genoemde cyclische framerates.
| CPU-klok (GHz) | GPU-klok (MHz) | Gemiddelde CPU-temperatuur (°C) | |
| Inactief systeem | -- | -- | 36 |
| Prime95 Stress | 2.2 | -- | 75 |
| Prime95 + FurMark Stress | 1.0 - 1.5 | 550 - 850 | 68 - 79 |
| Witcher 3 Spanning | ~0.6 | 950 - 1150 | 75 |
Luidsprekers
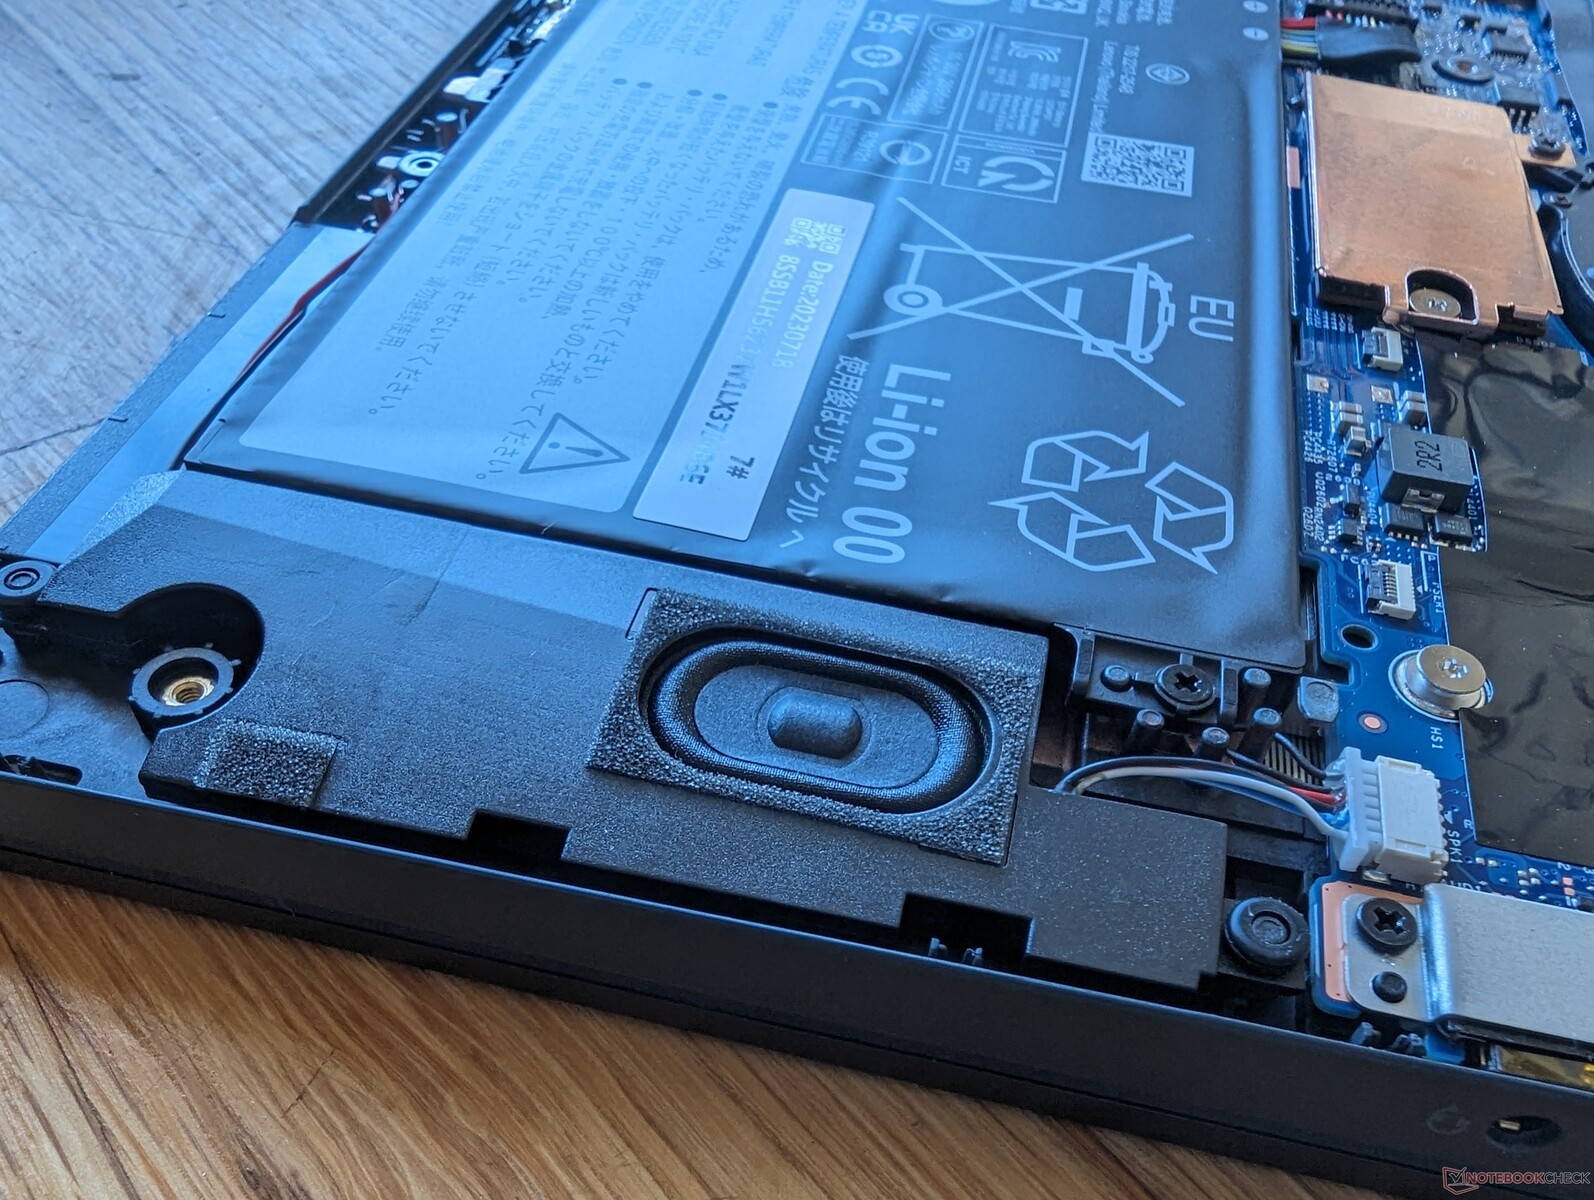
Lenovo ThinkPad L13 Yoga G4 i7-1355U audioanalyse
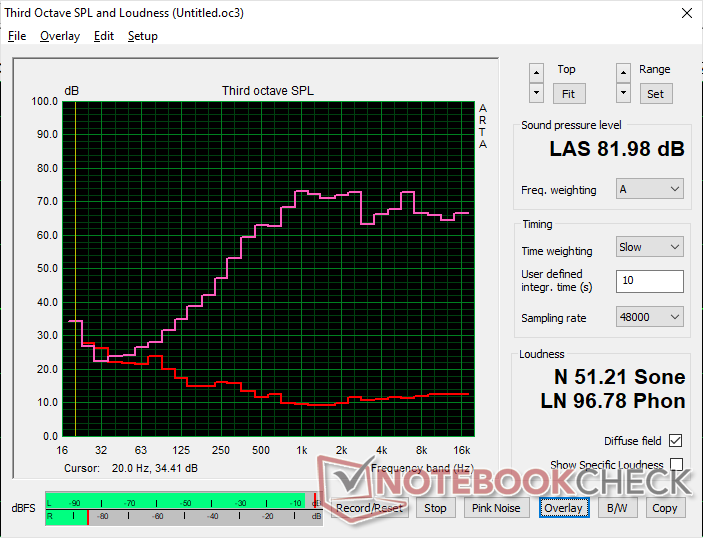
(+) | luidsprekers kunnen relatief luid spelen (82 dB)
Bas 100 - 315 Hz
(-) | bijna geen lage tonen - gemiddeld 24.7% lager dan de mediaan
(±) | lineariteit van de lage tonen is gemiddeld (7.7% delta ten opzichte van de vorige frequentie)
Midden 400 - 2000 Hz
(+) | evenwichtige middens - slechts 4.9% verwijderd van de mediaan
(+) | de middentonen zijn lineair (5.4% delta ten opzichte van de vorige frequentie)
Hoog 2 - 16 kHz
(+) | evenwichtige hoogtepunten - slechts 2.7% verwijderd van de mediaan
(±) | lineariteit van de hoogtepunten is gemiddeld (7% delta ten opzichte van de vorige frequentie)
Algemeen 100 - 16.000 Hz
(±) | lineariteit van het totale geluid is gemiddeld (17.7% verschil met de mediaan)
Vergeleken met dezelfde klasse
» 35% van alle geteste apparaten in deze klasse waren beter, 9% vergelijkbaar, 55% slechter
» De beste had een delta van 6%, het gemiddelde was 20%, de slechtste was 57%
Vergeleken met alle geteste toestellen
» 35% van alle geteste apparaten waren beter, 8% gelijk, 57% slechter
» De beste had een delta van 4%, het gemiddelde was 23%, de slechtste was 134%
Apple MacBook Pro 16 2021 M1 Pro audioanalyse
(+) | luidsprekers kunnen relatief luid spelen (84.7 dB)
Bas 100 - 315 Hz
(+) | goede baars - slechts 3.8% verwijderd van de mediaan
(+) | de lage tonen zijn lineair (5.2% delta naar de vorige frequentie)
Midden 400 - 2000 Hz
(+) | evenwichtige middens - slechts 1.3% verwijderd van de mediaan
(+) | de middentonen zijn lineair (2.1% delta ten opzichte van de vorige frequentie)
Hoog 2 - 16 kHz
(+) | evenwichtige hoogtepunten - slechts 1.9% verwijderd van de mediaan
(+) | de hoge tonen zijn lineair (2.7% delta naar de vorige frequentie)
Algemeen 100 - 16.000 Hz
(+) | het totale geluid is lineair (4.6% verschil met de mediaan)
Vergeleken met dezelfde klasse
» 0% van alle geteste apparaten in deze klasse waren beter, 0% vergelijkbaar, 100% slechter
» De beste had een delta van 5%, het gemiddelde was 17%, de slechtste was 45%
Vergeleken met alle geteste toestellen
» 0% van alle geteste apparaten waren beter, 0% gelijk, 100% slechter
» De beste had een delta van 4%, het gemiddelde was 23%, de slechtste was 134%
Energiebeheer
Stroomverbruik
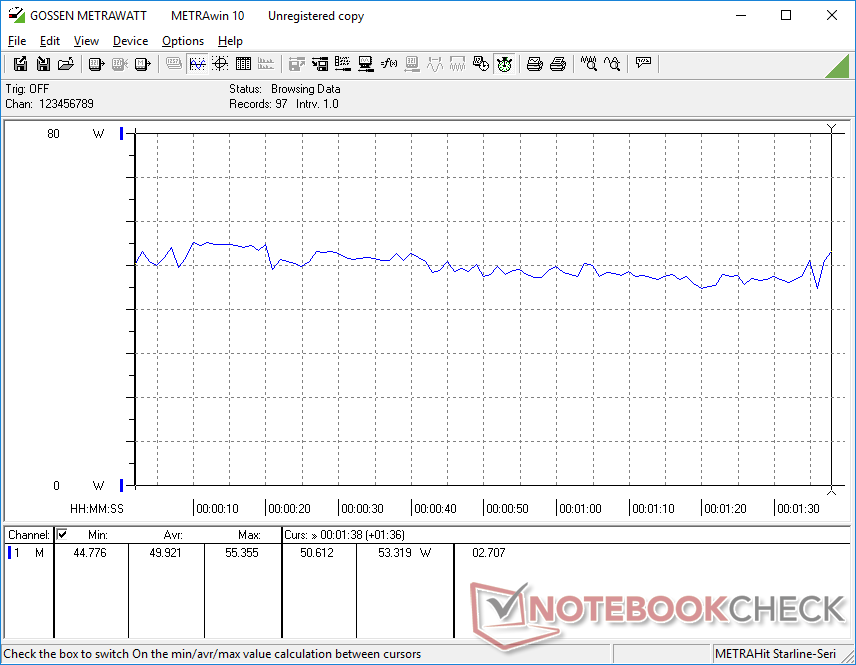
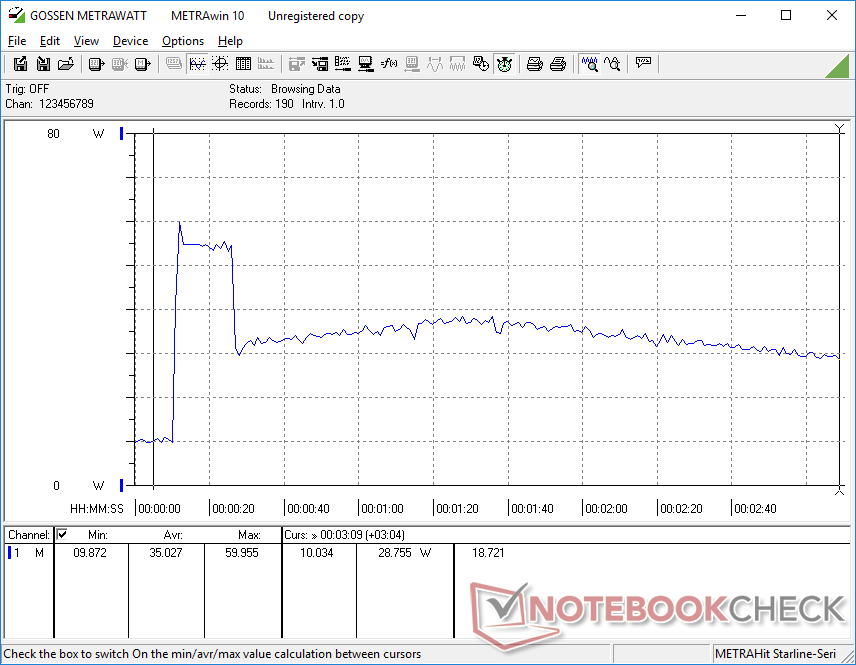
Het stroomverbruik is over de hele linie hoger bij de Intel-configuratie in vergelijking met AMD, vooral bij hogere belastingen. Deze verschillen zouden te wijten kunnen zijn aan zowel het hogere initiële Turbo Boost-potentieel van de Core i7 CPU in vergelijking met de Ryzen 5 en de snellere geïntegreerde grafische prestaties in vergelijking met de Radeon RX Vega 7. Running Witcher 3zou bijvoorbeeld ongeveer 30 procent meer stroom verbruiken op ons Intel-toestel.
| Uit / Standby | |
| Inactief | |
| Belasting |
|
Key:
min: | |
| Lenovo ThinkPad L13 Yoga G4 i7-1355U i7-1355U, Iris Xe G7 96EUs, Samsung PM9B1 512GB MZAL4512HBLU, IPS, 1920x1200, 13.3" | Lenovo ThinkPad L13 Yoga G4 21FSS00100 R5 7530U, Vega 7, Kioxia BG5 KBG5AZNT512G, IPS LED, 1920x1200, 13.3" | HP Elite Dragonfly Folio 13.5 G3 i7-1265U, Iris Xe G7 96EUs, Samsung PM9A1 MZVL2512HCJQ, IPS, 1920x1280, 13.5" | Dell Latitude 9330 i7-1260U, Iris Xe G7 96EUs, , IPS, 2560x1600, 13.3" | MSI Summit E13 Flip Evo A11MT i7-1185G7, Iris Xe G7 96EUs, Phison 1TB SM2801T24GKBB4S-E162, IPS, 1920x1200, 13.4" | Framework Laptop 13.5 Ryzen 7 7840U R7 7840U, Radeon 780M, WD PC SN740 512GB SDDPNQD-512G, IPS, 2256x1504, 13.5" | |
|---|---|---|---|---|---|---|
| Power Consumption | 24% | 16% | 16% | -2% | 11% | |
| Idle Minimum * (Watt) | 5.5 | 4.4 20% | 3.4 38% | 4.7 15% | 4.8 13% | 4 27% |
| Idle Average * (Watt) | 8.3 | 7.2 13% | 4.9 41% | 8.2 1% | 8.4 -1% | 6.5 22% |
| Idle Maximum * (Watt) | 9.1 | 8.3 9% | 9.3 -2% | 8.4 8% | 8.6 5% | 6.8 25% |
| Load Average * (Watt) | 49.9 | 21.6 57% | 41.9 16% | 36.8 26% | 47.1 6% | 48 4% |
| Witcher 3 ultra * (Watt) | 42.4 | 32.1 24% | 36.4 14% | 30.4 28% | 51.6 -22% | 52.3 -23% |
| Load Maximum * (Watt) | 60 | 49.3 18% | 67.5 -13% | 49.9 17% | 65.9 -10% | 55.2 8% |
* ... kleiner is beter
Power Consumption Witcher 3 / Stresstest
Power Consumption external Monitor
Levensduur batterij
Het hierboven genoemde over het algemeen hogere stroomverbruik eist zijn tol op de levensduur van de batterij. Surfen op het web op ons Intel-toestel duurt iets meer dan 6 uur in vergelijking met 7,5 uur op het AMD-toestel wanneer beide op hetzelfde gebalanceerde energieprofiel zijn ingesteld. Het opladen duurt ook langzamer dan verwacht, ongeveer 2 uur, zelfs wanneer Lenovo Rapid Charge is ingeschakeld.
| Lenovo ThinkPad L13 Yoga G4 i7-1355U i7-1355U, Iris Xe G7 96EUs, 46 Wh | Lenovo ThinkPad L13 Yoga G4 21FSS00100 R5 7530U, Vega 7, 46 Wh | HP Elite Dragonfly Folio 13.5 G3 i7-1265U, Iris Xe G7 96EUs, 53 Wh | Dell Latitude 9330 i7-1260U, Iris Xe G7 96EUs, 50 Wh | MSI Summit E13 Flip Evo A11MT i7-1185G7, Iris Xe G7 96EUs, 70 Wh | Framework Laptop 13.5 Ryzen 7 7840U R7 7840U, Radeon 780M, 61 Wh | |
|---|---|---|---|---|---|---|
| Batterijduur | 24% | 52% | 52% | 81% | 95% | |
| WiFi v1.3 (h) | 6.2 | 7.7 24% | 9.4 52% | 9.4 52% | 11.2 81% | 12.1 95% |
| Load (h) | 1.5 | 2.6 | 2.3 | 1.8 | ||
| Reader / Idle (h) | 27.3 | 15.4 | 21.1 |
Pro
Contra
Verdict - Batterijduur en stillere ventilatoren inruilen voor Thunderbolt en snellere graphics
Misschien wel de meest verrassende bevinding over de Intel-versie van de ThinkPad L13 Yoga G4 is de steiler dan verwachte CPU-prestatie throttling. Hoewel we nooit verwachten dat een Core U-processor gedurende langere perioden hoge Turbo Boost-kloksnelheden aanhoudt, throttled de Core i7 in dit specifieke Lenovo-model meer dan op de meeste andere laptops met exact dezelfde CPU. Dit prestatietekort vermindert een belangrijk voordeel voor Intel ten opzichte van AMD, vooral omdat het throttling-probleem niet zo ernstig is op de AMD-configuratie.
Een ander vermeldenswaardig aspect is het hogere stroomverbruik van de Intel-versie, wat leidt tot een kortere gebruikstijd van 1 tot 2 uur. Gebruikers die waarde hechten aan een langere batterijlevensduur kunnen daarom beter kiezen voor de AMD-versie van de ThinkPad L13 Yoga G4.
Tenzij u echt de extra grafische prestaties en Thunderbolt-ondersteuning van Intel nodig hebt, zou de AMD-versie van de ThinkPad L13 Yoga G4 voldoende moeten zijn voor de meeste geïnteresseerde gebruikers.
De belangrijkste redenen om de Intel-versie van het model boven de AMD-versie te verkiezen zijn vPro (in plaats van AMD PRO), Thunderbolt-ondersteuning en snellere grafische prestaties en single-thread CPU-prestaties. Verder hebben de AMD SKU's de overhand als het aankomt op multi-thread CPU-prestaties, batterijduur en prijs.
Prijs en beschikbaarheid
Lenovo levert de ThinkPad L13 Yoga Gen 4 op het moment van publicatie nog niet. CDW levert momenteel echter onze Core i7-configuratie voor $1419 USD.
Lenovo ThinkPad L13 Yoga G4 i7-1355U
- 30-10-2023 v7 (old)
Allen Ngo
Transparantie
De selectie van te beoordelen apparaten wordt gemaakt door onze redactie. Het testexemplaar werd ten behoeve van deze beoordeling door de fabrikant of detailhandelaar in bruikleen aan de auteur verstrekt. De kredietverstrekker had geen invloed op deze recensie, noch ontving de fabrikant vóór publicatie een exemplaar van deze recensie. Er bestond geen verplichting om deze recensie te publiceren. Als onafhankelijk mediabedrijf is Notebookcheck niet onderworpen aan het gezag van fabrikanten, detailhandelaren of uitgevers.
[transparency_disclaimer]Dit is hoe Notebookcheck test
Elk jaar beoordeelt Notebookcheck onafhankelijk honderden laptops en smartphones met behulp van gestandaardiseerde procedures om ervoor te zorgen dat alle resultaten vergelijkbaar zijn. We hebben onze testmethoden al zo'n 20 jaar voortdurend ontwikkeld en daarbij de industriestandaard bepaald. In onze testlaboratoria wordt gebruik gemaakt van hoogwaardige meetapparatuur door ervaren technici en redacteuren. Deze tests omvatten een validatieproces in meerdere fasen. Ons complexe beoordelingssysteem is gebaseerd op honderden goed onderbouwde metingen en benchmarks, waardoor de objectiviteit behouden blijft. Meer informatie over onze testmethoden kunt u hier vinden.
Price comparison

