Kort testrapport Nexoc GH5 515IG (Clevo NH50DB): Instap-gaming-laptop met drie opslagapparaten
Evaluatie | Datum | Model | Gewicht | Hoogte | Formaat | Resolutie | Beste prijs |
|---|---|---|---|---|---|---|---|
| 81.2 % v7 (old) | 08-2020 | Nexoc GH5 515IG i5-10300H, GeForce GTX 1650 Mobile | 2.1 kg | 24.9 mm | 15.60" | 1920x1080 | |
| 78.4 % v7 (old) | 07-2020 | Lenovo IdeaPad Gaming 3i 15IMH05 i5-10300H, GeForce GTX 1650 Mobile | 2.2 kg | 24.9 mm | 15.60" | 1920x1080 | |
| 80.4 % v6 (old) | 07-2019 | Asus TUF FX505DT-EB73 R7 3750H, GeForce GTX 1650 Mobile | 2.2 kg | 26.8 mm | 15.60" | 1920x1080 | |
| 79.3 % v7 (old) | 10-2019 | Dell G3 3590 i5-9300H, GeForce GTX 1650 Mobile | 2.5 kg | 21.6 mm | 15.60" | 1920x1080 | |
| 75.4 % v7 (old) | HP Pavilion Gaming 15-ec0002ng R5 3550H, GeForce GTX 1050 Mobile | 2.3 kg | 23.5 mm | 15.60" | 1920x1080 | ||
| 79.8 % v7 (old) | 07-2020 | Acer Nitro 5 AN515-44-R5FT R5 4600H, GeForce GTX 1650 Ti Mobile | 2.2 kg | 24 mm | 15.60" | 1920x1080 | |
| 79.5 % v7 (old) | 07-2020 | MSI Bravo 15 A4DCR R7 4800H, Radeon RX 5300M | 2 kg | 22 mm | 15.60" | 1920x1080 |
| SD Card Reader | |
| average JPG Copy Test (av. of 3 runs) | |
| Gemiddelde van klas Gaming (20.9 - 210, n=54, laatste 2 jaar) | |
| Nexoc GH5 515IG (Toshiba Exceria Pro SDXC 64 GB UHS-II) | |
| HP Pavilion Gaming 15-ec0002ng (Toshiba Exceria Pro SDXC 64 GB UHS-II) | |
| Dell G3 3590 (Toshiba Exceria Pro SDXC 64 GB UHS-II) | |
| maximum AS SSD Seq Read Test (1GB) | |
| Gemiddelde van klas Gaming (25.5 - 261, n=51, laatste 2 jaar) | |
| Nexoc GH5 515IG (Toshiba Exceria Pro SDXC 64 GB UHS-II) | |
| HP Pavilion Gaming 15-ec0002ng (Toshiba Exceria Pro SDXC 64 GB UHS-II) | |
| Dell G3 3590 (Toshiba Exceria Pro SDXC 64 GB UHS-II) | |
| Networking | |
| iperf3 transmit AX12 | |
| Nexoc GH5 515IG | |
| Acer Nitro 5 AN515-44-R5FT | |
| MSI Bravo 15 A4DCR | |
| HP Pavilion Gaming 15-ec0002ng | |
| Lenovo IdeaPad Gaming 3i 15IMH05 | |
| Asus TUF FX505DT-EB73 | |
| Dell G3 3590 | |
| iperf3 receive AX12 | |
| Nexoc GH5 515IG | |
| Acer Nitro 5 AN515-44-R5FT | |
| MSI Bravo 15 A4DCR | |
| Lenovo IdeaPad Gaming 3i 15IMH05 | |
| HP Pavilion Gaming 15-ec0002ng | |
| Asus TUF FX505DT-EB73 | |
| Dell G3 3590 | |


| |||||||||||||||||||||||||
Helderheidsverdeling: 93 %
Helderheid in Batterij-modus: 261 cd/m²
Contrast: 1135:1 (Zwart: 0.23 cd/m²)
ΔE ColorChecker Calman: 4.71 | ∀{0.5-29.43 Ø4.72}
calibrated: 3.67
ΔE Greyscale Calman: 2.76 | ∀{0.09-98 Ø4.97}
56% sRGB (Argyll 1.6.3 3D)
36% AdobeRGB 1998 (Argyll 1.6.3 3D)
39.19% AdobeRGB 1998 (Argyll 3D)
57% sRGB (Argyll 3D)
37.91% Display P3 (Argyll 3D)
Gamma: 2.42
CCT: 7090 K
| Nexoc GH5 515IG LG Philips LP156WFC-SPD1, IPS, 1920x1080, 15.6" | Lenovo IdeaPad Gaming 3i 15IMH05 BOE CQ NV156FHM-NX1, IPS, 1920x1080, 15.6" | Asus TUF FX505DT-EB73 Panda LM156LF-GL, IPS, 1920x1080, 15.6" | Dell G3 3590 BOE NV15N3D, IPS, 1920x1080, 15.6" | HP Pavilion Gaming 15-ec0002ng Chi Mei N156HGA-EA3, TN LED, 1920x1080, 15.6" | Acer Nitro 5 AN515-44-R5FT Panda LM156LF-2F01 (NCP004D), IPS, 1920x1080, 15.6" | MSI Bravo 15 A4DCR AU Optronics B156HAN08.0 (AUO80ED), IPS-Level, 1920x1080, 15.6" | |
|---|---|---|---|---|---|---|---|
| Display | -0% | 4% | 6% | 9% | 9% | 59% | |
| Display P3 Coverage (%) | 37.91 | 38.04 0% | 39.56 4% | 40.13 6% | 41.22 9% | 41.16 9% | 62 64% |
| sRGB Coverage (%) | 57 | 56.6 -1% | 59.5 4% | 59.8 5% | 61.8 8% | 61.8 8% | 86.8 52% |
| AdobeRGB 1998 Coverage (%) | 39.19 | 39.3 0% | 40.91 4% | 41.47 6% | 42.62 9% | 42.56 9% | 62.7 60% |
| Response Times | 31% | 2% | -31% | 7% | -18% | 57% | |
| Response Time Grey 50% / Grey 80% * (ms) | 34.8 ? | 25 ? 28% | 30.4 ? 13% | 46 ? -32% | 44 ? -26% | 40.8 ? -17% | 16 ? 54% |
| Response Time Black / White * (ms) | 25.2 ? | 17 ? 33% | 27.6 ? -10% | 32.4 ? -29% | 15 ? 40% | 30 ? -19% | 10.4 ? 59% |
| PWM Frequency (Hz) | 200 ? | 250 ? | |||||
| Screen | -34% | -29% | -24% | -63% | -9% | 5% | |
| Brightness middle (cd/m²) | 261 | 305 17% | 286.2 10% | 276.2 6% | 233 -11% | 287 10% | 311 19% |
| Brightness (cd/m²) | 254 | 294 16% | 267 5% | 261 3% | 211 -17% | 271 7% | 313 23% |
| Brightness Distribution (%) | 93 | 70 -25% | 84 -10% | 86 -8% | 82 -12% | 88 -5% | 88 -5% |
| Black Level * (cd/m²) | 0.23 | 0.405 -76% | 0.33 -43% | 0.24 -4% | 0.405 -76% | 0.25 -9% | 0.43 -87% |
| Contrast (:1) | 1135 | 753 -34% | 867 -24% | 1151 1% | 575 -49% | 1148 1% | 723 -36% |
| Colorchecker dE 2000 * | 4.71 | 6.01 -28% | 5.45 -16% | 5.56 -18% | 8.22 -75% | 4.77 -1% | 4.5 4% |
| Colorchecker dE 2000 max. * | 7.6 | 21.9 -188% | 18.08 -138% | 23.45 -209% | 18.6 -145% | 17.15 -126% | 7.97 -5% |
| Colorchecker dE 2000 calibrated * | 3.67 | 5.12 -40% | 4.47 -22% | 5.23 -43% | 3.73 -2% | 2.65 28% | |
| Greyscale dE 2000 * | 2.76 | 3.23 -17% | 5.3 -92% | 2.8 -1% | 10.13 -267% | 2.7 2% | 3.3 -20% |
| Gamma | 2.42 91% | 2.43 91% | 2.1 105% | 2.37 93% | 2.27 97% | 2.115 104% | 2.129 103% |
| CCT | 7090 92% | 6818 95% | 7679 85% | 6710 97% | 11323 57% | 7187 90% | 7227 90% |
| Color Space (Percent of AdobeRGB 1998) (%) | 36 | 36 0% | 37.6 4% | 37.8 5% | 39 8% | 43 19% | 63 75% |
| Color Space (Percent of sRGB) (%) | 56 | 56 0% | 59.1 6% | 59 5% | 62 11% | 61 9% | 86 54% |
| Totaal Gemiddelde (Programma / Instellingen) | -1% /
-20% | -8% /
-19% | -16% /
-19% | -16% /
-40% | -6% /
-7% | 40% /
21% |
* ... kleiner is beter
Responstijd Scherm
| ↔ Responstijd Zwart naar Wit | ||
|---|---|---|
| 25.2 ms ... stijging ↗ en daling ↘ gecombineerd | ↗ 15.2 ms stijging | 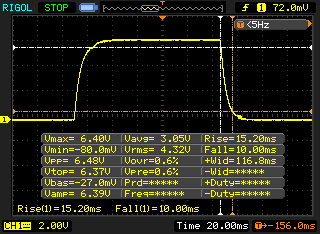 |
| ↘ 10 ms daling | ||
| Het scherm vertoonde relatief trage responstijden in onze tests en is misschien te traag voor games. Ter vergelijking: alle testtoestellen variëren van 0.1 (minimum) tot 240 (maximum) ms. » 61 % van alle toestellen zijn beter. Dit betekent dat de gemeten responstijd slechter is dan het gemiddelde (19.8 ms) van alle geteste toestellen. | ||
| ↔ Responstijd 50% Grijs naar 80% Grijs | ||
| 34.8 ms ... stijging ↗ en daling ↘ gecombineerd | ↗ 17.6 ms stijging | 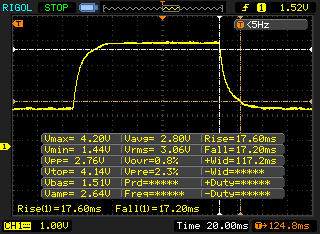 |
| ↘ 17.2 ms daling | ||
| Het scherm vertoonde trage responstijden in onze tests en is misschien te traag voor games. Ter vergelijking: alle testtoestellen variëren van 0.165 (minimum) tot 636 (maximum) ms. » 49 % van alle toestellen zijn beter. Dit betekent dat de gemeten responstijd slechter is dan het gemiddelde (31 ms) van alle geteste toestellen. | ||
Screen Flickering / PWM (Pulse-Width Modulation)
| Screen flickering / PWM niet waargenomen | 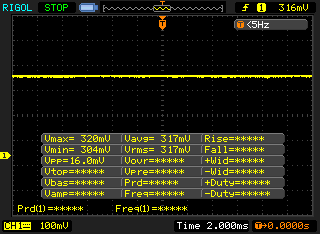 | ||
Ter vergelijking: 52 % van alle geteste toestellen maakten geen gebruik van PWM om de schermhelderheid te verlagen. Als het wel werd gebruikt, werd een gemiddelde van 7763 (minimum: 5 - maximum: 343500) Hz waargenomen. | |||
| Cinebench R15 | |
| CPU Single 64Bit | |
| Lenovo IdeaPad Gaming 3i 15IMH05 | |
| MSI Bravo 15 A4DCR | |
| Nexoc GH5 515IG | |
| Nexoc GH5 515IG (Leistungsmodus) | |
| Acer Nitro 5 AN515-44-R5FT | |
| Dell G3 3590 | |
| Asus TUF FX505DT-EB73 | |
| HP Pavilion Gaming 15-ec0002ng | |
| CPU Multi 64Bit | |
| MSI Bravo 15 A4DCR | |
| Acer Nitro 5 AN515-44-R5FT | |
| Nexoc GH5 515IG (Leistungsmodus) | |
| Lenovo IdeaPad Gaming 3i 15IMH05 | |
| Nexoc GH5 515IG | |
| Asus TUF FX505DT-EB73 | |
| Dell G3 3590 | |
| HP Pavilion Gaming 15-ec0002ng | |
| Blender - v2.79 BMW27 CPU | |
| Nexoc GH5 515IG | |
| Lenovo IdeaPad Gaming 3i 15IMH05 | |
| Acer Nitro 5 AN515-44-R5FT | |
| MSI Bravo 15 A4DCR | |
| Cinebench R20 | |
| CPU (Single Core) | |
| MSI Bravo 15 A4DCR | |
| Nexoc GH5 515IG | |
| Lenovo IdeaPad Gaming 3i 15IMH05 | |
| Acer Nitro 5 AN515-44-R5FT | |
| Dell G3 3590 | |
| Asus TUF FX505DT-EB73 | |
| HP Pavilion Gaming 15-ec0002ng | |
| CPU (Multi Core) | |
| MSI Bravo 15 A4DCR | |
| Acer Nitro 5 AN515-44-R5FT | |
| Lenovo IdeaPad Gaming 3i 15IMH05 | |
| Nexoc GH5 515IG | |
| Dell G3 3590 | |
| Asus TUF FX505DT-EB73 | |
| HP Pavilion Gaming 15-ec0002ng | |
| Geekbench 5.5 | |
| Single-Core | |
| Nexoc GH5 515IG | |
| Lenovo IdeaPad Gaming 3i 15IMH05 | |
| MSI Bravo 15 A4DCR | |
| Acer Nitro 5 AN515-44-R5FT | |
| HP Pavilion Gaming 15-ec0002ng | |
| Multi-Core | |
| MSI Bravo 15 A4DCR | |
| Acer Nitro 5 AN515-44-R5FT | |
| Nexoc GH5 515IG | |
| Lenovo IdeaPad Gaming 3i 15IMH05 | |
| HP Pavilion Gaming 15-ec0002ng | |
| HWBOT x265 Benchmark v2.2 - 4k Preset | |
| MSI Bravo 15 A4DCR | |
| Acer Nitro 5 AN515-44-R5FT | |
| Lenovo IdeaPad Gaming 3i 15IMH05 | |
| Nexoc GH5 515IG | |
| LibreOffice - 20 Documents To PDF | |
| MSI Bravo 15 A4DCR | |
| Acer Nitro 5 AN515-44-R5FT | |
| Nexoc GH5 515IG | |
| Lenovo IdeaPad Gaming 3i 15IMH05 | |
| R Benchmark 2.5 - Overall mean | |
| Lenovo IdeaPad Gaming 3i 15IMH05 | |
| Acer Nitro 5 AN515-44-R5FT | |
| Nexoc GH5 515IG | |
| MSI Bravo 15 A4DCR | |
* ... kleiner is beter
| PCMark 8 Home Score Accelerated v2 | 3971 punten | |
| PCMark 8 Creative Score Accelerated v2 | 4576 punten | |
| PCMark 8 Work Score Accelerated v2 | 5179 punten | |
| PCMark 10 Score | 4936 punten | |
Help | ||
| PCMark 10 - Score | |
| MSI Bravo 15 A4DCR | |
| Nexoc GH5 515IG | |
| Acer Nitro 5 AN515-44-R5FT | |
| Dell G3 3590 | |
| Asus TUF FX505DT-EB73 | |
| Lenovo IdeaPad Gaming 3i 15IMH05 | |
| HP Pavilion Gaming 15-ec0002ng | |
| PCMark 8 | |
| Home Score Accelerated v2 | |
| Nexoc GH5 515IG | |
| Asus TUF FX505DT-EB73 | |
| Lenovo IdeaPad Gaming 3i 15IMH05 | |
| Dell G3 3590 | |
| HP Pavilion Gaming 15-ec0002ng | |
| Work Score Accelerated v2 | |
| Lenovo IdeaPad Gaming 3i 15IMH05 | |
| Nexoc GH5 515IG | |
| Dell G3 3590 | |
| HP Pavilion Gaming 15-ec0002ng | |
| Asus TUF FX505DT-EB73 | |
| DPC Latencies / LatencyMon - interrupt to process latency (max), Web, Youtube, Prime95 | |
| MSI Bravo 15 A4DCR | |
| Acer Nitro 5 AN515-44-R5FT | |
| Lenovo IdeaPad Gaming 3i 15IMH05 | |
| Nexoc GH5 515IG | |
* ... kleiner is beter

| Nexoc GH5 515IG Samsung SSD 860 Evo 512GB | Lenovo IdeaPad Gaming 3i 15IMH05 SK hynix BC511 HFM512GDHTNI-87A0B | Asus TUF FX505DT-EB73 Intel SSD 660p SSDPEKNW512G8 | Dell G3 3590 Toshiba BG4 KBG40ZNS128G | HP Pavilion Gaming 15-ec0002ng Intel SSD 660p SSDPEKNW512G8 | Acer Nitro 5 AN515-44-R5FT SK Hynix BC511 HFM512GDJTNI | MSI Bravo 15 A4DCR Samsung PM981a MZVLB1T0HBLR | |
|---|---|---|---|---|---|---|---|
| CrystalDiskMark 5.2 / 6 | 90% | 81% | 85% | 88% | 240% | ||
| Write 4K (MB/s) | 89.6 | 130 45% | 137.5 53% | 136.9 53% | 94.7 6% | 118.3 32% | |
| Read 4K (MB/s) | 40.88 | 44.44 9% | 57 39% | 57 39% | 38.91 -5% | 43.73 7% | |
| Write Seq (MB/s) | 518 | 1059 104% | 984 90% | 968 87% | 1056 104% | 2854 451% | |
| Read Seq (MB/s) | 539 | 1105 105% | 1564 190% | 1631 203% | 1183 119% | 2302 327% | |
| Write 4K Q32T1 (MB/s) | 304 | 490.3 61% | 237.4 -22% | 237 -22% | 445.3 46% | 418.5 38% | |
| Read 4K Q32T1 (MB/s) | 329 | 309.2 -6% | 340.7 4% | 337.1 2% | 477.7 45% | 517 57% | |
| Write Seq Q32T1 (MB/s) | 529 | 1053 99% | 959 81% | 963 82% | 1063 101% | 3008 469% | |
| Read Seq Q32T1 (MB/s) | 561 | 2261 303% | 1732 209% | 1863 232% | 2154 284% | 3568 536% | |
| AS SSD | 71% | 58% | -194% | -2% | 82% | 269% | |
| Seq Read (MB/s) | 524 | 1348 157% | 1019 94% | 1174 124% | 1623 210% | 1504 187% | 2730 421% |
| Seq Write (MB/s) | 495 | 1000 102% | 889 80% | 186 -62% | 891 80% | 1064 115% | 2513 408% |
| 4K Read (MB/s) | 38.93 | 48.04 23% | 48.22 24% | 34.01 -13% | 48.06 23% | 51.5 32% | 61.4 58% |
| 4K Write (MB/s) | 87.3 | 103.3 18% | 115.5 32% | 69.4 -21% | 102.1 17% | 123.2 41% | 156.1 79% |
| 4K-64 Read (MB/s) | 380 | 755 99% | 321.5 -15% | 424 12% | 325.6 -14% | 703 85% | 1780 368% |
| 4K-64 Write (MB/s) | 335.7 | 749 123% | 787 134% | 68.8 -80% | 94.1 -72% | 730 117% | 1920 472% |
| Access Time Read * (ms) | 0.073 | 0.061 16% | 0.065 11% | 0.168 -130% | 0.171 -134% | 0.064 12% | 0.063 14% |
| Access Time Write * (ms) | 0.039 | 0.036 8% | 0.047 -21% | 0.94 -2310% | 0.048 -23% | 0.031 21% | 0.025 36% |
| Score Read (Points) | 471 | 938 99% | 472 0% | 575 22% | 536 14% | 905 92% | 2114 349% |
| Score Write (Points) | 472 | 952 102% | 992 110% | 157 -67% | 285 -40% | 960 103% | 2327 393% |
| Score Total (Points) | 1198 | 2365 97% | 1717 43% | 987 -18% | 1077 -10% | 2321 94% | 5518 361% |
| Copy ISO MB/s (MB/s) | 500 | 749 50% | 942 88% | 215.7 -57% | 566 13% | ||
| Copy Program MB/s (MB/s) | 283.8 | 342.5 21% | 444.5 57% | 108.2 -62% | 223.8 -21% | ||
| Copy Game MB/s (MB/s) | 319.6 | 571 79% | 867 171% | 165.9 -48% | 104.3 -67% | ||
| Totaal Gemiddelde (Programma / Instellingen) | 81% /
78% | 70% /
66% | -194% /
-194% | 42% /
30% | 85% /
84% | 255% /
257% |
* ... kleiner is beter
Continuous load read: DiskSpd Read Loop, Queue Depth 8
| 3DMark 06 Standard Score | 36299 punten | |
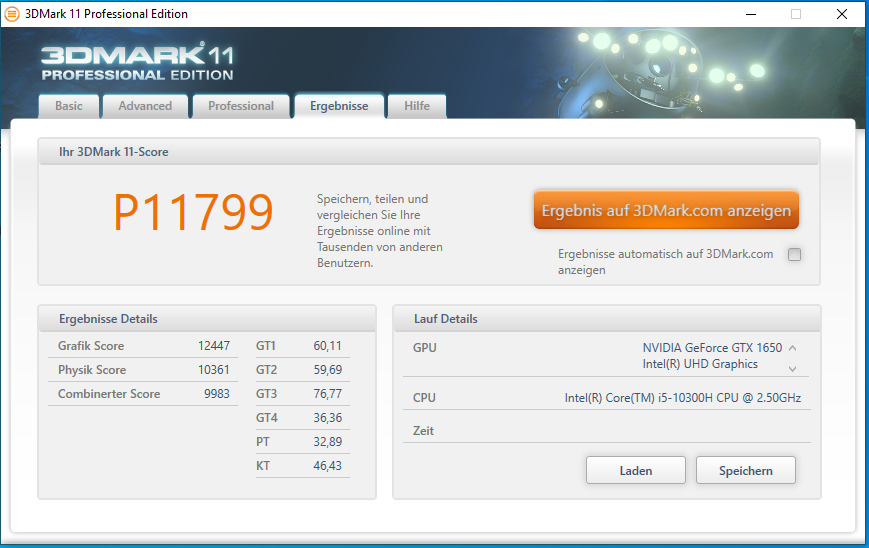
| 3DMark 11 Performance | 11799 punten | |
| 3DMark Cloud Gate Standard Score | 27676 punten | |
| 3DMark Fire Strike Score | 8410 punten | |
| 3DMark Time Spy Score | 3552 punten | |
Help | ||
| 3DMark 11 - 1280x720 Performance GPU | |
| MSI Bravo 15 A4DCR | |
| Acer Nitro 5 AN515-44-R5FT | |
| Asus TUF FX505DT-EB73 | |
| Dell G3 3590 | |
| Lenovo IdeaPad Gaming 3i 15IMH05 | |
| Nexoc GH5 515IG | |
| HP Pavilion Gaming 15-ec0002ng | |
| 3DMark | |
| 1280x720 Cloud Gate Standard Graphics | |
| Lenovo IdeaPad Gaming 3i 15IMH05 | |
| Nexoc GH5 515IG | |
| Dell G3 3590 | |
| MSI Bravo 15 A4DCR | |
| Acer Nitro 5 AN515-44-R5FT | |
| Asus TUF FX505DT-EB73 | |
| HP Pavilion Gaming 15-ec0002ng | |
| 1920x1080 Fire Strike Graphics | |
| MSI Bravo 15 A4DCR | |
| Acer Nitro 5 AN515-44-R5FT | |
| Nexoc GH5 515IG (Leistungsmodus) | |
| Lenovo IdeaPad Gaming 3i 15IMH05 | |
| Asus TUF FX505DT-EB73 | |
| Dell G3 3590 | |
| Nexoc GH5 515IG | |
| HP Pavilion Gaming 15-ec0002ng | |
| 2560x1440 Time Spy Graphics | |
| Acer Nitro 5 AN515-44-R5FT | |
| Asus TUF FX505DT-EB73 | |
| MSI Bravo 15 A4DCR | |
| Nexoc GH5 515IG (Leistungsmodus) | |
| Dell G3 3590 | |
| Lenovo IdeaPad Gaming 3i 15IMH05 | |
| Nexoc GH5 515IG | |
| HP Pavilion Gaming 15-ec0002ng | |
| Shadow of the Tomb Raider - 1920x1080 Highest Preset AA:T | |
| Acer Nitro 5 AN515-44-R5FT | |
| Lenovo IdeaPad Gaming 3i 15IMH05 | |
| Nexoc GH5 515IG (Leistungsmodus) | |
| Nexoc GH5 515IG | |
| Asus TUF FX505DT-EB73 | |
| MSI Bravo 15 A4DCR | |
| HP Pavilion Gaming 15-ec0002ng | |
| The Witcher 3 - 1920x1080 Ultra Graphics & Postprocessing (HBAO+) | |
| Nexoc GH5 515IG | |
| Acer Nitro 5 AN515-44-R5FT | |
| MSI Bravo 15 A4DCR | |
| Lenovo IdeaPad Gaming 3i 15IMH05 | |
| Nexoc GH5 515IG (Leistungsmodus) | |
| Asus TUF FX505DT-EB73 | |
| Dell G3 3590 | |
| HP Pavilion Gaming 15-ec0002ng | |
| BioShock Infinite - 1920x1080 Ultra Preset, DX11 (DDOF) | |
| Nexoc GH5 515IG (Leistungsmodus) | |
| Lenovo IdeaPad Gaming 3i 15IMH05 | |
| Nexoc GH5 515IG | |
| Dell G3 3590 | |
| Asus TUF FX505DT-EB73 | |
| HP Pavilion Gaming 15-ec0002ng | |
| Star Wars Jedi Fallen Order - 1920x1080 Epic Preset | |
| MSI Bravo 15 A4DCR | |
| Lenovo IdeaPad Gaming 3i 15IMH05 | |
| Nexoc GH5 515IG | |
| HP Pavilion Gaming 15-ec0002ng | |
| Gears Tactics - 1920x1080 Ultra Preset | |
| Acer Nitro 5 AN515-44-R5FT | |
| Lenovo IdeaPad Gaming 3i 15IMH05 | |
| MSI Bravo 15 A4DCR | |
| Nexoc GH5 515IG (Leistungsmodus) | |
| Nexoc GH5 515IG | |
| Doom Eternal - 1920x1080 High Preset | |
| Lenovo IdeaPad Gaming 3i 15IMH05 | |
| Nexoc GH5 515IG | |
| MSI Bravo 15 A4DCR | |
| F1 2020 - 1920x1080 Ultra High Preset AA:T AF:16x | |
| Nexoc GH5 515IG | |
| lage | gem. | hoge | ultra | |
|---|---|---|---|---|
| BioShock Infinite (2013) | 332.4 | 250.2 | 226.1 | 95.2 |
| The Witcher 3 (2015) | 187.9 | 118.4 | 67.2 | 38.5 |
| Shadow of the Tomb Raider (2018) | 115 | 61 | 51 | 44 |
| Call of Duty Modern Warfare 2019 (2019) | 97.5 | 61.5 | 51.1 | 43.3 |
| Star Wars Jedi Fallen Order (2019) | 78.3 | 61.1 | 51.8 | |
| Doom Eternal (2020) | 148.6 | 81.4 | 62.6 | |
| Gears Tactics (2020) | 230.8 | 89.7 | 61 | 41.9 |
| F1 2020 (2020) | 182 | 104 | 81 | 57 |
| Death Stranding (2020) | 104.9 | 62.8 | 57.3 | 56.5 |
| Horizon Zero Dawn (2020) | 95 | 54 | 45 | 34 |
Geluidsniveau
| Onbelast |
| 25 / 31 / 33 dB (A) |
| Belasting |
| 53 / 53 dB (A) |
 | ||
30 dB stil 40 dB(A) hoorbaar 50 dB(A) luid |
||
min: | ||
| Nexoc GH5 515IG i5-10300H, GeForce GTX 1650 Mobile | Lenovo IdeaPad Gaming 3i 15IMH05 i5-10300H, GeForce GTX 1650 Mobile | Asus TUF FX505DT-EB73 R7 3750H, GeForce GTX 1650 Mobile | Dell G3 3590 i5-9300H, GeForce GTX 1650 Mobile | HP Pavilion Gaming 15-ec0002ng R5 3550H, GeForce GTX 1050 Mobile | Acer Nitro 5 AN515-44-R5FT R5 4600H, GeForce GTX 1650 Ti Mobile | MSI Bravo 15 A4DCR R7 4800H, Radeon RX 5300M | |
|---|---|---|---|---|---|---|---|
| Noise | -4% | 3% | 2% | 3% | -3% | -9% | |
| uit / omgeving * (dB) | 25 | 30.7 -23% | 28.2 -13% | 28.4 -14% | 30.3 -21% | 30 -20% | 30 -20% |
| Idle Minimum * (dB) | 25 | 30.7 -23% | 28.2 -13% | 29.2 -17% | 30.3 -21% | 30 -20% | 31 -24% |
| Idle Average * (dB) | 31 | 30.7 1% | 28.2 9% | 29.4 5% | 30.3 2% | 32 -3% | 32 -3% |
| Idle Maximum * (dB) | 33 | 30.7 7% | 31.4 5% | 29.4 11% | 31 6% | 34 -3% | 40 -21% |
| Load Average * (dB) | 53 | 49.7 6% | 39.8 25% | 39 26% | 39.3 26% | 46 13% | 48 9% |
| Witcher 3 ultra * (dB) | 48 | 47 2% | 47 2% | 49.5 -3% | 42.9 11% | 47 2% | 48 -0% |
| Load Maximum * (dB) | 53 | 50.3 5% | 50.2 5% | 49.7 6% | 43.3 18% | 49 8% | 54 -2% |
* ... kleiner is beter
(-) De maximumtemperatuur aan de bovenzijde bedraagt 48 °C / 118 F, vergeleken met het gemiddelde van 40.4 °C / 105 F, variërend van 21.2 tot 68.8 °C voor de klasse Gaming.
(-) De bodem warmt op tot een maximum van 47 °C / 117 F, vergeleken met een gemiddelde van 43.2 °C / 110 F
(+) Bij onbelast gebruik bedraagt de gemiddelde temperatuur voor de bovenzijde 27.6 °C / 82 F, vergeleken met het apparaatgemiddelde van 33.9 °C / 93 F.
(-) Bij het spelen van The Witcher 3 is de gemiddelde temperatuur voor de bovenzijde 38.1 °C / 101 F, vergeleken met het apparaatgemiddelde van 33.9 °C / 93 F.
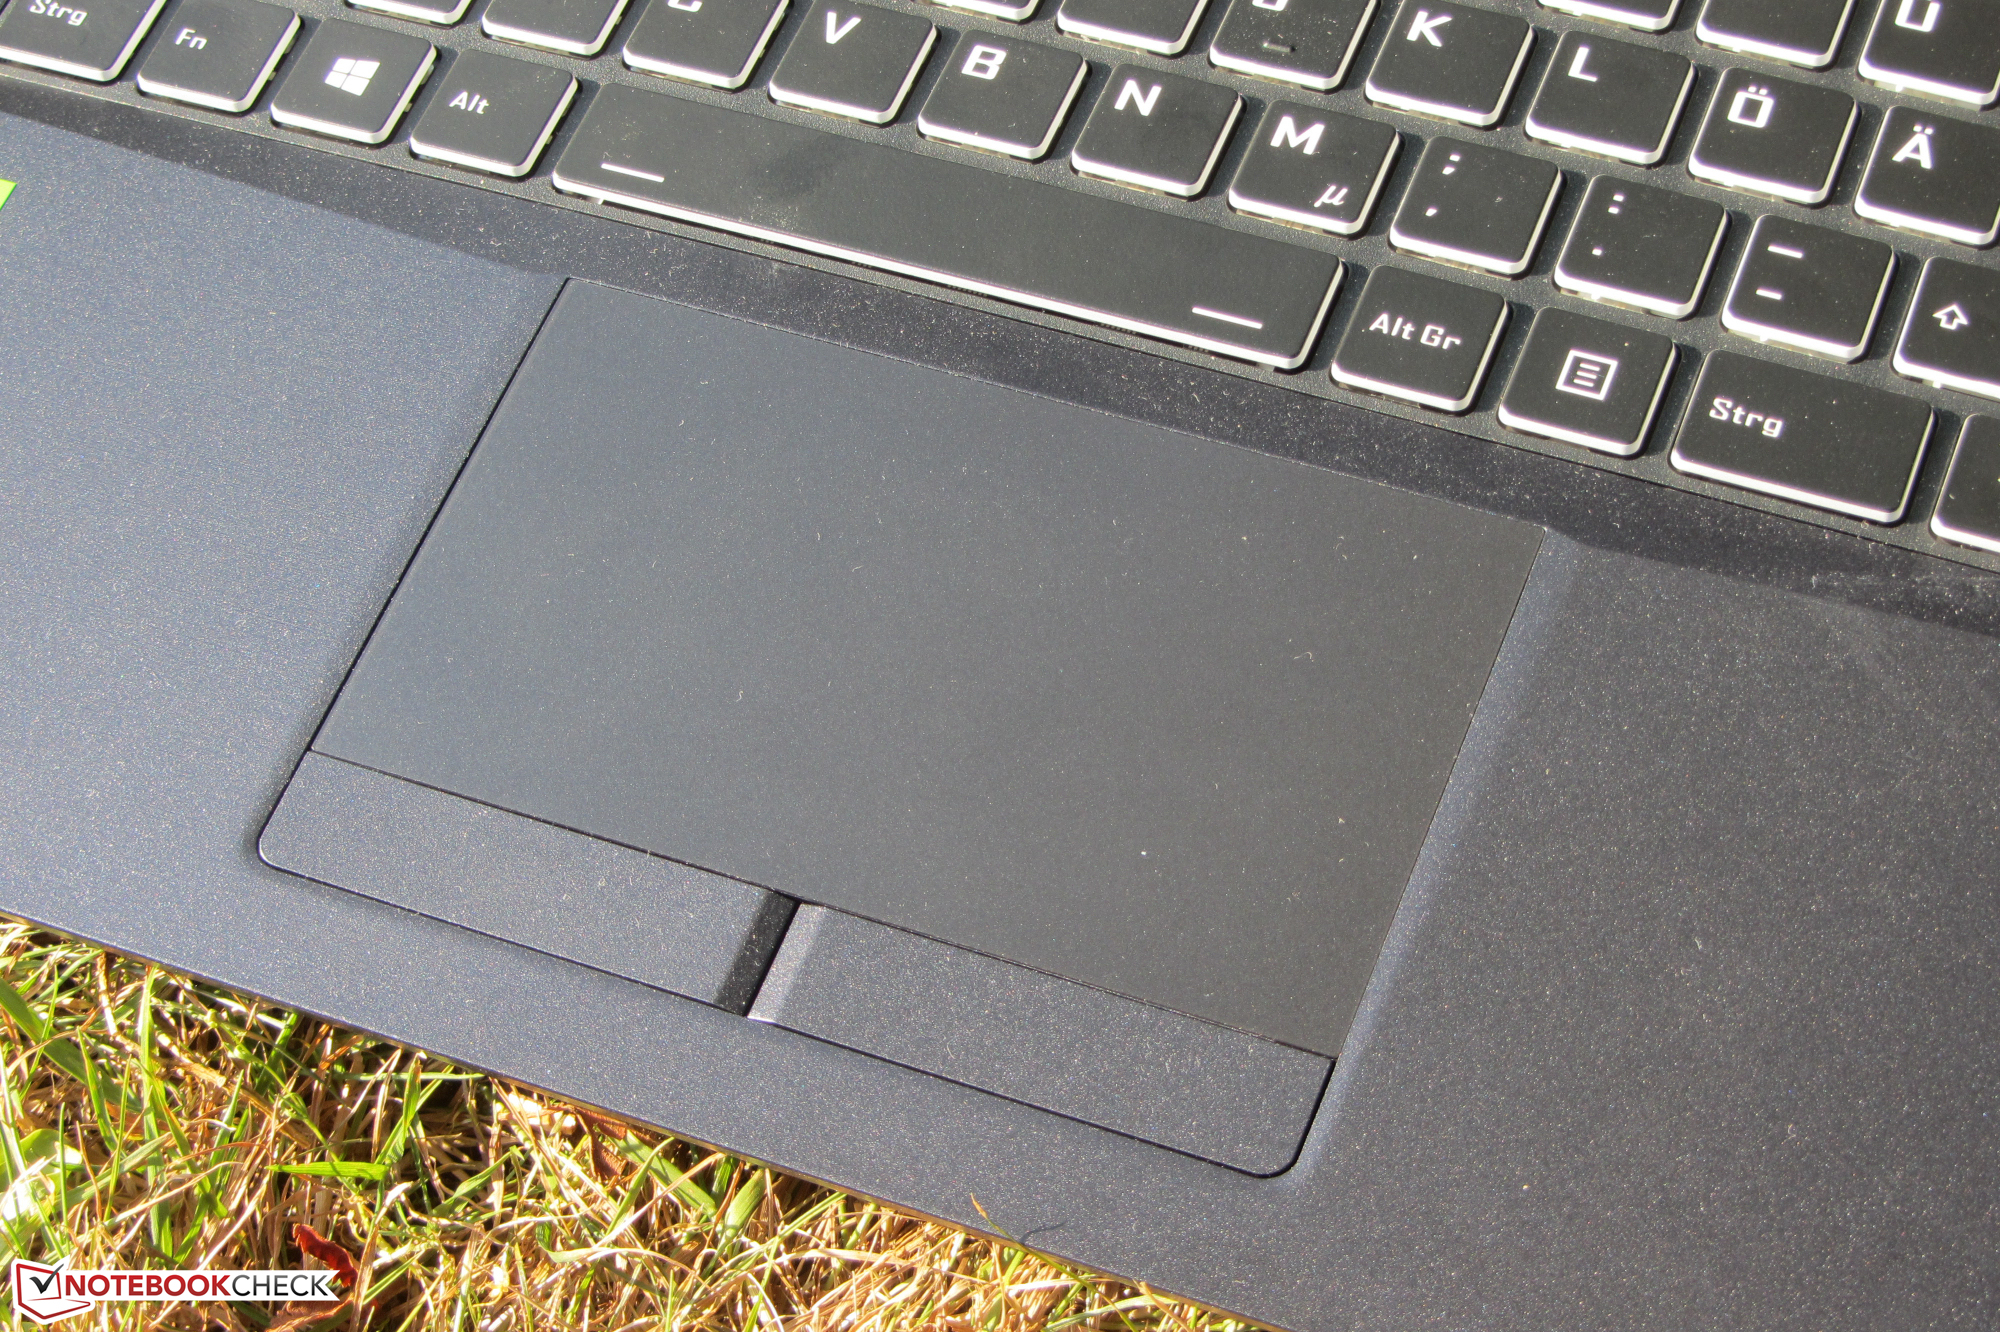
(+) De handpalmsteunen en het touchpad bereiken maximaal de huidtemperatuur (34 °C / 93.2 F) en zijn dus niet heet.
(-) De gemiddelde temperatuur van de handpalmsteun van soortgelijke toestellen bedroeg 28.8 °C / 83.8 F (-5.2 °C / -9.4 F).
| Nexoc GH5 515IG i5-10300H, GeForce GTX 1650 Mobile | Lenovo IdeaPad Gaming 3i 15IMH05 i5-10300H, GeForce GTX 1650 Mobile | Asus TUF FX505DT-EB73 R7 3750H, GeForce GTX 1650 Mobile | Dell G3 3590 i5-9300H, GeForce GTX 1650 Mobile | HP Pavilion Gaming 15-ec0002ng R5 3550H, GeForce GTX 1050 Mobile | Acer Nitro 5 AN515-44-R5FT R5 4600H, GeForce GTX 1650 Ti Mobile | MSI Bravo 15 A4DCR R7 4800H, Radeon RX 5300M | |
|---|---|---|---|---|---|---|---|
| Heat | 2% | -5% | -13% | 11% | -2% | -8% | |
| Maximum Upper Side * (°C) | 48 | 43 10% | 41.2 14% | 49 -2% | 41 15% | 49 -2% | 51 -6% |
| Maximum Bottom * (°C) | 47 | 50.6 -8% | 40 15% | 49.8 -6% | 39.1 17% | 50 -6% | 50 -6% |
| Idle Upper Side * (°C) | 28 | 27.2 3% | 34.6 -24% | 32.4 -16% | 26 7% | 28 -0% | 30 -7% |
| Idle Bottom * (°C) | 28 | 27.5 2% | 34.4 -23% | 35.6 -27% | 26.5 5% | 28 -0% | 31 -11% |
* ... kleiner is beter
Nexoc GH5 515IG audioanalyse
(±) | luidspreker luidheid is gemiddeld maar goed (81 dB)
Bas 100 - 315 Hz
(-) | bijna geen lage tonen - gemiddeld 24.4% lager dan de mediaan
(±) | lineariteit van de lage tonen is gemiddeld (13% delta ten opzichte van de vorige frequentie)
Midden 400 - 2000 Hz
(+) | evenwichtige middens - slechts 4.3% verwijderd van de mediaan
(±) | lineariteit van de middentonen is gemiddeld (7.5% delta ten opzichte van de vorige frequentie)
Hoog 2 - 16 kHz
(±) | higher highs - on average 5% higher than median
(±) | lineariteit van de hoogtepunten is gemiddeld (8.3% delta ten opzichte van de vorige frequentie)
Algemeen 100 - 16.000 Hz
(±) | lineariteit van het totale geluid is gemiddeld (20.2% verschil met de mediaan)
Vergeleken met dezelfde klasse
» 71% van alle geteste apparaten in deze klasse waren beter, 6% vergelijkbaar, 23% slechter
» De beste had een delta van 6%, het gemiddelde was 18%, de slechtste was 132%
Vergeleken met alle geteste toestellen
» 52% van alle geteste apparaten waren beter, 8% gelijk, 39% slechter
» De beste had een delta van 4%, het gemiddelde was 23%, de slechtste was 134%
| Uit / Standby | |
| Inactief | |
| Belasting |
|
Key:
min: | |
| Nexoc GH5 515IG i5-10300H, GeForce GTX 1650 Mobile | Lenovo IdeaPad Gaming 3i 15IMH05 i5-10300H, GeForce GTX 1650 Mobile | Asus TUF FX505DT-EB73 R7 3750H, GeForce GTX 1650 Mobile | Dell G3 3590 i5-9300H, GeForce GTX 1650 Mobile | HP Pavilion Gaming 15-ec0002ng R5 3550H, GeForce GTX 1050 Mobile | Acer Nitro 5 AN515-44-R5FT R5 4600H, GeForce GTX 1650 Ti Mobile | MSI Bravo 15 A4DCR R7 4800H, Radeon RX 5300M | |
|---|---|---|---|---|---|---|---|
| Power Consumption | -24% | -23% | -36% | 18% | -5% | -74% | |
| Idle Minimum * (Watt) | 3 | 5.1 -70% | 7 -133% | 6.2 -107% | 1.9 37% | 5 -67% | 11 -267% |
| Idle Average * (Watt) | 7 | 8.2 -17% | 9.9 -41% | 8.4 -20% | 7.2 -3% | 8 -14% | 14 -100% |
| Idle Maximum * (Watt) | 16 | 10.6 34% | 12 25% | 27.7 -73% | 9.6 40% | 13 19% | 25 -56% |
| Load Average * (Watt) | 85 | 128 -51% | 68.4 20% | 91 -7% | 74 13% | 69 19% | 72 15% |
| Witcher 3 ultra * (Watt) | 86 | 109 -27% | 94.9 -10% | 94.4 -10% | 75 13% | 78 9% | 100 -16% |
| Load Maximum * (Watt) | 134 | 150 -12% | 130.9 2% | 131.5 2% | 124 7% | 124 7% | 163 -22% |
* ... kleiner is beter
| Nexoc GH5 515IG i5-10300H, GeForce GTX 1650 Mobile, 48.96 Wh | Lenovo IdeaPad Gaming 3i 15IMH05 i5-10300H, GeForce GTX 1650 Mobile, 45 Wh | Asus TUF FX505DT-EB73 R7 3750H, GeForce GTX 1650 Mobile, 48 Wh | Dell G3 3590 i5-9300H, GeForce GTX 1650 Mobile, 51 Wh | HP Pavilion Gaming 15-ec0002ng R5 3550H, GeForce GTX 1050 Mobile, 52.5 Wh | Acer Nitro 5 AN515-44-R5FT R5 4600H, GeForce GTX 1650 Ti Mobile, 57.48 Wh | MSI Bravo 15 A4DCR R7 4800H, Radeon RX 5300M, 51 Wh | |
|---|---|---|---|---|---|---|---|
| Batterijduur | 11% | -16% | 4% | 31% | 15% | -36% | |
| Reader / Idle (h) | 14.9 | 12.4 -17% | 7.8 -48% | 13.5 -9% | 13.8 -7% | 7 -53% | |
| H.264 (h) | 6.5 | 7.3 12% | |||||
| WiFi v1.3 (h) | 6.4 | 6.3 -2% | 4.8 -25% | 6.7 5% | 8.4 31% | 8.7 36% | 4.5 -30% |
| Load (h) | 1.2 | 1.8 50% | 1.5 25% | 1.4 17% | 1.4 17% | 0.9 -25% |
Pro
Contra
Dit is de verkorte versie van het originele artikel. Het volledige, Engelse testrapport vind je hier.
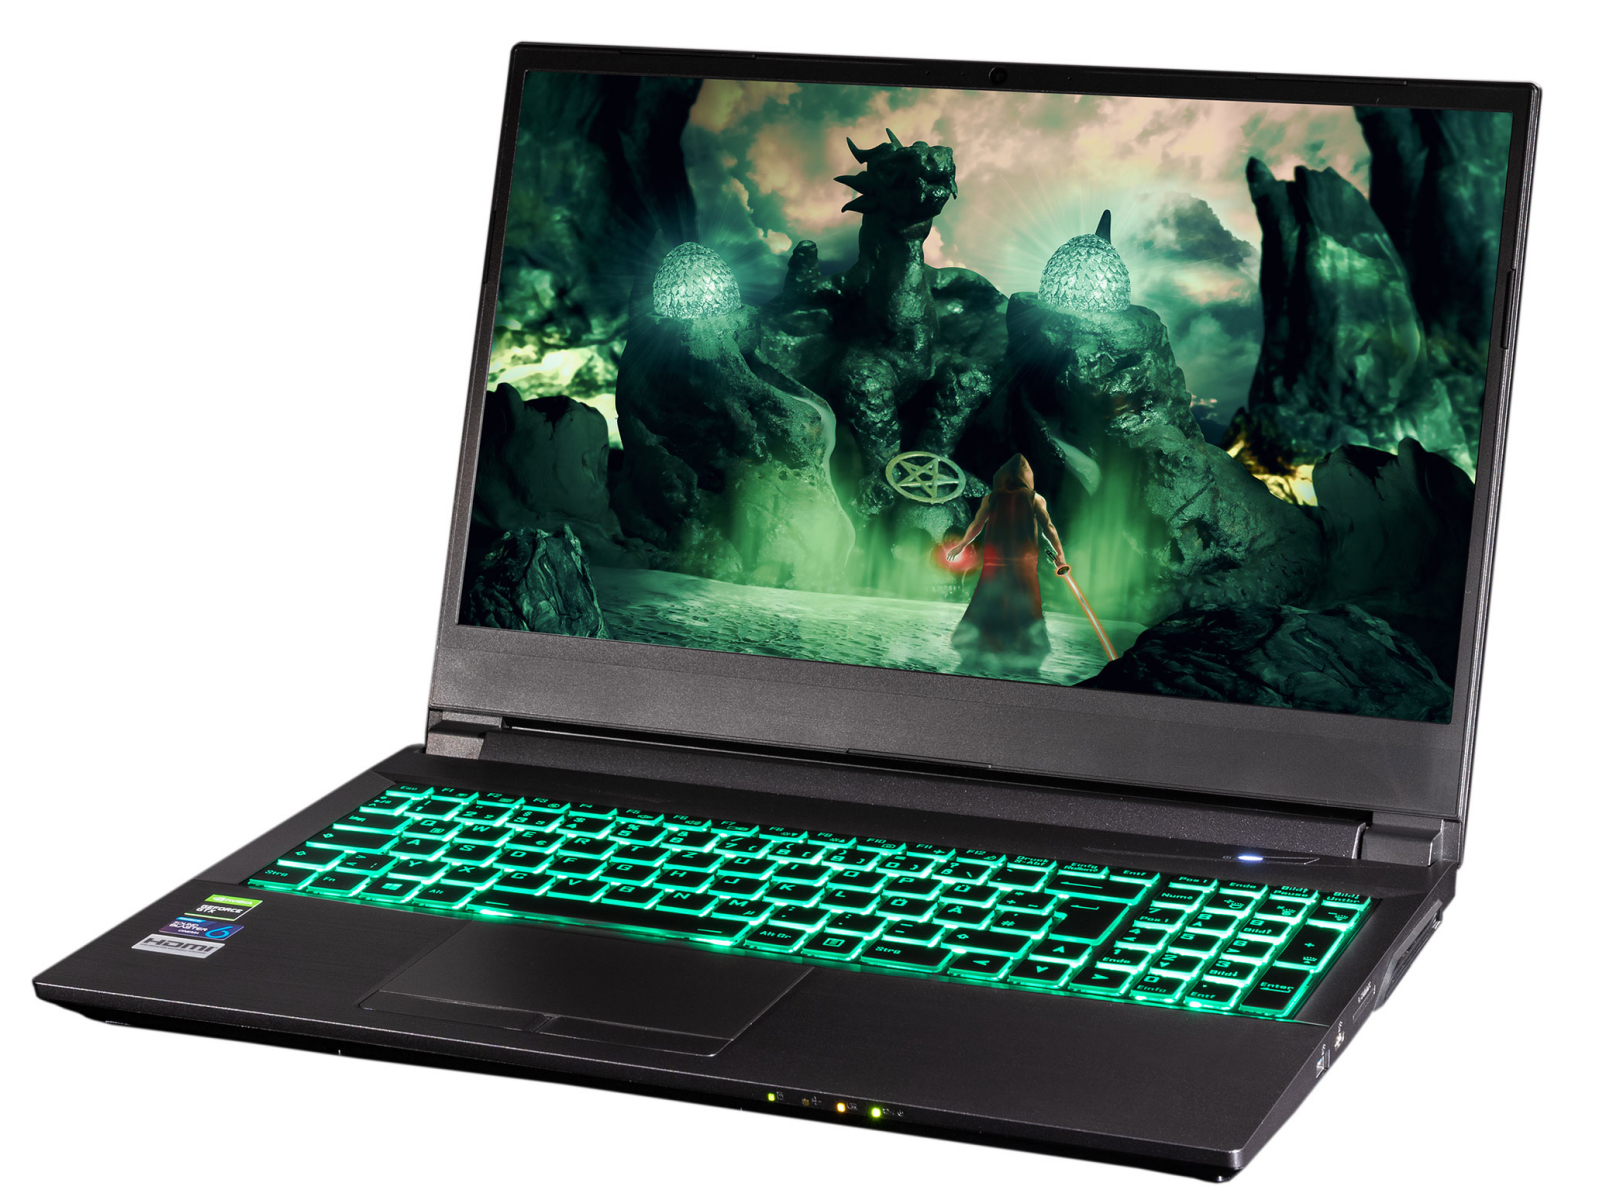
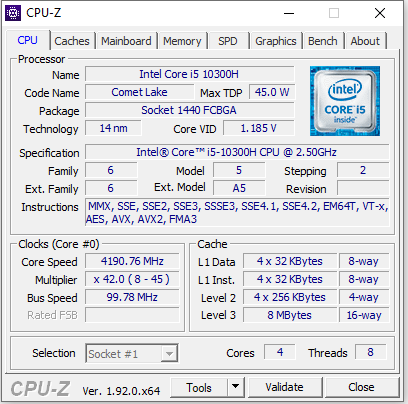
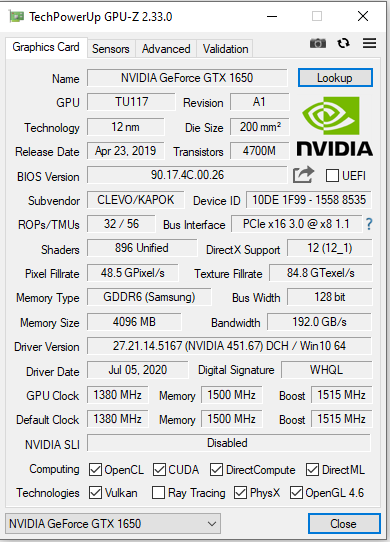
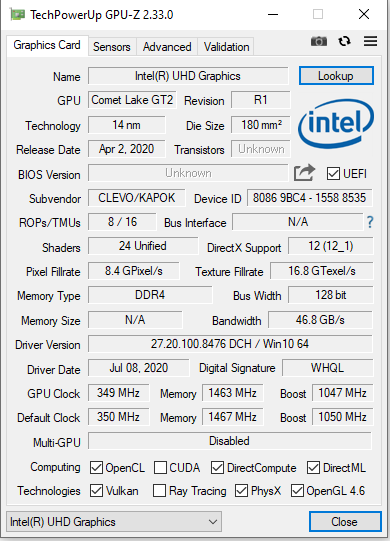
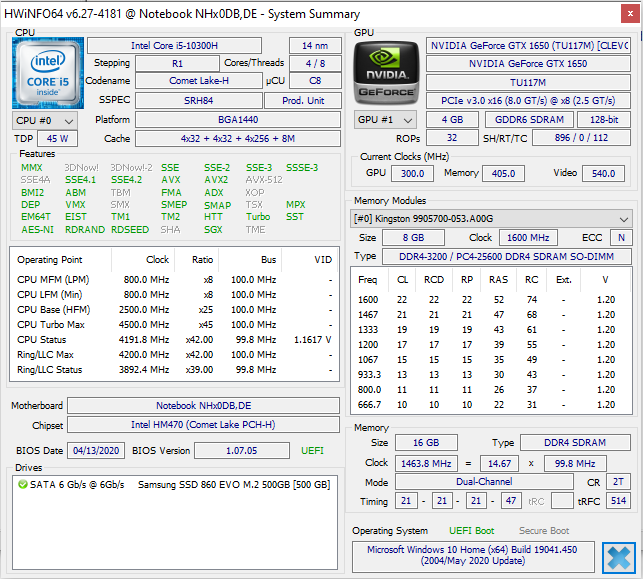
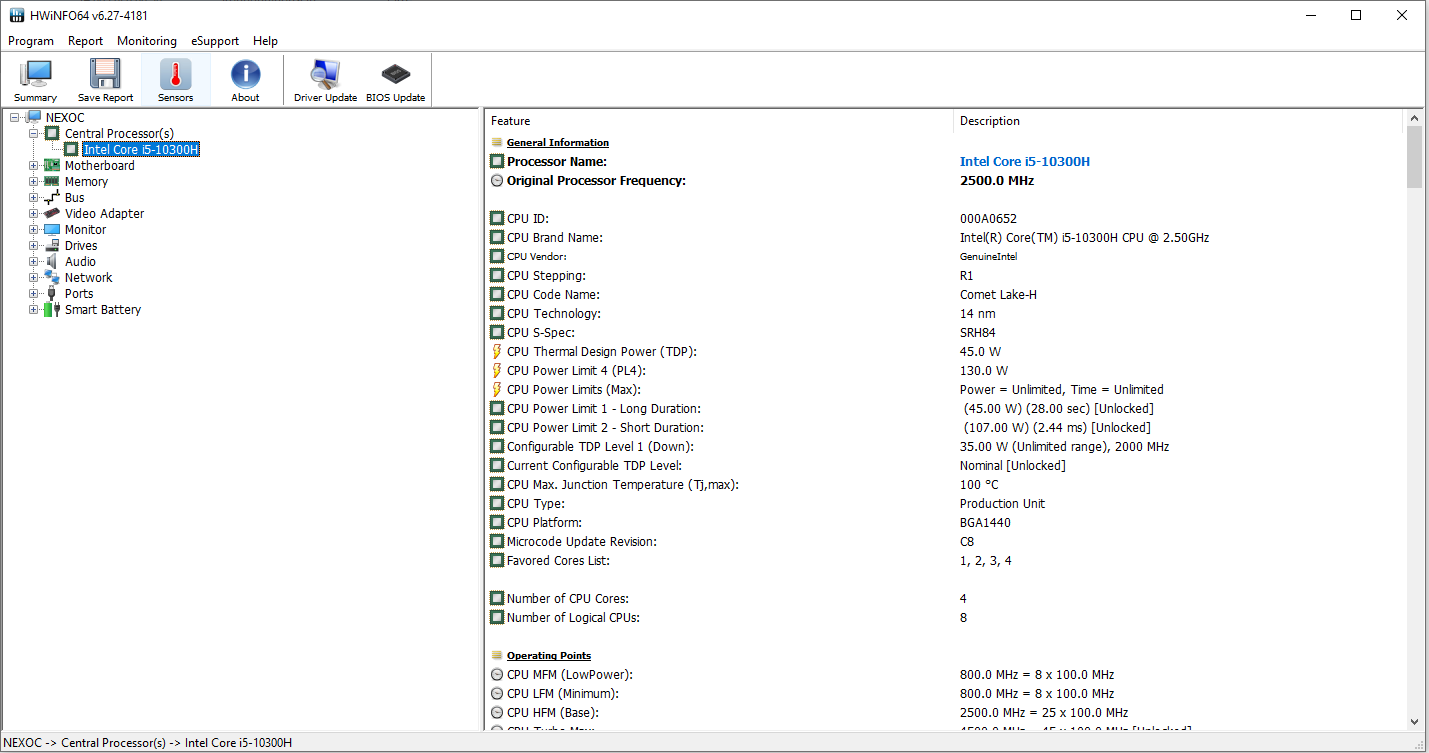
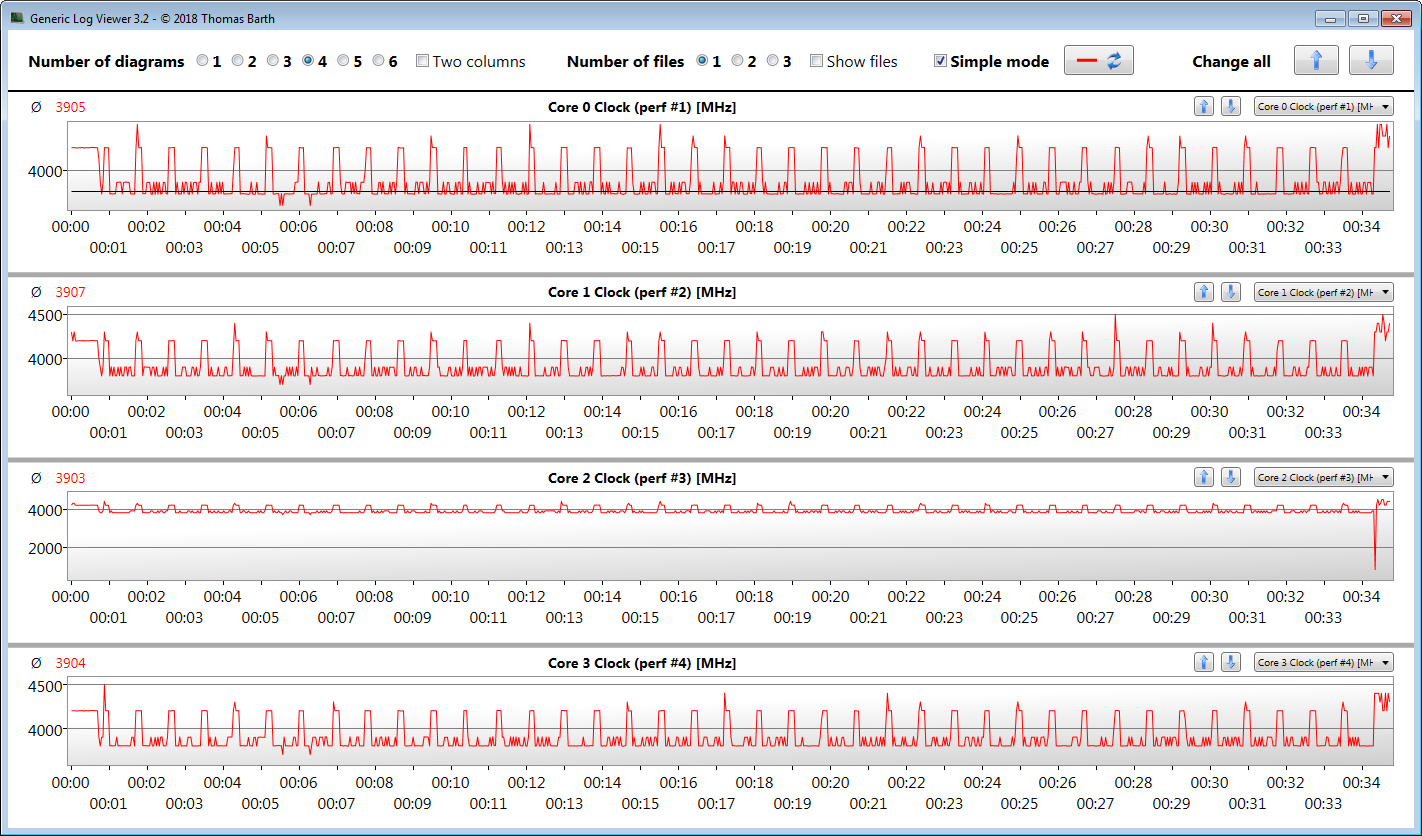
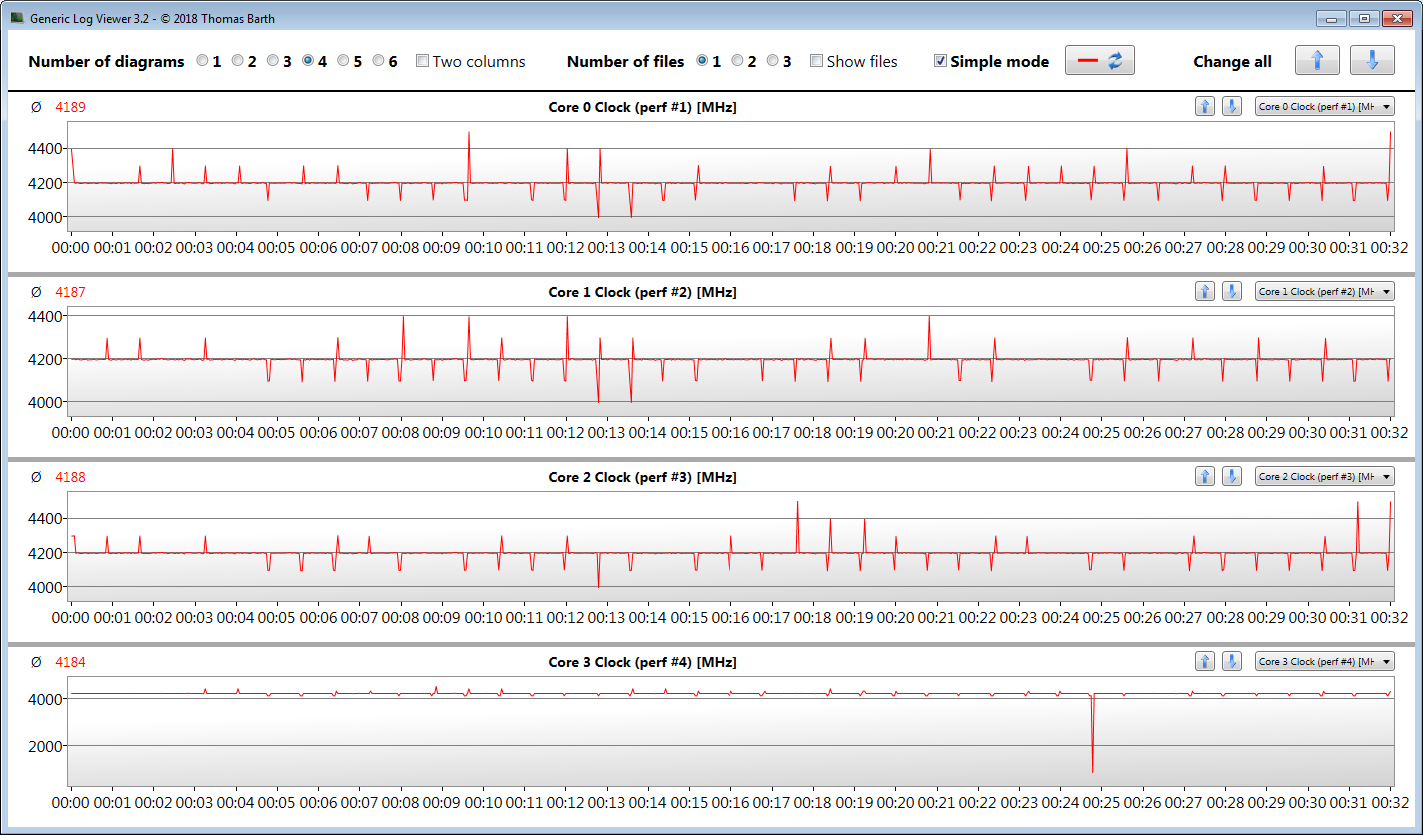
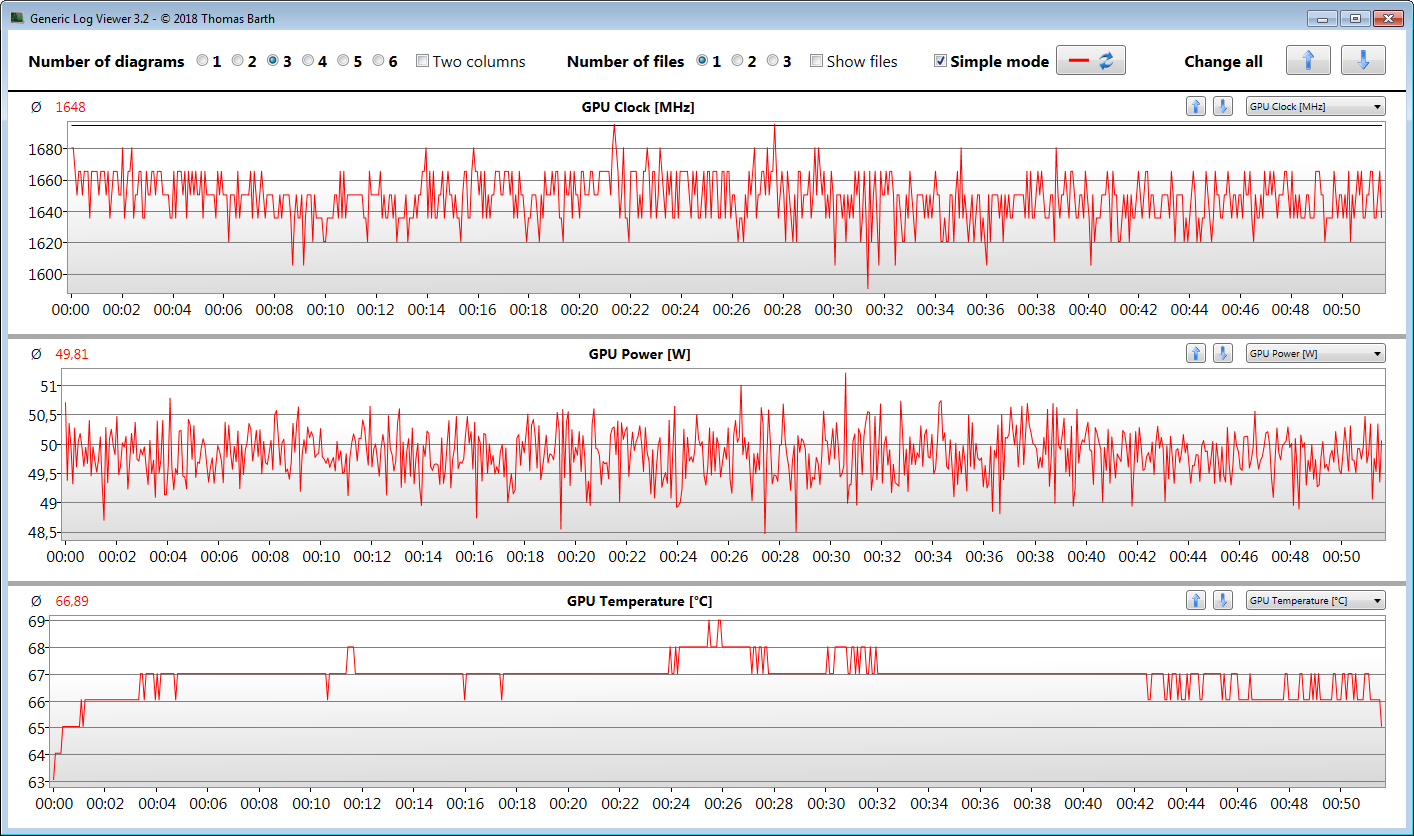
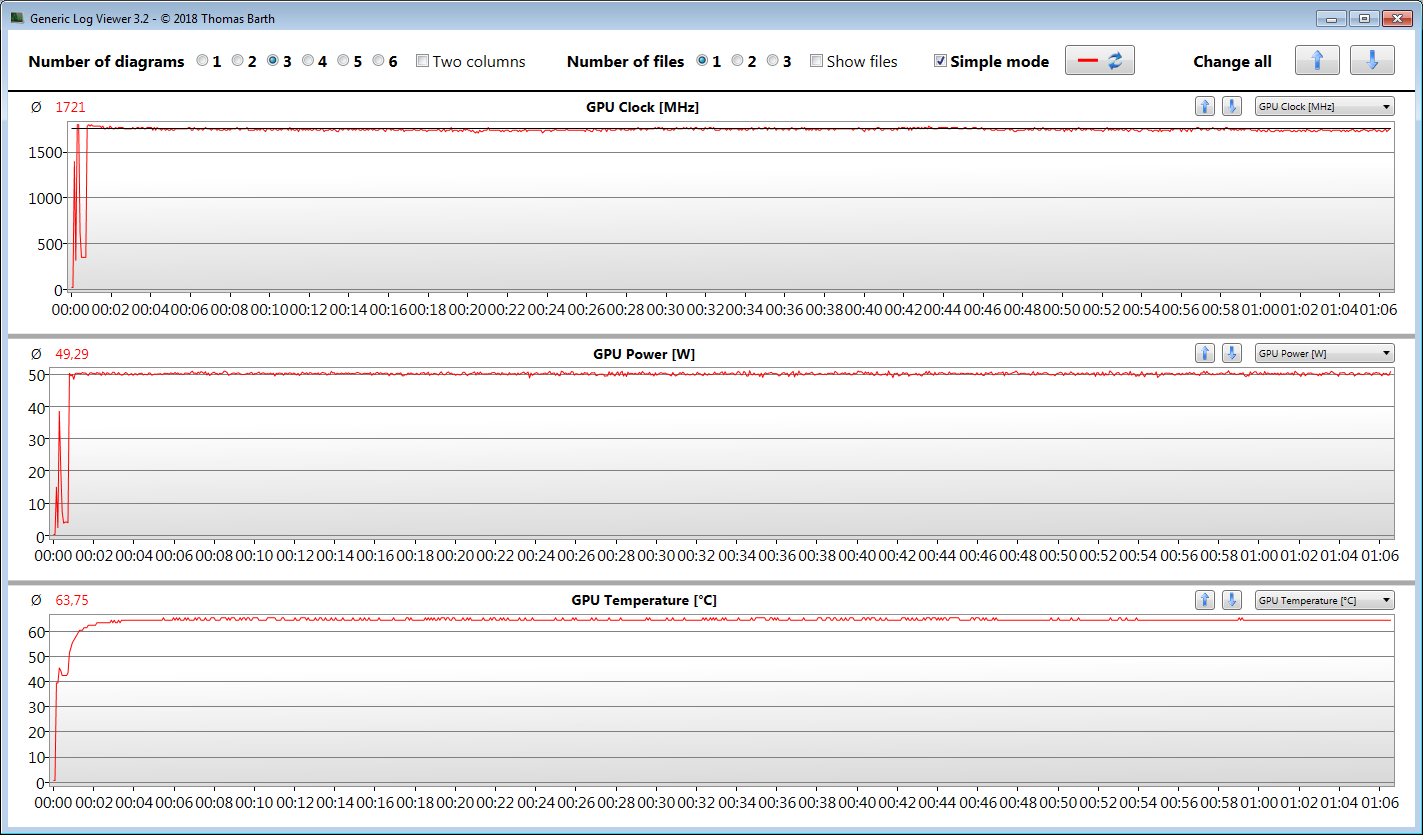
Nexoc's gaming laptop brings all the latest computer games smoothly onto the screen thanks to its Core i5-10300H processor and GeForce GTX 1650 graphics core. However, maximum quality settings are mostly beyond the reach of the device's owners. Positive: The CPU and GPU can run at high speeds for prolonged periods of time.
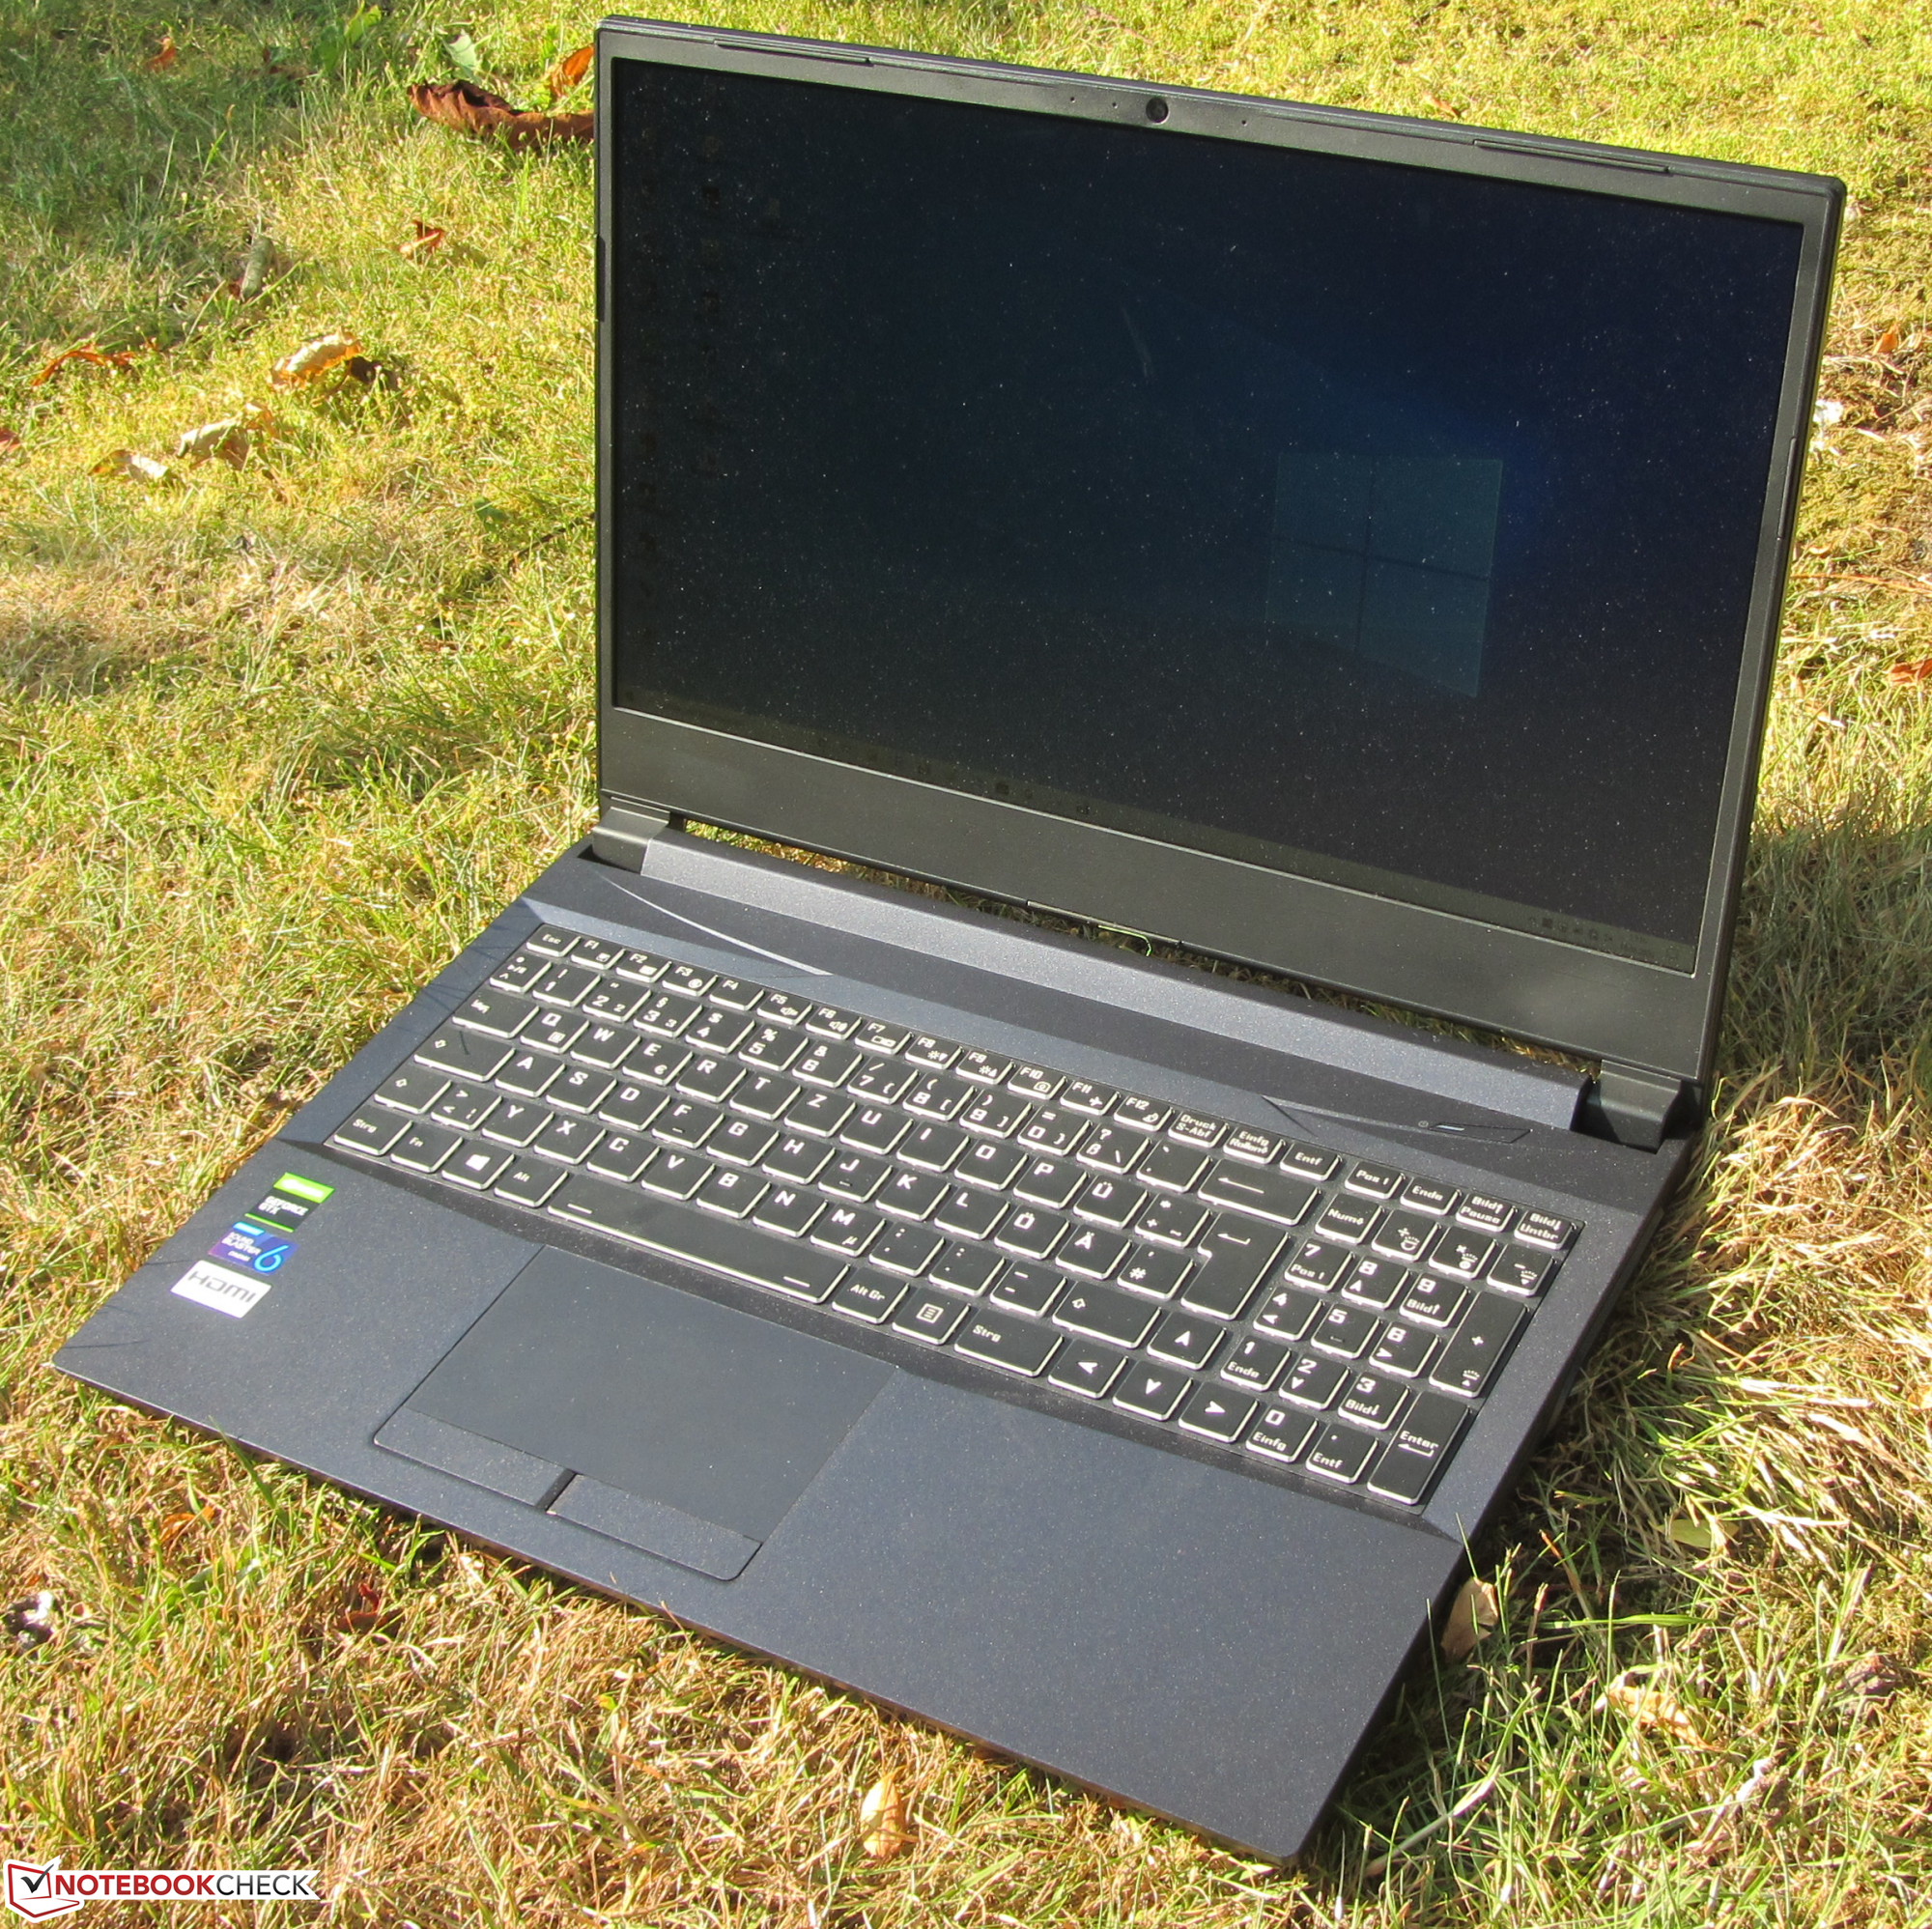
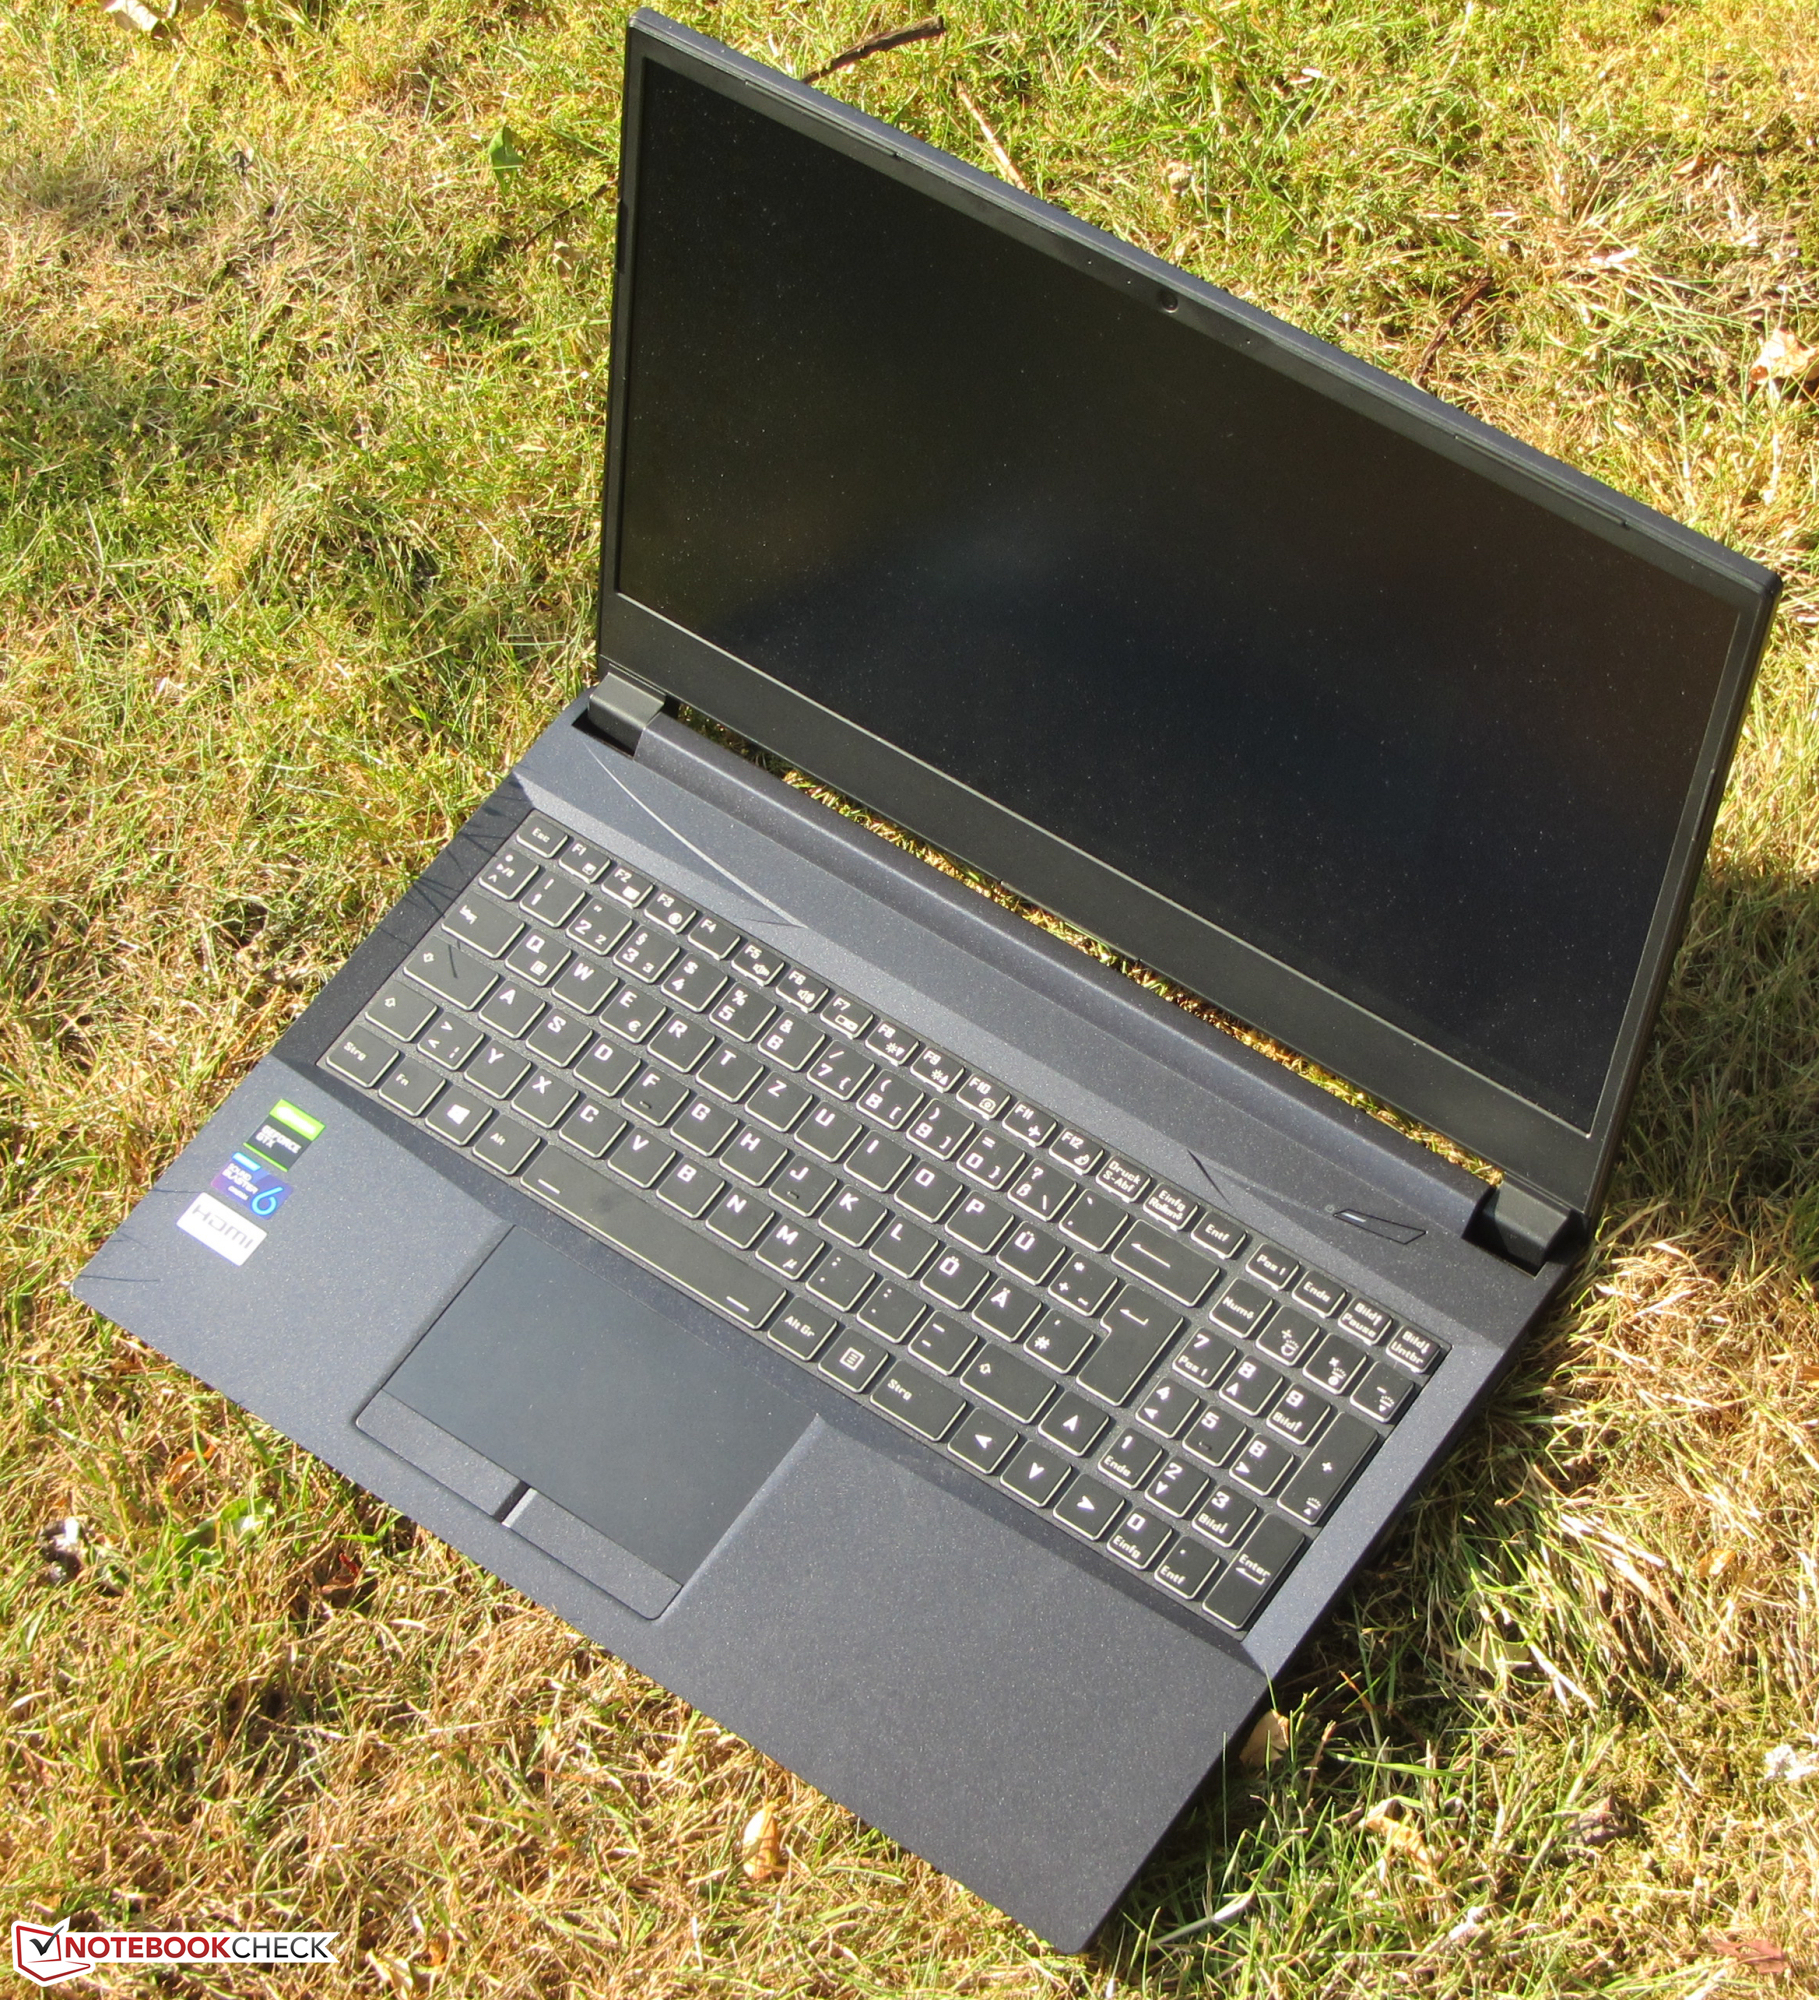
With the GH5 515IG, Nexoc delivers a well-rounded gaming laptop from the entry-level segment that can be customized to users' own needs.
De laptop kan individueel worden geconfigureerd in de Nexoc online-shop. Terwijl de basisversie verkrijgbaar is voor ongeveer 850 euro, moet je zo'n 1040 euro neertellen voor de configuratievariant die aan ons werd geleverd. We kunnen leven met de ingebouwde SATA-SSD (500 GB, M.2 2280) aangezien het mogelijk is om een configuratie te kiezen met een extra schijf. Een NVMe-SSD wordt aanbevolen als systeemschijf voor alle potentiële kopers.
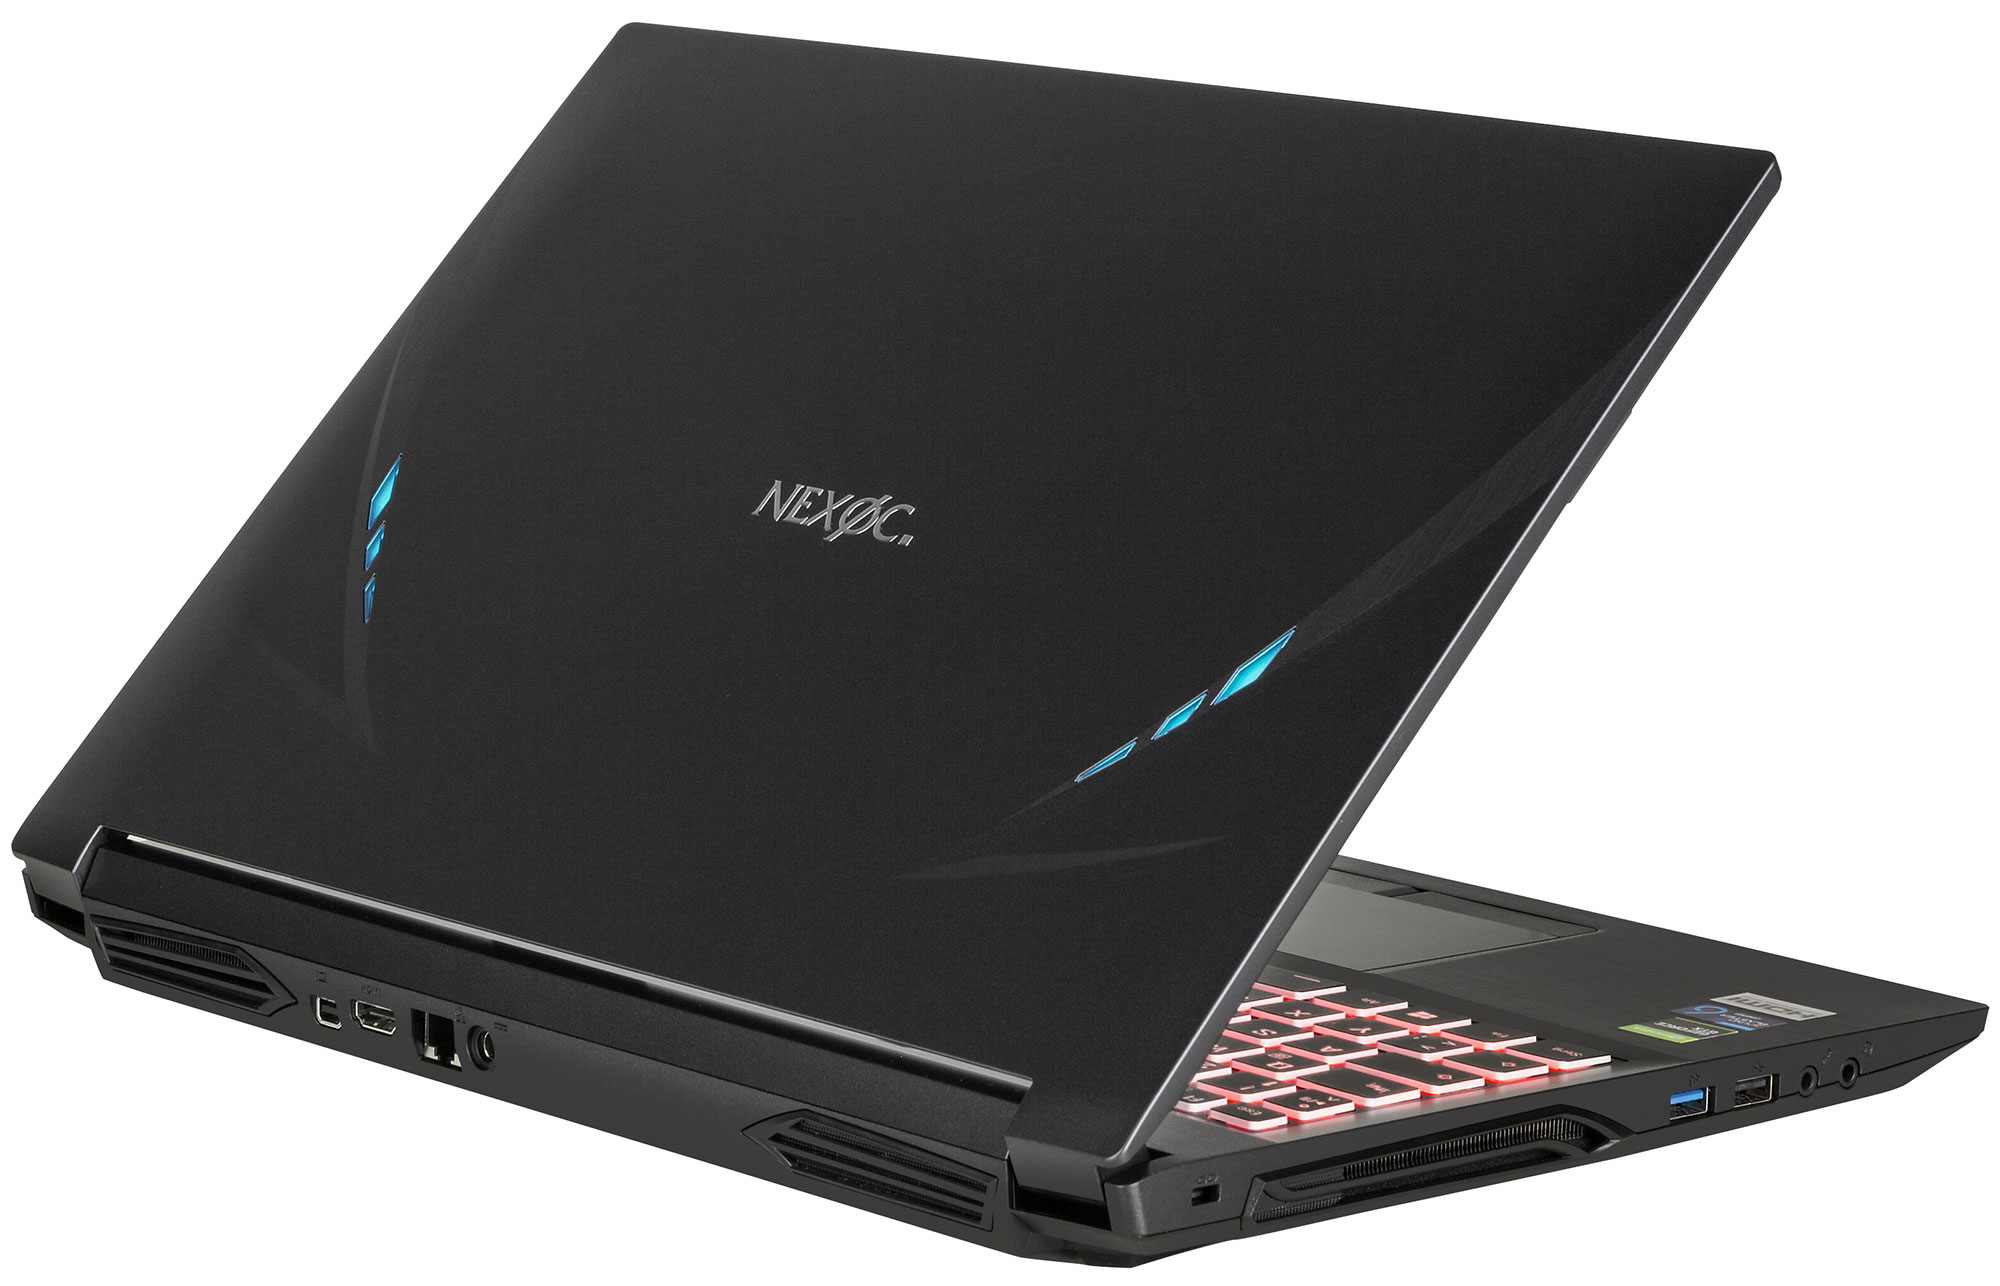
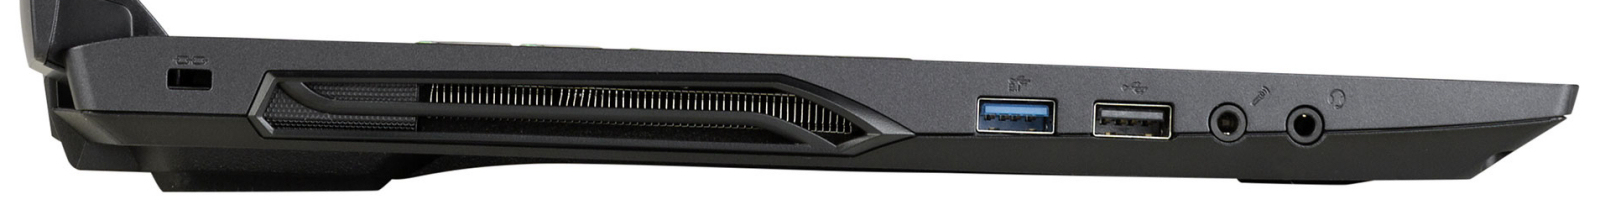
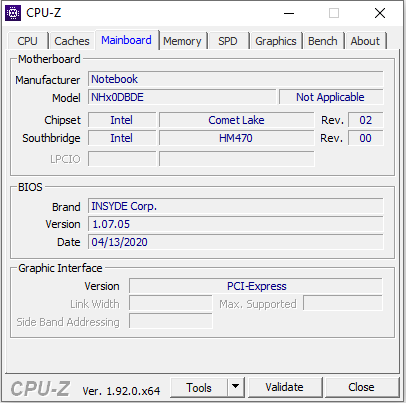
De laptop heeft ruimte voor twee M.2-SSD's (1x NVMe / SATA, 1x NVMe; RAID 0/1) en een 2,5-inch-opslagschijf. Mocht de opslagruimte van de ingebouwde 500-GB-SSD opraken, dan is deze eenvoudig uit te breiden. Om dit te doen, zou de onderkant van de laptop moeten worden verwijderd, aangezien er geen onderhoudsluik is.
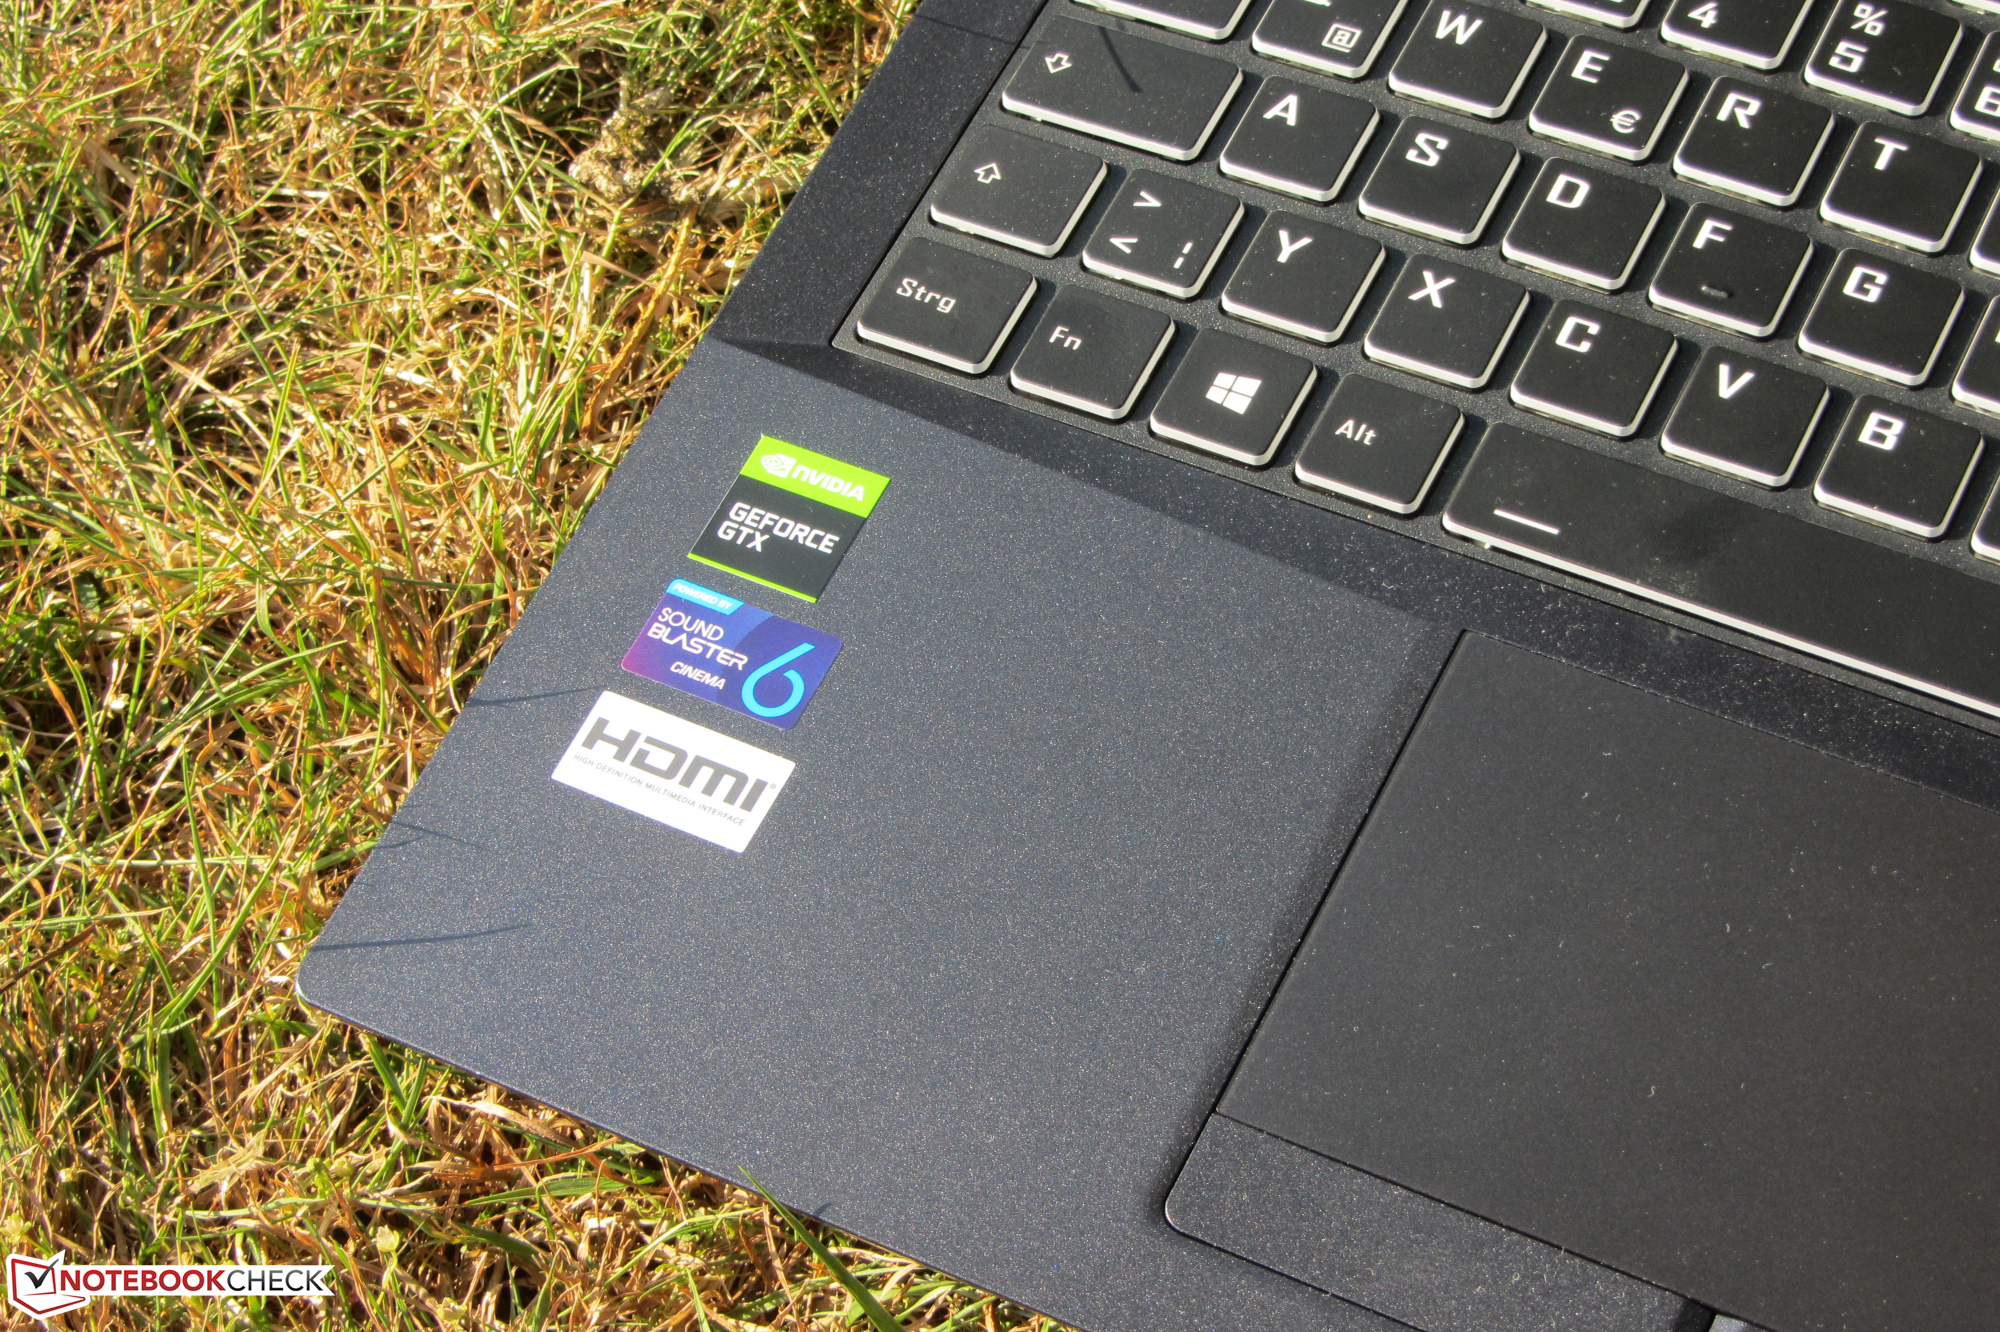
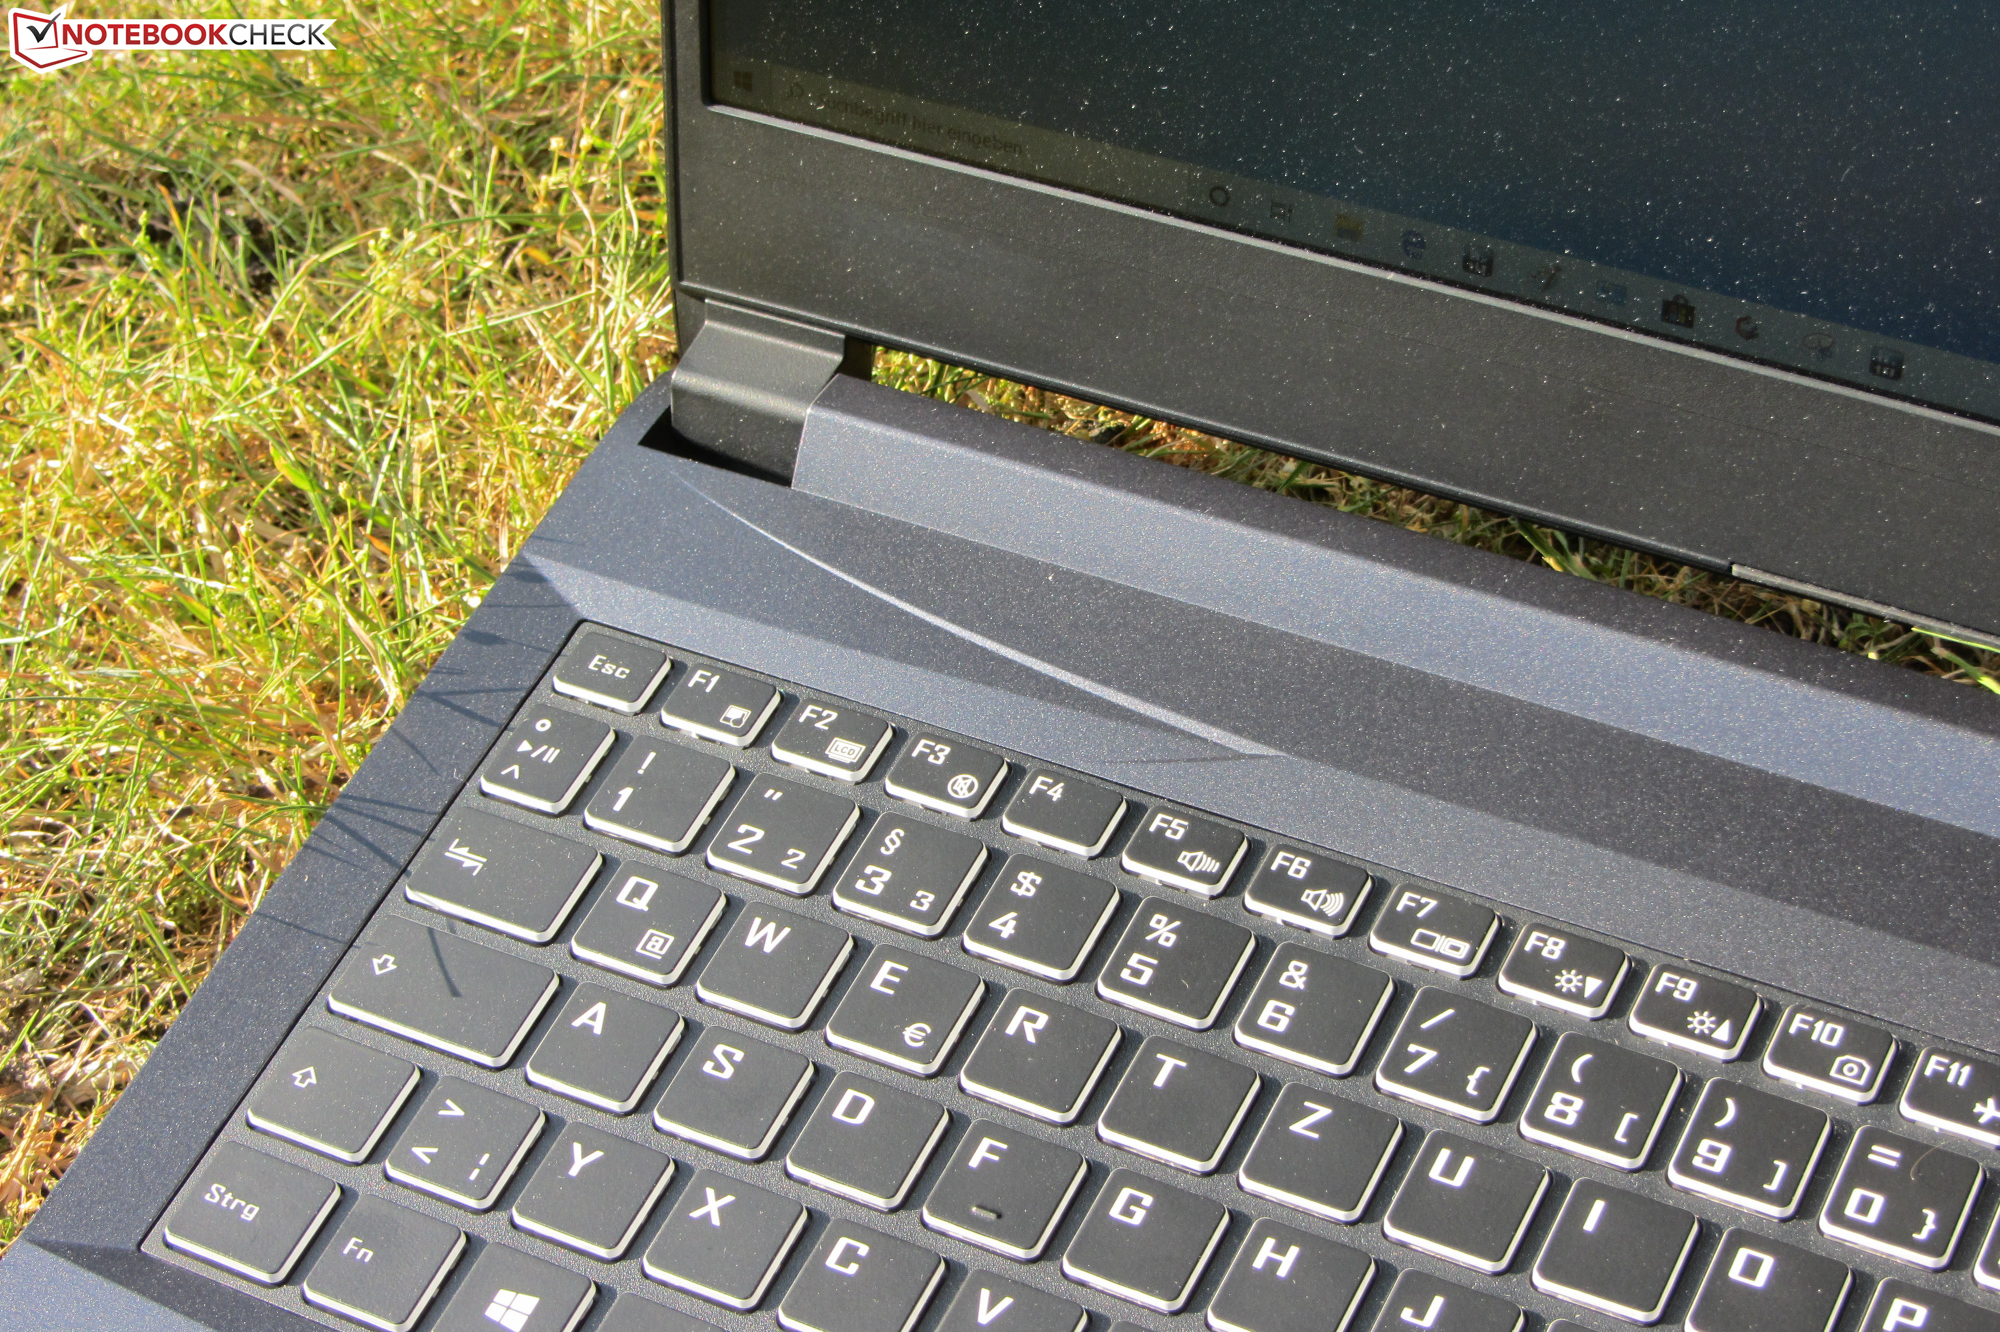
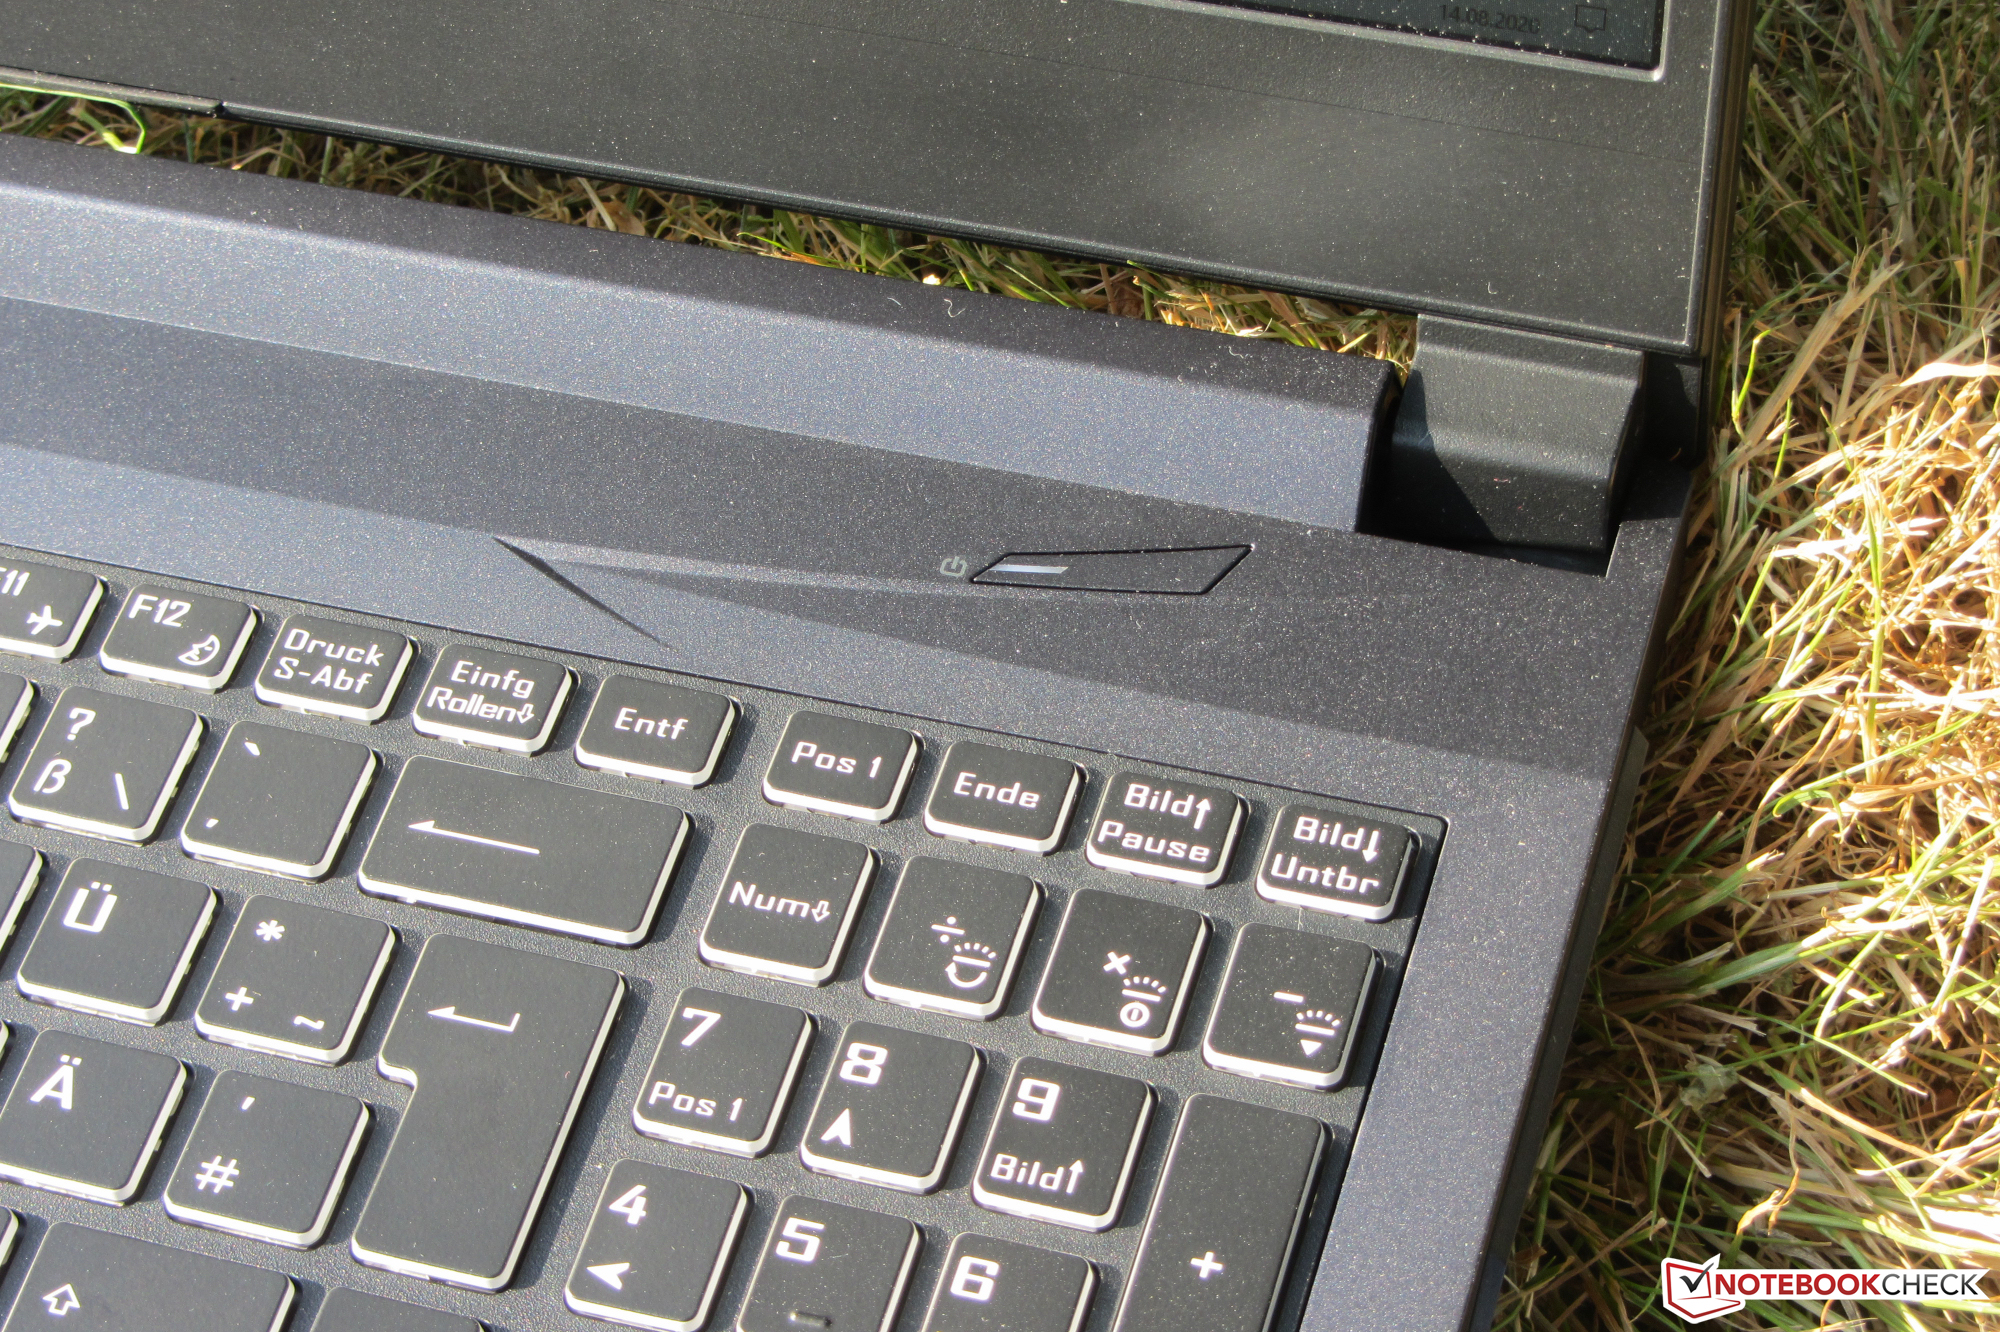
Het Full HD IPS-scherm biedt stabiele kijkhoeken, een mat oppervlak, goed contrast en een behoorlijke kleurweergave. De maximale helderheid is echter te laag. De dekking van de kleurruimte is evenmin een reden tot enthousiasme. Verder is het ingebouwde toetsenbord (RGB-verlichting) geschikt gebleken voor alledaags gebruik, terwijl de batterijduur ook prima is.
Nexoc GH5 515IG
- 19-08-2020 v7 (old)
Sascha Mölck
Price comparison
