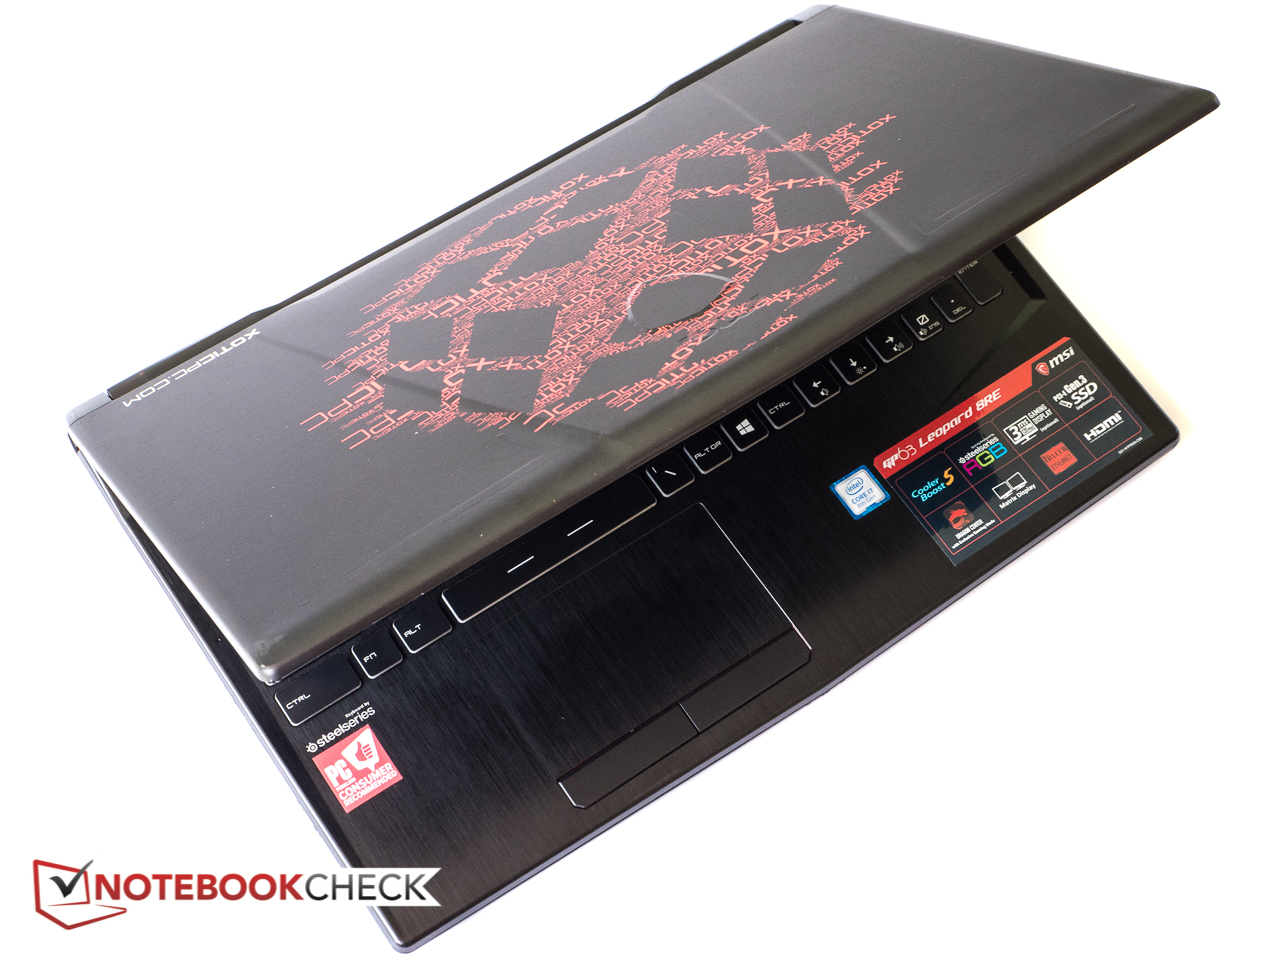
Kort testrapport MSI GP63 Leopard 8RE (i7-8750H, GTX 1060, FHD) Xotic PC Edition Laptop
| SD Card Reader | |
| average JPG Copy Test (av. of 3 runs) (sorteer op waarde) | |
| MSI GP63 Leopard 8RE-013US (Toshiba Exceria Pro SDXC 64 GB UHS-II) | |
| HP Omen 15-ce002ng (Toshiba Exceria Pro SDXC 64 GB UHS-II) | |
| Acer Aspire VN7-593G-73HP V15 Nitro BE | |
| Asus Strix GL703VM-DB74 (Toshiba Exceria Pro SDXC 64 GB UHS-II) | |
| Eurocom Q6 (Toshiba Exceria Pro SDXC 64 GB UHS-II) | |
| maximum AS SSD Seq Read Test (1GB) (sorteer op waarde) | |
| MSI GP63 Leopard 8RE-013US (Toshiba Exceria Pro SDXC 64 GB UHS-II) | |
| HP Omen 15-ce002ng (Toshiba Exceria Pro SDXC 64 GB UHS-II) | |
| Acer Aspire VN7-593G-73HP V15 Nitro BE | |
| Asus Strix GL703VM-DB74 (Toshiba Exceria Pro SDXC 64 GB UHS-II) | |
| Eurocom Q6 (Toshiba Exceria Pro SDXC 64 GB UHS-II) | |
| |||||||||||||||||||||||||
Helderheidsverdeling: 87 %
Helderheid in Batterij-modus: 368.5 cd/m²
Contrast: 1084:1 (Zwart: 0.34 cd/m²)
ΔE ColorChecker Calman: 8.91 | ∀{0.5-29.43 Ø4.73}
calibrated: 2.87
ΔE Greyscale Calman: 12 | ∀{0.09-98 Ø4.97}
99.98% sRGB (Argyll 1.6.3 3D)
85.94% AdobeRGB 1998 (Argyll 1.6.3 3D)
85.9% AdobeRGB 1998 (Argyll 3D)
100% sRGB (Argyll 3D)
91.5% Display P3 (Argyll 3D)
Gamma: 1.825
CCT: 11519 K
| MSI GP63 Leopard 8RE-013US Chi Mei CMN15F4 (N156HHE-GA1 CMN), TN LED, 120 Hz, 15.6", 1920x1080 | HP Omen 15-ce002ng AUO42ED, IPS, 15.6", 1920x1080 | Lenovo Legion Y720 80VR002XGE LG Philips LGD0533 LP156WF6-SPK3, IPS, 15.6", 1920x1080 | Acer Aspire VN7-593G-73HP V15 Nitro BE LG Display LP156WF6-SPP1, AH-IPS, Normally Black, Transmissive, 15.6", 1920x1080 | MSI GE63VR 7RF Raider Chi Mei N156HHE-GA1 (CMN15F4), TN LED, 15.6", 1920x1080 | |
|---|---|---|---|---|---|
| Display | -20% | -52% | -24% | 0% | |
| Display P3 Coverage (%) | 91.5 | 65.8 -28% | 38.43 -58% | 65.8 -28% | 91.3 0% |
| sRGB Coverage (%) | 100 | 90.9 -9% | 57.5 -43% | 85.1 -15% | 100 0% |
| AdobeRGB 1998 Coverage (%) | 85.9 | 66.5 -23% | 39.75 -54% | 62.2 -28% | 86.7 1% |
| Response Times | -176% | -133% | -188% | 37% | |
| Response Time Grey 50% / Grey 80% * (ms) | 24 ? | 43.2 ? -80% | 43 ? -79% | 41 ? -71% | 9.6 ? 60% |
| Response Time Black / White * (ms) | 8.4 ? | 31.2 ? -271% | 24 ? -186% | 34 ? -305% | 7.2 ? 14% |
| PWM Frequency (Hz) | 26040 ? | 21000 ? | 26000 ? | ||
| Screen | 14% | -4% | 6% | 19% | |
| Brightness middle (cd/m²) | 368.5 | 304 -18% | 288 -22% | 322 -13% | 285 -23% |
| Brightness (cd/m²) | 341 | 289 -15% | 275 -19% | 297 -13% | 273 -20% |
| Brightness Distribution (%) | 87 | 86 -1% | 86 -1% | 86 -1% | 84 -3% |
| Black Level * (cd/m²) | 0.34 | 0.26 24% | 0.36 -6% | 0.31 9% | 0.23 32% |
| Contrast (:1) | 1084 | 1169 8% | 800 -26% | 1039 -4% | 1239 14% |
| Colorchecker dE 2000 * | 8.91 | 3.46 61% | 5.29 41% | 4.73 47% | 3.52 60% |
| Colorchecker dE 2000 max. * | 14.39 | 7.72 46% | 9.97 31% | 12.37 14% | 5.18 64% |
| Colorchecker dE 2000 calibrated * | 2.87 | ||||
| Greyscale dE 2000 * | 12 | 2.46 79% | 4.5 62% | 2.99 75% | 3.41 72% |
| Gamma | 1.825 121% | 2.38 92% | 2.39 92% | 2.32 95% | 2.05 107% |
| CCT | 11519 56% | 6915 94% | 6839 95% | 6905 94% | 7077 92% |
| Color Space (Percent of AdobeRGB 1998) (%) | 85.94 | 59 -31% | 37 -57% | 56 -35% | 77 -10% |
| Color Space (Percent of sRGB) (%) | 99.98 | 91 -9% | 57 -43% | 85 -15% | 100 0% |
| Totaal Gemiddelde (Programma / Instellingen) | -61% /
-18% | -63% /
-31% | -69% /
-26% | 19% /
17% |
* ... kleiner is beter
Responstijd Scherm
| ↔ Responstijd Zwart naar Wit | ||
|---|---|---|
| 8.4 ms ... stijging ↗ en daling ↘ gecombineerd | ↗ 6 ms stijging | 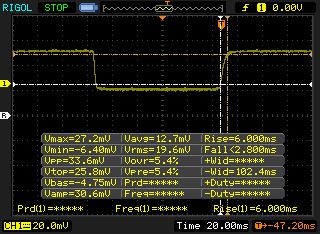 |
| ↘ 2.4 ms daling | ||
| Het scherm vertoonde snelle responstijden in onze tests en zou geschikt moeten zijn voor games. Ter vergelijking: alle testtoestellen variëren van 0.1 (minimum) tot 240 (maximum) ms. » 24 % van alle toestellen zijn beter. Dit betekent dat de gemeten responstijd beter is dan het gemiddelde (19.9 ms) van alle geteste toestellen. | ||
| ↔ Responstijd 50% Grijs naar 80% Grijs | ||
| 24 ms ... stijging ↗ en daling ↘ gecombineerd | ↗ 12.8 ms stijging | 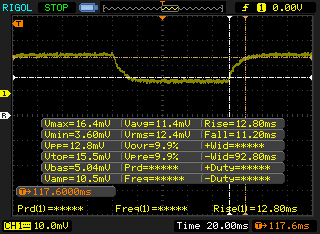 |
| ↘ 11.2 ms daling | ||
| Het scherm vertoonde prima responstijden in onze tests maar is misschien wat te traag voor competitieve games. Ter vergelijking: alle testtoestellen variëren van 0.165 (minimum) tot 636 (maximum) ms. » 34 % van alle toestellen zijn beter. Dit betekent dat de gemeten responstijd beter is dan het gemiddelde (31.1 ms) van alle geteste toestellen. | ||
Screen Flickering / PWM (Pulse-Width Modulation)
| Screen flickering / PWM waargenomen | 26040 Hz | ≤ 19 % helderheid instelling | 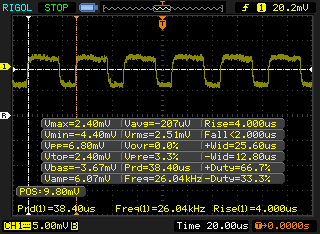 |
De achtergrondverlichting van het scherm flikkert op 26040 Hz (in het slechtste geval, bijvoorbeeld bij gebruik van PWM) aan een helderheid van 19 % en lager. Boven deze helderheid zou er geen flickering / PWM mogen optreden. De frequentie van 26040 Hz is redelijk hoog en de meeste mensen die gevoelig zijn aan flickering zouden dit dus niet mogen waarnemen of geïrriteerde ogen krijgen. Ter vergelijking: 52 % van alle geteste toestellen maakten geen gebruik van PWM om de schermhelderheid te verlagen. Als het wel werd gebruikt, werd een gemiddelde van 7801 (minimum: 5 - maximum: 343500) Hz waargenomen. | |||
| PCMark 8 Home Score Accelerated v2 | 4415 punten | |
| PCMark 8 Creative Score Accelerated v2 | 5336 punten | |
| PCMark 8 Work Score Accelerated v2 | 5354 punten | |
Help | ||
| MSI GP63 Leopard 8RE-013US Samsung PM871b MZNLN128HAHQ | Gigabyte Aero 15X Samsung SM961 MZVKW512HMJP m.2 PCI-e | Eurocom Q6 Samsung SSD 960 Pro 512 GB m.2 | MSI GE63VR 7RF Raider Toshiba HG6 THNSNJ256G8NY | Dell Inspiron 15 7000 7577 Samsung PM961 MZVLW256HEHP | |
|---|---|---|---|---|---|
| AS SSD | 259% | 282% | 16% | 145% | |
| Copy Game MB/s (MB/s) | 220.7 | 933 323% | 633 187% | 382.5 73% | |
| Copy Program MB/s (MB/s) | 328.1 | 323.8 -1% | 363.4 11% | 274.8 -16% | |
| Copy ISO MB/s (MB/s) | 690 | 1851 168% | 1768 156% | 814 18% | |
| Score Total (Points) | 742 | 3570 381% | 3894 425% | 930 25% | 2405 224% |
| Score Write (Points) | 245 | 1333 444% | 1693 591% | 293 20% | 594 142% |
| Score Read (Points) | 325 | 1522 368% | 1477 354% | 420 29% | 1241 282% |
| Access Time Write * (ms) | 0.072 | 0.033 54% | 0.039 46% | 0.045 37% | 0.037 49% |
| Access Time Read * (ms) | 0.155 | 0.068 56% | 0.049 68% | 0.168 -8% | 0.058 63% |
| 4K-64 Write (MB/s) | 137.8 | 1106 703% | 1403 918% | 170.6 24% | 375.8 173% |
| 4K-64 Read (MB/s) | 253 | 1225 384% | 1195 372% | 350.3 38% | 929 267% |
| 4K Write (MB/s) | 60.8 | 113.8 87% | 96.2 58% | 77.3 27% | 100.2 65% |
| 4K Read (MB/s) | 21.88 | 46.56 113% | 29.62 35% | 19.55 -11% | 46.95 115% |
| Seq Write (MB/s) | 462.9 | 1124 143% | 1943 320% | 447 -3% | 1181 155% |
| Seq Read (MB/s) | 504 | 2508 398% | 2523 401% | 506 0% | 2652 426% |
* ... kleiner is beter

| 3DMark 11 Performance | 14174 punten | |
| 3DMark Cloud Gate Standard Score | 32310 punten | |
| 3DMark Fire Strike Score | 10722 punten | |
| 3DMark Fire Strike Extreme Score | 5536 punten | |
Help | ||
| The Witcher 3 | |
| 1366x768 Medium Graphics & Postprocessing | |
| Eurocom Q6 | |
| MSI GP63 Leopard 8RE-013US | |
| Asus GL702ZC-GC104T | |
| HP Omen 15-ce002ng | |
| Lenovo Legion Y720 80VR002XGE | |
| 1920x1080 High Graphics & Postprocessing (Nvidia HairWorks Off) | |
| Eurocom Q6 | |
| Gigabyte Aero 15X v8 | |
| Dell Inspiron 15 7000 7577 | |
| MSI GP63 Leopard 8RE-013US | |
| Asus GL702ZC-GC104T | |
| Lenovo Legion Y720 80VR002XGE | |
| HP Omen 15-ce002ng | |
| 1920x1080 Ultra Graphics & Postprocessing (HBAO+) | |
| MSI GE63VR 7RF Raider | |
| Gigabyte Aero 15X v8 | |
| Eurocom Q6 | |
| MSI GP63 Leopard 8RE-013US | |
| Asus Strix GL703VM-DB74 | |
| Asus GL702ZC-GC104T | |
| Lenovo Legion Y720 80VR002XGE | |
| Dell Inspiron 15 7000 7577 | |
| HP Omen 15-ce002ng | |
| Rise of the Tomb Raider | |
| 1366x768 Medium Preset AF:2x | |
| Eurocom Q6 | |
| MSI GP63 Leopard 8RE-013US | |
| HP Omen 15-ce002ng | |
| Asus GL702ZC-GC104T | |
| MSI GP62 7REX-1045US | |
| 1920x1080 High Preset AA:FX AF:4x | |
| MSI GE63VR 7RF Raider | |
| Eurocom Q6 | |
| MSI GP63 Leopard 8RE-013US | |
| Dell Inspiron 15 7000 7577 | |
| HP Omen 15-ce002ng | |
| Asus GL702ZC-GC104T | |
| MSI GP62 7REX-1045US | |
| 1920x1080 Very High Preset AA:FX AF:16x | |
| MSI GE63VR 7RF Raider | |
| Eurocom Q6 | |
| MSI GP63 Leopard 8RE-013US | |
| Asus Strix GL703VM-DB74 | |
| Dell Inspiron 15 7000 7577 | |
| Asus GL702ZC-GC104T | |
| HP Omen 15-ce002ng | |
| MSI GP62 7REX-1045US | |
| BioShock Infinite | |
| 1366x768 Medium Preset | |
| Eurocom Q6 | |
| MSI GP63 Leopard 8RE-013US | |
| Lenovo Legion Y720 80VR002XGE | |
| MSI GP62 7REX-1045US | |
| 1366x768 High Preset | |
| Eurocom Q6 | |
| MSI GP63 Leopard 8RE-013US | |
| Lenovo Legion Y720 80VR002XGE | |
| MSI GP62 7REX-1045US | |
| 1920x1080 Ultra Preset, DX11 (DDOF) | |
| Eurocom Q6 | |
| MSI GP63 Leopard 8RE-013US | |
| Asus Strix GL703VM-DB74 | |
| Lenovo Legion Y720 80VR002XGE | |
| Dell Inspiron 15 7000 7577 | |
| MSI GP62 7REX-1045US | |
| lage | gem. | hoge | ultra | |
|---|---|---|---|---|
| BioShock Infinite (2013) | 272.4 | 233.2 | 225.4 | 115.4 |
| The Witcher 3 (2015) | 197.4 | 138.7 | 68.5 | 42.3 |
| Rise of the Tomb Raider (2016) | 180.3 | 138.2 | 77.3 | 66.6 |
Geluidsniveau
| Onbelast |
| 32.8 / 32.8 / 33 dB (A) |
| Belasting |
| 35.8 / 52.3 dB (A) |
 | ||
30 dB stil 40 dB(A) hoorbaar 50 dB(A) luid |
||
min: | ||
| MSI GP63 Leopard 8RE-013US GeForce GTX 1060 Mobile, i7-8750H, Samsung PM871b MZNLN128HAHQ | HP Omen 15-ce002ng GeForce GTX 1060 Max-Q, i7-7700HQ, Samsung PM961 MZVLW256HEHP | Lenovo Legion Y720 80VR002XGE GeForce GTX 1060 Mobile, i7-7700HQ, Samsung PM961 MZVLW256HEHP | Acer Aspire VN7-593G-73HP V15 Nitro BE GeForce GTX 1060 Mobile, i7-7700HQ, Seagate Mobile HDD 1TB ST1000LM035 | Asus Strix GL703VM-DB74 GeForce GTX 1060 Mobile, i7-7700HQ, Seagate Mobile HDD 1TB ST1000LX015-1U7172 | |
|---|---|---|---|---|---|
| Noise | -0% | 6% | 3% | 2% | |
| uit / omgeving * (dB) | 28.4 | 30 -6% | 30.3 -7% | 30.4 -7% | 28.4 -0% |
| Idle Minimum * (dB) | 32.8 | 30 9% | 31 5% | 30.9 6% | 30.2 8% |
| Idle Average * (dB) | 32.8 | 33 -1% | 30.9 6% | 30.9 6% | 30.2 8% |
| Idle Maximum * (dB) | 33 | 37 -12% | 31.5 5% | 31.5 5% | 30.2 8% |
| Load Average * (dB) | 35.8 | 41 -15% | 38.7 -8% | 40.7 -14% | 38.4 -7% |
| Witcher 3 ultra * (dB) | 51 | 42 18% | 42 18% | 45.5 11% | 49.7 3% |
| Load Maximum * (dB) | 52.3 | 50 4% | 41.9 20% | 43.9 16% | 54.5 -4% |
* ... kleiner is beter
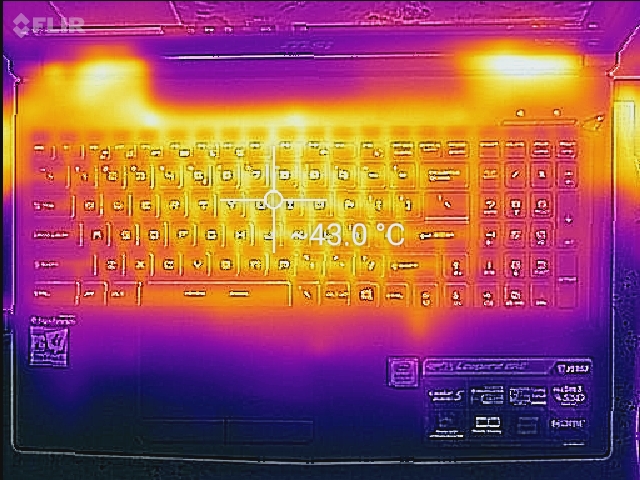
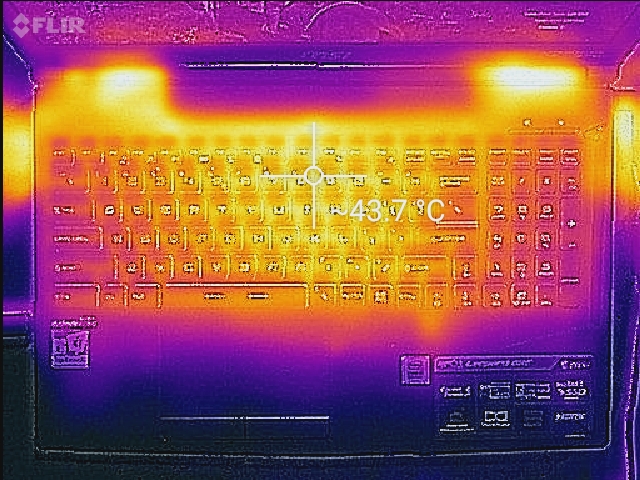
(±) De maximumtemperatuur aan de bovenzijde bedraagt 42.2 °C / 108 F, vergeleken met het gemiddelde van 40.4 °C / 105 F, variërend van 21.2 tot 68.8 °C voor de klasse Gaming.
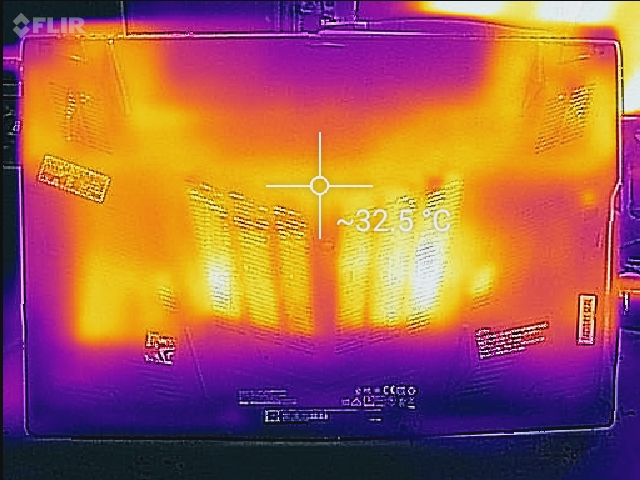
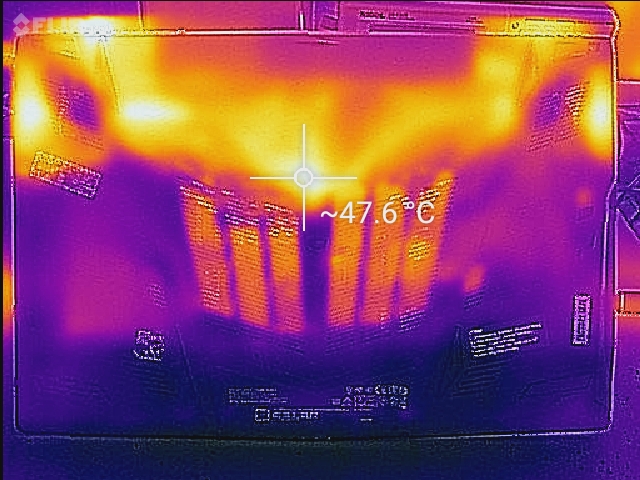
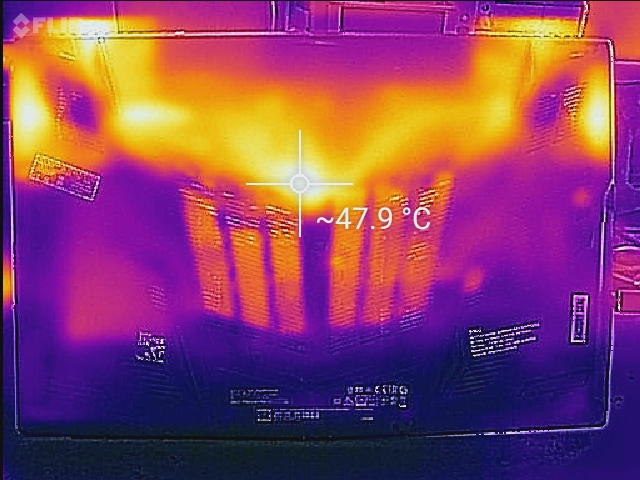
(-) De bodem warmt op tot een maximum van 47.8 °C / 118 F, vergeleken met een gemiddelde van 43.2 °C / 110 F
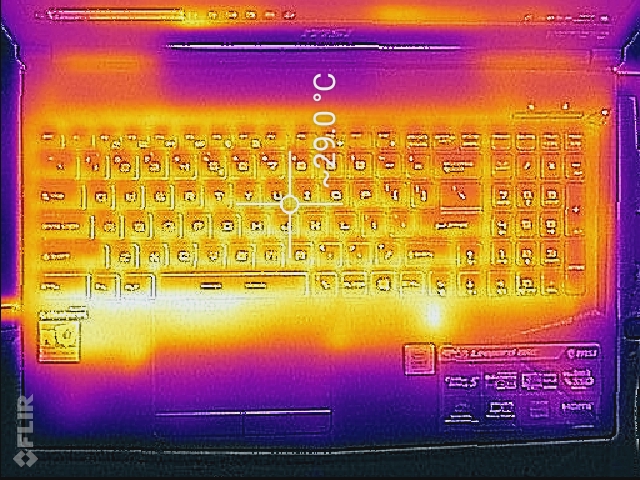
(+) Bij onbelast gebruik bedraagt de gemiddelde temperatuur voor de bovenzijde 25.9 °C / 79 F, vergeleken met het apparaatgemiddelde van 33.9 °C / 93 F.
(±) Bij het spelen van The Witcher 3 is de gemiddelde temperatuur voor de bovenzijde 34.7 °C / 94 F, vergeleken met het apparaatgemiddelde van 33.9 °C / 93 F.
(+) De palmsteunen en het touchpad zijn met een maximum van ###max## °C / 85.3 F koeler dan de huidtemperatuur en voelen daarom koel aan.
(±) De gemiddelde temperatuur van de handpalmsteun van soortgelijke toestellen bedroeg 28.8 °C / 83.8 F (-0.8 °C / -1.5 F).
MSI GP63 Leopard 8RE-013US audioanalyse
(±) | luidspreker luidheid is gemiddeld maar goed (78.3 dB)
Bas 100 - 315 Hz
(-) | bijna geen lage tonen - gemiddeld 23.1% lager dan de mediaan
(±) | lineariteit van de lage tonen is gemiddeld (10.6% delta ten opzichte van de vorige frequentie)
Midden 400 - 2000 Hz
(+) | evenwichtige middens - slechts 3% verwijderd van de mediaan
(±) | lineariteit van de middentonen is gemiddeld (7.1% delta ten opzichte van de vorige frequentie)
Hoog 2 - 16 kHz
(±) | higher highs - on average 5.8% higher than median
(+) | de hoge tonen zijn lineair (6% delta naar de vorige frequentie)
Algemeen 100 - 16.000 Hz
(±) | lineariteit van het totale geluid is gemiddeld (21.2% verschil met de mediaan)
Vergeleken met dezelfde klasse
» 76% van alle geteste apparaten in deze klasse waren beter, 4% vergelijkbaar, 19% slechter
» De beste had een delta van 6%, het gemiddelde was 18%, de slechtste was 132%
Vergeleken met alle geteste toestellen
» 59% van alle geteste apparaten waren beter, 7% gelijk, 34% slechter
» De beste had een delta van 4%, het gemiddelde was 24%, de slechtste was 134%
Apple MacBook 12 (Early 2016) 1.1 GHz audioanalyse
(+) | luidsprekers kunnen relatief luid spelen (83.6 dB)
Bas 100 - 315 Hz
(±) | verminderde zeebaars - gemiddeld 11.3% lager dan de mediaan
(±) | lineariteit van de lage tonen is gemiddeld (14.2% delta ten opzichte van de vorige frequentie)
Midden 400 - 2000 Hz
(+) | evenwichtige middens - slechts 2.4% verwijderd van de mediaan
(+) | de middentonen zijn lineair (5.5% delta ten opzichte van de vorige frequentie)
Hoog 2 - 16 kHz
(+) | evenwichtige hoogtepunten - slechts 2% verwijderd van de mediaan
(+) | de hoge tonen zijn lineair (4.5% delta naar de vorige frequentie)
Algemeen 100 - 16.000 Hz
(+) | het totale geluid is lineair (10.2% verschil met de mediaan)
Vergeleken met dezelfde klasse
» 7% van alle geteste apparaten in deze klasse waren beter, 2% vergelijkbaar, 91% slechter
» De beste had een delta van 5%, het gemiddelde was 18%, de slechtste was 53%
Vergeleken met alle geteste toestellen
» 5% van alle geteste apparaten waren beter, 1% gelijk, 94% slechter
» De beste had een delta van 4%, het gemiddelde was 24%, de slechtste was 134%
| Uit / Standby | |
| Inactief | |
| Belasting |
|
Key:
min: | |
| MSI GP63 Leopard 8RE-013US i7-8750H, GeForce GTX 1060 Mobile, Samsung PM871b MZNLN128HAHQ, TN LED, 120 Hz, 1920x1080, 15.6" | HP Omen 15-ce002ng i7-7700HQ, GeForce GTX 1060 Max-Q, Samsung PM961 MZVLW256HEHP, IPS, 1920x1080, 15.6" | Lenovo Legion Y720 80VR002XGE i7-7700HQ, GeForce GTX 1060 Mobile, Samsung PM961 MZVLW256HEHP, IPS, 1920x1080, 15.6" | Dell Inspiron 15 7000 7577 i5-7300HQ, GeForce GTX 1060 Max-Q, Samsung PM961 MZVLW256HEHP, IPS, 1920x1080, 15.6" | MSI GP62 7REX-1045US i7-7700HQ, GeForce GTX 1050 Ti Mobile, Toshiba NVMe THNSN5128GP, TN LED, 1920x1080, 15.6" | |
|---|---|---|---|---|---|
| Power Consumption | -46% | 17% | 34% | -14% | |
| Idle Minimum * (Watt) | 7.99 | 18 -125% | 8 -0% | 7.1 11% | 14.6 -83% |
| Idle Average * (Watt) | 12.15 | 23 -89% | 10.9 10% | 7.6 37% | 17.2 -42% |
| Idle Maximum * (Watt) | 13.4 | 30 -124% | 11.8 12% | 8.6 36% | 17.3 -29% |
| Load Average * (Watt) | 103.62 | 85 18% | 70 32% | 59.5 43% | 82.7 20% |
| Witcher 3 ultra * (Watt) | 156.1 | 96 39% | 102 35% | 89 43% | 107 31% |
| Load Maximum * (Watt) | 164.29 | 158 4% | 148 10% | 112.8 31% | 136.7 17% |
* ... kleiner is beter
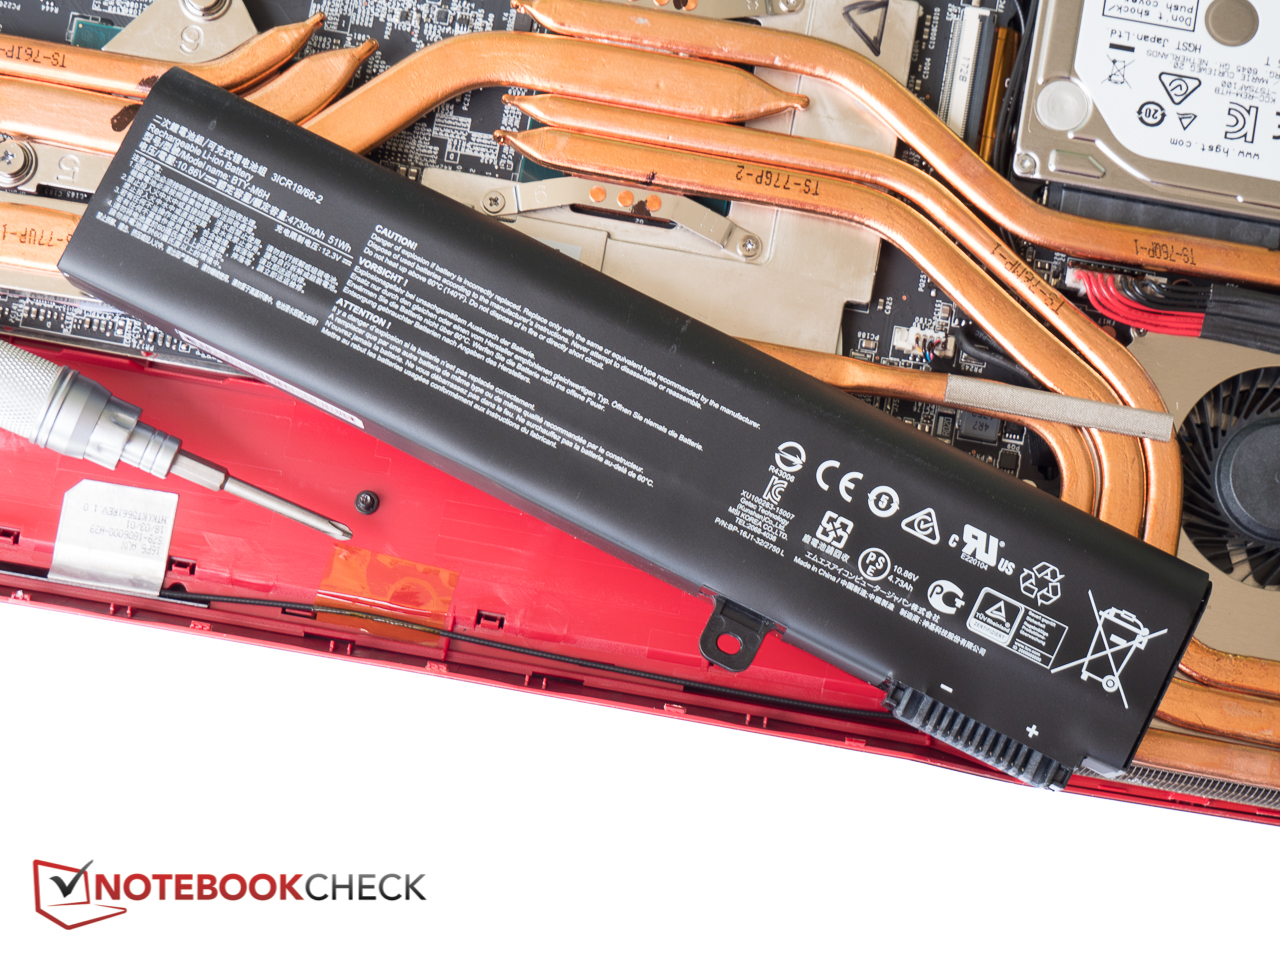
| MSI GP63 Leopard 8RE-013US i7-8750H, GeForce GTX 1060 Mobile, 51 Wh | HP Omen 15-ce002ng i7-7700HQ, GeForce GTX 1060 Max-Q, 70 Wh | Lenovo Legion Y720 80VR002XGE i7-7700HQ, GeForce GTX 1060 Mobile, 60 Wh | Acer Aspire VN7-593G-73HP V15 Nitro BE i7-7700HQ, GeForce GTX 1060 Mobile, 69 Wh | MSI GP62 7REX-1045US i7-7700HQ, GeForce GTX 1050 Ti Mobile, 41 Wh | Dell Inspiron 15 7000 7577 i5-7300HQ, GeForce GTX 1060 Max-Q, 56 Wh | |
|---|---|---|---|---|---|---|
| Batterijduur | -10% | 40% | 68% | -35% | 56% | |
| Reader / Idle (h) | 7.5 | 4.3 -43% | 11.8 57% | 8.4 12% | 4.3 -43% | 11 47% |
| WiFi v1.3 (h) | 4.8 | 3.3 -31% | 6.3 31% | 6 25% | 2.9 -40% | 6.9 44% |
| Load (h) | 0.9 | 1.3 44% | 1.2 33% | 2.4 167% | 0.7 -22% | 1.6 78% |
Pro
Contra

Voor het volledige, Engelse testrapport, klik hier.
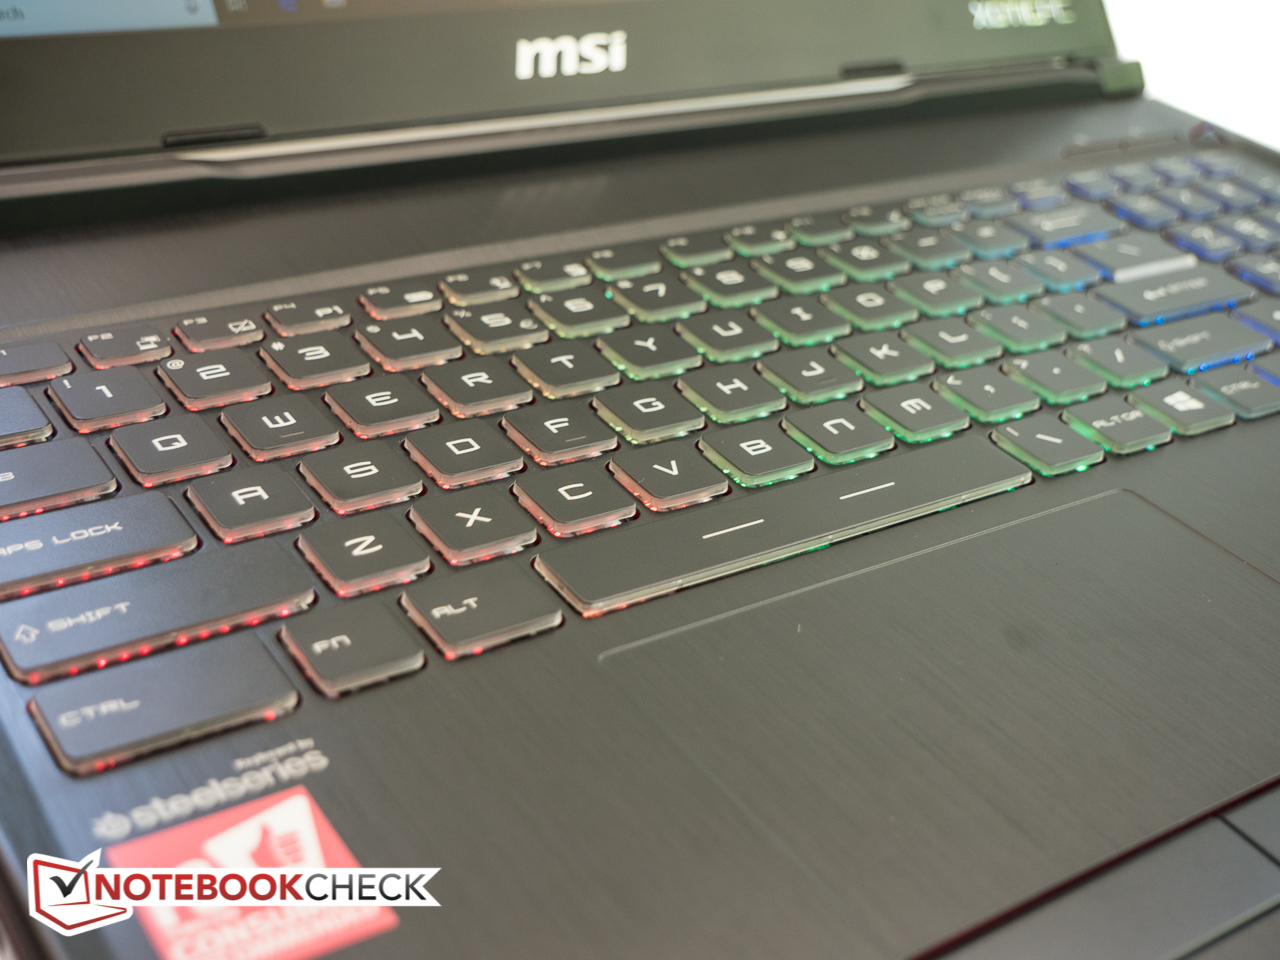
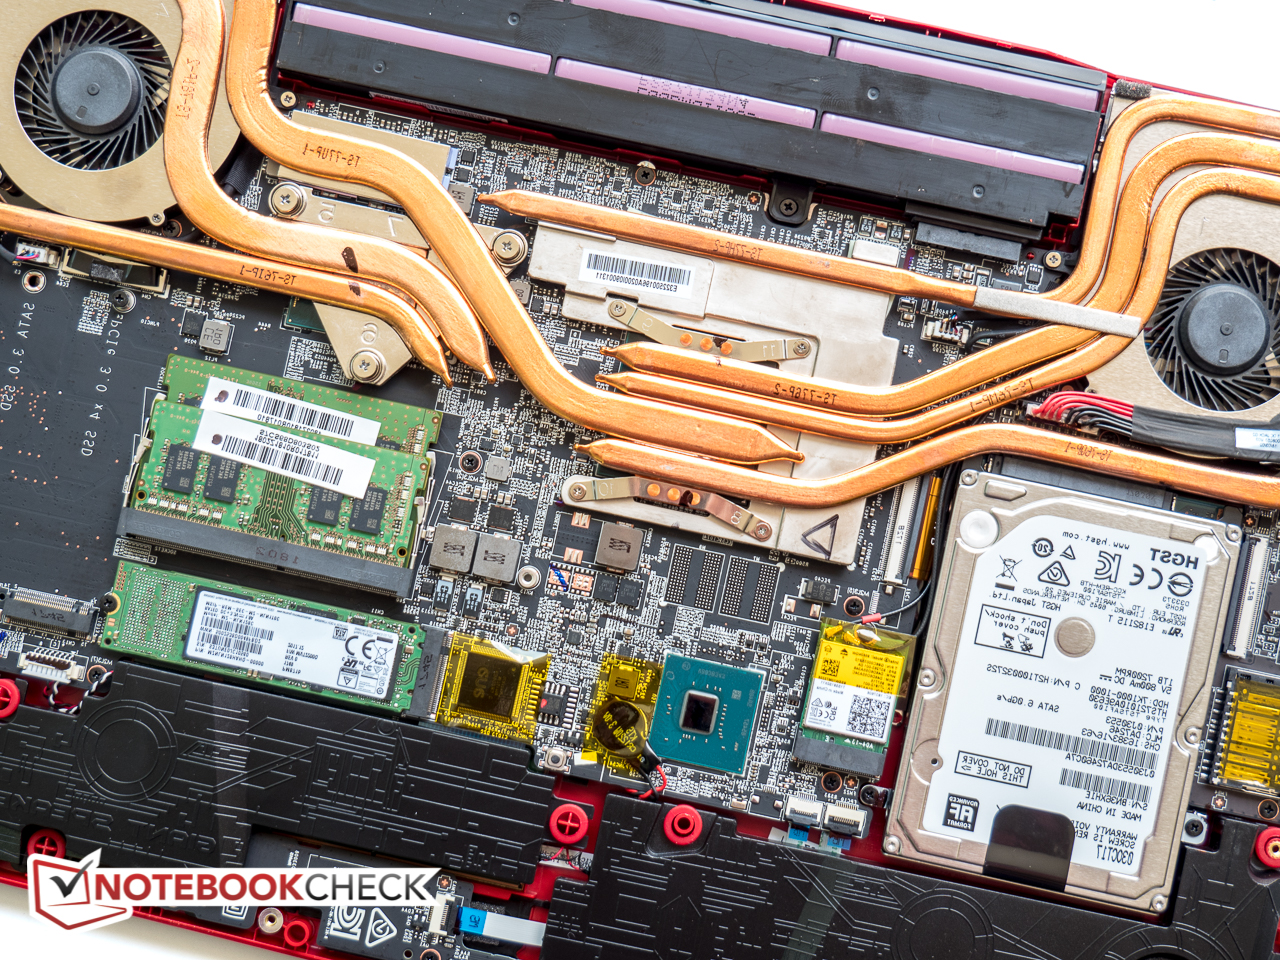
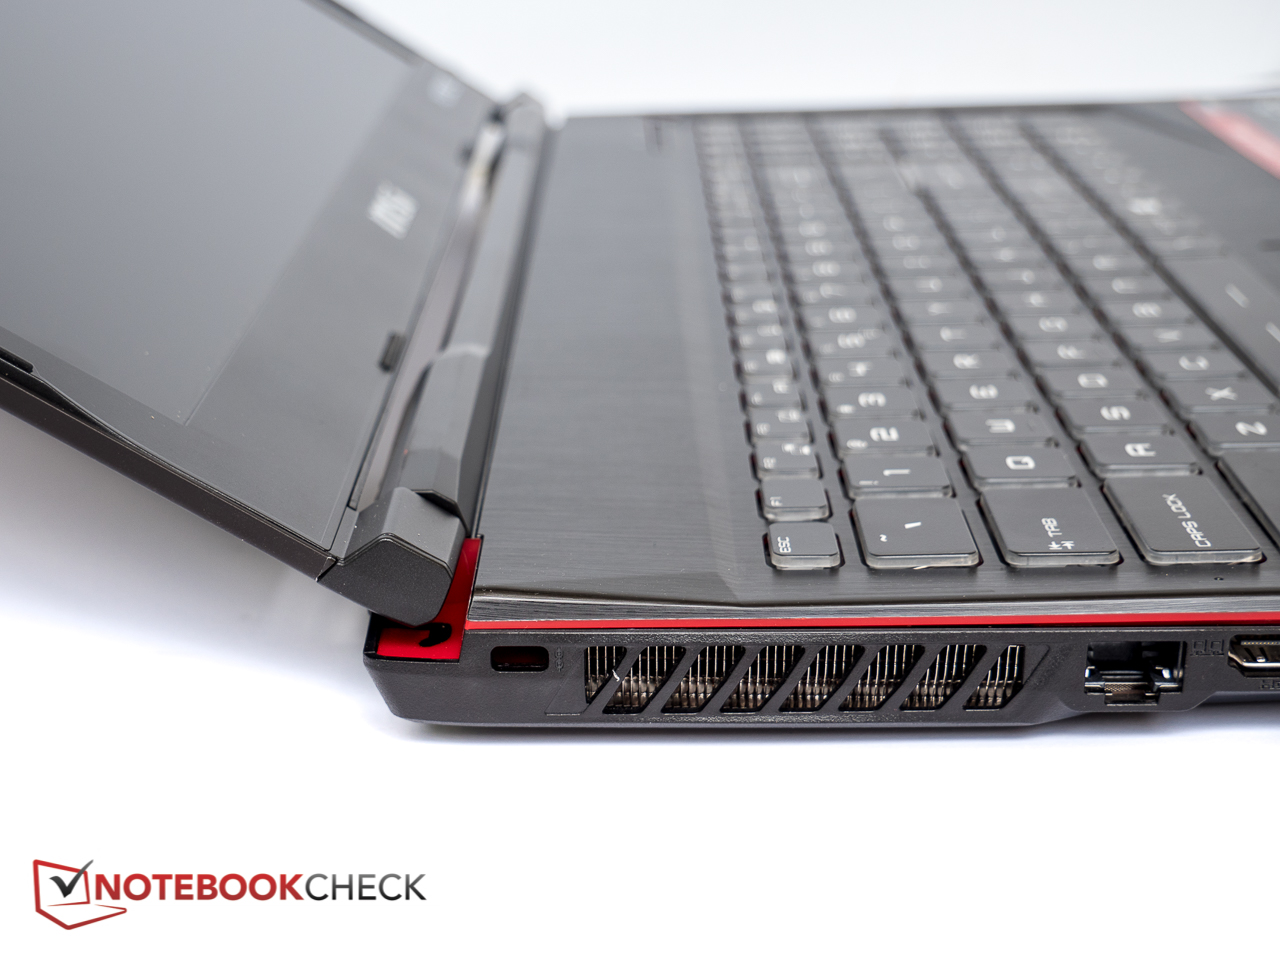
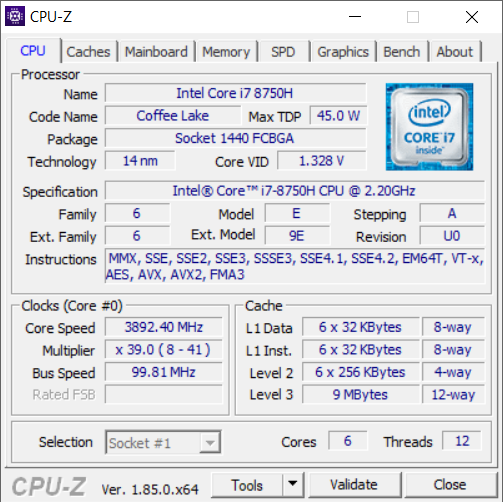
De MSI GP63 Leopard Xotic PC Edition is een grote vooruitgang op de GP62 voorganger. Hoewel de bouwkwaliteit nog te wensen over laat, garandeert de geüpdatet hardware in de vorm van een hexa-core Coffee Lake-H CPU en snellere GTX 1060 GPU een soepelere gaming ervaring. We stellen ook de USB 3.0 poort als vervanging van de weggelaten DVD +/- RW brander op prijs. Het toetsenbord met 3-zone achtergrondverlichting en het touchpad zijn comfortabel in gebruik. Het 120 Hz TN beeldscherm is helder en reproduceert - na kalibratie - een degelijk kleurenspectrum. Ook de accucapaciteit is verhoogd, waardoor de veelzijdigheid verder is toegenomen.
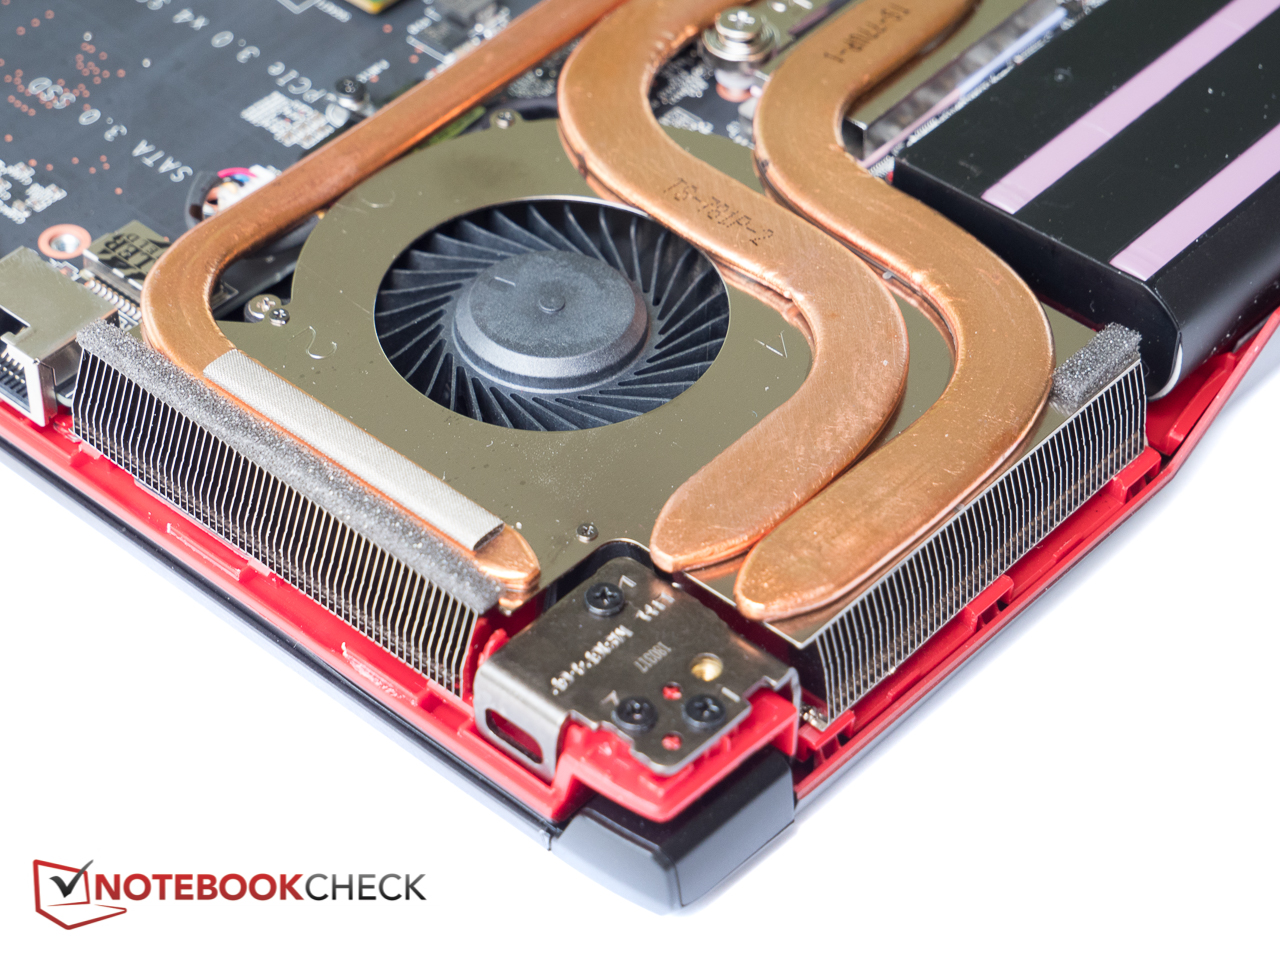
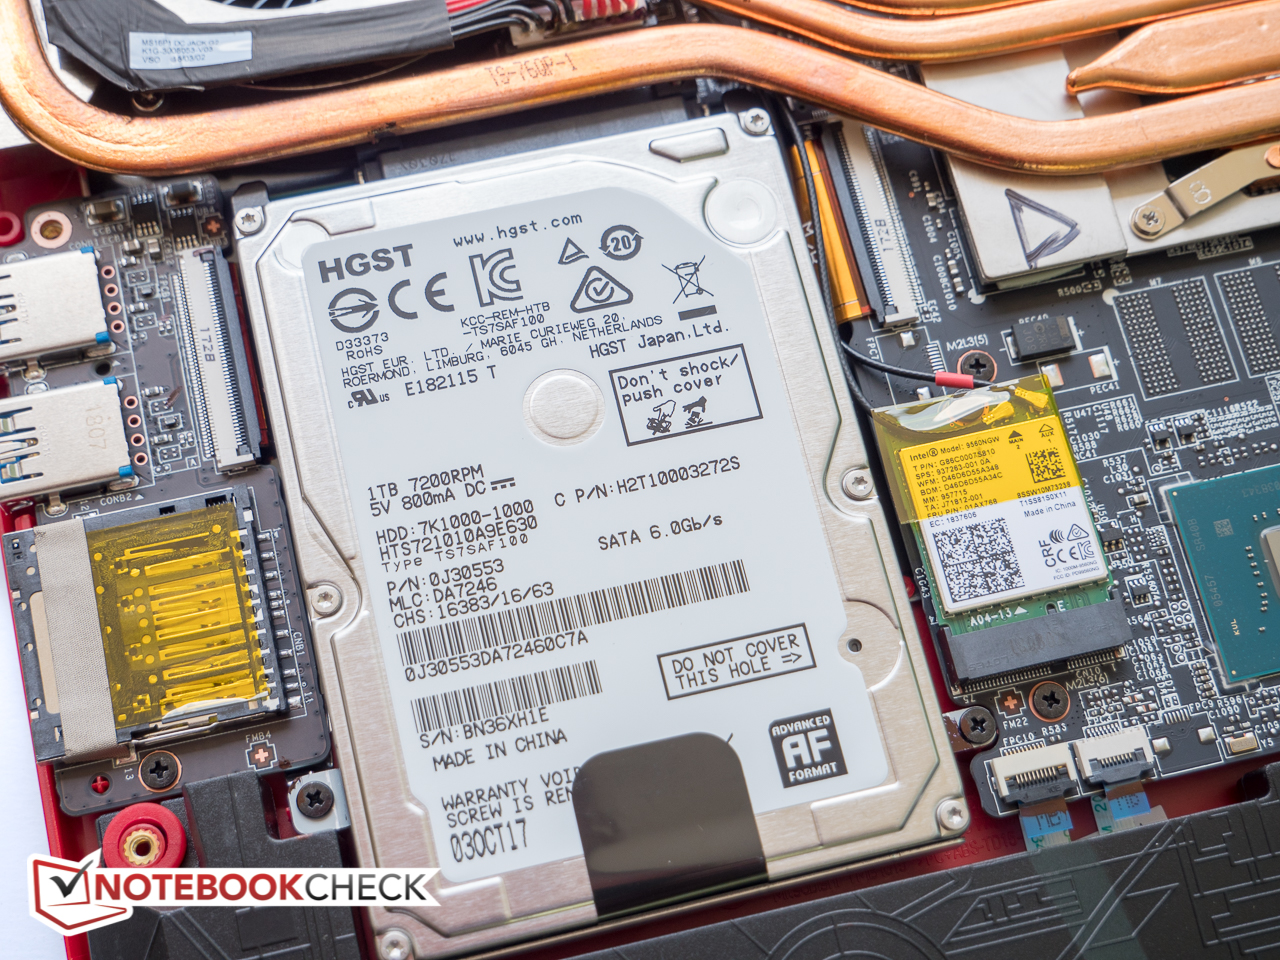
Het thermisch beheer blijft ondanks het verbeterde koelsysteem nogal conservatief. Terwijl CPU temperaturen meestal verrassend laag blijven, hebben de ruwe prestaties er wel onder te lijden. We zijn van mening dat een 128 GB SSD als hoofdschijf tegenwoordig het absolute minimum is en raden aan om te upgraden naar een grotere en snellere 256 GB PCIe NVMe SSD. Ondanks het 120 Hz beeldscherm is G-Sync niet beschikbaar.
De MSI GP63 Leopard Xotic PC Edition is een gebalanceerde gaming laptop met uitstekende prestaties - maar staat niet bekend als koopje.
MSI GP63 Leopard 8RE-013US
- 13-06-2018 v6 (old)
Bernie Pechlaner
Price comparison
