Kort testrapport Dell Inspiron 13 5379 (i5-8250U, UHD 620) Convertible
| SD Card Reader | |
| average JPG Copy Test (av. of 3 runs) | |
| Lenovo Miix 520-12IKB 81CG | |
| Dell Inspiron 13-5379-9573 (Toshiba Exceria Pro SDXC 64 GB UHS-II) | |
| Acer Spin 5 SP513-52N-54SF (Toshiba Exceria Pro SDXC 64 GB UHS-II) | |
| Dell Inspiron 13 5368 (Toshiba Exceria Pro SDXC 64 GB UHS-II) | |
| maximum AS SSD Seq Read Test (1GB) | |
| Lenovo Miix 520-12IKB 81CG | |
| Dell Inspiron 13-5379-9573 (Toshiba Exceria Pro SDXC 64 GB UHS-II) | |
| Acer Spin 5 SP513-52N-54SF (Toshiba Exceria Pro SDXC 64 GB UHS-II) | |
| Dell Inspiron 13 5368 (Toshiba Exceria Pro SDXC 64 GB UHS-II) | |
| Networking | |
| iperf3 transmit AX12 | |
| Lenovo Yoga 720-13IKB | |
| Dell Inspiron 13-5379-9573 | |
| Acer Spin 5 SP513-52N-54SF | |
| Lenovo Miix 520-12IKB 81CG | |
| iperf3 receive AX12 | |
| Dell Inspiron 13-5379-9573 | |
| Lenovo Yoga 720-13IKB | |
| Lenovo Miix 520-12IKB 81CG | |
| Acer Spin 5 SP513-52N-54SF | |
| |||||||||||||||||||||||||
Helderheidsverdeling: 81 %
Helderheid in Batterij-modus: 276 cd/m²
Contrast: 856:1 (Zwart: 0.32 cd/m²)
ΔE ColorChecker Calman: 5.57 | ∀{0.5-29.43 Ø4.71}
ΔE Greyscale Calman: 4.66 | ∀{0.09-98 Ø4.96}
61% sRGB (Argyll 1.6.3 3D)
39% AdobeRGB 1998 (Argyll 1.6.3 3D)
42.6% AdobeRGB 1998 (Argyll 3D)
61.7% sRGB (Argyll 3D)
41.2% Display P3 (Argyll 3D)
Gamma: 2.53
CCT: 7010 K
| Dell Inspiron 13-5379-9573 BOE BOE06A7, , 1920x1080, 13.3" | Lenovo Yoga 720-13IKB BOE CQ NV133FHM-N61, , 1920x1080, 13.3" | Acer Spin 5 SP513-52N-54SF LC133LF102, , 1920x1080, 13.3" | Lenovo Miix 520-12IKB 81CG Unknown, , 1920x1200, 12.2" | Dell Inspiron 13 5368 AUO B133HAB, , 1920x1080, 13.3" | |
|---|---|---|---|---|---|
| Display | 53% | 62% | 52% | -6% | |
| Display P3 Coverage (%) | 41.2 | 67.8 65% | 69.8 69% | 64.4 56% | 38.88 -6% |
| sRGB Coverage (%) | 61.7 | 88.2 43% | 94.6 53% | 90.8 47% | 57.7 -6% |
| AdobeRGB 1998 Coverage (%) | 42.6 | 64.4 51% | 69.3 63% | 65.4 54% | 40.17 -6% |
| Response Times | -7% | 5% | 18% | 4% | |
| Response Time Grey 50% / Grey 80% * (ms) | 45 ? | 48 ? -7% | 49 ? -9% | 35.6 ? 21% | 44 ? 2% |
| Response Time Black / White * (ms) | 33 ? | 35 ? -6% | 27 ? 18% | 28 ? 15% | 31 ? 6% |
| PWM Frequency (Hz) | 192 ? | 350 ? | 1000 ? | 198.4 ? | |
| Screen | 16% | 31% | -3% | 7% | |
| Brightness middle (cd/m²) | 274 | 297 8% | 295 8% | 348.8 27% | 240 -12% |
| Brightness (cd/m²) | 272 | 277 2% | 276 1% | 339 25% | 229 -16% |
| Brightness Distribution (%) | 81 | 87 7% | 88 9% | 87 7% | 92 14% |
| Black Level * (cd/m²) | 0.32 | 0.33 -3% | 0.27 16% | 0.4 -25% | 0.24 25% |
| Contrast (:1) | 856 | 900 5% | 1093 28% | 872 2% | 1000 17% |
| Colorchecker dE 2000 * | 5.57 | 4.93 11% | 2.97 47% | 7 -26% | 4.75 15% |
| Colorchecker dE 2000 max. * | 13.48 | 8.39 38% | 5.67 58% | 16.2 -20% | 9.09 33% |
| Greyscale dE 2000 * | 4.66 | 4.84 -4% | 3.12 33% | 10.1 -117% | 4.3 8% |
| Gamma | 2.53 87% | 2.5 88% | 2.45 90% | 2.22 99% | 2.5 88% |
| CCT | 7010 93% | 6894 94% | 6676 97% | 9065 72% | 5893 110% |
| Color Space (Percent of AdobeRGB 1998) (%) | 39 | 58 49% | 62 59% | 58.7 51% | 36.79 -6% |
| Color Space (Percent of sRGB) (%) | 61 | 88 44% | 94 54% | 90.9 49% | 57.39 -6% |
| Totaal Gemiddelde (Programma / Instellingen) | 21% /
20% | 33% /
34% | 22% /
11% | 2% /
4% |
* ... kleiner is beter
Responstijd Scherm
| ↔ Responstijd Zwart naar Wit | ||
|---|---|---|
| 33 ms ... stijging ↗ en daling ↘ gecombineerd | ↗ 20 ms stijging | 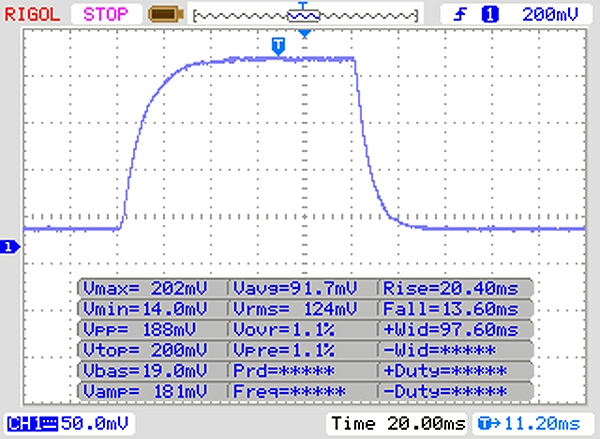 |
| ↘ 13 ms daling | ||
| Het scherm vertoonde trage responstijden in onze tests en is misschien te traag voor games. Ter vergelijking: alle testtoestellen variëren van 0.1 (minimum) tot 240 (maximum) ms. » 89 % van alle toestellen zijn beter. Dit betekent dat de gemeten responstijd slechter is dan het gemiddelde (19.8 ms) van alle geteste toestellen. | ||
| ↔ Responstijd 50% Grijs naar 80% Grijs | ||
| 45 ms ... stijging ↗ en daling ↘ gecombineerd | ↗ 24 ms stijging | 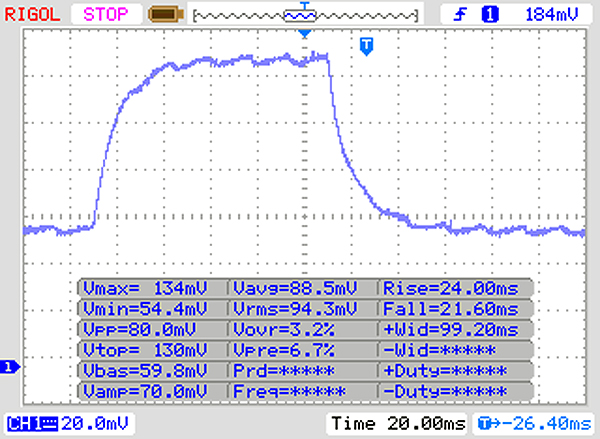 |
| ↘ 21 ms daling | ||
| Het scherm vertoonde trage responstijden in onze tests en is misschien te traag voor games. Ter vergelijking: alle testtoestellen variëren van 0.165 (minimum) tot 636 (maximum) ms. » 77 % van alle toestellen zijn beter. Dit betekent dat de gemeten responstijd slechter is dan het gemiddelde (31 ms) van alle geteste toestellen. | ||
Screen Flickering / PWM (Pulse-Width Modulation)
| Screen flickering / PWM waargenomen | 192 Hz | ≤ 90 % helderheid instelling | 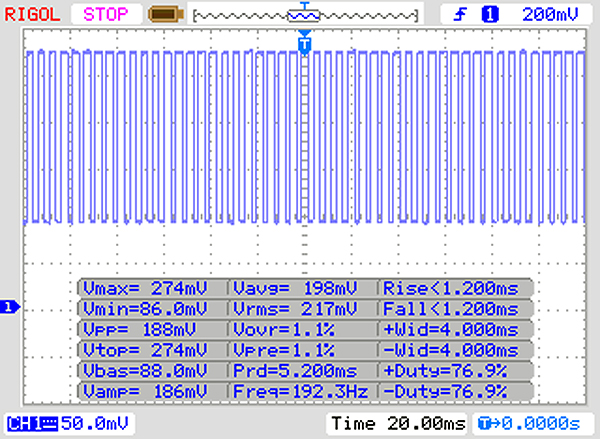 |
De achtergrondverlichting van het scherm flikkert op 192 Hz (in het slechtste geval, bijvoorbeeld bij gebruik van PWM) aan een helderheid van 90 % en lager. Boven deze helderheid zou er geen flickering / PWM mogen optreden. De frequentie van 192 Hz is redelijk laag en de meeste mensen die gevoelig zijn aan flickering kunnen dit dus waarnemen of geïrriteerde ogen krijgen (gebruikmakend van de vermelde helderheid en lager). Ter vergelijking: 52 % van alle geteste toestellen maakten geen gebruik van PWM om de schermhelderheid te verlagen. Als het wel werd gebruikt, werd een gemiddelde van 7751 (minimum: 5 - maximum: 343500) Hz waargenomen. | |||
| Cinebench R15 | |
| CPU Single 64Bit | |
| Acer Spin 5 SP513-52N-54SF | |
| Lenovo Miix 520-12IKB 81CG | |
| Dell Inspiron 13-5379-9573 | |
| Dell Inspiron 13 5368 | |
| Lenovo Yoga 720-13IKB | |
| CPU Multi 64Bit | |
| Dell Inspiron 13-5379-9573 | |
| Lenovo Miix 520-12IKB 81CG | |
| Acer Spin 5 SP513-52N-54SF | |
| Lenovo Yoga 720-13IKB | |
| Dell Inspiron 13 5368 | |
| PCMark 8 | |
| Home Score Accelerated v2 | |
| Lenovo Yoga 720-13IKB | |
| Lenovo Miix 520-12IKB 81CG | |
| Dell Inspiron 13 5368 | |
| Dell Inspiron 13-5379-9573 | |
| Acer Spin 5 SP513-52N-54SF | |
| Work Score Accelerated v2 | |
| Lenovo Yoga 720-13IKB | |
| Dell Inspiron 13-5379-9573 | |
| Dell Inspiron 13 5368 | |
| Acer Spin 5 SP513-52N-54SF | |
| Lenovo Miix 520-12IKB 81CG | |
| PCMark 8 Home Score Accelerated v2 | 3592 punten | |
| PCMark 8 Work Score Accelerated v2 | 4621 punten | |
Help | ||
| Dell Inspiron 13-5379-9573 Micron 1100 MTFDDAV256TBN | Lenovo Yoga 720-13IKB Toshiba XG4 NVMe (THNSN5512GPUK) | Acer Spin 5 SP513-52N-54SF Micron 1100 MTFDDAV256TBN | Dell Inspiron 13 5368 Toshiba THNSNK256GCS8 | |
|---|---|---|---|---|
| CrystalDiskMark 3.0 | 167% | 58% | 43% | |
| Read Seq (MB/s) | 447.9 | 1345 200% | 462.7 3% | 479 7% |
| Write Seq (MB/s) | 304.8 | 569 87% | 439.9 44% | 270.1 -11% |
| Read 512 (MB/s) | 293.7 | 1041 254% | 325.2 11% | 428.3 46% |
| Write 512 (MB/s) | 157 | 547 248% | 361.9 131% | 267.9 71% |
| Read 4k (MB/s) | 14.03 | 38.42 174% | 27.52 96% | 23.77 69% |
| Write 4k (MB/s) | 63.3 | 127.1 101% | 91.6 45% | 81.4 29% |
| Read 4k QD32 (MB/s) | 165.9 | 416.4 151% | 247.3 49% | 333.6 101% |
| Write 4k QD32 (MB/s) | 155.1 | 337.5 118% | 292 88% | 200.9 30% |

| 3DMark 11 - 1280x720 Performance GPU | |
| Lenovo Yoga 720-13IKB | |
| Lenovo Miix 520-12IKB 81CG | |
| Acer Spin 5 SP513-52N-54SF | |
| Dell Inspiron 13-5379-9573 | |
| Dell Inspiron 13 5368 | |
| 3DMark | |
| 1280x720 Cloud Gate Standard Graphics | |
| Lenovo Yoga 720-13IKB | |
| Acer Spin 5 SP513-52N-54SF | |
| Lenovo Miix 520-12IKB 81CG | |
| Dell Inspiron 13-5379-9573 | |
| Dell Inspiron 13 5368 | |
| 1920x1080 Fire Strike Graphics | |
| Lenovo Yoga 720-13IKB | |
| Acer Spin 5 SP513-52N-54SF | |
| Lenovo Miix 520-12IKB 81CG | |
| Dell Inspiron 13-5379-9573 | |
| 3DMark 11 Performance | 1643 punten | |
| 3DMark Cloud Gate Standard Score | 7244 punten | |
| 3DMark Fire Strike Score | 876 punten | |
Help | ||
| BioShock Infinite | |
| 1920x1080 Ultra Preset, DX11 (DDOF) | |
| Lenovo Yoga 720-13IKB | |
| Acer Spin 5 SP513-52N-54SF | |
| Dell Inspiron 13-5379-9573 | |
| Lenovo Miix 520-12IKB 81CG | |
| 1366x768 High Preset | |
| Dell Inspiron 13 5368 | |
| Lenovo Yoga 720-13IKB | |
| Acer Spin 5 SP513-52N-54SF | |
| Lenovo Miix 520-12IKB 81CG | |
| Dell Inspiron 13-5379-9573 | |
| 1366x768 Medium Preset | |
| Dell Inspiron 13 5368 | |
| Lenovo Yoga 720-13IKB | |
| Acer Spin 5 SP513-52N-54SF | |
| Lenovo Miix 520-12IKB 81CG | |
| Dell Inspiron 13-5379-9573 | |
| 1280x720 Very Low Preset | |
| Lenovo Yoga 720-13IKB | |
| Dell Inspiron 13 5368 | |
| Acer Spin 5 SP513-52N-54SF | |
| Lenovo Miix 520-12IKB 81CG | |
| Dell Inspiron 13-5379-9573 | |
| Thief | |
| 1366x768 High Preset AA:FXAA & Low SS AF:4x | |
| Dell Inspiron 13 5368 | |
| 1366x768 Normal Preset AA:FX | |
| Dell Inspiron 13 5368 | |
| Dell Inspiron 13-5379-9573 | |
| 1024x768 Very Low Preset | |
| Dell Inspiron 13 5368 | |
| Dell Inspiron 13-5379-9573 | |
| Rise of the Tomb Raider | |
| 1366x768 Medium Preset AF:2x | |
| Dell Inspiron 13-5379-9573 | |
| Dell Inspiron 13 5368 | |
| Lenovo Miix 520-12IKB 81CG | |
| 1024x768 Lowest Preset | |
| Lenovo Miix 520-12IKB 81CG | |
| Dell Inspiron 13-5379-9573 | |
| Dell Inspiron 13 5368 | |
| lage | gem. | hoge | ultra | |
|---|---|---|---|---|
| BioShock Infinite (2013) | 49.4 | 27.1 | 21.8 | 7.6 |
| Thief (2014) | 22.8 | 11.5 | ||
| Rise of the Tomb Raider (2016) | 20.8 | 11.7 |
Geluidsniveau
| Onbelast |
| 30.1 / 30.1 / 30.1 dB (A) |
| Belasting |
| 33 / 35 dB (A) |
 | ||
30 dB stil 40 dB(A) hoorbaar 50 dB(A) luid |
||
min: | ||
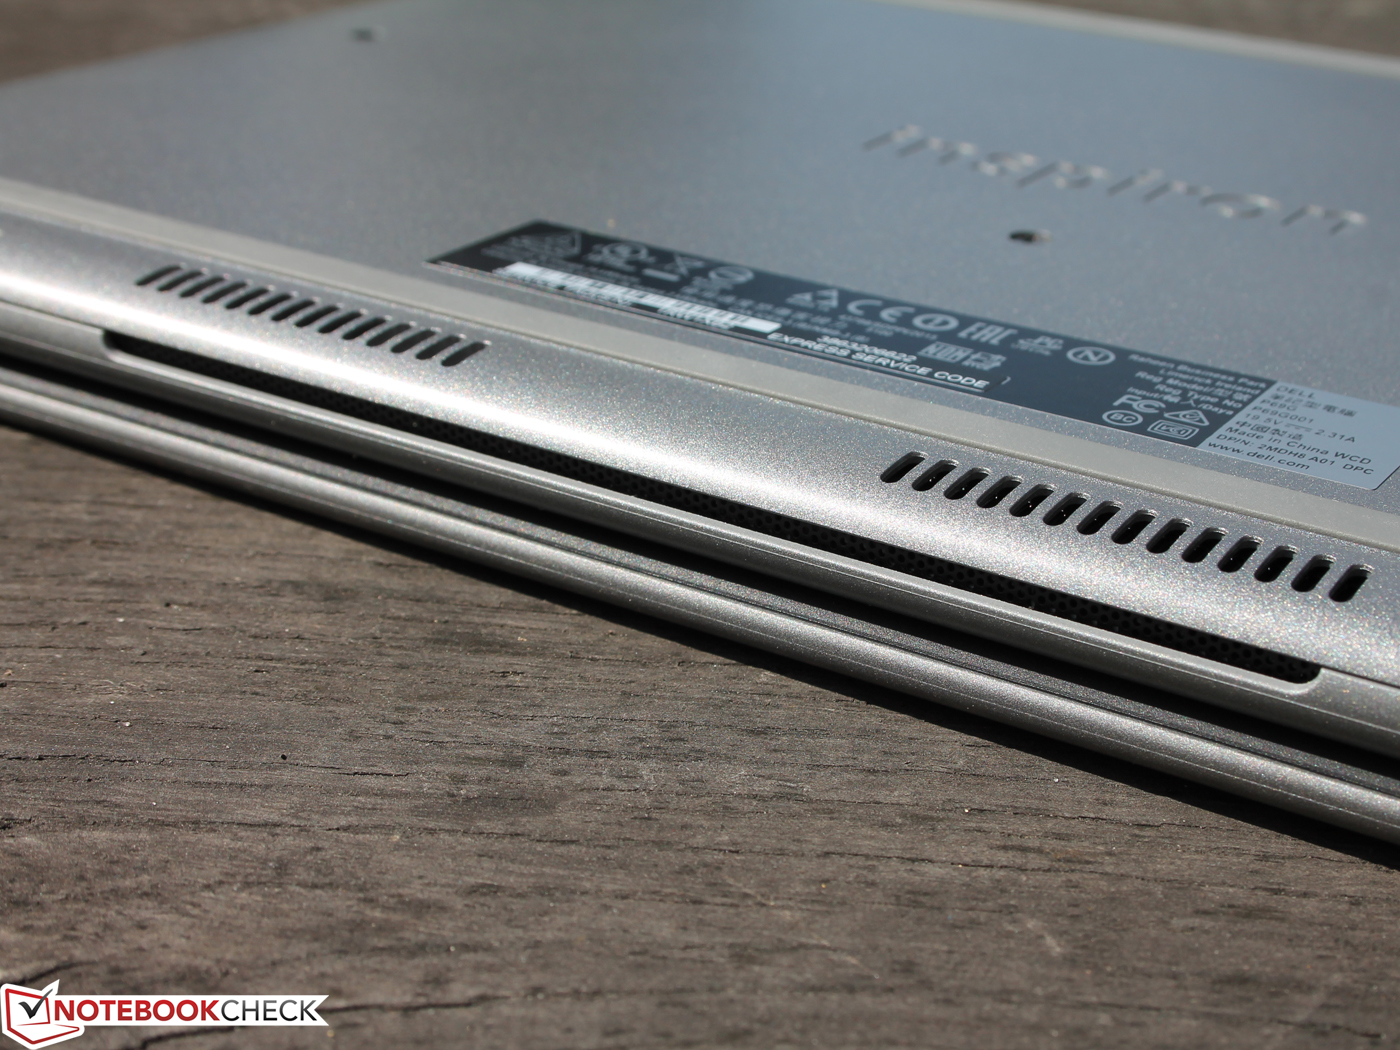
(±) De maximumtemperatuur aan de bovenzijde bedraagt 43.2 °C / 110 F, vergeleken met het gemiddelde van 35.4 °C / 96 F, variërend van 19.6 tot 60 °C voor de klasse Convertible.
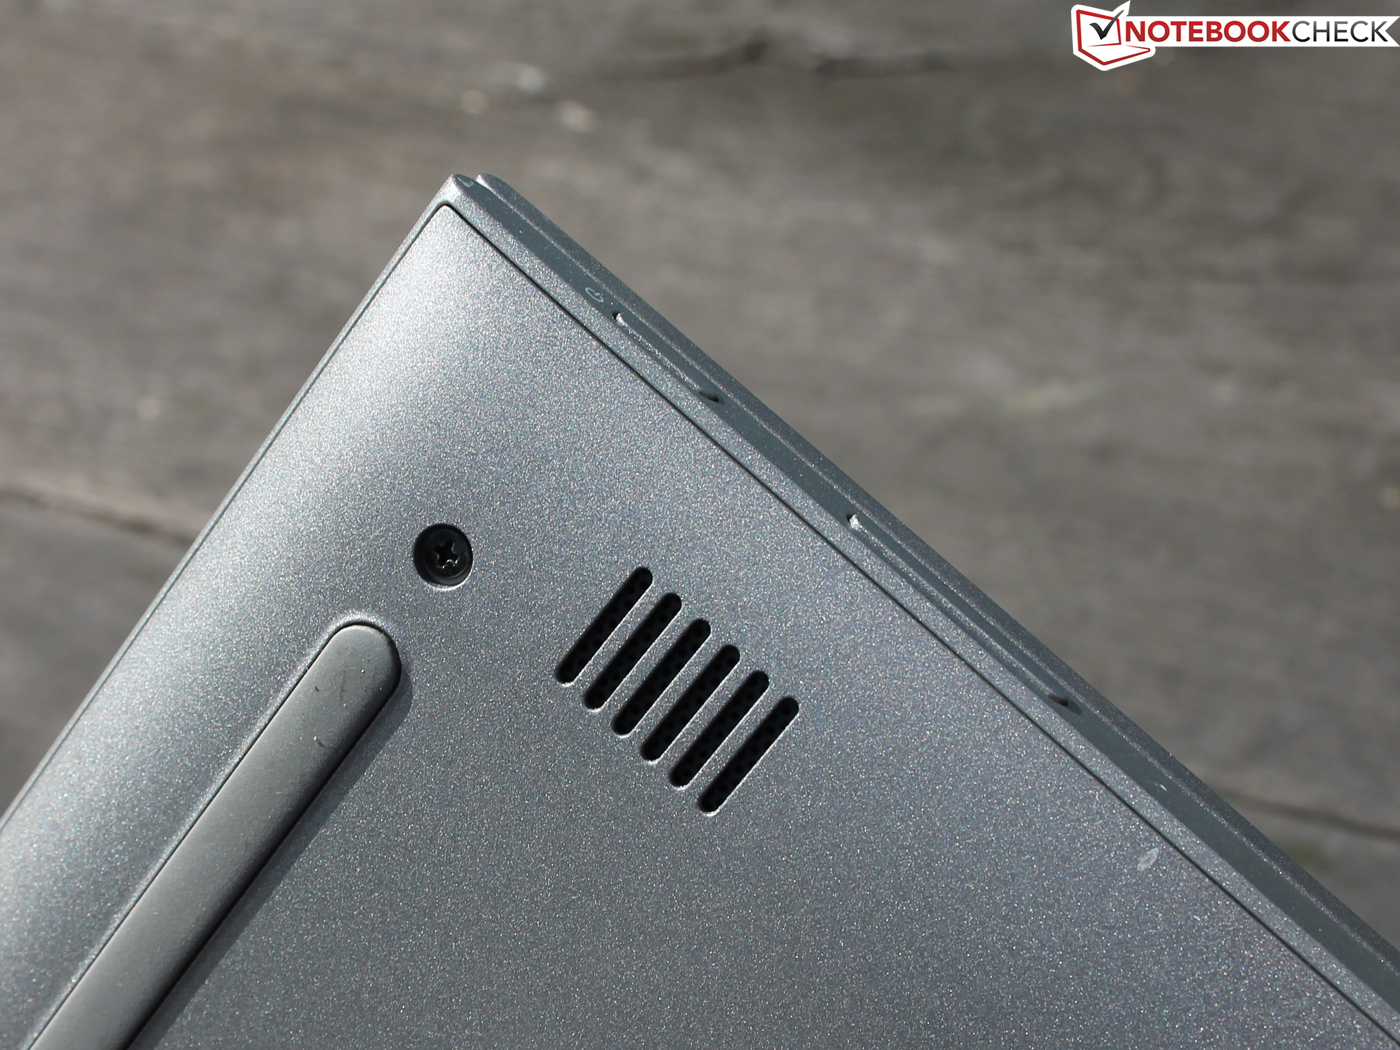
(-) De bodem warmt op tot een maximum van 57.8 °C / 136 F, vergeleken met een gemiddelde van 36.9 °C / 98 F
(+) Bij onbelast gebruik bedraagt de gemiddelde temperatuur voor de bovenzijde 29.9 °C / 86 F, vergeleken met het apparaatgemiddelde van 30.3 °C / 87 F.
(+) De palmsteunen en het touchpad zijn met een maximum van ###max## °C / 83.7 F koeler dan de huidtemperatuur en voelen daarom koel aan.
(±) De gemiddelde temperatuur van de handpalmsteun van soortgelijke toestellen bedroeg 28 °C / 82.4 F (-0.7 °C / -1.3 F).
Dell Inspiron 13-5379-9573 audioanalyse
(-) | niet erg luide luidsprekers (64.1 dB)
Bas 100 - 315 Hz
(±) | verminderde zeebaars - gemiddeld 10.2% lager dan de mediaan
(±) | lineariteit van de lage tonen is gemiddeld (7.6% delta ten opzichte van de vorige frequentie)
Midden 400 - 2000 Hz
(±) | hogere middens - gemiddeld 5.3% hoger dan de mediaan
(±) | lineariteit van de middentonen is gemiddeld (7.7% delta ten opzichte van de vorige frequentie)
Hoog 2 - 16 kHz
(±) | higher highs - on average 5.1% higher than median
(+) | de hoge tonen zijn lineair (6% delta naar de vorige frequentie)
Algemeen 100 - 16.000 Hz
(±) | lineariteit van het totale geluid is gemiddeld (21.3% verschil met de mediaan)
Vergeleken met dezelfde klasse
» 57% van alle geteste apparaten in deze klasse waren beter, 12% vergelijkbaar, 32% slechter
» De beste had een delta van 6%, het gemiddelde was 20%, de slechtste was 57%
Vergeleken met alle geteste toestellen
» 59% van alle geteste apparaten waren beter, 7% gelijk, 33% slechter
» De beste had een delta van 4%, het gemiddelde was 23%, de slechtste was 134%
Apple MacBook 12 (Early 2016) 1.1 GHz audioanalyse
(+) | luidsprekers kunnen relatief luid spelen (83.6 dB)
Bas 100 - 315 Hz
(±) | verminderde zeebaars - gemiddeld 11.3% lager dan de mediaan
(±) | lineariteit van de lage tonen is gemiddeld (14.2% delta ten opzichte van de vorige frequentie)
Midden 400 - 2000 Hz
(+) | evenwichtige middens - slechts 2.4% verwijderd van de mediaan
(+) | de middentonen zijn lineair (5.5% delta ten opzichte van de vorige frequentie)
Hoog 2 - 16 kHz
(+) | evenwichtige hoogtepunten - slechts 2% verwijderd van de mediaan
(+) | de hoge tonen zijn lineair (4.5% delta naar de vorige frequentie)
Algemeen 100 - 16.000 Hz
(+) | het totale geluid is lineair (10.2% verschil met de mediaan)
Vergeleken met dezelfde klasse
» 7% van alle geteste apparaten in deze klasse waren beter, 2% vergelijkbaar, 90% slechter
» De beste had een delta van 5%, het gemiddelde was 18%, de slechtste was 53%
Vergeleken met alle geteste toestellen
» 5% van alle geteste apparaten waren beter, 1% gelijk, 94% slechter
» De beste had een delta van 4%, het gemiddelde was 23%, de slechtste was 134%
| Uit / Standby | |
| Inactief | |
| Belasting |
|
Key:
min: | |
| Dell Inspiron 13-5379-9573 i5-8250U, UHD Graphics 620, Micron 1100 MTFDDAV256TBN, IPS, 1920x1080, 13.3" | Lenovo Yoga 720-13IKB i5-8550U, UHD Graphics 620, Toshiba XG4 NVMe (THNSN5512GPUK), IPS, 1920x1080, 13.3" | Acer Spin 5 SP513-52N-54SF i5-8250U, UHD Graphics 620, Micron 1100 MTFDDAV256TBN, IPS, 1920x1080, 13.3" | Lenovo Miix 520-12IKB 81CG i5-8250U, UHD Graphics 620, Samsung PM961 MZVLW256HEHP, IPS, 1920x1200, 12.2" | Dell Inspiron 13 5368 6500U, HD Graphics 520, Toshiba THNSNK256GCS8, IPS, 1920x1080, 13.3" | |
|---|---|---|---|---|---|
| Power Consumption | -14% | -5% | -31% | 3% | |
| Idle Minimum * (Watt) | 3.2 | 3.8 -19% | 3.9 -22% | 5.5 -72% | 4.4 -38% |
| Idle Average * (Watt) | 5.9 | 8.4 -42% | 8.2 -39% | 8.3 -41% | 6.1 -3% |
| Idle Maximum * (Watt) | 8.8 | 9.7 -10% | 8.8 -0% | 11.5 -31% | 6.8 23% |
| Load Average * (Watt) | 31.2 | 36 -15% | 28.5 9% | 38.3 -23% | 29 7% |
| Load Maximum * (Watt) | 42.2 | 36 15% | 30.7 27% | 37.7 11% | 31.9 24% |
* ... kleiner is beter
| Dell Inspiron 13-5379-9573 i5-8250U, UHD Graphics 620, 42 Wh | Lenovo Yoga 720-13IKB i5-8550U, UHD Graphics 620, 48 Wh | Acer Spin 5 SP513-52N-54SF i5-8250U, UHD Graphics 620, 53.9 Wh | Lenovo Miix 520-12IKB 81CG i5-8250U, UHD Graphics 620, 38 Wh | Dell Inspiron 13 5368 6500U, HD Graphics 520, 42 Wh | |
|---|---|---|---|---|---|
| Batterijduur | 44% | 54% | -16% | -22% | |
| Reader / Idle (h) | 15.3 | 12.3 -20% | 11.2 -27% | ||
| WiFi v1.3 (h) | 5.4 | 7.8 44% | 8.3 54% | 5.6 4% | 4 -26% |
| Load (h) | 1.6 | 1.1 -31% | 1.4 -13% |
Pro
Contra
Voor het volledige, Engelse testrapport, klik hier.
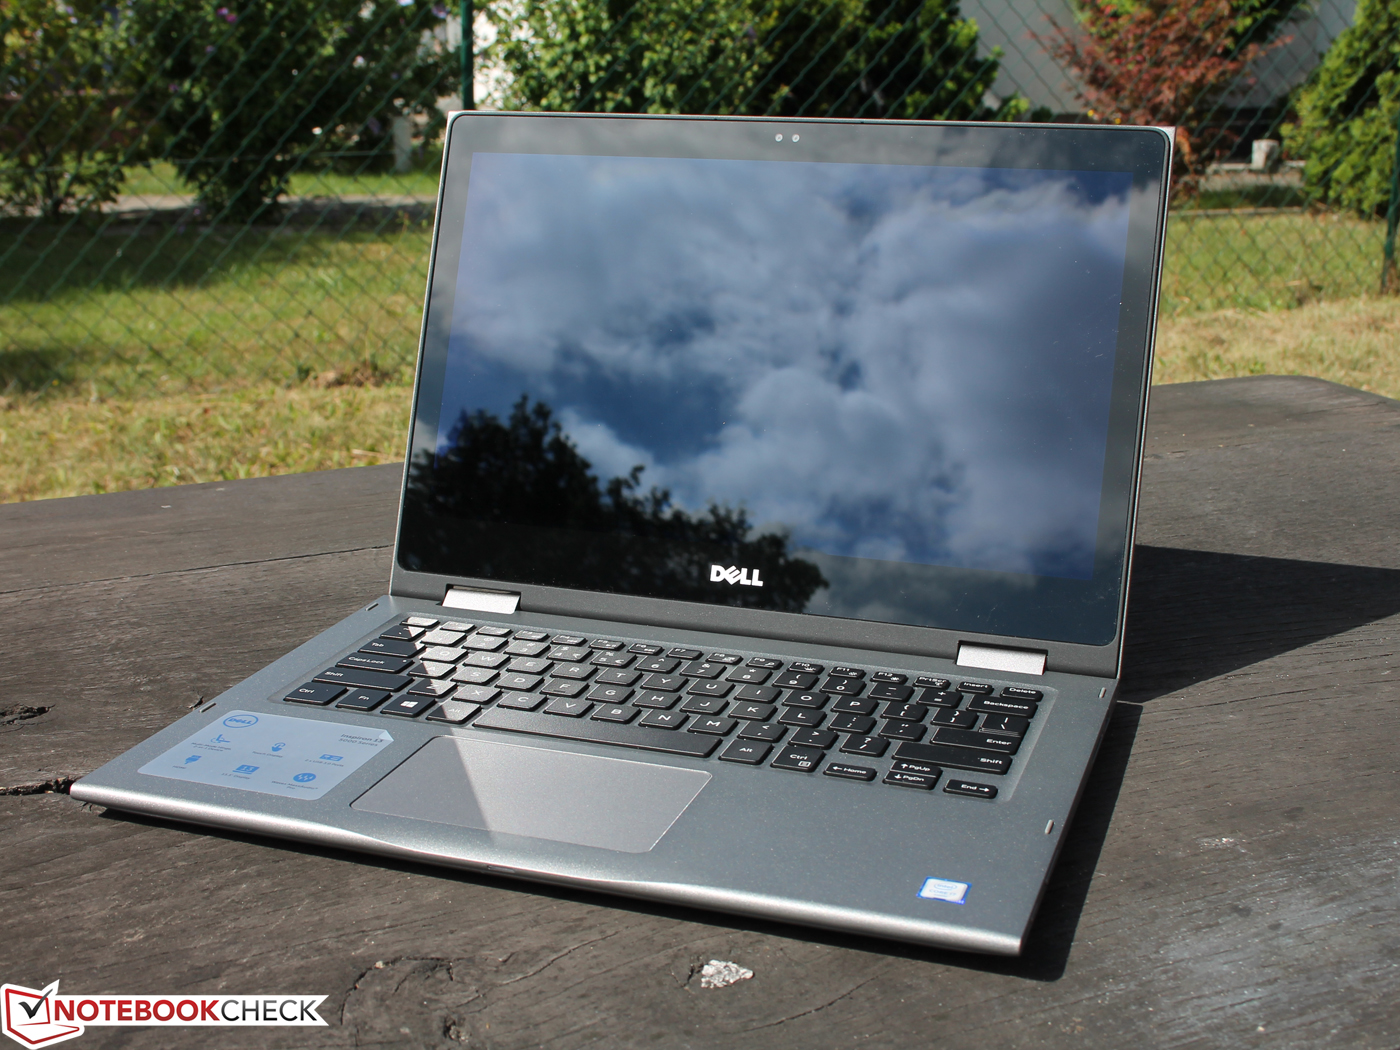
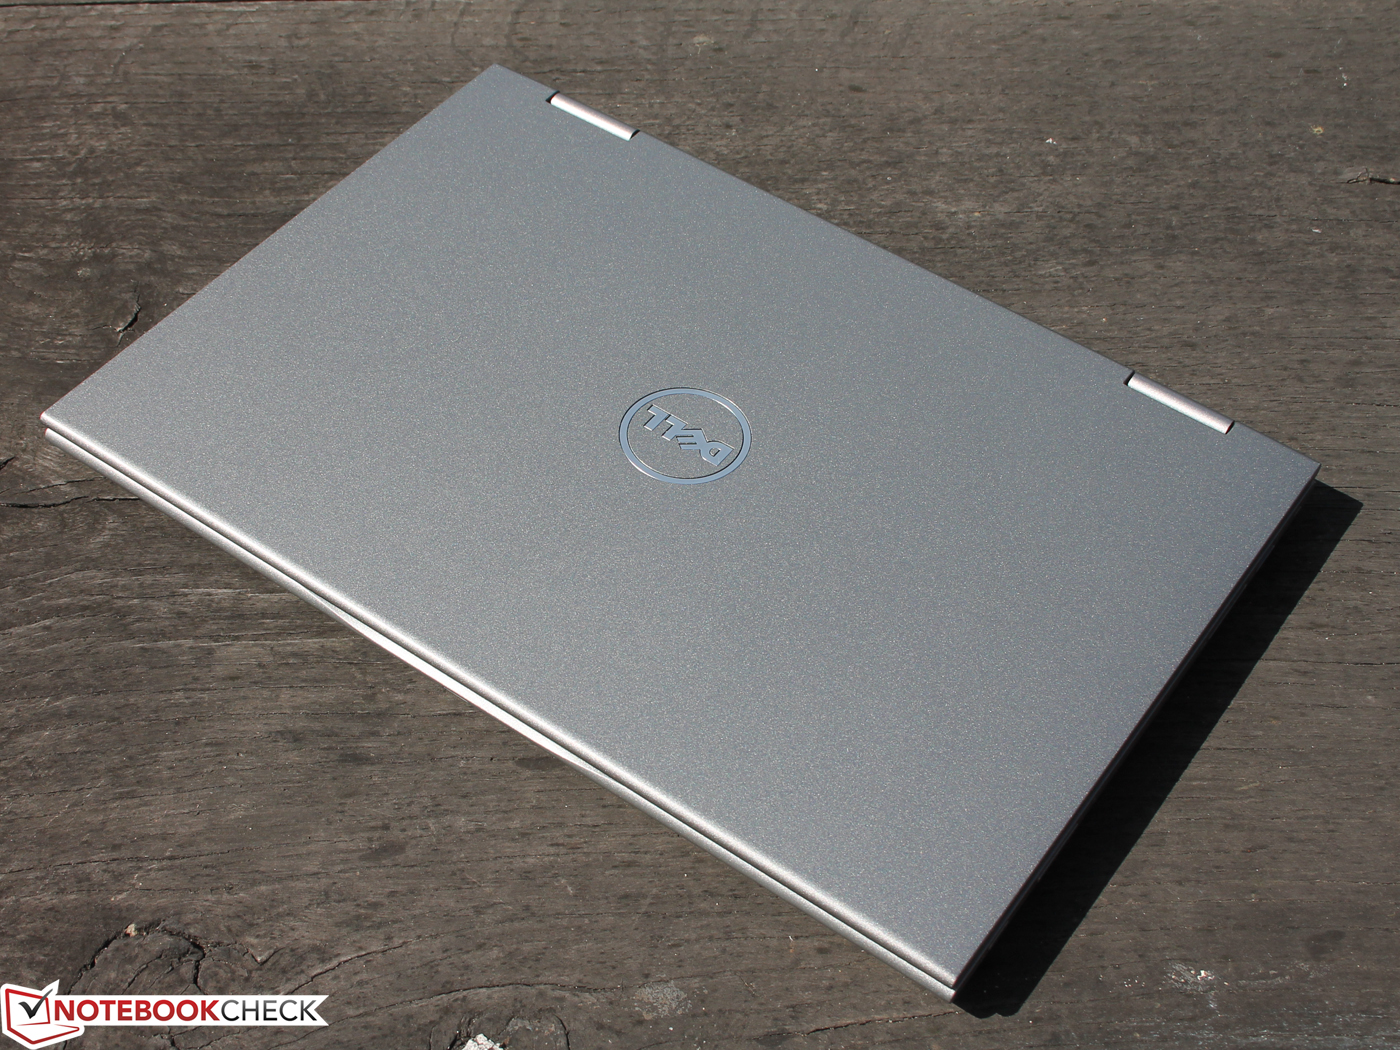
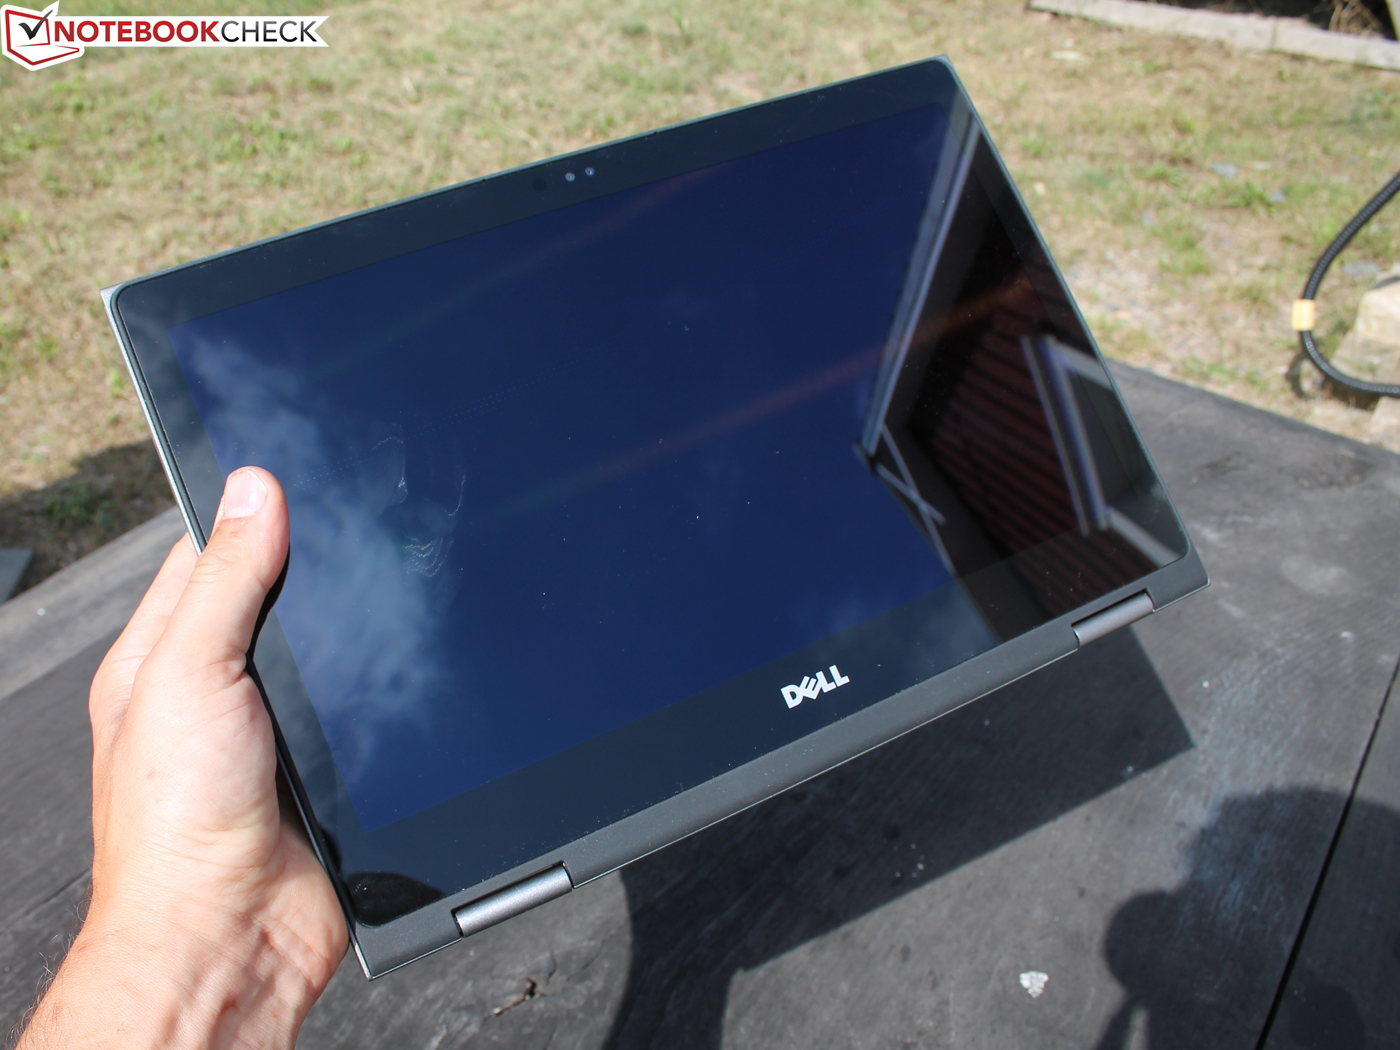
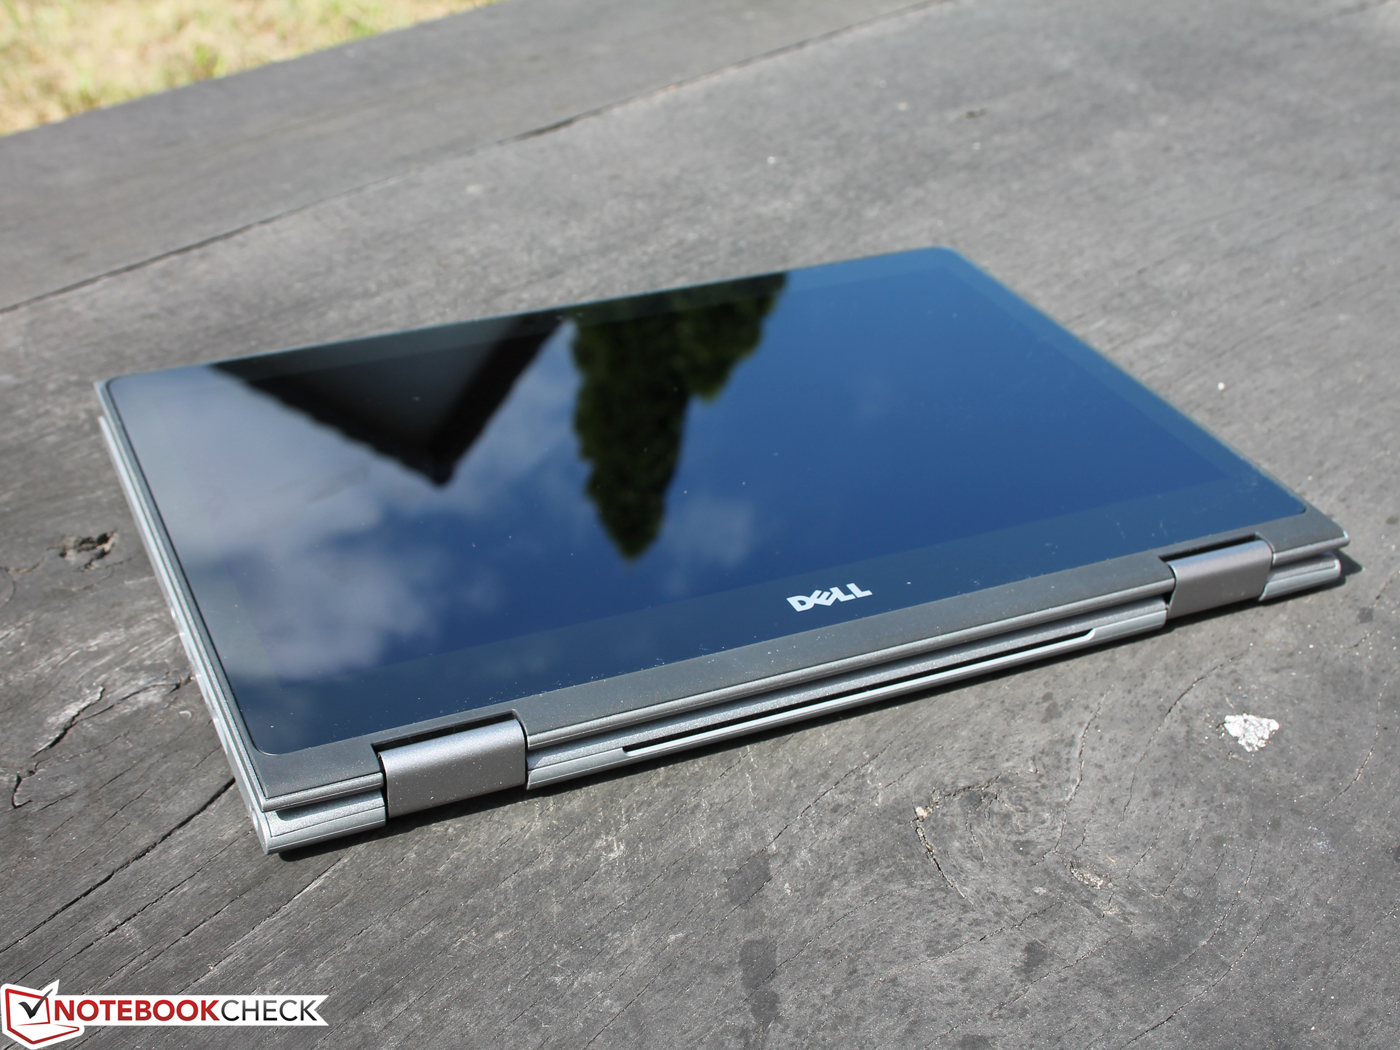
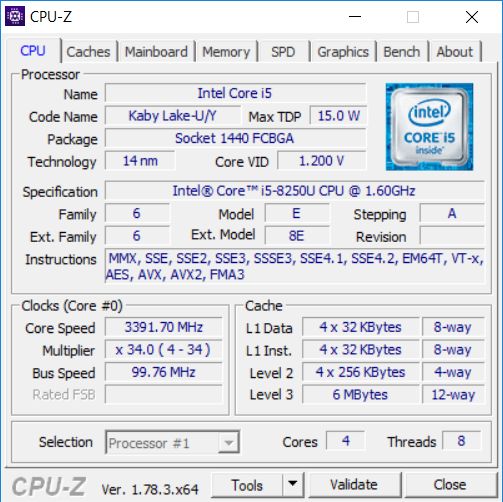
De Inspiron 13 5379 is meer een laptop dan een tablet. Ook de fysieke afmetingen dragen bij aan dit beeld. Door het beeldscherm 360° te draaien ontstaat er een zeer dikke tablet, waarvan het gebruik beperkt wordt door het gat tussen het beeldscherm en de basiseenheid. Hoewel ons testmodel er verouderd uitziet, zijn de interne componenten modern.
"Als je slechts incidenteel gebruik maakt van de tablet modus of graag een laptop met touchscreen wilt, is de Inspiron 13 5379 een goede keuze. Het is een krachtige en onderhoudsvriendelijke convertible met Intel 8e generatie Kaby Lake processor."
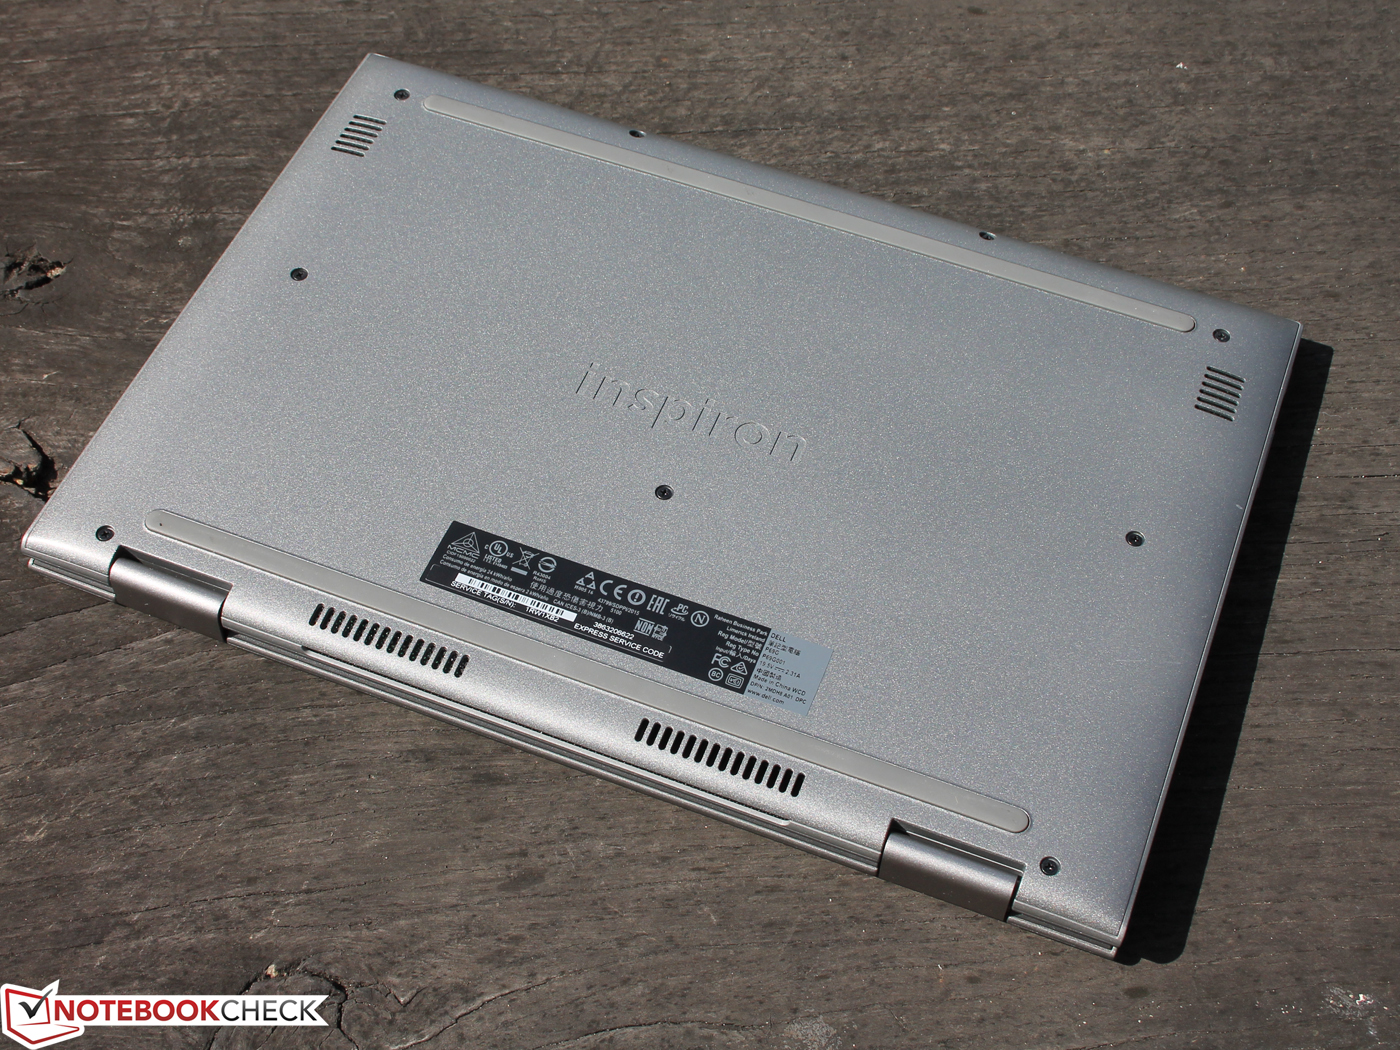
De Inspiron 13 5379 is een capabel apparaat dat zonder moeite alle zakelijke taken afhandelt. Ook is de convertible geschikt voor casual gaming, maar het blijft beperkt tot oudere games of games uit de Windows Store. Het eenvoudige onderhoud maakt het systeem toekomstbestendig.
Dell Inspiron 13-5379-9573
- 12-02-2018 v6 (old)
Mike Wobker
Price comparison
