Verdict - Een van de beste 16-inch convertibles voor $1000
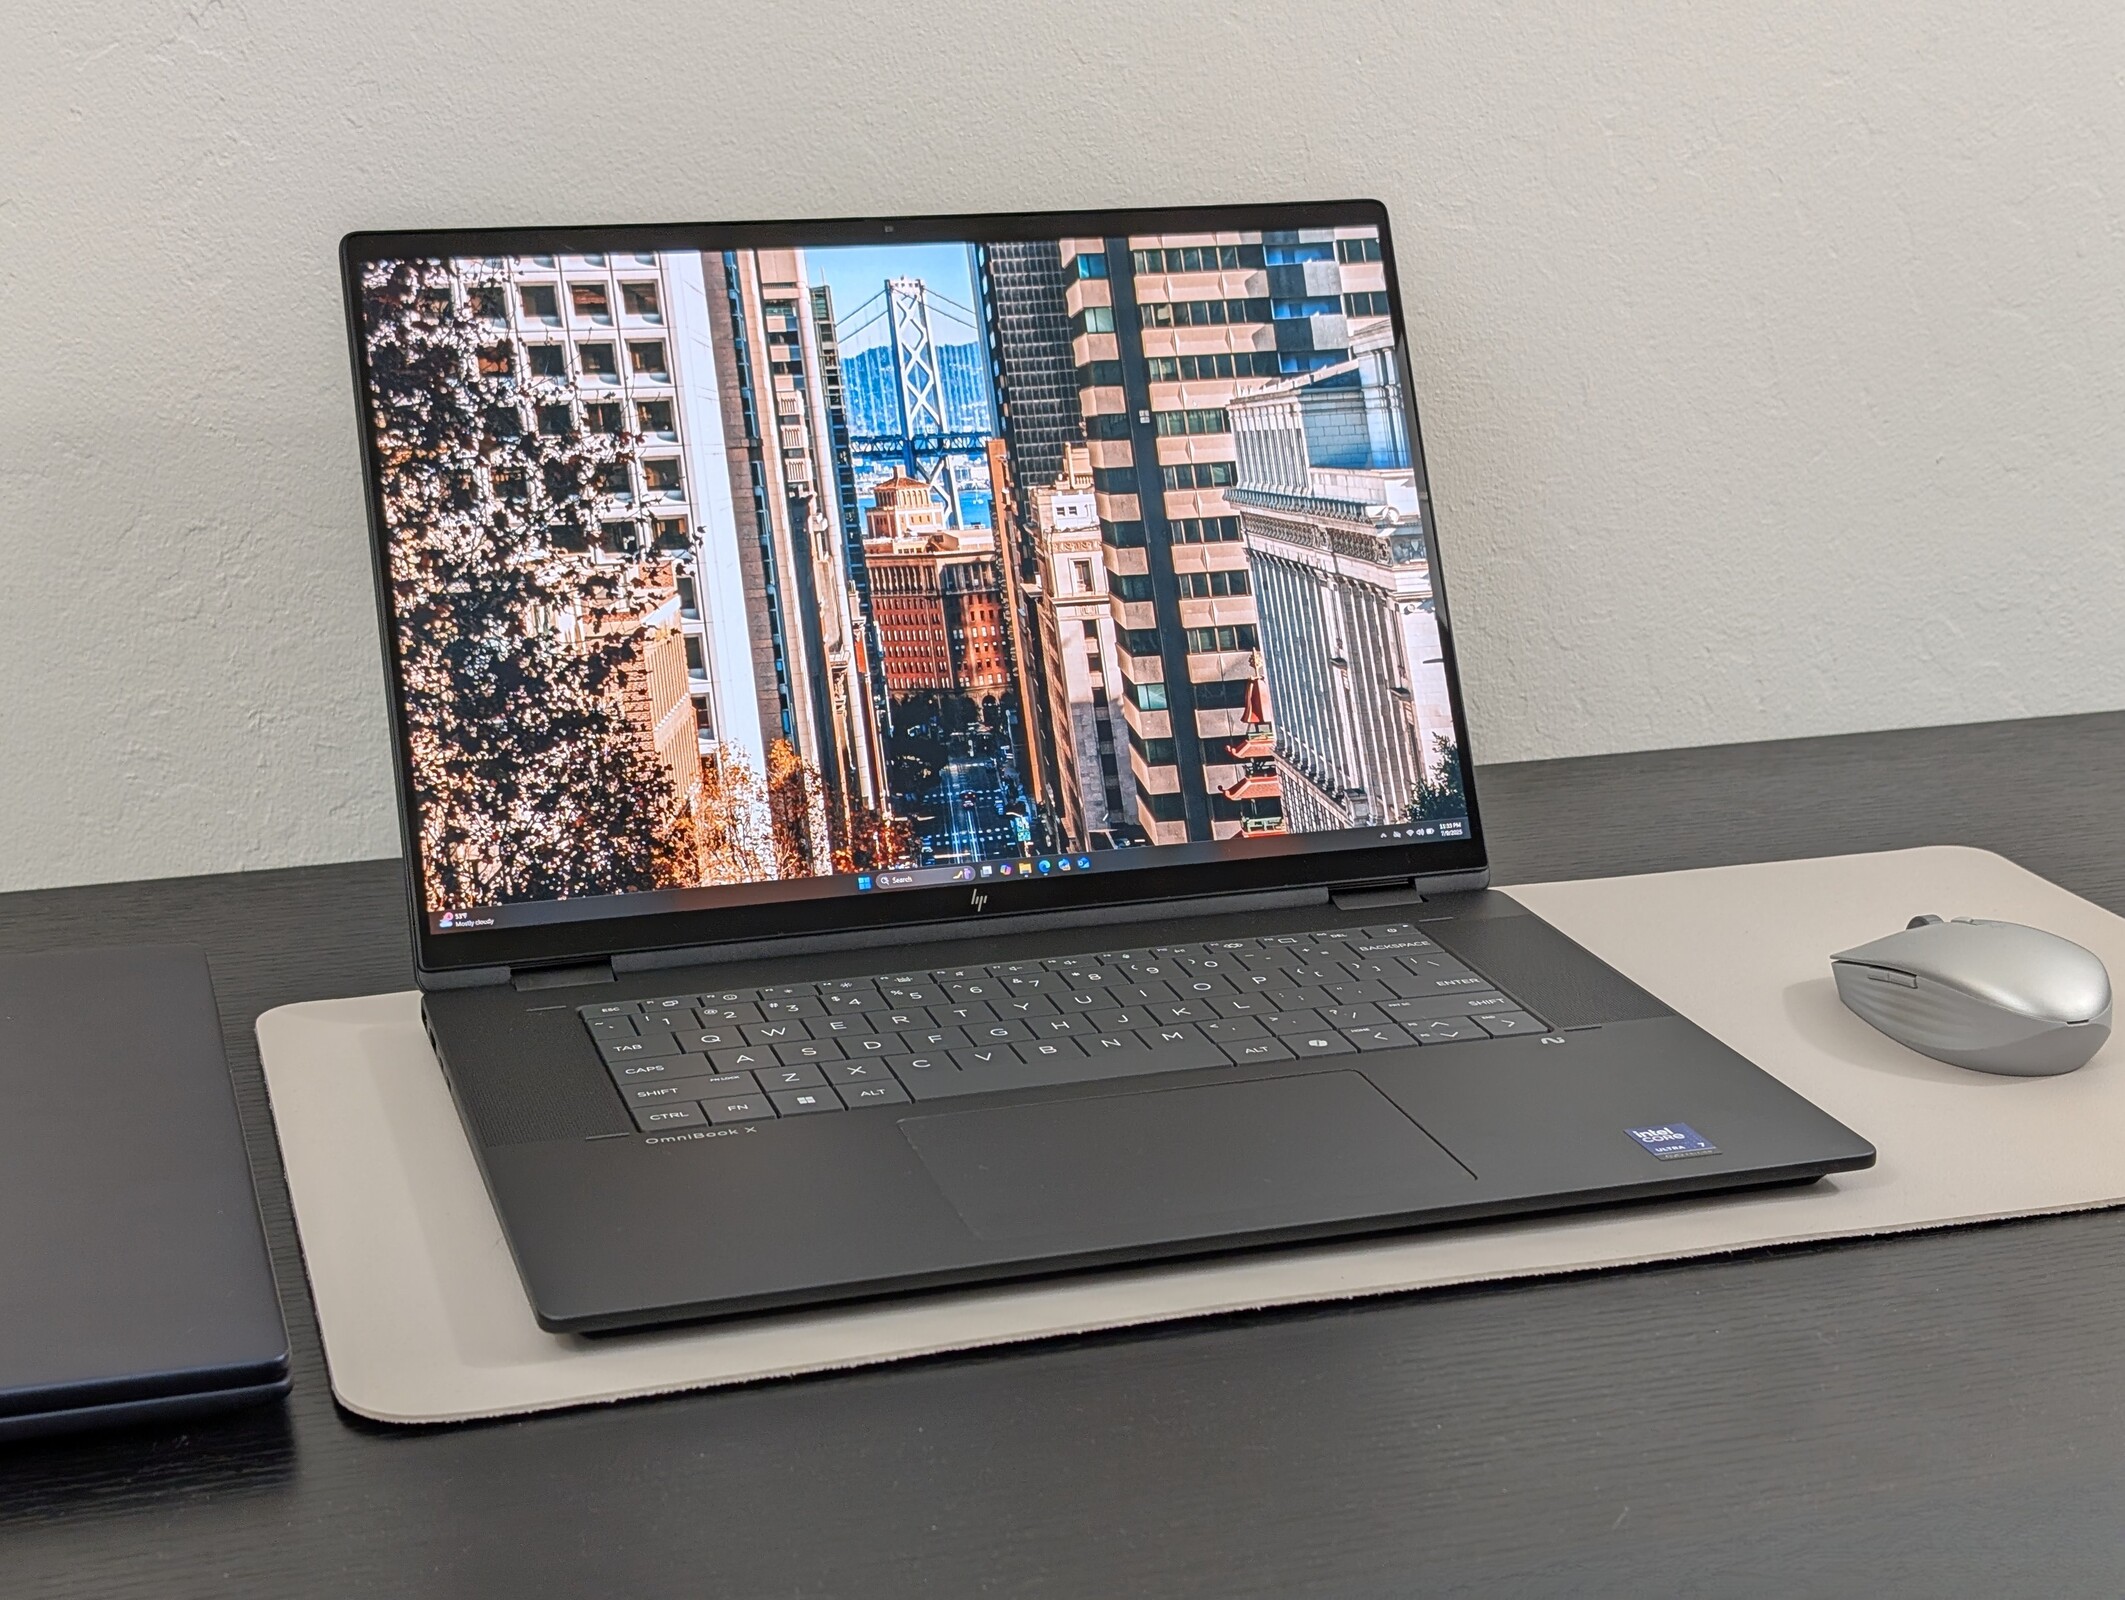
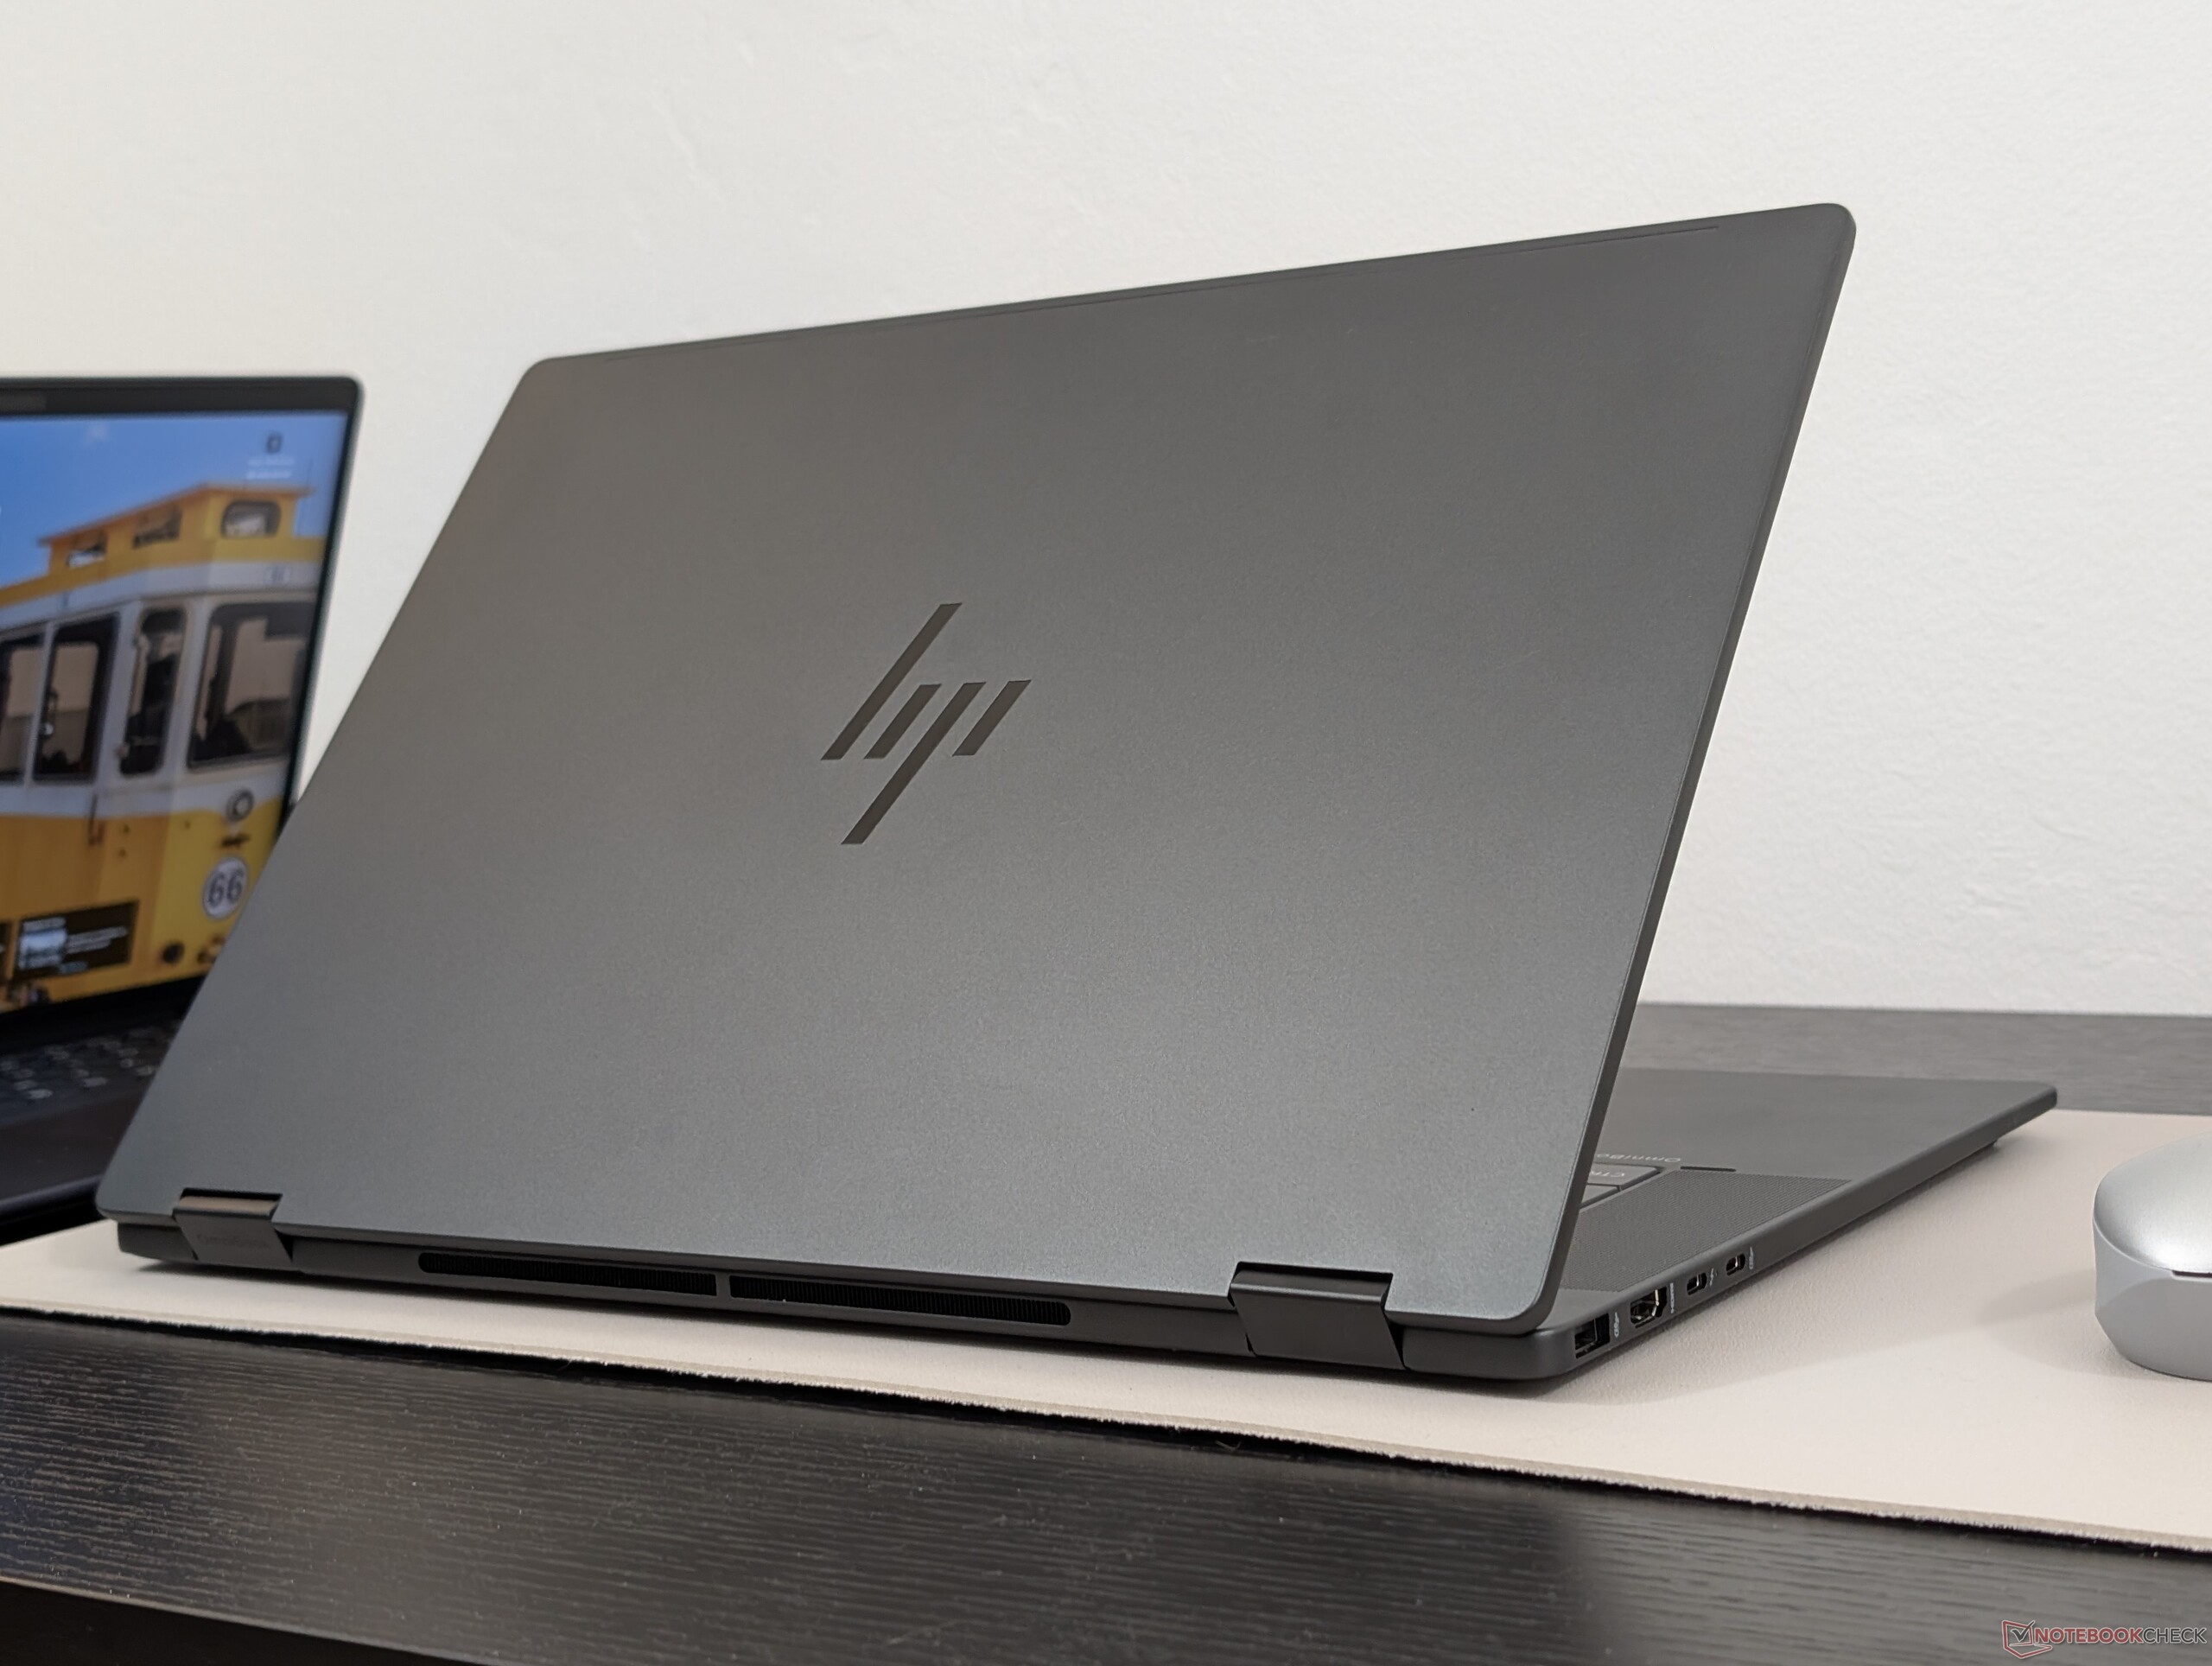
De OmniBook X Flip 16 heeft meer gemeen met de Spectre-serie van het vlaggenschip dan met de minder dure Pavilion -serie. Het gladde metalen ontwerp, het OLED-touchscreen en de moderne Lunar Lake processor zorgen voor een uitstekende balans tussen draagbaarheid en gebruiksgemak, vooral in vergelijking met de concurrerende Dell 16 Plus 2-in-1 die in vergelijking goedkoper aanvoelt. De vormfactor en OLED-kleuren zijn geschikt voor allerlei omgevingen, van thuismultimedia tot bewerking onderweg - trouw aan de "omni"-naam.
Sommige gebruikers zullen het niet waarderen hoe anders het toetsenbord aanvoelt in vergelijking met de meeste andere HP laptops, waardoor de type-ervaring even wennen kan zijn. Daarnaast zullen de ruwe prestaties langzamer zijn dan die van veel 16-inch clamshells zoals HP's Envy 16, die meestal uitgerust zijn met H-serie processors en discrete graphics. Krachtige gebruikers kunnen de Spectre x360 16 serie voor extra bewerkings- en gamingkracht. Voor alle anderen is de OmniBook X Flip 16 een van de beste en meest veelzijdige 16-inch convertibles in het lage prijssegment van $1000.
Pro
Contra
Prijs en beschikbaarheid
Amazon levert de OmniBook X Flip 16 momenteel voor $1300, zoals geconfigureerd op onze Core Ultra 7 258V beoordelingseenheid. Gebruikers kunnen de OmniBook ook rechtstreeks bij HP kopen voor slechts 950 dollar in de uitverkoop.
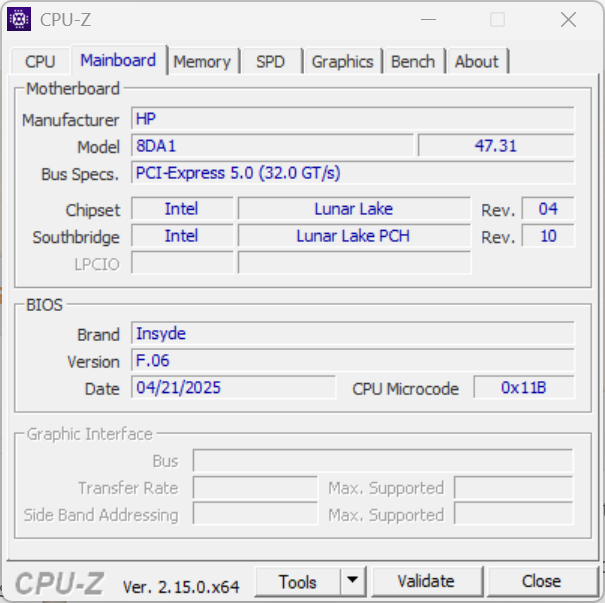
De HP OmniBook X Flip 16 is een prosumer 16-inch convertible die net onder de Spectre x360 16 serie qua prijs en functies. Ons testmodel is een configuratie in het hogere segment met de Core Ultra 7 258V Lunar Lake Intel CPU en een 3K 120 Hz OLED touchscreen voor ongeveer $1300 of iets minder dan $1000 in de uitverkoop.
Er is ook een AMD-variant van het model beschikbaar met de Ryzen AI 5 340 en een 1200p aanraakscherm met een lagere resolutie voor ongeveer $700. Alle Intel-configuraties worden momenteel echter geleverd met het 1800p 120 Hz OLED-aanraakscherm.
Concurrenten op dit gebied zijn andere 16-inch convertibles voor consumenten, zoals de Lenovo Yoga 7 2-in-1 16, Samsung Galaxy Book5 Pro 360of Dell 16 Plus 2-in-1.
Meer HP beoordelingen:
Specificaties
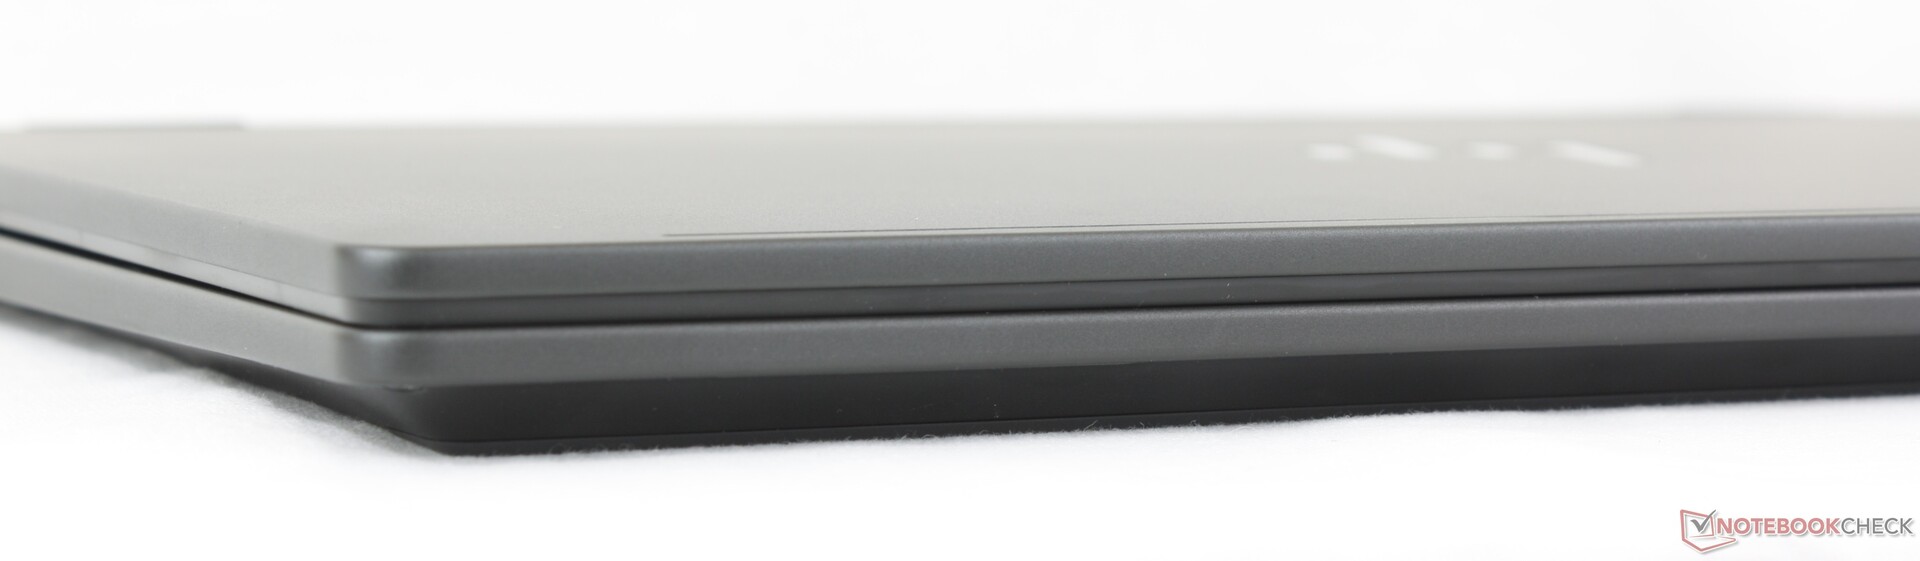
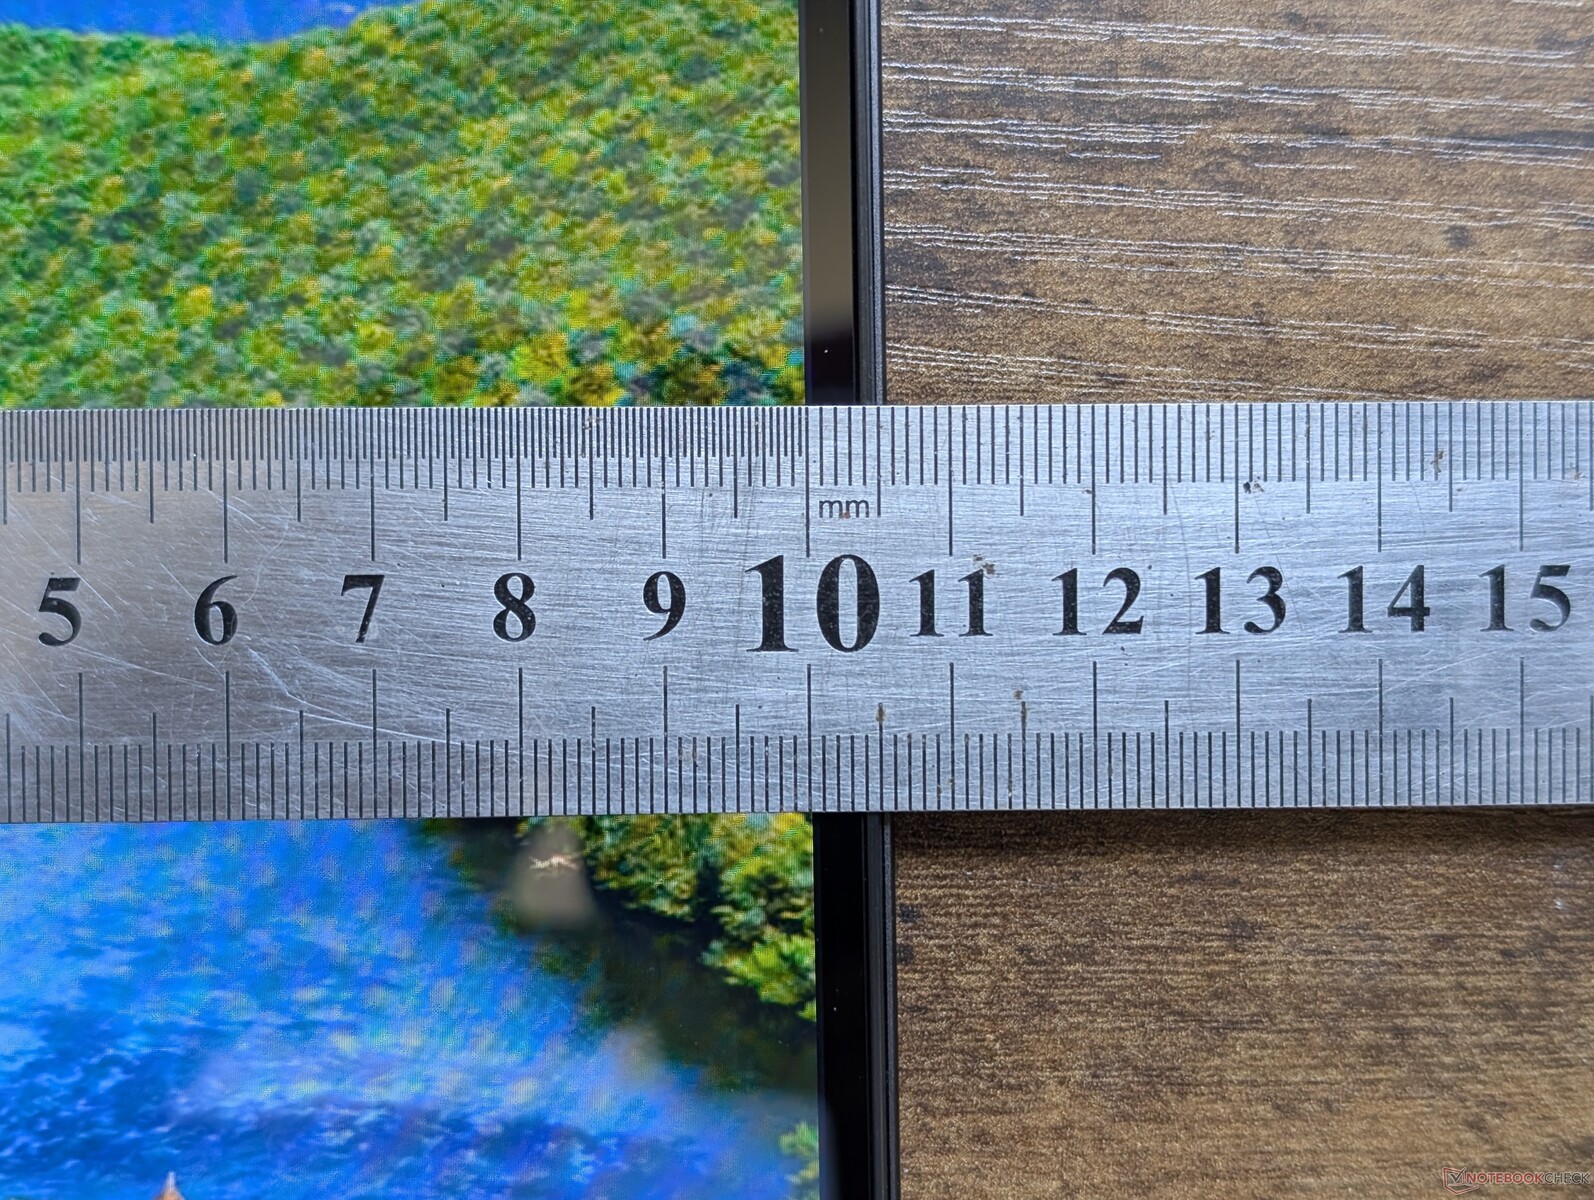
Behuizing - Slanker dan een Dell
Het matte metalen ontwerp in één kleur voelt sterker en luxueuzer aan dan de Dell 16 Plus 2-in-1 met dezelfde prijs. Het buigt nog steeds iets meer dan de duurdere Spectre x360 16, terwijl gebruikers die bereid zijn om honderden dollars meer uit te geven de Samsung Galaxy Book5 Pro 360 een merkbaar lichter alternatief vinden.
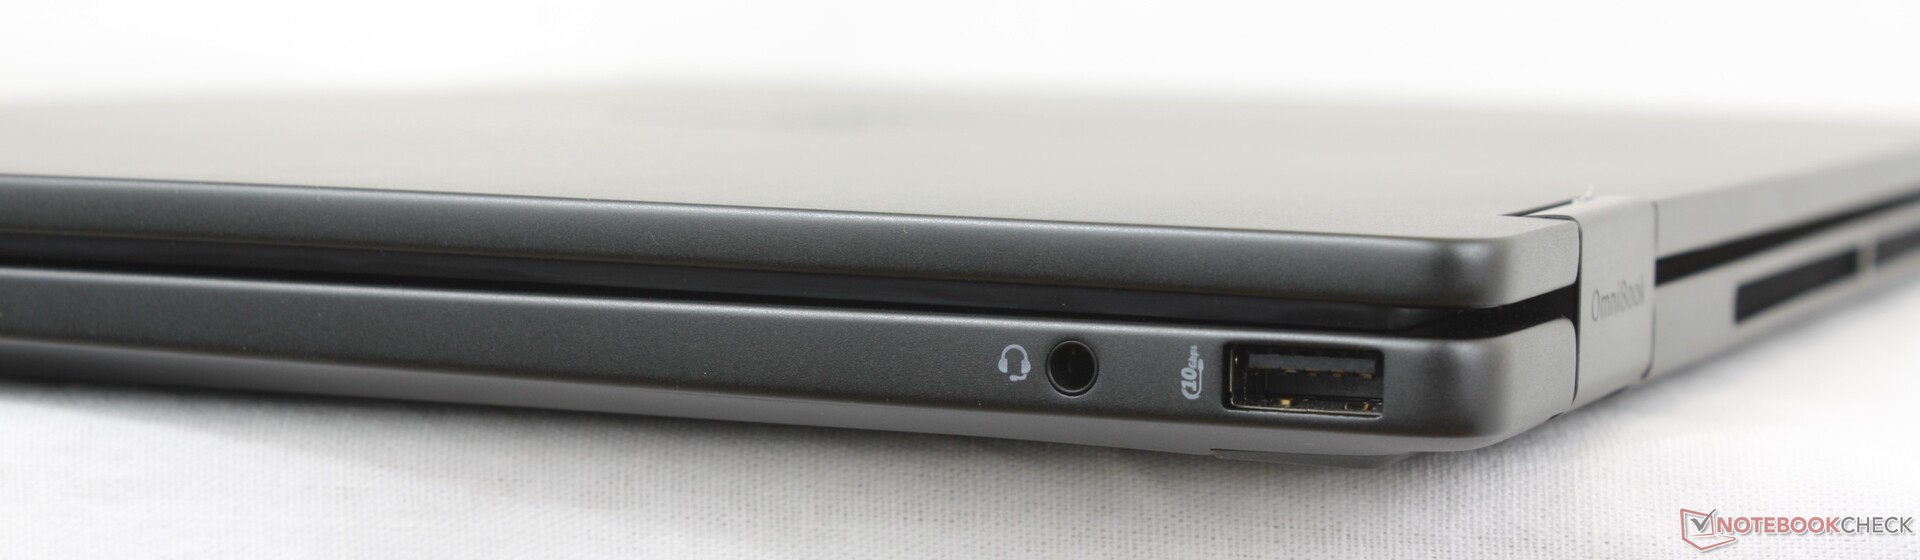
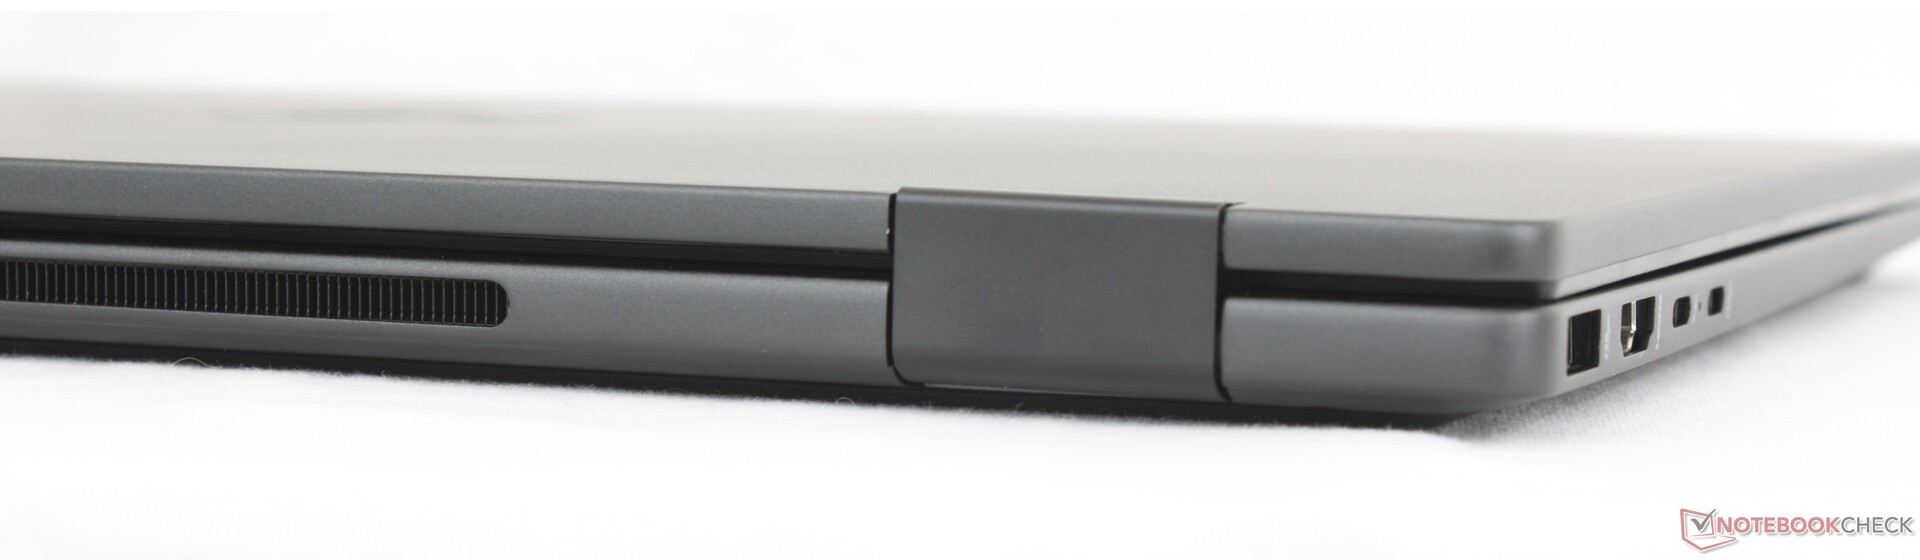
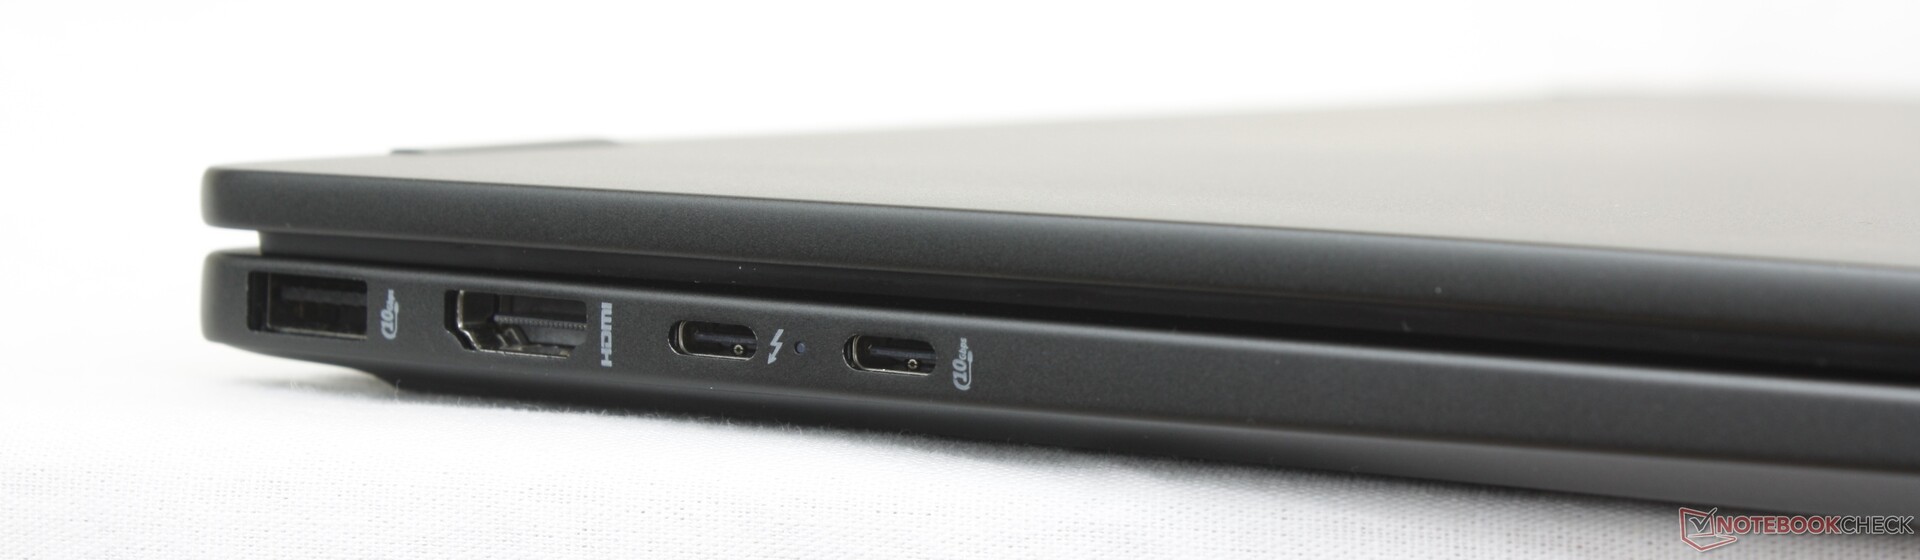
Connectiviteit
De HP heeft alle poorten van de Dell Plus 16 2-in-1 plus een extra USB-A poort langs de linkerrand. Merk op dat slechts één van de twee USB-C poorten Thunderbolt 4 en DisplayPort 2.1 ondersteunt, terwijl de andere USB-C poort slechts 10 Gbps met DisplayPort 1.4 ondersteunt.
Communicatie
Webcam
De 5 MP webcam wordt standaard geleverd met IR en een fysieke sluiter.


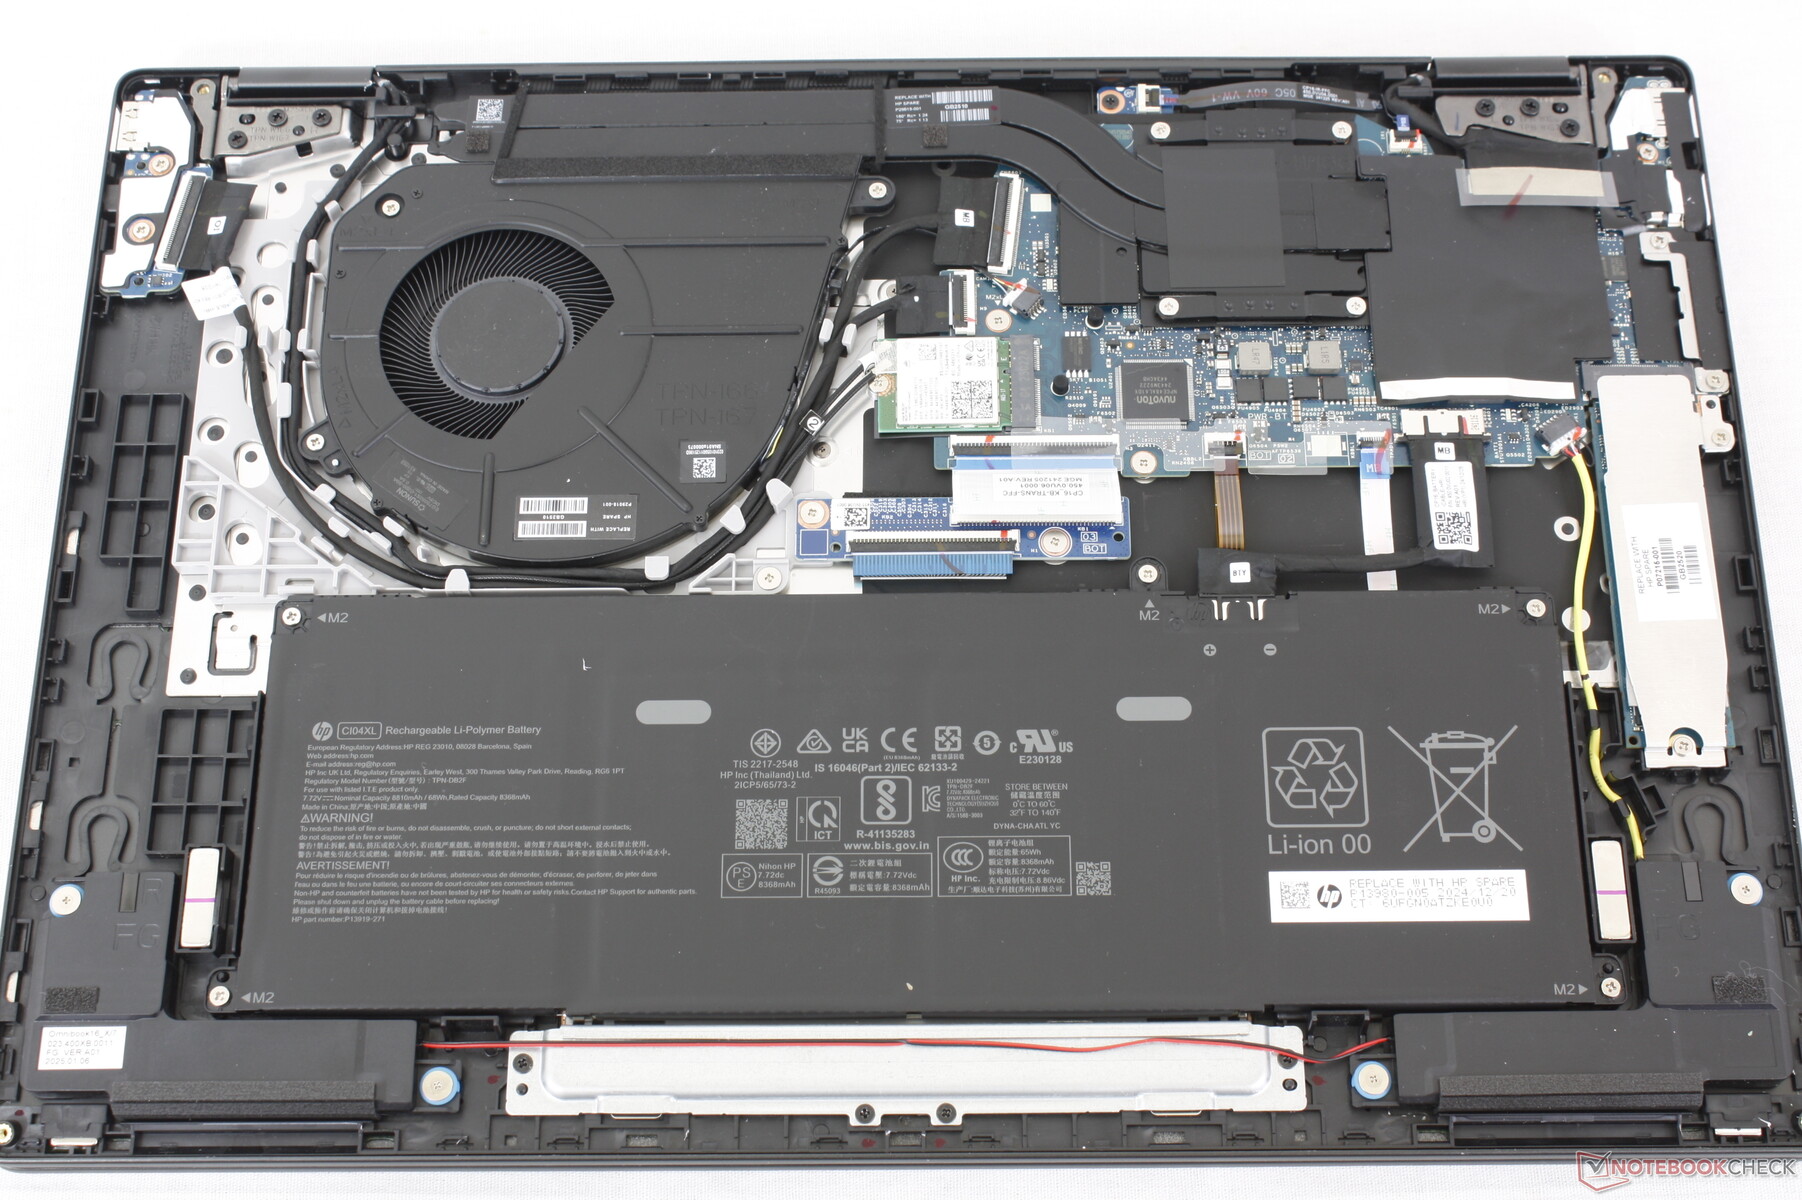
Onderhoud
Duurzaamheid
HP verwerkt verschillende hoeveelheden gerecyclede en hernieuwbare metalen en kunststoffen in de productie van de OmniBook X Flip 16.
Accessoires en garantie
De verkoopverpakking bevat een actieve stylus pen (TPA-M005P) naast het gebruikelijke papierwerk en een USB-C AC-adapter. De standaard beperkte fabrieksgarantie van een jaar is van toepassing bij aankoop in de VS.
Invoerapparaten
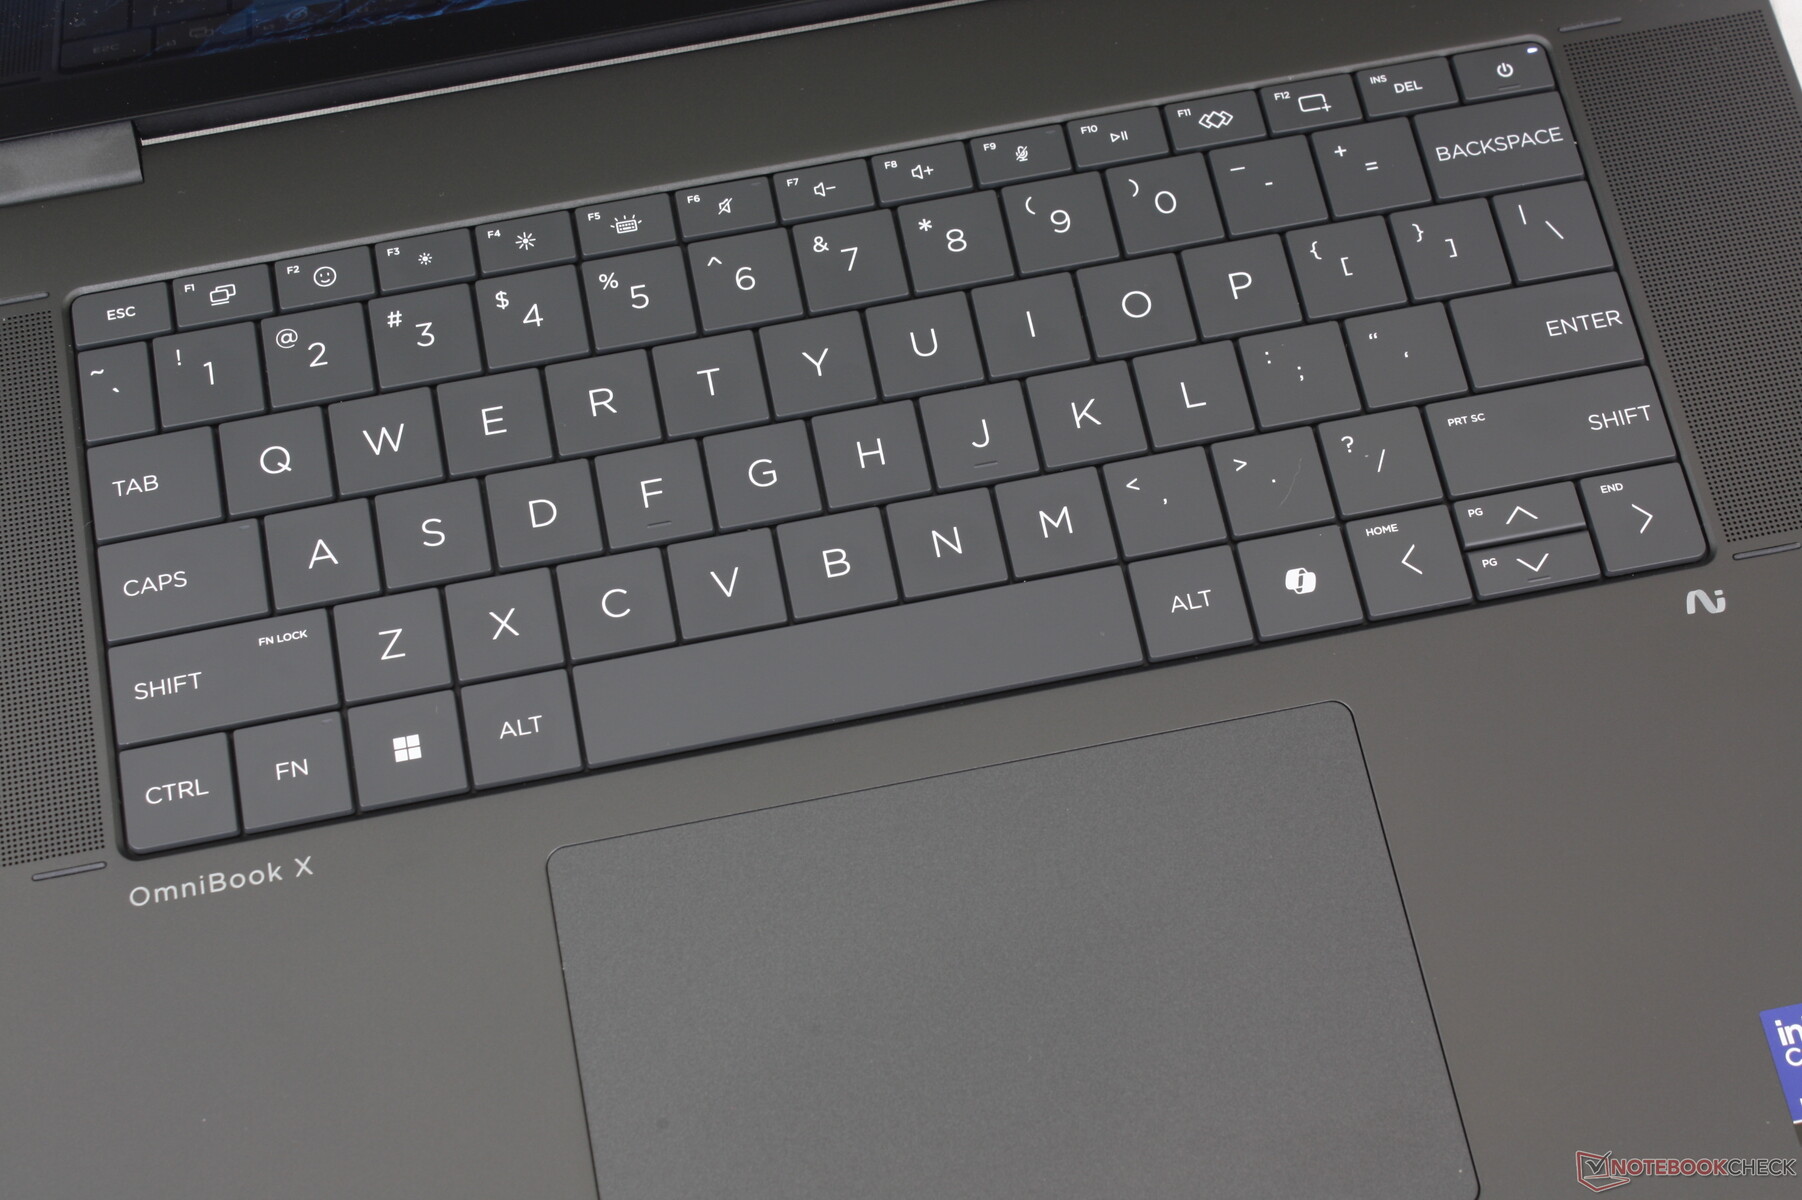
Toetsenbord
Het zero-lattice toetsenbord is een verandering ten opzichte van de huidige Spectre serie, EliteBook serie en vorige generatie Envy serie. Hoewel de toetsen groter zijn, is de feedback helaas zowel lichter als ondieper dan op de traditionelere toetsenborden van de meeste andere HP laptops.
Touchpad
Het clickpad is ongeveer even groot als op de Dell 16 Plus 2-in-1 (13,5 x 8,7 cm vs. 13,3 x 9 cm). Klikken is gemakkelijker omdat er minder kracht voor nodig is dan op de Dell convertible, maar de feedback is aan de sponsachtige kant.
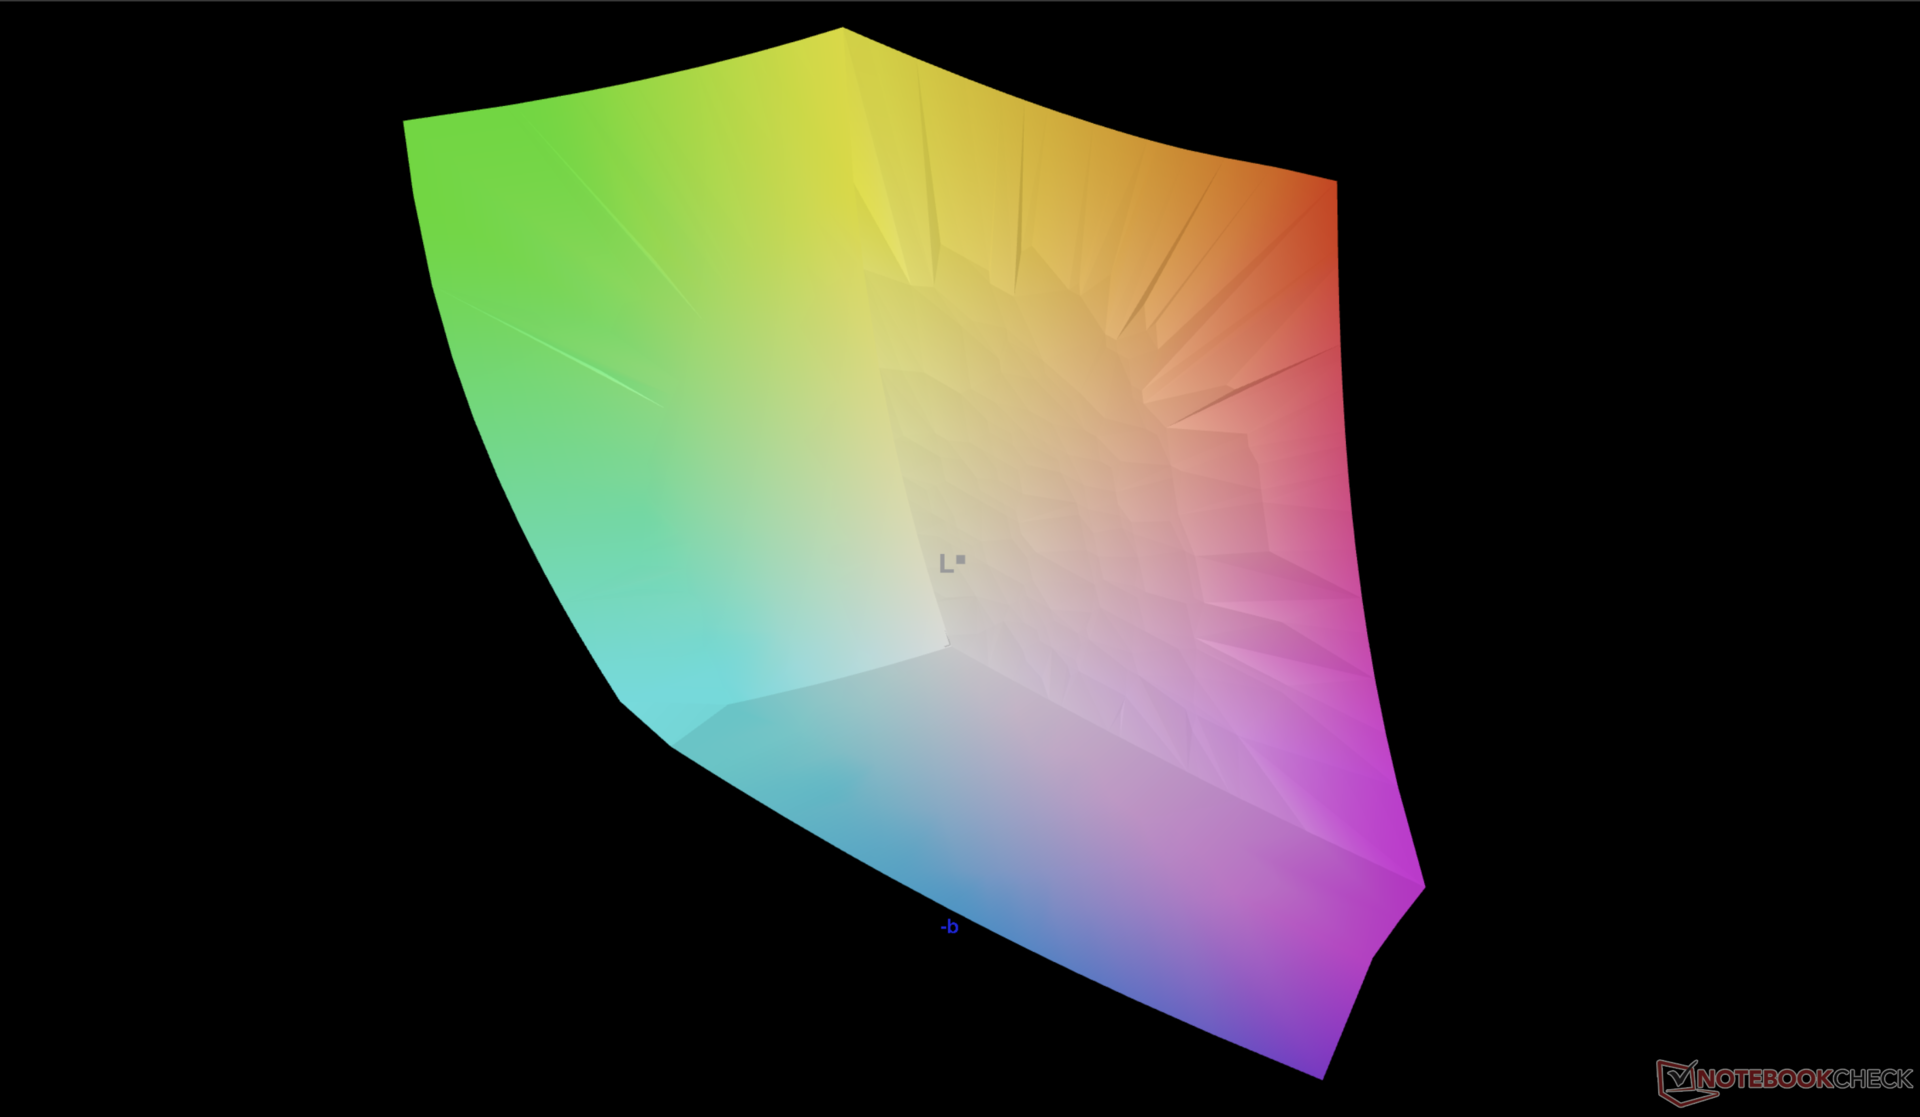
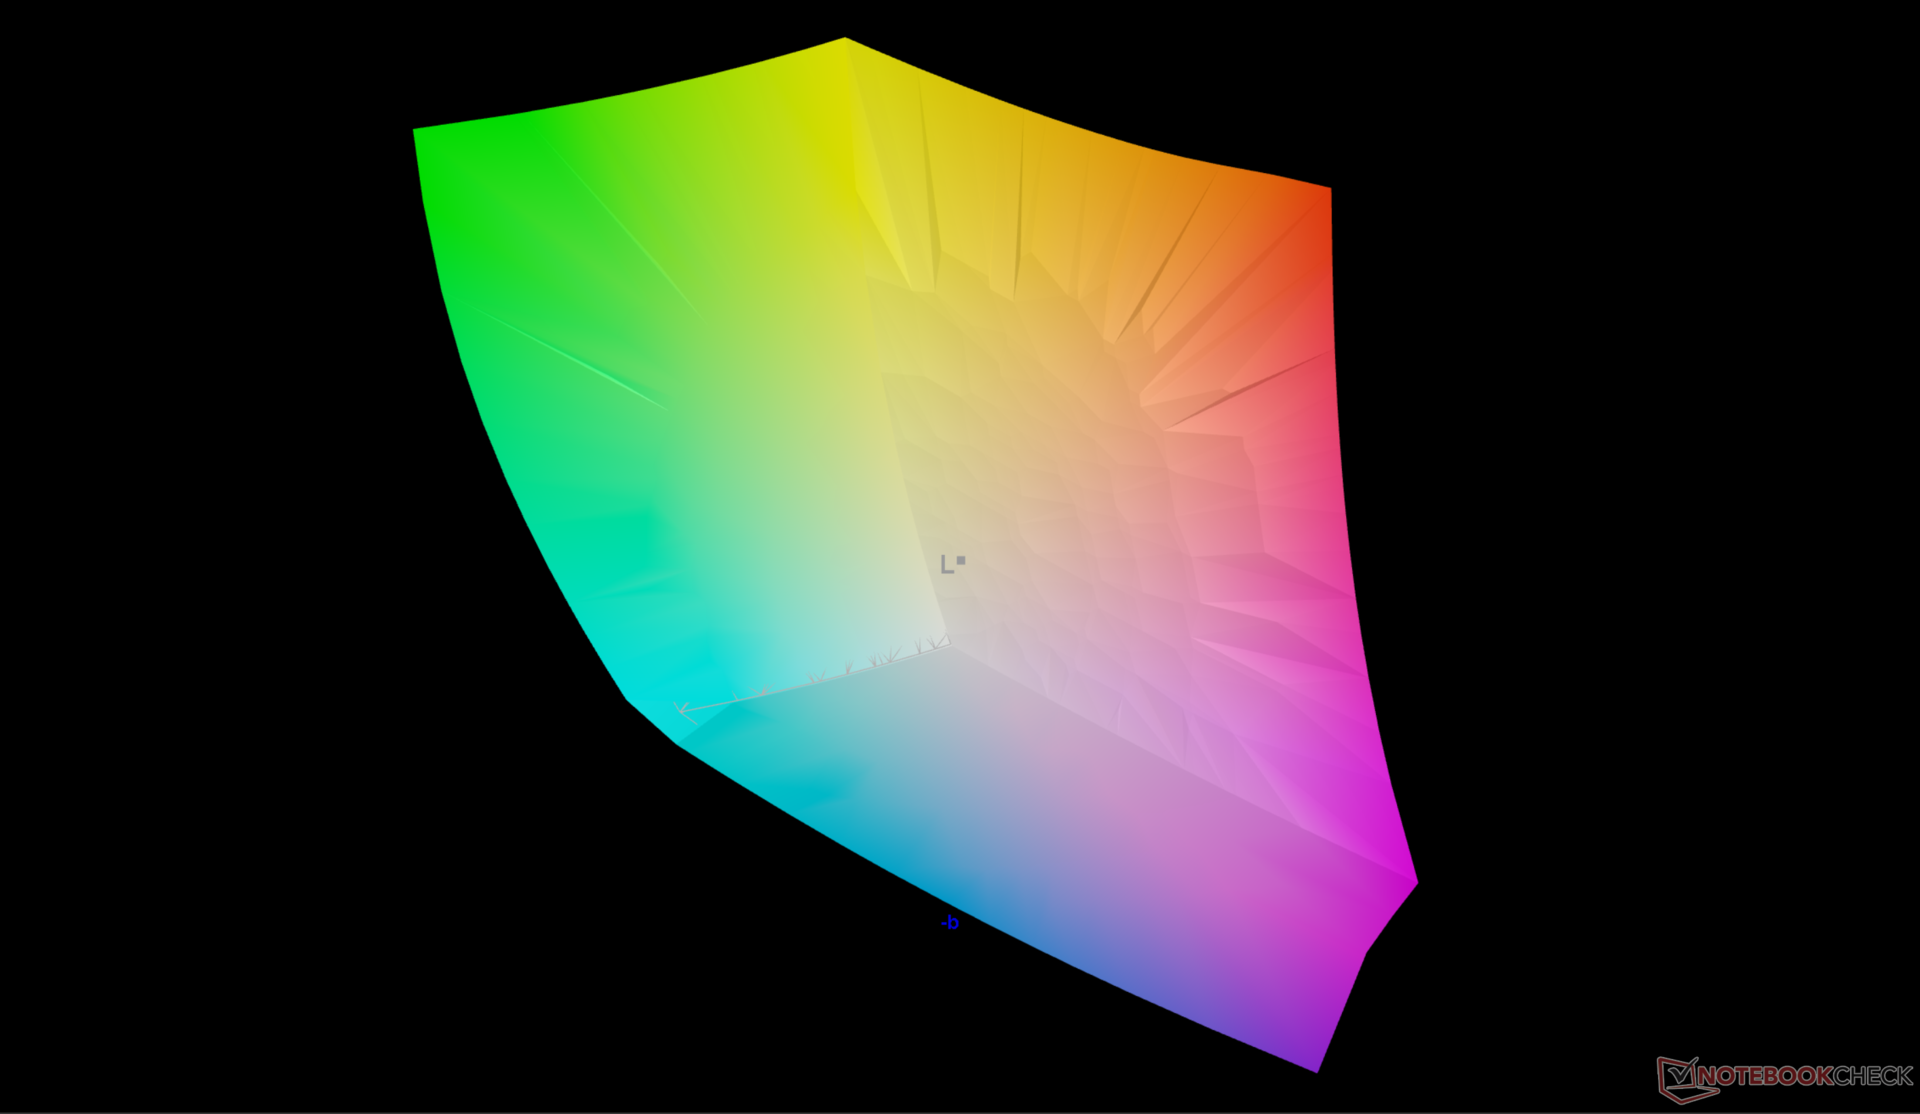
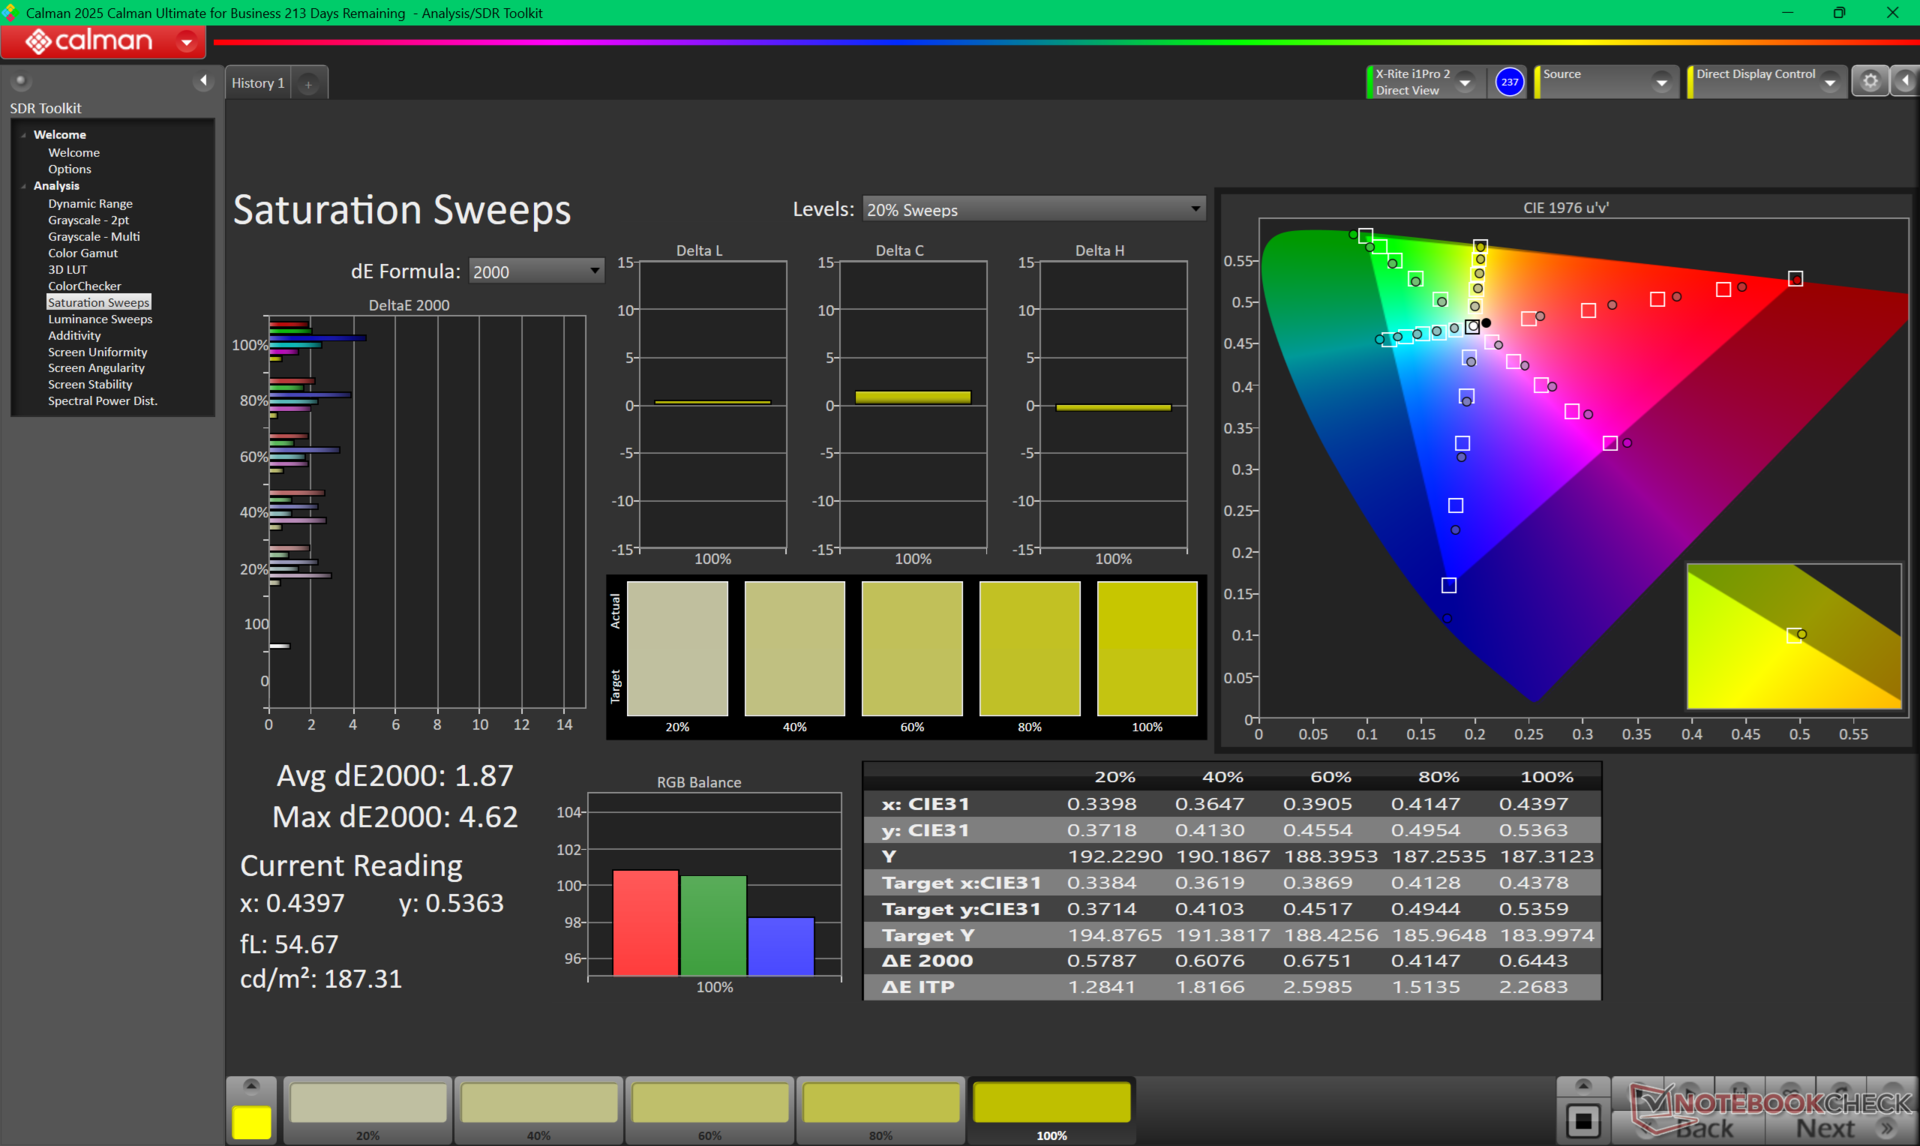
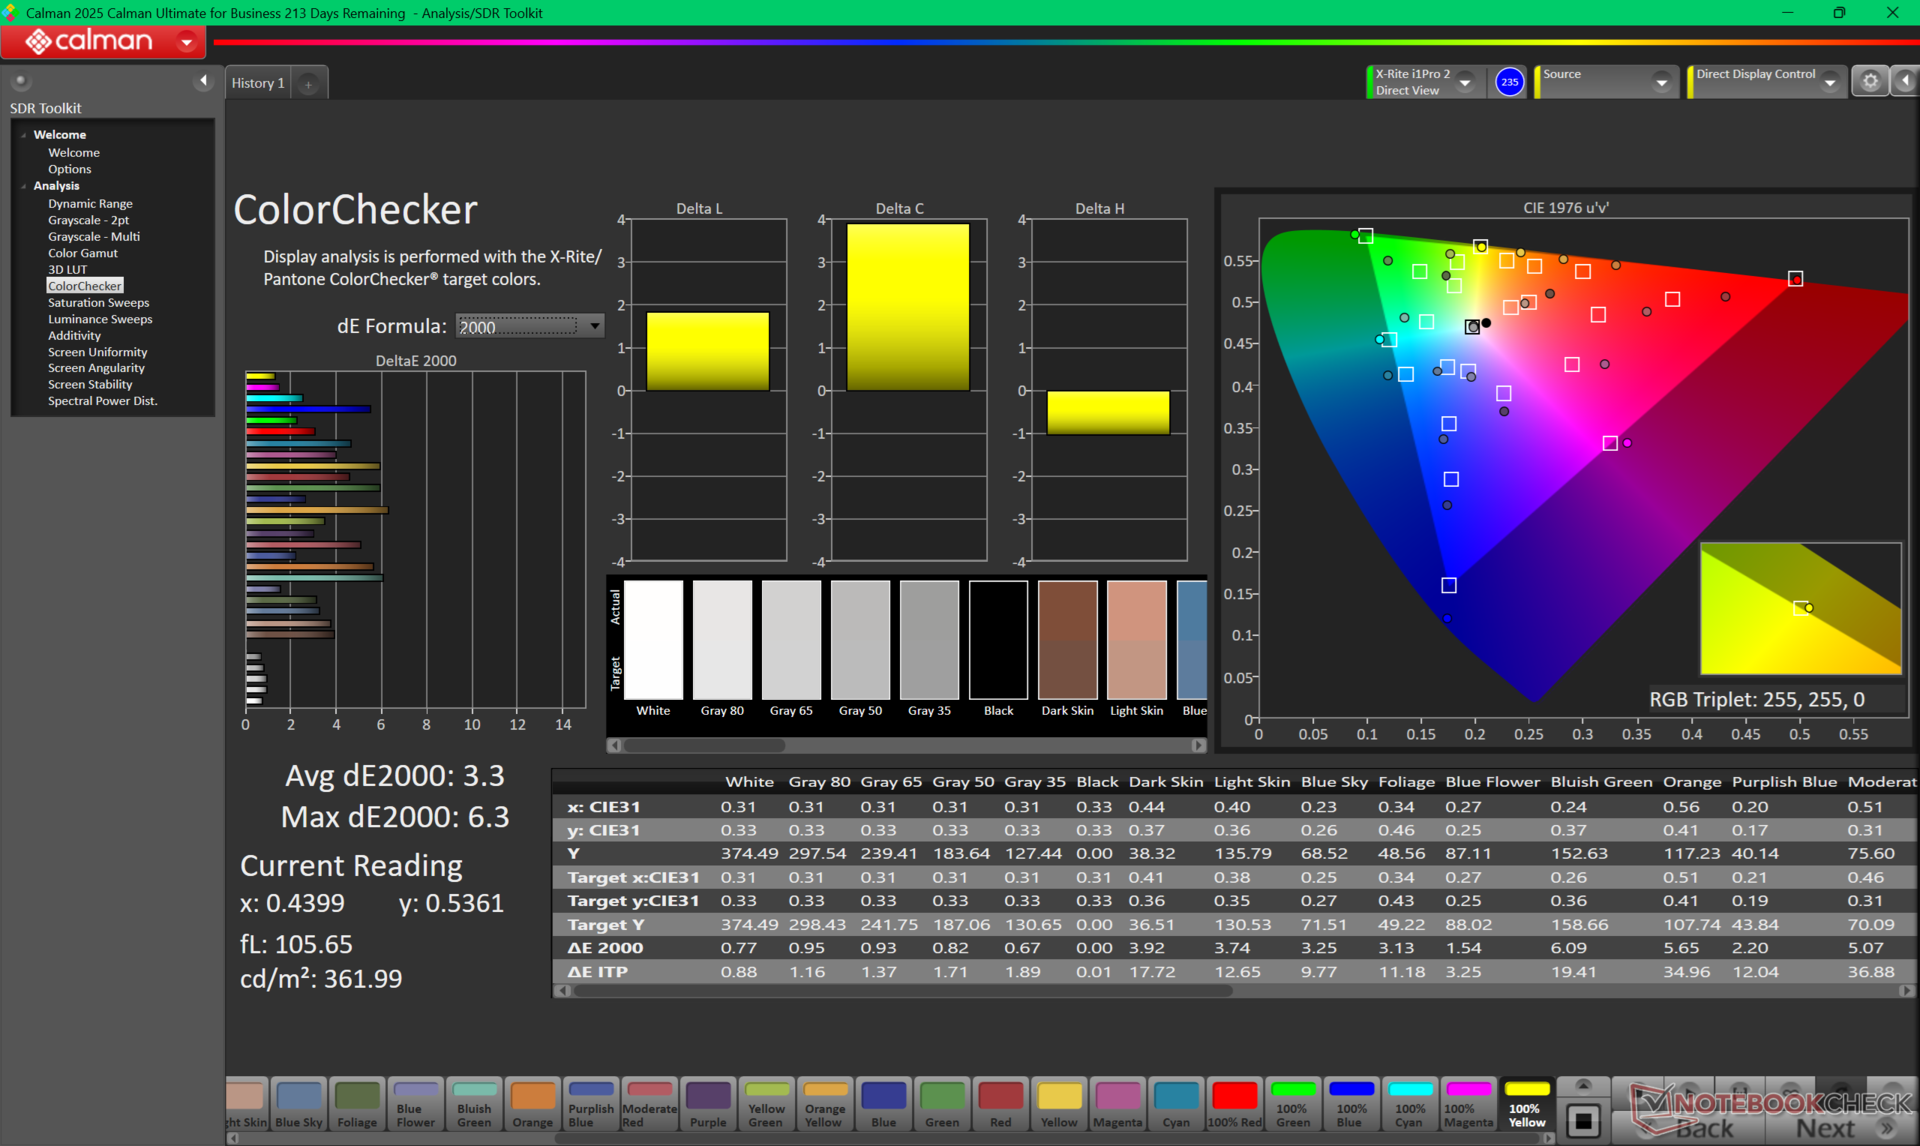
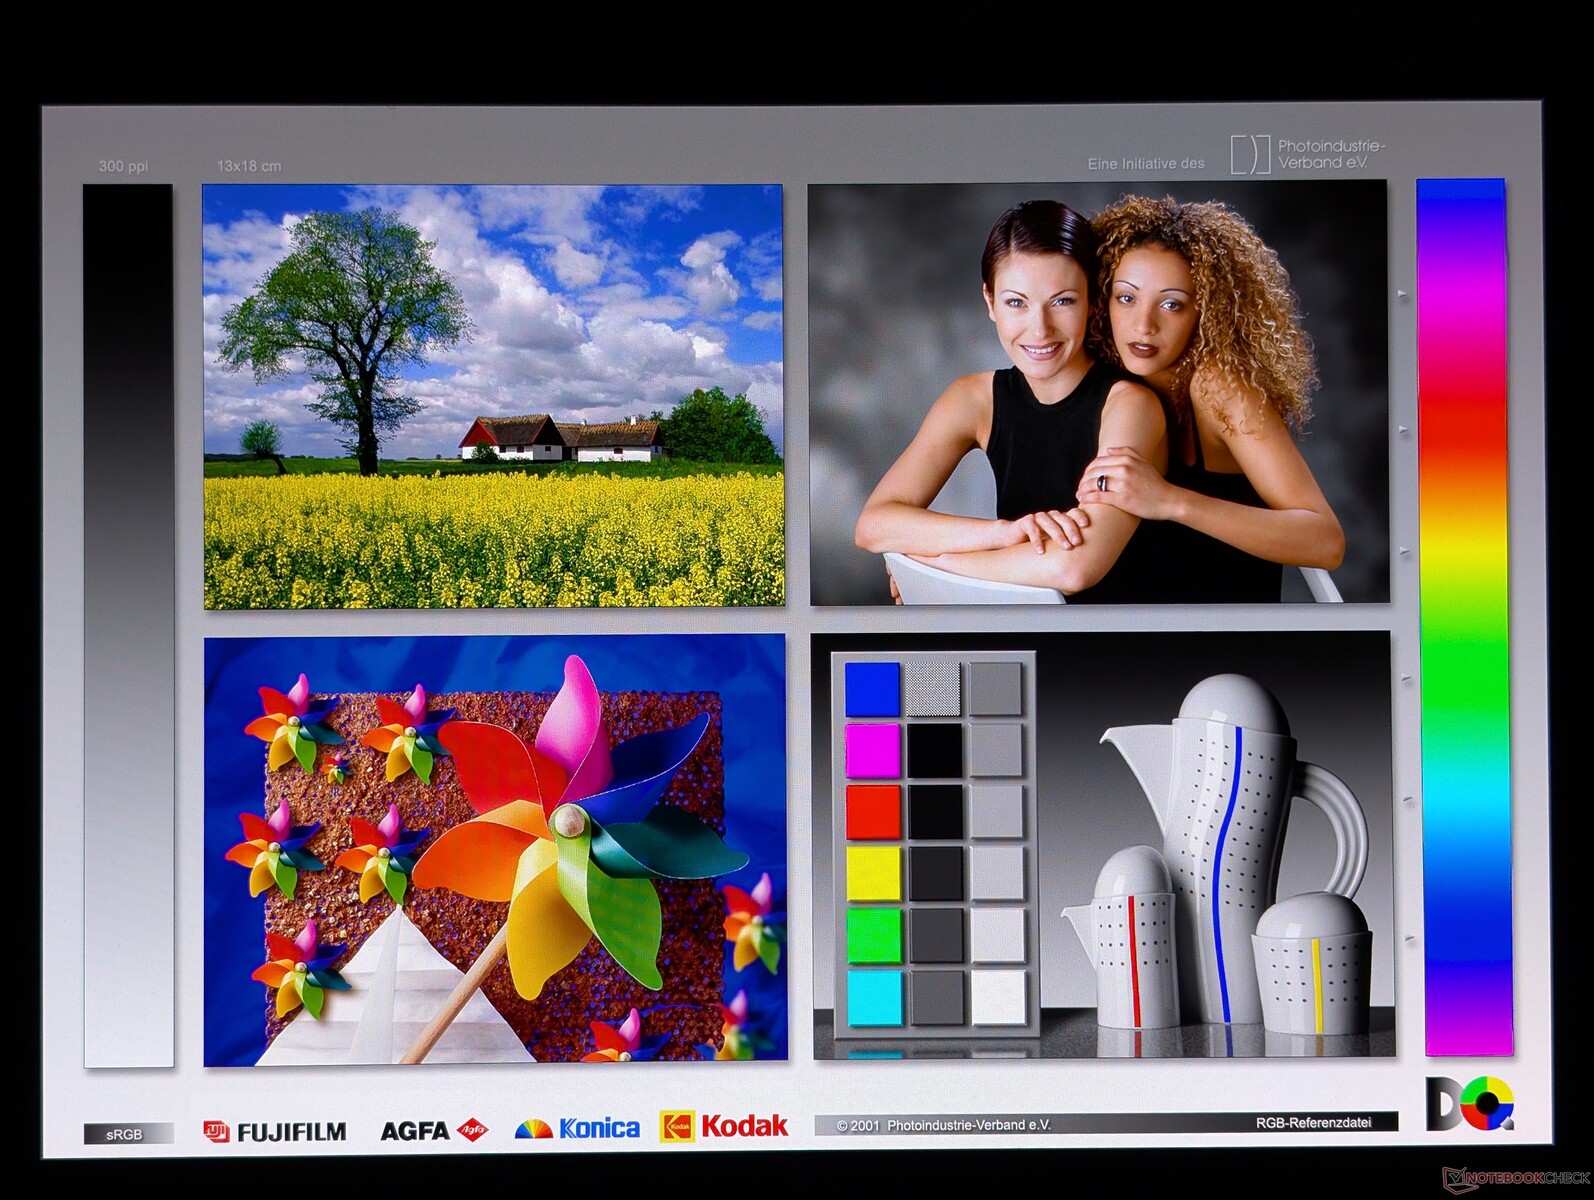
Beeldscherm - 3K 120 Hz OLED
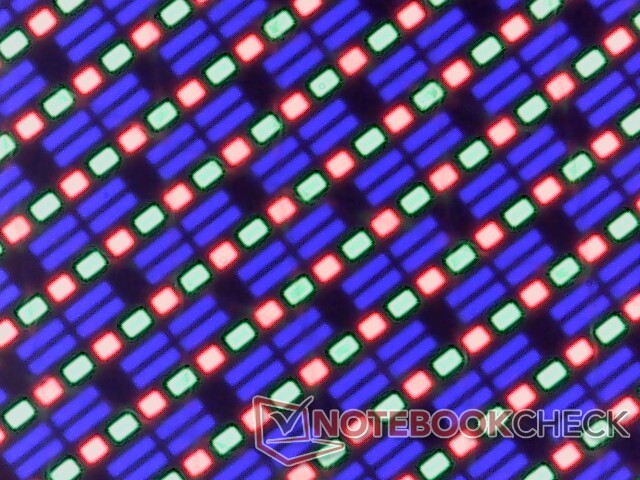
De OmniBook X Flip 16 maakt gebruik van een vergelijkbaar 1800p 120 Hz Samsung OLED-touchscreen als dat van de Galaxy Book5 Pro 360 of HP Spectre x360 16. Het biedt een hogere native resolutie dan de Mini-LED- of IPS-panelen van de Dell Plus 16 2-in-1 of de OmniBook X Flip 16 MSI Summit A16 AI Plus. De maximale helderheid bereikt 561 nits in de HDR-modus ter ondersteuning van HDR500, maar is anders beperkt tot 381 nits in de SDR-modus.

| |||||||||||||||||||||||||
Helderheidsverdeling: 98 %
Helderheid in Batterij-modus: 381.1 cd/m²
Contrast: ∞:1 (Zwart: 0 cd/m²)
ΔE ColorChecker Calman: 3.3 | ∀{0.5-29.43 Ø4.72}
ΔE Greyscale Calman: 0.9 | ∀{0.09-98 Ø4.97}
95.2% AdobeRGB 1998 (Argyll 3D)
100% sRGB (Argyll 3D)
99.9% Display P3 (Argyll 3D)
Gamma: 2.23
CCT: 6369 K
| HP OmniBook X Flip 16 Samsung SDC41BA, OLED, 2880x1800, 16", 120 Hz | Dell 16 Plus 2-in-1 AU Optronics B160QAT, Mini-LED, 2560x1600, 16", 90 Hz | Lenovo Yoga 7 2-in-1 16ILL10 LEN160WUM, IPS, 1920x1200, 16", 60 Hz | Samsung Galaxy Book5 Pro 360 ATNA60CL09-0, OLED, 2880x1800, 16", 120 Hz | MSI Summit A16 AI Plus A3HMTG AU Optronics B16QAN02.N, IPS, 2560x1600, 16", 165 Hz | HP Spectre x360 16 RTX 4050 Samsung SDC41A6, OLED, 2880x1800, 16", 120 Hz | |
|---|---|---|---|---|---|---|
| Display | -0% | -53% | 0% | -5% | 1% | |
| Display P3 Coverage (%) | 99.9 | 99.5 0% | 39.7 -60% | 99.9 0% | 96.8 -3% | 99.6 0% |
| sRGB Coverage (%) | 100 | 100 0% | 57.9 -42% | 100 0% | 99.8 0% | 100 0% |
| AdobeRGB 1998 Coverage (%) | 95.2 | 94.2 -1% | 41 -57% | 96.6 1% | 84.7 -11% | 96.7 2% |
| Response Times | -4178% | -3025% | -33% | -1201% | 3% | |
| Response Time Grey 50% / Grey 80% * (ms) | 0.8 ? | 48.8 ? -6000% | 30 ? -3650% | 0.48 ? 40% | 12.9 ? -1513% | 0.78 ? 2% |
| Response Time Black / White * (ms) | 0.9 ? | 57.6 ? -6300% | 22.5 ? -2400% | 0.64 ? 29% | 8.9 ? -889% | 0.86 ? 4% |
| PWM Frequency (Hz) | 473.8 ? | 2807 ? | 240 ? | 480 ? | ||
| PWM Amplitude * (%) | 15 | 50 -233% | 40 -167% | |||
| Screen | -3% | -172% | 9% | -34% | -17% | |
| Brightness middle (cd/m²) | 381.1 | 432.1 13% | 317.9 -17% | 387 2% | 475.4 25% | 385.2 1% |
| Brightness (cd/m²) | 381 | 426 12% | 304 -20% | 392 3% | 440 15% | 387 2% |
| Brightness Distribution (%) | 98 | 97 -1% | 90 -8% | 98 0% | 89 -9% | 99 1% |
| Black Level * (cd/m²) | 0.25 | 0.36 | ||||
| Colorchecker dE 2000 * | 3.3 | 1.95 41% | 7.39 -124% | 1 70% | 2.99 9% | 1.73 48% |
| Colorchecker dE 2000 max. * | 6.3 | 3.87 39% | 21.43 -240% | 1.9 70% | 7.64 -21% | 3.95 37% |
| Greyscale dE 2000 * | 0.9 | 2 -122% | 6.5 -622% | 1.7 -89% | 2.9 -222% | 2.6 -189% |
| Gamma | 2.23 99% | 2.3 96% | 2.22 99% | 2.25 98% | 2.31 95% | 2.17 101% |
| CCT | 6369 102% | 6222 104% | 6140 106% | 6325 103% | 6472 100% | 6133 106% |
| Colorchecker dE 2000 calibrated * | 1.16 | 3.06 | 0.74 | |||
| Contrast (:1) | 1272 | 1321 | ||||
| Totaal Gemiddelde (Programma / Instellingen) | -1394% /
-1046% | -1083% /
-658% | -8% /
-3% | -413% /
-238% | -4% /
-8% |
* ... kleiner is beter

Responstijd Scherm
| ↔ Responstijd Zwart naar Wit | ||
|---|---|---|
| 0.9 ms ... stijging ↗ en daling ↘ gecombineerd | ↗ 0.4 ms stijging | 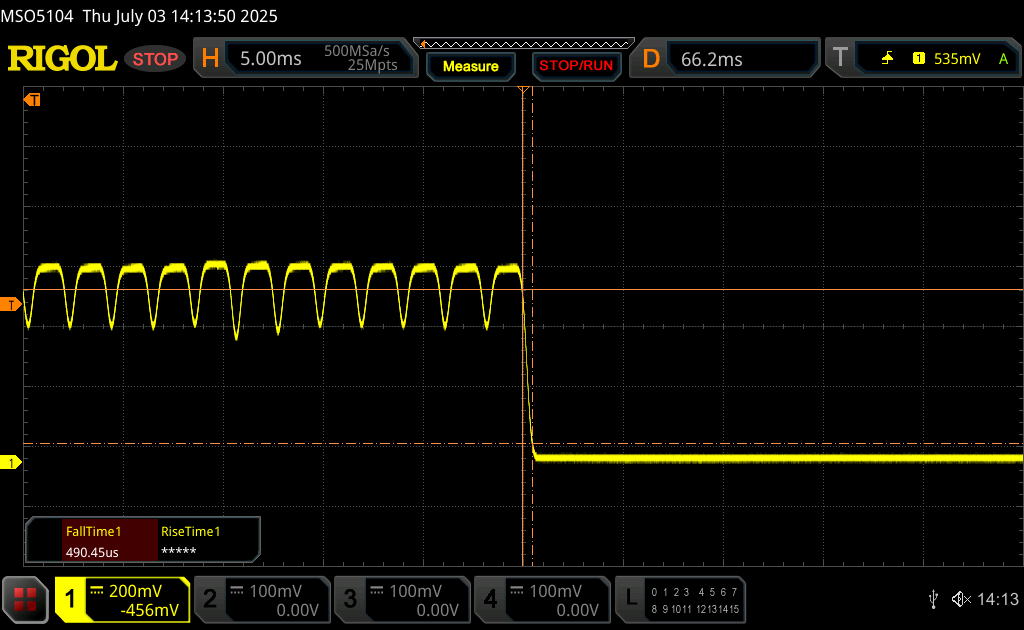 |
| ↘ 0.5 ms daling | ||
| Het scherm vertoonde erg snelle responstijden in onze tests en zou zeer geschikt moeten zijn voor snelle games. Ter vergelijking: alle testtoestellen variëren van 0.1 (minimum) tot 240 (maximum) ms. » 3 % van alle toestellen zijn beter. Dit betekent dat de gemeten responstijd beter is dan het gemiddelde (19.8 ms) van alle geteste toestellen. | ||
| ↔ Responstijd 50% Grijs naar 80% Grijs | ||
| 0.8 ms ... stijging ↗ en daling ↘ gecombineerd | ↗ 0.4 ms stijging | 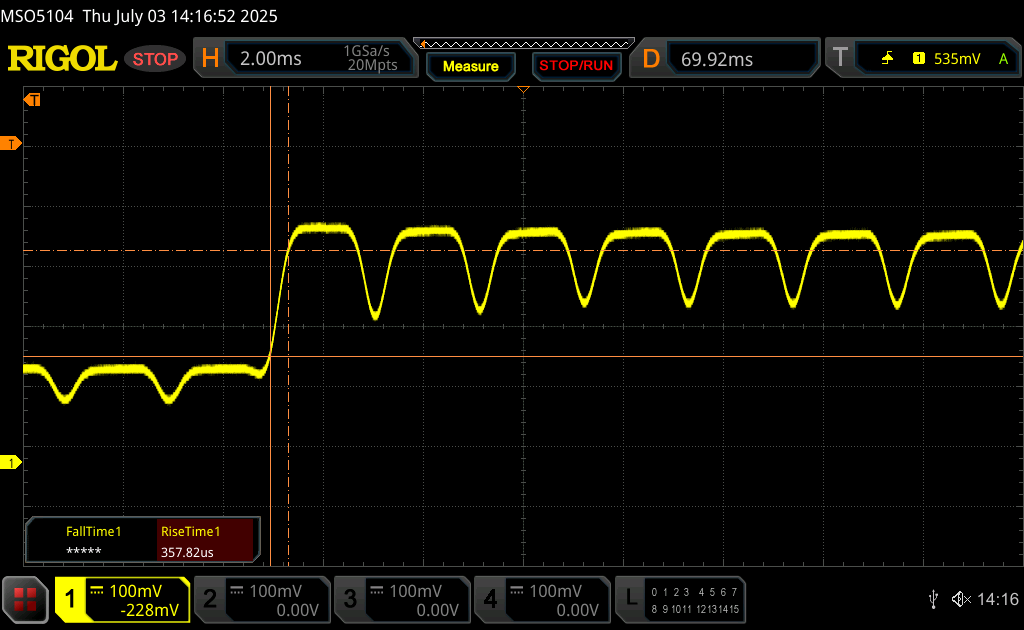 |
| ↘ 0.4 ms daling | ||
| Het scherm vertoonde erg snelle responstijden in onze tests en zou zeer geschikt moeten zijn voor snelle games. Ter vergelijking: alle testtoestellen variëren van 0.165 (minimum) tot 636 (maximum) ms. » 3 % van alle toestellen zijn beter. Dit betekent dat de gemeten responstijd beter is dan het gemiddelde (31 ms) van alle geteste toestellen. | ||
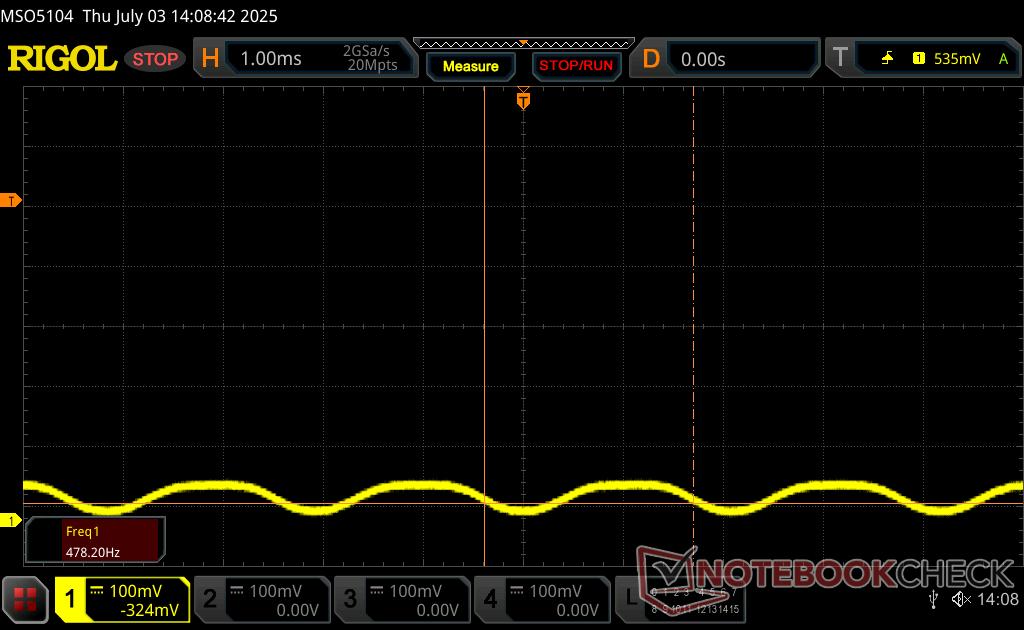
Screen Flickering / PWM (Pulse-Width Modulation)
| Screen flickering / PWM waargenomen | 473.8 Hz Amplitude: 15 % | ≤ 100 % helderheid instelling | 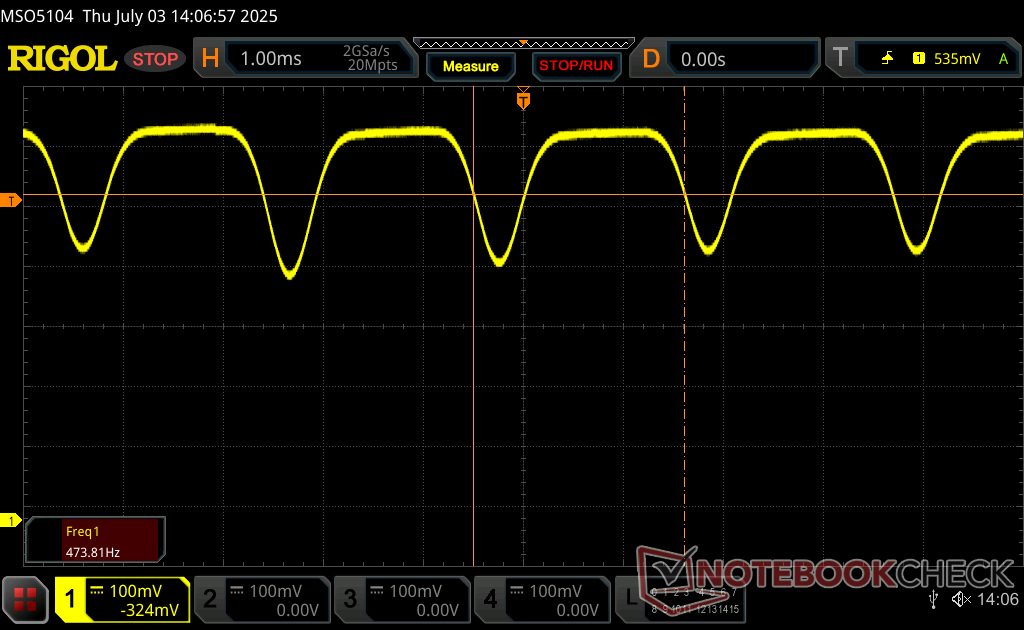 |
De achtergrondverlichting van het scherm flikkert op 473.8 Hz (in het slechtste geval, bijvoorbeeld bij gebruik van PWM) aan een helderheid van 100 % en lager. Boven deze helderheid zou er geen flickering / PWM mogen optreden. De frequentie van 473.8 Hz is relatief hoog en de meeste mensen die gevoelig zijn aan flickering zouden dit dus niet mogen waarnemen of geïrriteerde ogen krijgen. Er zijn echter rapporten die beweren dat sommige mensen toch flickering met 500 Hz en hoger kunnen waarnemen: opgelet dus. Ter vergelijking: 52 % van alle geteste toestellen maakten geen gebruik van PWM om de schermhelderheid te verlagen. Als het wel werd gebruikt, werd een gemiddelde van 7750 (minimum: 5 - maximum: 343500) Hz waargenomen. | |||


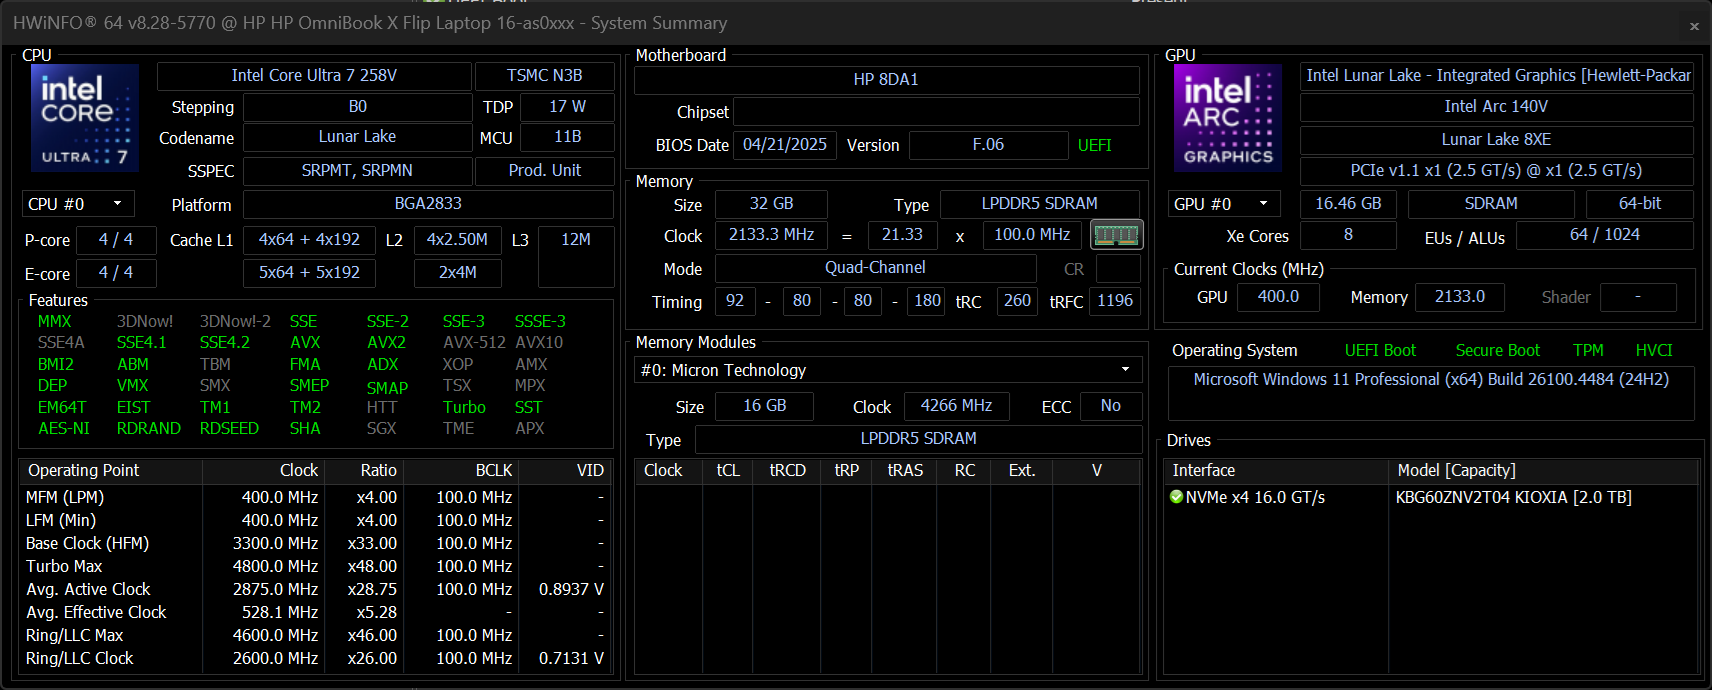
Prestaties - Lunar Lake Efficiëntie
Testomstandigheden
We hebben Windows in de modus Prestaties gezet voordat we de onderstaande benchmarks uitvoerden.
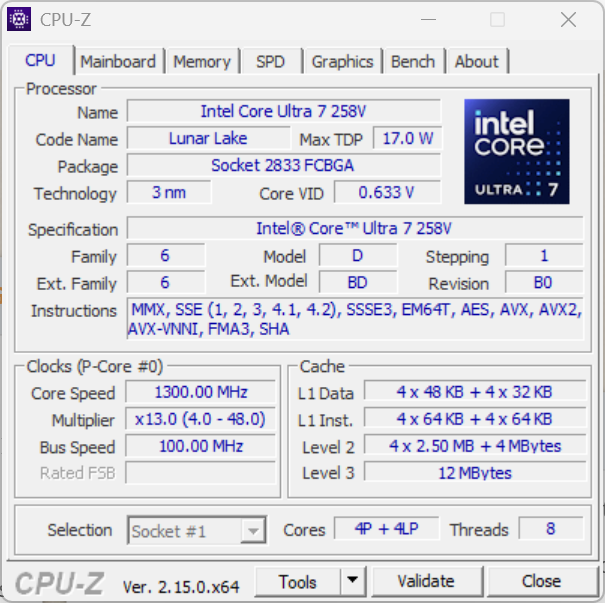
Processor
De Core Ultra 7 258V biedt vergelijkbare multi-thread prestaties als de goedkopere Core Ultra 5 125U. De duurzaamheid van de prestaties is ook behoorlijk met een tekort van ongeveer 10 procent bij het uitvoeren van CineBench R15 xT in een loop.
Cinebench R15 Multi Loop
Cinebench R23: Multi Core | Single Core
Cinebench R20: CPU (Multi Core) | CPU (Single Core)
Cinebench R15: CPU Multi 64Bit | CPU Single 64Bit
Blender: v2.79 BMW27 CPU
7-Zip 18.03: 7z b 4 | 7z b 4 -mmt1
Geekbench 6.7: Multi-Core | Single-Core
Geekbench 5.5: Multi-Core | Single-Core
HWBOT x265 Benchmark v2.2: 4k Preset
LibreOffice : 20 Documents To PDF
R Benchmark 2.5: Overall mean
| HWBOT x265 Benchmark v2.2 / 4k Preset | |
| MSI Summit A16 AI Plus A3HMTG | |
| Asus Vivobook 16 M1606K | |
| Asus Zenbook S 16 UM5606WA-RK052W | |
| Asus V16 V3607V | |
| HP Spectre x360 16 RTX 4050 | |
| Lenovo Yoga 7 2-in-1 16ILL10 | |
| Samsung Galaxy Book5 Pro 360 | |
| Dell 16 Plus 2-in-1 | |
| HP OmniBook X Flip 16 | |
| Gemiddeld Intel Core Ultra 7 258V (7.11 - 14.2, n=24) | |
| Lenovo ThinkBook 16 G7 IML | |
| Acer Aspire 16 A16-51GM-77G2 | |
* ... kleiner is beter
AIDA64: FP32 Ray-Trace | FPU Julia | CPU SHA3 | CPU Queen | FPU SinJulia | FPU Mandel | CPU AES | CPU ZLib | FP64 Ray-Trace | CPU PhotoWorxx
| Performance rating | |
| MSI Summit A16 AI Plus A3HMTG | |
| HP Spectre x360 16 RTX 4050 | |
| Dell 16 Plus 2-in-1 | |
| HP OmniBook X Flip 16 | |
| Lenovo Yoga 7 2-in-1 16ILL10 | |
| Gemiddeld Intel Core Ultra 7 258V | |
| Samsung Galaxy Book5 Pro 360 | |
| AIDA64 / FP32 Ray-Trace | |
| MSI Summit A16 AI Plus A3HMTG | |
| HP Spectre x360 16 RTX 4050 | |
| Dell 16 Plus 2-in-1 | |
| Samsung Galaxy Book5 Pro 360 | |
| Lenovo Yoga 7 2-in-1 16ILL10 | |
| Gemiddeld Intel Core Ultra 7 258V (8454 - 12781, n=26) | |
| HP OmniBook X Flip 16 | |
| AIDA64 / FPU Julia | |
| MSI Summit A16 AI Plus A3HMTG | |
| HP Spectre x360 16 RTX 4050 | |
| Samsung Galaxy Book5 Pro 360 | |
| HP OmniBook X Flip 16 | |
| Lenovo Yoga 7 2-in-1 16ILL10 | |
| Dell 16 Plus 2-in-1 | |
| Gemiddeld Intel Core Ultra 7 258V (40875 - 63401, n=26) | |
| AIDA64 / CPU SHA3 | |
| MSI Summit A16 AI Plus A3HMTG | |
| HP Spectre x360 16 RTX 4050 | |
| Lenovo Yoga 7 2-in-1 16ILL10 | |
| HP OmniBook X Flip 16 | |
| Gemiddeld Intel Core Ultra 7 258V (1930 - 2817, n=26) | |
| Samsung Galaxy Book5 Pro 360 | |
| Dell 16 Plus 2-in-1 | |
| AIDA64 / CPU Queen | |
| MSI Summit A16 AI Plus A3HMTG | |
| HP Spectre x360 16 RTX 4050 | |
| Dell 16 Plus 2-in-1 | |
| HP OmniBook X Flip 16 | |
| Lenovo Yoga 7 2-in-1 16ILL10 | |
| Gemiddeld Intel Core Ultra 7 258V (48816 - 49818, n=24) | |
| Samsung Galaxy Book5 Pro 360 | |
| AIDA64 / FPU SinJulia | |
| MSI Summit A16 AI Plus A3HMTG | |
| HP Spectre x360 16 RTX 4050 | |
| Lenovo Yoga 7 2-in-1 16ILL10 | |
| HP OmniBook X Flip 16 | |
| Dell 16 Plus 2-in-1 | |
| Gemiddeld Intel Core Ultra 7 258V (3817 - 4440, n=26) | |
| Samsung Galaxy Book5 Pro 360 | |
| AIDA64 / FPU Mandel | |
| MSI Summit A16 AI Plus A3HMTG | |
| HP Spectre x360 16 RTX 4050 | |
| Samsung Galaxy Book5 Pro 360 | |
| Lenovo Yoga 7 2-in-1 16ILL10 | |
| HP OmniBook X Flip 16 | |
| Dell 16 Plus 2-in-1 | |
| Gemiddeld Intel Core Ultra 7 258V (21670 - 33565, n=26) | |
| AIDA64 / CPU AES | |
| MSI Summit A16 AI Plus A3HMTG | |
| HP Spectre x360 16 RTX 4050 | |
| HP OmniBook X Flip 16 | |
| Dell 16 Plus 2-in-1 | |
| Lenovo Yoga 7 2-in-1 16ILL10 | |
| Gemiddeld Intel Core Ultra 7 258V (30957 - 40753, n=26) | |
| Samsung Galaxy Book5 Pro 360 | |
| AIDA64 / CPU ZLib | |
| MSI Summit A16 AI Plus A3HMTG | |
| HP Spectre x360 16 RTX 4050 | |
| Lenovo Yoga 7 2-in-1 16ILL10 | |
| Dell 16 Plus 2-in-1 | |
| HP OmniBook X Flip 16 | |
| Gemiddeld Intel Core Ultra 7 258V (422 - 632, n=26) | |
| Samsung Galaxy Book5 Pro 360 | |
| AIDA64 / FP64 Ray-Trace | |
| MSI Summit A16 AI Plus A3HMTG | |
| HP Spectre x360 16 RTX 4050 | |
| Samsung Galaxy Book5 Pro 360 | |
| Dell 16 Plus 2-in-1 | |
| Lenovo Yoga 7 2-in-1 16ILL10 | |
| Gemiddeld Intel Core Ultra 7 258V (4258 - 6930, n=26) | |
| HP OmniBook X Flip 16 | |
| AIDA64 / CPU PhotoWorxx | |
| Dell 16 Plus 2-in-1 | |
| HP OmniBook X Flip 16 | |
| Gemiddeld Intel Core Ultra 7 258V (44223 - 59245, n=26) | |
| Lenovo Yoga 7 2-in-1 16ILL10 | |
| MSI Summit A16 AI Plus A3HMTG | |
| Samsung Galaxy Book5 Pro 360 | |
| HP Spectre x360 16 RTX 4050 | |
Stresstest
De CPU stabiliseert op 2,9 GHz, 82 C en 26 W bij het uitvoeren van Prime95 stress, vergeleken met 2,5 GHz, 72 C en 22 W op de Dell Plus 16 2-in-1 met dezelfde Core Ultra 7 258V processor.
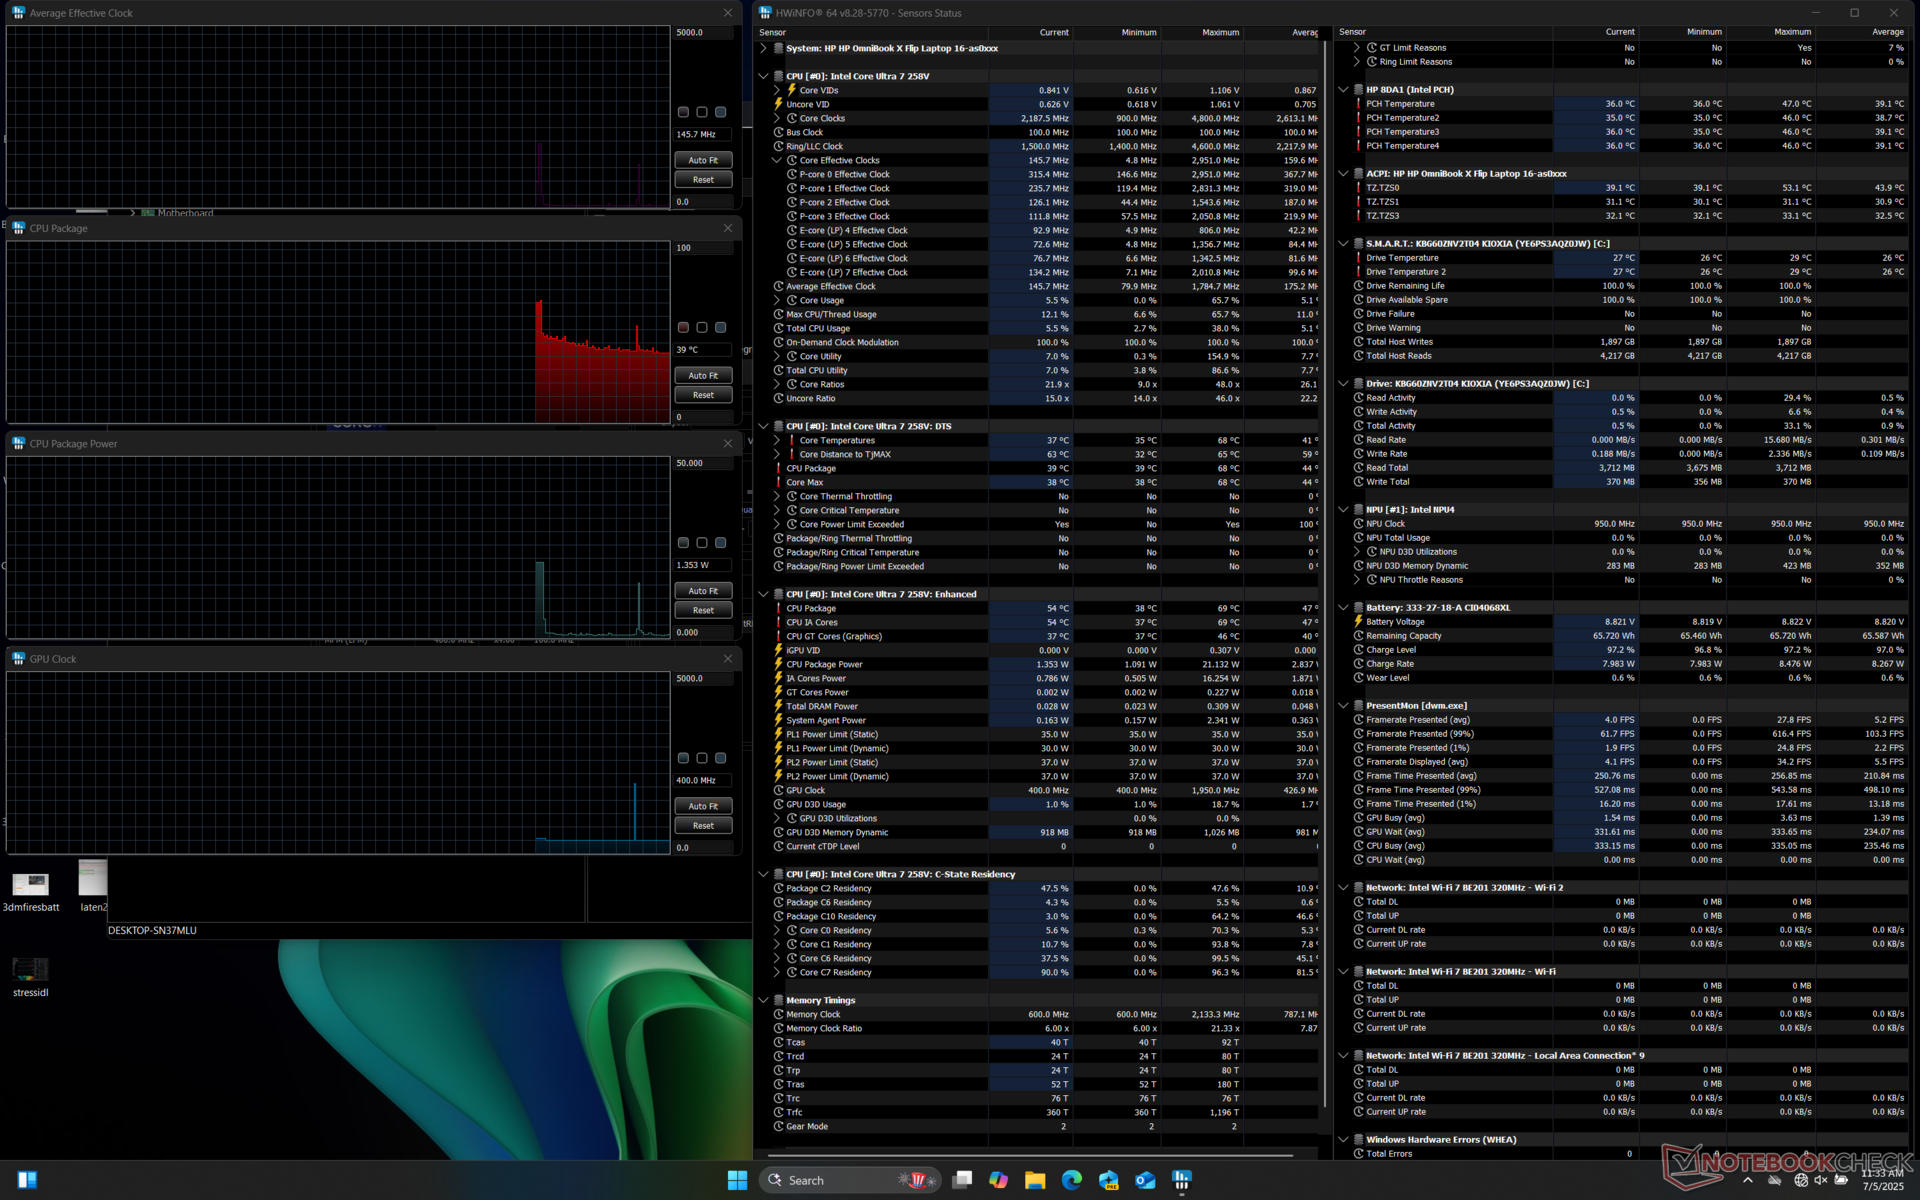

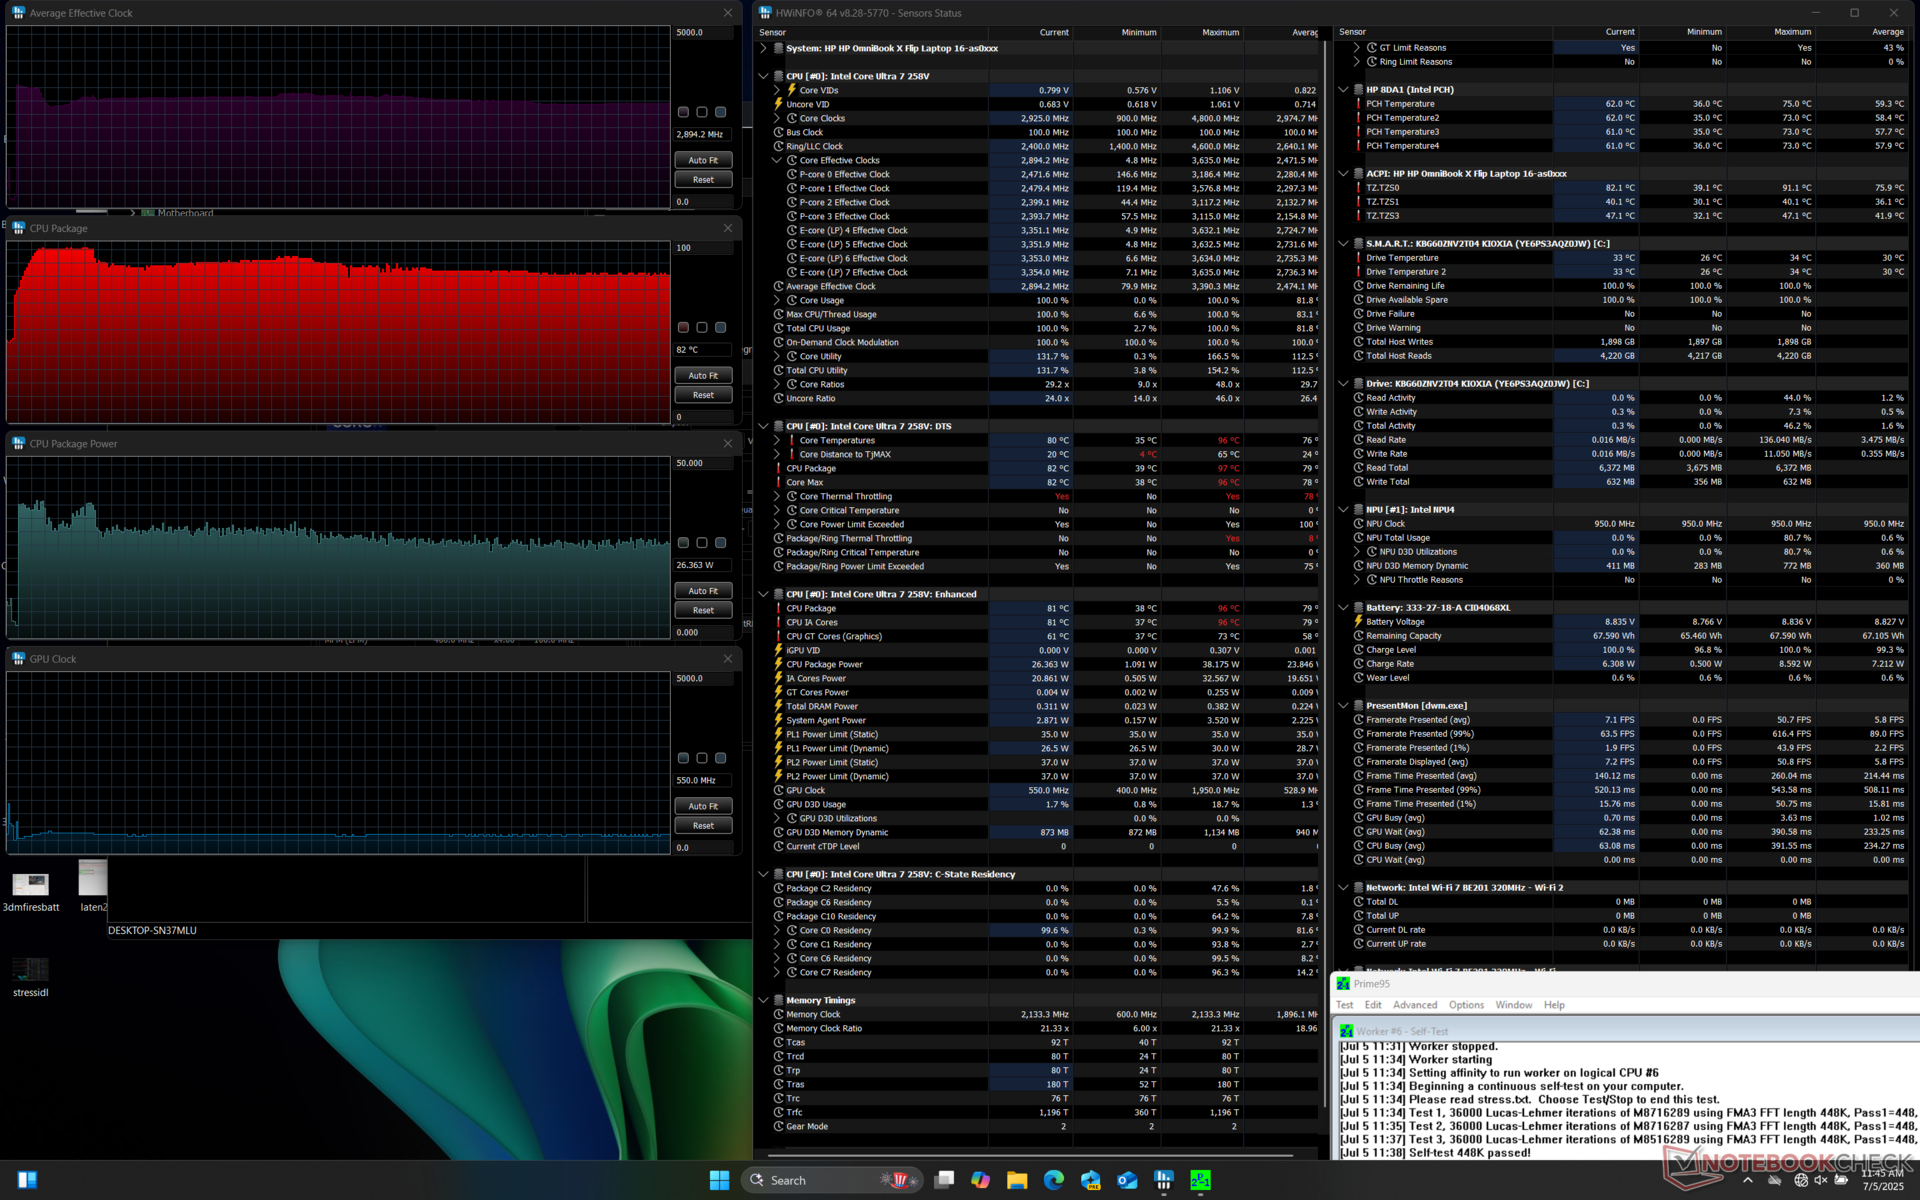
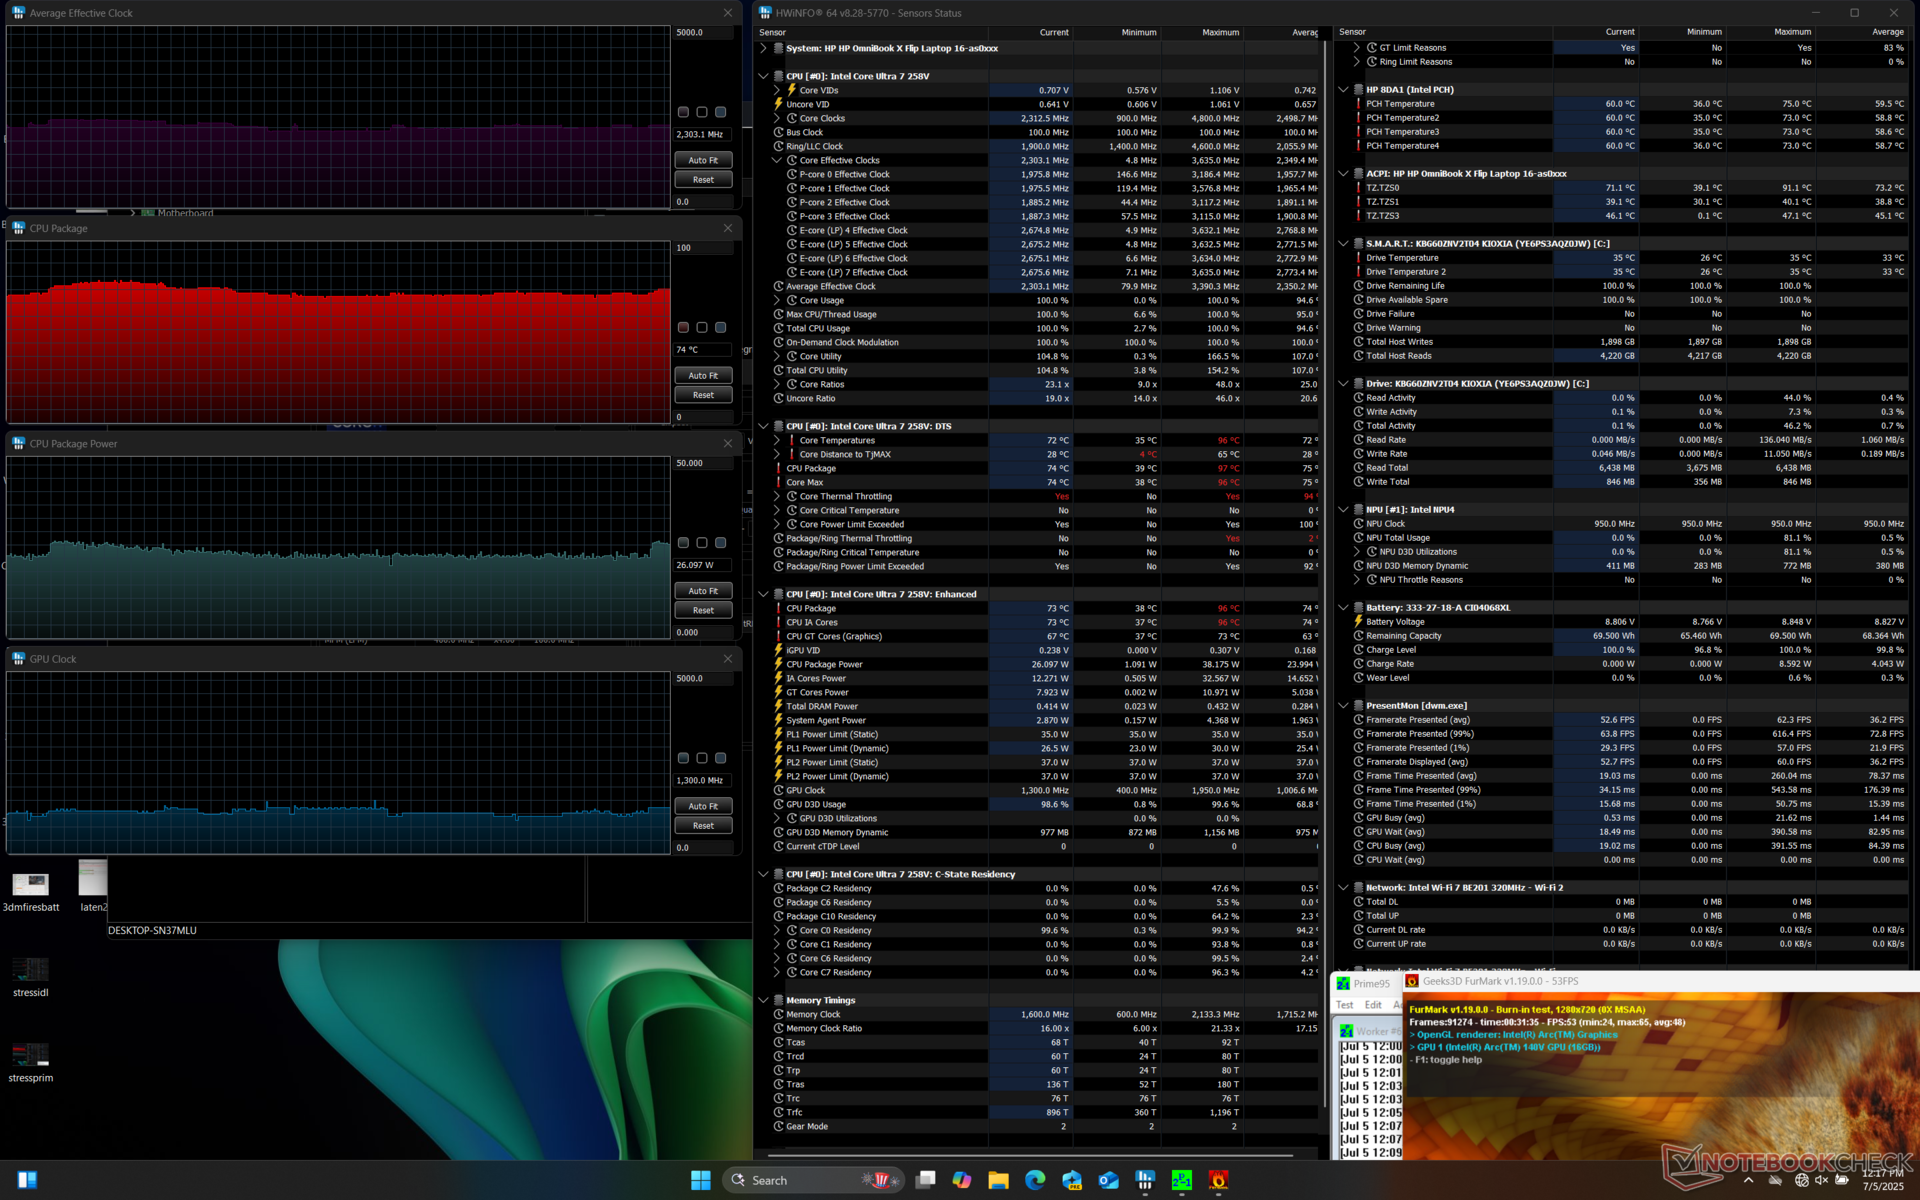
| Gemiddelde CPU-klok (GHz) | GPU-klok (MHz) | Gemiddelde CPU-temperatuur (°C) | |
| Inactief systeem | -- | -- | 39 |
| Prime95-stress | 2.9 | -- | 82 |
| Prime95 + FurMark Stress | 2.3 | 1300 | 74 |
| Cyberpunk 2077 Stress | 1.3 | 1750 | 68 |
Systeemprestaties
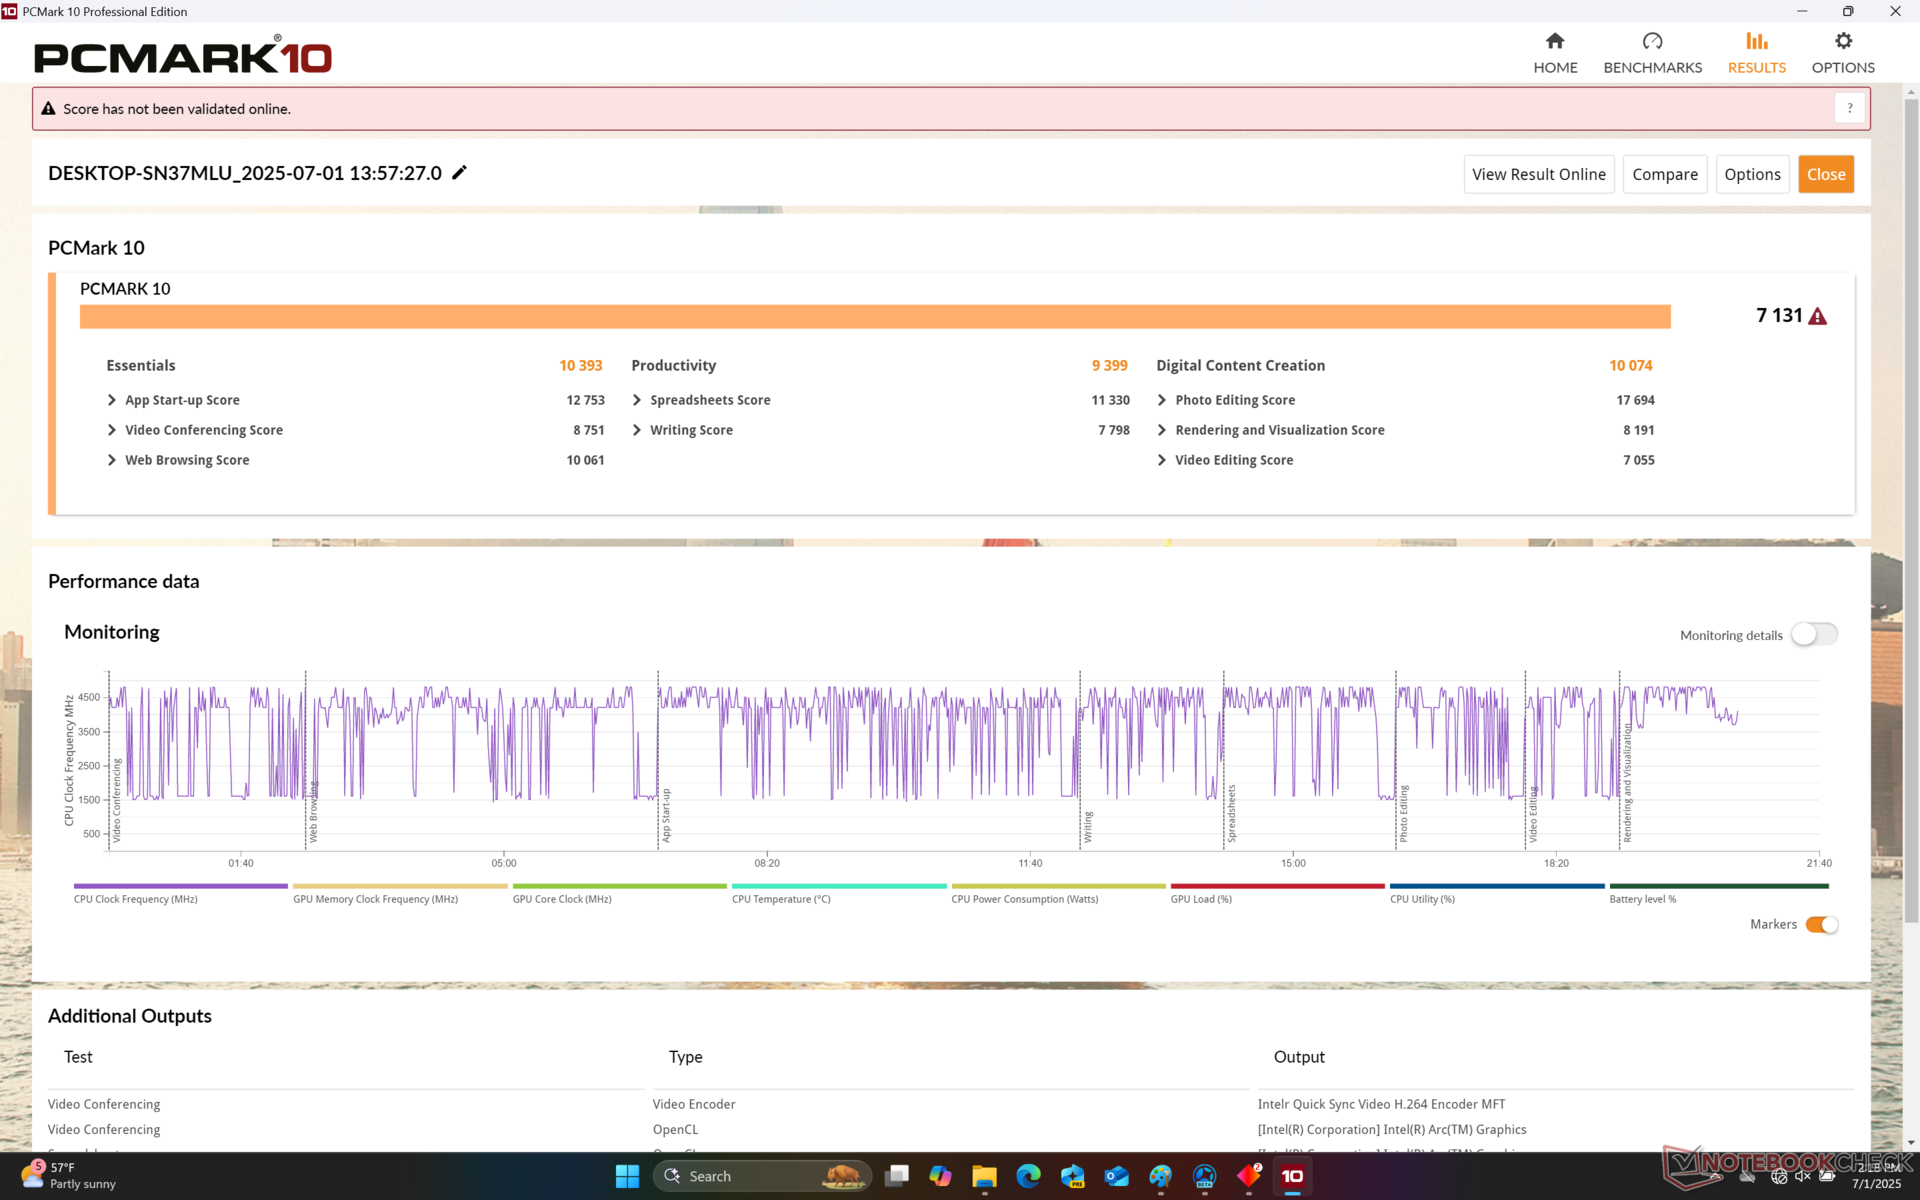
PCMark 10: Score | Essentials | Productivity | Digital Content Creation
CrossMark: Overall | Productivity | Creativity | Responsiveness
WebXPRT 3: Overall
WebXPRT 4: Overall
Mozilla Kraken 1.1: Total
| Performance rating | |
| MSI Summit A16 AI Plus A3HMTG | |
| Lenovo Yoga 7 2-in-1 16ILL10 | |
| HP OmniBook X Flip 16 | |
| Dell 16 Plus 2-in-1 | |
| Gemiddeld Intel Core Ultra 7 258V, Intel Arc Graphics 140V | |
| Samsung Galaxy Book5 Pro 360 | |
| HP Spectre x360 16 RTX 4050 | |
| PCMark 10 / Score | |
| MSI Summit A16 AI Plus A3HMTG | |
| Lenovo Yoga 7 2-in-1 16ILL10 | |
| HP OmniBook X Flip 16 | |
| Gemiddeld Intel Core Ultra 7 258V, Intel Arc Graphics 140V (6265 - 7420, n=23) | |
| Dell 16 Plus 2-in-1 | |
| HP Spectre x360 16 RTX 4050 | |
| Samsung Galaxy Book5 Pro 360 | |
| PCMark 10 / Essentials | |
| Lenovo Yoga 7 2-in-1 16ILL10 | |
| MSI Summit A16 AI Plus A3HMTG | |
| HP OmniBook X Flip 16 | |
| Gemiddeld Intel Core Ultra 7 258V, Intel Arc Graphics 140V (9295 - 11467, n=23) | |
| HP Spectre x360 16 RTX 4050 | |
| Dell 16 Plus 2-in-1 | |
| Samsung Galaxy Book5 Pro 360 | |
| PCMark 10 / Productivity | |
| MSI Summit A16 AI Plus A3HMTG | |
| Lenovo Yoga 7 2-in-1 16ILL10 | |
| HP OmniBook X Flip 16 | |
| HP Spectre x360 16 RTX 4050 | |
| Gemiddeld Intel Core Ultra 7 258V, Intel Arc Graphics 140V (7357 - 13600, n=23) | |
| Samsung Galaxy Book5 Pro 360 | |
| Dell 16 Plus 2-in-1 | |
| PCMark 10 / Digital Content Creation | |
| MSI Summit A16 AI Plus A3HMTG | |
| Lenovo Yoga 7 2-in-1 16ILL10 | |
| HP OmniBook X Flip 16 | |
| Gemiddeld Intel Core Ultra 7 258V, Intel Arc Graphics 140V (8160 - 10308, n=23) | |
| Dell 16 Plus 2-in-1 | |
| Samsung Galaxy Book5 Pro 360 | |
| HP Spectre x360 16 RTX 4050 | |
| CrossMark / Overall | |
| MSI Summit A16 AI Plus A3HMTG | |
| HP OmniBook X Flip 16 | |
| Lenovo Yoga 7 2-in-1 16ILL10 | |
| Dell 16 Plus 2-in-1 | |
| Gemiddeld Intel Core Ultra 7 258V, Intel Arc Graphics 140V (1275 - 1742, n=22) | |
| Samsung Galaxy Book5 Pro 360 | |
| HP Spectre x360 16 RTX 4050 | |
| CrossMark / Productivity | |
| HP OmniBook X Flip 16 | |
| Lenovo Yoga 7 2-in-1 16ILL10 | |
| Dell 16 Plus 2-in-1 | |
| Gemiddeld Intel Core Ultra 7 258V, Intel Arc Graphics 140V (1267 - 1684, n=22) | |
| MSI Summit A16 AI Plus A3HMTG | |
| Samsung Galaxy Book5 Pro 360 | |
| HP Spectre x360 16 RTX 4050 | |
| CrossMark / Creativity | |
| MSI Summit A16 AI Plus A3HMTG | |
| Lenovo Yoga 7 2-in-1 16ILL10 | |
| HP OmniBook X Flip 16 | |
| Dell 16 Plus 2-in-1 | |
| Gemiddeld Intel Core Ultra 7 258V, Intel Arc Graphics 140V (1393 - 1977, n=22) | |
| HP Spectre x360 16 RTX 4050 | |
| Samsung Galaxy Book5 Pro 360 | |
| CrossMark / Responsiveness | |
| MSI Summit A16 AI Plus A3HMTG | |
| HP OmniBook X Flip 16 | |
| Lenovo Yoga 7 2-in-1 16ILL10 | |
| Samsung Galaxy Book5 Pro 360 | |
| Gemiddeld Intel Core Ultra 7 258V, Intel Arc Graphics 140V (999 - 1411, n=22) | |
| Dell 16 Plus 2-in-1 | |
| HP Spectre x360 16 RTX 4050 | |
| WebXPRT 3 / Overall | |
| MSI Summit A16 AI Plus A3HMTG | |
| HP OmniBook X Flip 16 | |
| Lenovo Yoga 7 2-in-1 16ILL10 | |
| Dell 16 Plus 2-in-1 | |
| Gemiddeld Intel Core Ultra 7 258V, Intel Arc Graphics 140V (219 - 317, n=22) | |
| HP Spectre x360 16 RTX 4050 | |
| Samsung Galaxy Book5 Pro 360 | |
| WebXPRT 4 / Overall | |
| Lenovo Yoga 7 2-in-1 16ILL10 | |
| Dell 16 Plus 2-in-1 | |
| HP OmniBook X Flip 16 | |
| Gemiddeld Intel Core Ultra 7 258V, Intel Arc Graphics 140V (199.5 - 291, n=22) | |
| MSI Summit A16 AI Plus A3HMTG | |
| Samsung Galaxy Book5 Pro 360 | |
| HP Spectre x360 16 RTX 4050 | |
| Mozilla Kraken 1.1 / Total | |
| HP Spectre x360 16 RTX 4050 | |
| Samsung Galaxy Book5 Pro 360 | |
| HP OmniBook X Flip 16 | |
| Gemiddeld Intel Core Ultra 7 258V, Intel Arc Graphics 140V (468 - 559, n=24) | |
| Dell 16 Plus 2-in-1 | |
| Lenovo Yoga 7 2-in-1 16ILL10 | |
| MSI Summit A16 AI Plus A3HMTG | |
* ... kleiner is beter
| PCMark 10 Score | 7131 punten | |
Help | ||
| AIDA64 / Memory Copy | |
| Gemiddeld Intel Core Ultra 7 258V (104408 - 114336, n=24) | |
| HP OmniBook X Flip 16 | |
| Dell 16 Plus 2-in-1 | |
| Samsung Galaxy Book5 Pro 360 | |
| Lenovo Yoga 7 2-in-1 16ILL10 | |
| MSI Summit A16 AI Plus A3HMTG | |
| HP Spectre x360 16 RTX 4050 | |
| AIDA64 / Memory Read | |
| MSI Summit A16 AI Plus A3HMTG | |
| Lenovo Yoga 7 2-in-1 16ILL10 | |
| Dell 16 Plus 2-in-1 | |
| Gemiddeld Intel Core Ultra 7 258V (82846 - 89417, n=24) | |
| HP Spectre x360 16 RTX 4050 | |
| HP OmniBook X Flip 16 | |
| Samsung Galaxy Book5 Pro 360 | |
| AIDA64 / Memory Write | |
| Lenovo Yoga 7 2-in-1 16ILL10 | |
| HP OmniBook X Flip 16 | |
| Dell 16 Plus 2-in-1 | |
| Gemiddeld Intel Core Ultra 7 258V (108824 - 117989, n=24) | |
| Samsung Galaxy Book5 Pro 360 | |
| MSI Summit A16 AI Plus A3HMTG | |
| HP Spectre x360 16 RTX 4050 | |
| AIDA64 / Memory Latency | |
| HP Spectre x360 16 RTX 4050 | |
| MSI Summit A16 AI Plus A3HMTG | |
| Dell 16 Plus 2-in-1 | |
| Lenovo Yoga 7 2-in-1 16ILL10 | |
| HP OmniBook X Flip 16 | |
| Gemiddeld Intel Core Ultra 7 258V (95 - 101.7, n=24) | |
| Samsung Galaxy Book5 Pro 360 | |
* ... kleiner is beter
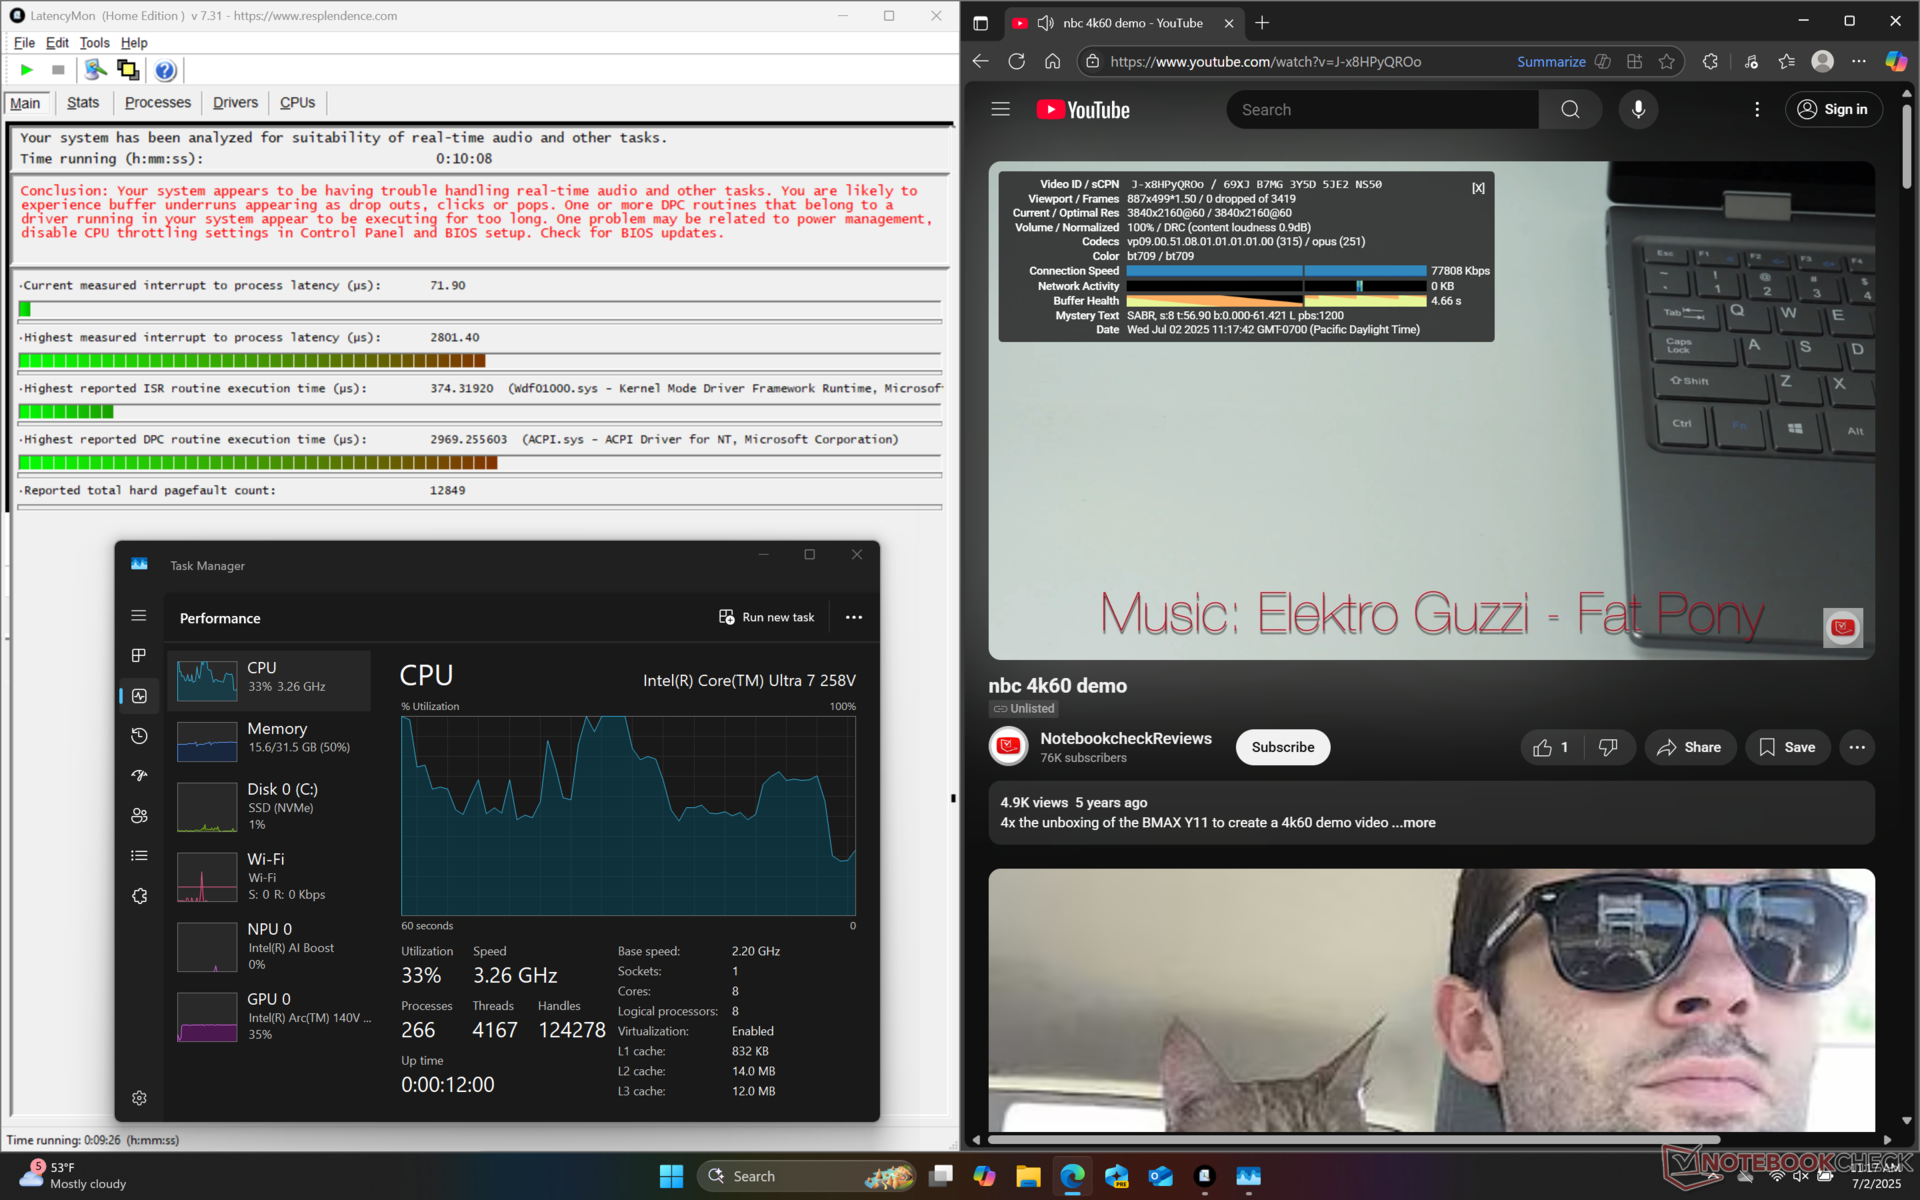
DPC latentie
| DPC Latencies / LatencyMon - interrupt to process latency (max), Web, Youtube, Prime95 | |
| HP Spectre x360 16 RTX 4050 | |
| MSI Summit A16 AI Plus A3HMTG | |
| HP OmniBook X Flip 16 | |
| Dell 16 Plus 2-in-1 | |
| Samsung Galaxy Book5 Pro 360 | |
| Lenovo Yoga 7 2-in-1 16ILL10 | |
* ... kleiner is beter
Opslagapparaten
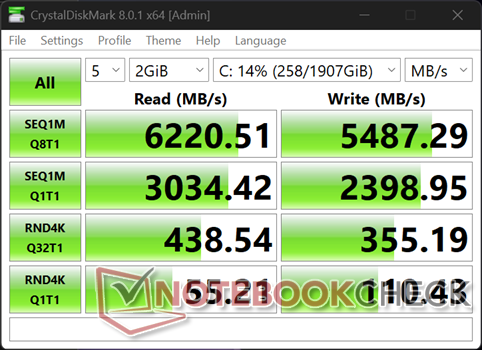
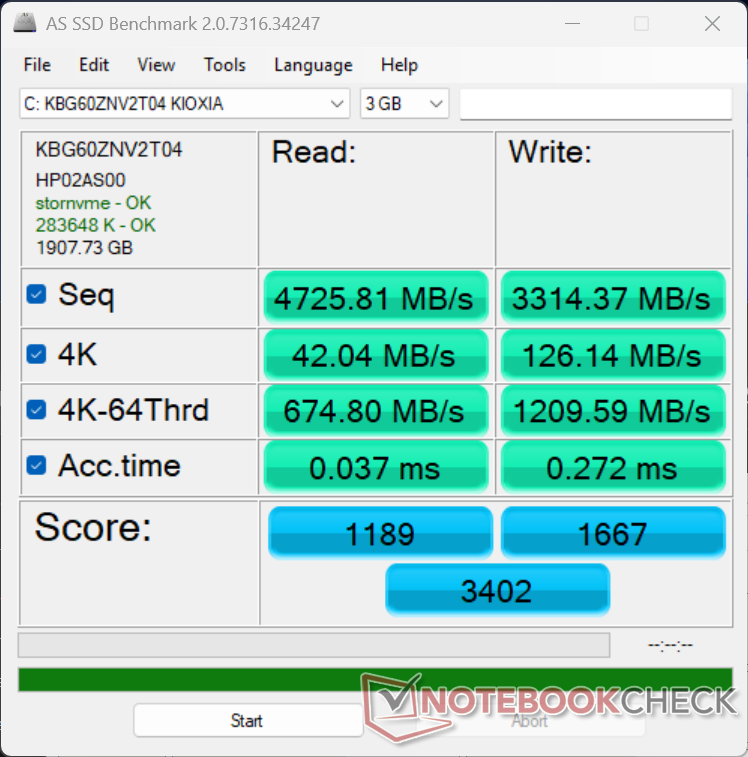

| Drive Performance rating - Percent | |
| Samsung Galaxy Book5 Pro 360 | |
| HP Spectre x360 16 RTX 4050 | |
| Lenovo Yoga 7 2-in-1 16ILL10 | |
| MSI Summit A16 AI Plus A3HMTG | |
| HP OmniBook X Flip 16 | |
| Dell 16 Plus 2-in-1 | |
* ... kleiner is beter
Disk Throttling: DiskSpd Read Loop, Queue Depth 8
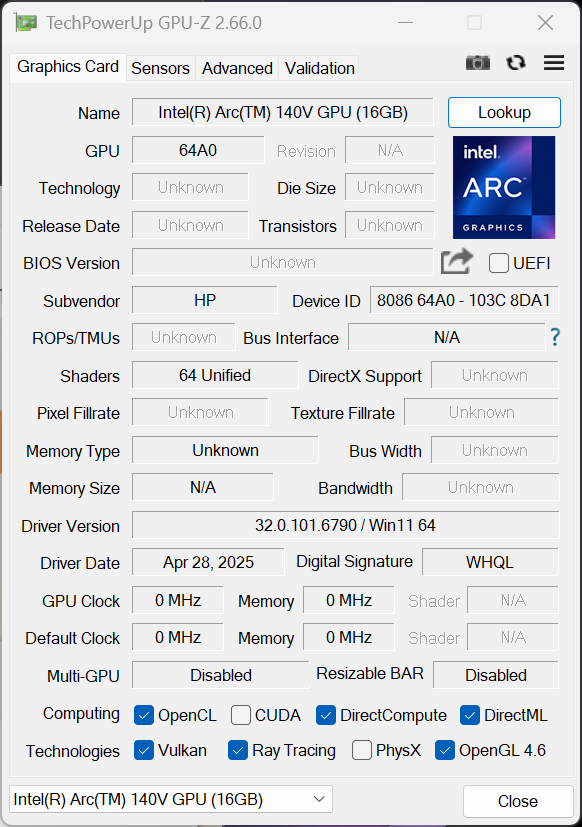
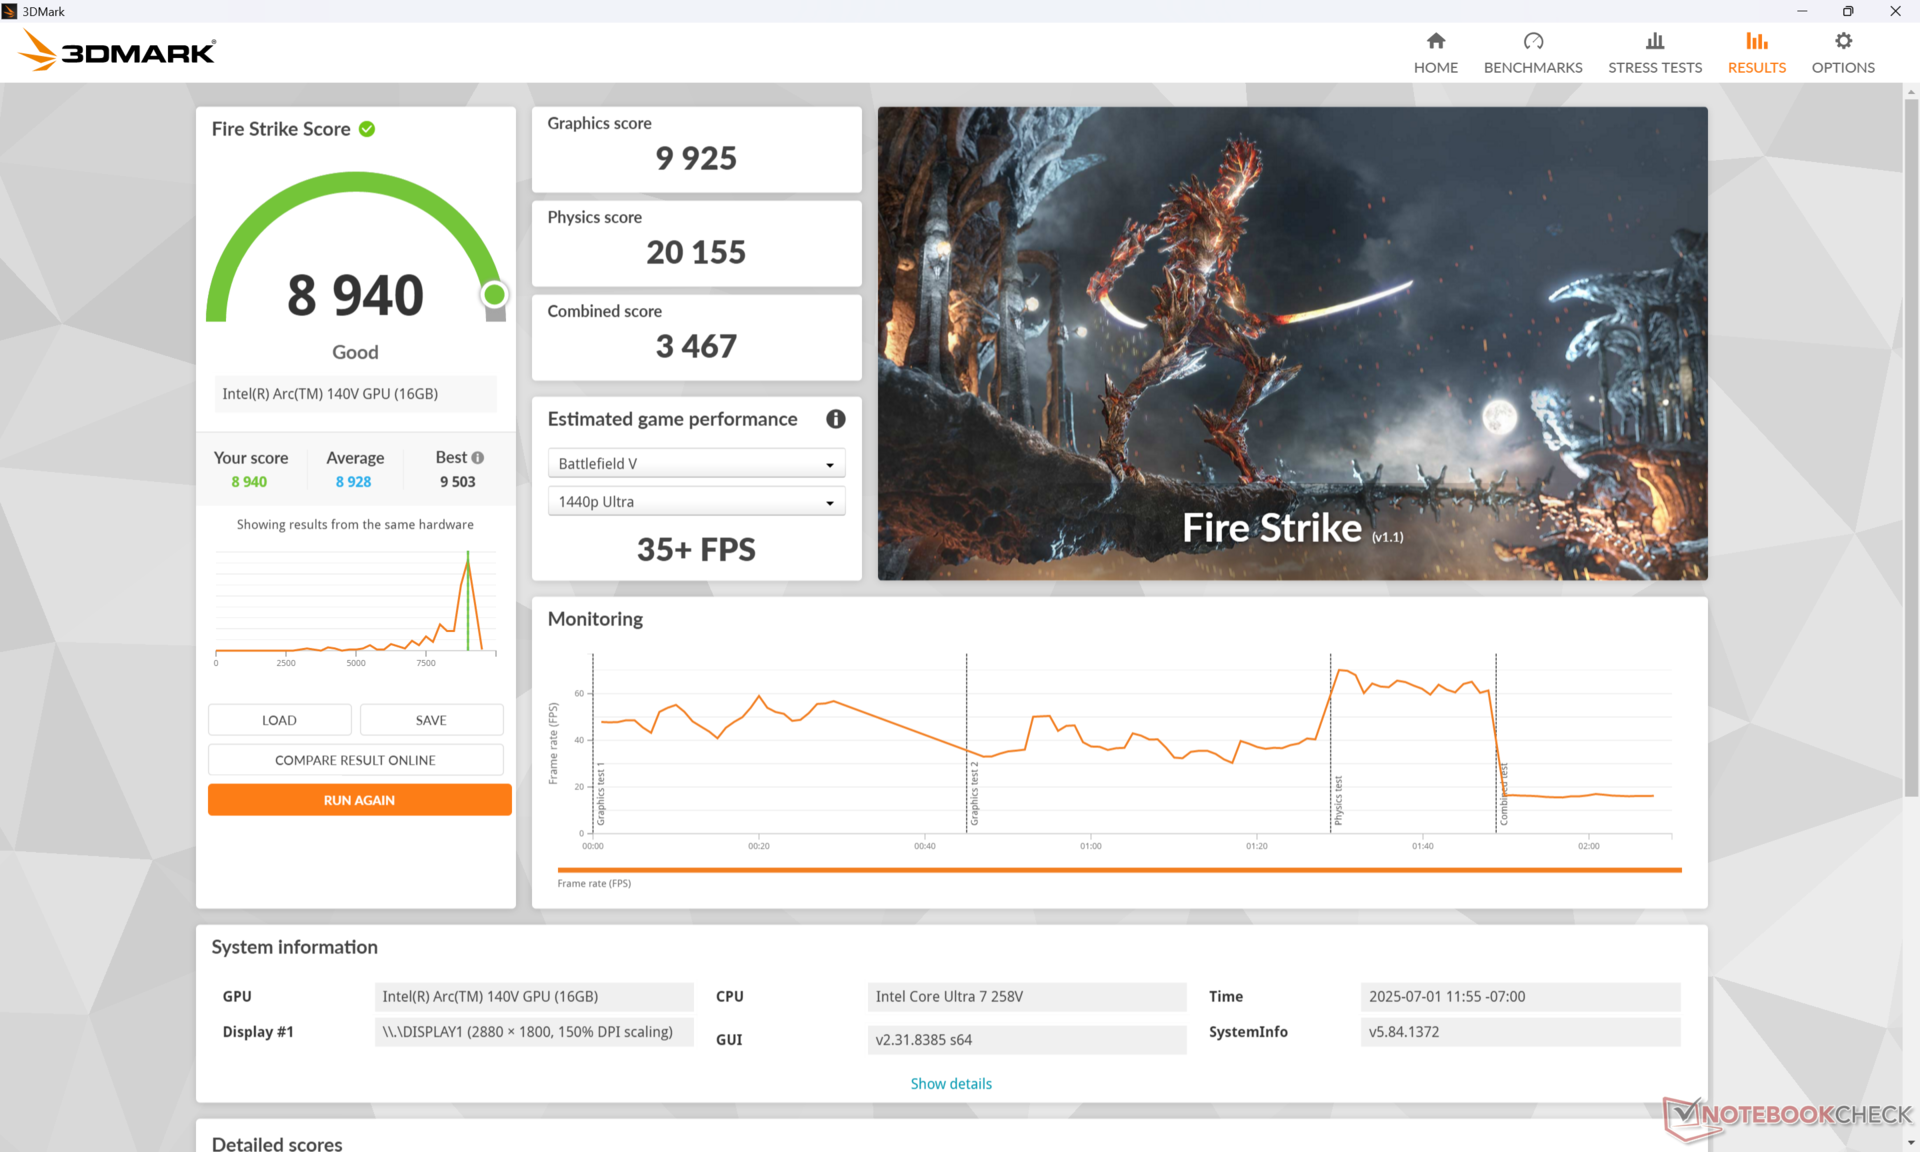
GPU-prestaties
De Arc Graphics 140V is een opmerkelijke verbetering ten opzichte van de vorige generatie Iris Xe serie terwijl hij ruwweg 15 procent sneller is dan de mindere Arc 130V configuratie. Het is nog steeds geen partij voor de discrete Nvidia GPU in de HP Spectre x360 16echter.
Op de batterij werken vermindert de prestaties met maar liefst 20 procent.
| Energieprofiel | Grafische Score | Fysica Score | Gecombineerde score |
| Prestatiemodus | 9925 | 20155 | 3467 |
| Gebalanceerde modus | 9910 (-0%) | 20635 (-0%) | 3466 (-0%) |
| Batterijvermogen | 8048 (-19%) | 16246 (-19%) | 2499 (-28%) |
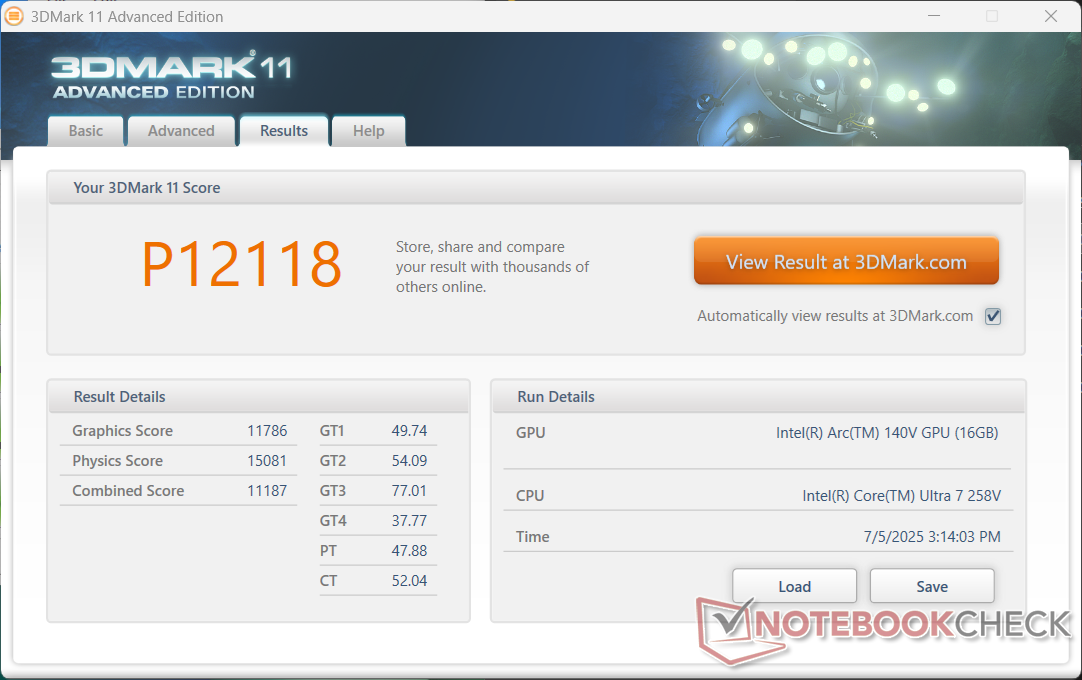
| 3DMark 11 Performance | 12118 punten | |
| 3DMark Cloud Gate Standard Score | 32872 punten | |
| 3DMark Fire Strike Score | 8940 punten | |
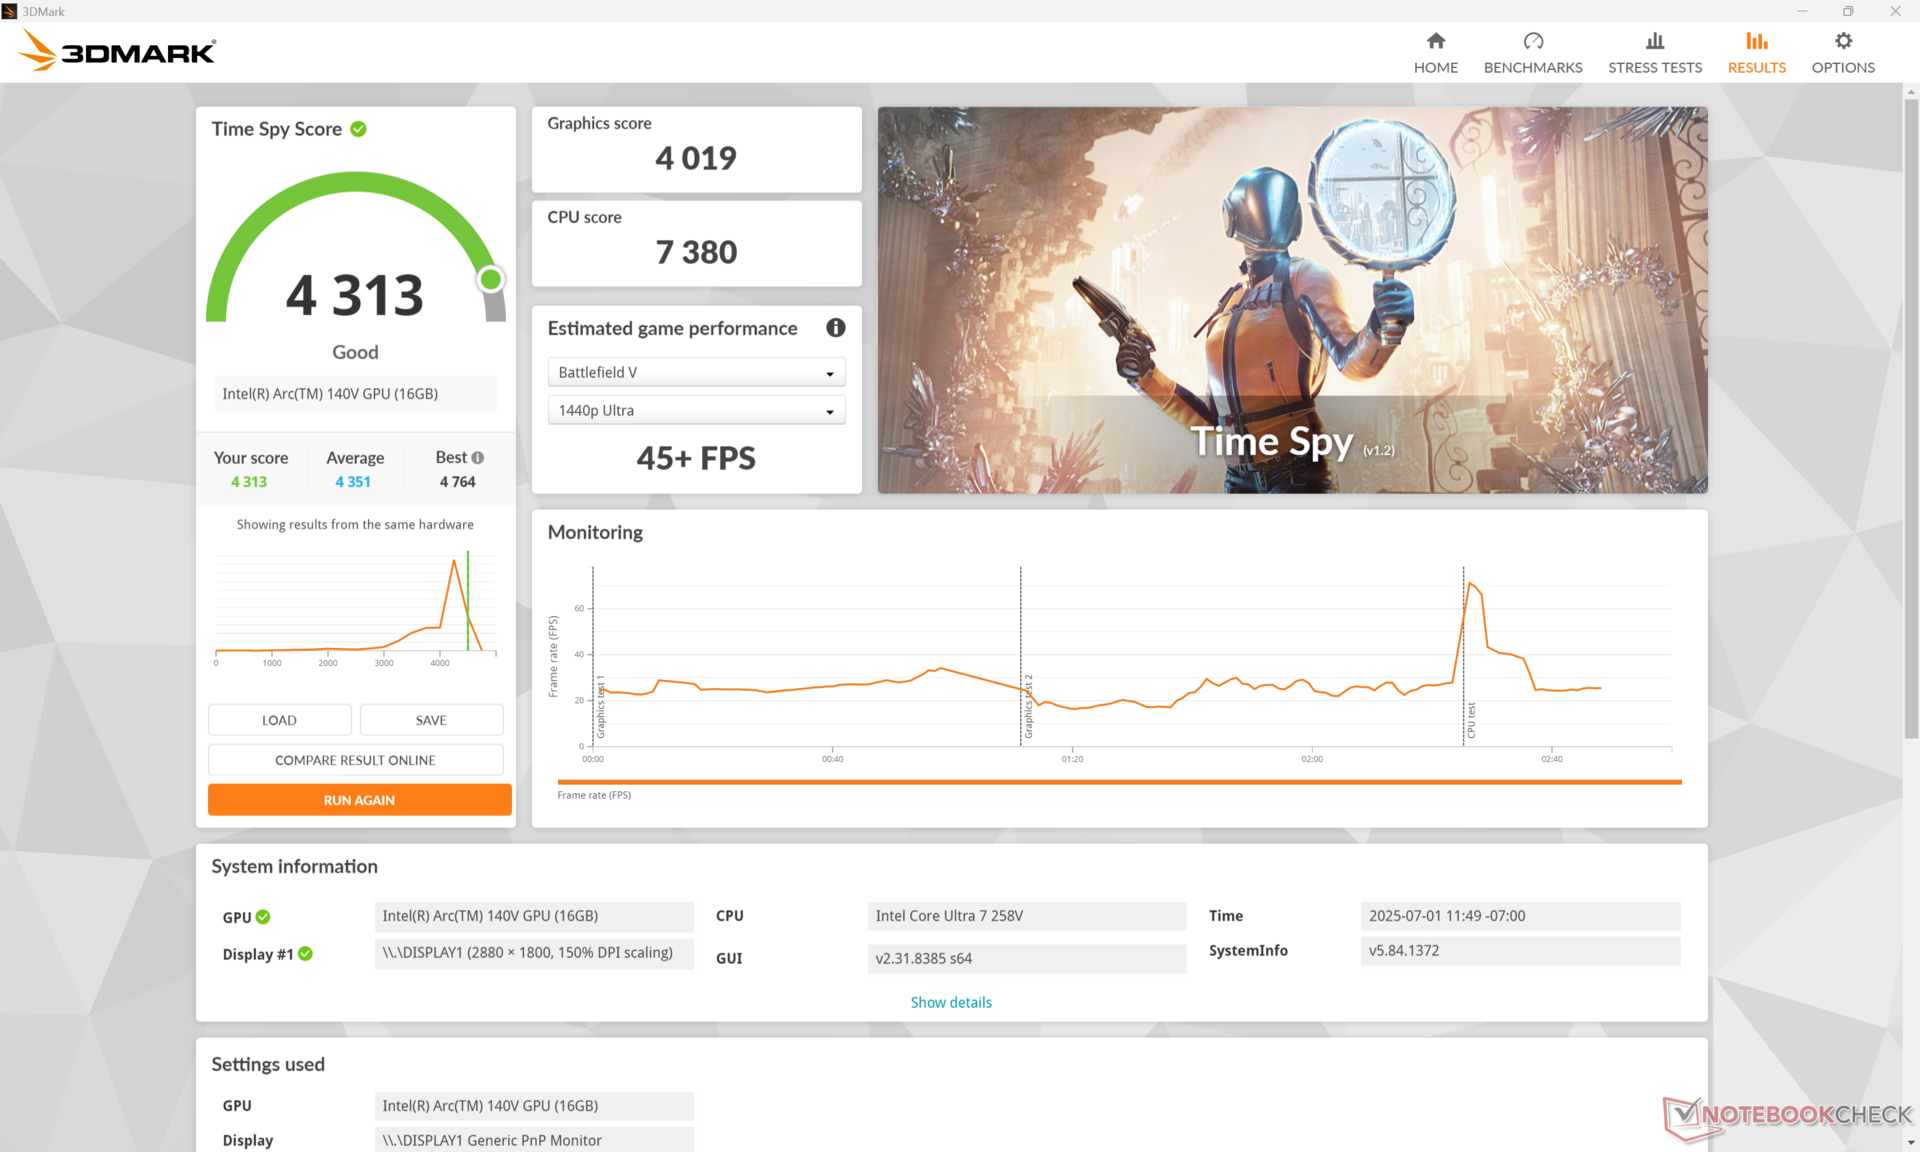
| 3DMark Time Spy Score | 4313 punten | |
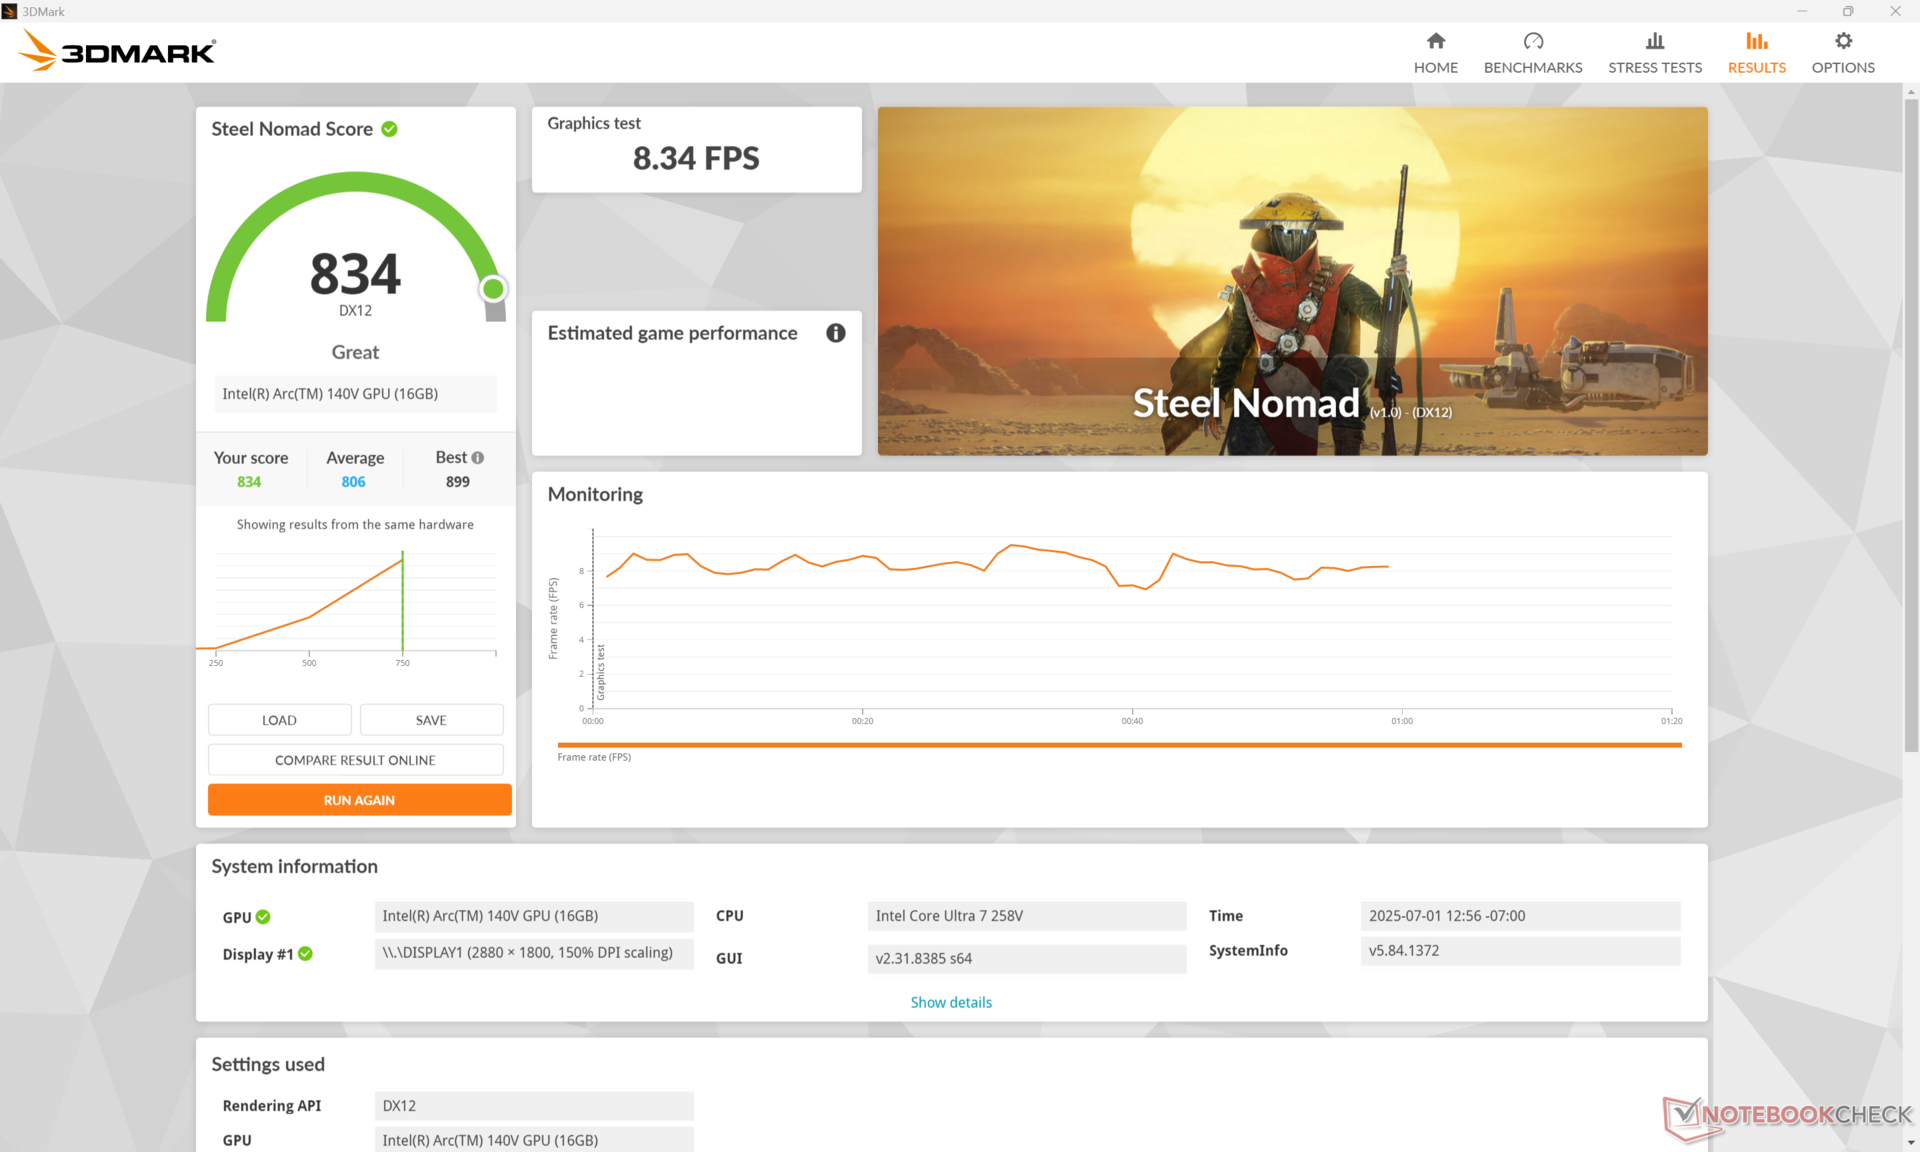
| 3DMark Steel Nomad Score | 834 punten | |
Help | ||
* ... kleiner is beter
| F1 24 | |
| 1920x1080 Low Preset AA:T AF:16x | |
| HP OmniBook X Flip 16 | |
| Lenovo Yoga 7 2-in-1 16ILL10 | |
| Dell 16 Plus 2-in-1 | |
| Gemiddeld Intel Arc Graphics 140V (54 - 99, n=25) | |
| Asus Zenbook S 16 UM5606WA-RK052W | |
| 1920x1080 Medium Preset AA:T AF:16x | |
| HP OmniBook X Flip 16 | |
| Lenovo Yoga 7 2-in-1 16ILL10 | |
| Dell 16 Plus 2-in-1 | |
| Gemiddeld Intel Arc Graphics 140V (49.2 - 88.2, n=24) | |
| Asus Zenbook S 16 UM5606WA-RK052W | |
| 1920x1080 High Preset AA:T AF:16x | |
| HP OmniBook X Flip 16 | |
| Dell 16 Plus 2-in-1 | |
| Lenovo Yoga 7 2-in-1 16ILL10 | |
| Gemiddeld Intel Arc Graphics 140V (34.4 - 66.4, n=27) | |
| Asus Zenbook S 16 UM5606WA-RK052W | |
| 1920x1080 Ultra High Preset AA:T AF:16x | |
| HP OmniBook X Flip 16 | |
| Lenovo Yoga 7 2-in-1 16ILL10 | |
| Dell 16 Plus 2-in-1 | |
| Gemiddeld Intel Arc Graphics 140V (14.6 - 22, n=25) | |
| Asus Zenbook S 16 UM5606WA-RK052W | |
Cyberpunk 2077 ultra FPS Chart
| lage | gem. | hoge | ultra | |
|---|---|---|---|---|
| Dota 2 Reborn (2015) | 97.2 | 88.4 | 63.5 | 84.9 |
| Final Fantasy XV Benchmark (2018) | 92.9 | 48.8 | 35.5 | |
| X-Plane 11.11 (2018) | 41.8 | 37.9 | 31.9 | |
| Strange Brigade (2018) | 246 | 79.6 | 67.7 | 58.7 |
| Baldur's Gate 3 (2023) | 43 | 36.1 | 29.7 | 29.1 |
| Cyberpunk 2077 (2023) | 46.4 | 37.5 | 32.9 | 23.3 |
| F1 24 (2024) | 91.9 | 83.9 | 64.6 | 20.9 |
Uitstoot
Systeemgeluid
Het geluid van de ventilator schommelt over het algemeen rond de 28,6 dB(A) tegen een stille achtergrond van 27,5 dB(A) wanneer u op het web surft of video streamt. Het maximum van iets minder dan 38 dB(A) wordt vrij snel bereikt wanneer er hogere belastingen zoals games worden geïntroduceerd.
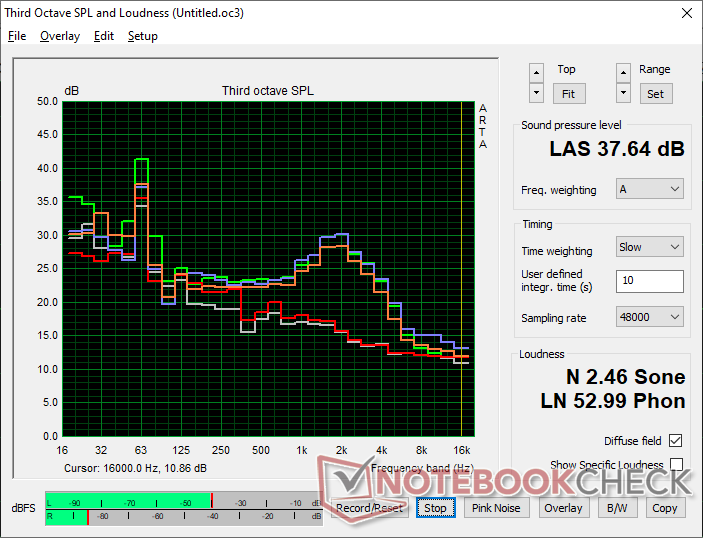
Geluidsniveau
| Onbelast |
| 28 / 28.3 / 28.3 dB (A) |
| Belasting |
| 37.7 / 37.6 dB (A) |
 | ||
30 dB stil 40 dB(A) hoorbaar 50 dB(A) luid |
||
min: | ||
| HP OmniBook X Flip 16 Arc 140V, Core Ultra 7 258V | Dell 16 Plus 2-in-1 Arc 140V, Core Ultra 7 258V, Samsung BM9C1 1024GB | Lenovo Yoga 7 2-in-1 16ILL10 Arc 140V, Core Ultra 7 256V, WD PC SN7100S SDFPMSL-512G-1101 | Samsung Galaxy Book5 Pro 360 Arc 130V, Core Ultra 5 226V, Samsung PM9B1 512GB MZVL4512HBLU | MSI Summit A16 AI Plus A3HMTG Radeon 880M, Ryzen AI 9 365, Samsung PM9C1 MZVL81T0HELB-00BTW | HP Spectre x360 16 RTX 4050 GeForce RTX 4050 Laptop GPU, Ultra 7 155H, SK hynix PC801 HFS001TEJ9X101N | |
|---|---|---|---|---|---|---|
| Noise | 6% | 4% | 9% | -6% | 17% | |
| uit / omgeving * (dB) | 27.5 | 23.2 16% | 23.3 15% | 23.6 14% | 23.8 13% | 23.3 15% |
| Idle Minimum * (dB) | 28 | 23 18% | 23.3 17% | 23.6 16% | 25 11% | 23.6 16% |
| Idle Average * (dB) | 28.3 | 23 19% | 23.3 18% | 23.6 17% | 25 12% | 23.6 17% |
| Idle Maximum * (dB) | 28.3 | 24.7 13% | 25.7 9% | 23.6 17% | 29.5 -4% | 23.6 17% |
| Load Average * (dB) | 37.7 | 32.5 14% | 40.2 -7% | 29.4 22% | 37.5 1% | 29.2 23% |
| Cyberpunk 2077 ultra * (dB) | 36.2 | 42.6 -18% | 41.6 -15% | 40.6 -12% | 46.5 -28% | |
| Load Maximum * (dB) | 37.6 | 45.6 -21% | 41.6 -11% | 40.6 -8% | 56.1 -49% | 32.1 15% |
| Witcher 3 ultra * (dB) | 32.1 |
* ... kleiner is beter
Temperatuur
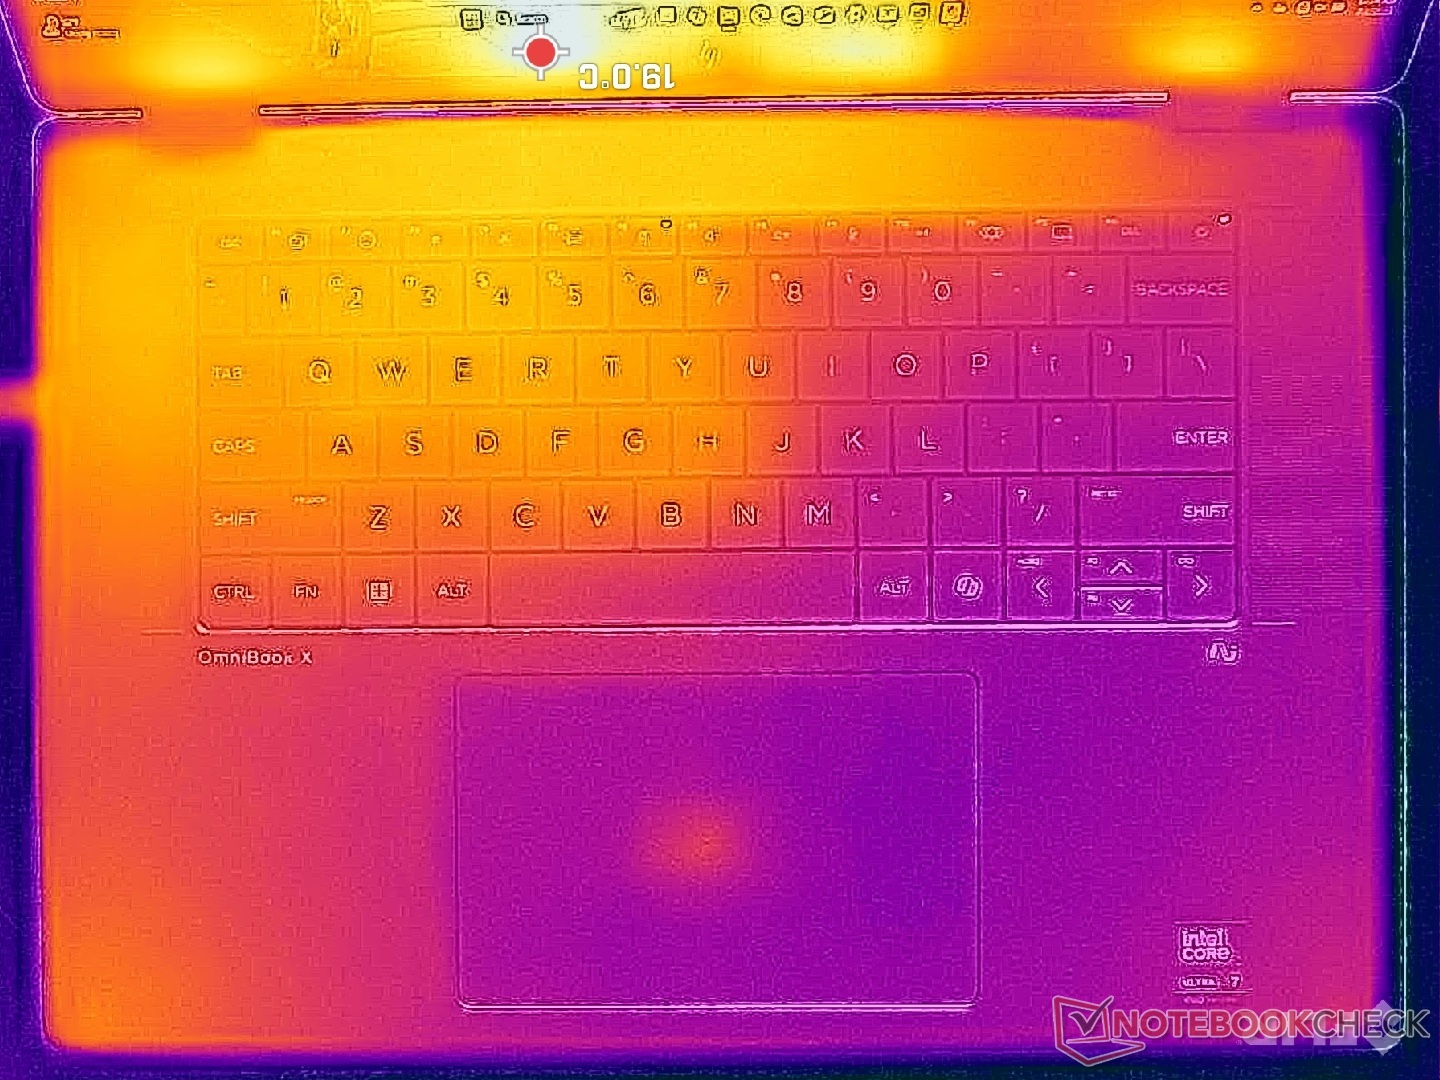
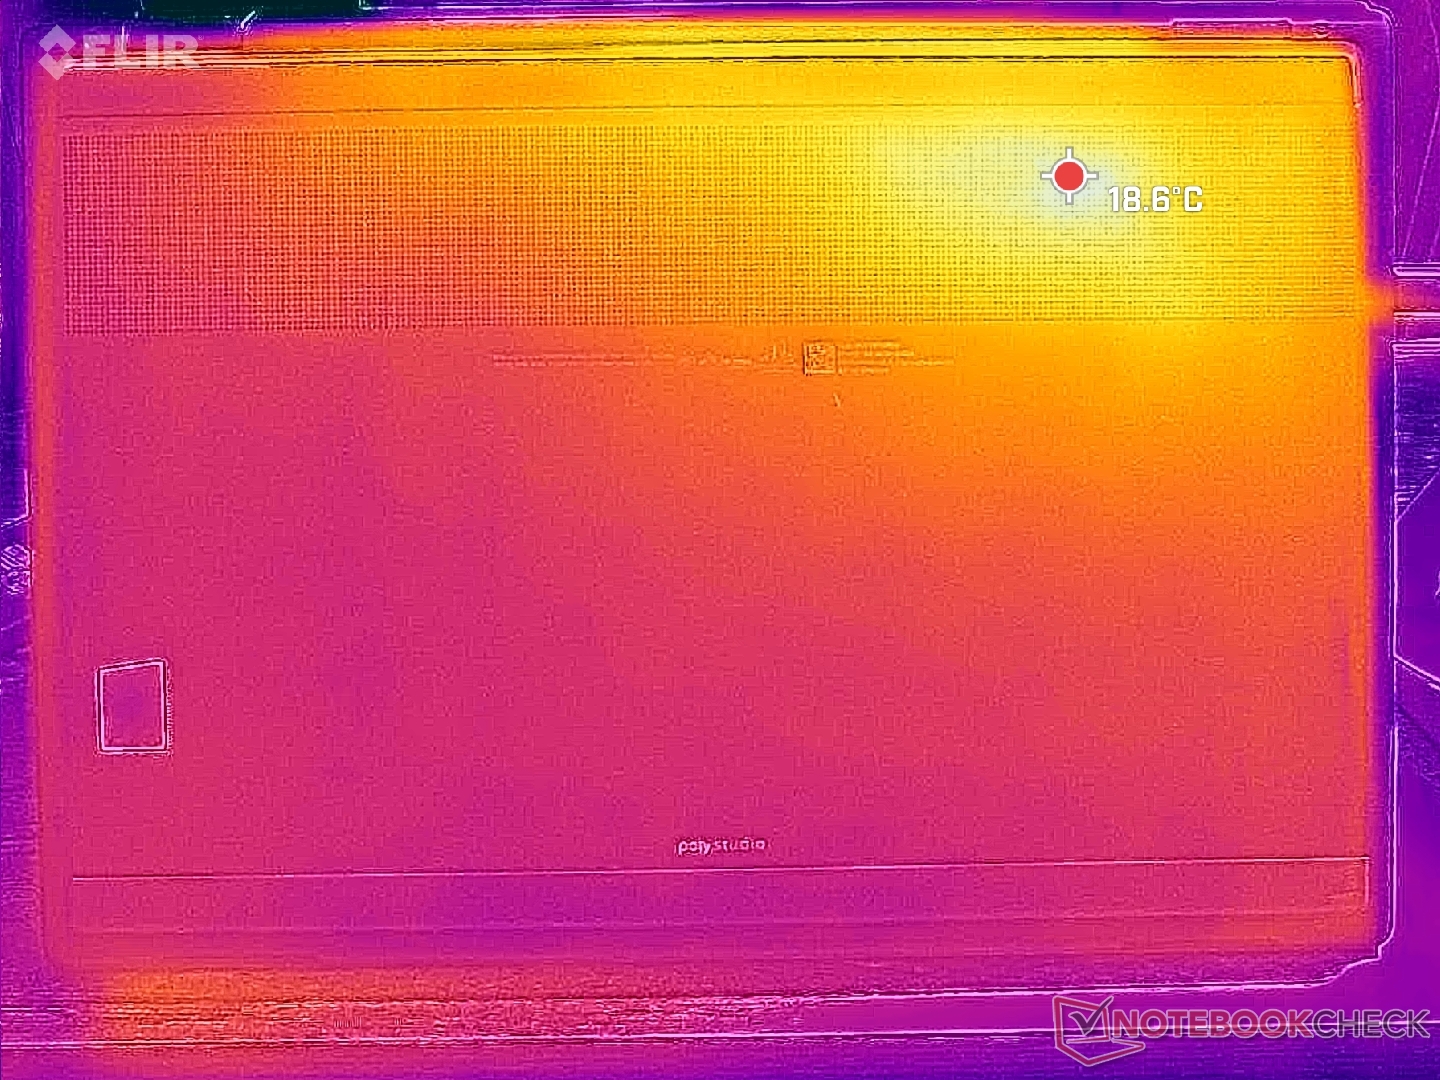
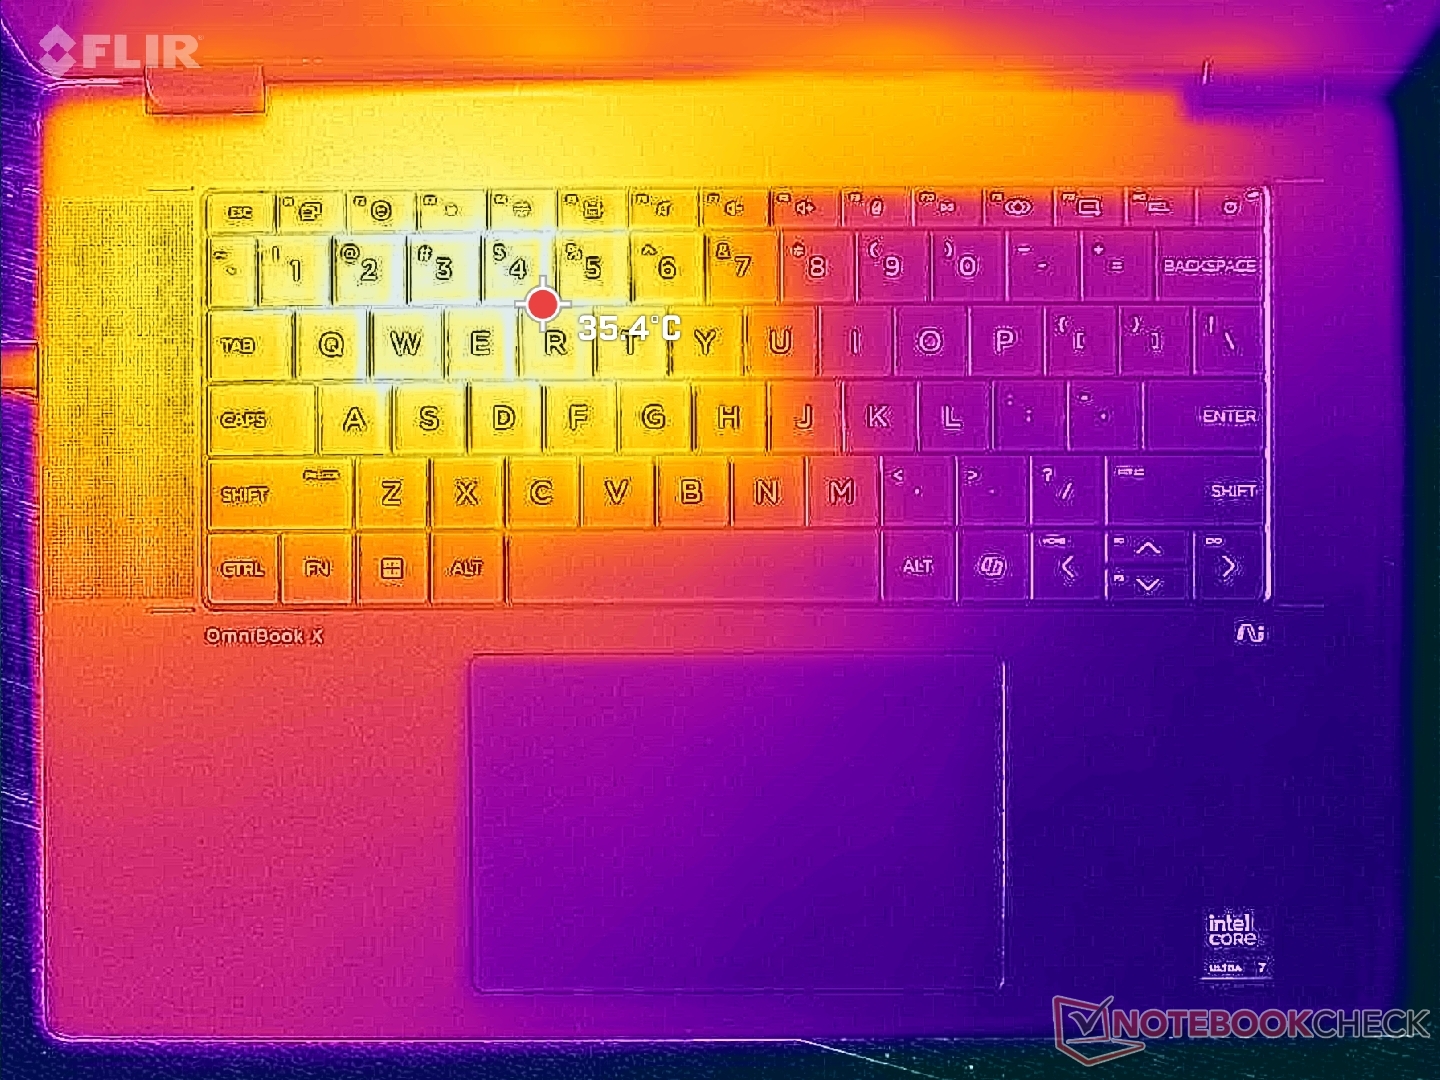
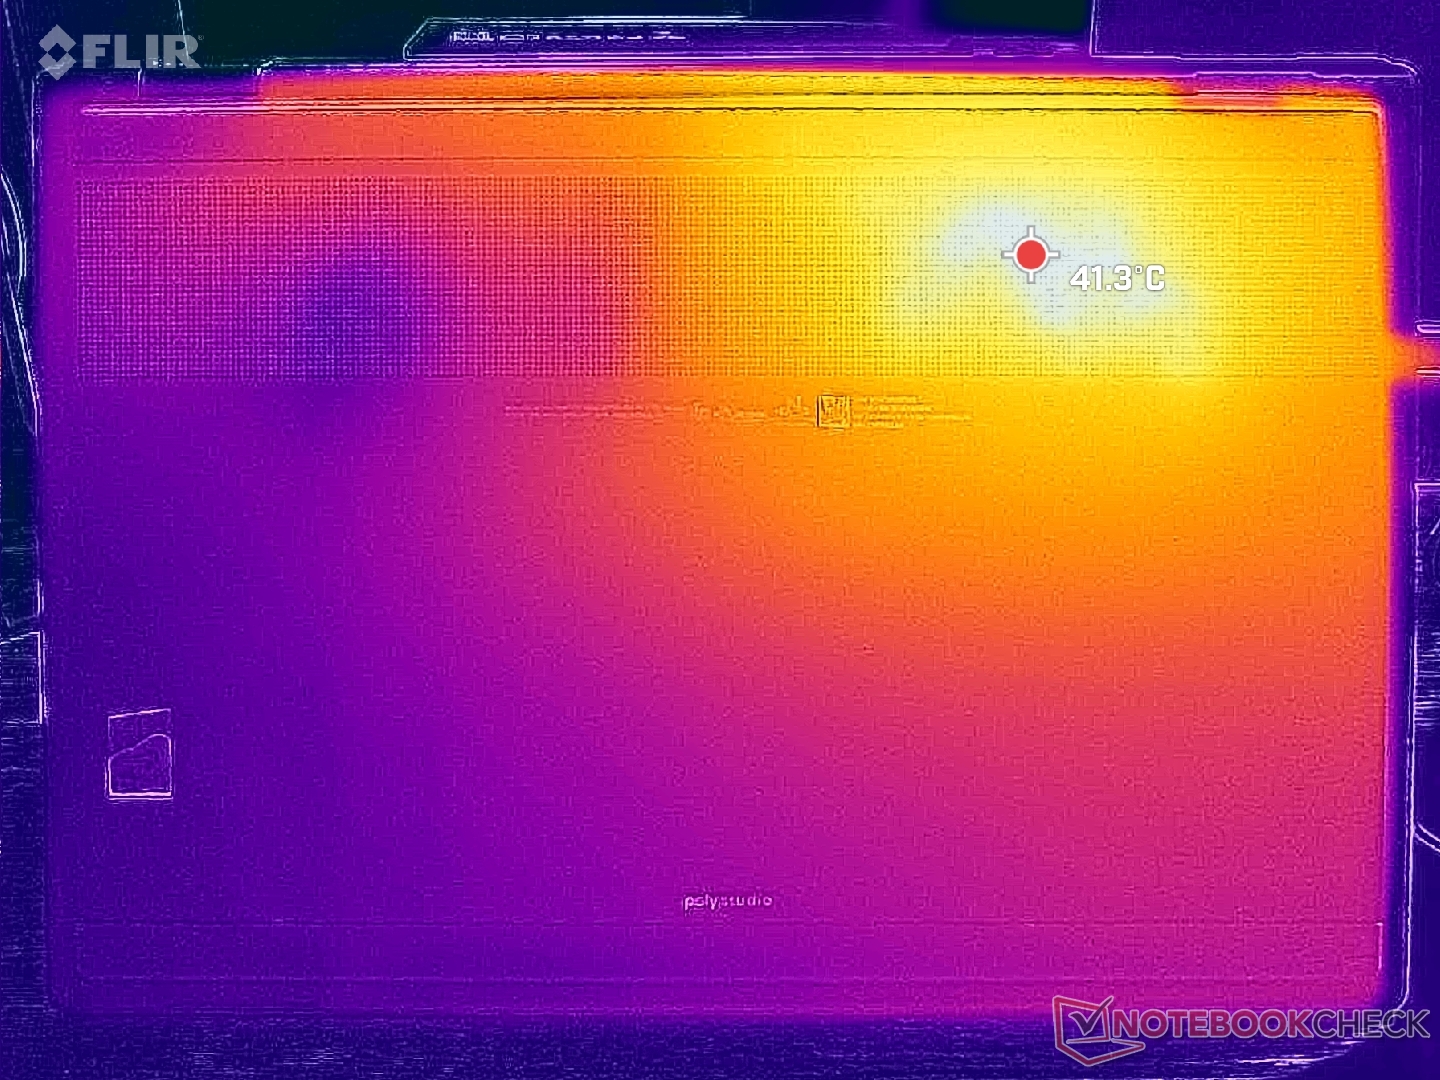
De hotspots aan het oppervlak zijn vergelijkbaar met wat we bij de concurrerende Dell Plus 16 2-in-1 hebben gezien. Op de HP zijn de hotspots echter merkbaar enkele graden koeler.
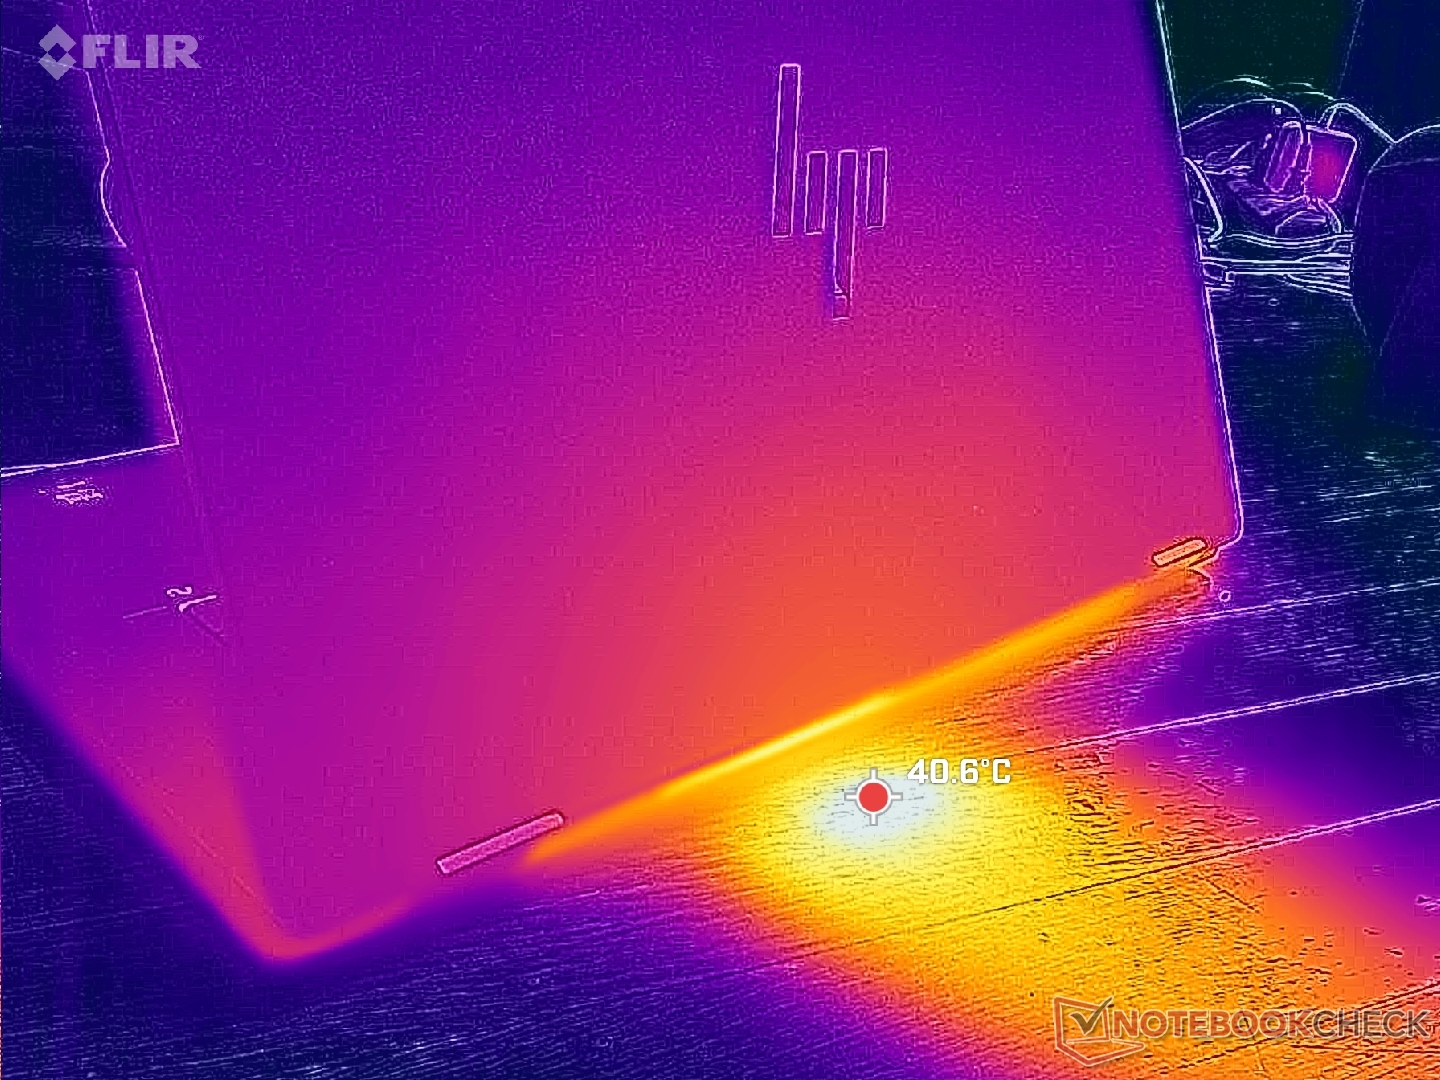
(+) De maximumtemperatuur aan de bovenzijde bedraagt 38 °C / 100 F, vergeleken met het gemiddelde van 35.4 °C / 96 F, variërend van 19.6 tot 60 °C voor de klasse Convertible.
(+) De bodem warmt op tot een maximum van 39.4 °C / 103 F, vergeleken met een gemiddelde van 36.9 °C / 98 F
(+) Bij onbelast gebruik bedraagt de gemiddelde temperatuur voor de bovenzijde 23 °C / 73 F, vergeleken met het apparaatgemiddelde van 30.3 °C / 87 F.
(+) De palmsteunen en het touchpad zijn met een maximum van ###max## °C / 81 F koeler dan de huidtemperatuur en voelen daarom koel aan.
(±) De gemiddelde temperatuur van de handpalmsteun van soortgelijke toestellen bedroeg 28 °C / 82.4 F (+0.8 °C / 1.4 F).
| HP OmniBook X Flip 16 Intel Core Ultra 7 258V, Intel Arc Graphics 140V | Dell 16 Plus 2-in-1 Intel Core Ultra 7 258V, Intel Arc Graphics 140V | Lenovo Yoga 7 2-in-1 16ILL10 Intel Core Ultra 7 256V, Intel Arc Graphics 140V | Samsung Galaxy Book5 Pro 360 Intel Core Ultra 5 226V, Intel Arc Graphics 130V | MSI Summit A16 AI Plus A3HMTG AMD Ryzen AI 9 365, AMD Radeon 880M | HP Spectre x360 16 RTX 4050 Intel Core Ultra 7 155H, NVIDIA GeForce RTX 4050 Laptop GPU | |
|---|---|---|---|---|---|---|
| Heat | -20% | -4% | -3% | -22% | -11% | |
| Maximum Upper Side * (°C) | 38 | 44 -16% | 42.6 -12% | 40.9 -8% | 52.8 -39% | 39.6 -4% |
| Maximum Bottom * (°C) | 39.4 | 39.4 -0% | 36.8 7% | 45.1 -14% | 42 -7% | 39.2 1% |
| Idle Upper Side * (°C) | 25 | 31.8 -27% | 26.4 -6% | 23.8 5% | 30.6 -22% | 29 -16% |
| Idle Bottom * (°C) | 25 | 34.2 -37% | 26.6 -6% | 23.5 6% | 29.6 -18% | 31.6 -26% |
* ... kleiner is beter
Luidsprekers
HP OmniBook X Flip 16 audioanalyse
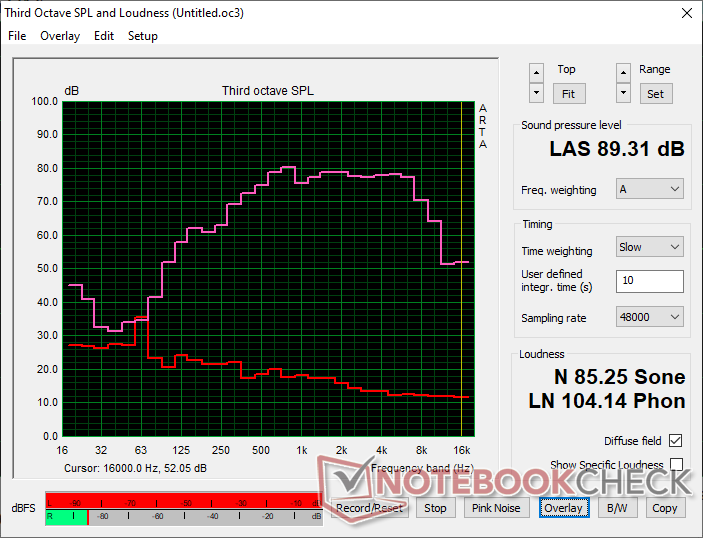
(+) | luidsprekers kunnen relatief luid spelen (89.3 dB)
Bas 100 - 315 Hz
(±) | verminderde zeebaars - gemiddeld 14.6% lager dan de mediaan
(±) | lineariteit van de lage tonen is gemiddeld (8.6% delta ten opzichte van de vorige frequentie)
Midden 400 - 2000 Hz
(+) | evenwichtige middens - slechts 2.5% verwijderd van de mediaan
(+) | de middentonen zijn lineair (4.1% delta ten opzichte van de vorige frequentie)
Hoog 2 - 16 kHz
(+) | evenwichtige hoogtepunten - slechts 3.9% verwijderd van de mediaan
(+) | de hoge tonen zijn lineair (4% delta naar de vorige frequentie)
Algemeen 100 - 16.000 Hz
(+) | het totale geluid is lineair (14.2% verschil met de mediaan)
Vergeleken met dezelfde klasse
» 21% van alle geteste apparaten in deze klasse waren beter, 3% vergelijkbaar, 76% slechter
» De beste had een delta van 6%, het gemiddelde was 20%, de slechtste was 57%
Vergeleken met alle geteste toestellen
» 17% van alle geteste apparaten waren beter, 4% gelijk, 79% slechter
» De beste had een delta van 4%, het gemiddelde was 23%, de slechtste was 134%
Apple MacBook Pro 16 2021 M1 Pro audioanalyse
(+) | luidsprekers kunnen relatief luid spelen (84.7 dB)
Bas 100 - 315 Hz
(+) | goede baars - slechts 3.8% verwijderd van de mediaan
(+) | de lage tonen zijn lineair (5.2% delta naar de vorige frequentie)
Midden 400 - 2000 Hz
(+) | evenwichtige middens - slechts 1.3% verwijderd van de mediaan
(+) | de middentonen zijn lineair (2.1% delta ten opzichte van de vorige frequentie)
Hoog 2 - 16 kHz
(+) | evenwichtige hoogtepunten - slechts 1.9% verwijderd van de mediaan
(+) | de hoge tonen zijn lineair (2.7% delta naar de vorige frequentie)
Algemeen 100 - 16.000 Hz
(+) | het totale geluid is lineair (4.6% verschil met de mediaan)
Vergeleken met dezelfde klasse
» 0% van alle geteste apparaten in deze klasse waren beter, 0% vergelijkbaar, 100% slechter
» De beste had een delta van 5%, het gemiddelde was 17%, de slechtste was 45%
Vergeleken met alle geteste toestellen
» 0% van alle geteste apparaten waren beter, 0% gelijk, 100% slechter
» De beste had een delta van 4%, het gemiddelde was 23%, de slechtste was 134%
Energiebeheer
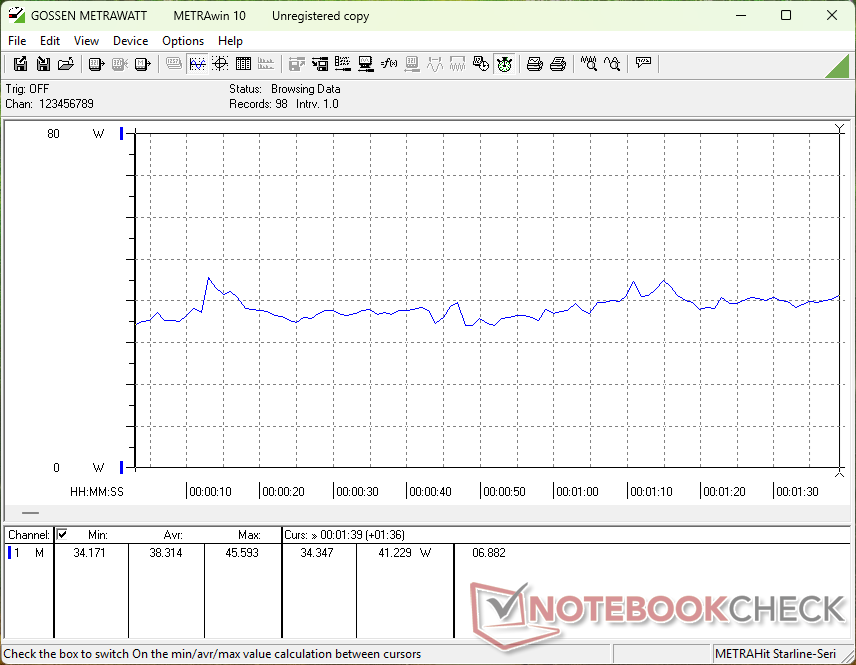
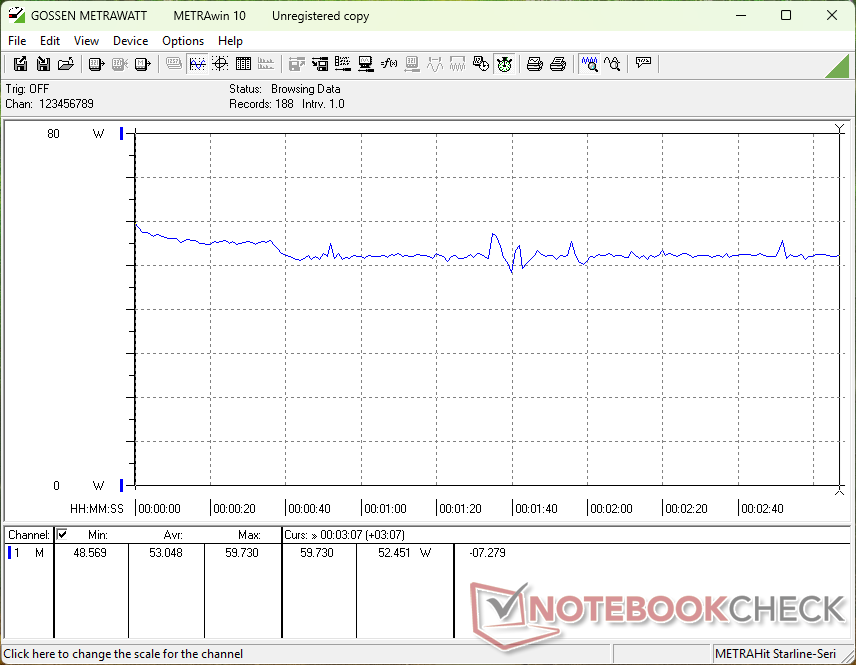
Stroomverbruik
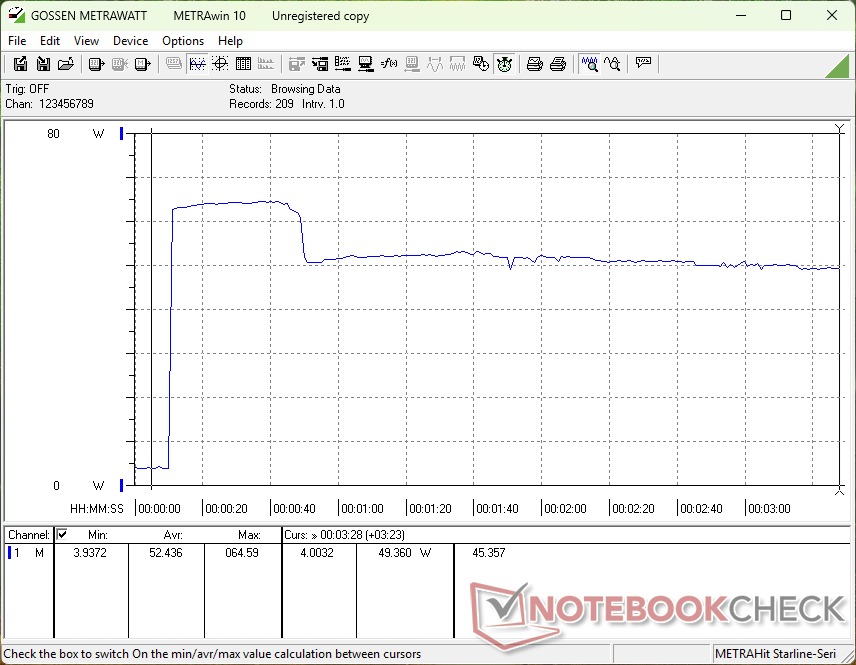
Intel Lunar Lake is uiterst efficiënt en dit geldt ook voor de HP. Als u bijvoorbeeld Cyberpunk 2077 uitvoert, verbruikt de OmniBook X Flip 16 minder stroom dan de AMD-aangedreven MSI Summit A16 AI Plus terwijl hij consistent hogere framerates biedt. De ruwe processorprestaties zijn echter nog steeds geen partij voor de Ryzen AI 9 365.
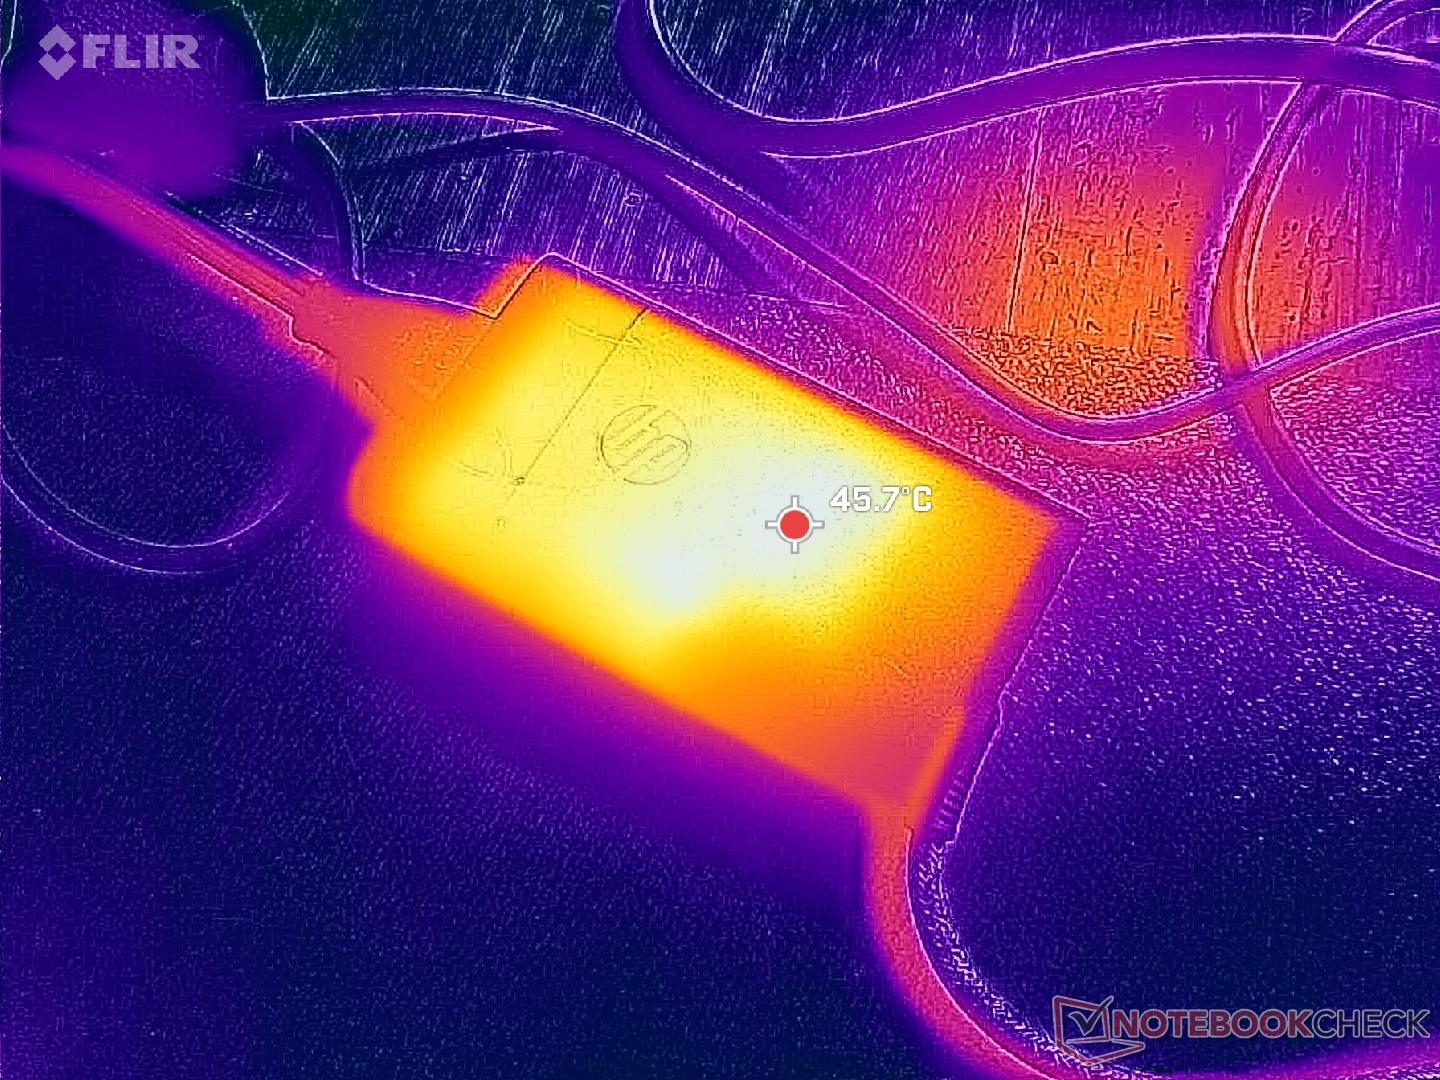
We zijn in staat om een tijdelijke maximale stroomopname van 65 W te registreren van de kleine (~6,8 x 2,2 x 5,4 cm) 65 W USB-C AC-adapter wanneer de CPU voor 100% wordt gebruikt.

| Uit / Standby | |
| Inactief | |
| Belasting |
|
Key:
min: | |
| HP OmniBook X Flip 16 Core Ultra 7 258V, Arc 140V, , OLED, 2880x1800, 16" | Dell 16 Plus 2-in-1 Core Ultra 7 258V, Arc 140V, Samsung BM9C1 1024GB, Mini-LED, 2560x1600, 16" | Lenovo Yoga 7 2-in-1 16ILL10 Core Ultra 7 256V, Arc 140V, WD PC SN7100S SDFPMSL-512G-1101, IPS, 1920x1200, 16" | Samsung Galaxy Book5 Pro 360 Core Ultra 5 226V, Arc 130V, Samsung PM9B1 512GB MZVL4512HBLU, OLED, 2880x1800, 16" | MSI Summit A16 AI Plus A3HMTG Ryzen AI 9 365, Radeon 880M, Samsung PM9C1 MZVL81T0HELB-00BTW, IPS, 2560x1600, 16" | HP Spectre x360 16 RTX 4050 Ultra 7 155H, GeForce RTX 4050 Laptop GPU, SK hynix PC801 HFS001TEJ9X101N, OLED, 2880x1800, 16" | |
|---|---|---|---|---|---|---|
| Power Consumption | -47% | -11% | -8% | -54% | -133% | |
| Idle Minimum * (Watt) | 3.1 | 7 -126% | 4.2 -35% | 5.3 -71% | 5.4 -74% | 5.8 -87% |
| Idle Average * (Watt) | 4.4 | 13.2 -200% | 8.3 -89% | 6.7 -52% | 11 -150% | 12.3 -180% |
| Idle Maximum * (Watt) | 11.4 | 13.4 -18% | 9.5 17% | 7.3 36% | 11.2 2% | 33.9 -197% |
| Load Average * (Watt) | 38.3 | 43.9 -15% | 40.3 -5% | 37.6 2% | 76.6 -100% | 83.3 -117% |
| Cyberpunk 2077 ultra external monitor * (Watt) | 48.7 | 40.7 16% | 40.8 16% | 42.8 12% | 49.2 -1% | |
| Cyberpunk 2077 ultra * (Watt) | 53.1 | 44.9 15% | 47.4 11% | 44.6 16% | 61.1 -15% | |
| Load Maximum * (Watt) | 64.9 | 67.8 -4% | 59 9% | 64.1 1% | 91.8 -41% | 120.8 -86% |
| Witcher 3 ultra * (Watt) | 89.1 |
* ... kleiner is beter
Power Consumption Cyberpunk / Stress Test
Power Consumption external Monitor
Levensduur batterij
| HP OmniBook X Flip 16 Core Ultra 7 258V, Arc 140V, 68 Wh | Dell 16 Plus 2-in-1 Core Ultra 7 258V, Arc 140V, 64 Wh | Lenovo Yoga 7 2-in-1 16ILL10 Core Ultra 7 256V, Arc 140V, 70 Wh | Samsung Galaxy Book5 Pro 360 Core Ultra 5 226V, Arc 130V, 76 Wh | MSI Summit A16 AI Plus A3HMTG Ryzen AI 9 365, Radeon 880M, 82 Wh | HP Spectre x360 16 RTX 4050 Ultra 7 155H, GeForce RTX 4050 Laptop GPU, 83 Wh | |
|---|---|---|---|---|---|---|
| Batterijduur | -30% | 56% | -16% | -29% | -14% | |
| WiFi v1.3 (h) | 12.8 | 8.9 -30% | 20 56% | 10.8 -16% | 9.1 -29% | 11 -14% |
| H.264 (h) | 19.7 | |||||
| Load (h) | 2.1 |
Notebookcheck Beoordeling
HP OmniBook X Flip 16
- 10-07-2025 v8
Allen Ngo
 Total Sustainability Score:
 Potential Competitors in Comparison
Afbeelding | Model / recensie | prijs | Gewicht | Hoogte | Scherm |
|---|---|---|---|---|---|
1. 86.9%  | HP OmniBook X Flip 16 Intel Core Ultra 7 258V ⎘ Intel Arc Graphics 140V ⎘ 16 GB Geheugen | Amazon: Catalogusprijs: 950 USD | 1.9 kg | 15.5 mm | 16.00" 2880x1800 212 PPI OLED |
2. 83.5%  | Dell 16 Plus 2-in-1 Intel Core Ultra 7 258V ⎘ Intel Arc Graphics 140V ⎘ 32 GB Geheugen, 1024 GB SSD | Amazon: $1,149.99 Catalogusprijs: 1500 USD | 2 kg | 16.99 mm | 16.00" 2560x1600 189 PPI Mini-LED |
3. 84.3%  | Lenovo Yoga 7 2-in-1 16ILL10 Intel Core Ultra 7 256V ⎘ Intel Arc Graphics 140V ⎘ 16 GB Geheugen, 512 GB SSD | Amazon: Catalogusprijs: 1000 USD | 1.9 kg | 15.85 mm | 16.00" 1920x1200 142 PPI IPS |
4. 85.9%  | Samsung Galaxy Book5 Pro 360 Intel Core Ultra 5 226V ⎘ Intel Arc Graphics 130V ⎘ 16 GB Geheugen, 512 GB SSD | Amazon: Catalogusprijs: 1799€ | 1.7 kg | 12.8 mm | 16.00" 2880x1800 212 PPI OLED |
5. 81.9%  | MSI Summit A16 AI Plus A3HMTG AMD Ryzen AI 9 365 ⎘ AMD Radeon 880M ⎘ 32 GB Geheugen, 1024 GB SSD | Amazon: Catalogusprijs: 1600 USD | 2.1 kg | 16.85 mm | 16.00" 2560x1600 189 PPI IPS |
6. 91.1% v7 (old)  | HP Spectre x360 16 RTX 4050 Intel Core Ultra 7 155H ⎘ NVIDIA GeForce RTX 4050 Laptop GPU ⎘ 16 GB Geheugen, 1024 GB SSD | Amazon: Catalogusprijs: 1600 USD | 2 kg | 19.8 mm | 16.00" 2880x1800 212 PPI OLED |
Transparantie
De selectie van te beoordelen apparaten wordt gemaakt door onze redactie. Het testexemplaar werd ten behoeve van deze beoordeling door de fabrikant of detailhandelaar in bruikleen aan de auteur verstrekt. De kredietverstrekker had geen invloed op deze recensie, noch ontving de fabrikant vóór publicatie een exemplaar van deze recensie. Er bestond geen verplichting om deze recensie te publiceren. Als onafhankelijk mediabedrijf is Notebookcheck niet onderworpen aan het gezag van fabrikanten, detailhandelaren of uitgevers.
[transparency_disclaimer]Dit is hoe Notebookcheck test
Elk jaar beoordeelt Notebookcheck onafhankelijk honderden laptops en smartphones met behulp van gestandaardiseerde procedures om ervoor te zorgen dat alle resultaten vergelijkbaar zijn. We hebben onze testmethoden al zo'n 20 jaar voortdurend ontwikkeld en daarbij de industriestandaard bepaald. In onze testlaboratoria wordt gebruik gemaakt van hoogwaardige meetapparatuur door ervaren technici en redacteuren. Deze tests omvatten een validatieproces in meerdere fasen. Ons complexe beoordelingssysteem is gebaseerd op honderden goed onderbouwde metingen en benchmarks, waardoor de objectiviteit behouden blijft. Meer informatie over onze testmethoden kunt u hier vinden.

