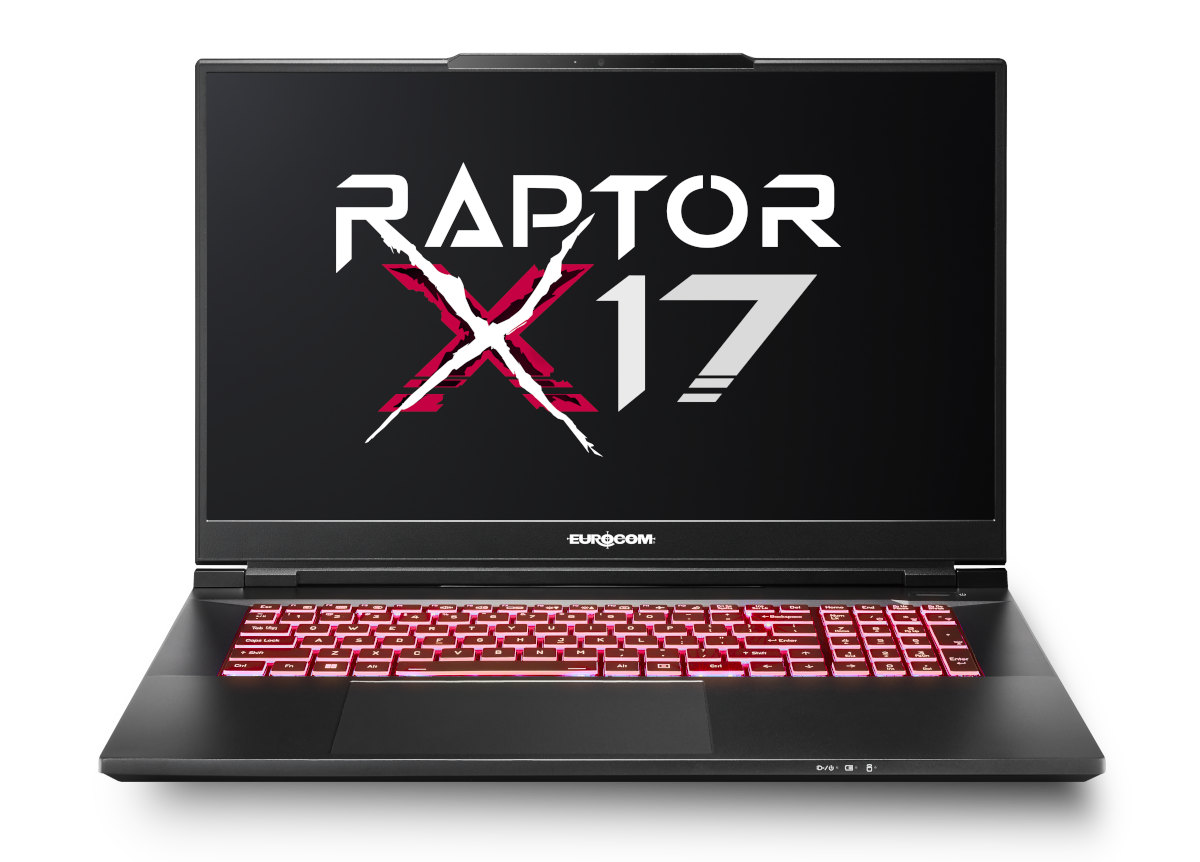
Eurocom Raptor X17 Core i9-14900HX laptop review: gPU van 175 W voor maximale prestaties

De Raptor X17 is een van de snelste laptops van Eurocom. Het model is dit jaar opgefrist met nieuwere Raptor Lake-HX opties, maar met verder dezelfde GPU en hetzelfde chassis als vroeger. We raden u daarom aan om onze reviews over de 2023 Raptor X17 en Schenker Key 17 Pro voor meer informatie over de fysieke kenmerken van de laptop, aangezien onze bestaande opmerkingen nog steeds van toepassing zijn.
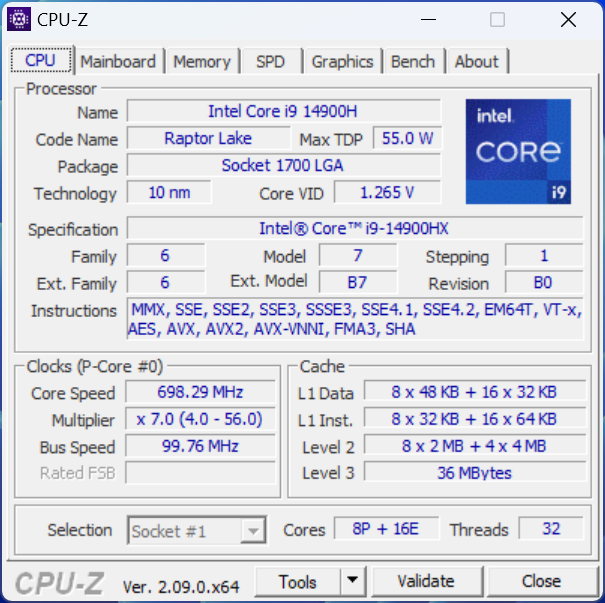
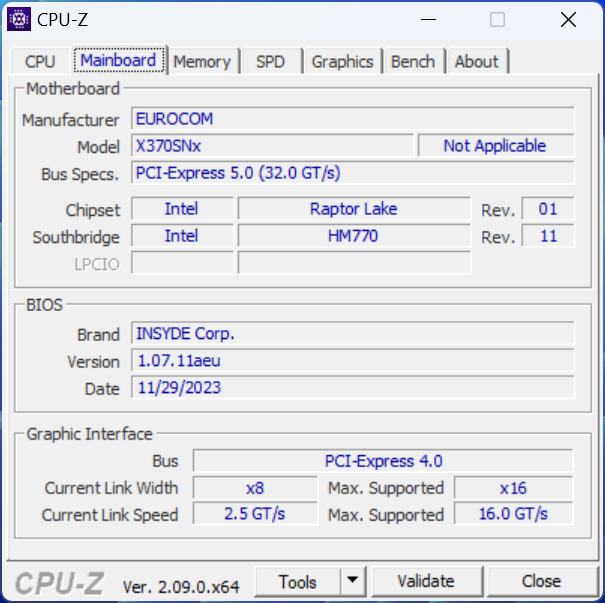
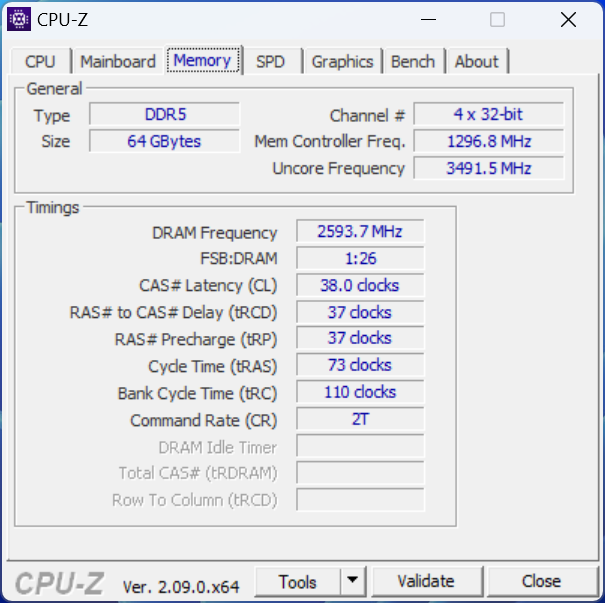
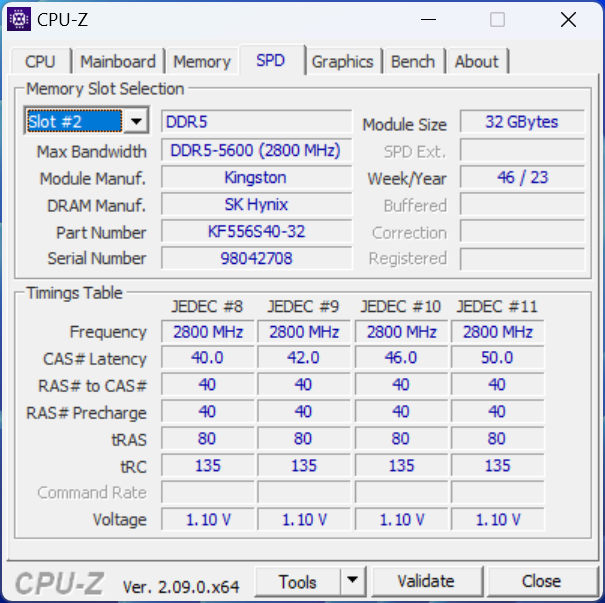
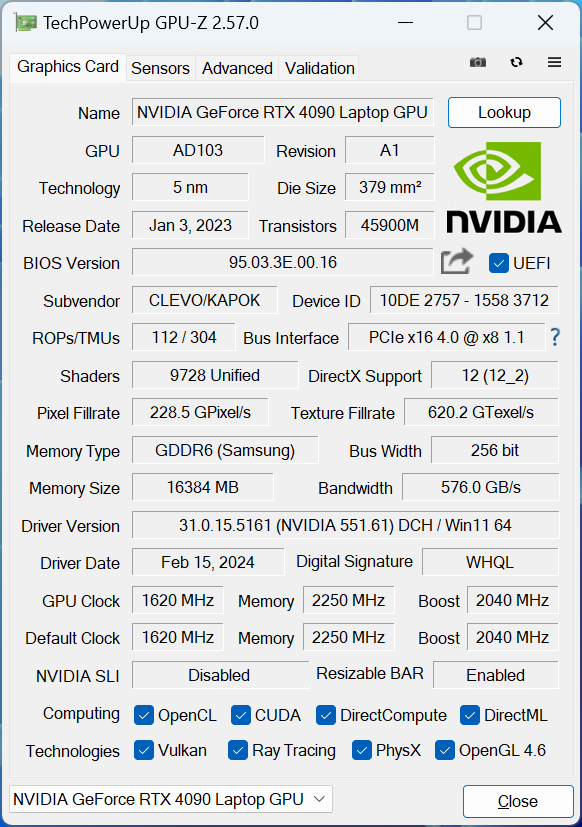
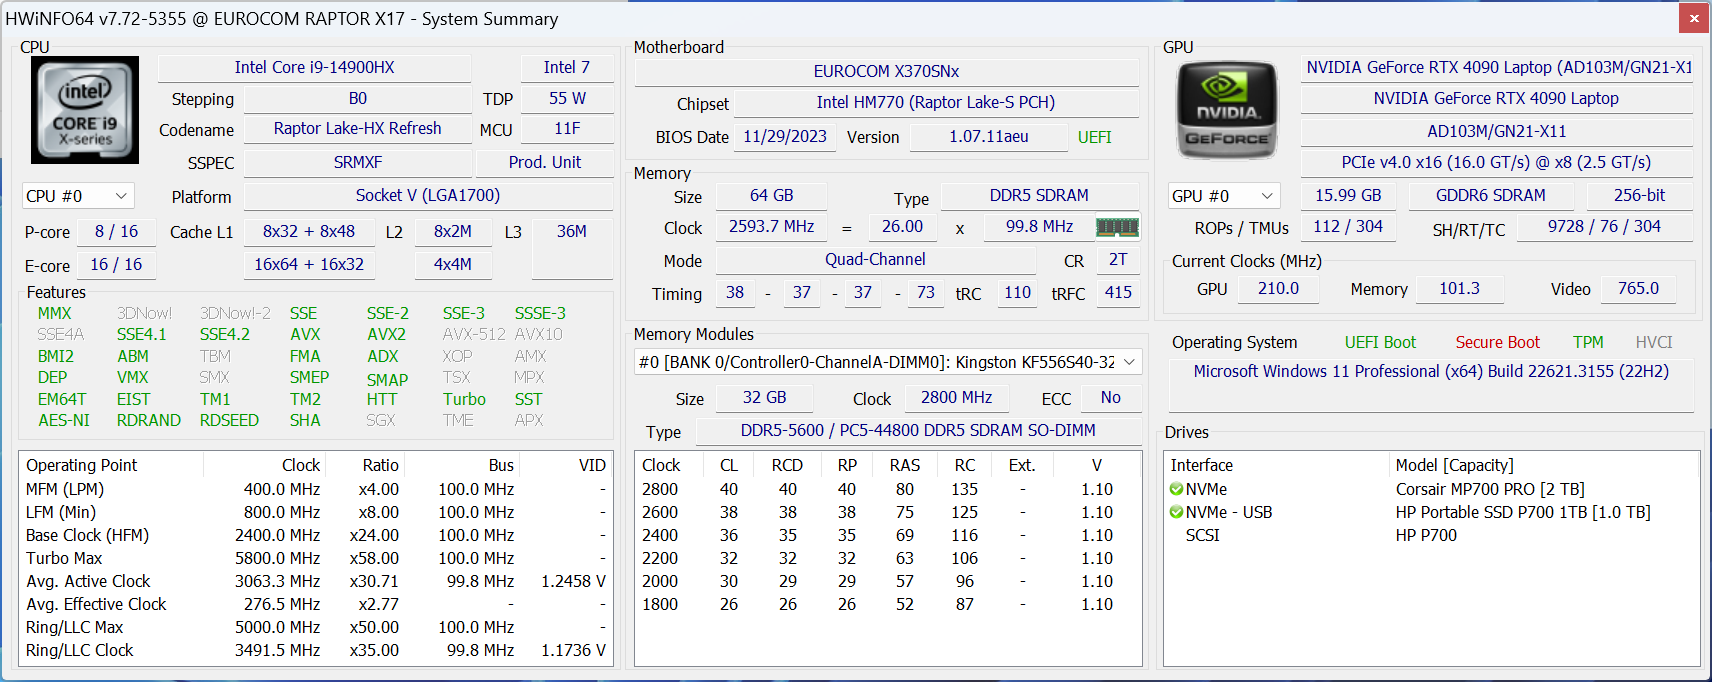
Onze 2024 Raptor X17 testeenheid wordt geleverd met de Core i9-14900HX, PCIe5 SSD en 4K 144 Hz beeldscherm, in tegenstelling tot de Core i9-13900HX, PCIe4 SSD en 2K 240 Hz beeldscherm van ons 2023 model. De 175 W GeForce RTX 4090 blijft hetzelfde.
Alternatieven voor de Raptor X17 zijn andere krachtige gaming laptops zoals de Asus ROG Strix Scar 17, MSI Titan 18 HXof Alienware m18 R2. Het is vermeldenswaard dat de Raptor X17 een van de weinige RTX 4090 gaming laptops op de markt is met een 17,3-inch 16:9 beeldscherm.
Meer Eurocom beoordelingen:
Potentiële concurrenten in vergelijking
Evaluatie | Datum | Model | Gewicht | Hoogte | Formaat | Resolutie | Beste prijs |
|---|---|---|---|---|---|---|---|
| 85.2 % v7 (old) | 03-2024 | Eurocom Raptor X17 Core i9-14900HX i9-14900HX, GeForce RTX 4090 Laptop GPU | 3.4 kg | 24.9 mm | 17.30" | 3840x2160 | |
| 82.8 % v7 (old) | 05-2023 | Eurocom Raptor X17 i9-13900HX, GeForce RTX 4090 Laptop GPU | 3.5 kg | 24.9 mm | 17.30" | 2560x1440 | |
| 85.6 % v7 (old) | 01-2024 | Asus TUF Gaming A17 FA707XI-NS94 R9 7940HS, GeForce RTX 4070 Laptop GPU | 2.5 kg | 25.4 mm | 17.30" | 1920x1080 | |
| 88.3 % v7 (old) | 04-2023 | Asus ROG Strix Scar 17 G733PY-XS96 R9 7945HX, GeForce RTX 4090 Laptop GPU | 2.9 kg | 28.3 mm | 17.30" | 2560x1440 | |
v (old) | MSI Raider GE78 HX 13VI i9-13980HX, GeForce RTX 4090 Laptop GPU | 17.30" | 2560x1600 | ||||
| 88.8 % v7 (old) | 01-2024 | MSI Titan 18 HX A14VIG i9-14900HX, GeForce RTX 4090 Laptop GPU | 3.6 kg | 32.1 mm | 18.00" | 3840x2400 |
Communicatie
Webcam


Weergave
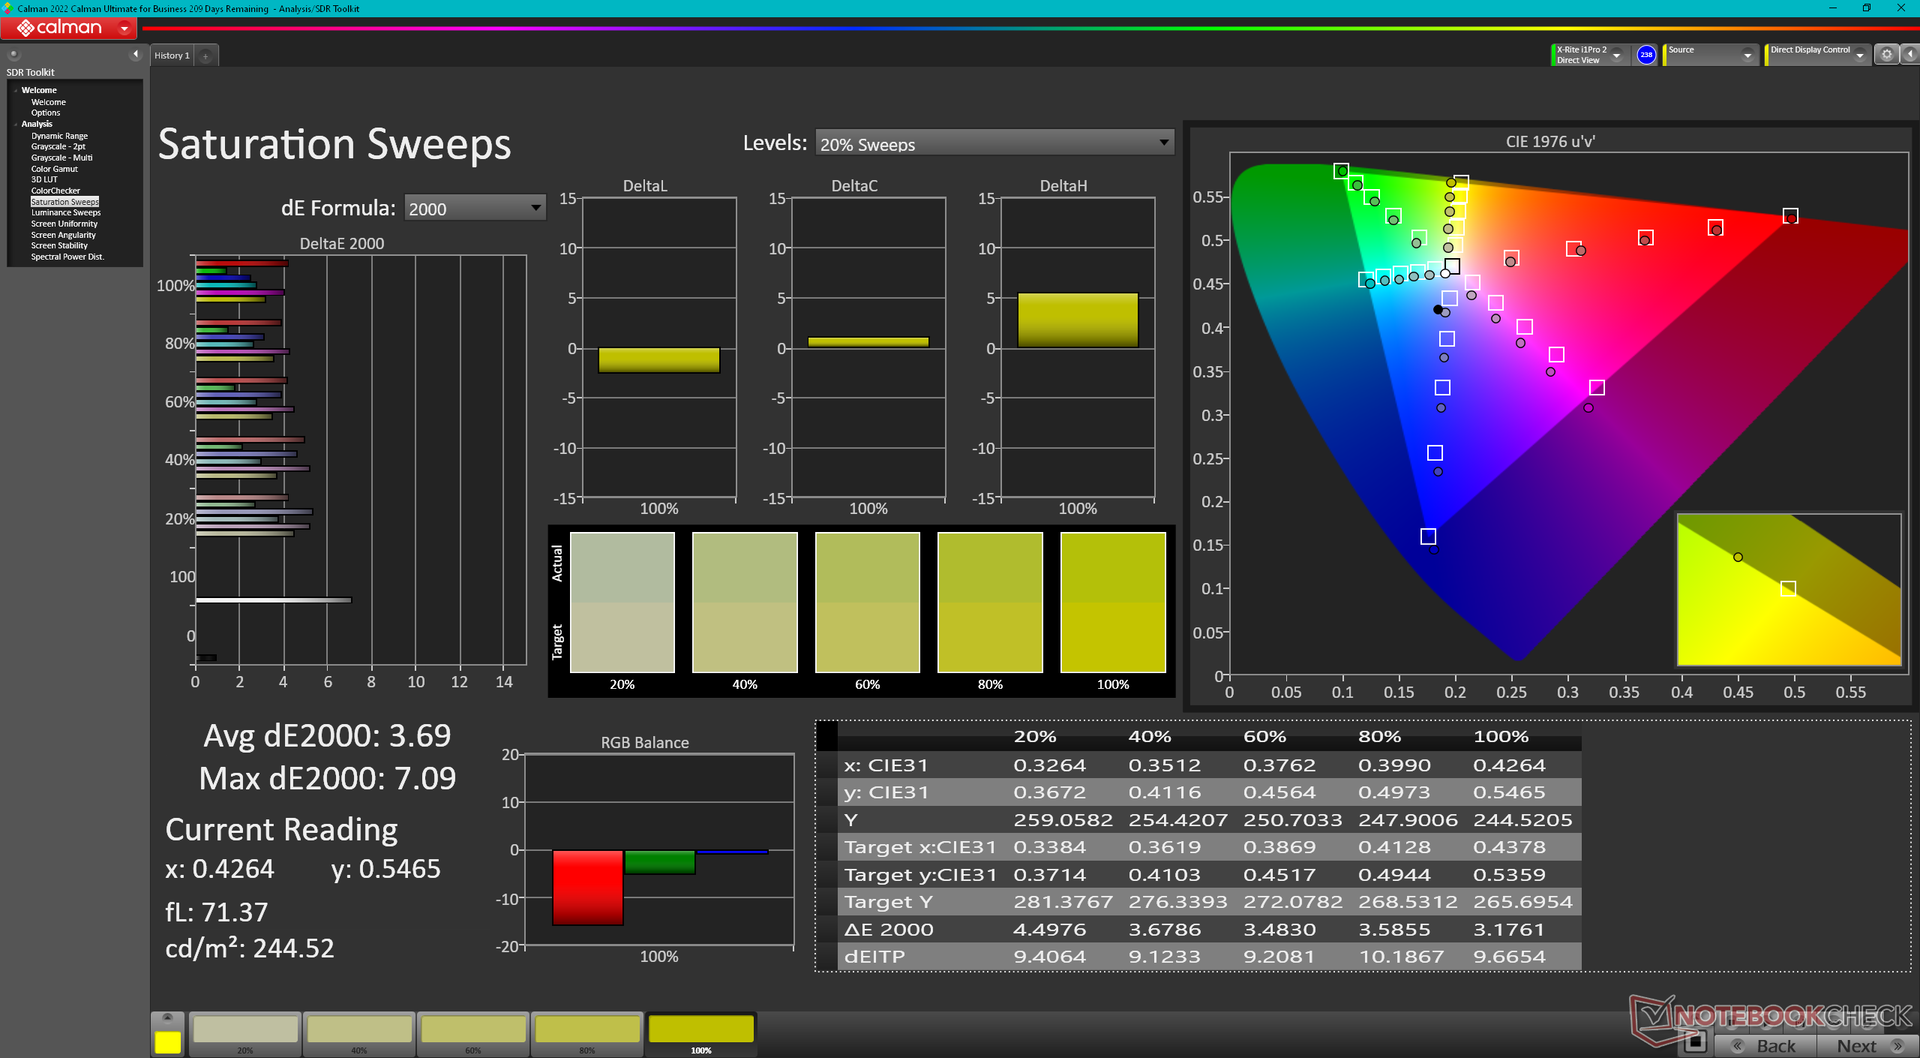
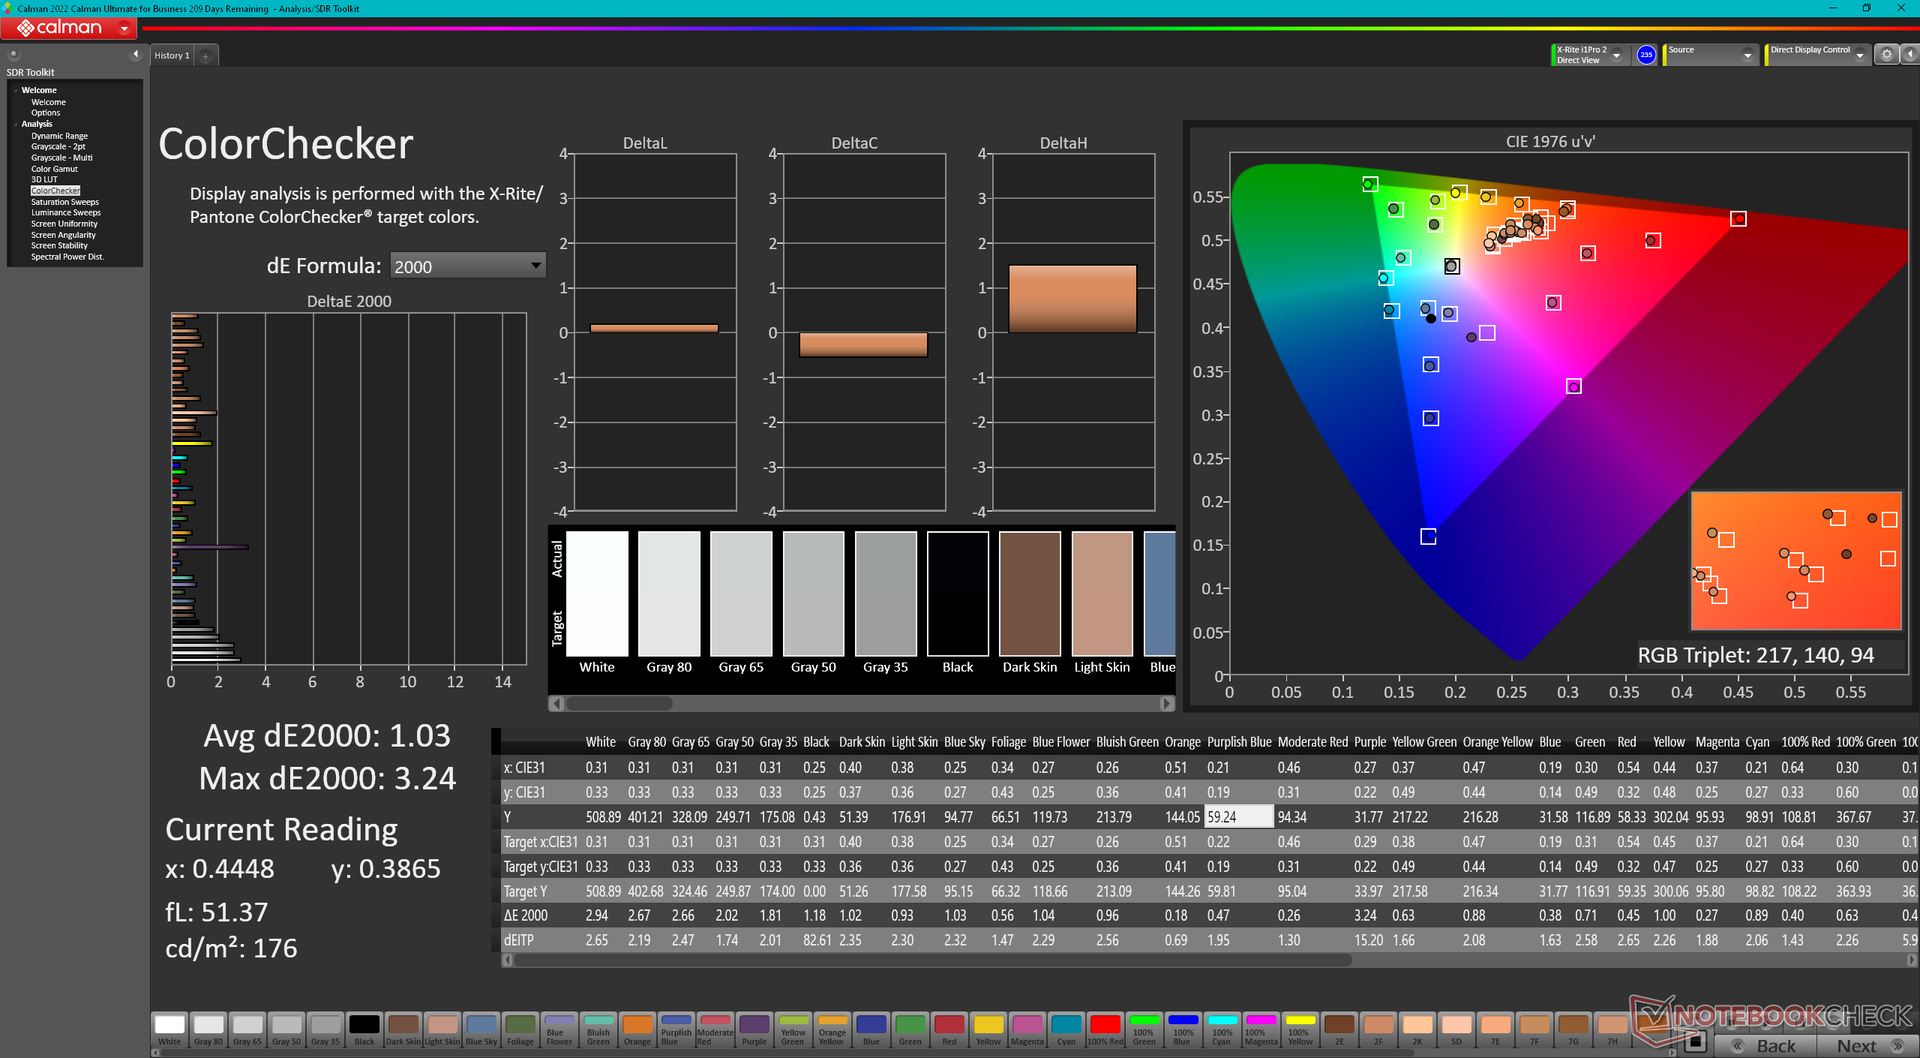
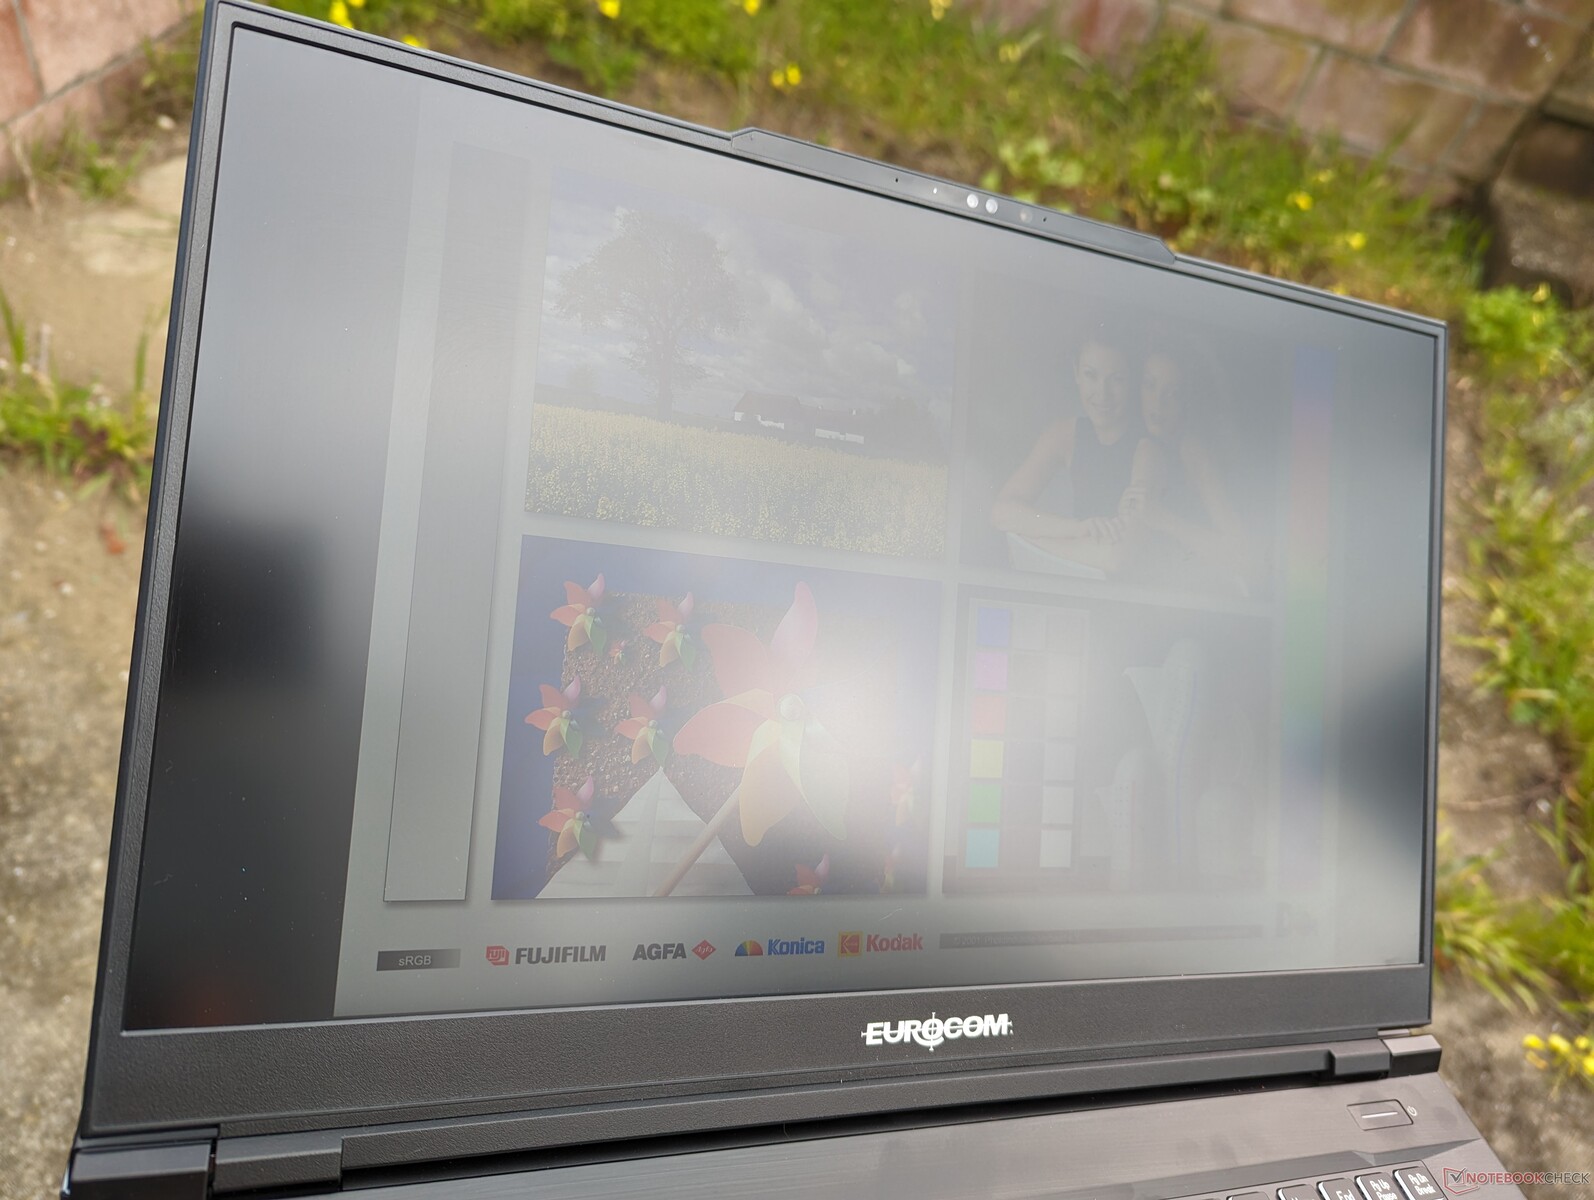
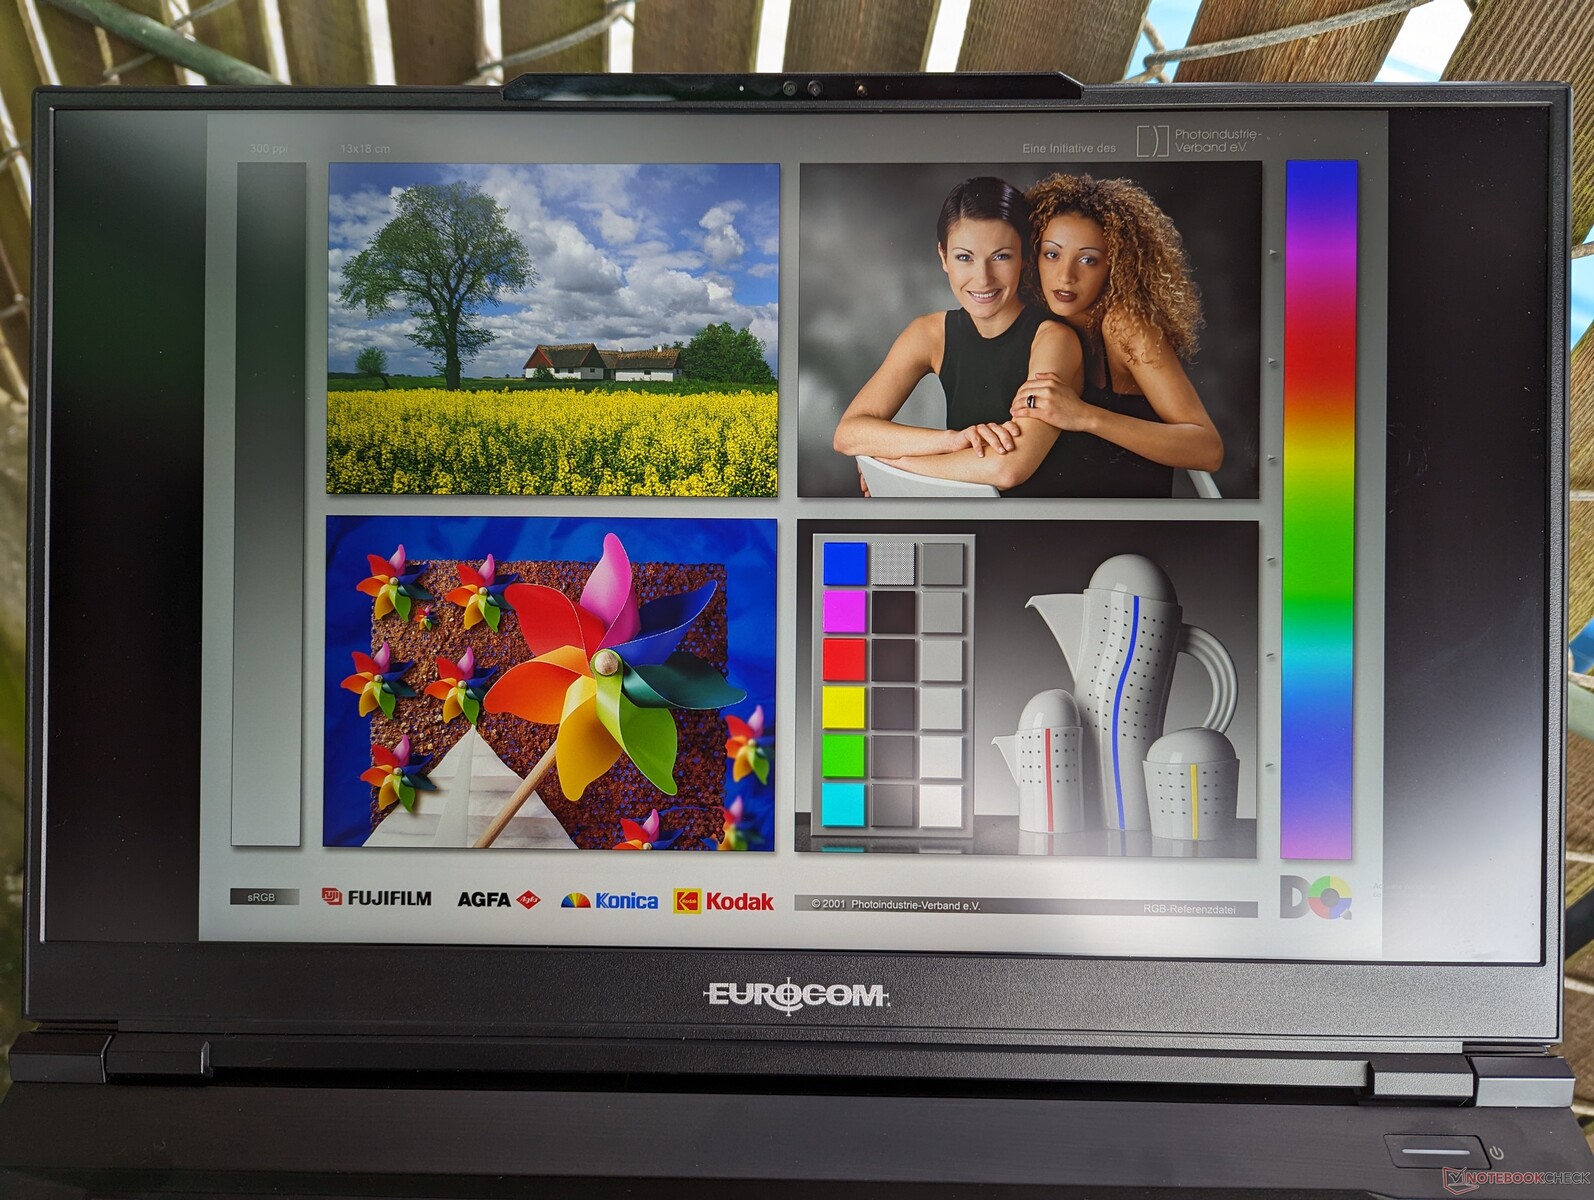
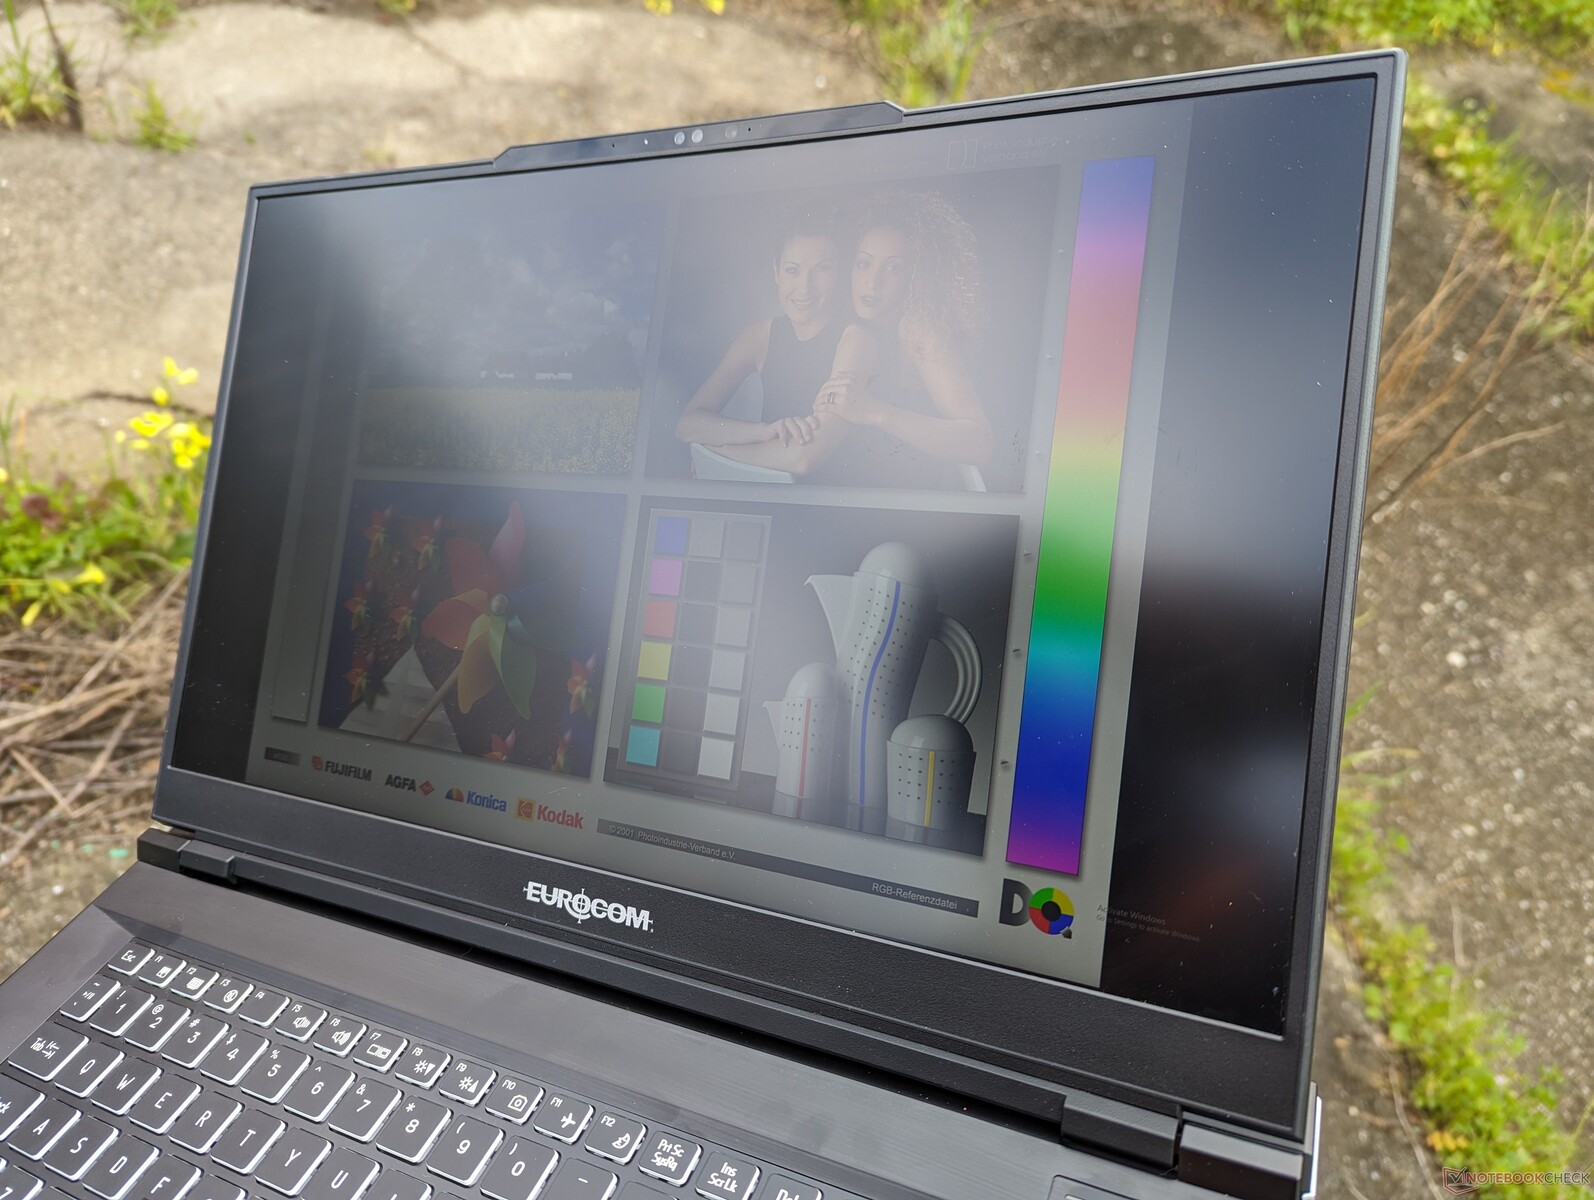
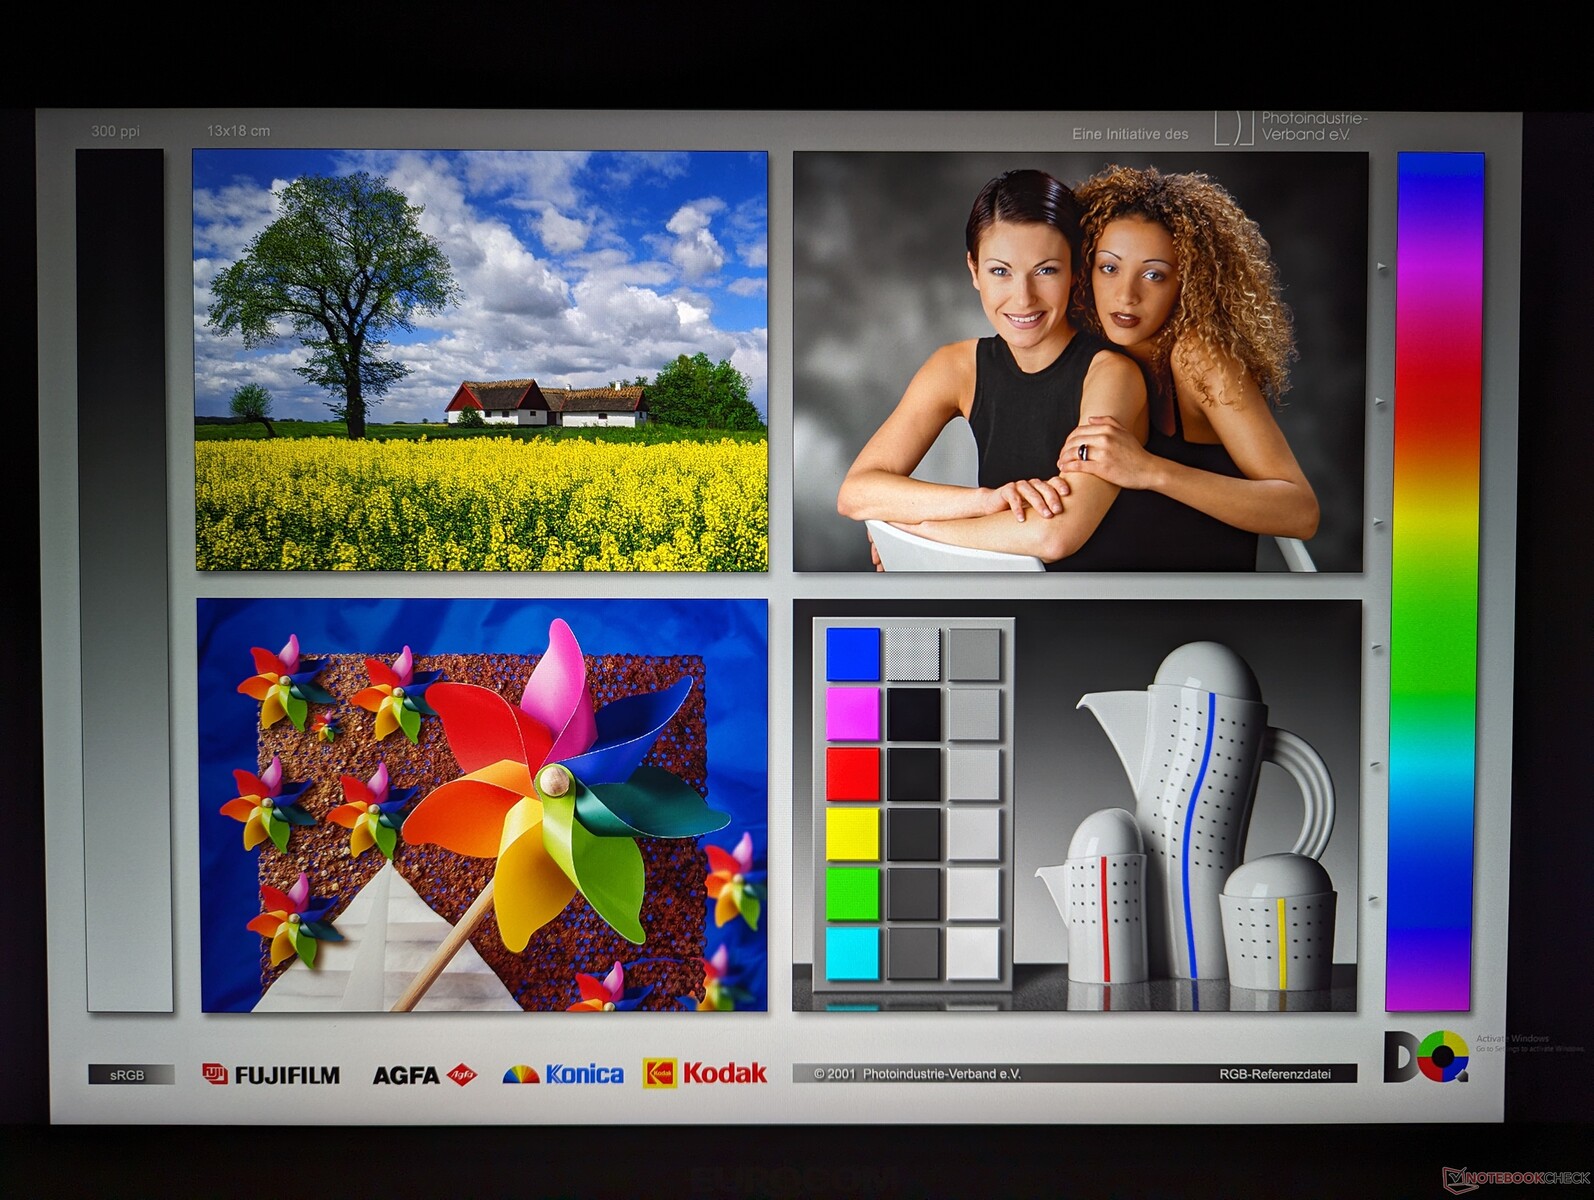
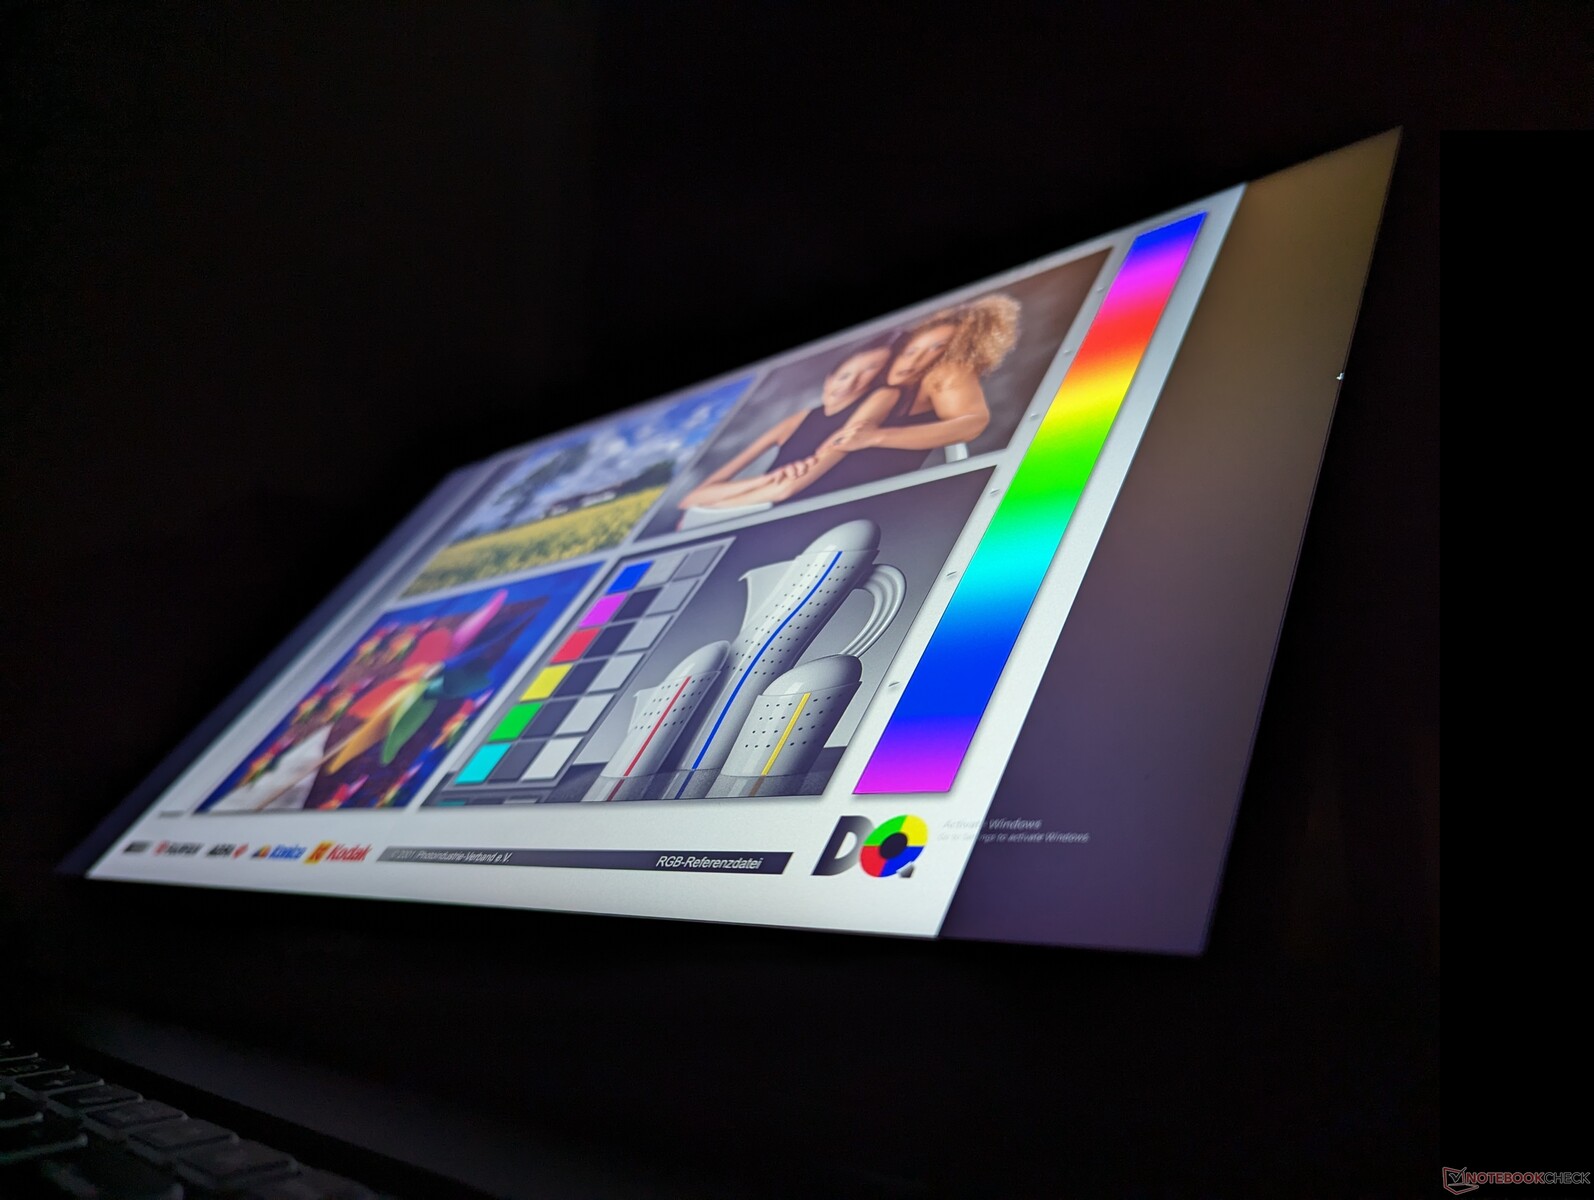
In vergelijking met het 2K 240 Hz beeldscherm op onze 2023 configuratie, gebruikt onze 2024 configuratie een 4K 144 Hz paneel, maar met verder vergelijkbare kleurdekking, contrastverhoudingen en responstijden. Ons paneel met hogere resolutie is ook merkbaar helderder met gemiddeld ongeveer 500 nits.
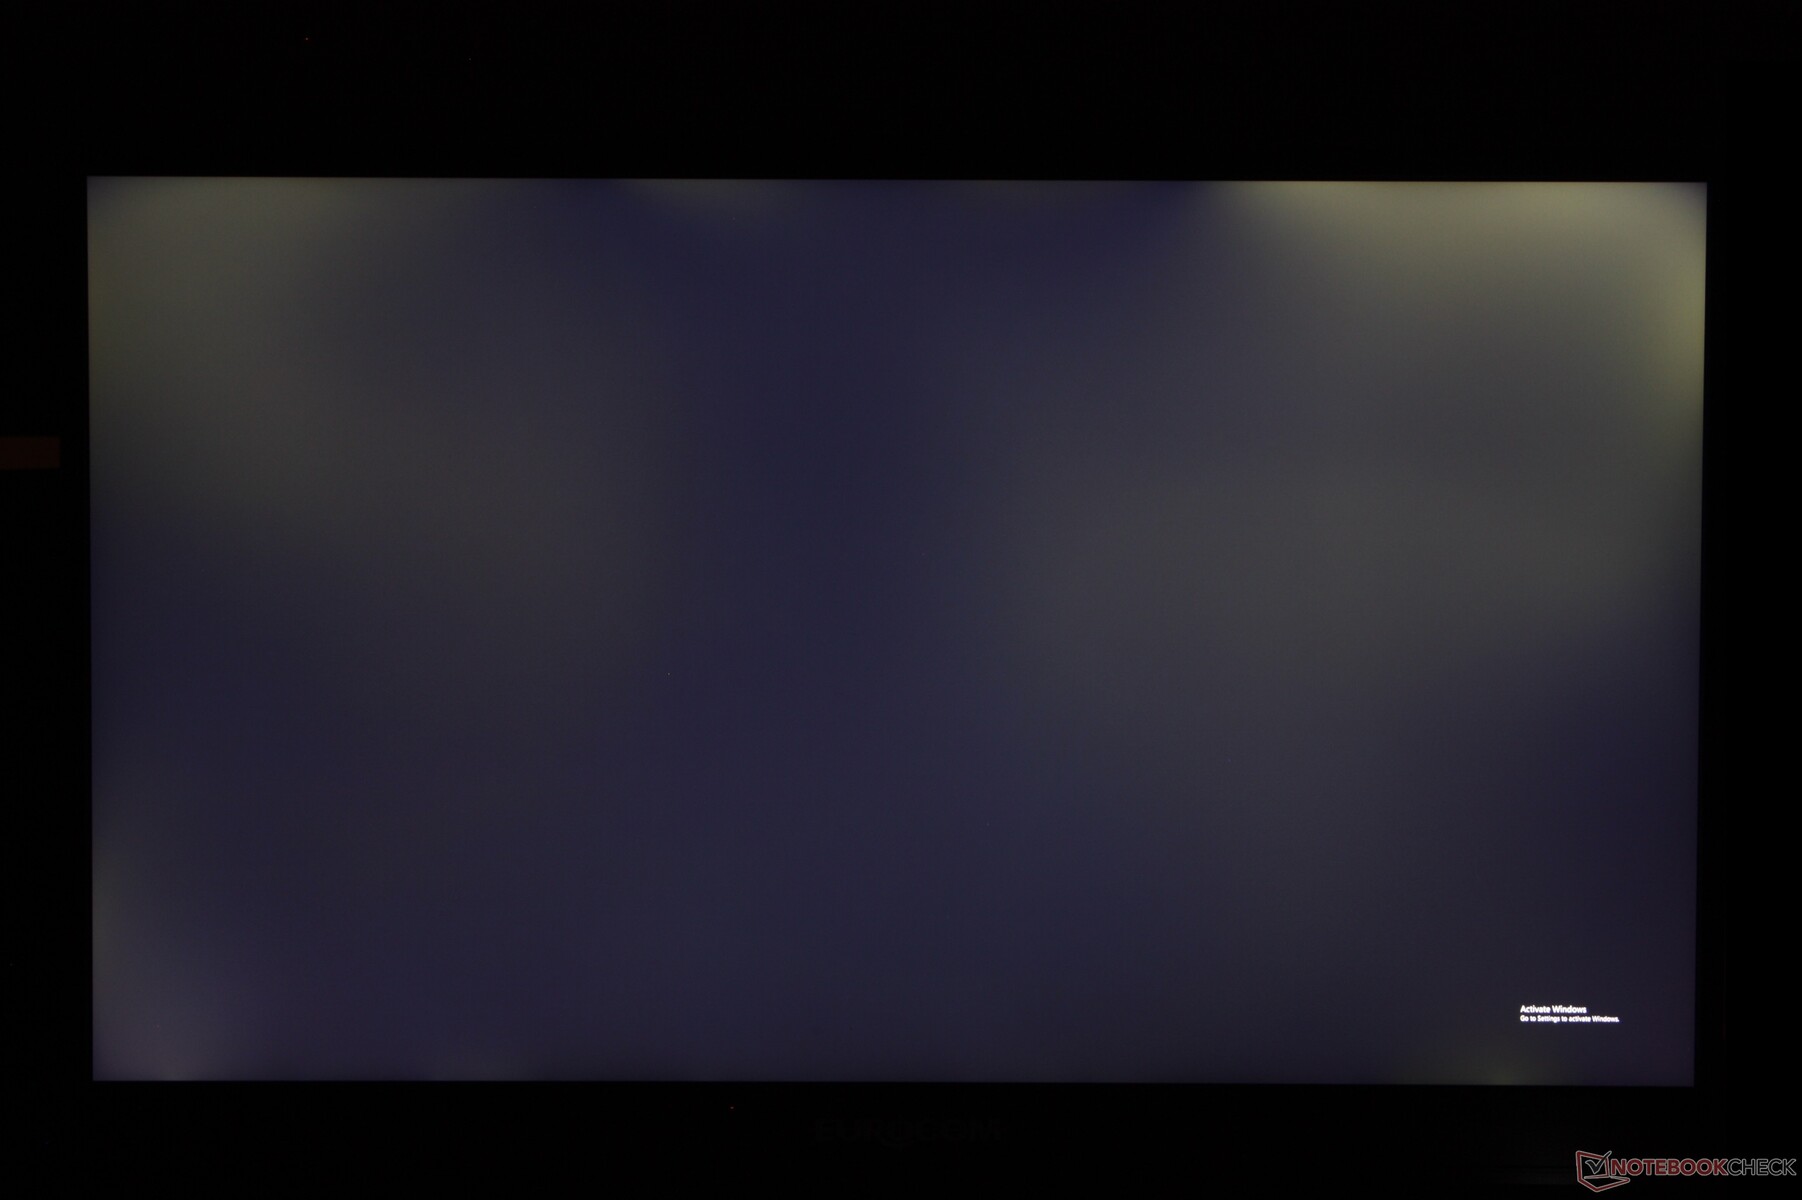
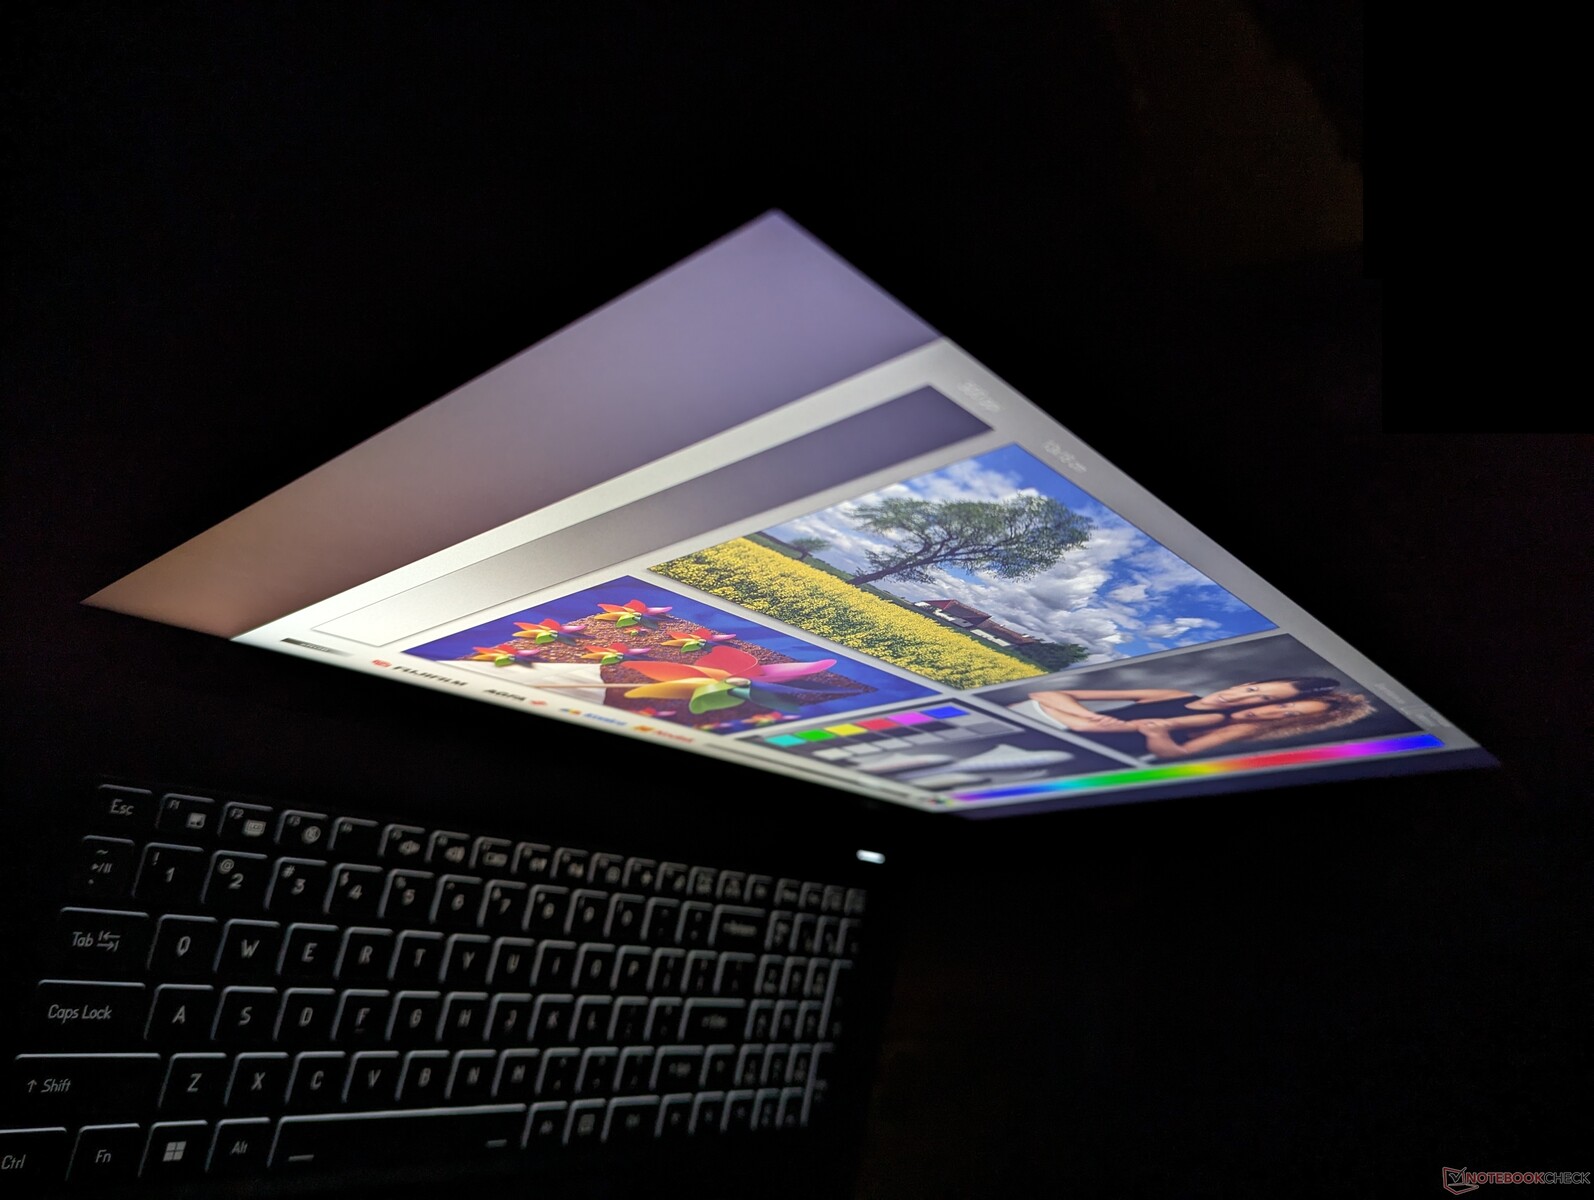
Een belangrijk nadeel van het beeldscherm is het ietwat korrelige matte paneel, de merkbare backlight bleeding in donkere scènes en het gebrek aan HDR-ondersteuning. OLED alternatieven zien er veel scherper en levendiger uit dan wat de Raptor X17 in dat opzicht te bieden heeft.
Het BOE NE173QUM-NY1 paneel is ook te vinden op andere modellen zoals de Schenker Key 17 Pro.

| |||||||||||||||||||||||||
Helderheidsverdeling: 77 %
Helderheid in Batterij-modus: 544.6 cd/m²
Contrast: 1135:1 (Zwart: 0.48 cd/m²)
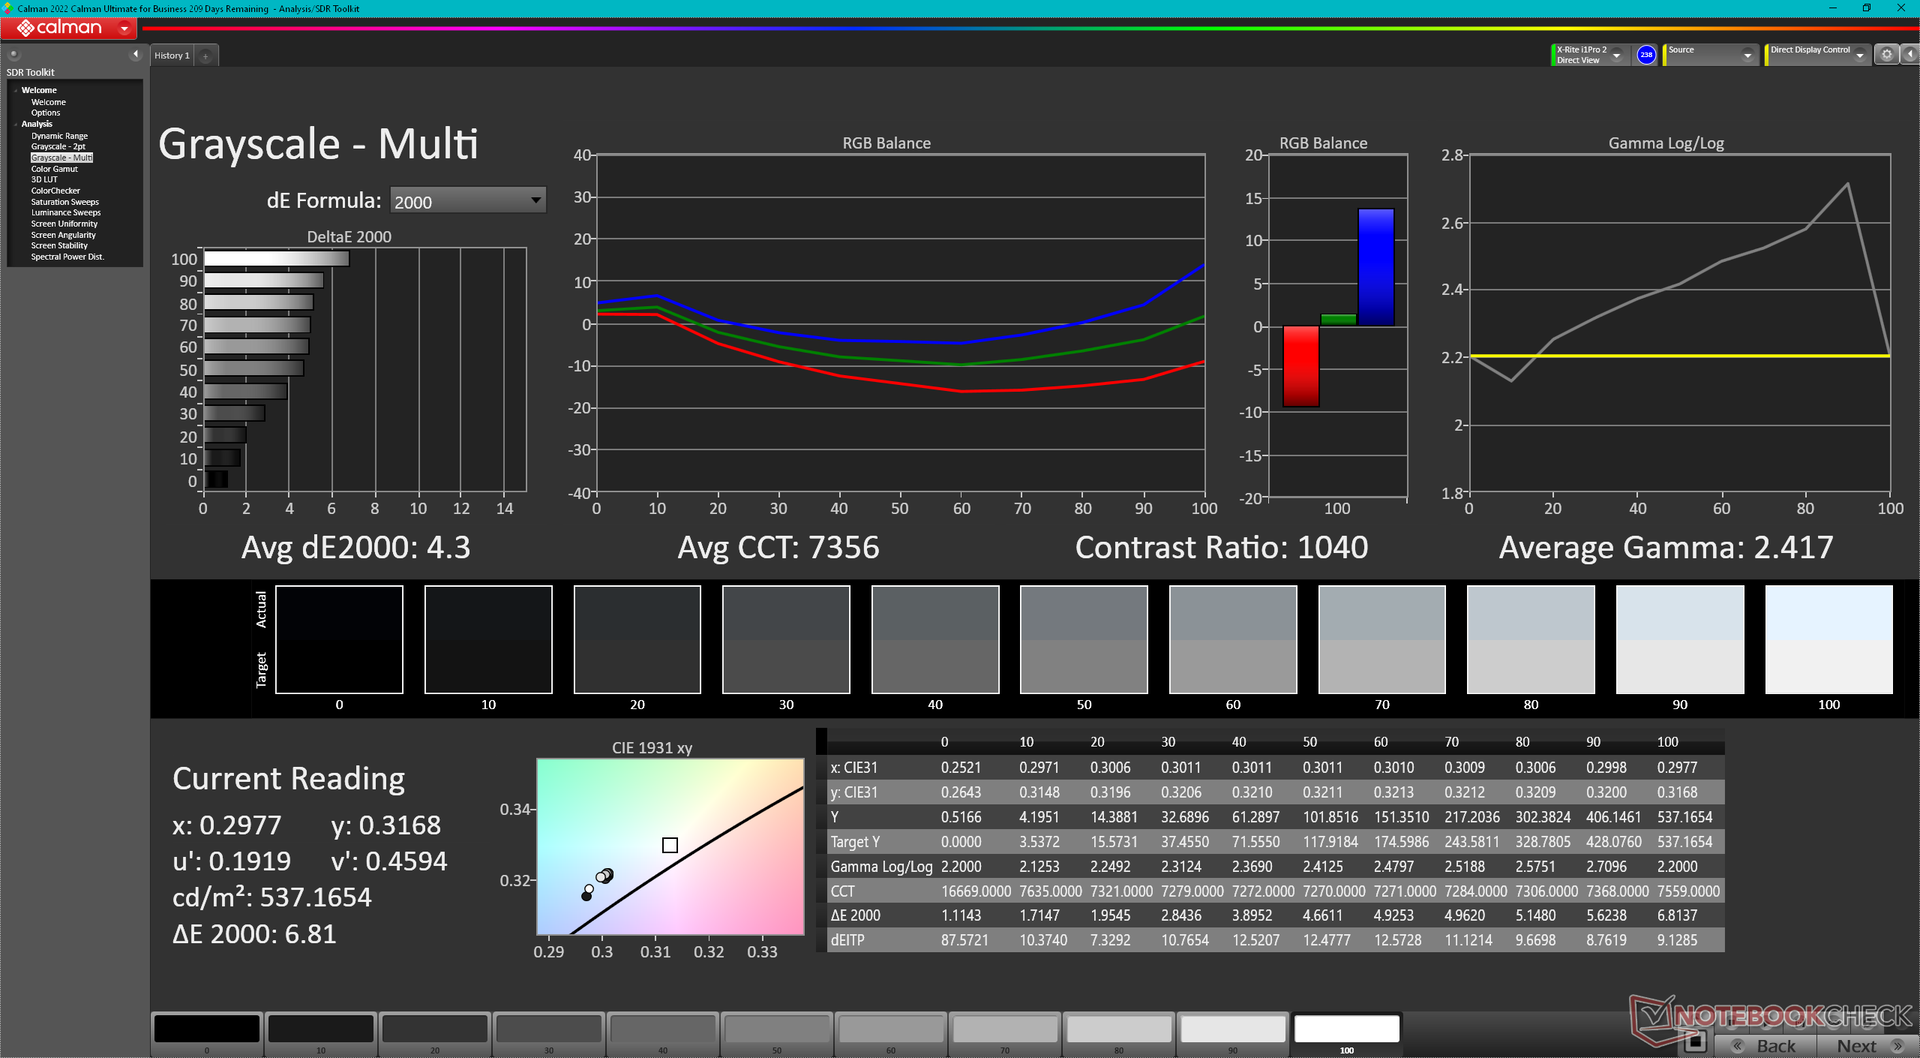
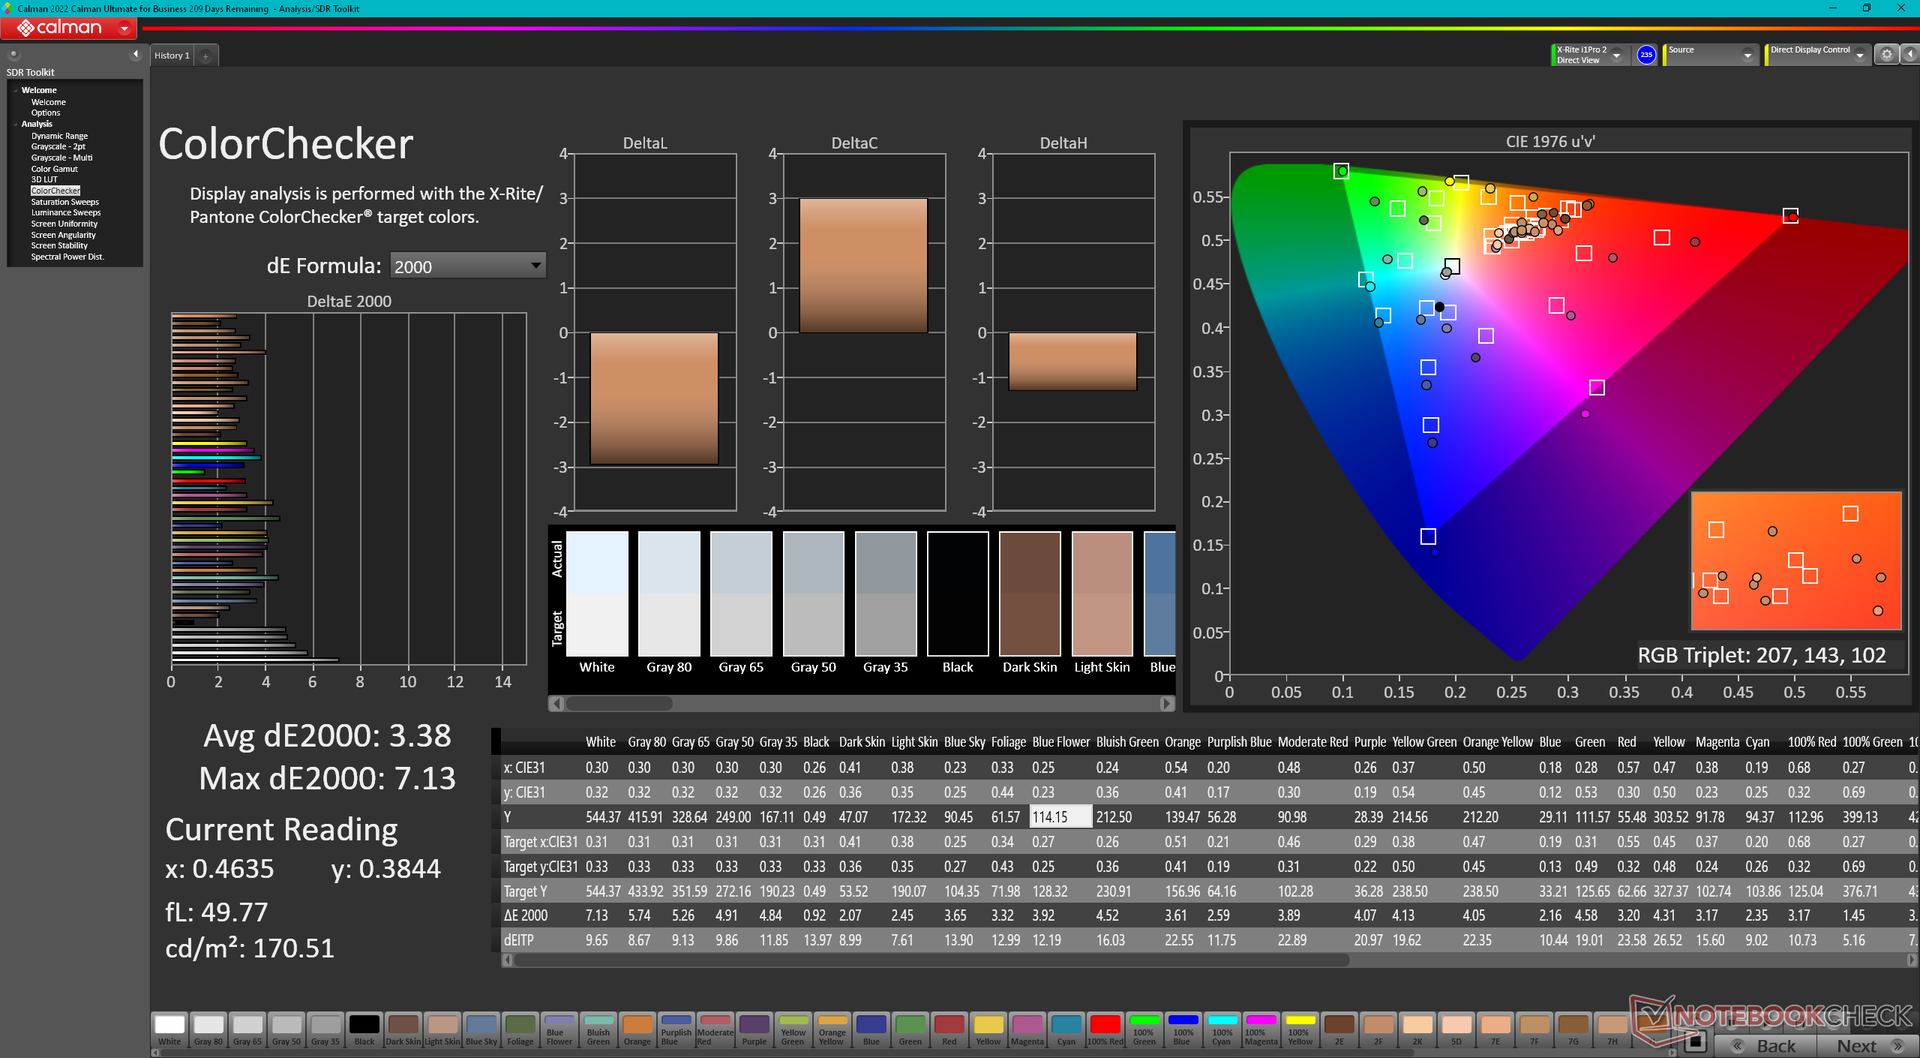
ΔE ColorChecker Calman: 3.38 | ∀{0.5-29.43 Ø4.71}
calibrated: 1.03
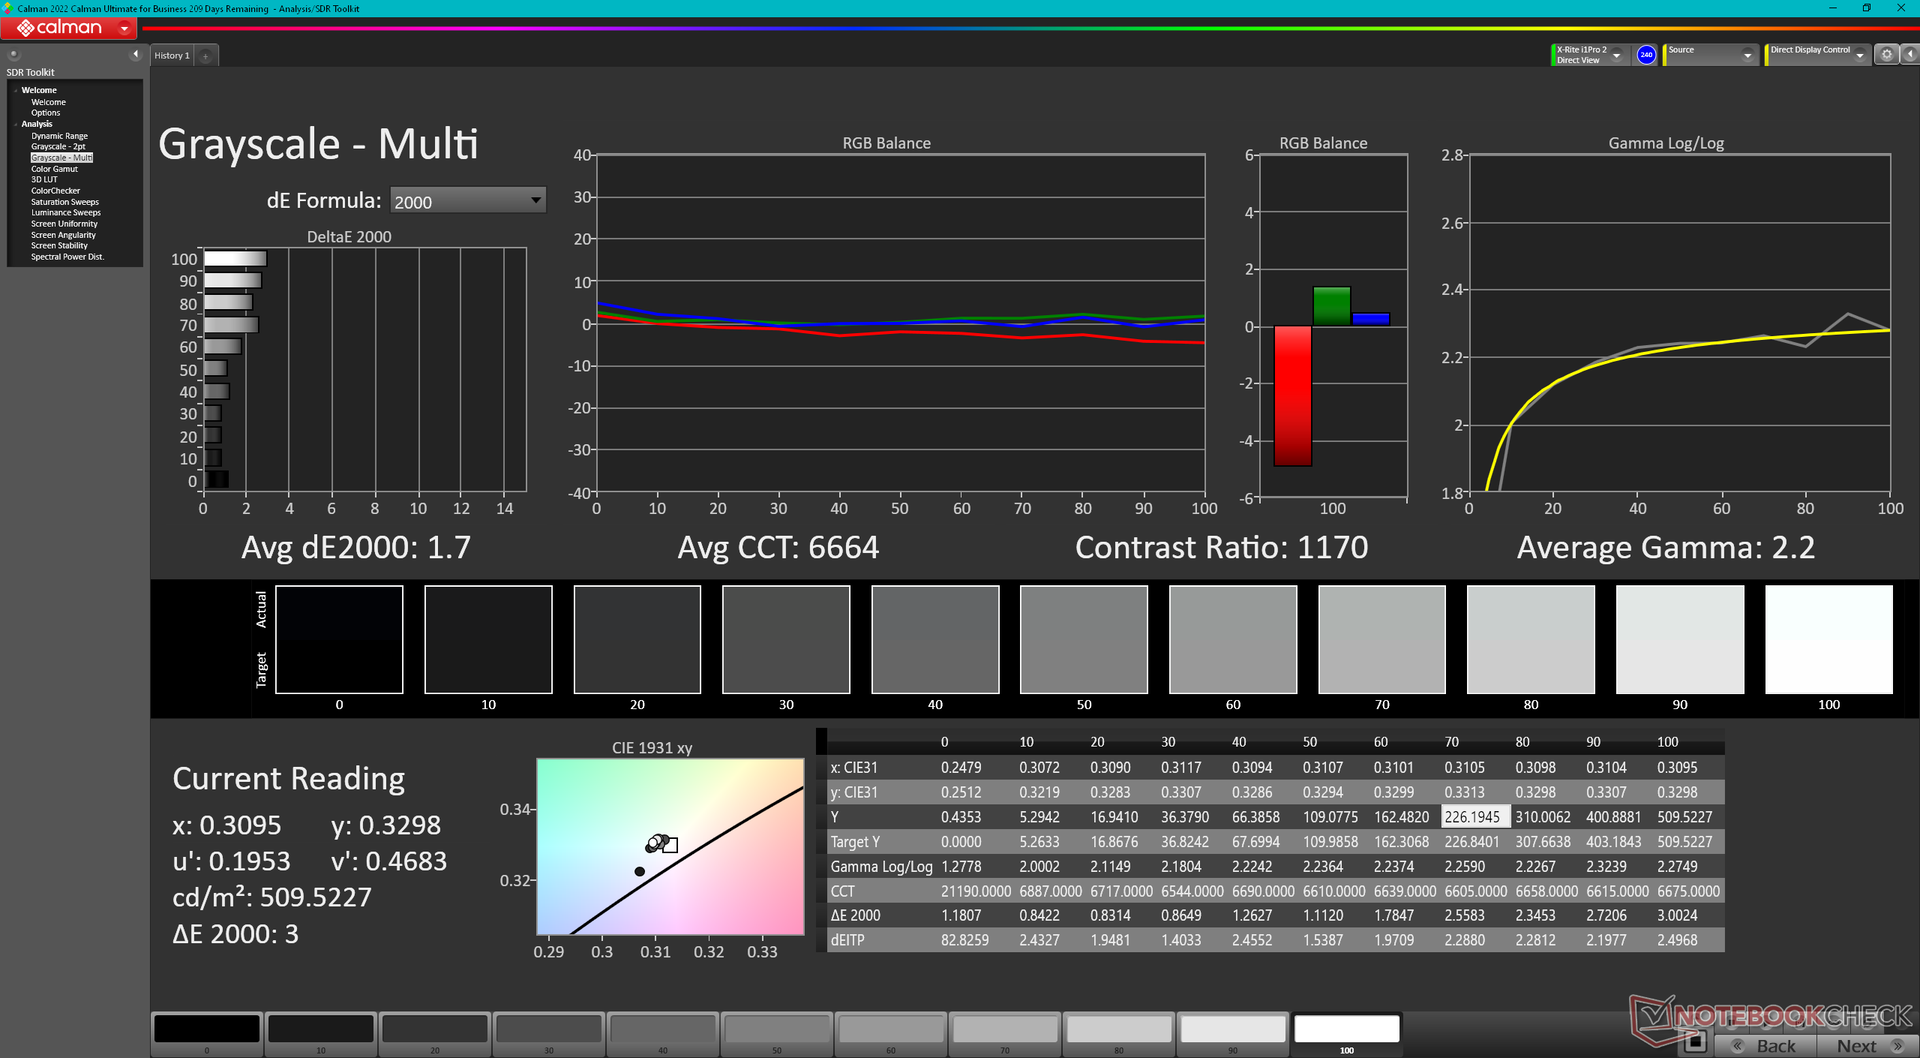
ΔE Greyscale Calman: 4.3 | ∀{0.09-98 Ø4.96}
84.2% AdobeRGB 1998 (Argyll 3D)
99.8% sRGB (Argyll 3D)
95.9% Display P3 (Argyll 3D)
Gamma: 2.42
CCT: 7356 K
| Eurocom Raptor X17 Core i9-14900HX BOE CQ NE173QUM-NY1, IPS, 3840x2160, 17.3" | Eurocom Raptor X17 BOE NE173QHM-NZ1, IPS, 2560x1440, 17.3" | Asus TUF Gaming A17 FA707XI-NS94 AU Optronics B173HAN04.9, IPS, 1920x1080, 17.3" | Asus ROG Strix Scar 17 G733PY-XS96 NE173QHM-NZ2, IPS, 2560x1440, 17.3" | MSI GE78HX 13VH-070US AU Optronics B170QAN01.2, IPS, 2560x1600, 17" | MSI Titan 18 HX A14VIG AU Optronics B180ZAN01.0, Mini-LED, 3840x2400, 18" | |
|---|---|---|---|---|---|---|
| Display | 1% | -50% | 1% | 2% | 1% | |
| Display P3 Coverage (%) | 95.9 | 97.8 2% | 39.7 -59% | 98 2% | 97.6 2% | 98.1 2% |
| sRGB Coverage (%) | 99.8 | 99.9 0% | 59.1 -41% | 100 0% | 99.9 0% | 99.8 0% |
| AdobeRGB 1998 Coverage (%) | 84.2 | 85.4 1% | 41 -51% | 85.6 2% | 86.5 3% | 86.2 2% |
| Response Times | 11% | -150% | 29% | 58% | -288% | |
| Response Time Grey 50% / Grey 80% * (ms) | 14.8 ? | 13.3 ? 10% | 39 ? -164% | 6.2 ? 58% | 4.2 ? 72% | 8.6 ? 42% |
| Response Time Black / White * (ms) | 11.4 ? | 10 ? 12% | 26.9 ? -136% | 11.4 ? -0% | 6.4 ? 44% | 81.8 ? -618% |
| PWM Frequency (Hz) | 2592 ? | |||||
| Screen | -4% | -33% | 22% | -16% | -23% | |
| Brightness middle (cd/m²) | 544.6 | 312.6 -43% | 255.9 -53% | 322.5 -41% | 398.6 -27% | 467.5 -14% |
| Brightness (cd/m²) | 507 | 292 -42% | 248 -51% | 317 -37% | 384 -24% | 459 -9% |
| Brightness Distribution (%) | 77 | 75 -3% | 91 18% | 86 12% | 89 16% | 90 17% |
| Black Level * (cd/m²) | 0.48 | 0.26 46% | 0.21 56% | 0.29 40% | 0.46 4% | |
| Contrast (:1) | 1135 | 1202 6% | 1219 7% | 1112 -2% | 867 -24% | |
| Colorchecker dE 2000 * | 3.38 | 3.43 -1% | 4.51 -33% | 1.15 66% | 4.05 -20% | 3.77 -12% |
| Colorchecker dE 2000 max. * | 7.13 | 8.31 -17% | 20.77 -191% | 3.03 58% | 8.68 -22% | 6.12 14% |
| Colorchecker dE 2000 calibrated * | 1.03 | 0.74 28% | 1.82 -77% | 0.56 46% | 1.02 1% | 2.94 -185% |
| Greyscale dE 2000 * | 4.3 | 4.8 -12% | 3.2 26% | 1.7 60% | 6.5 -51% | 3.2 26% |
| Gamma | 2.42 91% | 2.12 104% | 2.08 106% | 2.27 97% | 2.11 104% | 2.43 91% |
| CCT | 7356 88% | 7082 92% | 6054 107% | 6299 103% | 7518 86% | 6478 100% |
| Totaal Gemiddelde (Programma / Instellingen) | 3% /
-1% | -78% /
-54% | 17% /
19% | 15% /
-2% | -103% /
-61% |
* ... kleiner is beter
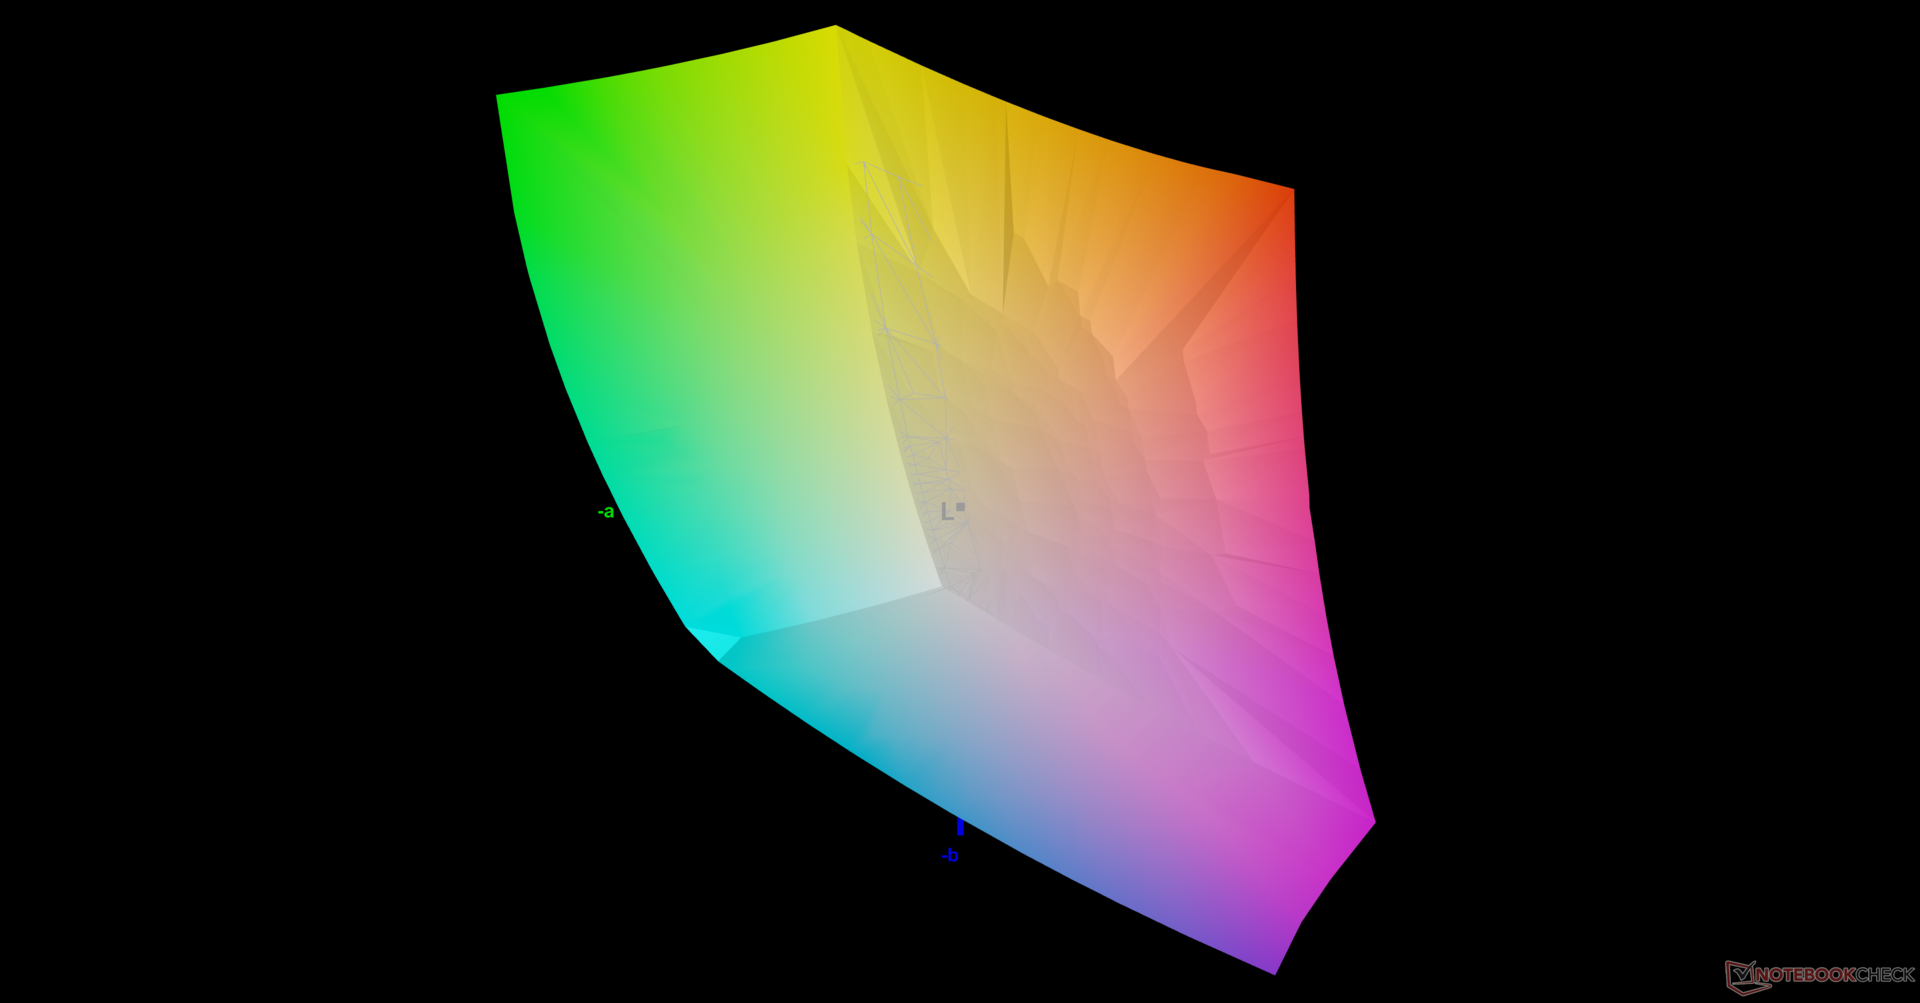
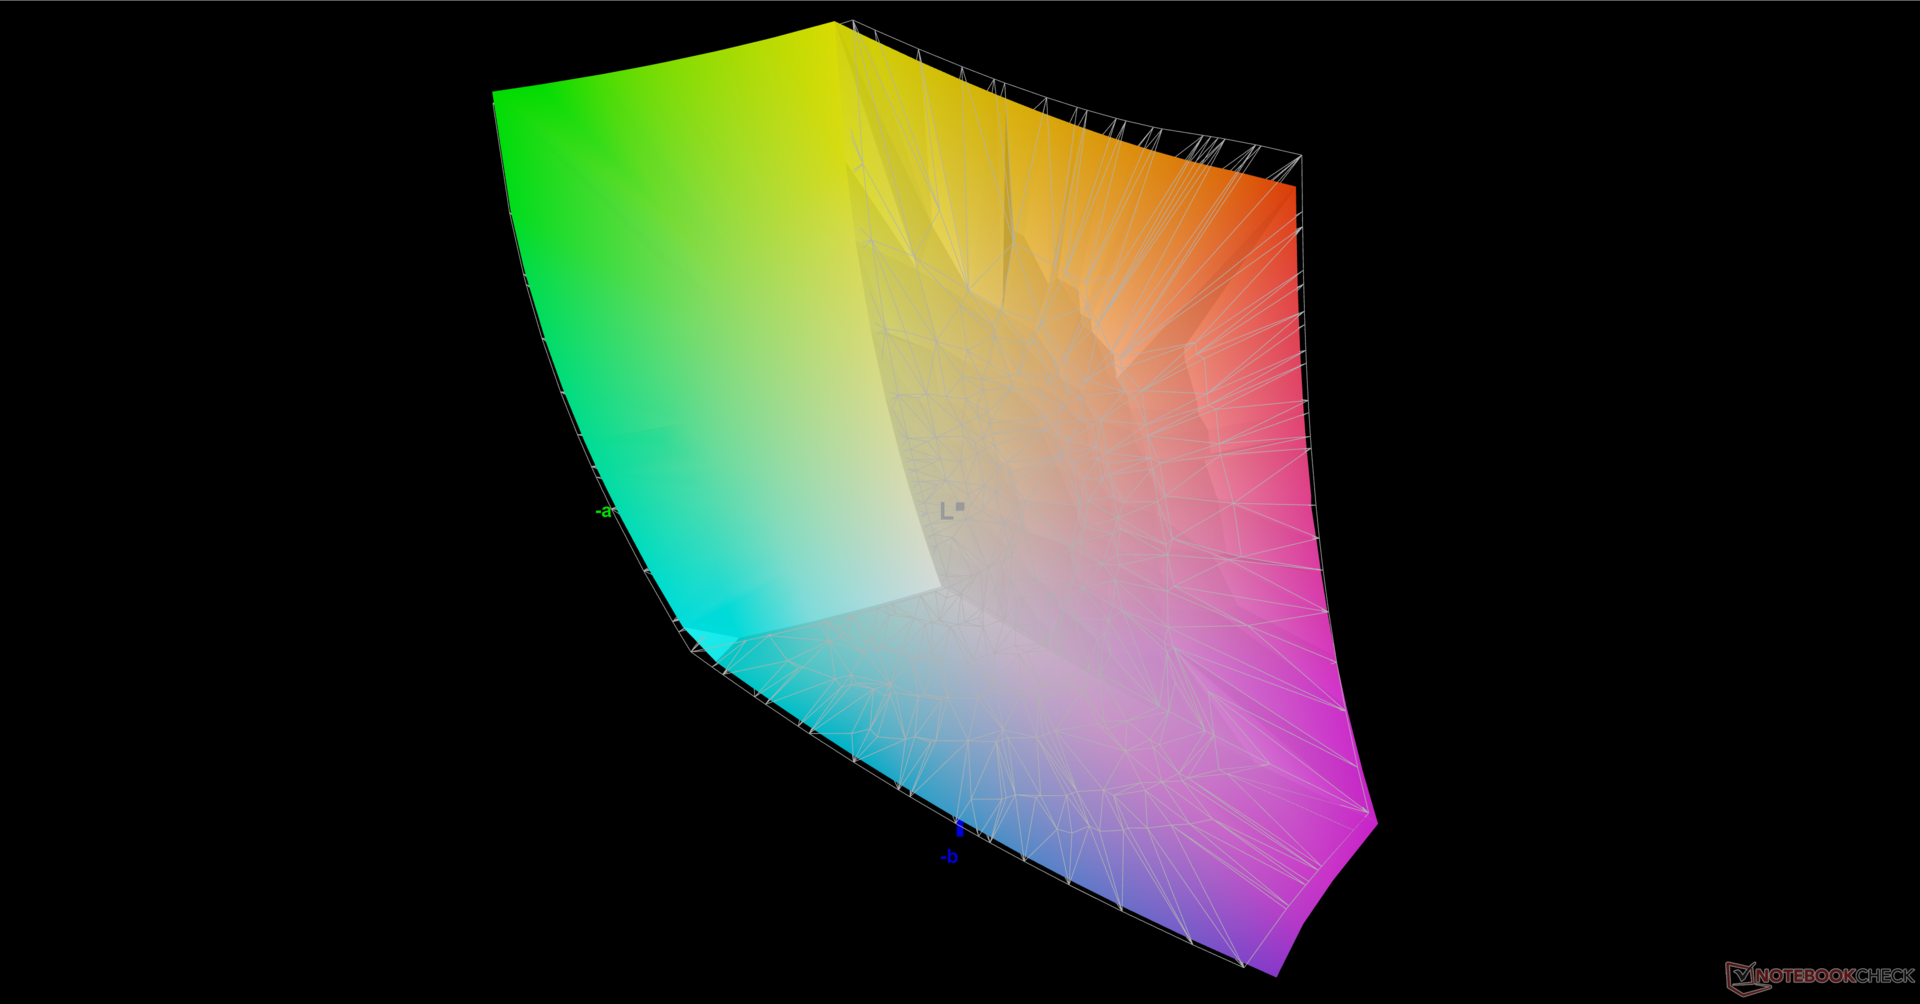
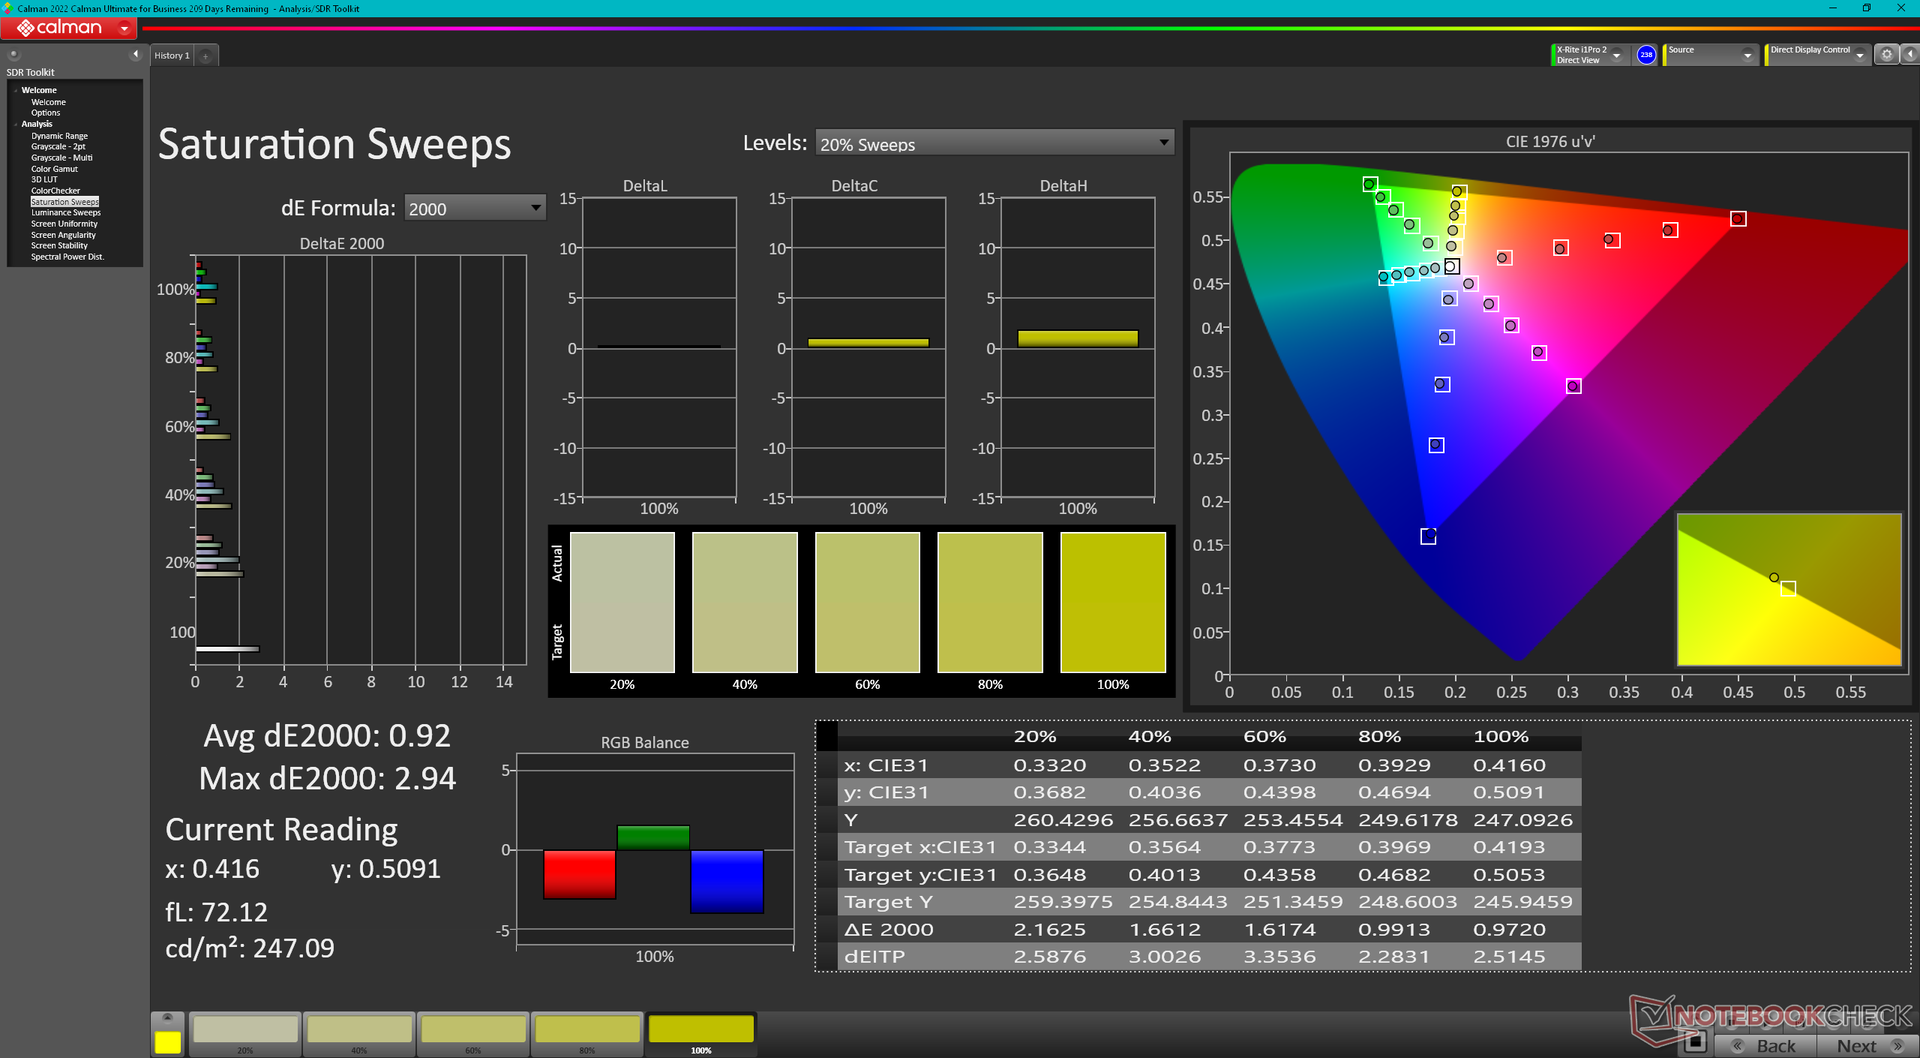
Hoewel de P3-standaard wordt ondersteund, had de kleurnauwkeurigheid beter gekund. De kleurtemperatuur is te koel, wat van invloed is op de grijswaarden en kleurdeltaE-waarden. Kalibratie met onze X-Rite colorimeter verhelpt dit probleem. Ons ICM-profiel kunt u hierboven gratis downloaden.
Responstijd Scherm
| ↔ Responstijd Zwart naar Wit | ||
|---|---|---|
| 11.4 ms ... stijging ↗ en daling ↘ gecombineerd | ↗ 6.1 ms stijging | 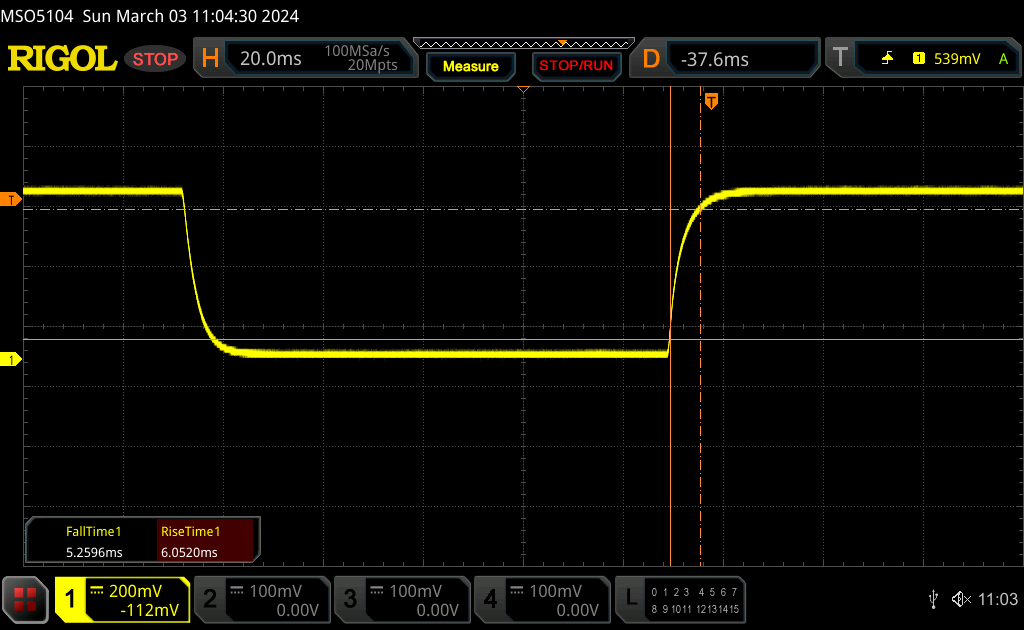 |
| ↘ 5.3 ms daling | ||
| Het scherm vertoonde prima responstijden in onze tests maar is misschien wat te traag voor competitieve games. Ter vergelijking: alle testtoestellen variëren van 0.1 (minimum) tot 240 (maximum) ms. » 31 % van alle toestellen zijn beter. Dit betekent dat de gemeten responstijd beter is dan het gemiddelde (19.8 ms) van alle geteste toestellen. | ||
| ↔ Responstijd 50% Grijs naar 80% Grijs | ||
| 14.8 ms ... stijging ↗ en daling ↘ gecombineerd | ↗ 7.2 ms stijging | 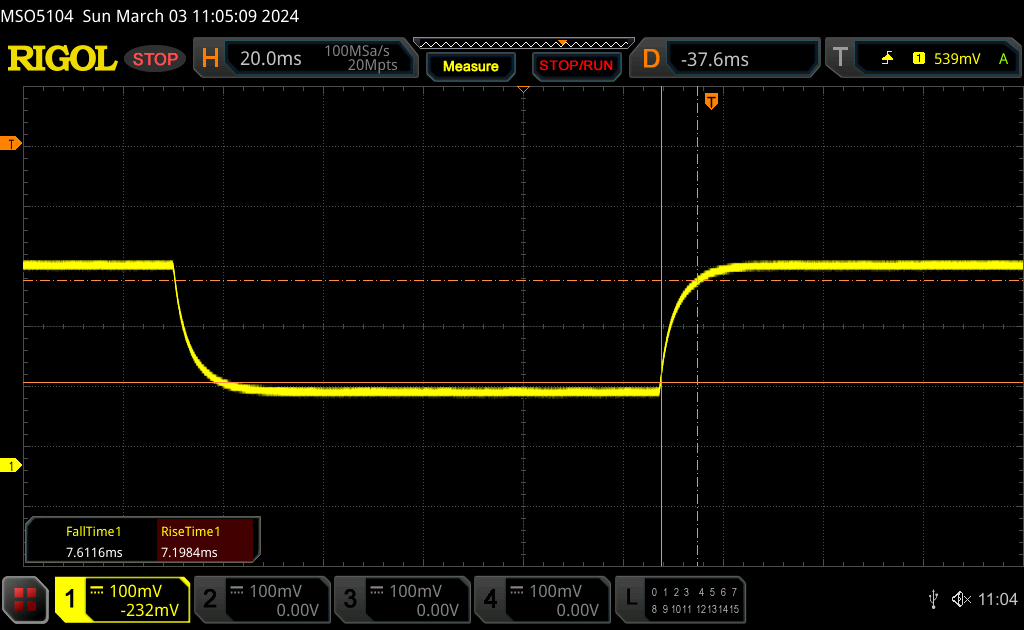 |
| ↘ 7.6 ms daling | ||
| Het scherm vertoonde prima responstijden in onze tests maar is misschien wat te traag voor competitieve games. Ter vergelijking: alle testtoestellen variëren van 0.165 (minimum) tot 636 (maximum) ms. » 29 % van alle toestellen zijn beter. Dit betekent dat de gemeten responstijd beter is dan het gemiddelde (30.9 ms) van alle geteste toestellen. | ||
Screen Flickering / PWM (Pulse-Width Modulation)
| Screen flickering / PWM niet waargenomen | 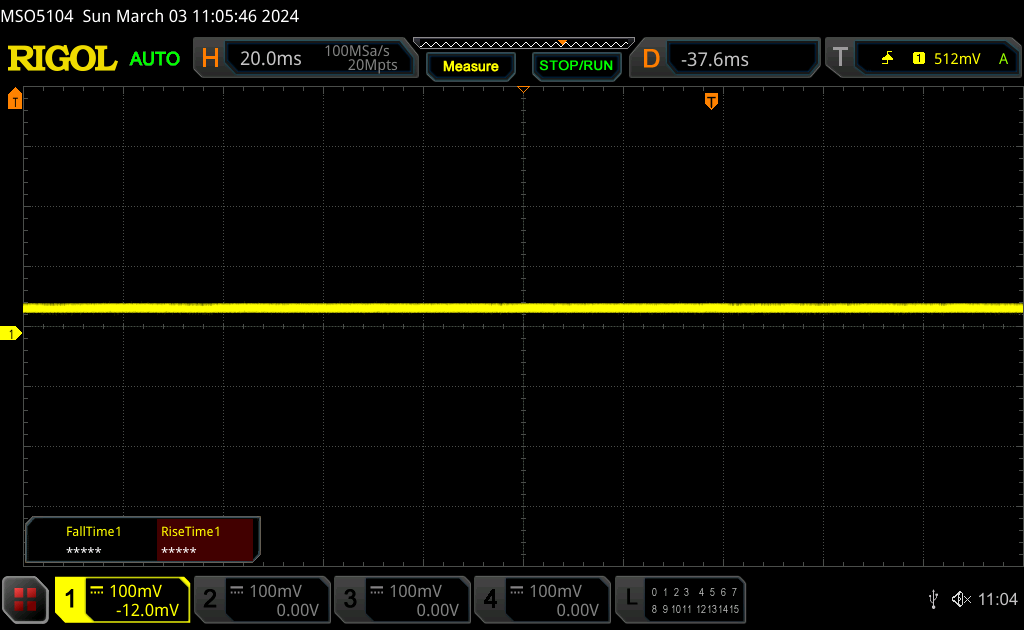 | ||
Ter vergelijking: 52 % van alle geteste toestellen maakten geen gebruik van PWM om de schermhelderheid te verlagen. Als het wel werd gebruikt, werd een gemiddelde van 7741 (minimum: 5 - maximum: 343500) Hz waargenomen. | |||
Prestaties - Raptor Lake-HX Vernieuwen
Testomstandigheden
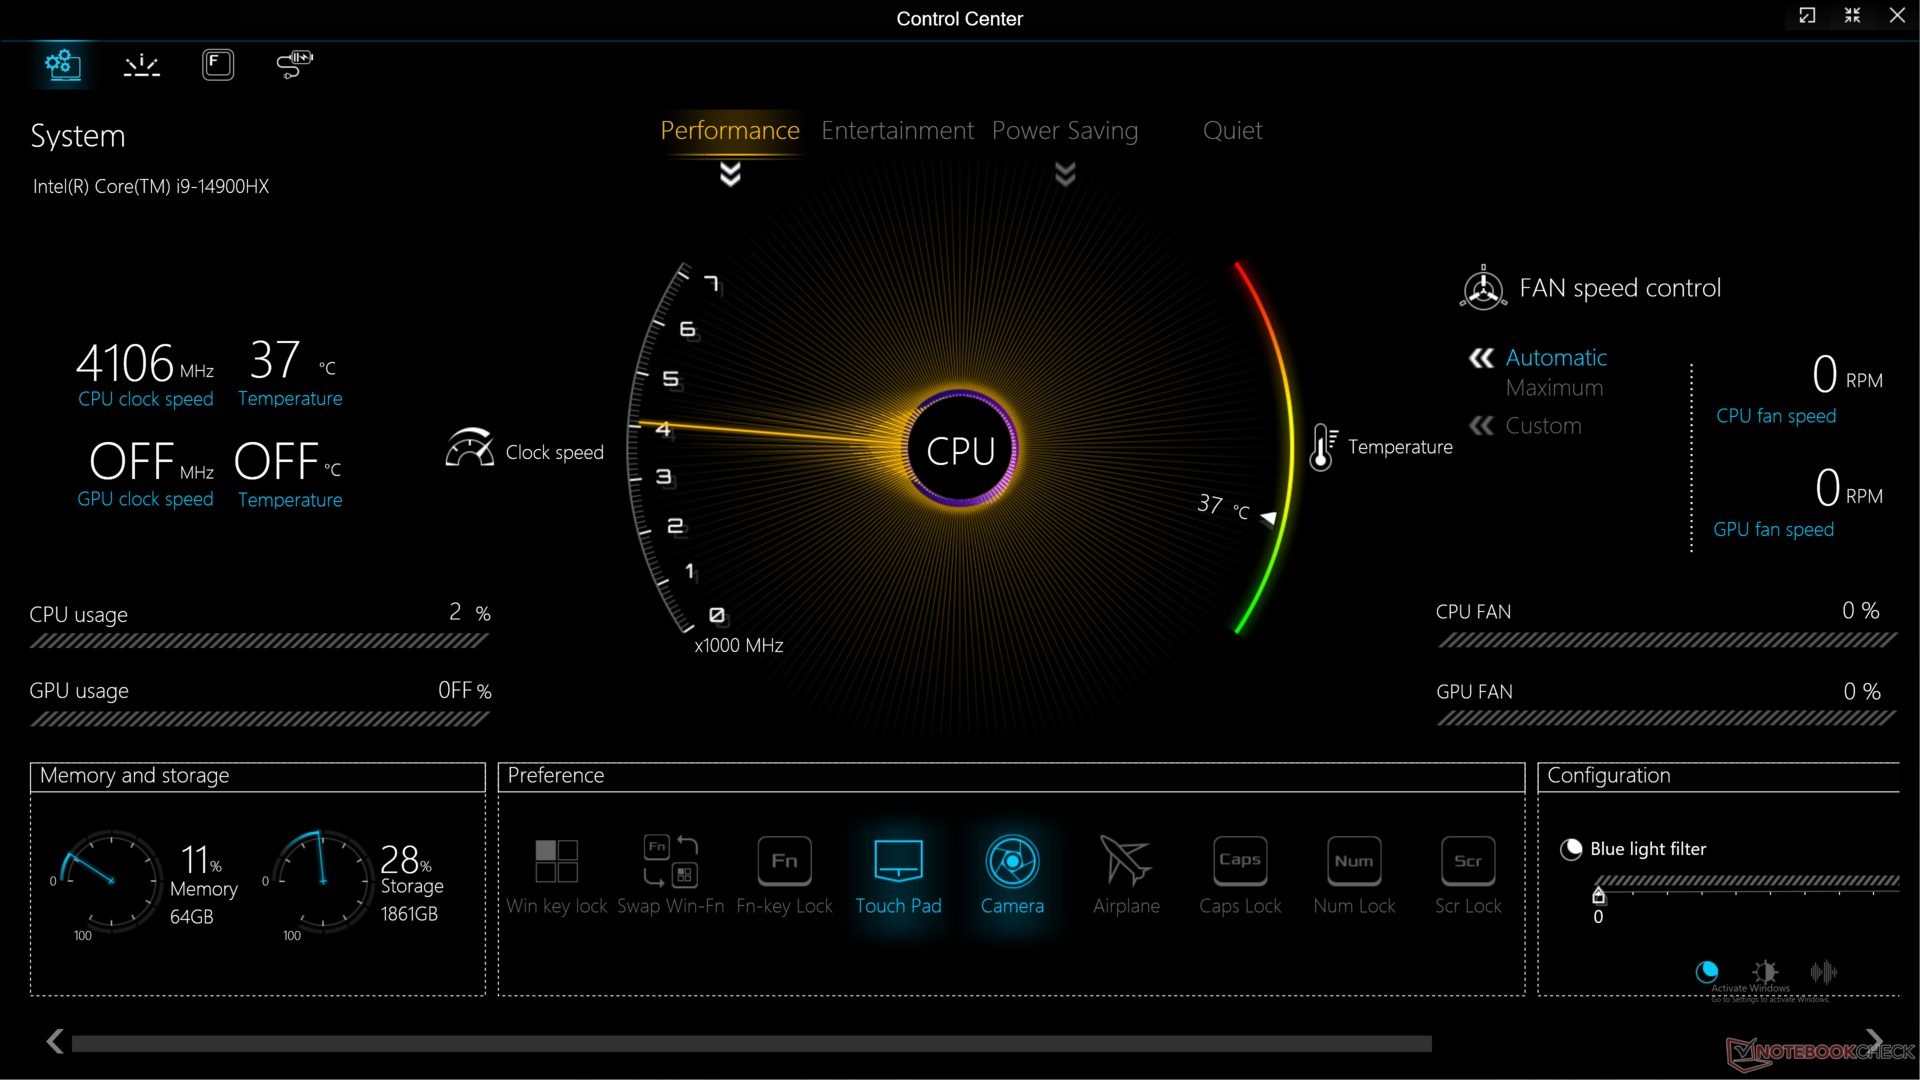
We hebben Windows en Control Center ingesteld op de modus Prestaties met Maximum Ventilator actief voordat we de onderstaande benchmarks uitvoerden. De handmatige GPU-schakelaar is ook te vinden in Control Center, maar deze is onhandig verborgen achter een schuifbalk. G-Sync wordt ondersteund, maar Advanced Optimus niet, wat betekent dat u opnieuw moet opstarten wanneer u wisselt tussen de iGPU en de dGPU.
De modi "Entertainment" en "Performance" in Control Center kunnen enigszins verwarrend zijn. Misschien is het beter om de modus "Entertainment" te hernoemen naar iets als "Balanced".
Processor
De Raptor Lake-HX serie is opgefrist voor 2024, maar de prestatievoordelen zijn op zijn best marginaal in vergelijking met de 2023 serie. Overstappen van de Core i9-13900HX in de Raptor X17 van vorig jaar naar de Core i9-14900HX in deze nieuwere configuratie verbetert de prestatie met slechts 5 tot 10 procent. De chipset heeft geen geïntegreerde NPU in tegenstelling tot het Meteor Lake platform.
Cinebench R15 Multi Loop
Cinebench R23: Multi Core | Single Core
Cinebench R20: CPU (Multi Core) | CPU (Single Core)
Cinebench R15: CPU Multi 64Bit | CPU Single 64Bit
Blender: v2.79 BMW27 CPU
7-Zip 18.03: 7z b 4 | 7z b 4 -mmt1
Geekbench 6.7: Multi-Core | Single-Core
Geekbench 5.5: Multi-Core | Single-Core
HWBOT x265 Benchmark v2.2: 4k Preset
LibreOffice : 20 Documents To PDF
R Benchmark 2.5: Overall mean
| CPU Performance rating | |
| KFA2 GeForce RTX 4080 Super SG -6! | |
| Asus ROG Strix Scar 17 G733PYV-LL053X | |
| Asus ROG Strix Scar 17 G733PY-XS96 -2! | |
| MSI GE78HX 13VH-070US -2! | |
| MSI Titan 18 HX A14VIG | |
| MSI Raider GE78 HX 13VI | |
| Gemiddeld Intel Core i9-14900HX | |
| Eurocom Raptor X17 Core i9-14900HX | |
| Eurocom Raptor X17 -2! | |
| Alienware x16 R1 -3! | |
| Asus TUF Gaming A17 FA707XI-NS94 | |
| Dell XPS 17 9730 RTX 4070 -2! | |
| Medion Erazer Defender P40 -2! | |
| Eurocom Nightsky TXi317 -4! | |
| Acer Nitro 17 AN17-41-R9LN | |
| Alienware m17 R5 (R9 6900HX, RX 6850M XT) -2! | |
| Cinebench R15 / CPU Multi 64Bit | |
| Asus ROG Strix Scar 17 G733PYV-LL053X | |
| Asus ROG Strix Scar 17 G733PY-XS96 | |
| MSI GE78HX 13VH-070US | |
| MSI Titan 18 HX A14VIG | |
| Eurocom Raptor X17 Core i9-14900HX | |
| MSI Raider GE78 HX 13VI | |
| Gemiddeld Intel Core i9-14900HX (3263 - 5589, n=38) | |
| Eurocom Raptor X17 | |
| Medion Erazer Defender P40 | |
| Alienware x16 R1 | |
| Asus TUF Gaming A17 FA707XI-NS94 | |
| Dell XPS 17 9730 RTX 4070 | |
| Alienware m17 R5 (R9 6900HX, RX 6850M XT) | |
| Acer Nitro 17 AN17-41-R9LN | |
| Cinebench R15 / CPU Single 64Bit | |
| Asus ROG Strix Scar 17 G733PYV-LL053X | |
| Asus ROG Strix Scar 17 G733PY-XS96 | |
| Gemiddeld Intel Core i9-14900HX (247 - 323, n=37) | |
| MSI GE78HX 13VH-070US | |
| MSI Raider GE78 HX 13VI | |
| MSI Titan 18 HX A14VIG | |
| Eurocom Raptor X17 Core i9-14900HX | |
| Eurocom Raptor X17 | |
| Asus TUF Gaming A17 FA707XI-NS94 | |
| Alienware x16 R1 | |
| Dell XPS 17 9730 RTX 4070 | |
| Acer Nitro 17 AN17-41-R9LN | |
| Alienware m17 R5 (R9 6900HX, RX 6850M XT) | |
| Medion Erazer Defender P40 | |
| Geekbench 6.7 / Multi-Core | |
| KFA2 GeForce RTX 4080 Super SG | |
| Eurocom Raptor X17 Core i9-14900HX | |
| MSI Raider GE78 HX 13VI | |
| Gemiddeld Intel Core i9-14900HX (13158 - 19665, n=37) | |
| Asus ROG Strix Scar 17 G733PYV-LL053X | |
| MSI Titan 18 HX A14VIG | |
| Asus TUF Gaming A17 FA707XI-NS94 | |
| Acer Nitro 17 AN17-41-R9LN | |
| Geekbench 6.7 / Single-Core | |
| KFA2 GeForce RTX 4080 Super SG | |
| Gemiddeld Intel Core i9-14900HX (2419 - 3129, n=37) | |
| Asus ROG Strix Scar 17 G733PYV-LL053X | |
| Eurocom Raptor X17 Core i9-14900HX | |
| MSI Titan 18 HX A14VIG | |
| MSI Raider GE78 HX 13VI | |
| Asus TUF Gaming A17 FA707XI-NS94 | |
| Acer Nitro 17 AN17-41-R9LN | |
Cinebench R23: Multi Core | Single Core
Cinebench R20: CPU (Multi Core) | CPU (Single Core)
Cinebench R15: CPU Multi 64Bit | CPU Single 64Bit
Blender: v2.79 BMW27 CPU
7-Zip 18.03: 7z b 4 | 7z b 4 -mmt1
Geekbench 6.7: Multi-Core | Single-Core
Geekbench 5.5: Multi-Core | Single-Core
HWBOT x265 Benchmark v2.2: 4k Preset
LibreOffice : 20 Documents To PDF
R Benchmark 2.5: Overall mean
* ... kleiner is beter
AIDA64: FP32 Ray-Trace | FPU Julia | CPU SHA3 | CPU Queen | FPU SinJulia | FPU Mandel | CPU AES | CPU ZLib | FP64 Ray-Trace | CPU PhotoWorxx
| Performance rating | |
| Asus ROG Strix Scar 17 G733PY-XS96 | |
| Eurocom Raptor X17 Core i9-14900HX | |
| MSI GE78HX 13VH-070US | |
| MSI Titan 18 HX A14VIG | |
| Gemiddeld Intel Core i9-14900HX | |
| Eurocom Raptor X17 | |
| Asus TUF Gaming A17 FA707XI-NS94 | |
| AIDA64 / FP32 Ray-Trace | |
| Asus ROG Strix Scar 17 G733PY-XS96 | |
| MSI Titan 18 HX A14VIG | |
| Asus TUF Gaming A17 FA707XI-NS94 | |
| MSI GE78HX 13VH-070US | |
| Eurocom Raptor X17 Core i9-14900HX | |
| Gemiddeld Intel Core i9-14900HX (13098 - 33474, n=36) | |
| Eurocom Raptor X17 | |
| AIDA64 / FPU Julia | |
| Asus ROG Strix Scar 17 G733PY-XS96 | |
| MSI Titan 18 HX A14VIG | |
| MSI GE78HX 13VH-070US | |
| Eurocom Raptor X17 Core i9-14900HX | |
| Gemiddeld Intel Core i9-14900HX (67573 - 166040, n=36) | |
| Asus TUF Gaming A17 FA707XI-NS94 | |
| Eurocom Raptor X17 | |
| AIDA64 / CPU SHA3 | |
| Asus ROG Strix Scar 17 G733PY-XS96 | |
| MSI Titan 18 HX A14VIG | |
| Eurocom Raptor X17 Core i9-14900HX | |
| MSI GE78HX 13VH-070US | |
| Gemiddeld Intel Core i9-14900HX (3589 - 7979, n=36) | |
| Eurocom Raptor X17 | |
| Asus TUF Gaming A17 FA707XI-NS94 | |
| AIDA64 / CPU Queen | |
| Asus ROG Strix Scar 17 G733PY-XS96 | |
| MSI Titan 18 HX A14VIG | |
| Eurocom Raptor X17 Core i9-14900HX | |
| MSI GE78HX 13VH-070US | |
| Gemiddeld Intel Core i9-14900HX (118405 - 148966, n=36) | |
| Eurocom Raptor X17 | |
| Asus TUF Gaming A17 FA707XI-NS94 | |
| AIDA64 / FPU SinJulia | |
| Asus ROG Strix Scar 17 G733PY-XS96 | |
| MSI Titan 18 HX A14VIG | |
| MSI GE78HX 13VH-070US | |
| Eurocom Raptor X17 Core i9-14900HX | |
| Asus TUF Gaming A17 FA707XI-NS94 | |
| Gemiddeld Intel Core i9-14900HX (10475 - 18517, n=36) | |
| Eurocom Raptor X17 | |
| AIDA64 / FPU Mandel | |
| Asus ROG Strix Scar 17 G733PY-XS96 | |
| MSI Titan 18 HX A14VIG | |
| MSI GE78HX 13VH-070US | |
| Eurocom Raptor X17 Core i9-14900HX | |
| Asus TUF Gaming A17 FA707XI-NS94 | |
| Gemiddeld Intel Core i9-14900HX (32543 - 83662, n=36) | |
| Eurocom Raptor X17 | |
| AIDA64 / CPU AES | |
| Eurocom Raptor X17 Core i9-14900HX | |
| Asus ROG Strix Scar 17 G733PY-XS96 | |
| Gemiddeld Intel Core i9-14900HX (86964 - 241777, n=36) | |
| MSI Titan 18 HX A14VIG | |
| MSI GE78HX 13VH-070US | |
| Eurocom Raptor X17 | |
| Asus TUF Gaming A17 FA707XI-NS94 | |
| AIDA64 / CPU ZLib | |
| Asus ROG Strix Scar 17 G733PY-XS96 | |
| MSI Titan 18 HX A14VIG | |
| MSI GE78HX 13VH-070US | |
| Eurocom Raptor X17 Core i9-14900HX | |
| Eurocom Raptor X17 | |
| Gemiddeld Intel Core i9-14900HX (1054 - 2292, n=36) | |
| Asus TUF Gaming A17 FA707XI-NS94 | |
| AIDA64 / FP64 Ray-Trace | |
| Asus ROG Strix Scar 17 G733PY-XS96 | |
| MSI Titan 18 HX A14VIG | |
| Asus TUF Gaming A17 FA707XI-NS94 | |
| MSI GE78HX 13VH-070US | |
| Eurocom Raptor X17 Core i9-14900HX | |
| Gemiddeld Intel Core i9-14900HX (6809 - 18349, n=36) | |
| Eurocom Raptor X17 | |
| AIDA64 / CPU PhotoWorxx | |
| Eurocom Raptor X17 | |
| Eurocom Raptor X17 Core i9-14900HX | |
| MSI GE78HX 13VH-070US | |
| Gemiddeld Intel Core i9-14900HX (23903 - 54702, n=36) | |
| Asus ROG Strix Scar 17 G733PY-XS96 | |
| MSI Titan 18 HX A14VIG | |
| Asus TUF Gaming A17 FA707XI-NS94 | |
Stresstest
De kerntemperatuur tijdens het uitvoeren van Prime95 stress is dit keer iets koeler, namelijk 91 C vergeleken met 97 C op het model van vorig jaar, wat duidt op een kleine verbetering van de efficiëntie.
Het uitvoeren van Witcher 3 om typische gamingbelastingen weer te geven met de maximale ventilatormodus aan en uit, laat geen grote prestatieverschillen zien. De resultaten vormen een aanvulling op onze Fire Strike resultaten in het gedeelte GPU-prestaties hieronder. Het inschakelen van de maximale ventilatormodus laat de ventilatoren alleen op hun maximale toerental draaien, ongeacht de belasting op het scherm; het verhoogt het maximale ventilatorplafond niet echt. Het ventilatorgeluid tijdens het gamen zal dus hetzelfde zijn tussen de twee modi.
Het stroomverbruik van de GPU-kaart tijdens het gamen is stabiel op 169 W, wat bijna het beoogde maximum van 175 W haalt. Door over te schakelen naar de Entertainment-modus wordt het opgenomen vermogen verlaagd naar 148 W, wat iets langzamere grafische prestaties oplevert.
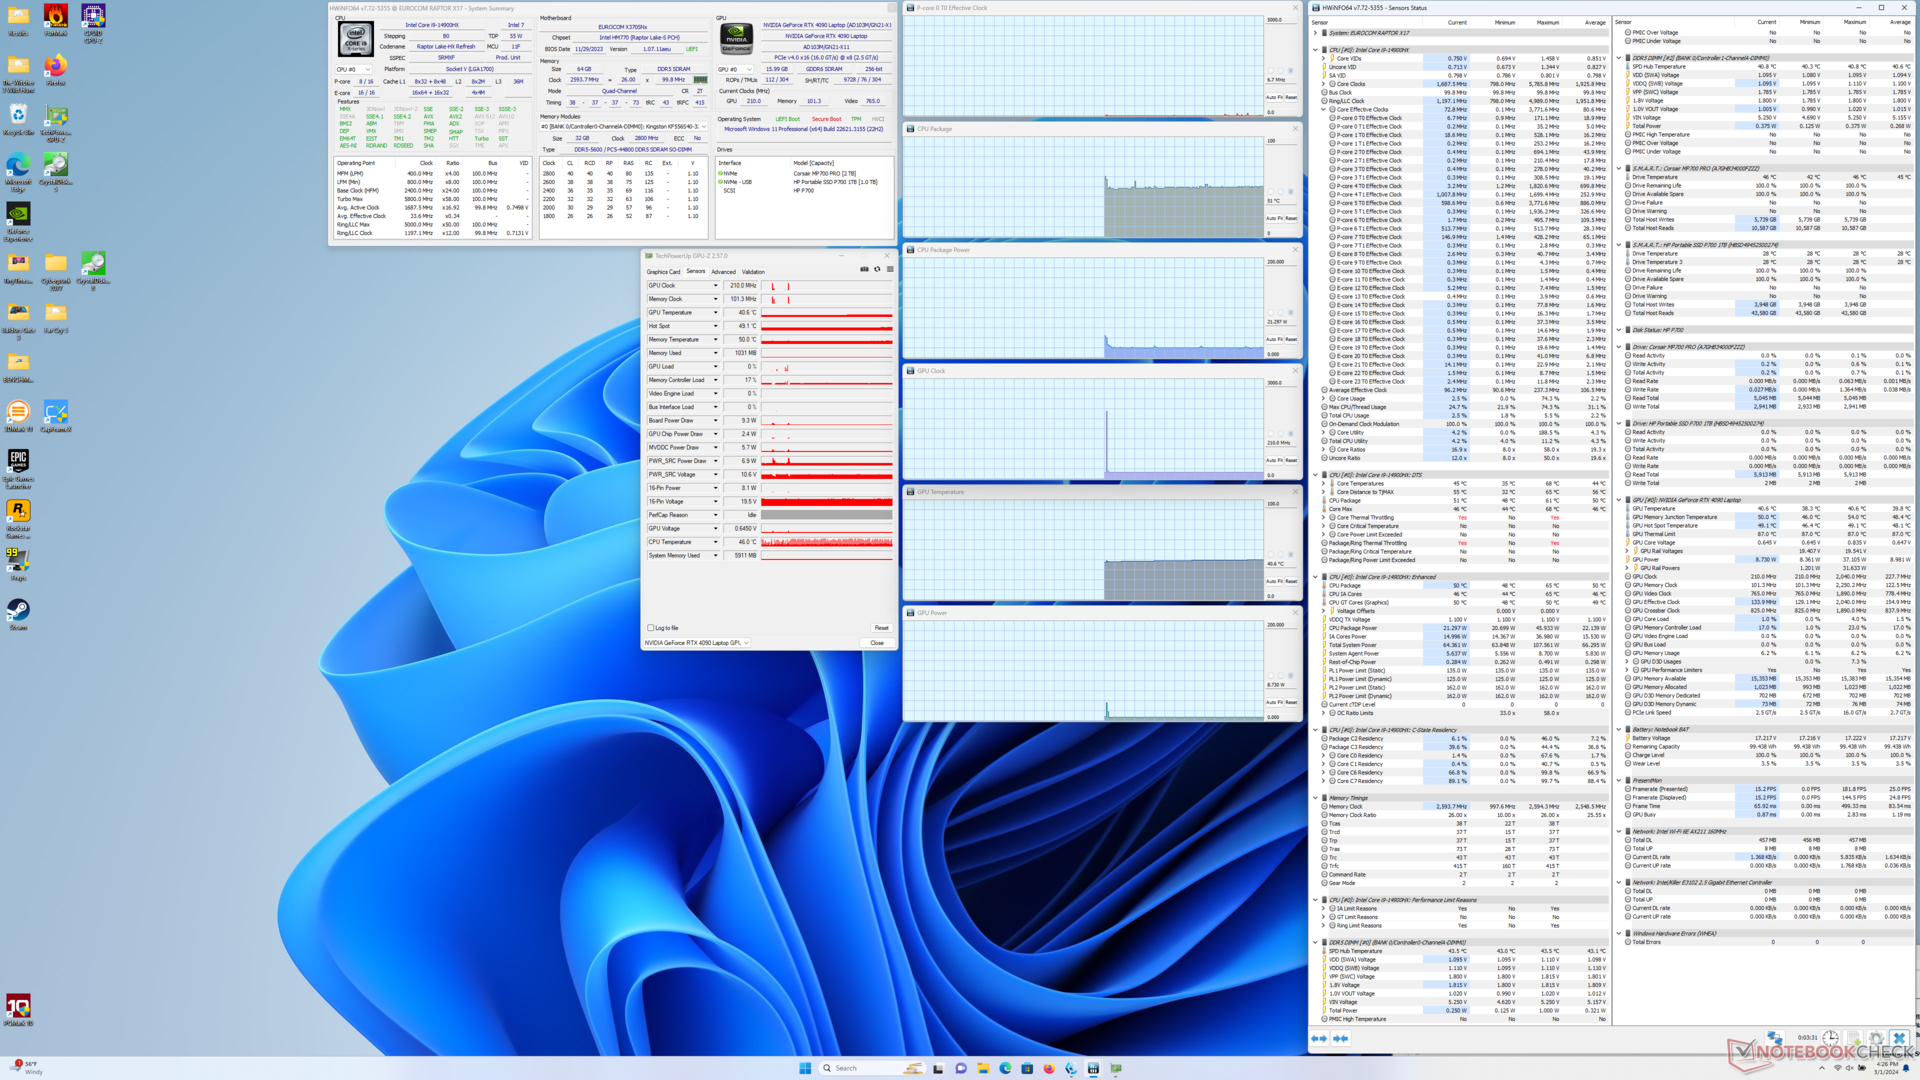
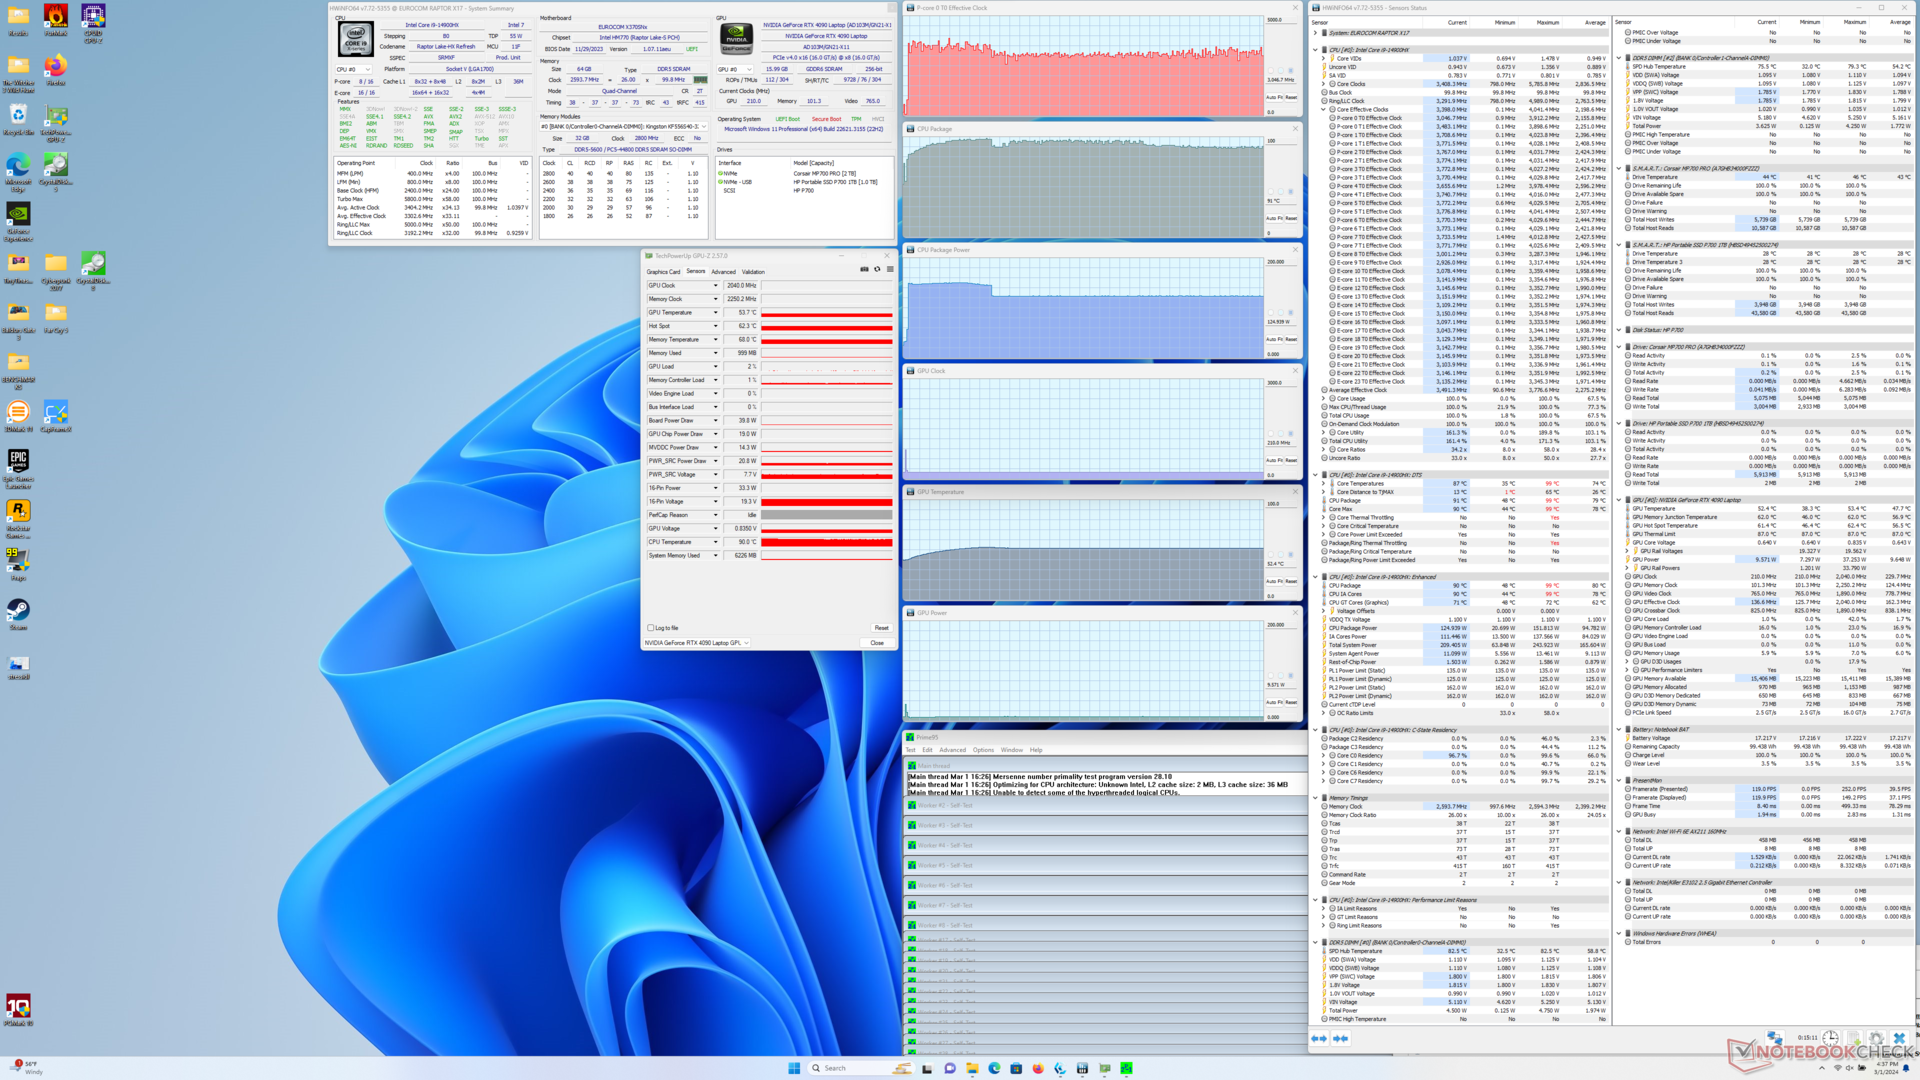
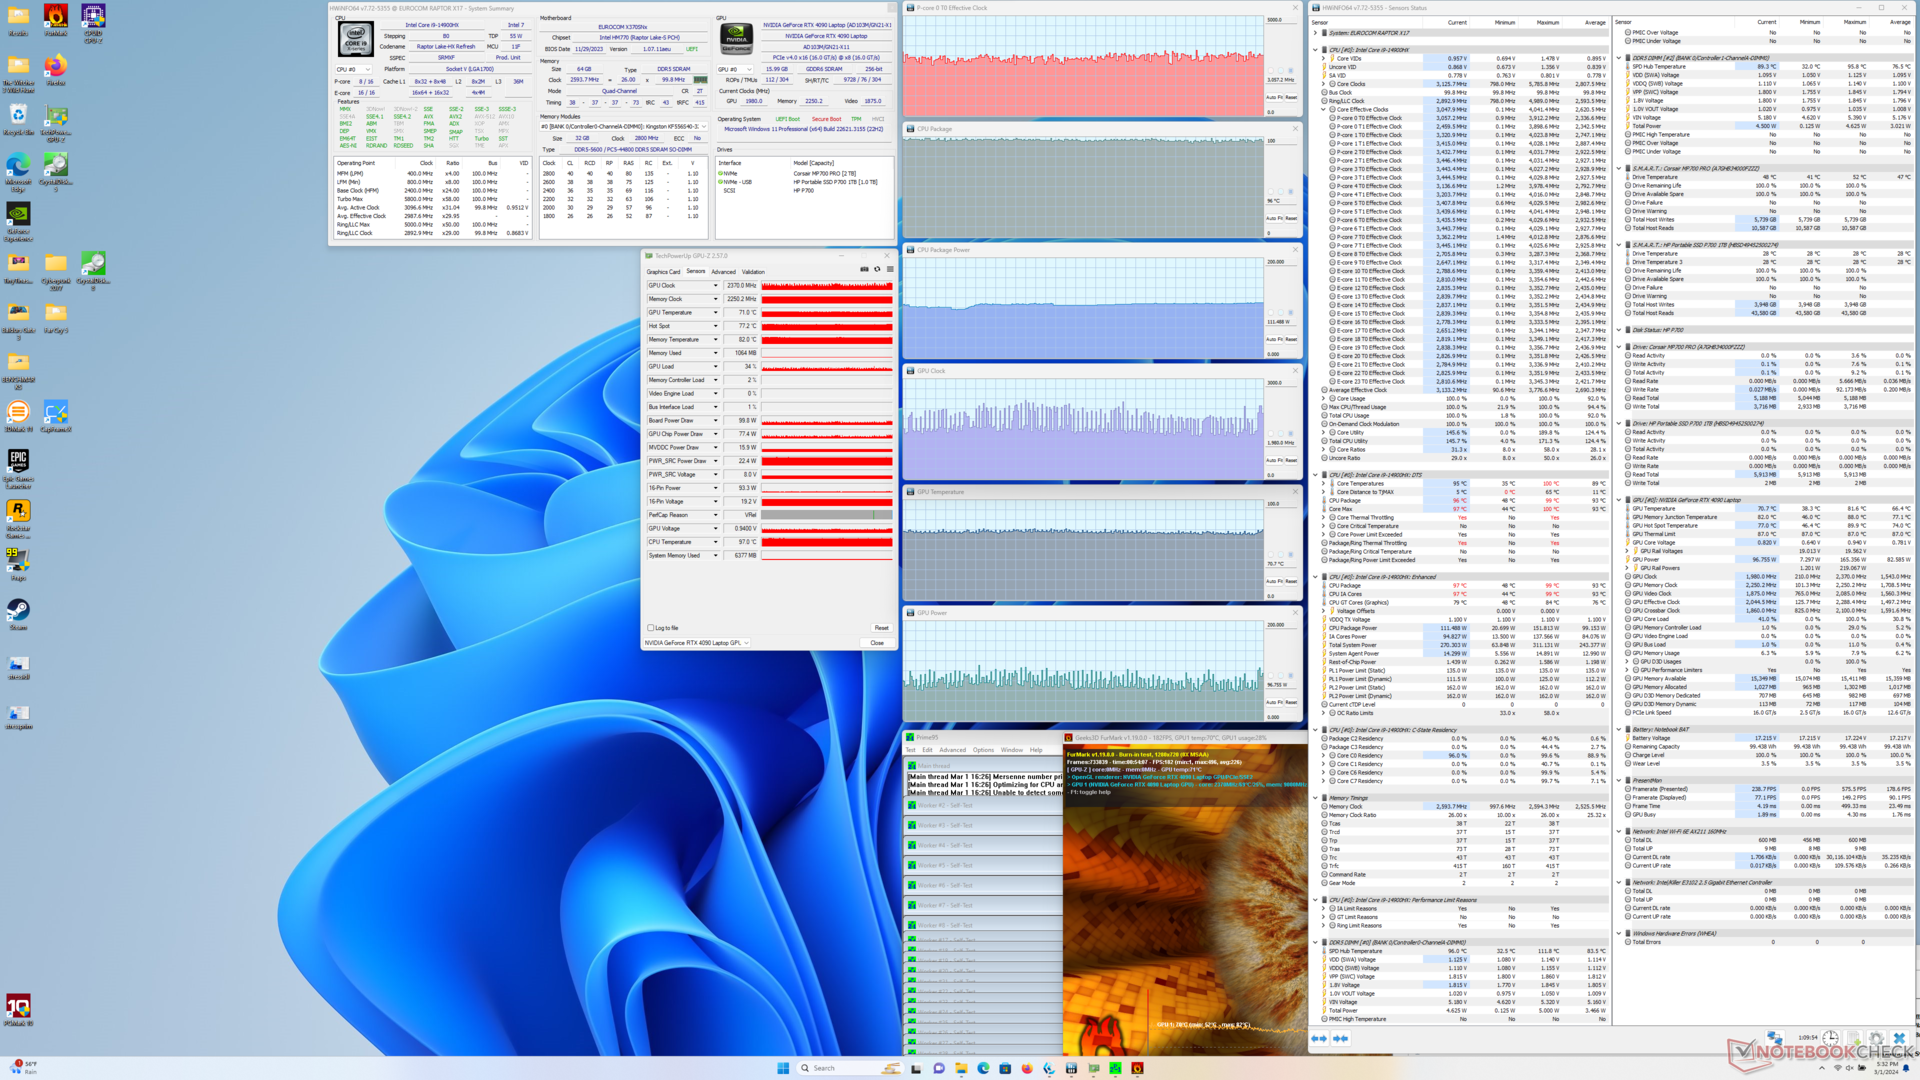
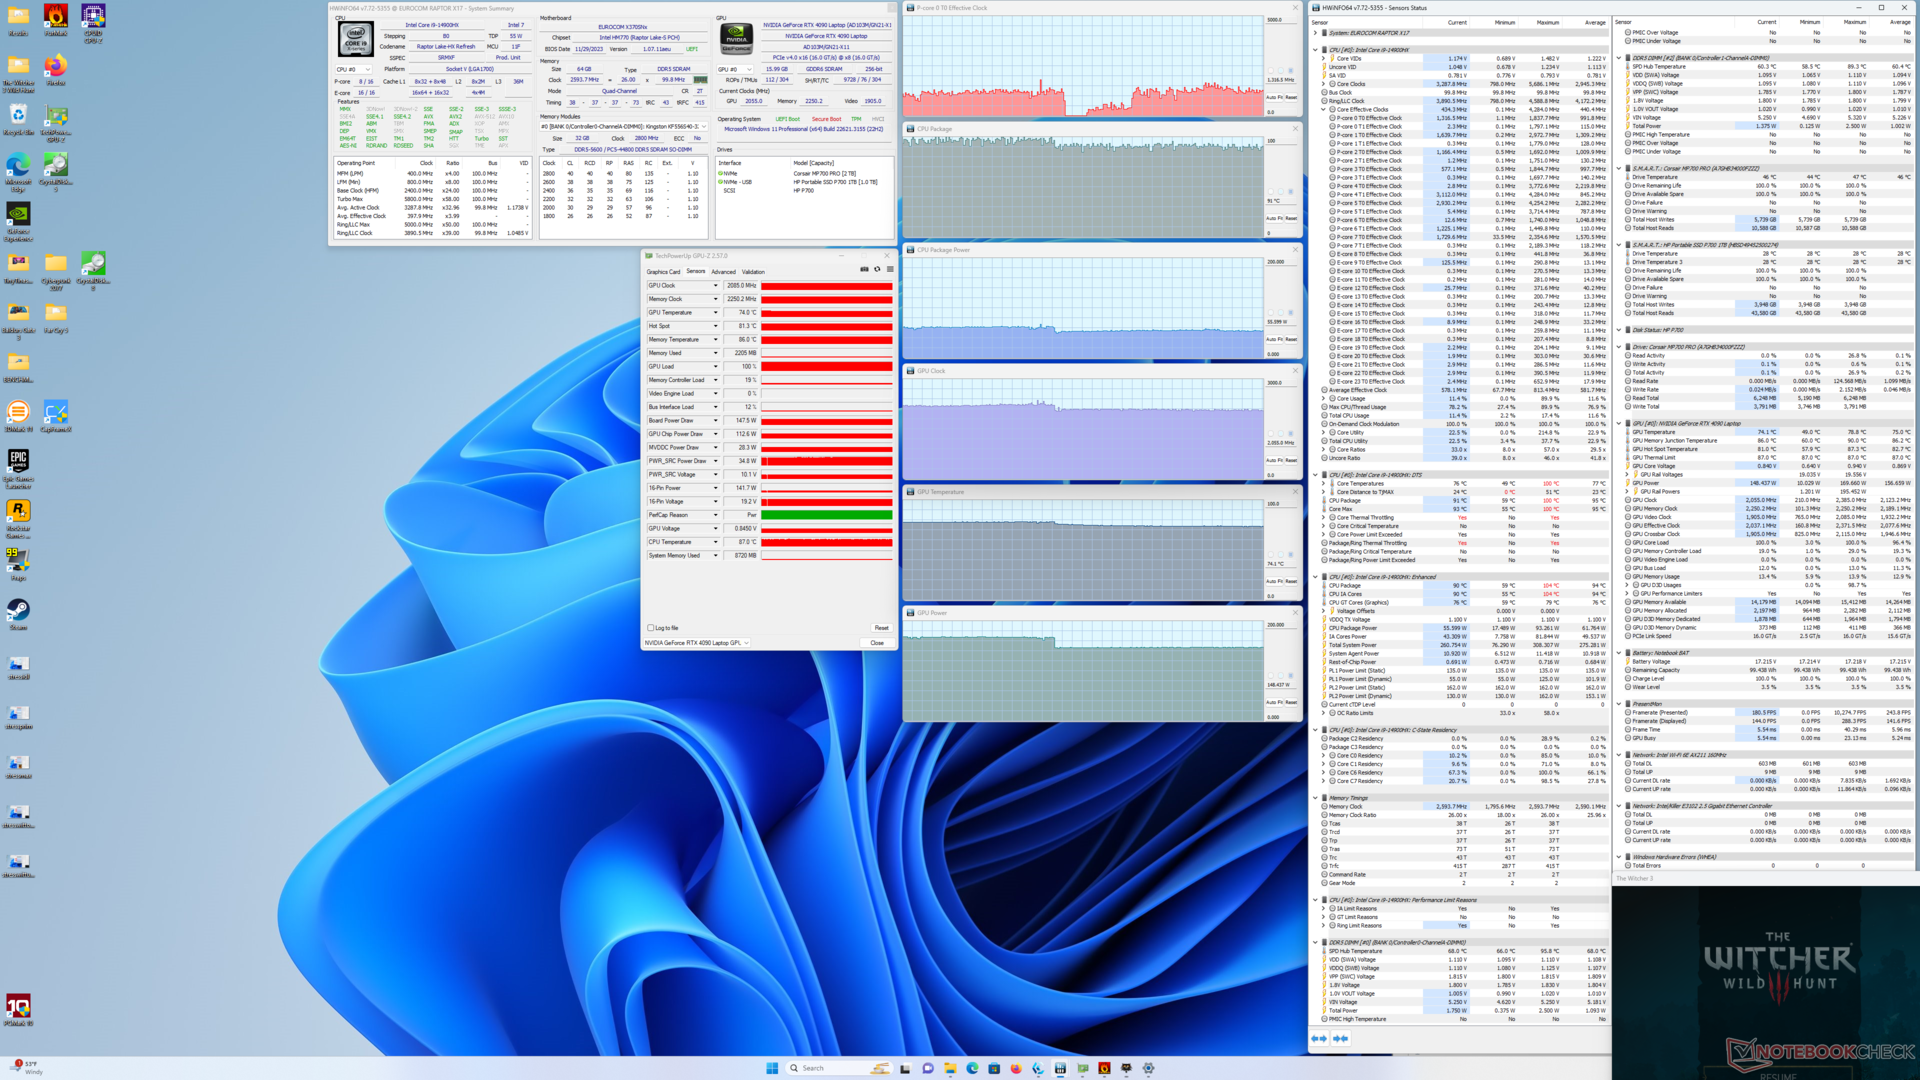
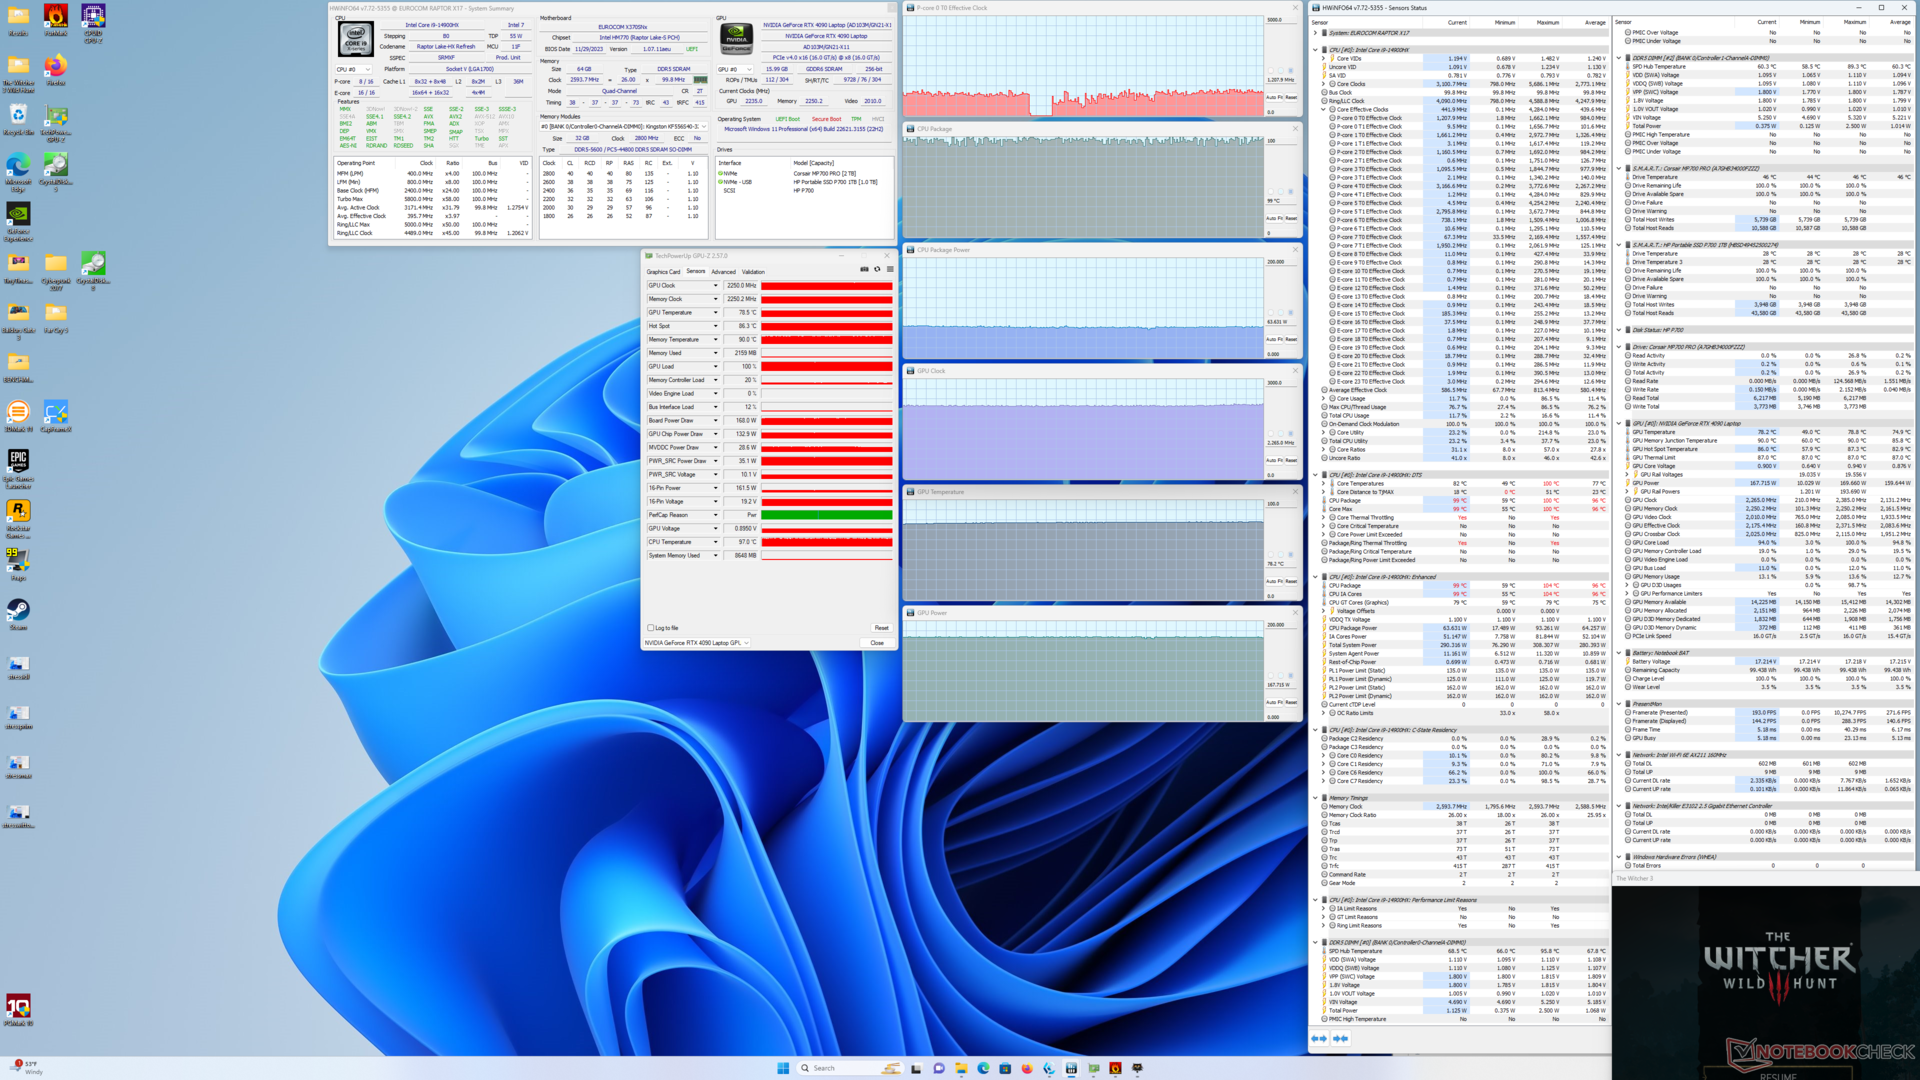

| CPU-klok (GHz) | GPU-klok (MHz) | Gemiddelde CPU-temperatuur (°C) | Gemiddelde GPU-temperatuur (°C) | |
| Systeem inactief | -- | -- | 51 | 41 |
| Prime95-stress | 3.1 | -- | 91 | 52 |
| Prime95 + FurMark-stress | 3.1 | 1000 - 2300 | 96 | 71 |
| Witcher 3 Belasting (Entertainment-modus) | ~1.3 | 2085 | 91 | 74 |
| Witcher 3 Belasting (prestatiemodus met maximaal ventilator uit) | 1.2 | 2250 | 99 | 78 |
| Witcher 3 Stress (prestatiemodus met maximaal ventilator aan) | 1.2 | 2205 | 97 | 78 |
| AIDA64 / Memory Copy | |
| MSI GE78HX 13VH-070US | |
| Eurocom Raptor X17 | |
| Eurocom Raptor X17 Core i9-14900HX | |
| Gemiddeld Intel Core i9-14900HX (38028 - 83392, n=36) | |
| Asus TUF Gaming A17 FA707XI-NS94 | |
| MSI Titan 18 HX A14VIG | |
| Asus ROG Strix Scar 17 G733PY-XS96 | |
| AIDA64 / Memory Read | |
| MSI GE78HX 13VH-070US | |
| Gemiddeld Intel Core i9-14900HX (43306 - 87568, n=36) | |
| Eurocom Raptor X17 | |
| Eurocom Raptor X17 Core i9-14900HX | |
| Asus TUF Gaming A17 FA707XI-NS94 | |
| Asus ROG Strix Scar 17 G733PY-XS96 | |
| MSI Titan 18 HX A14VIG | |
| AIDA64 / Memory Write | |
| MSI GE78HX 13VH-070US | |
| Eurocom Raptor X17 Core i9-14900HX | |
| Eurocom Raptor X17 | |
| Asus TUF Gaming A17 FA707XI-NS94 | |
| Gemiddeld Intel Core i9-14900HX (37146 - 80589, n=36) | |
| Asus ROG Strix Scar 17 G733PY-XS96 | |
| MSI Titan 18 HX A14VIG | |
| AIDA64 / Memory Latency | |
| MSI Titan 18 HX A14VIG | |
| Asus TUF Gaming A17 FA707XI-NS94 | |
| Eurocom Raptor X17 Core i9-14900HX | |
| Gemiddeld Intel Core i9-14900HX (76.1 - 105, n=36) | |
| MSI GE78HX 13VH-070US | |
| Eurocom Raptor X17 | |
| Asus ROG Strix Scar 17 G733PY-XS96 | |
* ... kleiner is beter
DPC latentie
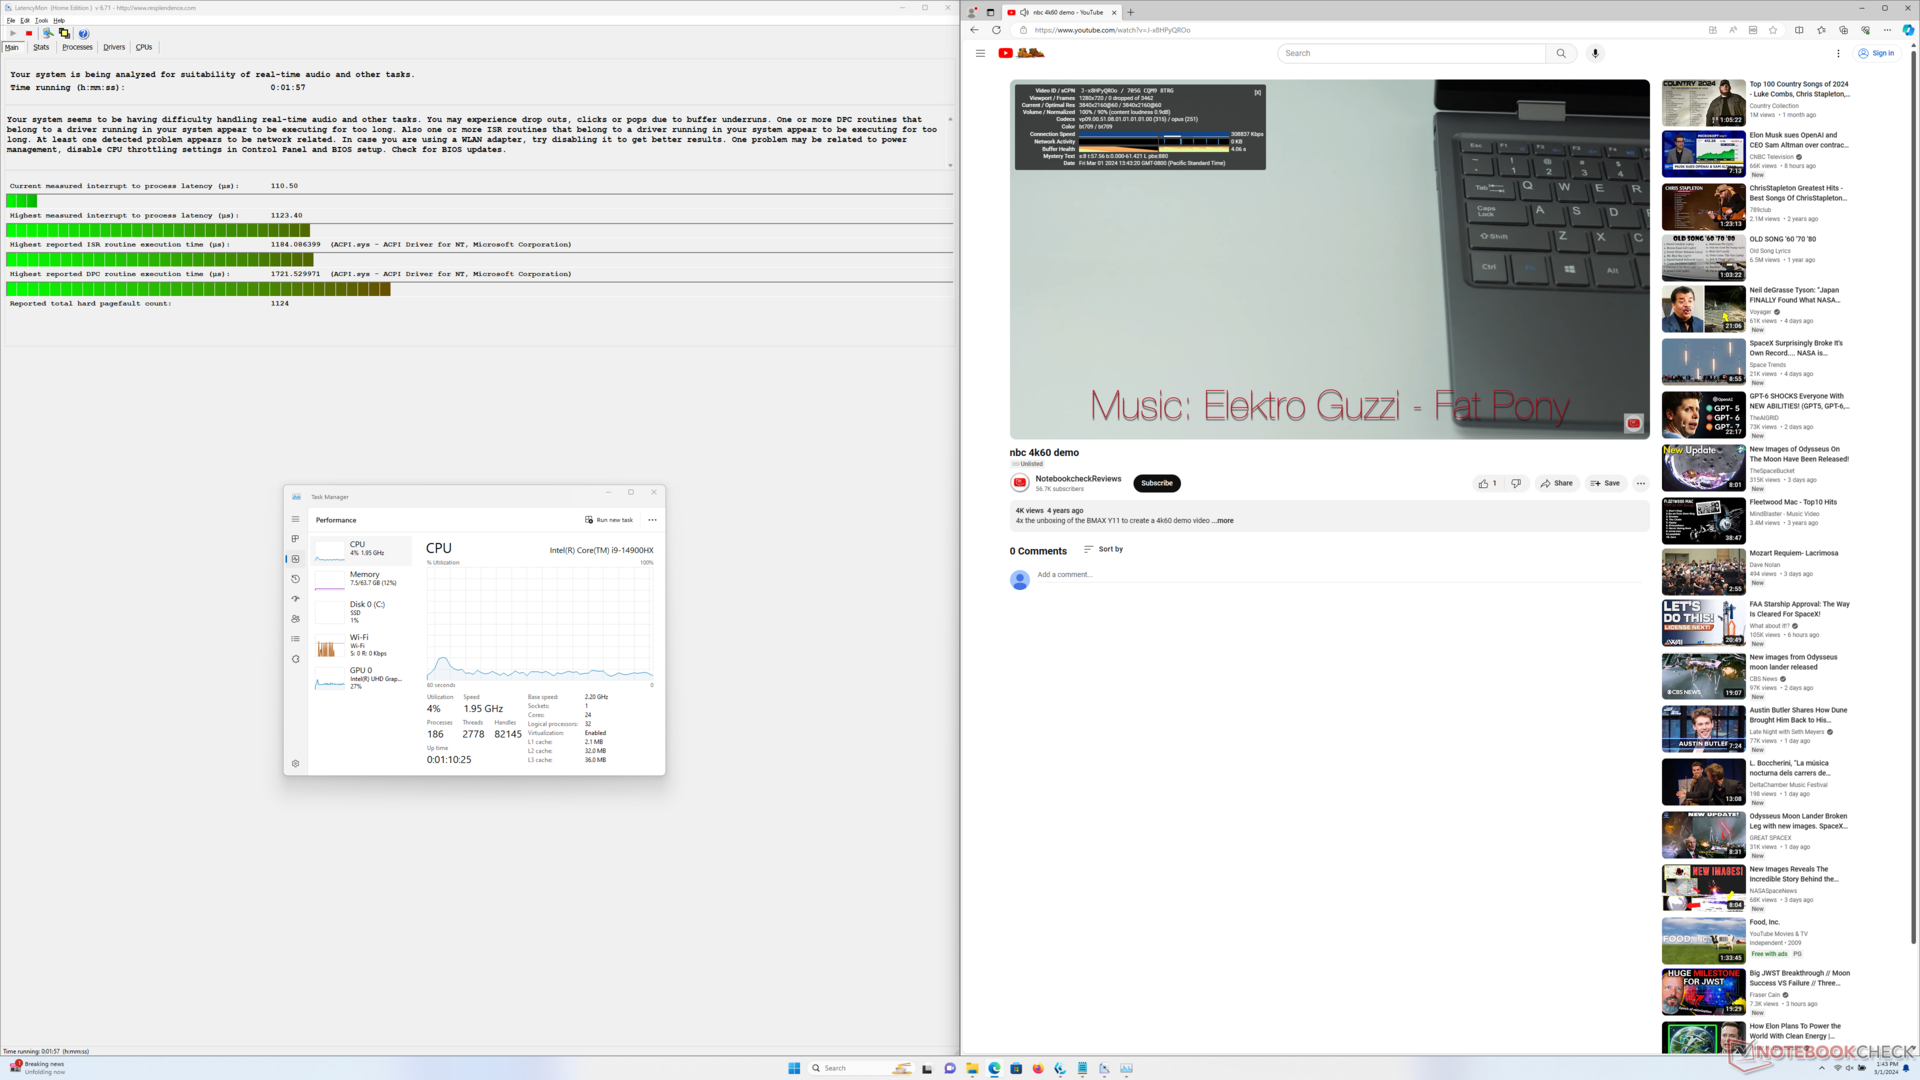
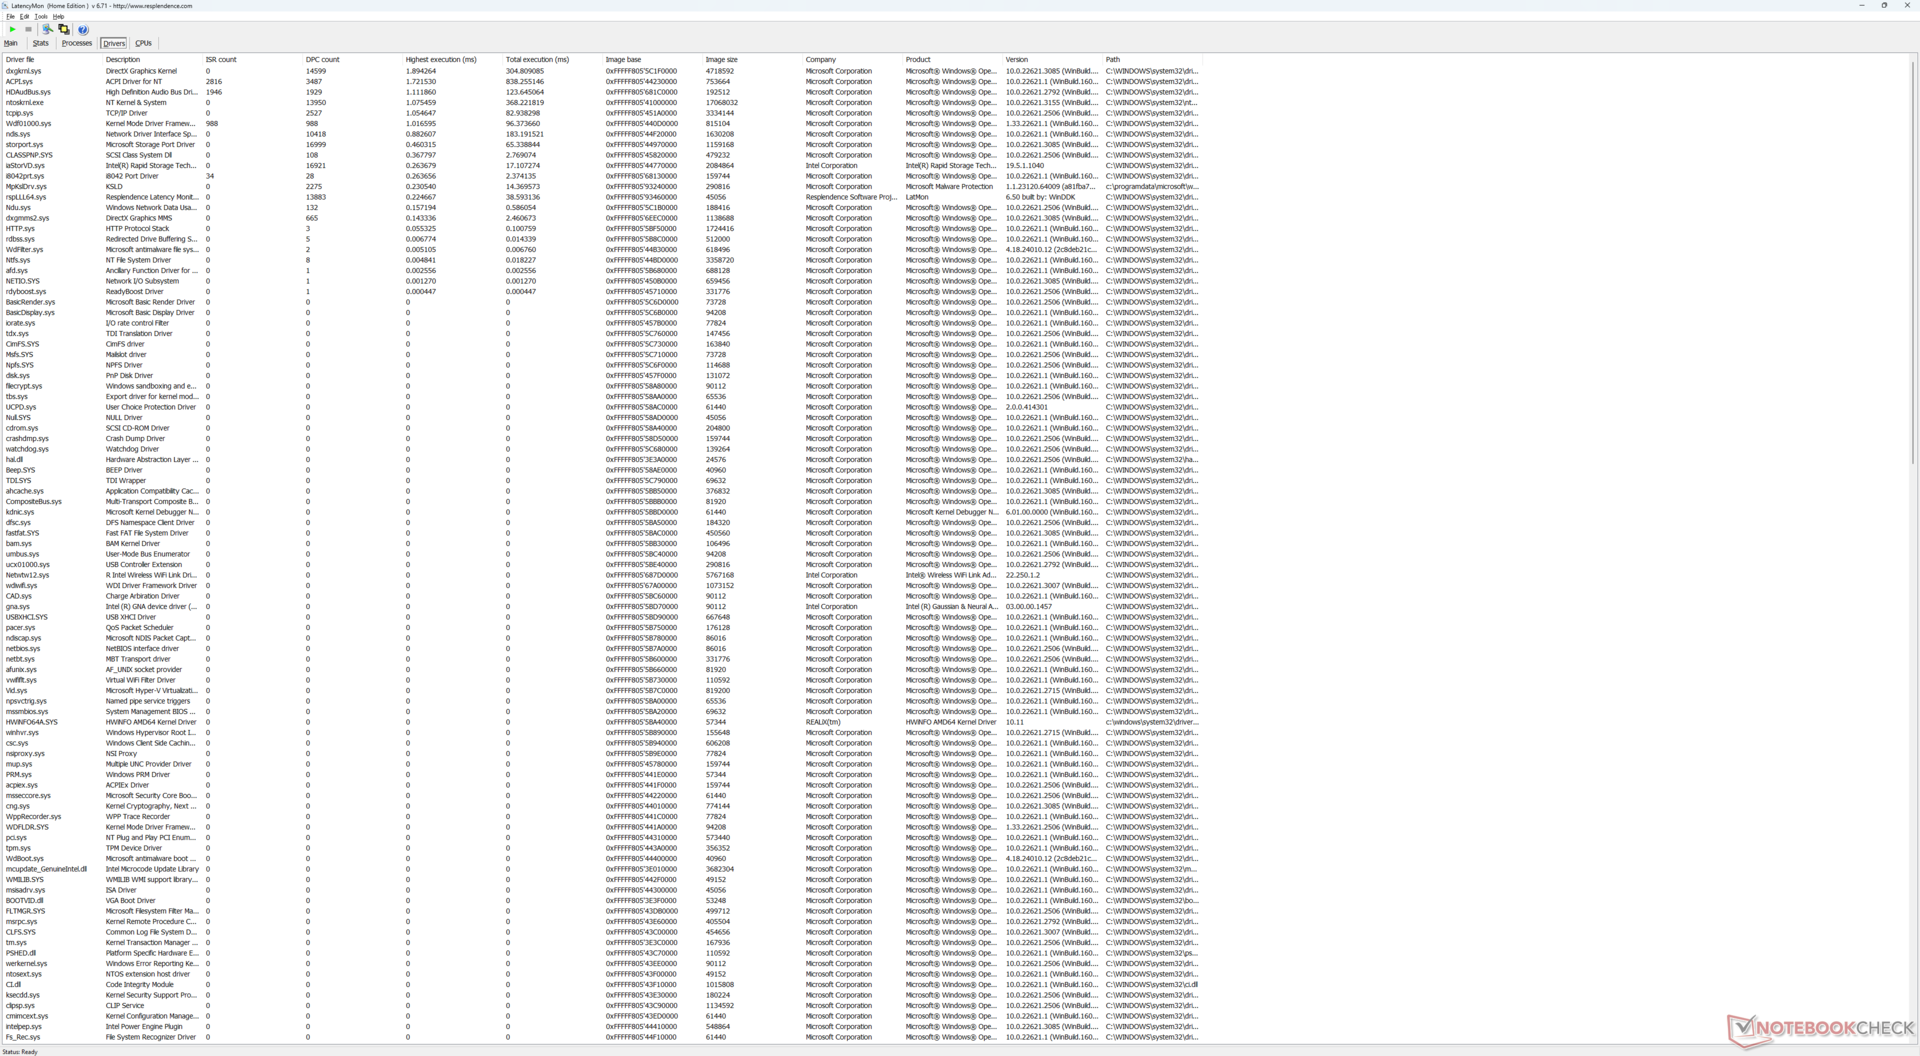
| DPC Latencies / LatencyMon - interrupt to process latency (max), Web, Youtube, Prime95 | |
| MSI GE78HX 13VH-070US | |
| Eurocom Raptor X17 | |
| MSI Titan 18 HX A14VIG | |
| Asus ROG Strix Scar 17 G733PY-XS96 | |
| Asus TUF Gaming A17 FA707XI-NS94 | |
| Eurocom Raptor X17 Core i9-14900HX | |
* ... kleiner is beter
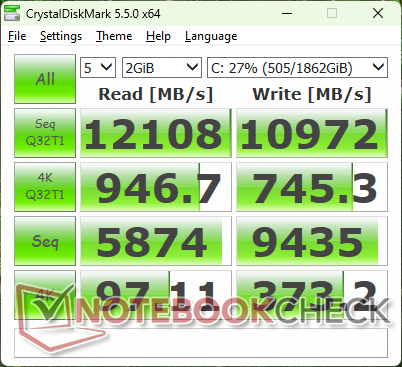
Opslagapparaten
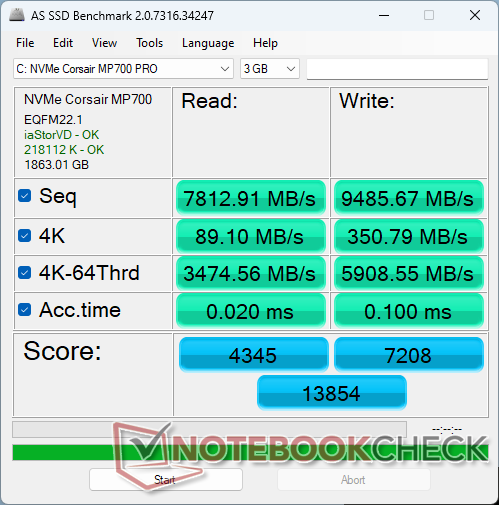
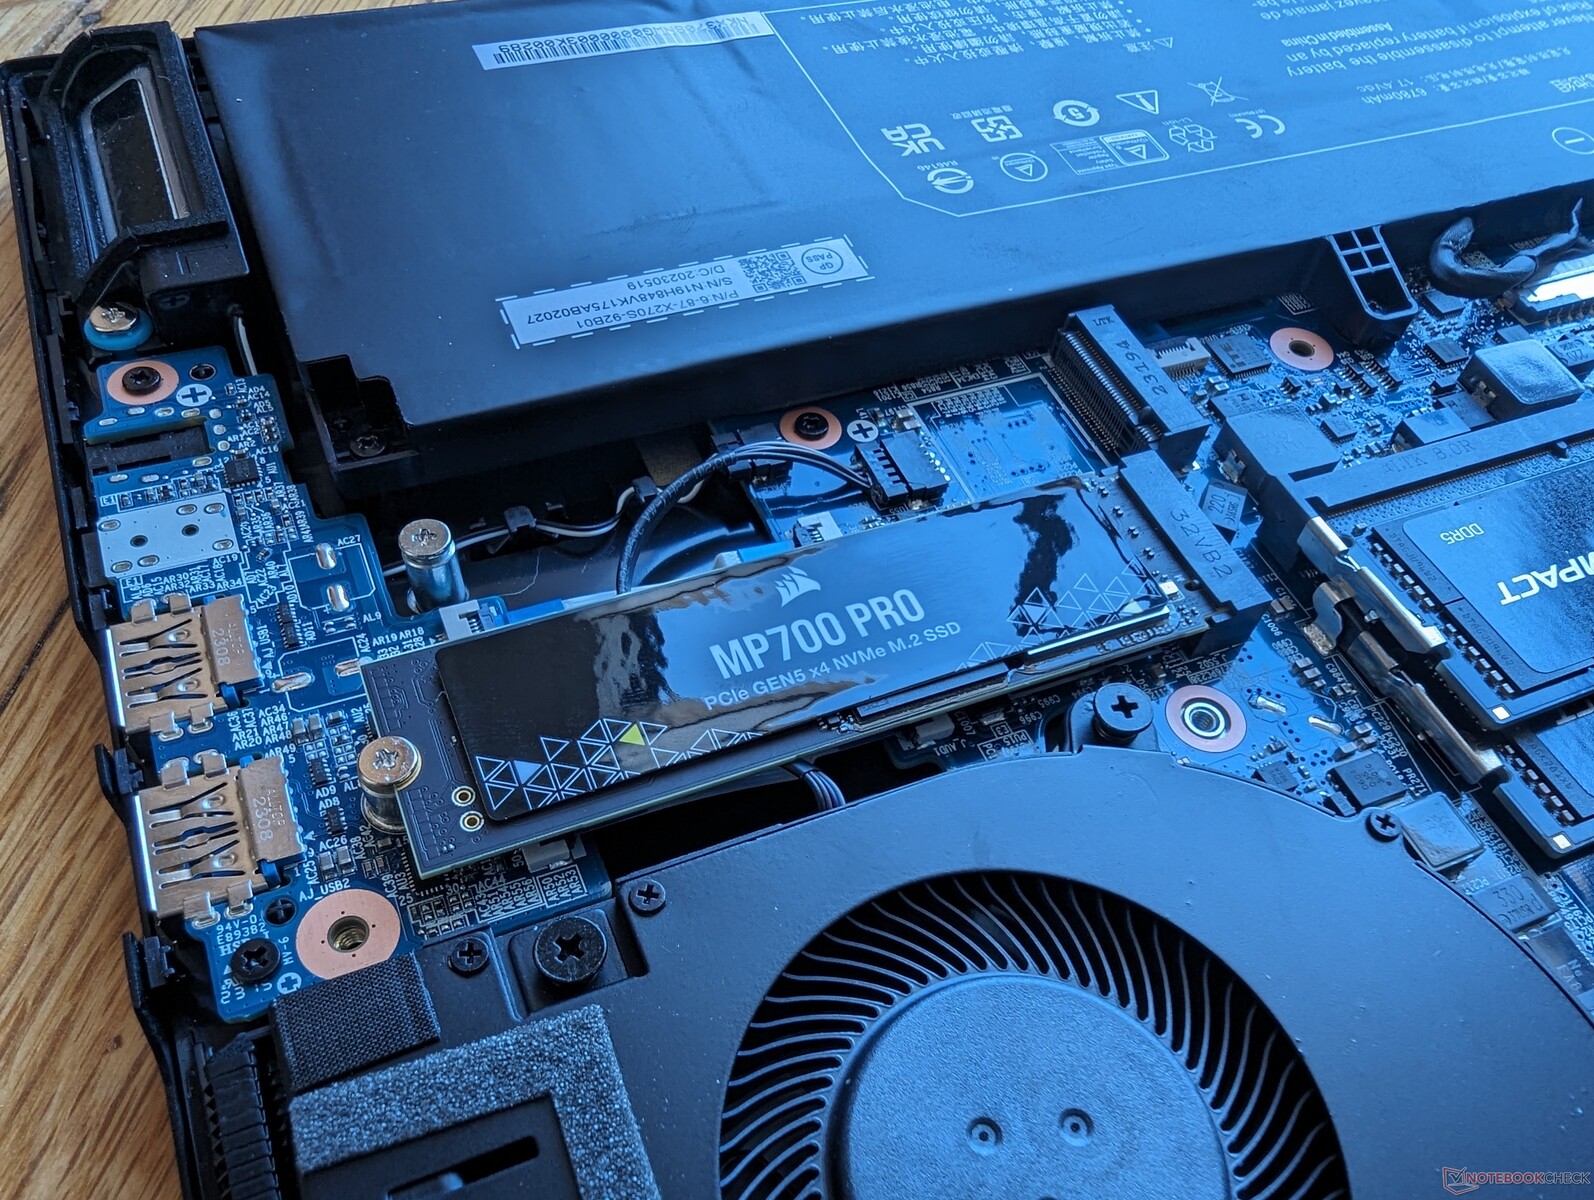
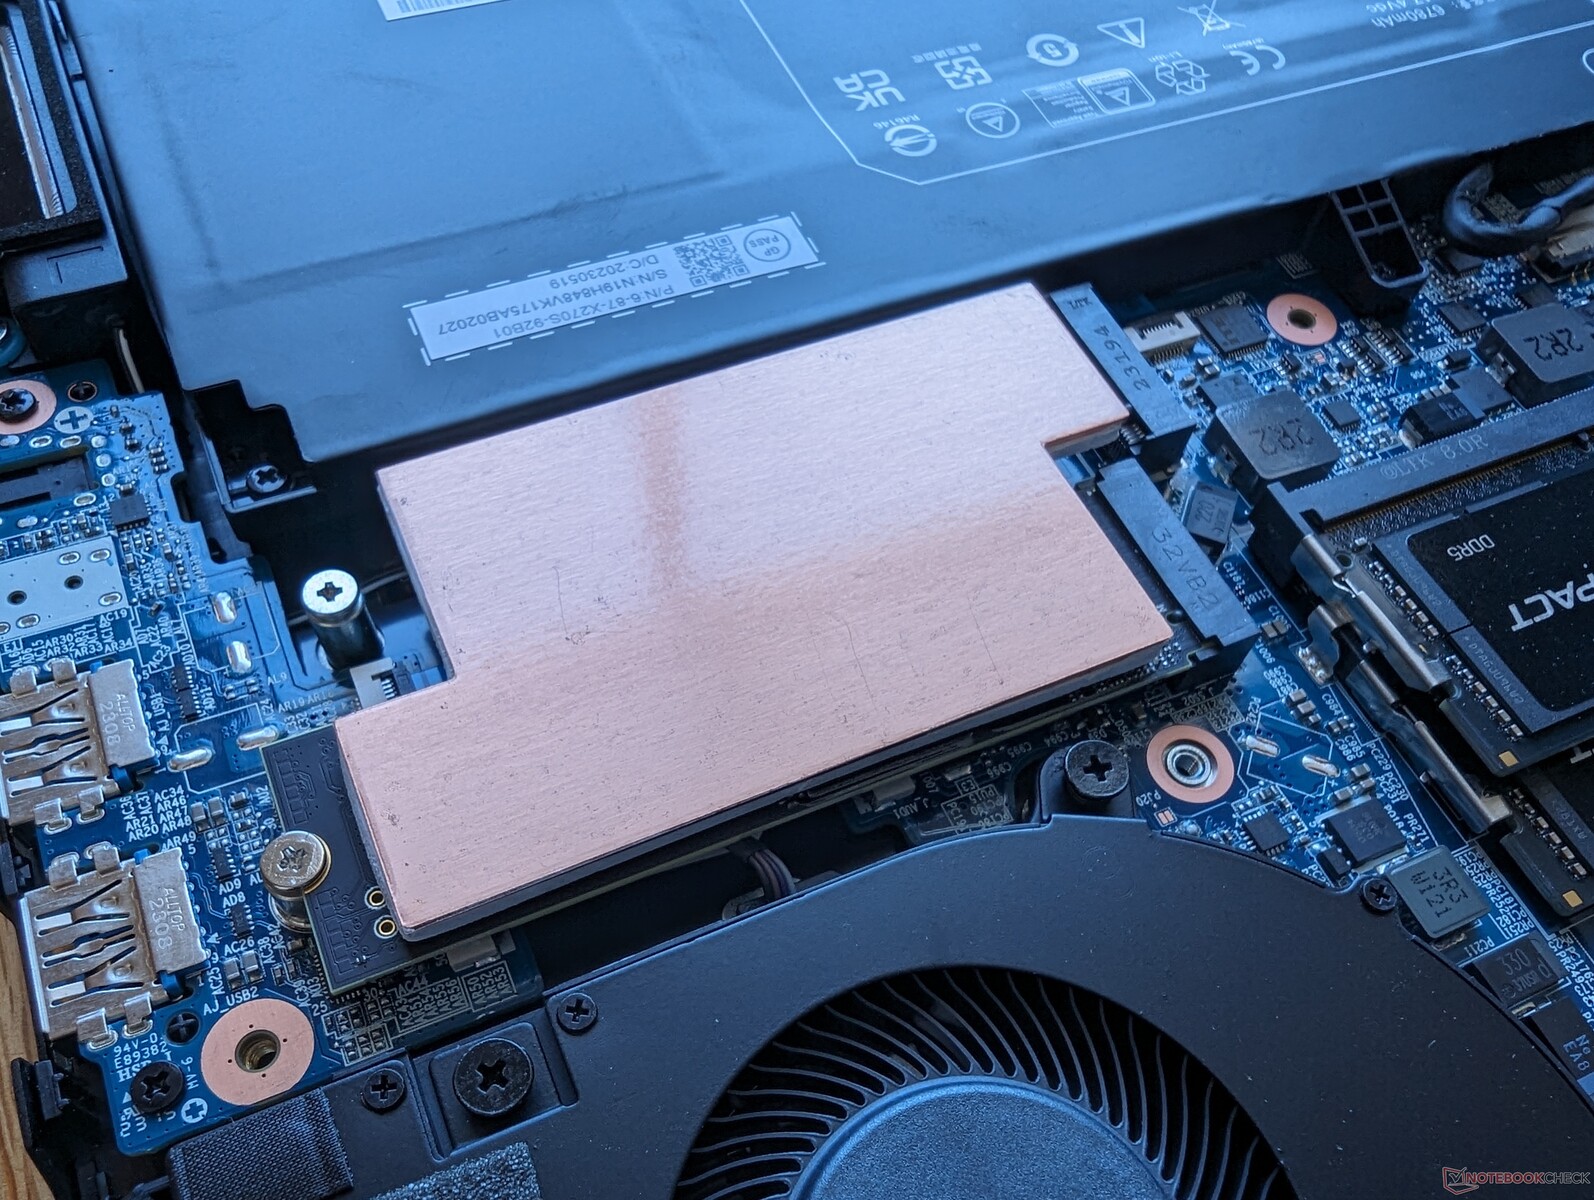
Eurocom is een van de weinige verkopers die configureert met een Corsair MP700 Pro PCI5 x4 NVMe SSD voor sequentiële leessnelheden tot 13000 MB/s, bijna 2x sneller dan de snelste PCIe4 drives. Om zulke hoge overdrachtssnelheden te kunnen handhaven, is echter een hitteverspreider nodig. Onze DiskSpd-lusresultaten hieronder tonen de prestatieverschillen met en zonder de hittespreider. Als er geen hittespreider is geïnstalleerd, zijn de maximale overdrachtsnelheden alleen haalbaar tijdens de eerste minuut of zo, voordat er gas wordt teruggenomen naar het bereik van 3500 MB/s tot 6500 MB/s. Door de heat spreader te installeren kan de schijf veel sneller en langer werken.

| Drive Performance rating - Percent | |
| Eurocom Raptor X17 Core i9-14900HX | |
| Eurocom Raptor X17 | |
| MSI GE78HX 13VH-070US | |
| MSI Titan 18 HX A14VIG | |
| Asus ROG Strix Scar 17 G733PY-XS96 | |
| Asus TUF Gaming A17 FA707XI-NS94 | |
* ... kleiner is beter
Disk Throttling: DiskSpd Read Loop, Queue Depth 8
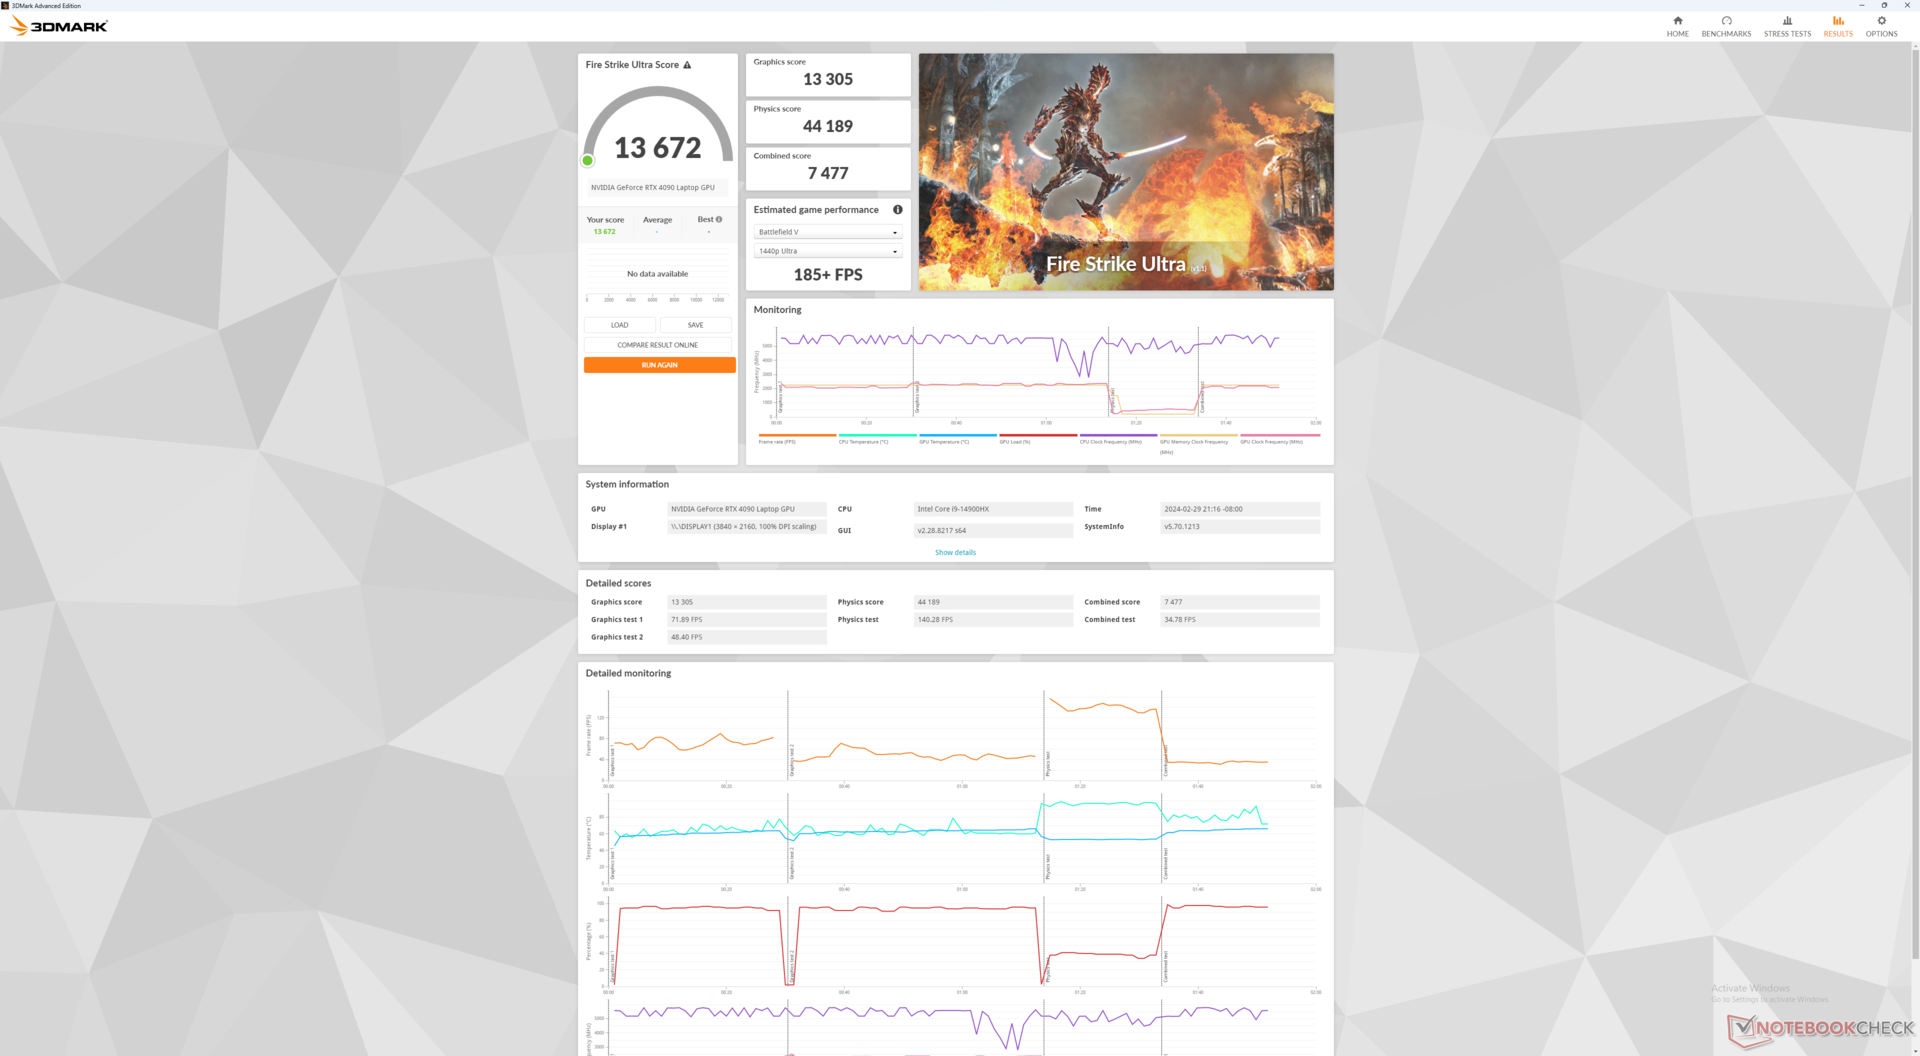
GPU-prestaties
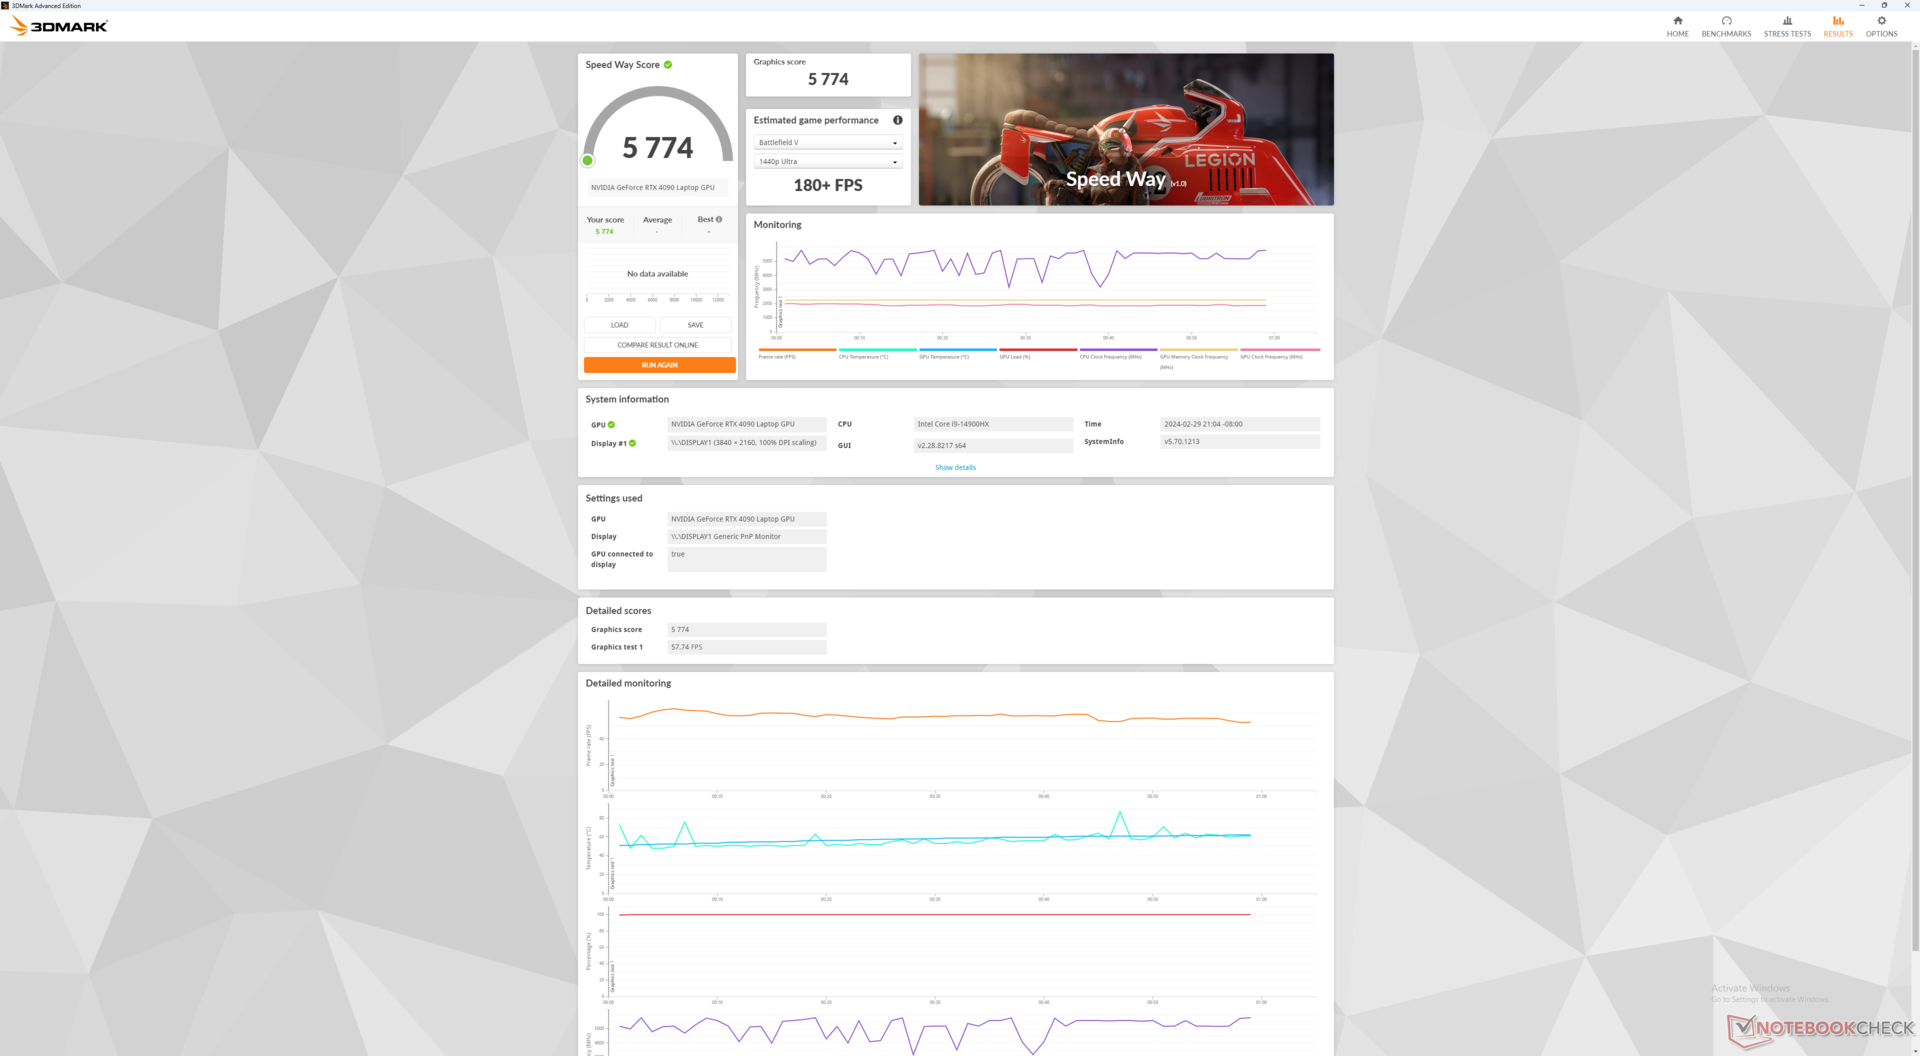
Onze 175 W GeForce RTX 4090 GPU is ongeveer 5 procent sneller dan de Raptor X17 van vorig jaar. Hij doet min of meer niet onder voor de MSI Titan 18 HX die groter en duurder is dan onze Eurocom-eenheid.
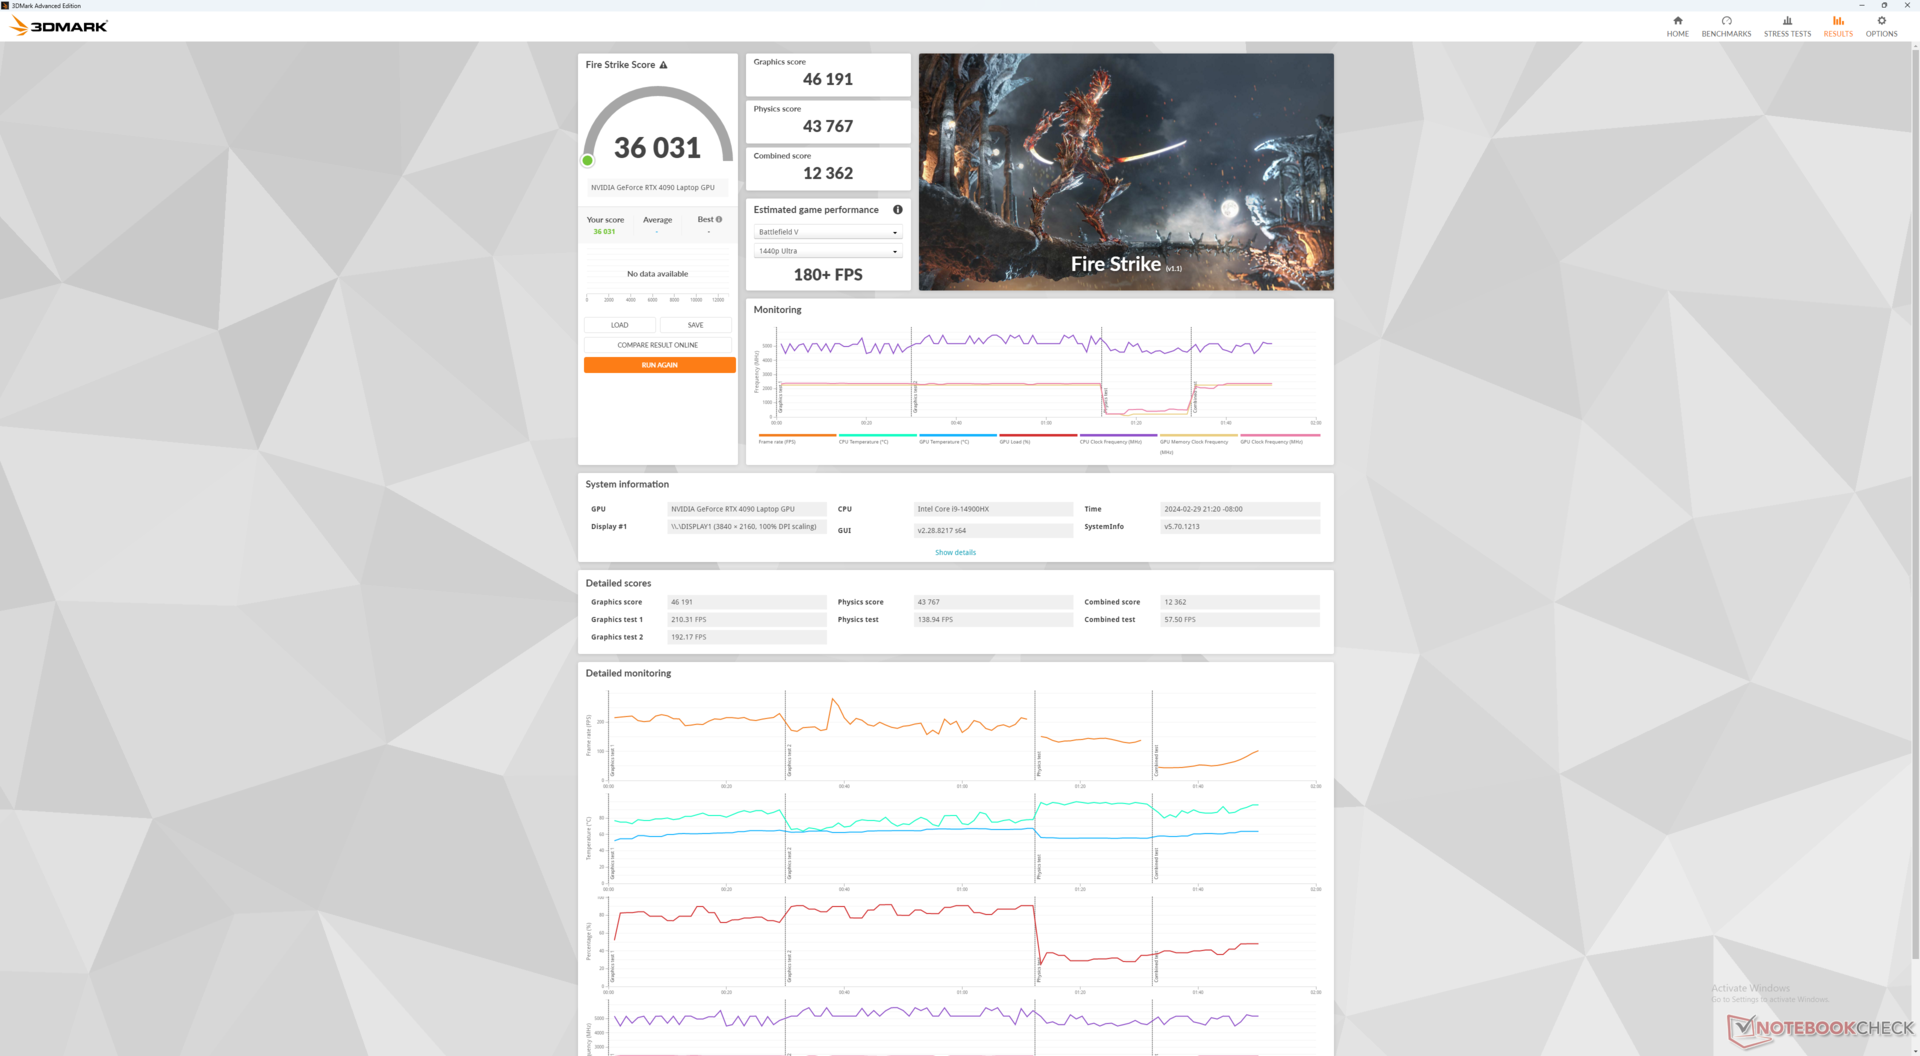
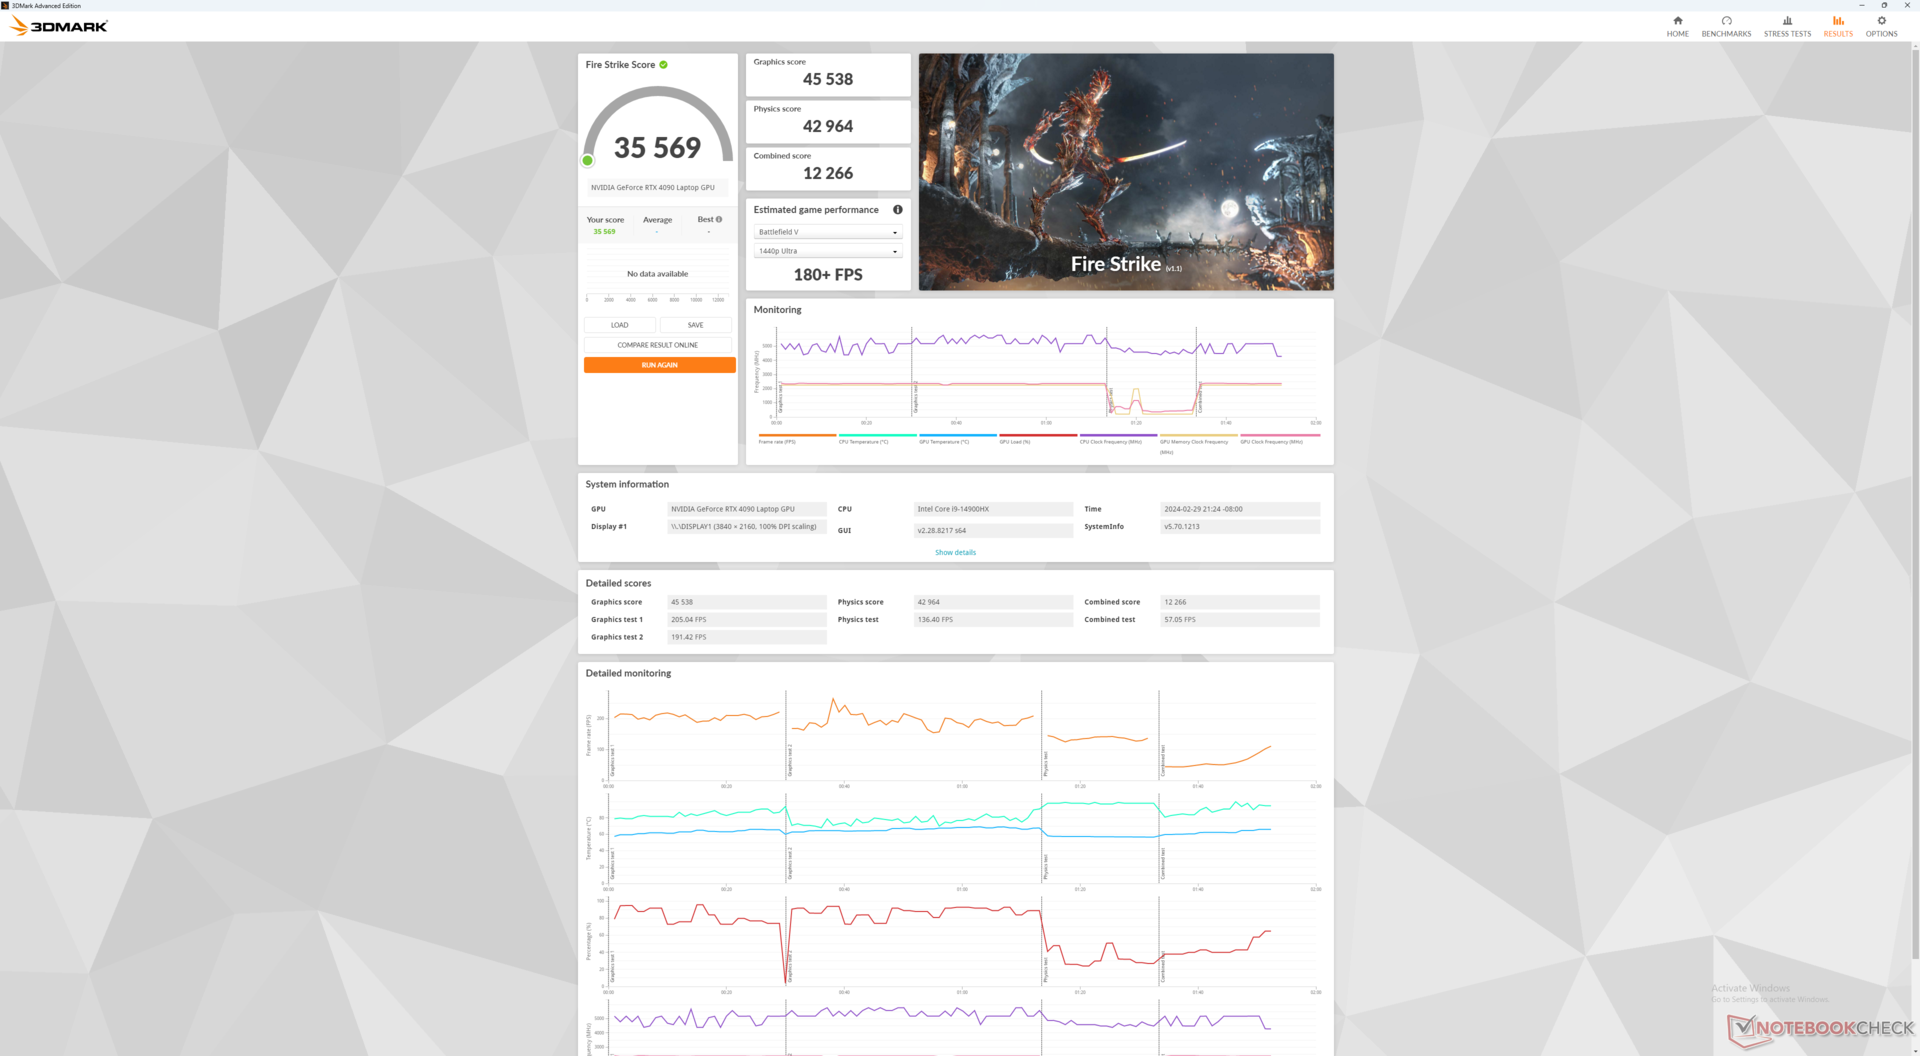
Houd er rekening mee dat het inschakelen van de maximale ventilatormodus de prestaties niet merkbaar verhoogt, zoals blijkt uit onze onderstaande Fire Strike resultatentabel. De modus is daarom niet essentieel voor het maximaliseren van de prestaties op standaardinstellingen. Het terugschakelen naar de Entertainment-modus heeft echter een grotere invloed op de prestaties.
| Vermogen Profiel | Grafische Score | Fysica Score | Gecombineerde Score |
| Prestatiemodus met maximale ventilator aan | 46191 | 43767 | 12362 |
| Prestatiemodus met maximale ventilator uit | 45538 (-1%) | 42964 (-2%) | 12266 (-1%) |
| Windows Gebalanceerde modus | 45892 (-1%) | 42567 (-3%) | 13382 (-0%) |
| Entertainment-modus | 44593 (-4%) | 36839 (-16%) | 9640 (-22%) |
| Batterijvermogen | 7324 (-84%) | 14932 (-66%) | 1901 (-85%) |
Desondanks hebben we verschillende problemen ondervonden die het vermelden waard zijn. Ubisoft Connect startte telkens niet op, Final Fantasy XV crashte op hoge instellingen en PCMark 10 crashte ook, zelfs na het updaten naar de nieuwste versie.
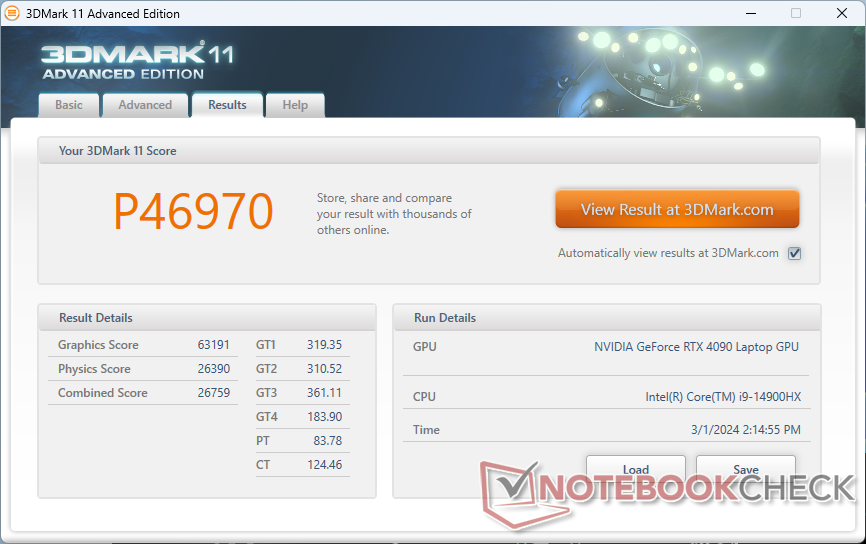
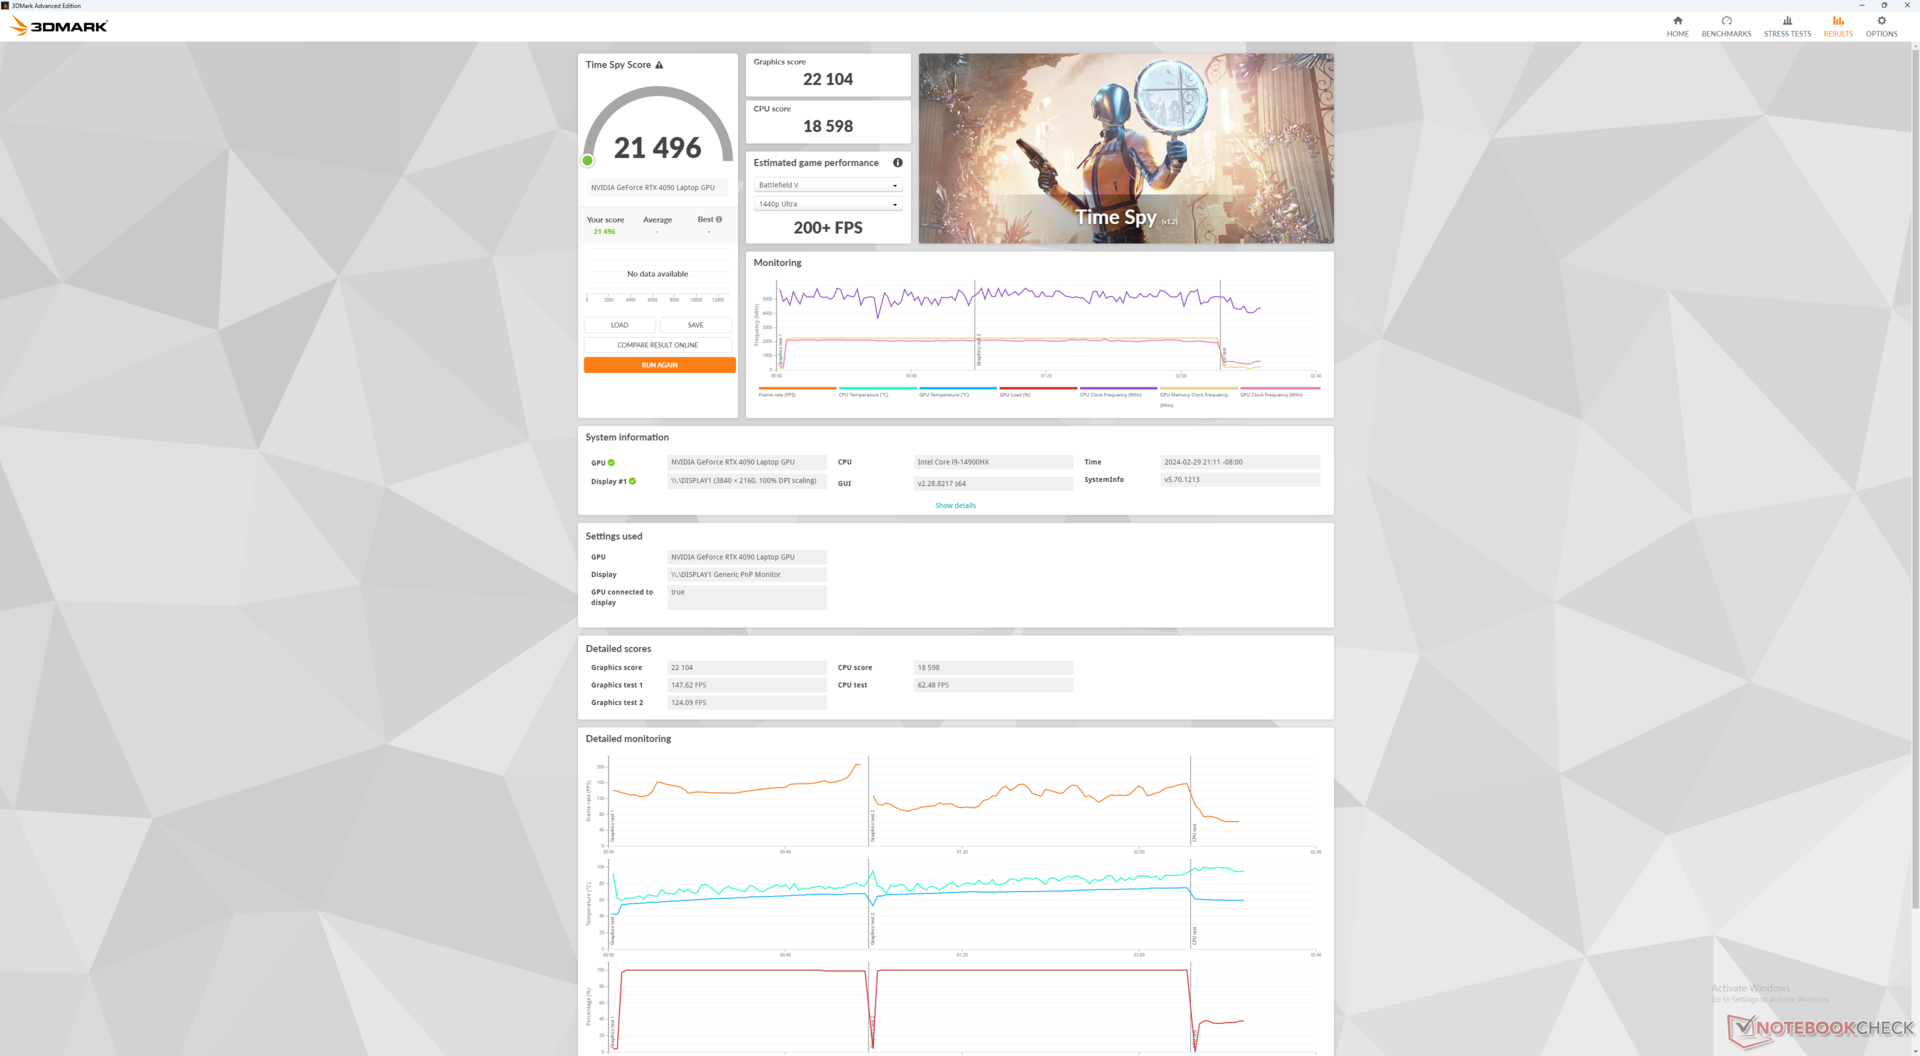
| 3DMark 11 Performance | 46970 punten | |
| 3DMark Fire Strike Score | 36031 punten | |
| 3DMark Time Spy Score | 21496 punten | |
Help | ||
* ... kleiner is beter
| Performance rating - Percent | |
| Eurocom Raptor X17 Core i9-14900HX -1! | |
| MSI Titan 18 HX A14VIG | |
| Eurocom Raptor X17 | |
| Asus ROG Strix Scar 17 G733PY-XS96 -1! | |
| MSI GE78HX 13VH-070US | |
| Asus TUF Gaming A17 FA707XI-NS94 -1! | |
| The Witcher 3 - 1920x1080 Ultra Graphics & Postprocessing (HBAO+) | |
| MSI Titan 18 HX A14VIG | |
| Eurocom Raptor X17 | |
| Asus ROG Strix Scar 17 G733PY-XS96 | |
| Eurocom Raptor X17 Core i9-14900HX | |
| MSI GE78HX 13VH-070US | |
| Asus TUF Gaming A17 FA707XI-NS94 | |
| GTA V - 1920x1080 Highest AA:4xMSAA + FX AF:16x | |
| Eurocom Raptor X17 Core i9-14900HX | |
| Eurocom Raptor X17 | |
| MSI Titan 18 HX A14VIG | |
| Asus ROG Strix Scar 17 G733PY-XS96 | |
| MSI GE78HX 13VH-070US | |
| Final Fantasy XV Benchmark - 1920x1080 High Quality | |
| MSI Titan 18 HX A14VIG | |
| Eurocom Raptor X17 | |
| Asus ROG Strix Scar 17 G733PY-XS96 | |
| MSI GE78HX 13VH-070US | |
| Asus TUF Gaming A17 FA707XI-NS94 | |
| Strange Brigade - 1920x1080 ultra AA:ultra AF:16 | |
| Eurocom Raptor X17 Core i9-14900HX | |
| MSI Titan 18 HX A14VIG | |
| Eurocom Raptor X17 | |
| MSI GE78HX 13VH-070US | |
| Asus TUF Gaming A17 FA707XI-NS94 | |
| Dota 2 Reborn - 1920x1080 ultra (3/3) best looking | |
| Eurocom Raptor X17 Core i9-14900HX | |
| Eurocom Raptor X17 | |
| MSI Titan 18 HX A14VIG | |
| MSI GE78HX 13VH-070US | |
| Asus ROG Strix Scar 17 G733PY-XS96 | |
| Asus TUF Gaming A17 FA707XI-NS94 | |
| X-Plane 11.11 - 1920x1080 high (fps_test=3) | |
| Eurocom Raptor X17 Core i9-14900HX | |
| Eurocom Raptor X17 | |
| MSI GE78HX 13VH-070US | |
| MSI Titan 18 HX A14VIG | |
| Asus ROG Strix Scar 17 G733PY-XS96 | |
| Asus TUF Gaming A17 FA707XI-NS94 | |
Witcher 3 FPS Chart
| lage | gem. | hoge | ultra | QHD | 4K | |
|---|---|---|---|---|---|---|
| GTA V (2015) | 187.6 | 186.9 | 185.8 | 152.2 | 145.7 | 178.8 |
| The Witcher 3 (2015) | 688.1 | 591.6 | 423.9 | 200 | 149.7 | |
| Dota 2 Reborn (2015) | 254 | 224 | 212 | 195.2 | 195 | |
| X-Plane 11.11 (2018) | 221 | 193.1 | 150.2 | 126.7 | ||
| Far Cry 5 (2018) | 222 | 195 | 186 | 174 | 171 | 113 |
| Strange Brigade (2018) | 567 | 459 | 433 | 402 | 309 | 156.8 |
| F1 22 (2022) | 360 | 331 | 116.3 | 87.8 | 44.2 | |
| Baldur's Gate 3 (2023) | 244.1 | 217.9 | 203.8 | 200.4 | 148.9 | 75.6 |
| Cyberpunk 2077 (2023) | 195.2 | 185.2 | 164.5 | 144.7 | 93.8 | 41.4 |
Uitstoot
Systeemgeluid - Luider dan veel andere gaming laptops
De ventilatoren pulseerden lang niet zo vaak als bij het model van vorig jaar. Bij het opstarten van 3DMark 06 bijvoorbeeld, bleven de ventilatoren langere tijd stiller voordat ze langzaam omhoog schoten, terwijl het model 2023 piekte tot bijna 60 dB(A). Verder stabiliseert het ventilatorgeluid zich tussen de twee modellen op ongeveer dezelfde waarden bij veeleisende belastingen zoals games.
Gamen in de modus Entertainment is iets stiller dan gamen in de modus Performance (58,3 dB(A) vs. 61,4 dB(A)). Vergeet niet dat de modus Entertainment, zoals hierboven vermeld, ten koste gaat van de prestaties.
Geluidsniveau
| Onbelast |
| 31.7 / 31.7 / 32.9 dB (A) |
| Belasting |
| 34 / 61.6 dB (A) |
 | ||
30 dB stil 40 dB(A) hoorbaar 50 dB(A) luid |
||
min: | ||
| Eurocom Raptor X17 Core i9-14900HX GeForce RTX 4090 Laptop GPU, i9-14900HX, Corsair MP700 Pro 2TB | Eurocom Raptor X17 GeForce RTX 4090 Laptop GPU, i9-13900HX, 3x Samsung SSD 980 Pro 1TB (RAID 0) | Asus TUF Gaming A17 FA707XI-NS94 GeForce RTX 4070 Laptop GPU, R9 7940HS, WD PC SN560 SDDPNQE-1T00 | Asus ROG Strix Scar 17 G733PY-XS96 GeForce RTX 4090 Laptop GPU, R9 7945HX, SK hynix PC801 HFS001TEJ9X101N | MSI GE78HX 13VH-070US GeForce RTX 4080 Laptop GPU, i9-13950HX, Samsung PM9A1 MZVL22T0HBLB | MSI Titan 18 HX A14VIG GeForce RTX 4090 Laptop GPU, i9-14900HX, 2x Samsung PM9A1a MZVL22T0HDLB (RAID 0) | |
|---|---|---|---|---|---|---|
| Noise | -15% | 3% | 14% | 5% | 9% | |
| uit / omgeving * (dB) | 23.7 | 23.3 2% | 27.9 -18% | 22.7 4% | 23.4 1% | 22.8 4% |
| Idle Minimum * (dB) | 31.7 | 33.1 -4% | 28.5 10% | 23.5 26% | 24.2 24% | 23.8 25% |
| Idle Average * (dB) | 31.7 | 33.1 -4% | 29.8 6% | 27.7 13% | 25.6 19% | 23.8 25% |
| Idle Maximum * (dB) | 32.9 | 40.7 -24% | 29.8 9% | 27.7 16% | 31 6% | 28 15% |
| Load Average * (dB) | 34 | 59.9 -76% | 34.8 -2% | 30.5 10% | 43.3 -27% | 38 -12% |
| Witcher 3 ultra * (dB) | 61.6 | 60.8 1% | 57.1 7% | 51.4 17% | 56.3 9% | 57.3 7% |
| Load Maximum * (dB) | 61.6 | 61 1% | 57.3 7% | 54.1 12% | 59.1 4% | 62.8 -2% |
* ... kleiner is beter
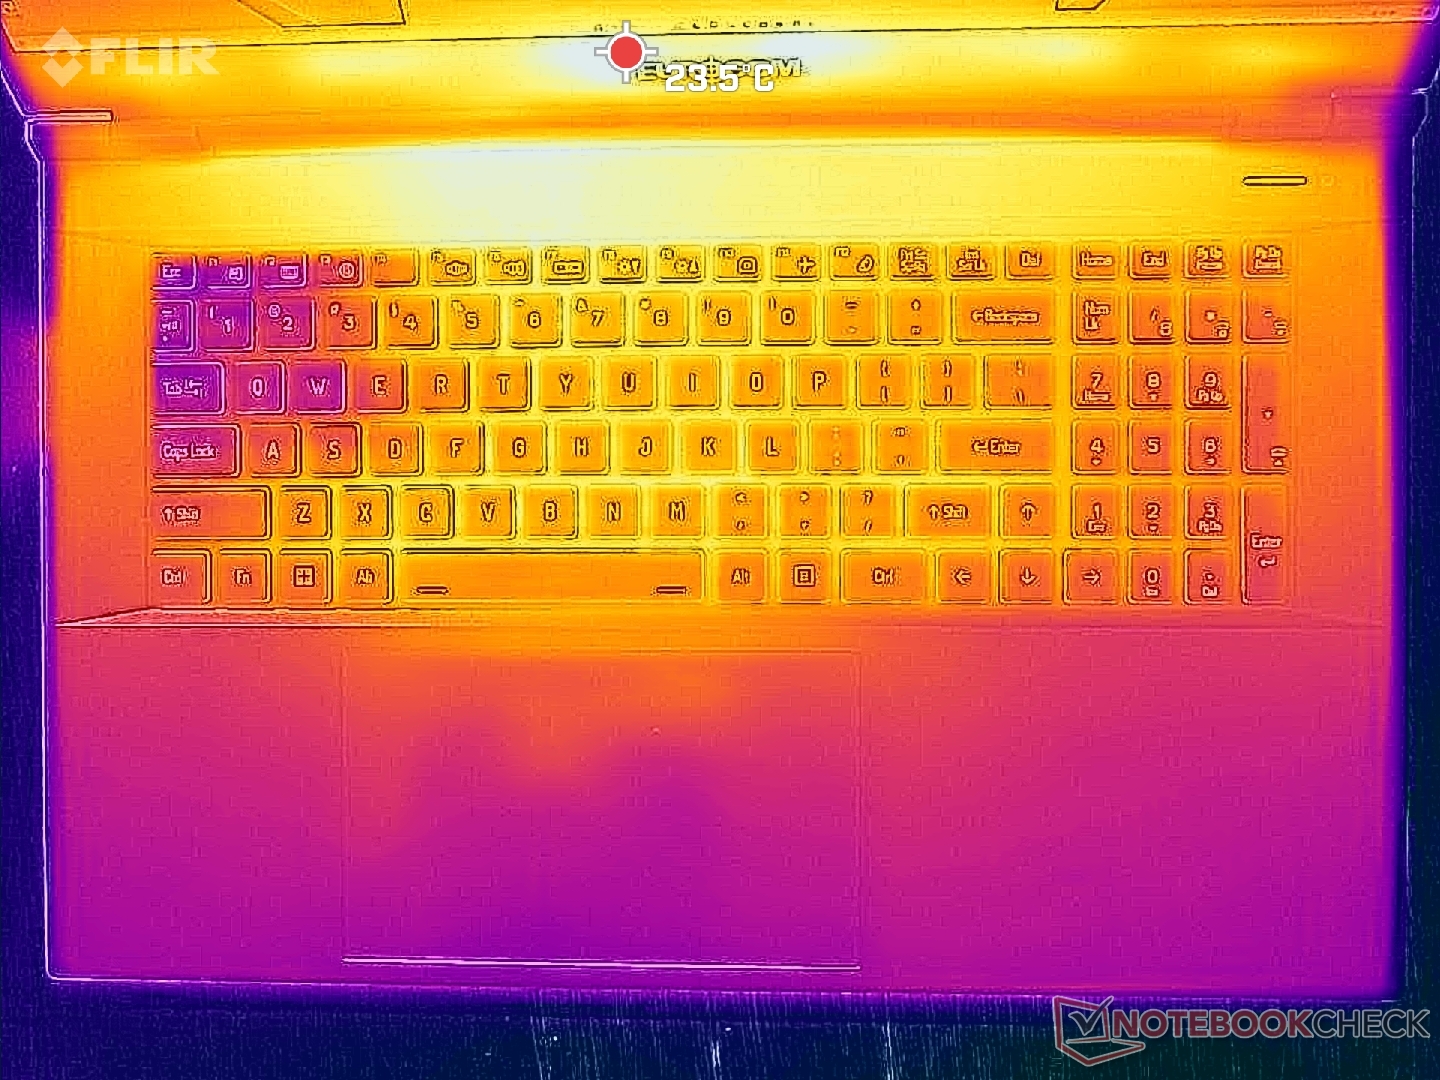
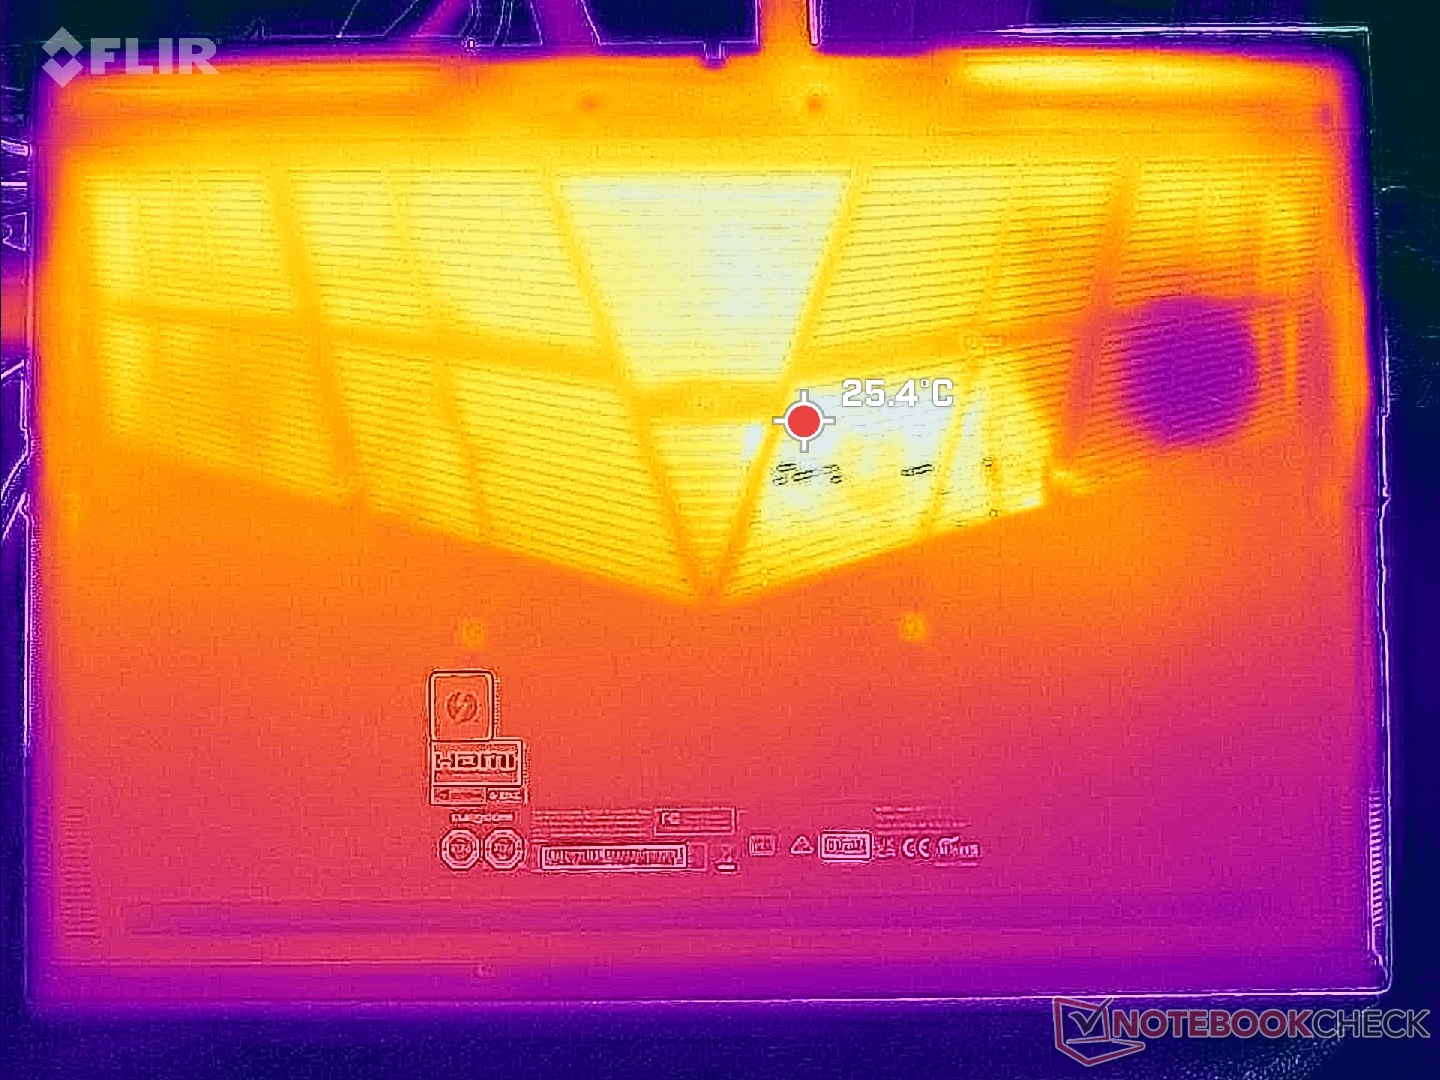
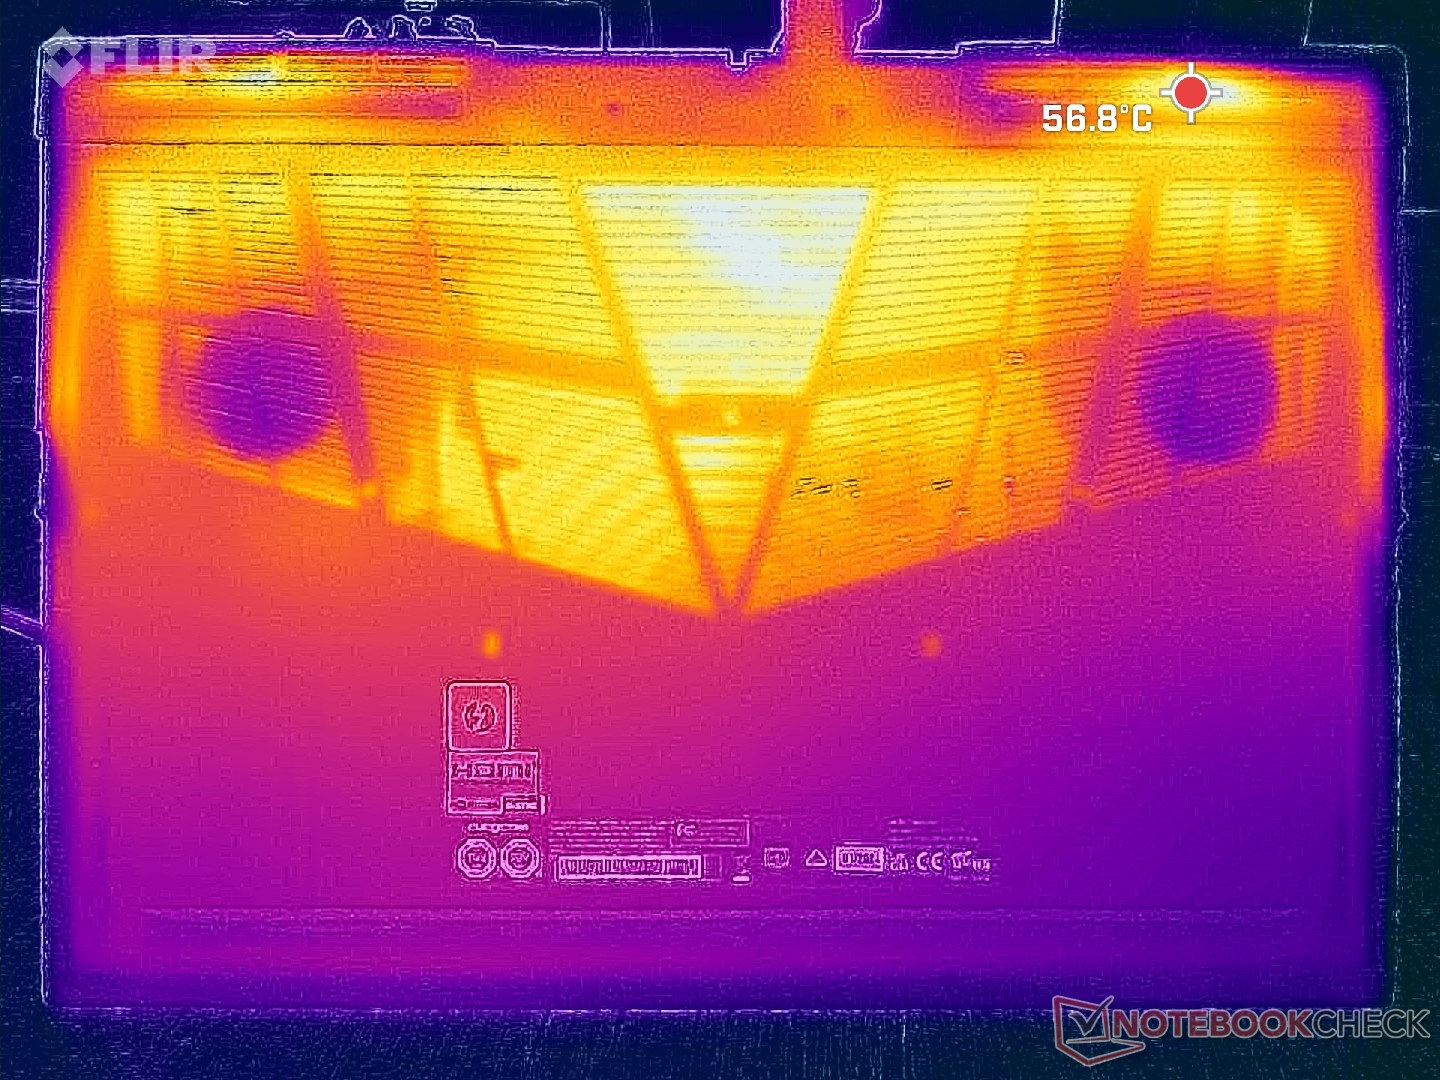
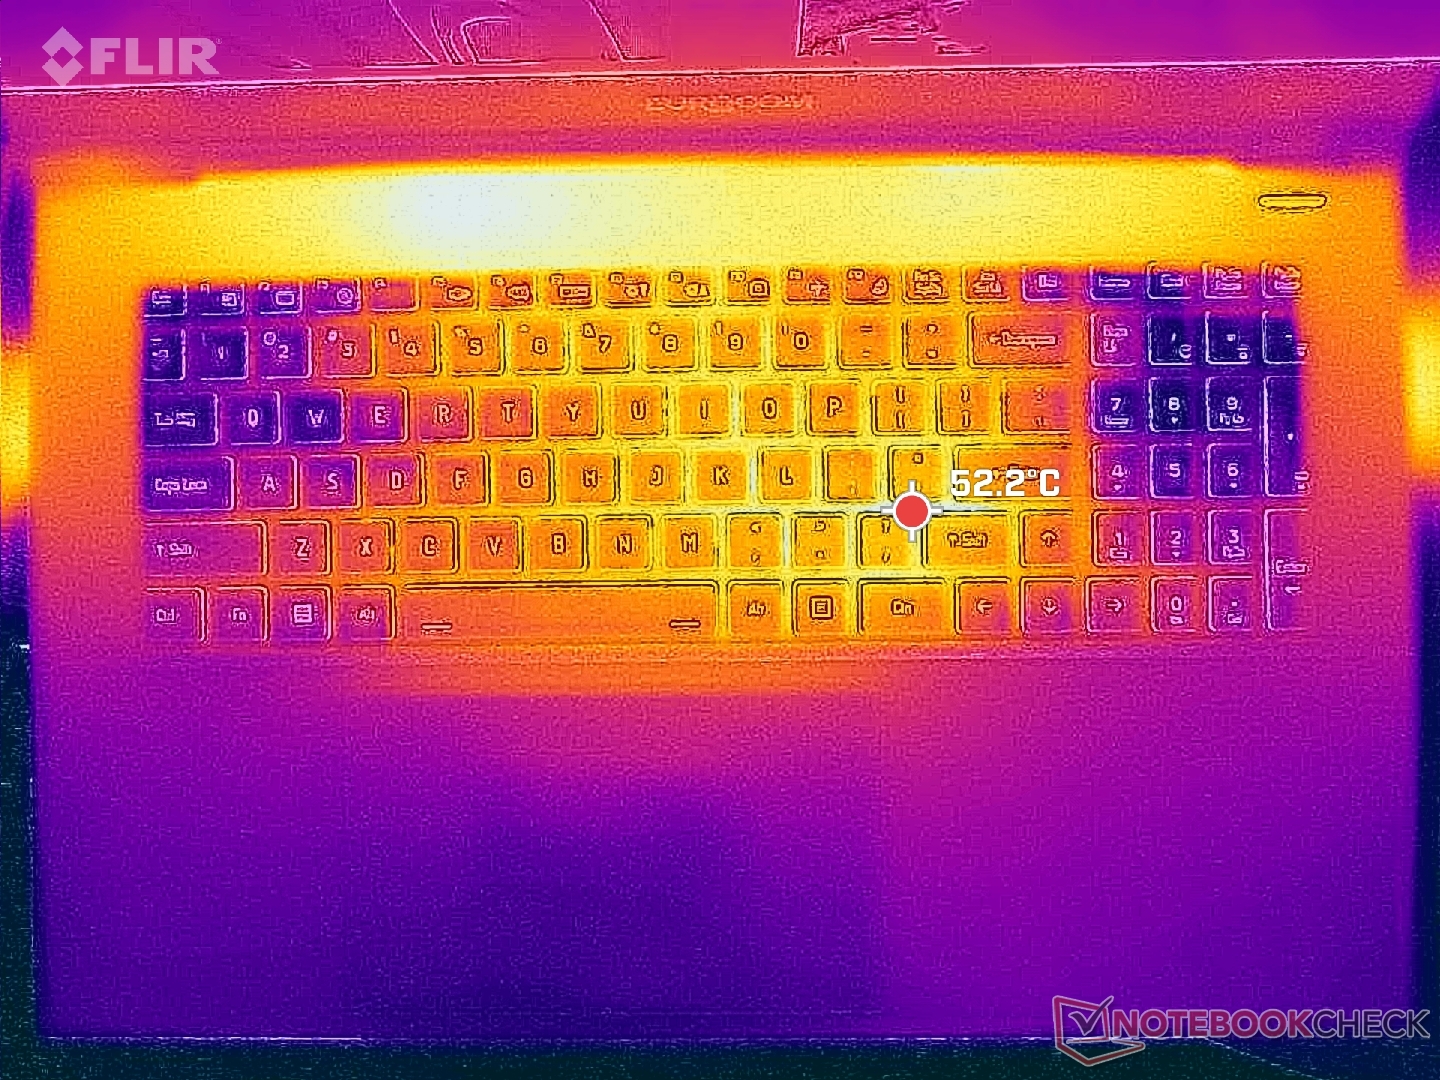
Temperatuur
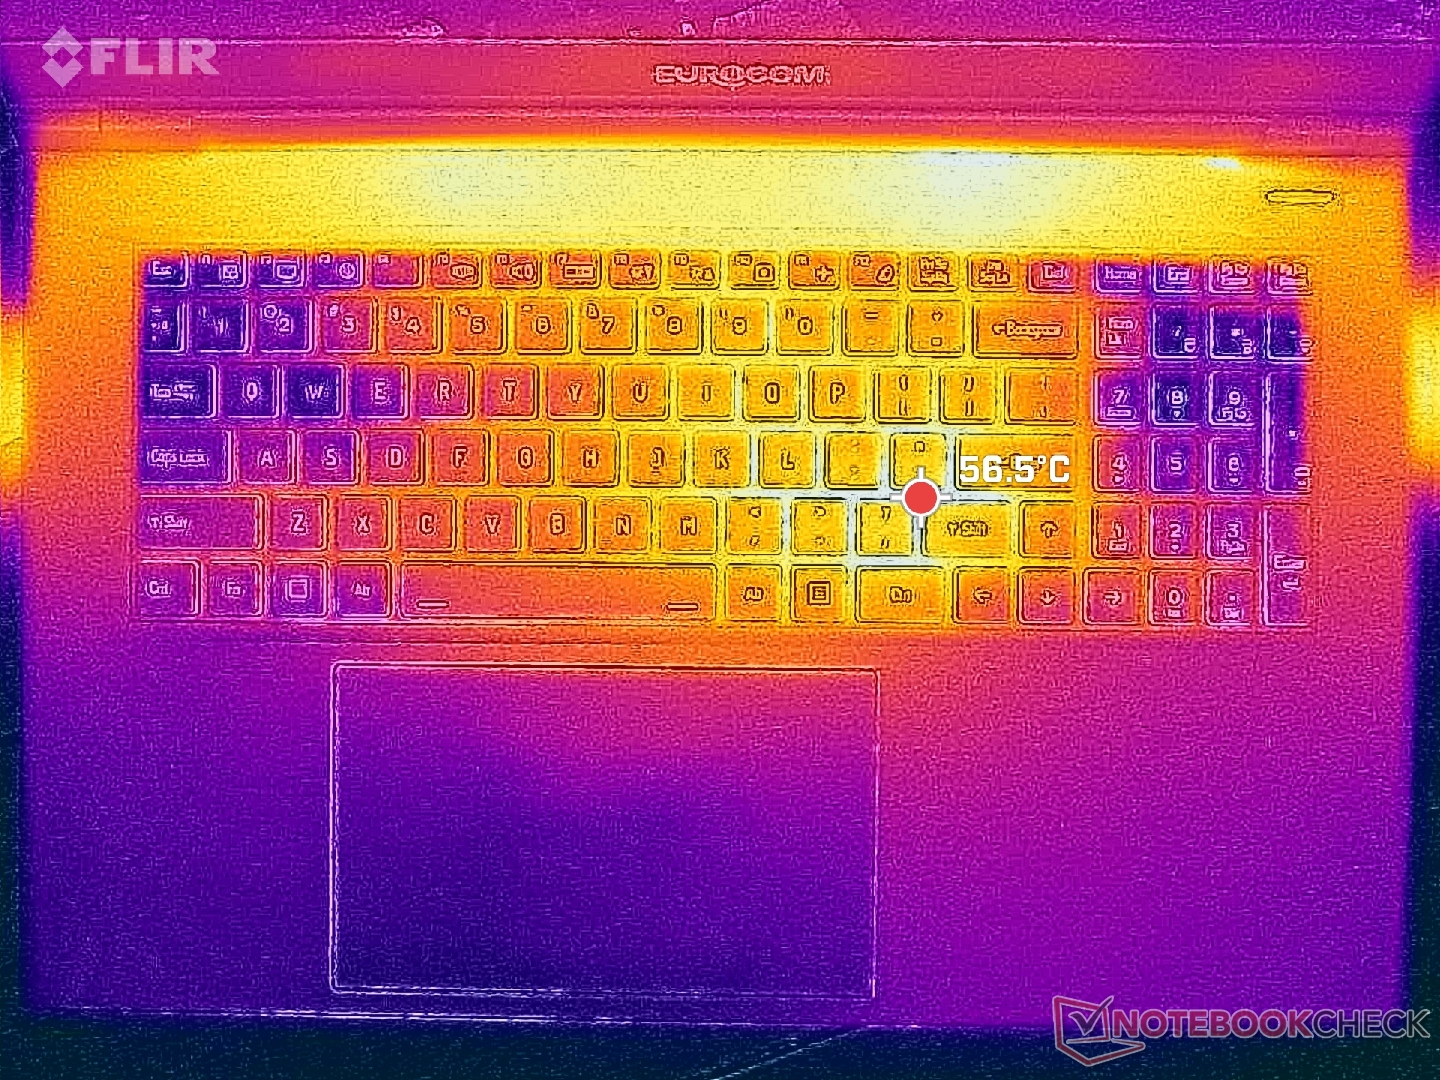
De hotspots op de oppervlaktetemperatuur zijn merkbaar warmer dan op andere gaminglaptops. Met name bepaalde delen van het toetsenbord kunnen tijdens het gamen wel 53 C warm worden, vergeleken met slechts 37 C of 40 C op de MSI GE78HX of Asus TUF Gaming A17.
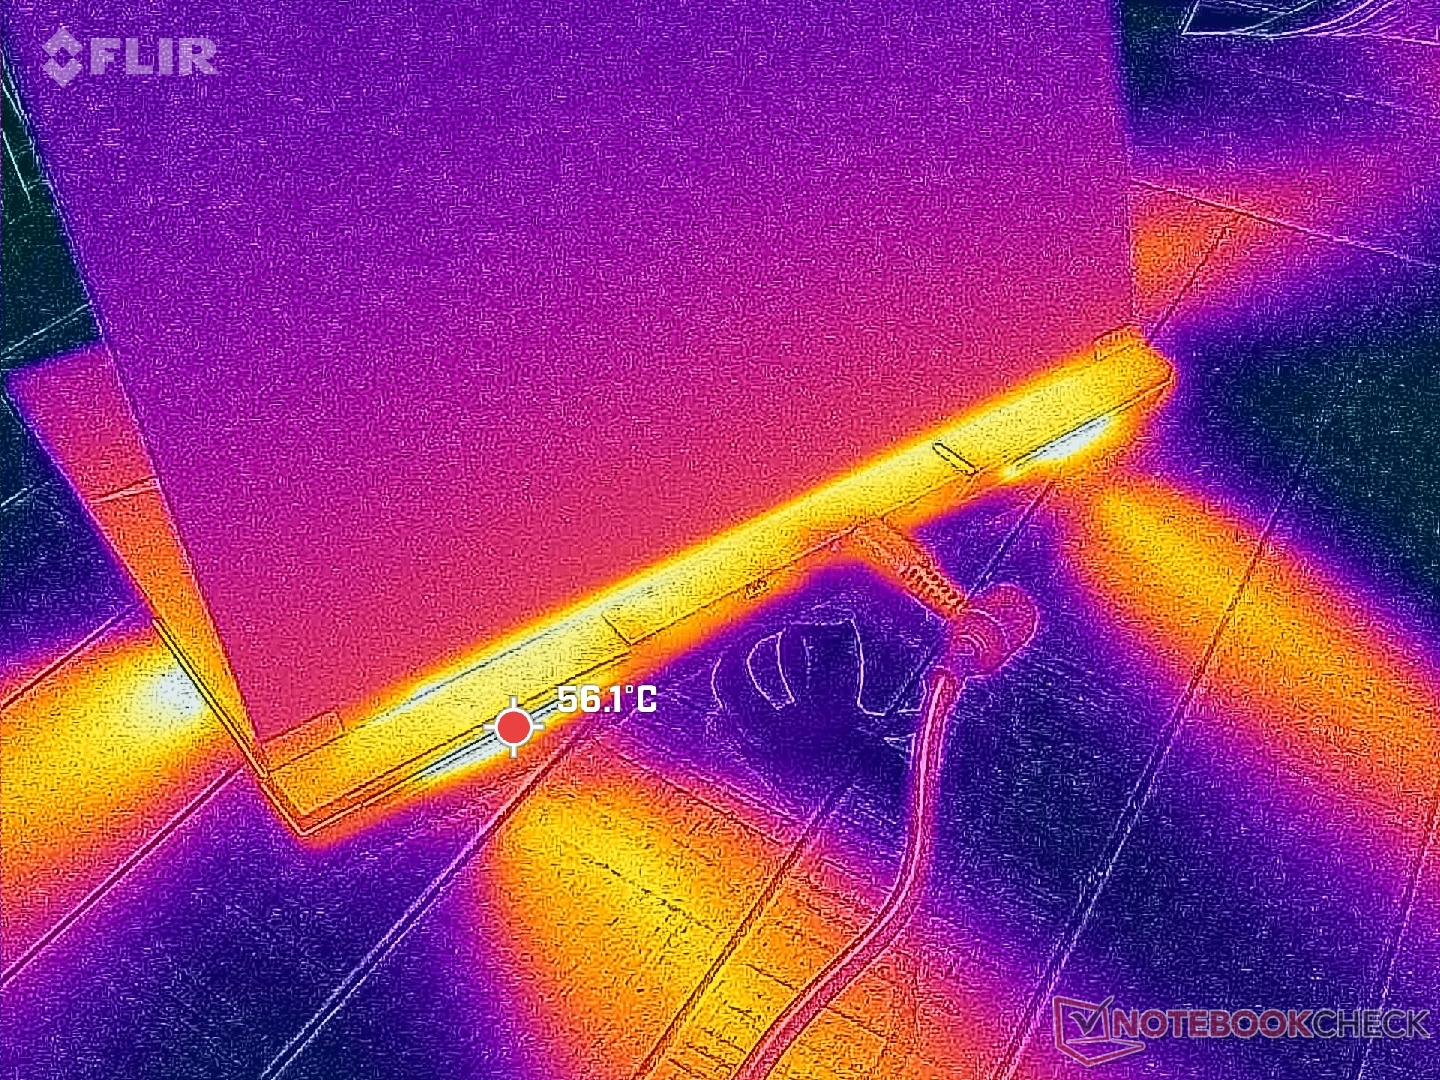
(-) De maximumtemperatuur aan de bovenzijde bedraagt 52.2 °C / 126 F, vergeleken met het gemiddelde van 40.4 °C / 105 F, variërend van 21.2 tot 68.8 °C voor de klasse Gaming.
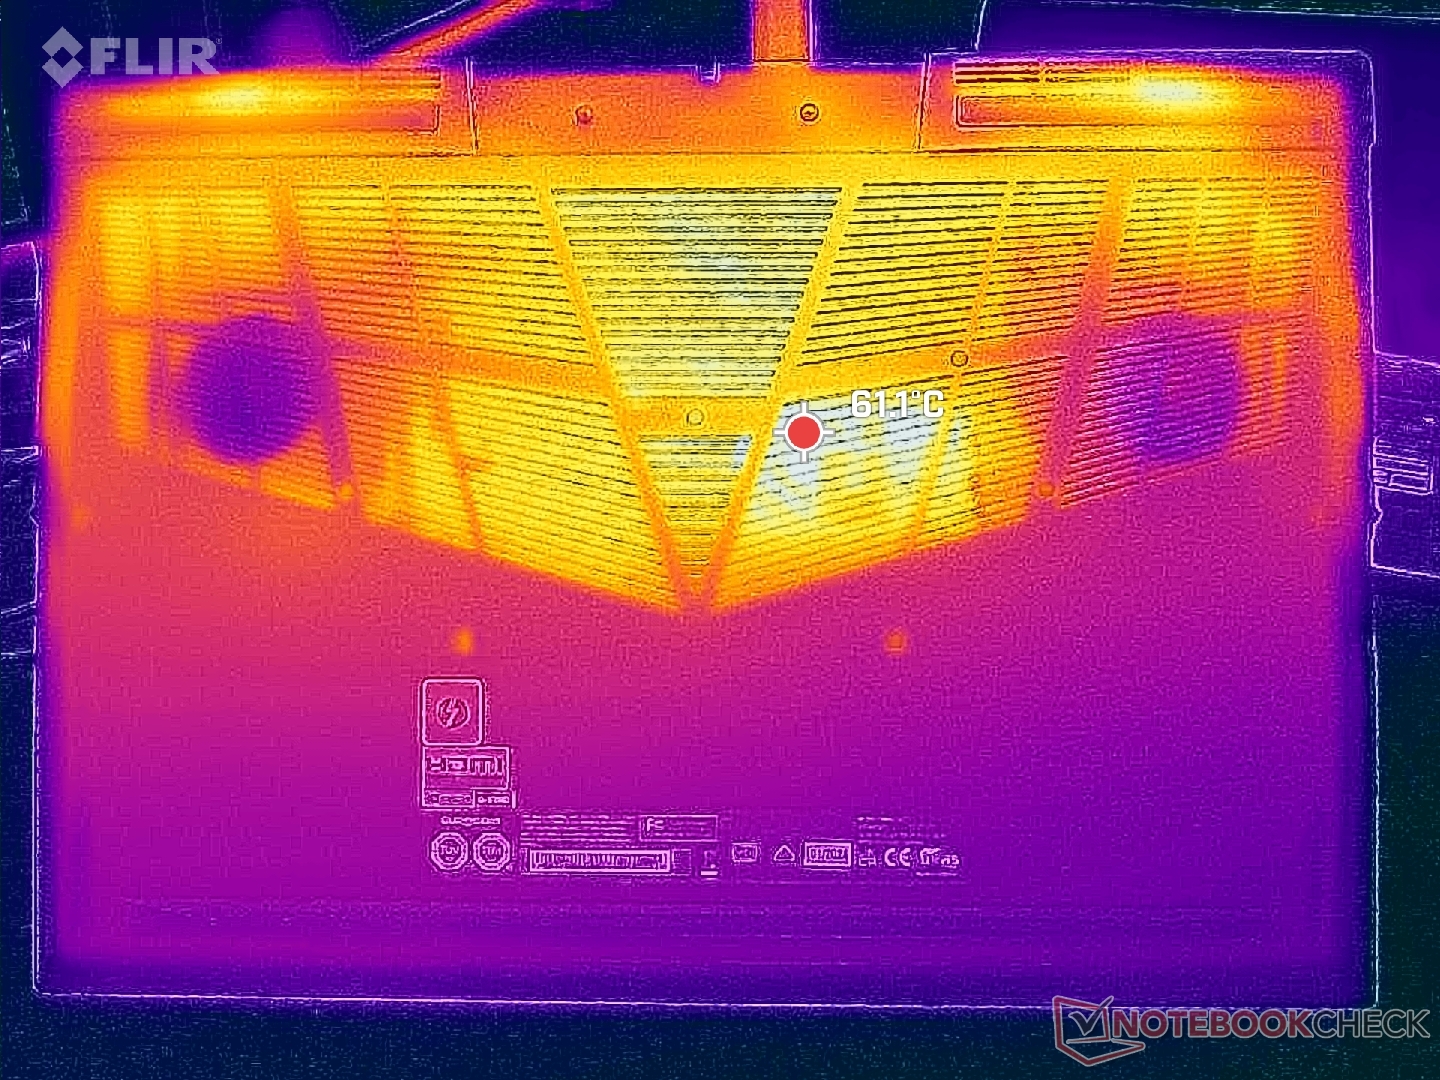
(-) De bodem warmt op tot een maximum van 53.2 °C / 128 F, vergeleken met een gemiddelde van 43.2 °C / 110 F
(+) Bij onbelast gebruik bedraagt de gemiddelde temperatuur voor de bovenzijde 25.8 °C / 78 F, vergeleken met het apparaatgemiddelde van 33.9 °C / 93 F.
(±) Bij het spelen van The Witcher 3 is de gemiddelde temperatuur voor de bovenzijde 36.7 °C / 98 F, vergeleken met het apparaatgemiddelde van 33.9 °C / 93 F.
(+) De palmsteunen en het touchpad zijn met een maximum van ###max## °C / 83.8 F koeler dan de huidtemperatuur en voelen daarom koel aan.
(±) De gemiddelde temperatuur van de handpalmsteun van soortgelijke toestellen bedroeg 28.8 °C / 83.8 F (0 °C / 0 F).
| Eurocom Raptor X17 Core i9-14900HX Intel Core i9-14900HX, NVIDIA GeForce RTX 4090 Laptop GPU | Eurocom Raptor X17 Intel Core i9-13900HX, NVIDIA GeForce RTX 4090 Laptop GPU | Asus TUF Gaming A17 FA707XI-NS94 AMD Ryzen 9 7940HS, NVIDIA GeForce RTX 4070 Laptop GPU | Asus ROG Strix Scar 17 G733PY-XS96 AMD Ryzen 9 7945HX, NVIDIA GeForce RTX 4090 Laptop GPU | MSI GE78HX 13VH-070US Intel Core i9-13950HX, NVIDIA GeForce RTX 4080 Laptop GPU | MSI Titan 18 HX A14VIG Intel Core i9-14900HX, NVIDIA GeForce RTX 4090 Laptop GPU | |
|---|---|---|---|---|---|---|
| Heat | -7% | 21% | 18% | 8% | 4% | |
| Maximum Upper Side * (°C) | 52.2 | 49.4 5% | 40 23% | 34.6 34% | 37.4 28% | 37.8 28% |
| Maximum Bottom * (°C) | 53.2 | 55.2 -4% | 33.6 37% | 35.6 33% | 45 15% | 37.6 29% |
| Idle Upper Side * (°C) | 28.6 | 33.4 -17% | 26.6 7% | 27.2 5% | 29.8 -4% | 34.8 -22% |
| Idle Bottom * (°C) | 29.8 | 33.4 -12% | 24.4 18% | 30 -1% | 32.4 -9% | 36 -21% |
* ... kleiner is beter
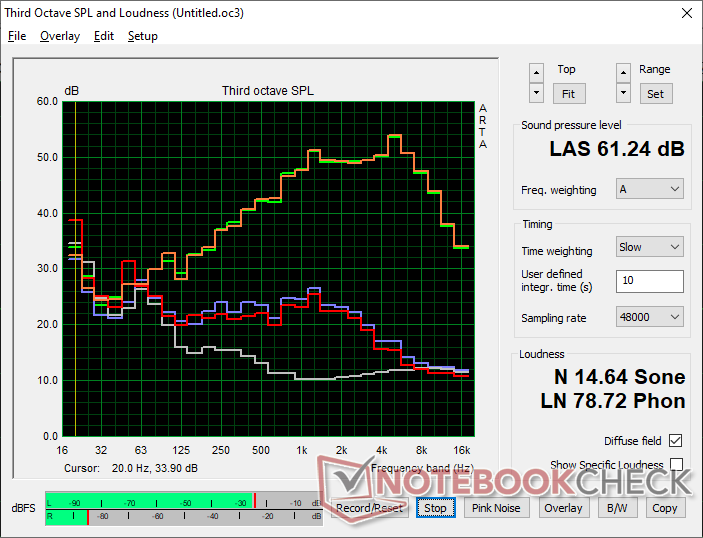
Luidsprekers
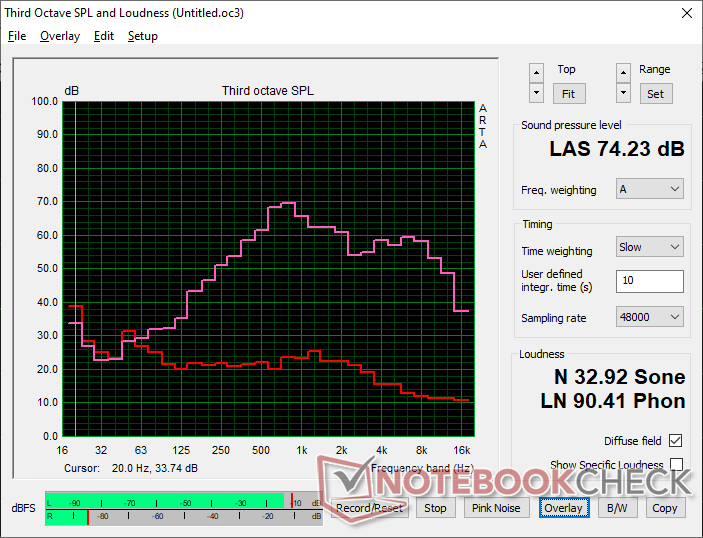
Eurocom Raptor X17 Core i9-14900HX audioanalyse
(±) | luidspreker luidheid is gemiddeld maar goed (74.2 dB)
Bas 100 - 315 Hz
(±) | verminderde zeebaars - gemiddeld 13.4% lager dan de mediaan
(±) | lineariteit van de lage tonen is gemiddeld (10.1% delta ten opzichte van de vorige frequentie)
Midden 400 - 2000 Hz
(±) | hogere middens - gemiddeld 6.6% hoger dan de mediaan
(±) | lineariteit van de middentonen is gemiddeld (8.6% delta ten opzichte van de vorige frequentie)
Hoog 2 - 16 kHz
(+) | evenwichtige hoogtepunten - slechts 2% verwijderd van de mediaan
(±) | lineariteit van de hoogtepunten is gemiddeld (8.5% delta ten opzichte van de vorige frequentie)
Algemeen 100 - 16.000 Hz
(±) | lineariteit van het totale geluid is gemiddeld (24% verschil met de mediaan)
Vergeleken met dezelfde klasse
» 86% van alle geteste apparaten in deze klasse waren beter, 4% vergelijkbaar, 9% slechter
» De beste had een delta van 6%, het gemiddelde was 18%, de slechtste was 132%
Vergeleken met alle geteste toestellen
» 72% van alle geteste apparaten waren beter, 6% gelijk, 22% slechter
» De beste had een delta van 4%, het gemiddelde was 23%, de slechtste was 134%
Apple MacBook Pro 16 2021 M1 Pro audioanalyse
(+) | luidsprekers kunnen relatief luid spelen (84.7 dB)
Bas 100 - 315 Hz
(+) | goede baars - slechts 3.8% verwijderd van de mediaan
(+) | de lage tonen zijn lineair (5.2% delta naar de vorige frequentie)
Midden 400 - 2000 Hz
(+) | evenwichtige middens - slechts 1.3% verwijderd van de mediaan
(+) | de middentonen zijn lineair (2.1% delta ten opzichte van de vorige frequentie)
Hoog 2 - 16 kHz
(+) | evenwichtige hoogtepunten - slechts 1.9% verwijderd van de mediaan
(+) | de hoge tonen zijn lineair (2.7% delta naar de vorige frequentie)
Algemeen 100 - 16.000 Hz
(+) | het totale geluid is lineair (4.6% verschil met de mediaan)
Vergeleken met dezelfde klasse
» 0% van alle geteste apparaten in deze klasse waren beter, 0% vergelijkbaar, 100% slechter
» De beste had een delta van 5%, het gemiddelde was 17%, de slechtste was 45%
Vergeleken met alle geteste toestellen
» 0% van alle geteste apparaten waren beter, 0% gelijk, 100% slechter
» De beste had een delta van 4%, het gemiddelde was 23%, de slechtste was 134%
Energiebeheer
Stroomverbruik
Voor Witcher 3 vraagt iets meer stroom dan voorheen met ongeveer 325 W om bijna evenveel te zijn als de Titan 18 HX. Het hogere verbruik in vergelijking met ons 2023-model kan waarschijnlijk worden toegeschreven aan het helderdere 4K-paneel met een hogere resolutie van onze nieuwere configuratie.
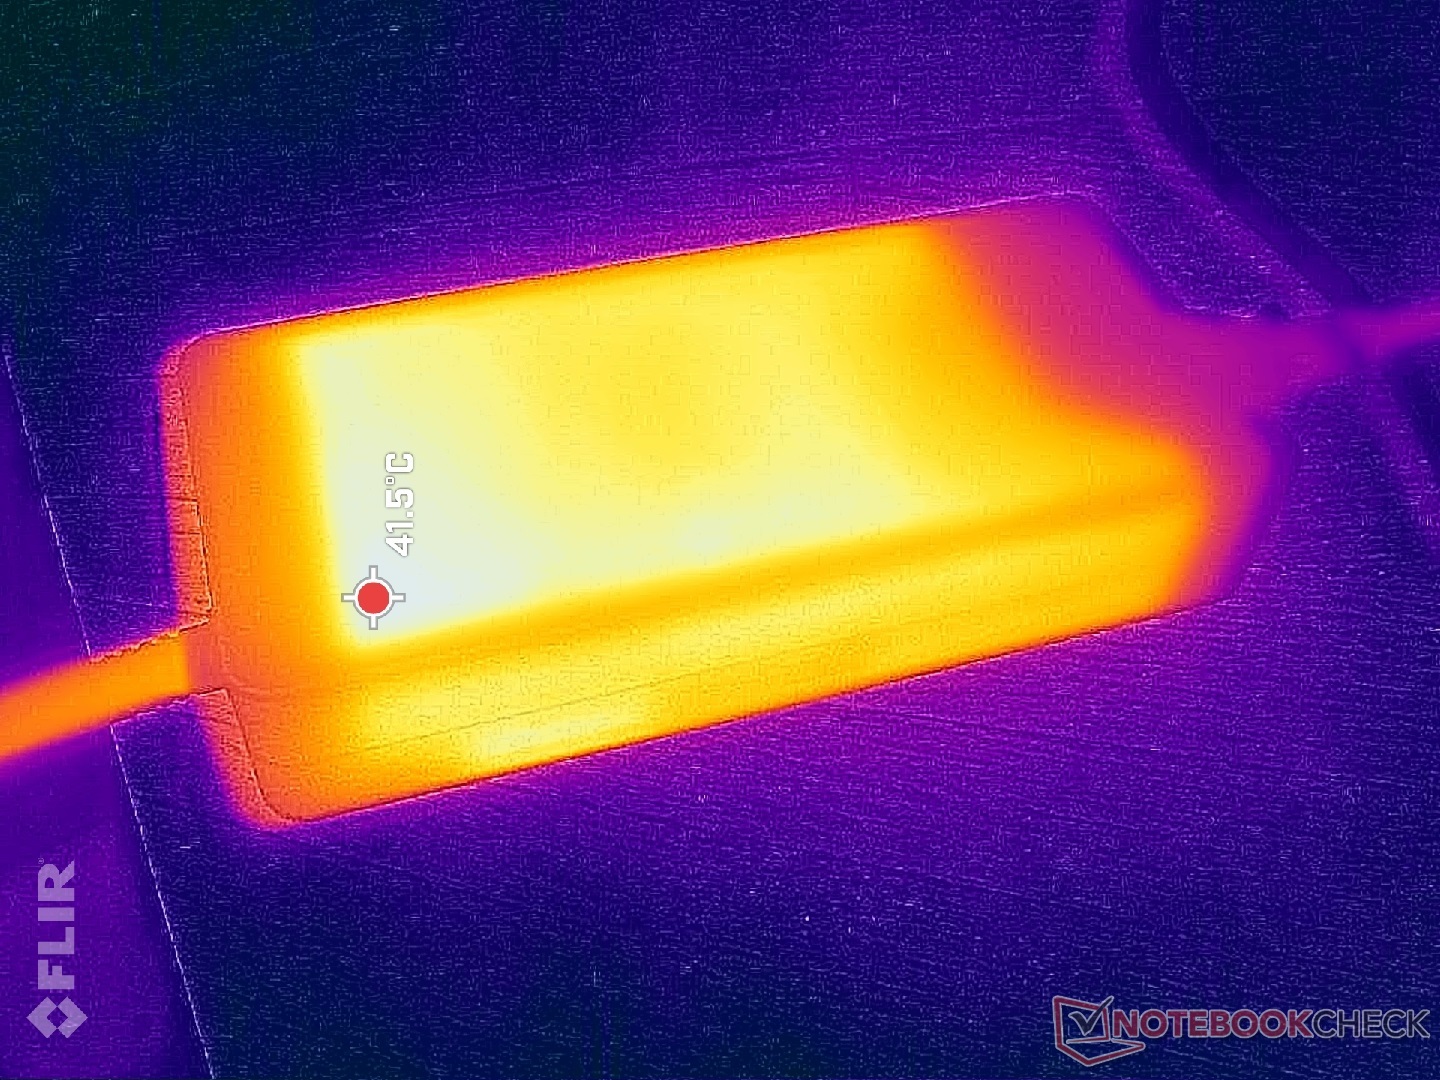
De grote 330 W AC-adapter blijft hetzelfde als voorheen. Aangezien gaming al bijna de volledige output van de adapter opeist, zal het veel en veel langer duren om de batterij tijdens het gamen op te laden.
(Noot van de redactie: Dit gedeelte zal worden bijgewerkt wanneer de reparaties aan onze Metrahit Energy multimeter zijn voltooid. Onze excuses voor het ongemak)
| Uit / Standby | |
| Inactief | |
| Belasting |
|
Key:
min: | |
| Eurocom Raptor X17 Core i9-14900HX i9-14900HX, GeForce RTX 4090 Laptop GPU, Corsair MP700 Pro 2TB, IPS, 3840x2160, 17.3" | Eurocom Raptor X17 i9-13900HX, GeForce RTX 4090 Laptop GPU, 3x Samsung SSD 980 Pro 1TB (RAID 0), IPS, 2560x1440, 17.3" | Asus TUF Gaming A17 FA707XI-NS94 R9 7940HS, GeForce RTX 4070 Laptop GPU, WD PC SN560 SDDPNQE-1T00, IPS, 1920x1080, 17.3" | Asus ROG Strix Scar 17 G733PY-XS96 R9 7945HX, GeForce RTX 4090 Laptop GPU, SK hynix PC801 HFS001TEJ9X101N, IPS, 2560x1440, 17.3" | MSI GE78HX 13VH-070US i9-13950HX, GeForce RTX 4080 Laptop GPU, Samsung PM9A1 MZVL22T0HBLB, IPS, 2560x1600, 17" | MSI Titan 18 HX A14VIG i9-14900HX, GeForce RTX 4090 Laptop GPU, 2x Samsung PM9A1a MZVL22T0HDLB (RAID 0), Mini-LED, 3840x2400, 18" | |
|---|---|---|---|---|---|---|
| Power Consumption | 13% | 45% | 17% | 16% | -1% | |
| Idle Minimum * (Watt) | 18.7 | 13.4 28% | 6.2 67% | 14.5 22% | 16.1 14% | 13.2 29% |
| Idle Average * (Watt) | 29.9 | 22.2 26% | 21.8 27% | 21.1 29% | 24 20% | 25.4 15% |
| Idle Maximum * (Watt) | 43.8 | 42.4 3% | 22 50% | 42.8 2% | 34 22% | 53.5 -22% |
| Load Average * (Watt) | 148.9 | 132.8 11% | 59.2 60% | 116.7 22% | 123.6 17% | 151.4 -2% |
| Witcher 3 ultra * (Watt) | 310.5 | 304 2% | 189.7 39% | 278 10% | 286 8% | 336 -8% |
| Load Maximum * (Watt) | 340.2 | 319.8 6% | 247.8 27% | 279.6 18% | 285.7 16% | 395.2 -16% |
* ... kleiner is beter
Power Consumption Witcher 3 / Stresstest
Power Consumption external Monitor
Levensduur batterij
De looptijden zijn net iets korter dan op de configuratie van vorig jaar, waarschijnlijk door de veeleisendere 4K-resolutie.
| Eurocom Raptor X17 Core i9-14900HX i9-14900HX, GeForce RTX 4090 Laptop GPU, 99 Wh | Eurocom Raptor X17 i9-13900HX, GeForce RTX 4090 Laptop GPU, 99 Wh | Asus TUF Gaming A17 FA707XI-NS94 R9 7940HS, GeForce RTX 4070 Laptop GPU, 90 Wh | Asus ROG Strix Scar 17 G733PY-XS96 R9 7945HX, GeForce RTX 4090 Laptop GPU, 90 Wh | MSI GE78HX 13VH-070US i9-13950HX, GeForce RTX 4080 Laptop GPU, 99 Wh | MSI Titan 18 HX A14VIG i9-14900HX, GeForce RTX 4090 Laptop GPU, 99.9 Wh | |
|---|---|---|---|---|---|---|
| Batterijduur | 6% | 94% | -13% | 30% | -11% | |
| WiFi v1.3 (h) | 4.7 | 5 6% | 9.1 94% | 4.1 -13% | 6.1 30% | 4.2 -11% |
| Reader / Idle (h) | 10.2 | 19.7 | 7.3 | 5.9 | ||
| Load (h) | 1.5 | 1.7 | 1.5 | 1.2 |
Pro
Contra
Verdict - Nieuwe processor, zelfde uiterlijk
Aangezien de Core i9-14900HX grotendeels een rebranding is van de Core i9-13900HX van vroeger, biedt de 2024 Eurocom Raptor X17 niet veel meer dan de 2023 versie. De processorprestaties zijn misschien iets sneller, maar al het andere blijft onveranderd. De algehele prestaties zijn desondanks nog steeds vergelijkbaar met enkele van de snelste laptops die verkrijgbaar zijn, waaronder de MSI Titan HX of Asus ROG Strix Scar 18. Eurocom biedt geen mini-LED of OLED voor dit model, maar dergelijke opties zijn bedoeld voor multimedia-gebruikers, terwijl de Raptor X17 meer ontworpen is voor professionele ruimtes met hoge prestaties.
Het geluid van de ventilator kan iets gelijkmatiger zijn, maar verwacht geen significante prestatiewinst ten opzichte van de al supersnelle opties van de vorige generatie.
Krachtige gebruikers die besluiten om te configureren met een PCIe5 SSD moeten absoluut overwegen om ook de hittespreider te bestellen. Anders zal de PCIe5-schijf zich na een paar minuten intensief gebruik meer als een PCIe4-schijf gedragen.
Prijs en beschikbaarheid
Eurocom levert nu de 2024 Raptor X17 vanaf $3500 voor de RTX 4080 en 2K scherm. Configuratie met de RTX 4090 en een 4K scherm, zoals in onze recensie, zal de prijs verhogen tot meer dan $4200.
Eurocom Raptor X17 Core i9-14900HX
- 15-03-2024 v7 (old)
Allen Ngo
Transparantie
De selectie van te beoordelen apparaten wordt gemaakt door onze redactie. Het testexemplaar werd ten behoeve van deze beoordeling door de fabrikant of detailhandelaar in bruikleen aan de auteur verstrekt. De kredietverstrekker had geen invloed op deze recensie, noch ontving de fabrikant vóór publicatie een exemplaar van deze recensie. Er bestond geen verplichting om deze recensie te publiceren. Als onafhankelijk mediabedrijf is Notebookcheck niet onderworpen aan het gezag van fabrikanten, detailhandelaren of uitgevers.
[transparency_disclaimer]Dit is hoe Notebookcheck test
Elk jaar beoordeelt Notebookcheck onafhankelijk honderden laptops en smartphones met behulp van gestandaardiseerde procedures om ervoor te zorgen dat alle resultaten vergelijkbaar zijn. We hebben onze testmethoden al zo'n 20 jaar voortdurend ontwikkeld en daarbij de industriestandaard bepaald. In onze testlaboratoria wordt gebruik gemaakt van hoogwaardige meetapparatuur door ervaren technici en redacteuren. Deze tests omvatten een validatieproces in meerdere fasen. Ons complexe beoordelingssysteem is gebaseerd op honderden goed onderbouwde metingen en benchmarks, waardoor de objectiviteit behouden blijft. Meer informatie over onze testmethoden kunt u hier vinden.
Price comparison

