Dell OptiPlex Micro Plus 7010 review: Desktop Core i7-13700 in een mini PC-pakket

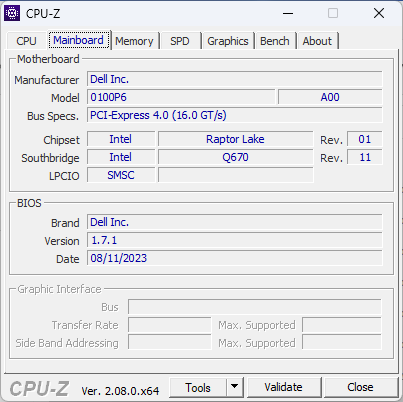
De OptiPlex Micro is een mini-pc die is ontworpen voor commerciële en professionele doeleinden, maar de compacte vormfactor heeft ook toepassingen voor WFH-omgevingen, vooral in vergelijking met de standaard volwaardige OptiPlex-modellen. Dit specifieke model valt op door zijn desktop-processor, terwijl de meeste andere mini-pc's gebruik maken van mobiele H- of HX-serie CPU's.
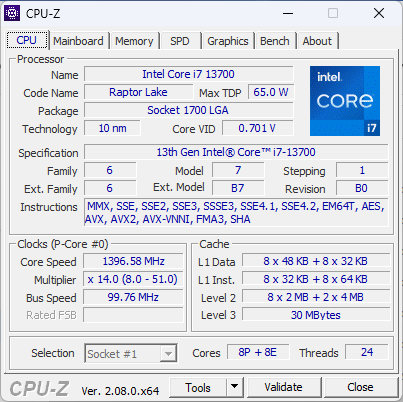
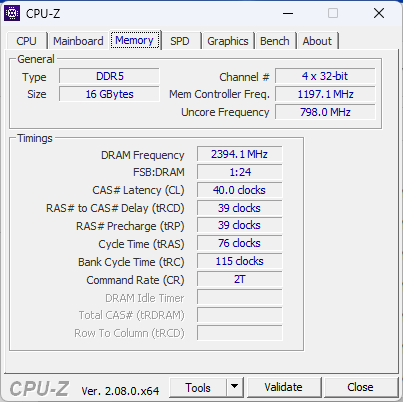
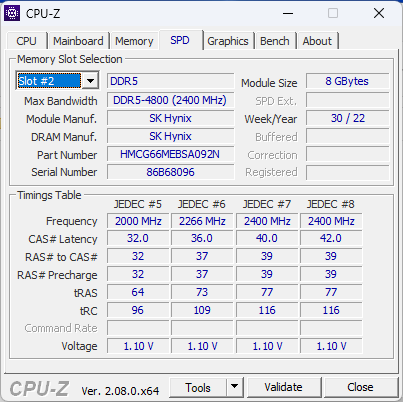
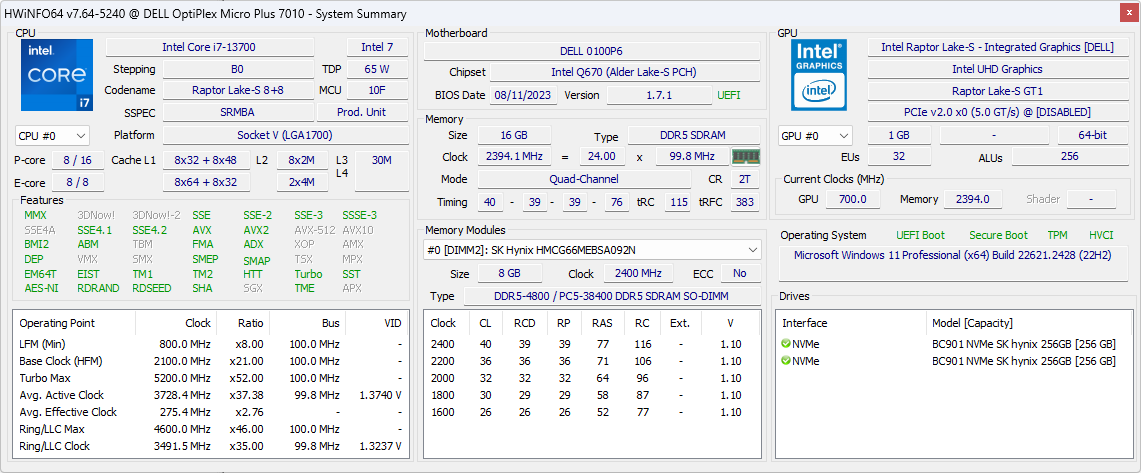
Onze specifieke testunit is geconfigureerd met de 13e generatie Core i7-13700 CPU, 16 GB DDR5-4800 RAM en 512 GB SSD in RAID 0. Configuraties in het lagere segment beginnen met de Core i3-13100T voor minder dan $900 tot de Core i9-13900 vPro. Niet-Plus SKU's kunnen geleverd worden met een nog langzamere Pentium Gold G7400T. Er zijn momenteel geen configuraties met discrete graphics of AMD-alternatieven.
De OptiPlex Micro concurreert met andere semi-professionele mini PC's zoals deApple Mac Mini M2, Beelink GTR7of de Intel NUC serie.
Meer Dell beoordelingen:
Potentiële concurrenten in vergelijking
Evaluatie | Datum | Model | Gewicht | Hoogte | Formaat | Resolutie | Beste prijs |
|---|---|---|---|---|---|---|---|
| 80.2 % v7 (old) | 10-2023 | Dell OptiPlex Micro i7-13700, UHD Graphics 770 | 1.2 kg | 36 mm | x | ||
| 87.3 % v7 (old) | 09-2023 | Apple Mac Mini M2 M2, M2 10-Core GPU | 1.2 kg | 36 mm | x | ||
| 81 % v7 (old) | 09-2023 | Lenovo IdeaCentre Mini 01IRH8 i7-13700H, Iris Xe G7 96EUs | 1.8 kg | 39 mm | x | ||
| 82.8 % v7 (old) | GMK NucBox K3 Pro i7-12650H, UHD Graphics 64EUs | 396 g | 43.2 mm | x | |||
| 86.3 % v7 (old) | 07-2023 | Beelink GTR7 7840HS R7 7840HS, Radeon 780M | 890 g | 48.8 mm | x | ||
| 86.6 % v7 (old) | 09-2023 | Beelink SER7 R7 7840HS, Radeon 780M | 640 g | 49 mm | x |
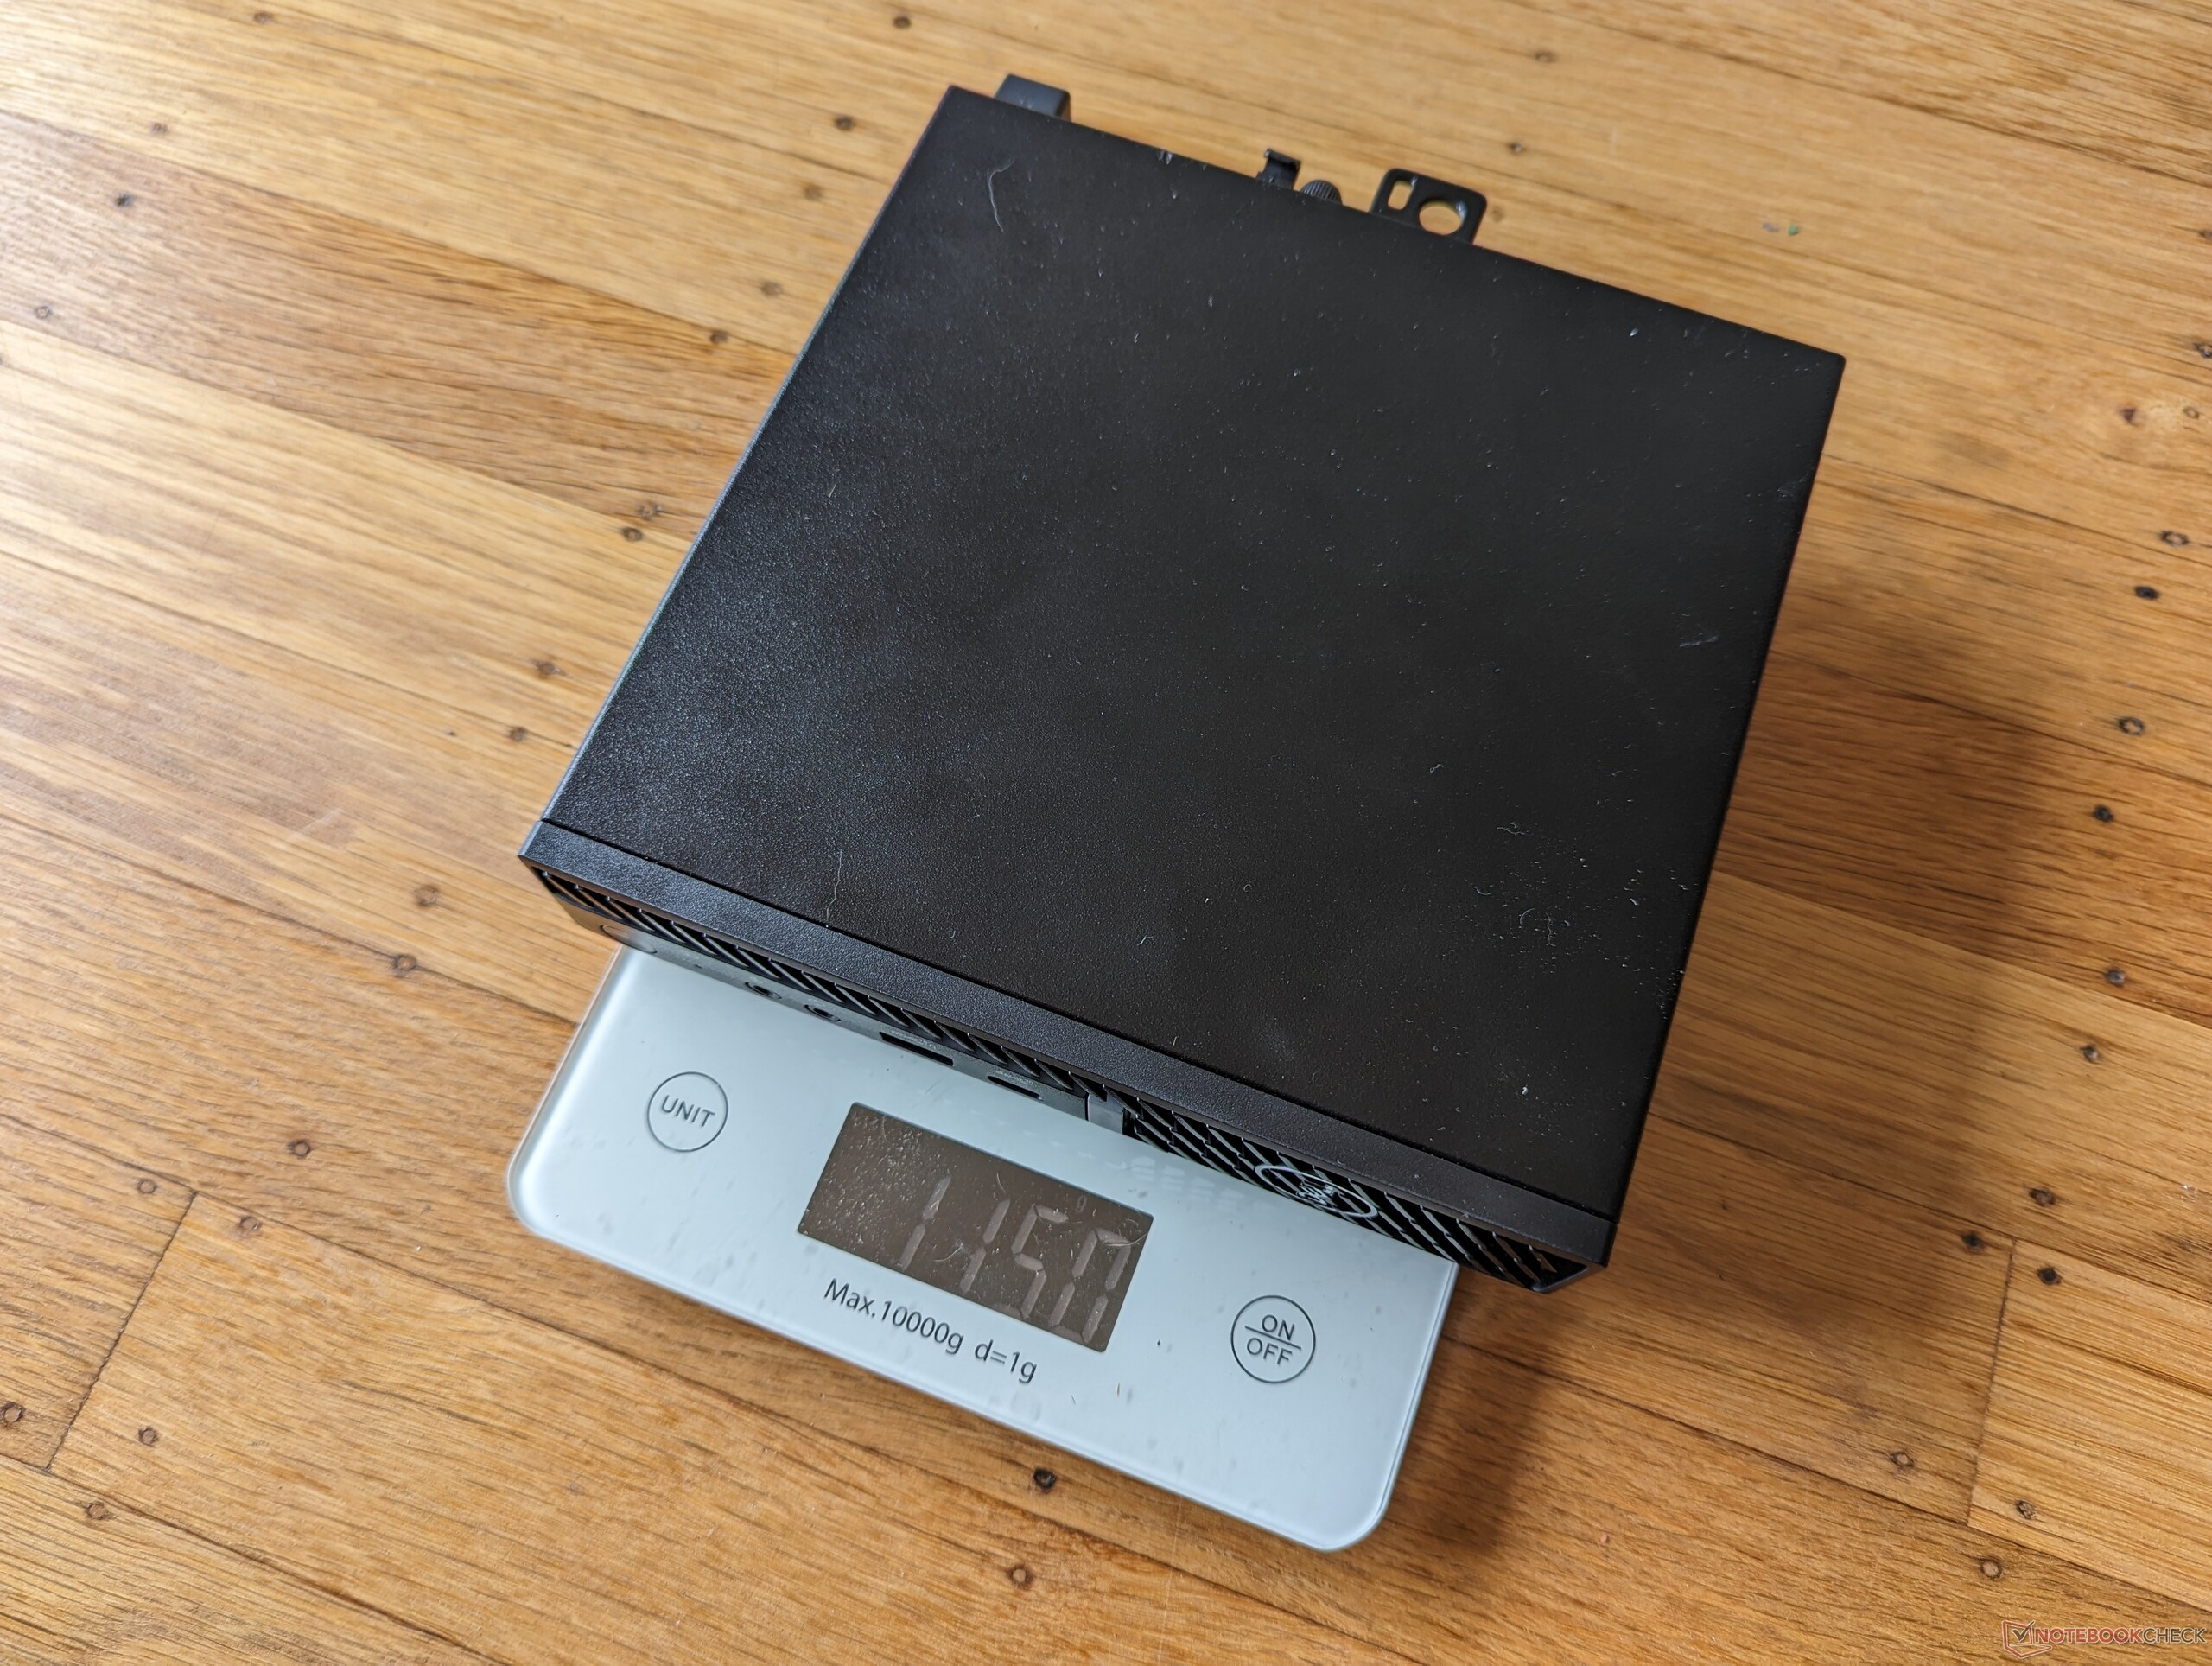
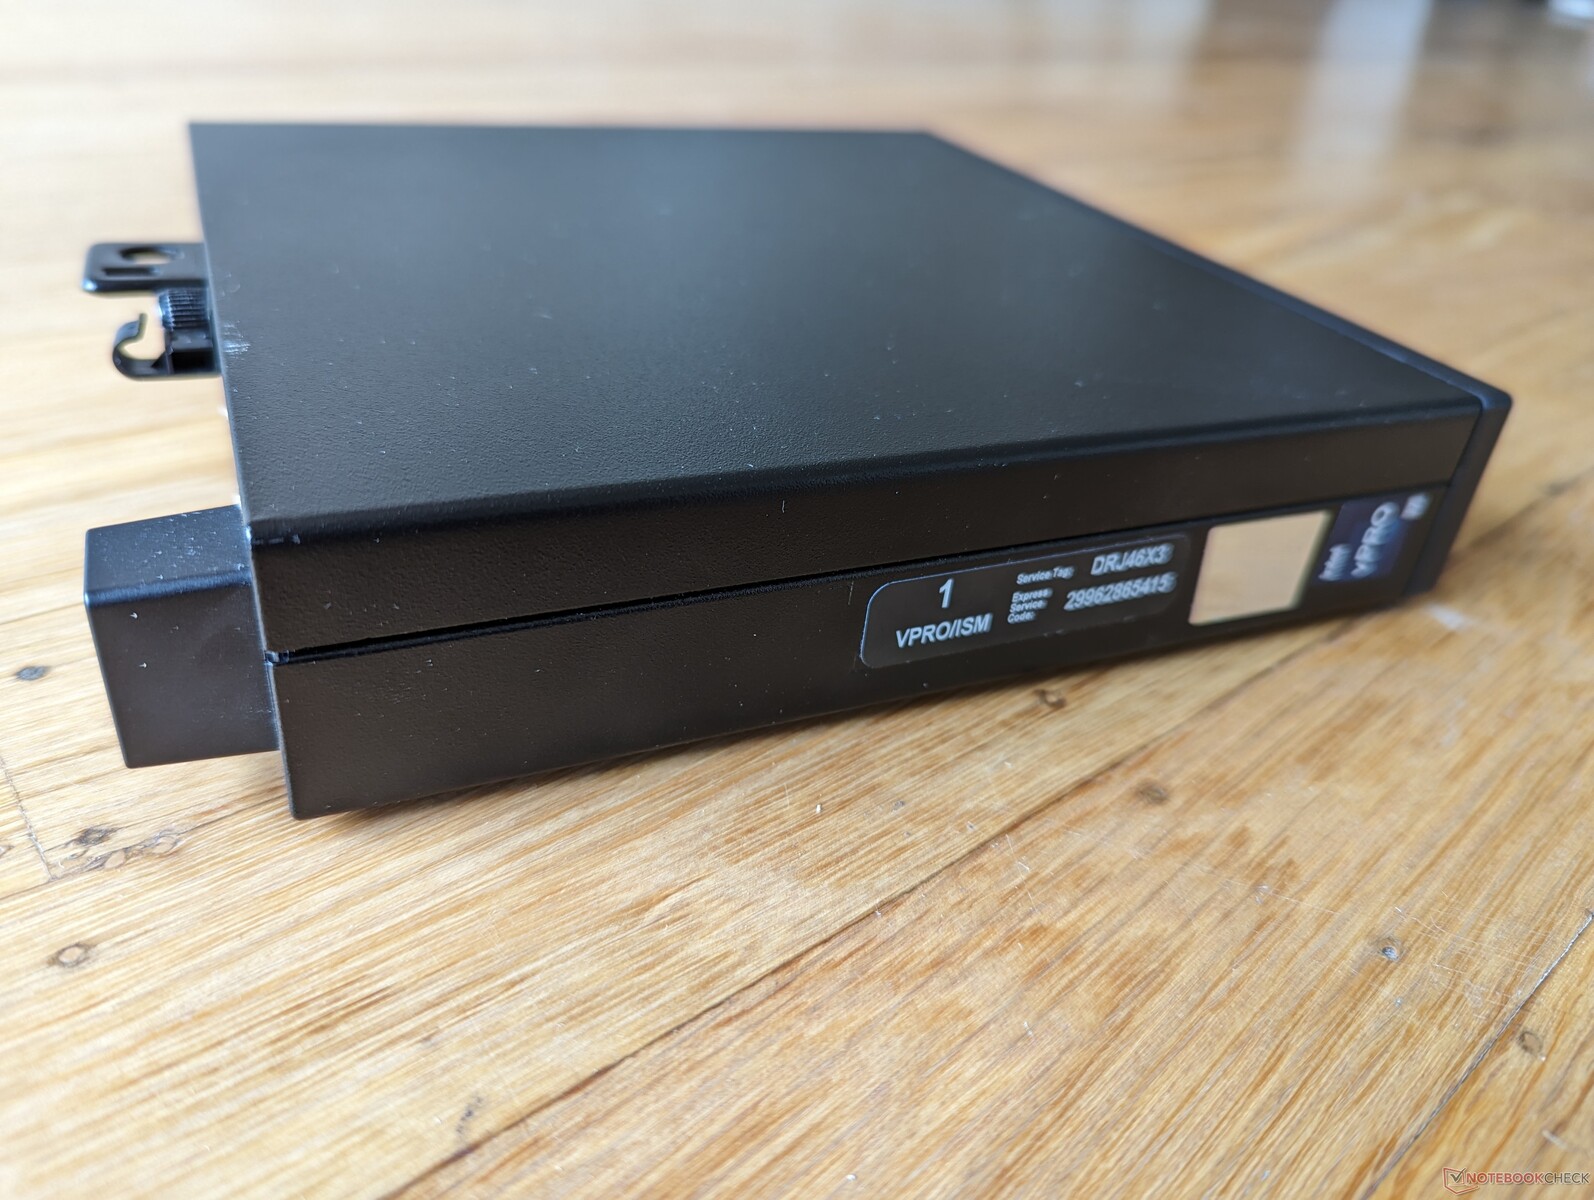
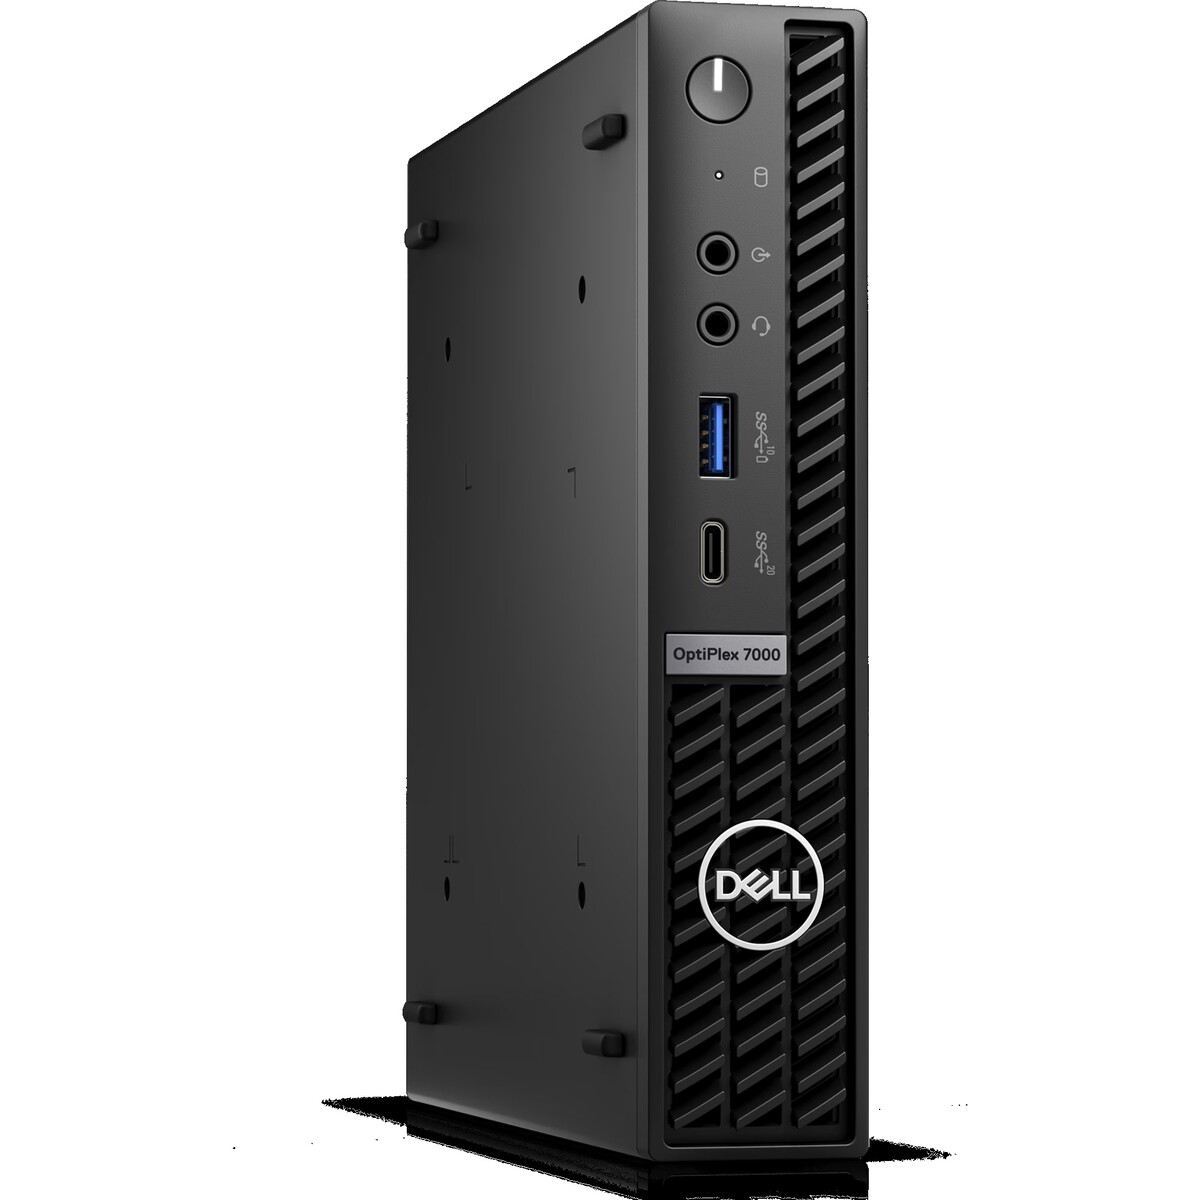
Behuizing - Minitoren-optiek
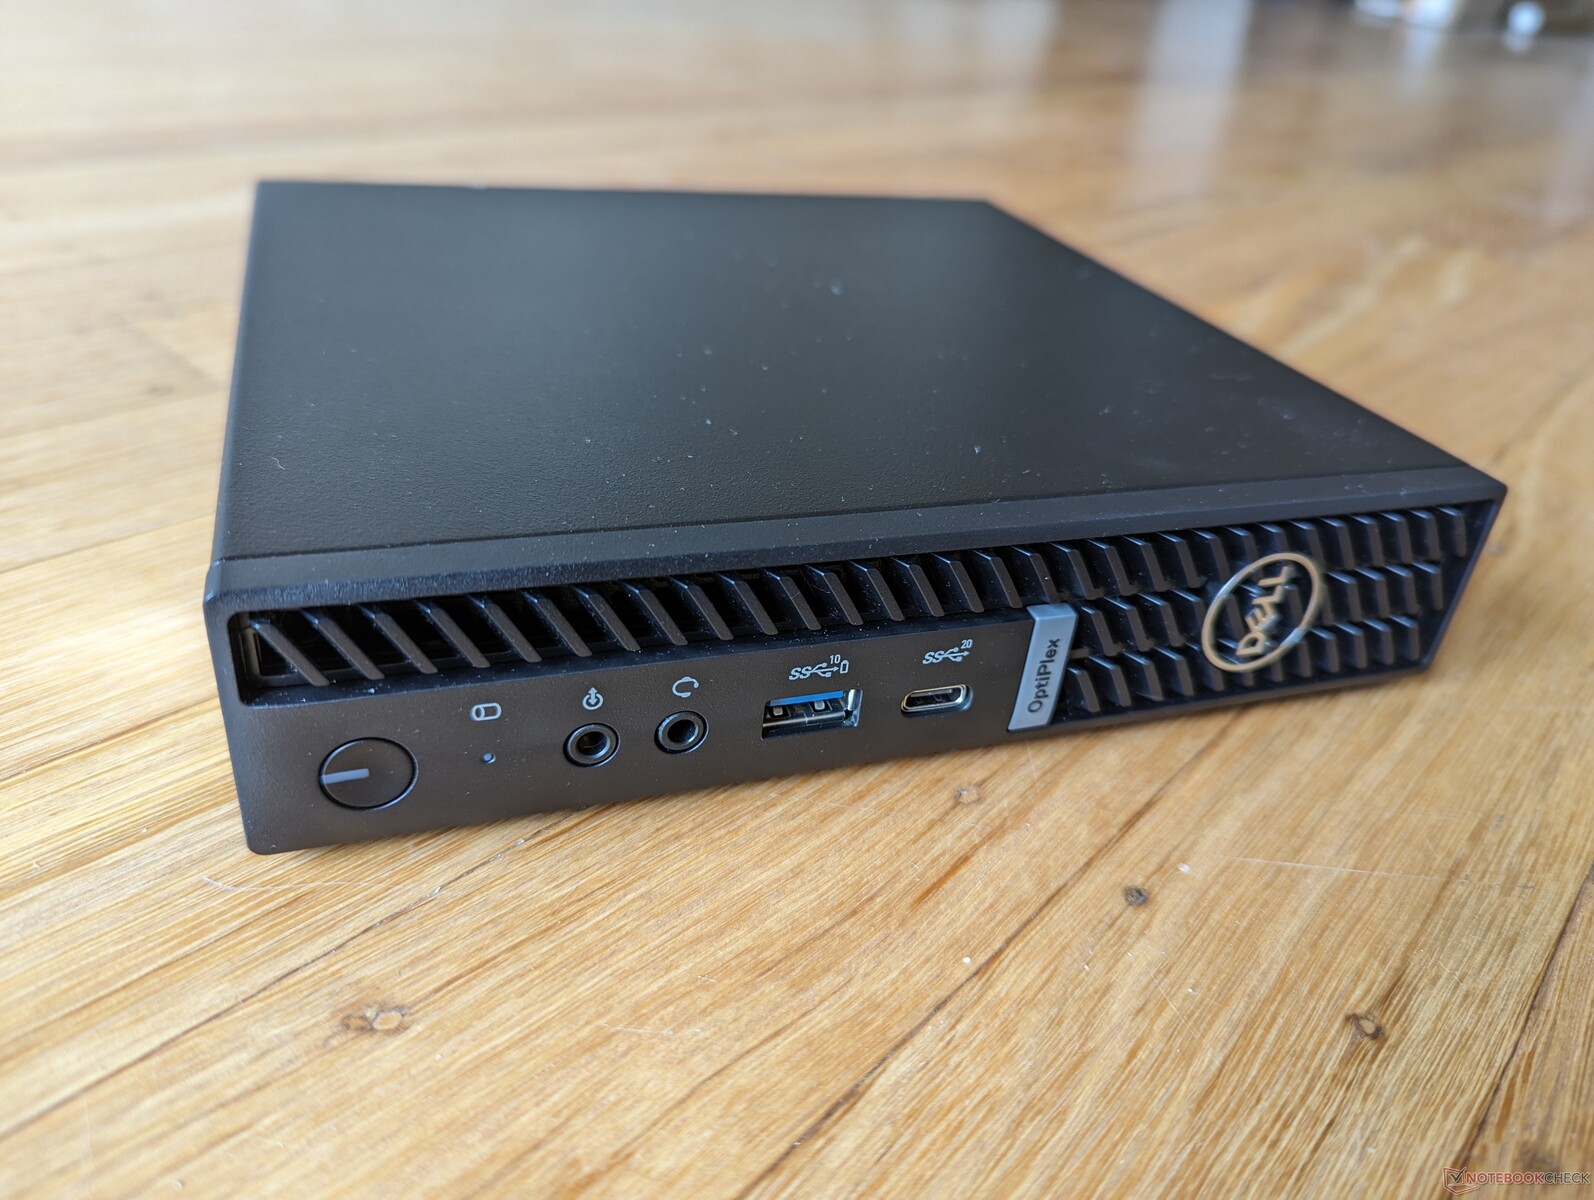
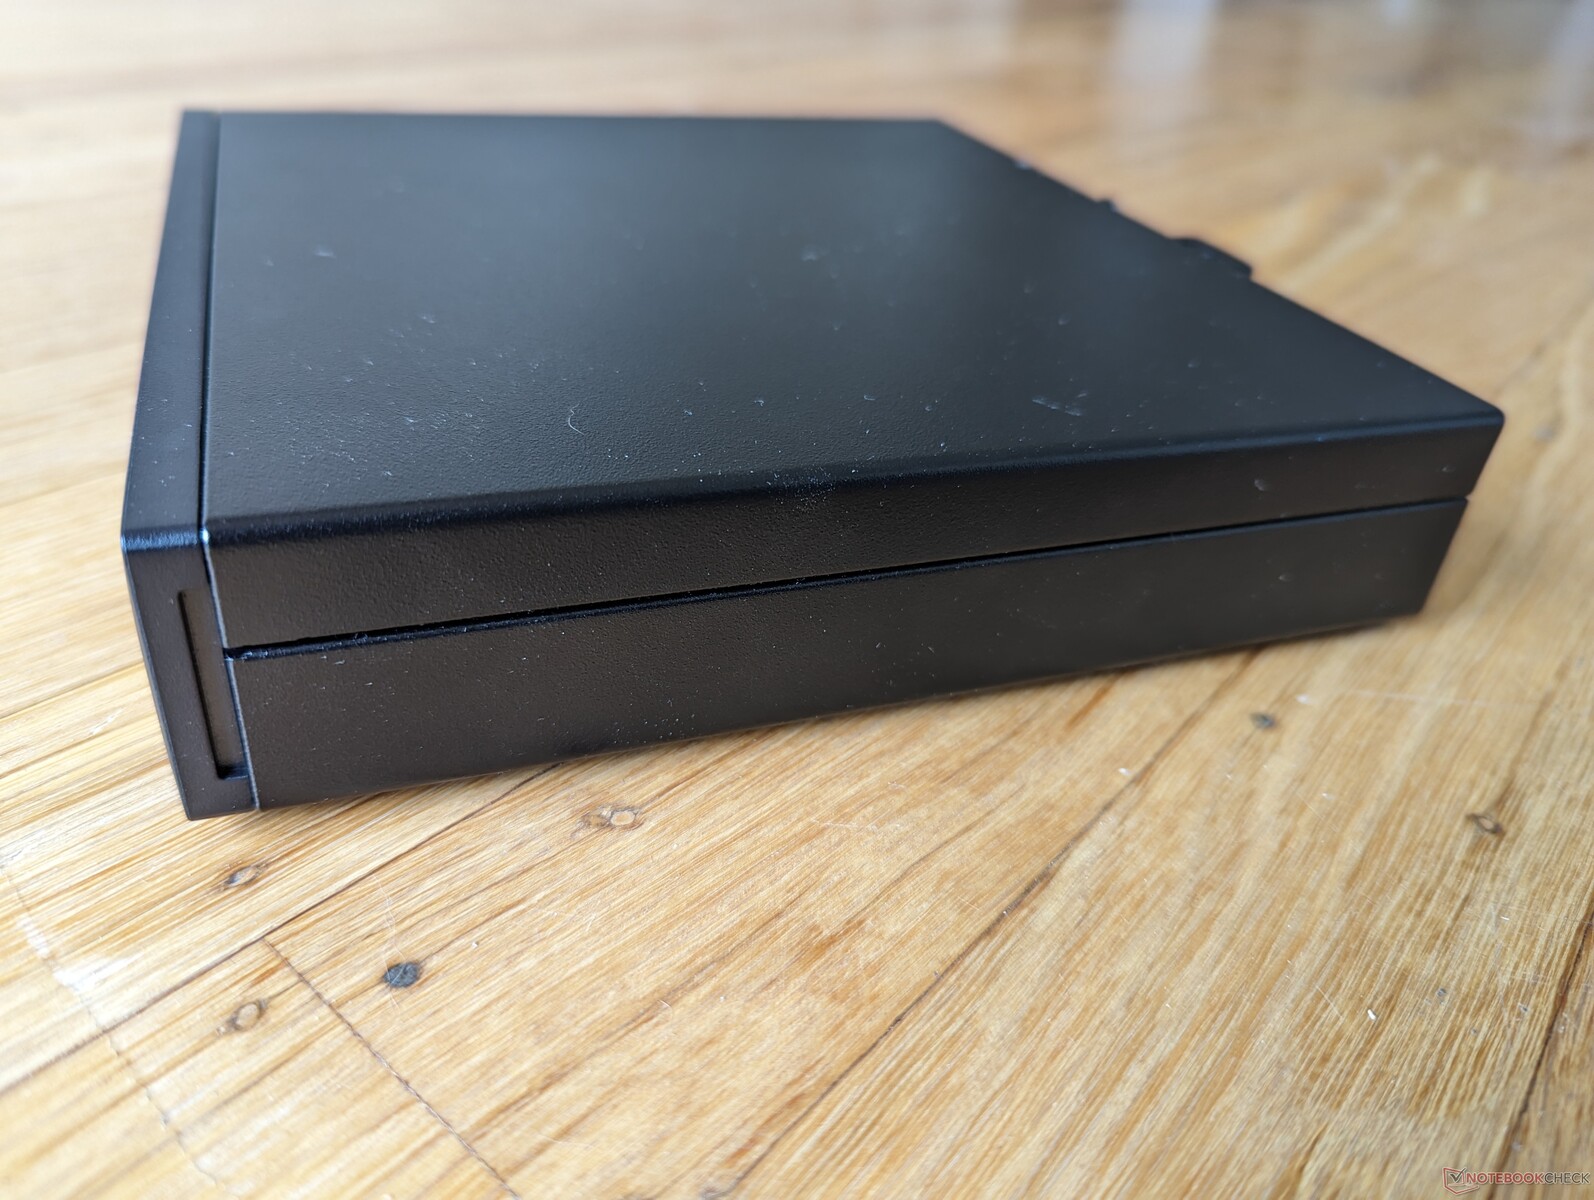
De OptiPlex Micro is twee keer zo groot en zwaar als de Intel NUC 13 Pro, maar nog steeds kleiner dan de Mac Mini en vooral de OptiPlex SFF. Het volledig metalen chassis en het kenmerkende roosterontwerp aan de voorkant zijn verder onmiskenbaar OptiPlex.
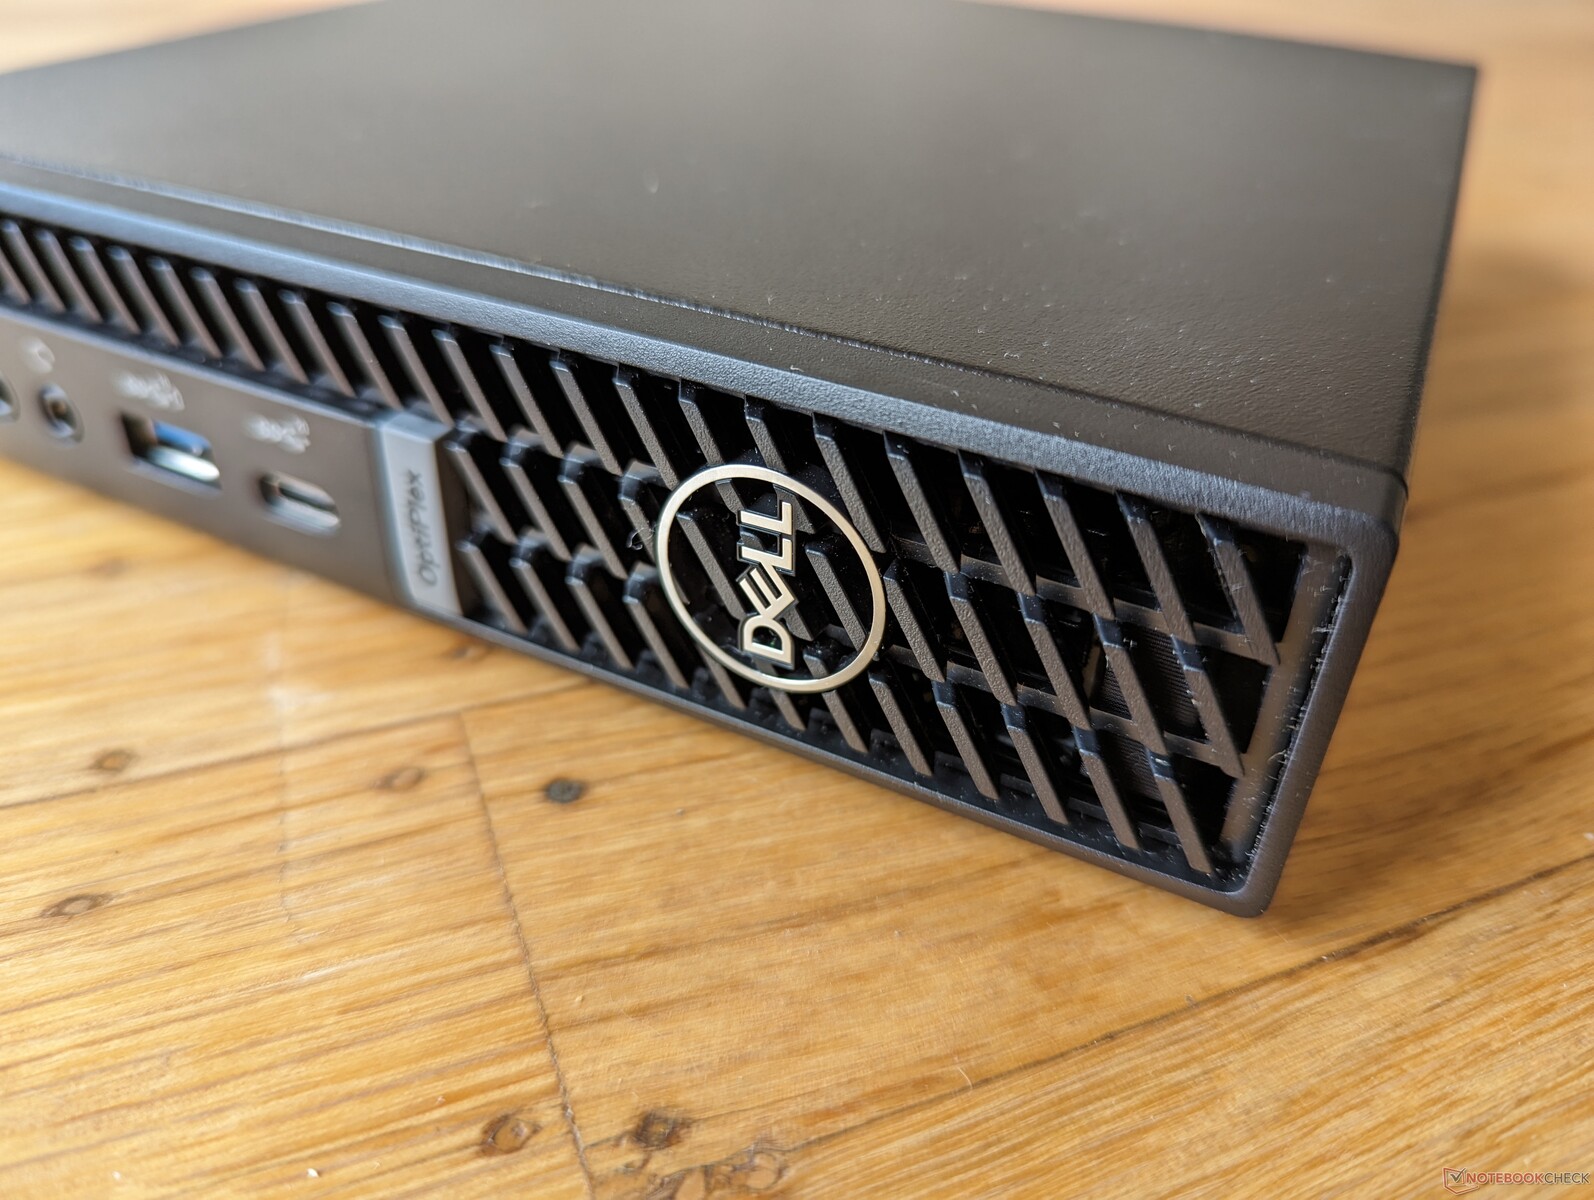
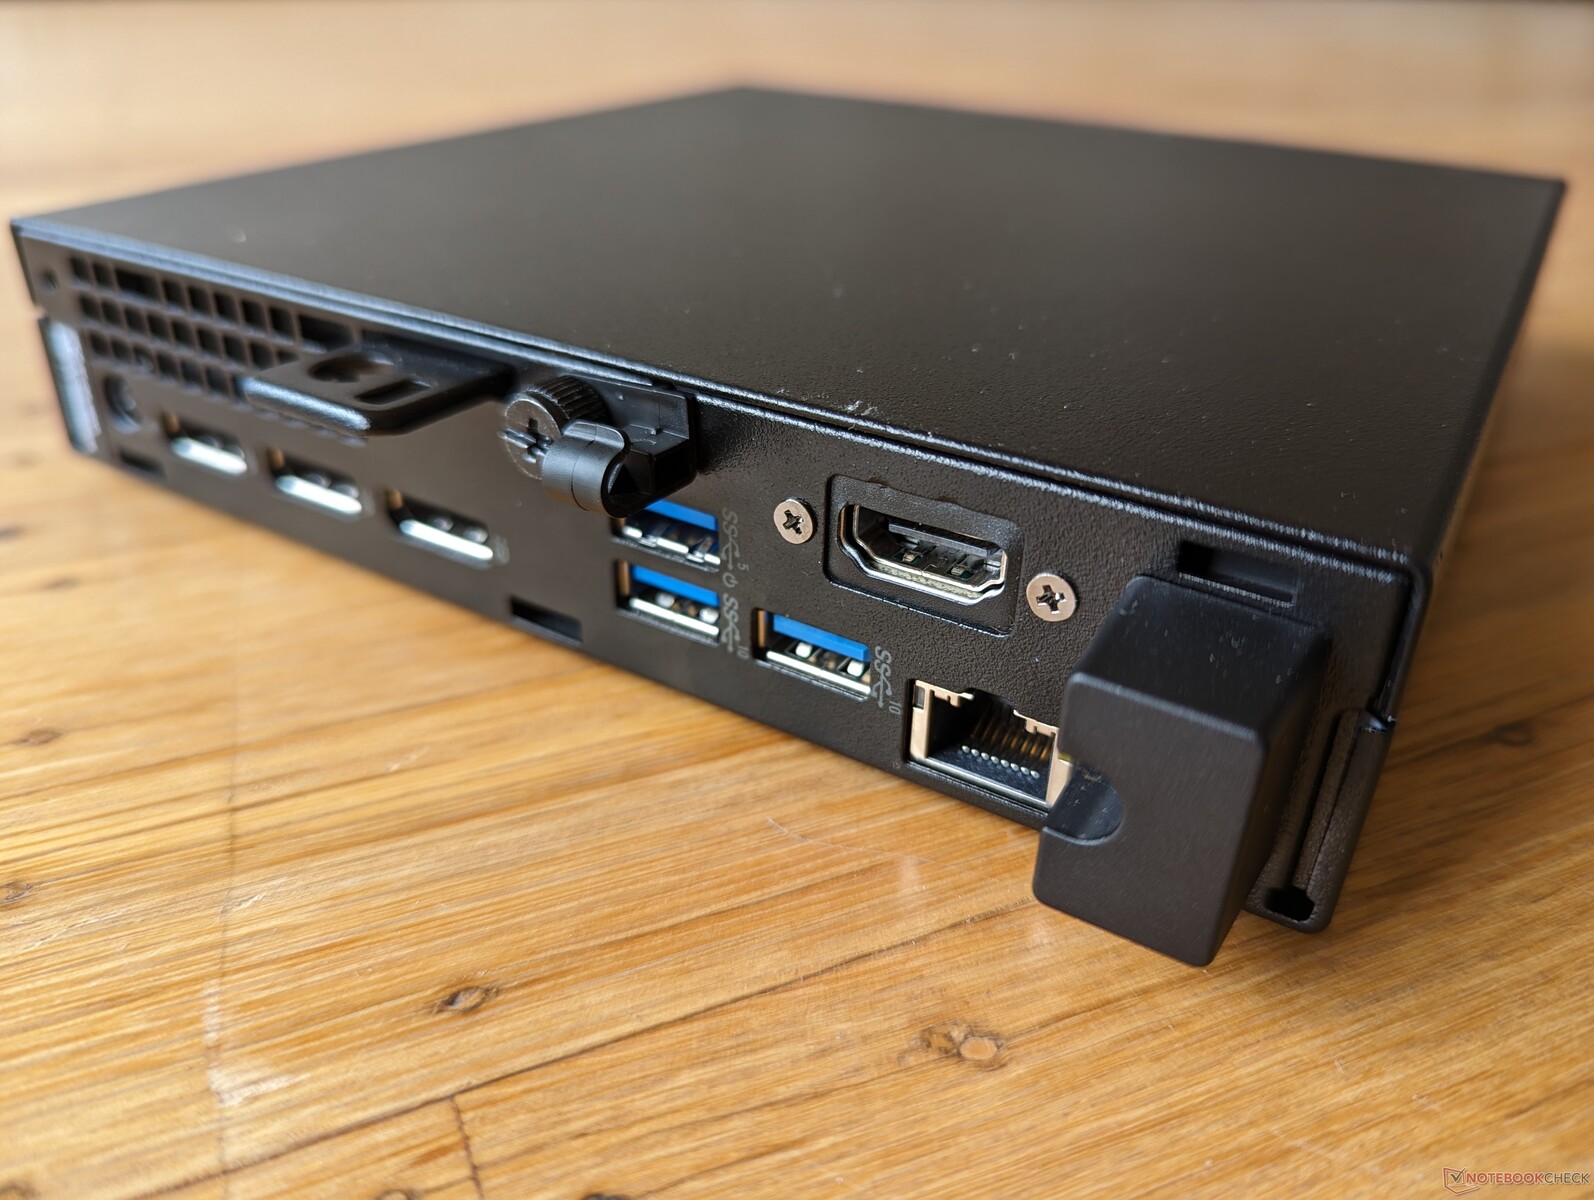
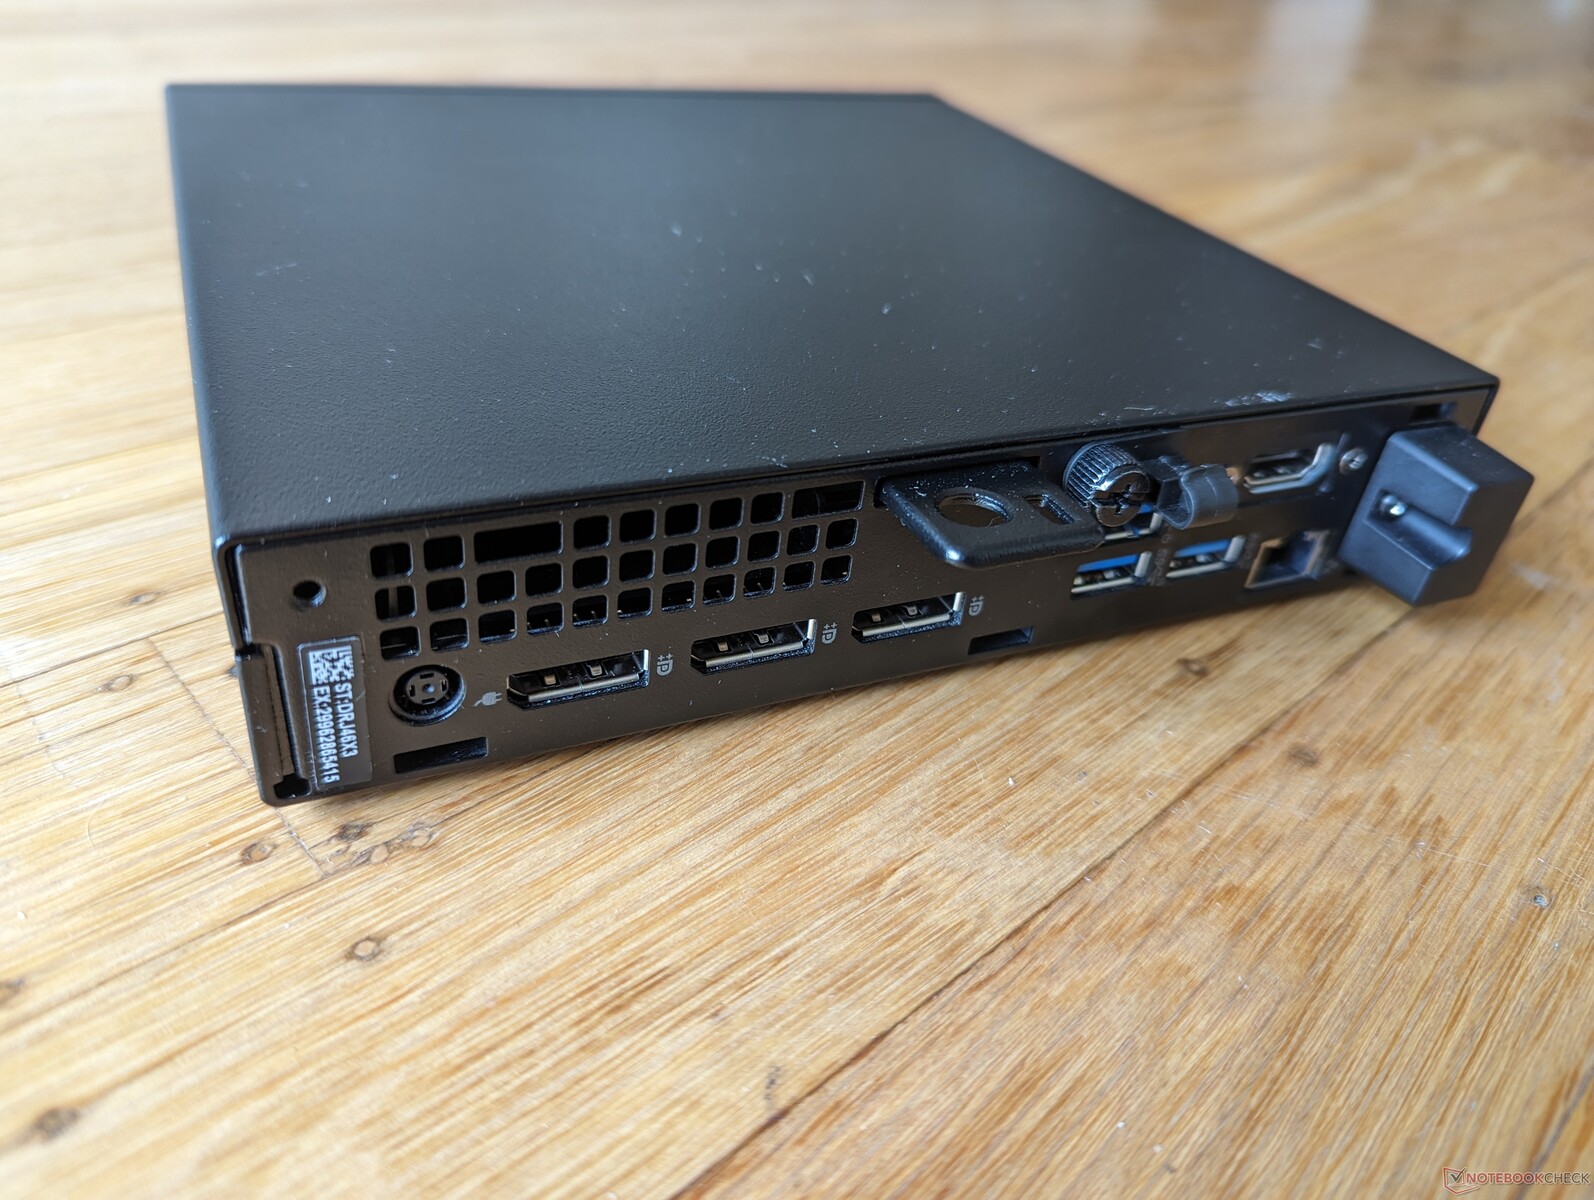
Connectiviteit
De poortopties zijn gevarieerd, met als meest opvallende de vier individuele video-out poorten. De enkele USB-C poort ondersteunt echter geen USB4, Thunderbolt, Power Delivery of zelfs DisplayPort, in tegenstelling tot de USB-C poorten op de meeste Intel NUC's of Beelink mini PC's.
Communicatie
De meegeleverde Intel AX211 biedt Wi-Fi 6E en Bluetooth 5.3 connectiviteit. De prestaties zijn betrouwbaar zonder grote verschillen tussen netwerken op 5 GHz of 6 GHz.
| Networking | |
| iperf3 transmit AXE11000 | |
| Apple Mac Mini M2 | |
| Beelink SER7 | |
| GMK NucBox K3 Pro | |
| Beelink GTR7 7840HS | |
| Dell OptiPlex Micro | |
| Lenovo IdeaCentre Mini 01IRH8 | |
| iperf3 receive AXE11000 | |
| Apple Mac Mini M2 | |
| GMK NucBox K3 Pro | |
| Beelink GTR7 7840HS | |
| Beelink SER7 | |
| Dell OptiPlex Micro | |
| Lenovo IdeaCentre Mini 01IRH8 | |
| iperf3 transmit AXE11000 6GHz | |
| Dell OptiPlex Micro | |
| iperf3 receive AXE11000 6GHz | |
| Dell OptiPlex Micro | |
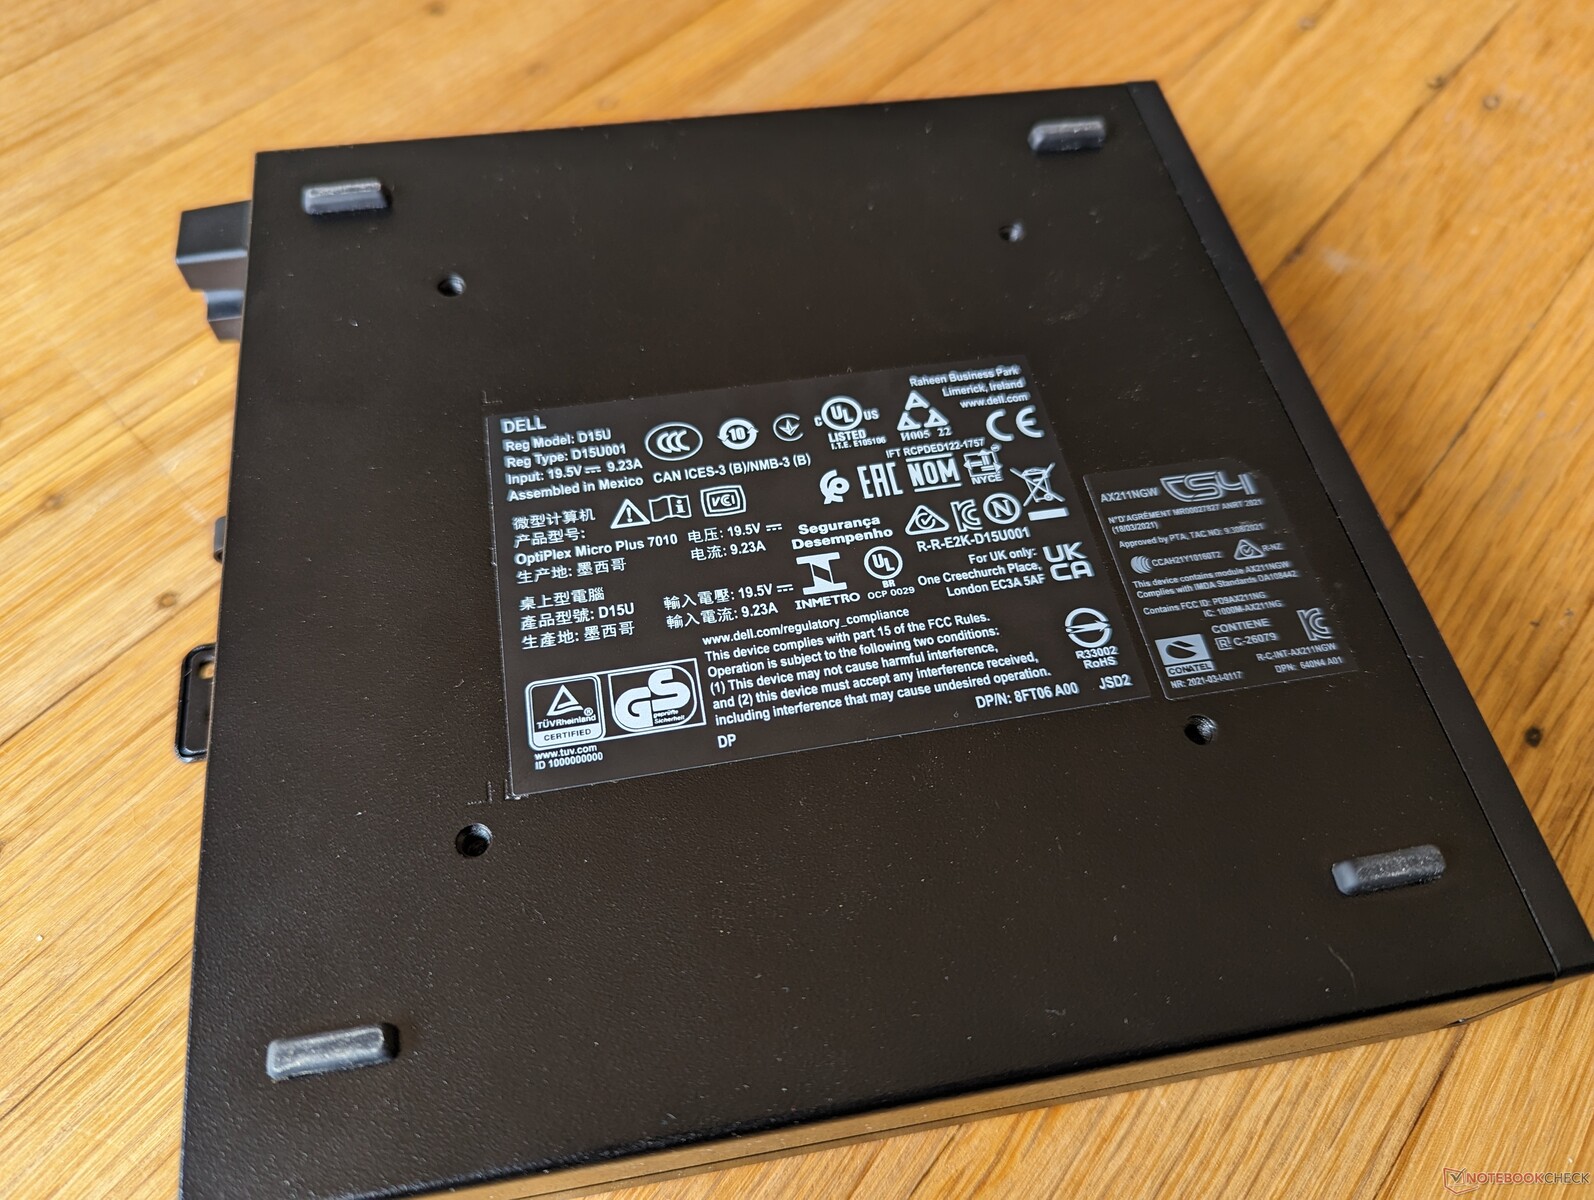
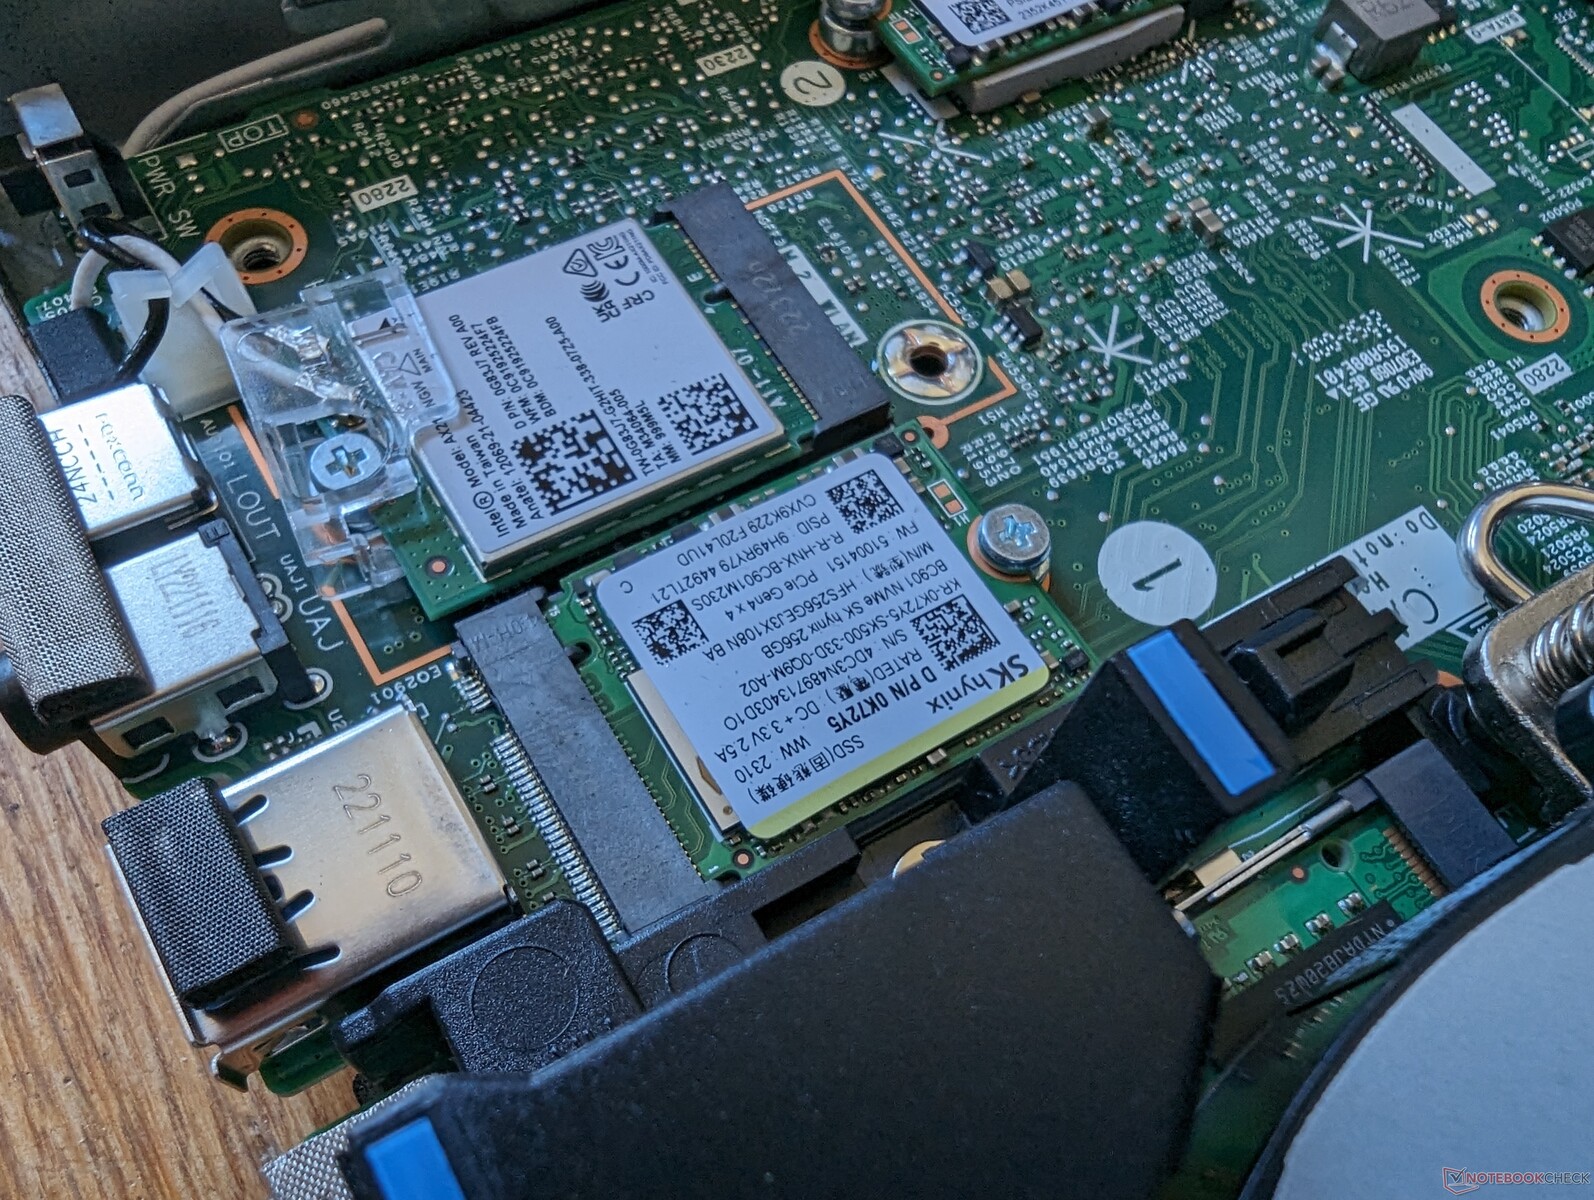
Onderhoud
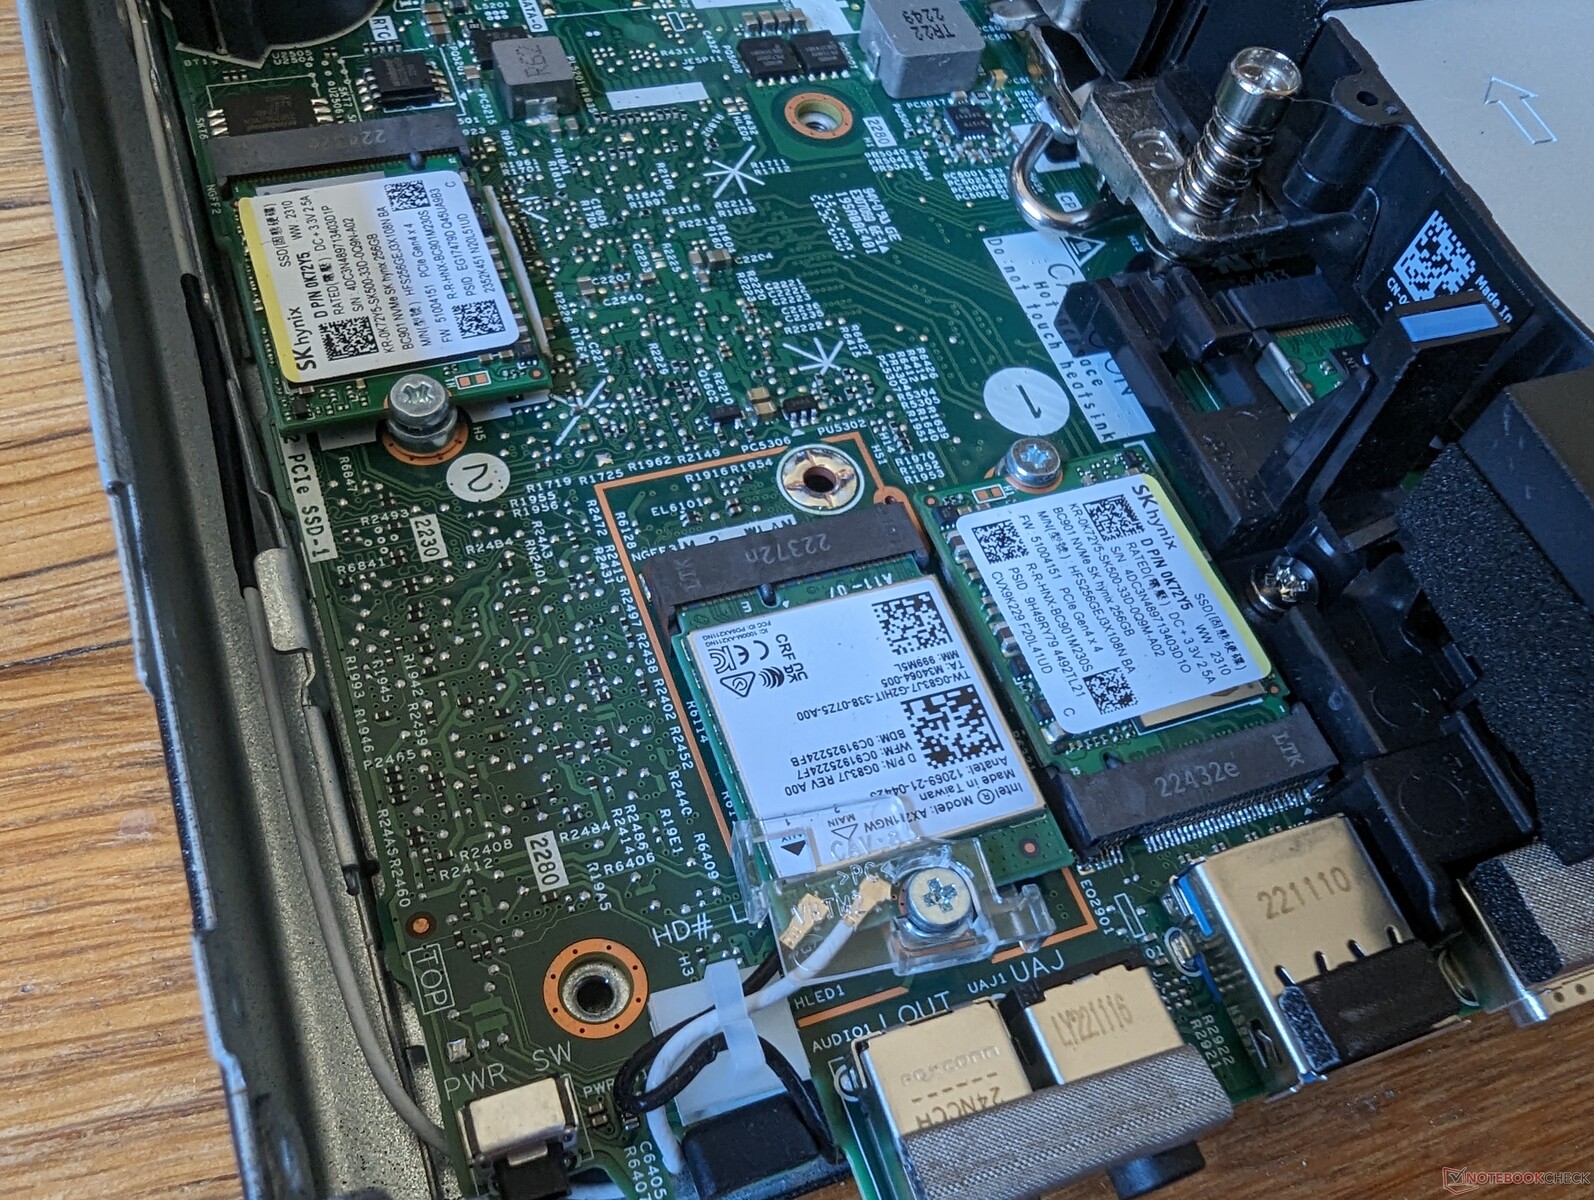
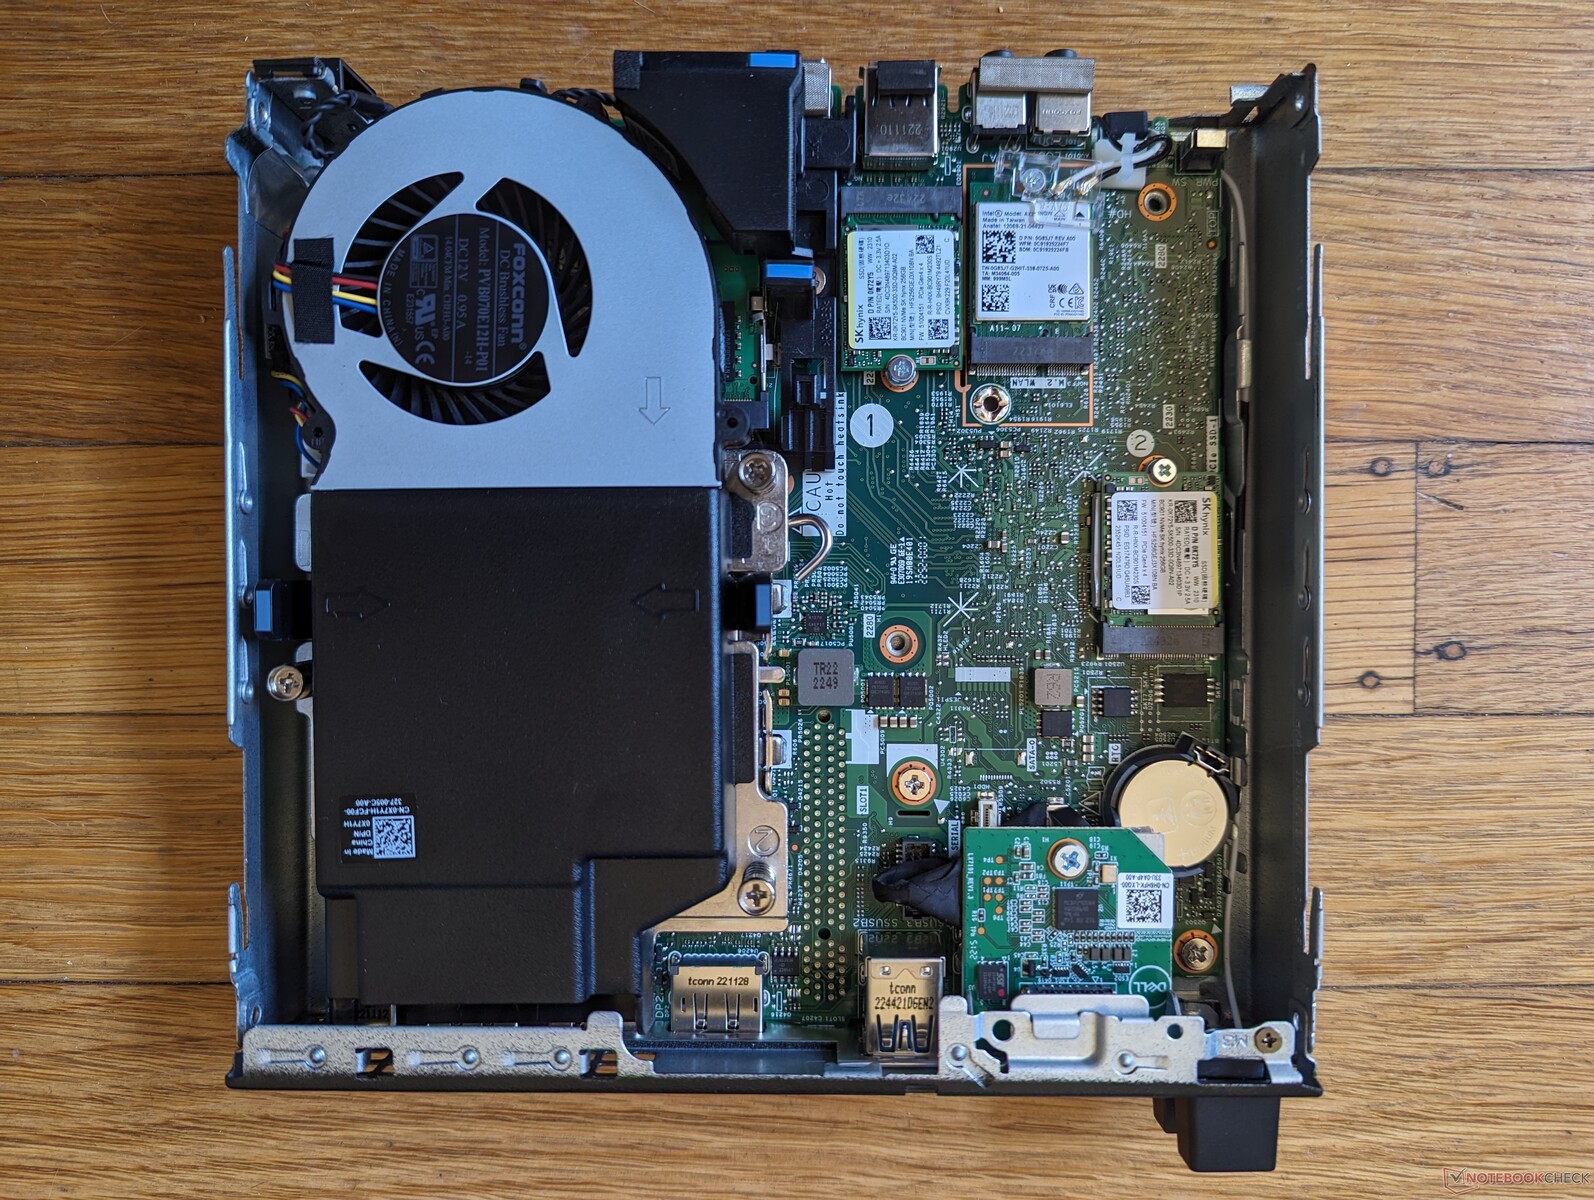
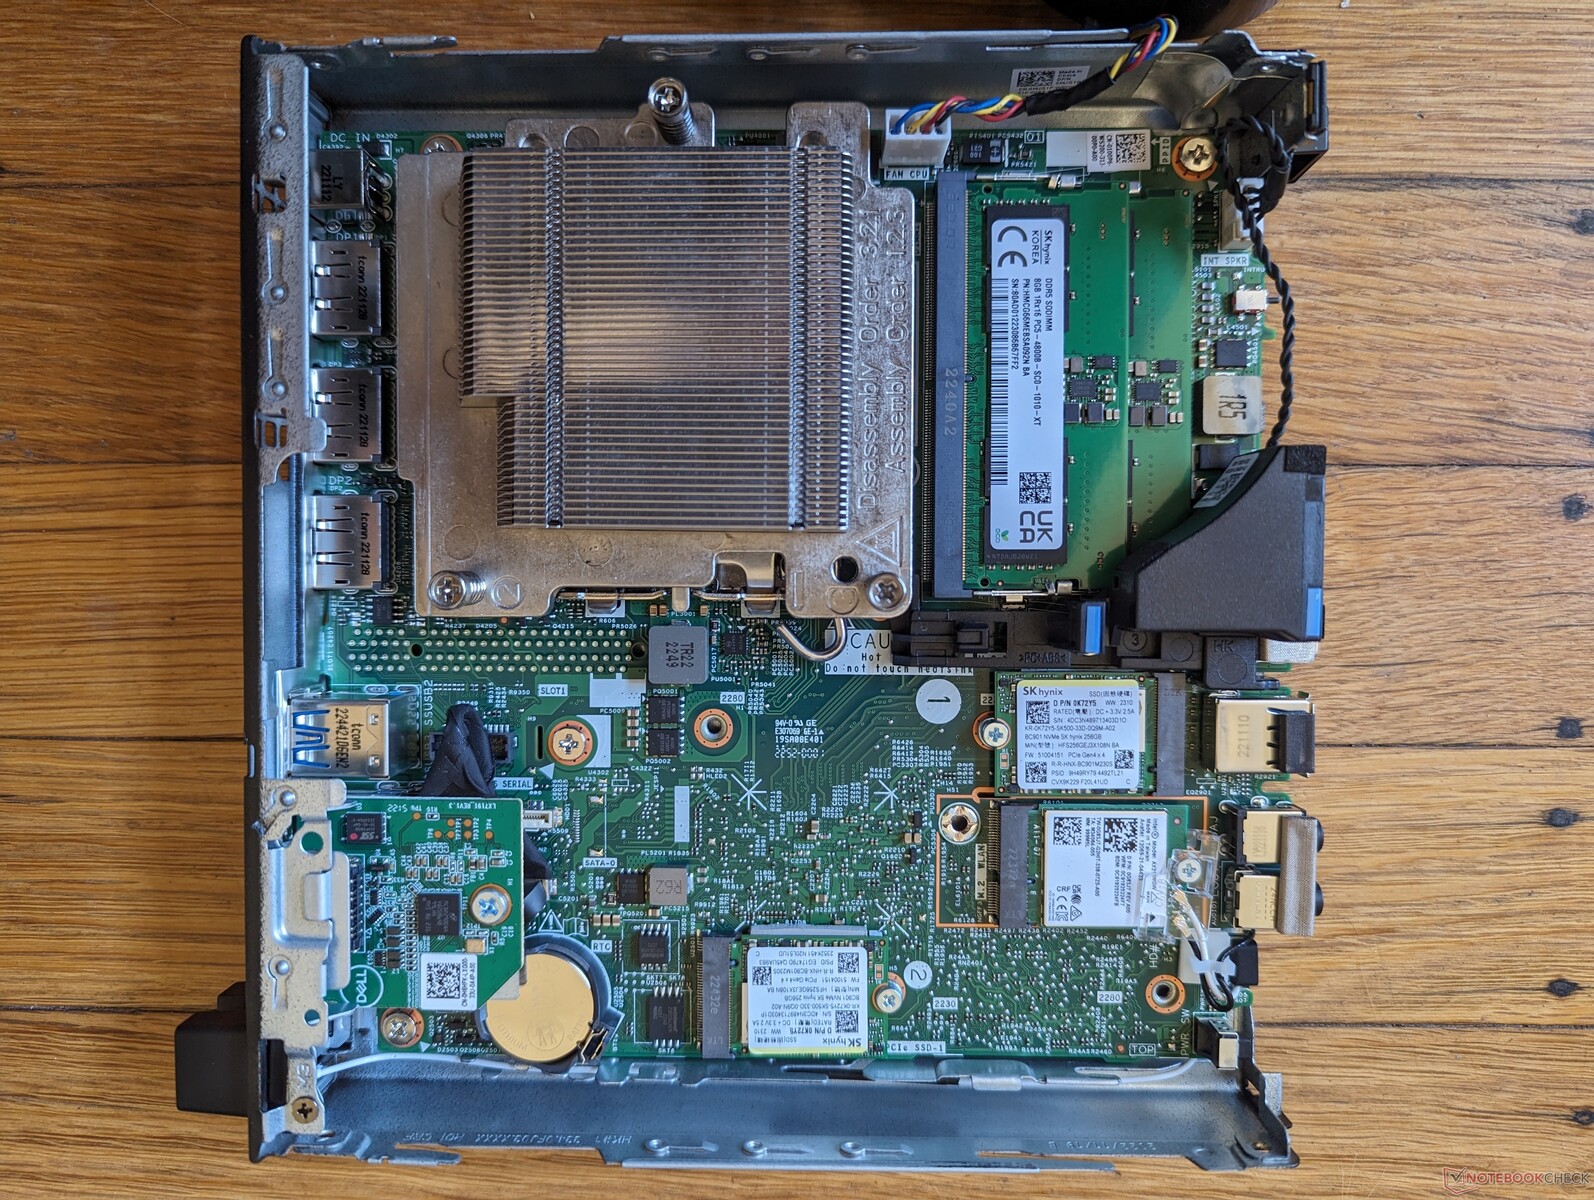
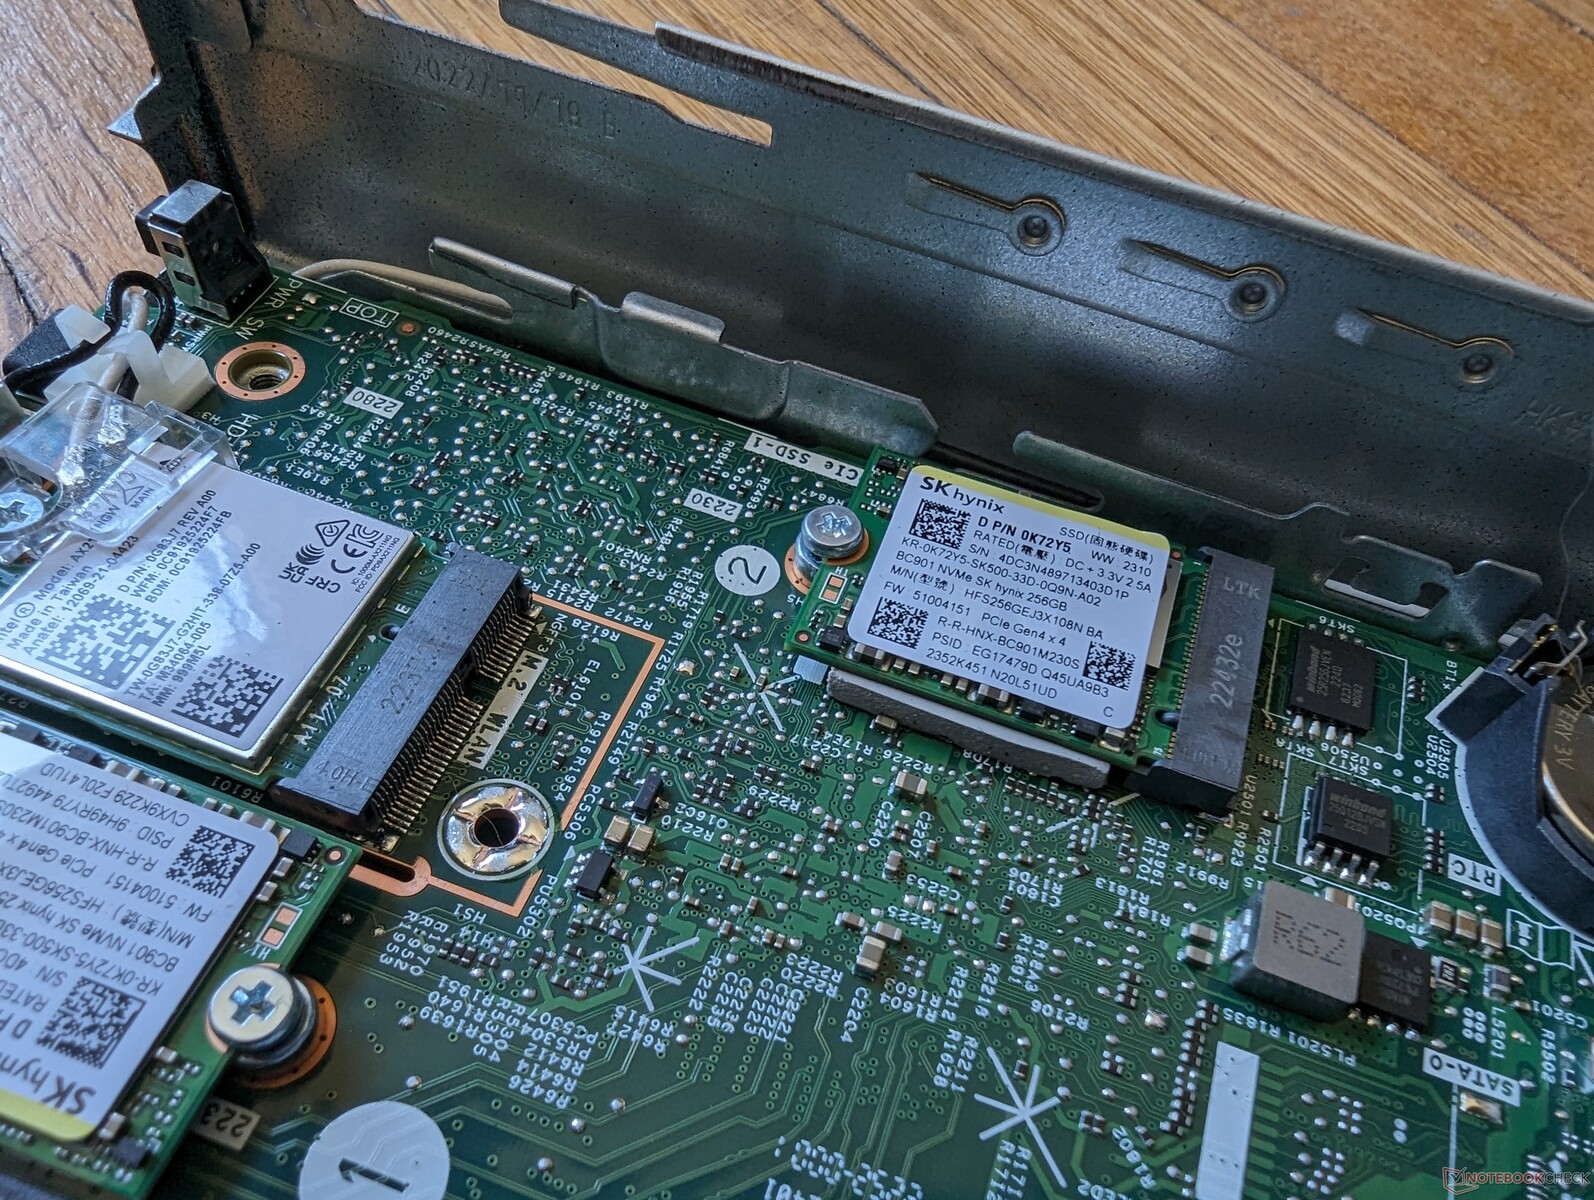
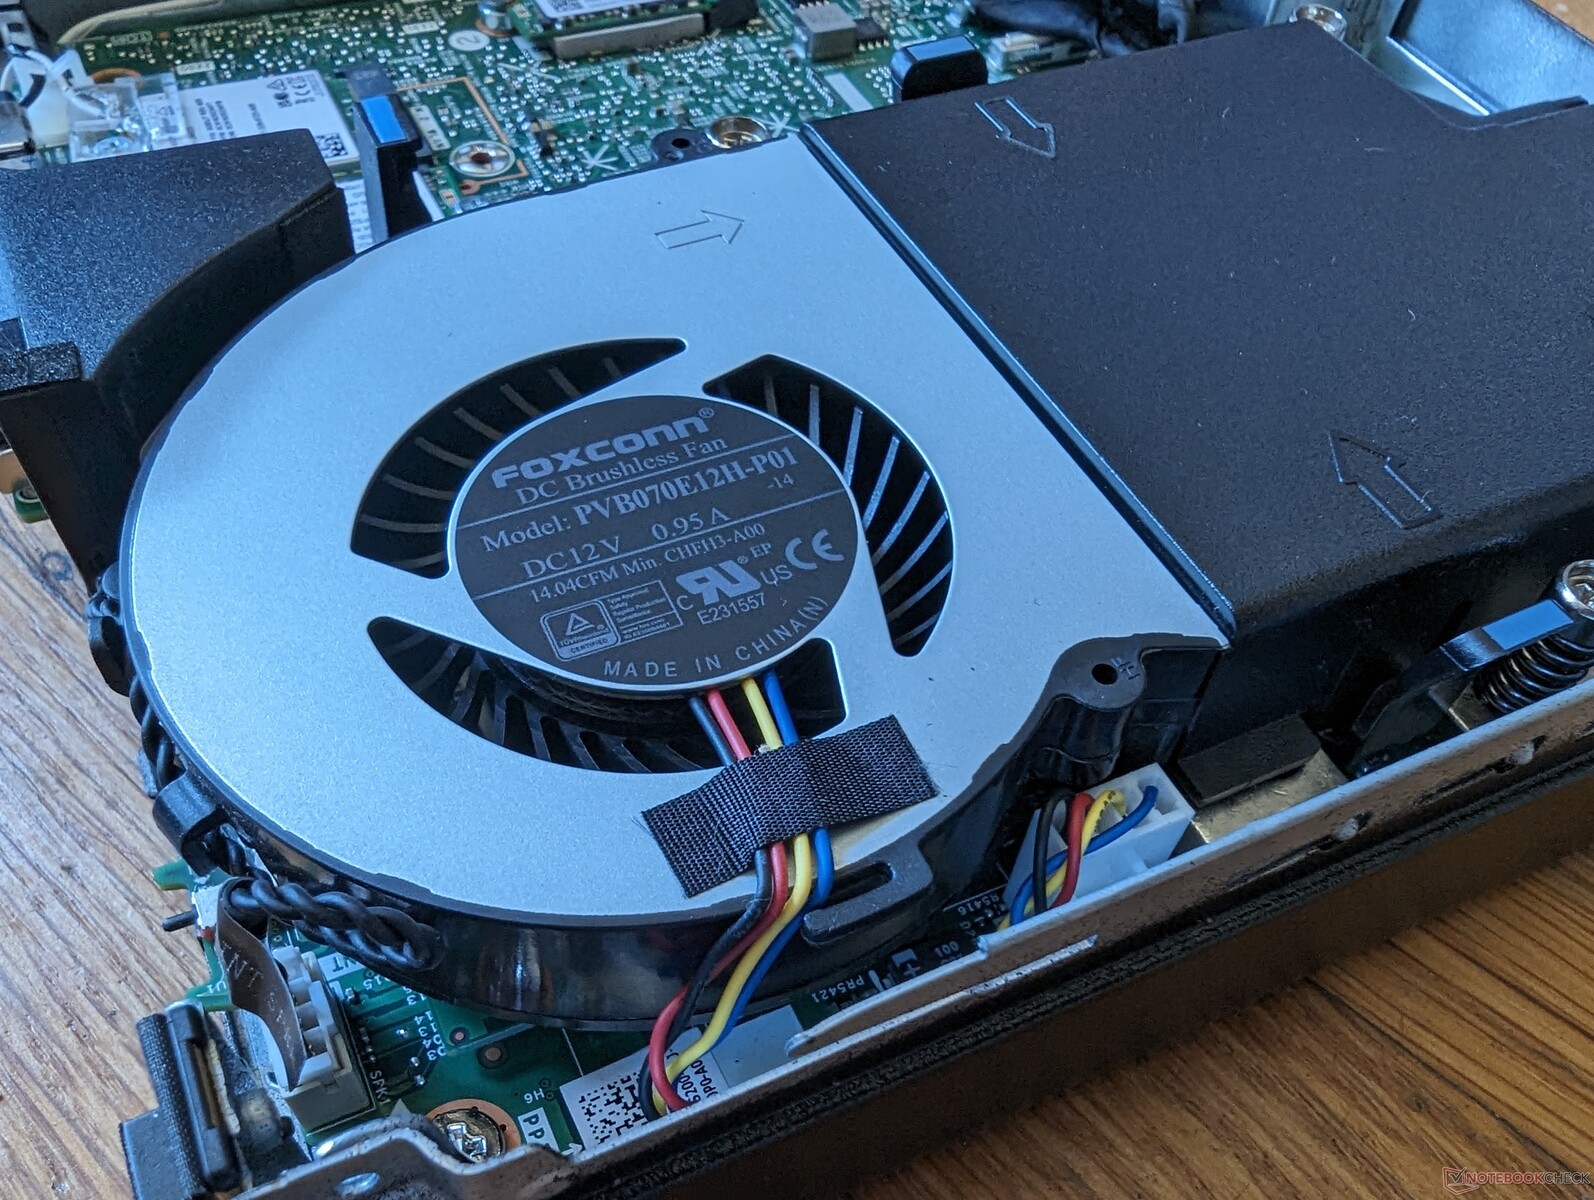
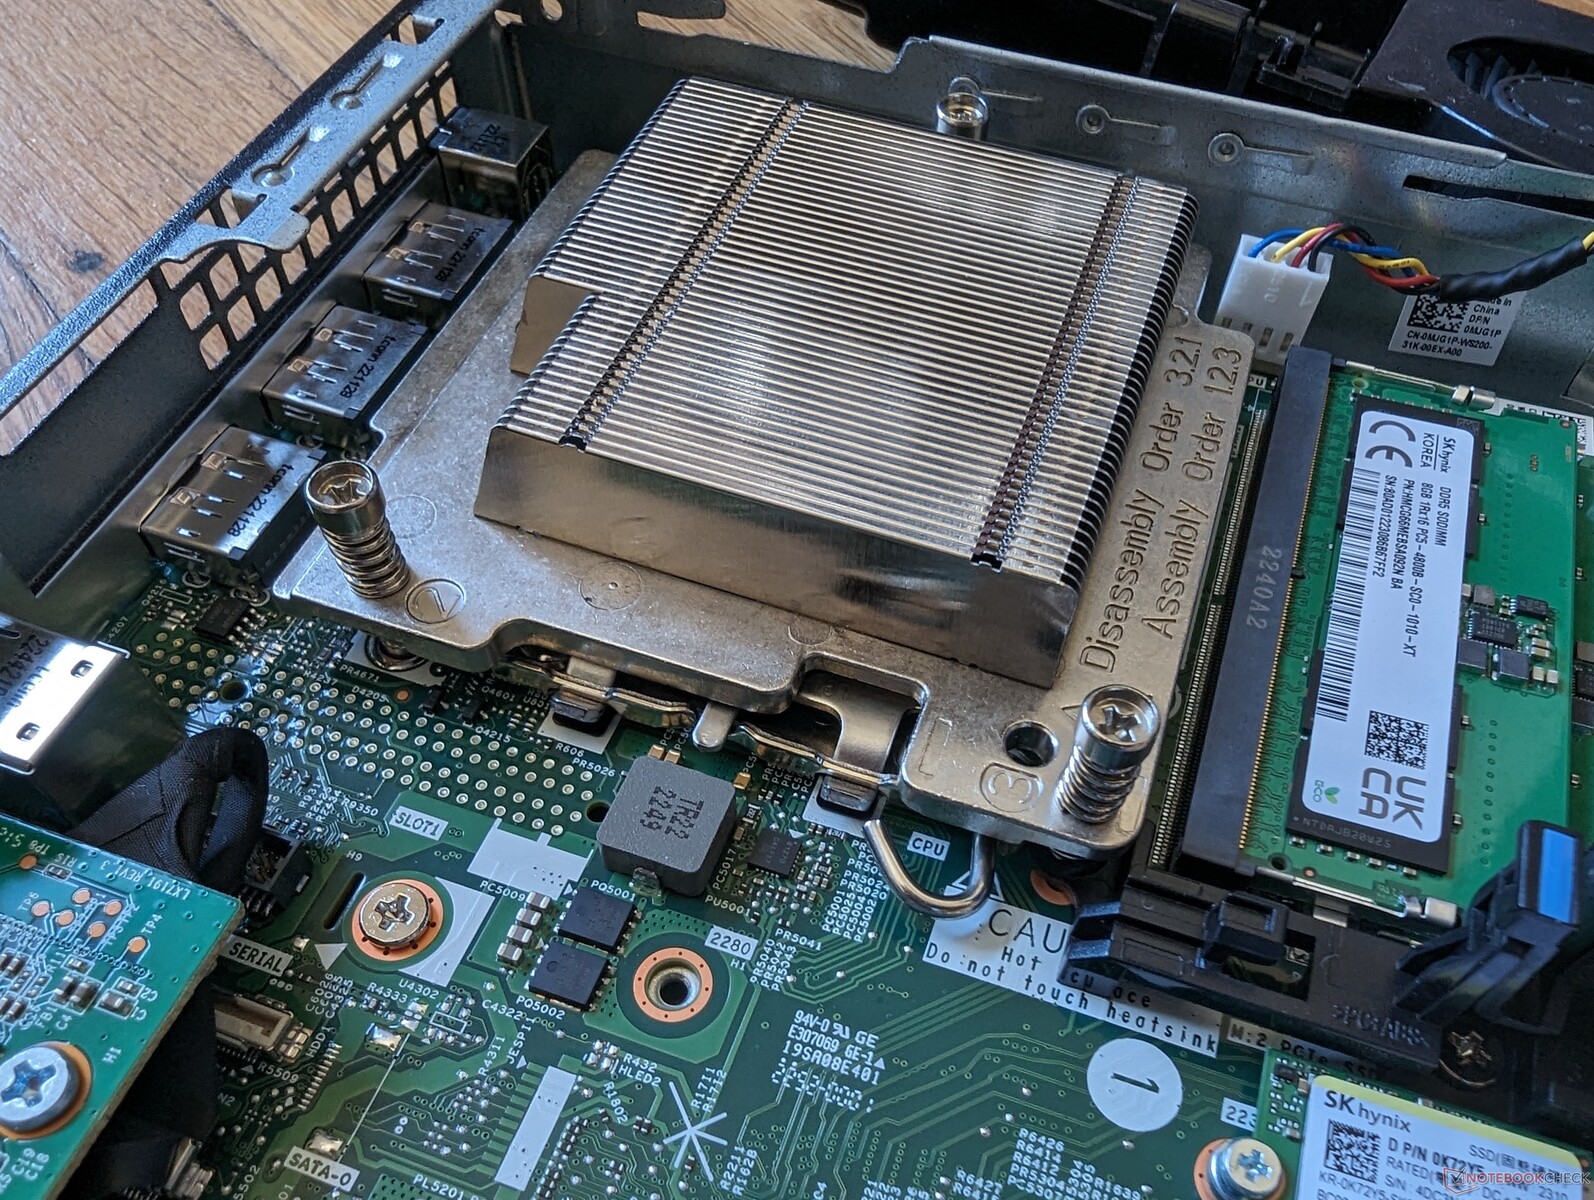
Het bovenpaneel glijdt er gemakkelijk af na het verwijderen van slechts één duimschroef aan de achterkant om de verwijderbare WLAN-module en twee SSD-sleuven te onthullen. De ventilator moet worden verwijderd om toegang te krijgen tot de twee SODIMM-sleuven, maar het hele proces is gereedschapsloos voor eenvoudig onderhoud.
Merk op dat de FCLGA1700 processor verwijderbaar en verwisselbaar is, in tegenstelling tot de meeste andere mini PC's.
Accessoires en garantie
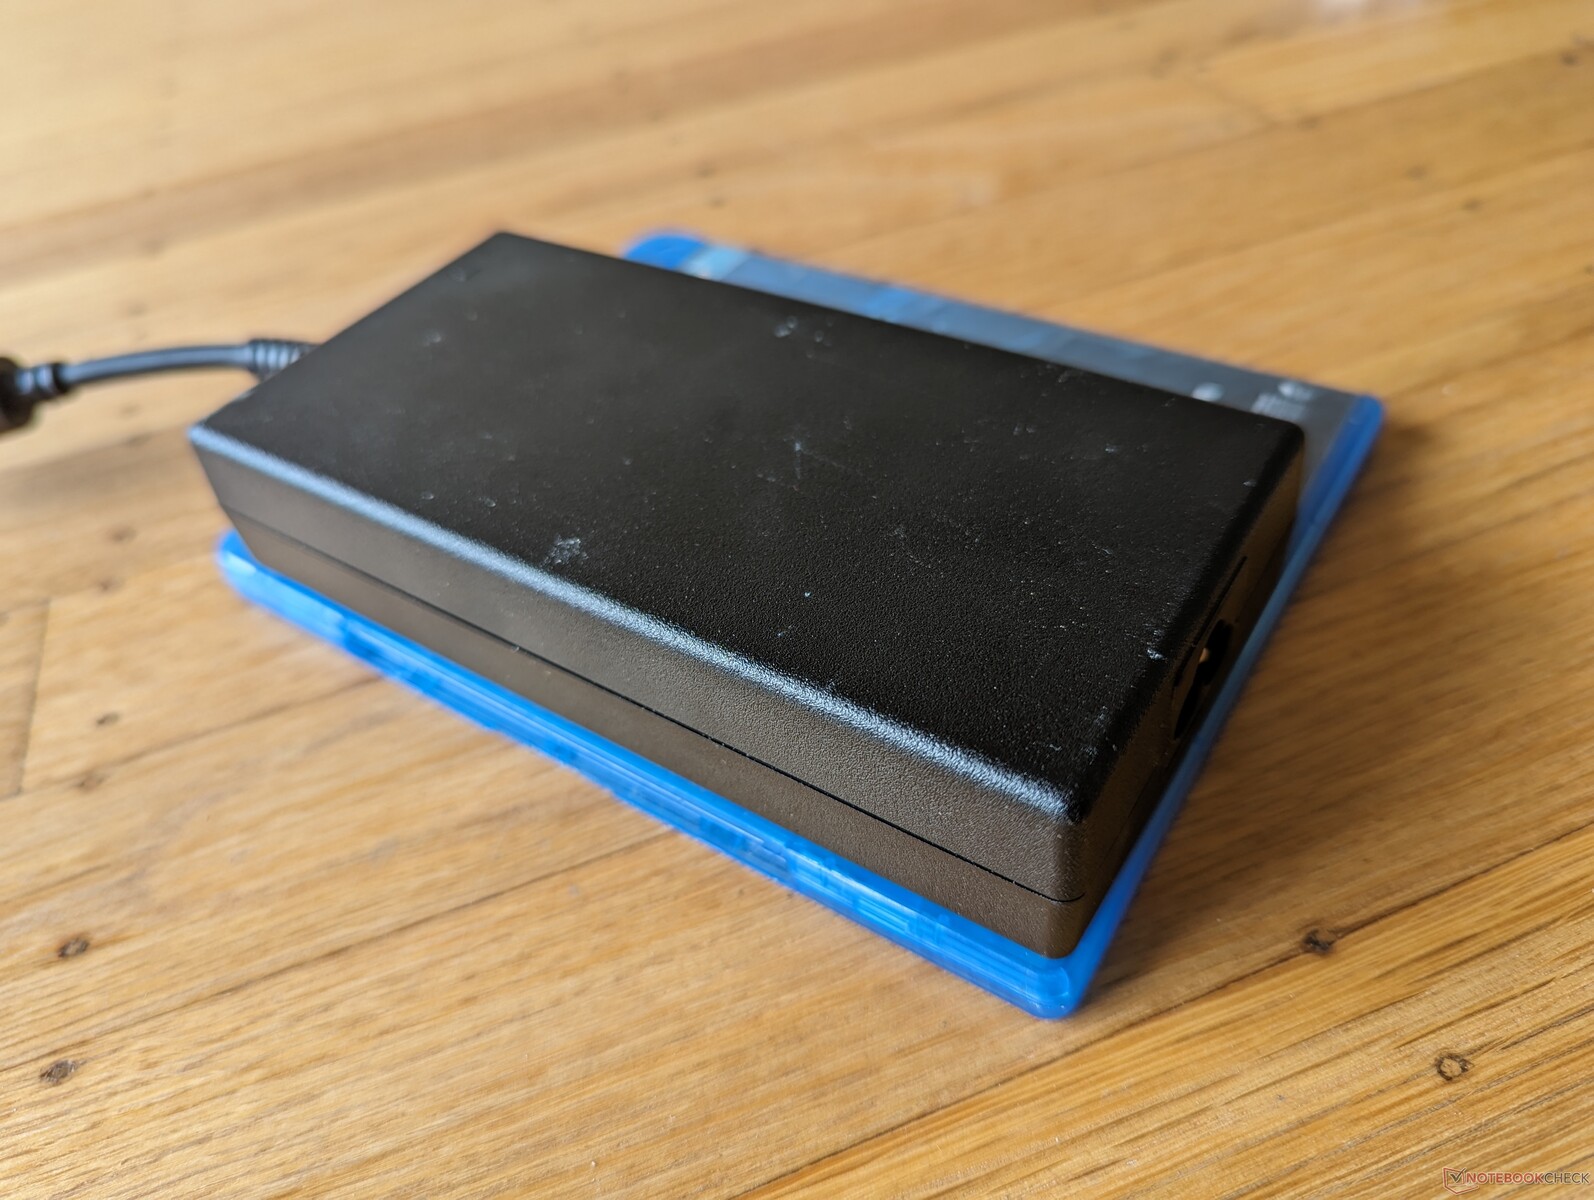
Er zitten geen extra's in de doos behalve de externe voeding en papierwerk. Het is jammer dat de verticale standaard apart wordt verkocht, want het systeem kan vrij gemakkelijk omvallen.
Er geldt een beperkte fabrieksgarantie van drie jaar, net als op de meeste andere high-end pc's van Dell die gericht zijn op zakelijk gebruik.
Prestaties - Desktop CPU Vermogen
Testomstandigheden
We hebben Windows ingesteld op de modus Prestaties voordat we de onderstaande benchmarks uitvoerden. Dell Optimizer is vooraf geïnstalleerd, maar biedt geen speciale energieprofielen, zoals bij de meeste Dell laptops.
Processor
De CPU-prestaties zijn ongelooflijk voor deze vormfactor. In vergelijking met de H-serie Core i7-13700H zoals die te vinden is op laptops zoals de Inspiron 16 Plus 7630biedt onze Core i7-13700 uit de desktop-serie 15 tot 30 procent snellere multi-thread prestaties, voornamelijk dankzij het hogere energieverbruik en de snellere kloksnelheden. De voordelen ten opzichte van de Apple M2 zijn merkbaar wanneer het aankomt op CPU-zware belastingen.
Helaas is de Core i7-13700 in de OptiPlex Micro gevoeliger voor throttling in vergelijking met een grotere desktop met dezelfde processor. Onze referentie Core i7-13700 die op een full-size tower draait, zou bijvoorbeeld multi-thread benchmarkscores opleveren die 40 tot 60 procent sneller zijn dan onze mini PC. Dit wil niet zeggen dat het Dell apparaat traag is, maar het valt niet te ontkennen dat de kleine koeloplossing een beperkende factor is. Bij het uitvoeren van CineBench R15 xT in een loop, bijvoorbeeld, daalden de prestaties met ongeveer 20 procent na de eerste paar loops, wat duidt op throttling gedrag.
Cinebench R15 Multi Loop
Cinebench R23: Multi Core | Single Core
Cinebench R20: CPU (Multi Core) | CPU (Single Core)
Cinebench R15: CPU Multi 64Bit | CPU Single 64Bit
Blender: v2.79 BMW27 CPU
7-Zip 18.03: 7z b 4 | 7z b 4 -mmt1
Geekbench 5.5: Multi-Core | Single-Core
HWBOT x265 Benchmark v2.2: 4k Preset
LibreOffice : 20 Documents To PDF
R Benchmark 2.5: Overall mean
| CPU Performance rating | |
| Intel Core i7-13700 | |
| Gemiddeld Intel Core i7-13700 | |
| Dell OptiPlex Micro | |
| Alienware m16 R1 Intel | |
| Beelink GTR7 7840HS | |
| Lenovo IdeaCentre Mini 01IRH8 | |
| Intel NUC 12, NUC12SNKi72_Serpent Canyon | |
| GMK NucBox K3 Pro | |
| Acemagic AM20 | |
| Apple Mac Mini M2 -5! | |
| Geekom A5 | |
| Acemagic AD15 | |
| Minisforum Venus Series UN1245 | |
| Cinebench R23 / Multi Core | |
| Intel Core i7-13700 | |
| Gemiddeld Intel Core i7-13700 (21013 - 29725, n=2) | |
| Alienware m16 R1 Intel | |
| Dell OptiPlex Micro | |
| Beelink GTR7 7840HS | |
| Intel NUC 12, NUC12SNKi72_Serpent Canyon | |
| Lenovo IdeaCentre Mini 01IRH8 | |
| Acemagic AM20 | |
| Geekom A5 | |
| GMK NucBox K3 Pro | |
| Acemagic AD15 | |
| Minisforum Venus Series UN1245 | |
| Apple Mac Mini M2 | |
| Cinebench R23 / Single Core | |
| Intel Core i7-13700 | |
| Gemiddeld Intel Core i7-13700 (1997 - 2020, n=2) | |
| Dell OptiPlex Micro | |
| Alienware m16 R1 Intel | |
| Lenovo IdeaCentre Mini 01IRH8 | |
| Beelink GTR7 7840HS | |
| Intel NUC 12, NUC12SNKi72_Serpent Canyon | |
| GMK NucBox K3 Pro | |
| Minisforum Venus Series UN1245 | |
| Apple Mac Mini M2 | |
| Acemagic AM20 | |
| Acemagic AD15 | |
| Geekom A5 | |
| Cinebench R20 / CPU (Multi Core) | |
| Intel Core i7-13700 | |
| Gemiddeld Intel Core i7-13700 (7027 - 11361, n=2) | |
| Alienware m16 R1 Intel | |
| Dell OptiPlex Micro | |
| Beelink GTR7 7840HS | |
| Intel NUC 12, NUC12SNKi72_Serpent Canyon | |
| Lenovo IdeaCentre Mini 01IRH8 | |
| Acemagic AM20 | |
| Geekom A5 | |
| GMK NucBox K3 Pro | |
| Acemagic AD15 | |
| Minisforum Venus Series UN1245 | |
| Apple Mac Mini M2 | |
| Cinebench R20 / CPU (Single Core) | |
| Intel Core i7-13700 | |
| Gemiddeld Intel Core i7-13700 (703 - 776, n=2) | |
| Alienware m16 R1 Intel | |
| Lenovo IdeaCentre Mini 01IRH8 | |
| Beelink GTR7 7840HS | |
| Dell OptiPlex Micro | |
| Intel NUC 12, NUC12SNKi72_Serpent Canyon | |
| GMK NucBox K3 Pro | |
| Minisforum Venus Series UN1245 | |
| Acemagic AM20 | |
| Acemagic AD15 | |
| Geekom A5 | |
| Apple Mac Mini M2 | |
| Cinebench R15 / CPU Multi 64Bit | |
| Intel Core i7-13700 | |
| Gemiddeld Intel Core i7-13700 (2986 - 4398, n=2) | |
| Alienware m16 R1 Intel | |
| Dell OptiPlex Micro | |
| Beelink GTR7 7840HS | |
| Intel NUC 12, NUC12SNKi72_Serpent Canyon | |
| Lenovo IdeaCentre Mini 01IRH8 | |
| Acemagic AM20 | |
| Geekom A5 | |
| GMK NucBox K3 Pro | |
| Acemagic AD15 | |
| Minisforum Venus Series UN1245 | |
| Apple Mac Mini M2 | |
| Cinebench R15 / CPU Single 64Bit | |
| Intel Core i7-13700 | |
| Beelink GTR7 7840HS | |
| Gemiddeld Intel Core i7-13700 (279 - 291, n=2) | |
| Dell OptiPlex Micro | |
| Alienware m16 R1 Intel | |
| Lenovo IdeaCentre Mini 01IRH8 | |
| Intel NUC 12, NUC12SNKi72_Serpent Canyon | |
| GMK NucBox K3 Pro | |
| Acemagic AM20 | |
| Minisforum Venus Series UN1245 | |
| Apple Mac Mini M2 | |
| Geekom A5 | |
| Acemagic AD15 | |
| Blender / v2.79 BMW27 CPU | |
| Apple Mac Mini M2 | |
| Minisforum Venus Series UN1245 | |
| GMK NucBox K3 Pro | |
| Acemagic AD15 | |
| Geekom A5 | |
| Acemagic AM20 | |
| Beelink GTR7 7840HS | |
| Lenovo IdeaCentre Mini 01IRH8 | |
| Intel NUC 12, NUC12SNKi72_Serpent Canyon | |
| Dell OptiPlex Micro | |
| Alienware m16 R1 Intel | |
| Gemiddeld Intel Core i7-13700 (111 - 178, n=2) | |
| Intel Core i7-13700 | |
| 7-Zip 18.03 / 7z b 4 | |
| Intel Core i7-13700 | |
| Gemiddeld Intel Core i7-13700 (74475 - 108733, n=2) | |
| Alienware m16 R1 Intel | |
| Dell OptiPlex Micro | |
| Beelink GTR7 7840HS | |
| Intel NUC 12, NUC12SNKi72_Serpent Canyon | |
| Lenovo IdeaCentre Mini 01IRH8 | |
| Geekom A5 | |
| Acemagic AM20 | |
| Acemagic AD15 | |
| GMK NucBox K3 Pro | |
| Minisforum Venus Series UN1245 | |
| 7-Zip 18.03 / 7z b 4 -mmt1 | |
| Intel Core i7-13700 | |
| Beelink GTR7 7840HS | |
| Gemiddeld Intel Core i7-13700 (6466 - 6819, n=2) | |
| Dell OptiPlex Micro | |
| Alienware m16 R1 Intel | |
| Lenovo IdeaCentre Mini 01IRH8 | |
| Intel NUC 12, NUC12SNKi72_Serpent Canyon | |
| GMK NucBox K3 Pro | |
| Acemagic AD15 | |
| Acemagic AM20 | |
| Geekom A5 | |
| Minisforum Venus Series UN1245 | |
| Geekbench 5.5 / Multi-Core | |
| Intel Core i7-13700 | |
| Gemiddeld Intel Core i7-13700 (15525 - 19602, n=2) | |
| Dell OptiPlex Micro | |
| Alienware m16 R1 Intel | |
| Beelink GTR7 7840HS | |
| Lenovo IdeaCentre Mini 01IRH8 | |
| Intel NUC 12, NUC12SNKi72_Serpent Canyon | |
| GMK NucBox K3 Pro | |
| Apple Mac Mini M2 | |
| Geekom A5 | |
| Acemagic AM20 | |
| Acemagic AD15 | |
| Minisforum Venus Series UN1245 | |
| Geekbench 5.5 / Single-Core | |
| Beelink GTR7 7840HS | |
| Intel Core i7-13700 | |
| Gemiddeld Intel Core i7-13700 (1958 - 2009, n=2) | |
| Dell OptiPlex Micro | |
| Apple Mac Mini M2 | |
| Alienware m16 R1 Intel | |
| Lenovo IdeaCentre Mini 01IRH8 | |
| GMK NucBox K3 Pro | |
| Minisforum Venus Series UN1245 | |
| Acemagic AD15 | |
| Intel NUC 12, NUC12SNKi72_Serpent Canyon | |
| Acemagic AM20 | |
| Geekom A5 | |
| HWBOT x265 Benchmark v2.2 / 4k Preset | |
| Intel Core i7-13700 | |
| Gemiddeld Intel Core i7-13700 (21.4 - 33.1, n=2) | |
| Alienware m16 R1 Intel | |
| Dell OptiPlex Micro | |
| Intel NUC 12, NUC12SNKi72_Serpent Canyon | |
| Lenovo IdeaCentre Mini 01IRH8 | |
| Acemagic AM20 | |
| Geekom A5 | |
| GMK NucBox K3 Pro | |
| Acemagic AD15 | |
| Beelink GTR7 7840HS | |
| Minisforum Venus Series UN1245 | |
| LibreOffice / 20 Documents To PDF | |
| Geekom A5 | |
| Minisforum Venus Series UN1245 | |
| Acemagic AD15 | |
| Acemagic AM20 | |
| Alienware m16 R1 Intel | |
| Intel NUC 12, NUC12SNKi72_Serpent Canyon | |
| GMK NucBox K3 Pro | |
| Beelink GTR7 7840HS | |
| Lenovo IdeaCentre Mini 01IRH8 | |
| Dell OptiPlex Micro | |
| Gemiddeld Intel Core i7-13700 (34.1 - 36.4, n=2) | |
| Intel Core i7-13700 | |
| R Benchmark 2.5 / Overall mean | |
| Acemagic AD15 | |
| Acemagic AM20 | |
| Geekom A5 | |
| Minisforum Venus Series UN1245 | |
| GMK NucBox K3 Pro | |
| Intel NUC 12, NUC12SNKi72_Serpent Canyon | |
| Lenovo IdeaCentre Mini 01IRH8 | |
| Alienware m16 R1 Intel | |
| Dell OptiPlex Micro | |
| Beelink GTR7 7840HS | |
| Gemiddeld Intel Core i7-13700 (0.4075 - 0.423, n=2) | |
| Intel Core i7-13700 | |
Cinebench R23: Multi Core | Single Core
Cinebench R20: CPU (Multi Core) | CPU (Single Core)
Cinebench R15: CPU Multi 64Bit | CPU Single 64Bit
Blender: v2.79 BMW27 CPU
7-Zip 18.03: 7z b 4 | 7z b 4 -mmt1
Geekbench 5.5: Multi-Core | Single-Core
HWBOT x265 Benchmark v2.2: 4k Preset
LibreOffice : 20 Documents To PDF
R Benchmark 2.5: Overall mean
* ... kleiner is beter
AIDA64: FP32 Ray-Trace | FPU Julia | CPU SHA3 | CPU Queen | FPU SinJulia | FPU Mandel | CPU AES | CPU ZLib | FP64 Ray-Trace | CPU PhotoWorxx
| Performance rating | |
| Beelink GTR7 7840HS | |
| Beelink SER7 | |
| Gemiddeld Intel Core i7-13700 | |
| Dell OptiPlex Micro | |
| Lenovo IdeaCentre Mini 01IRH8 | |
| GMK NucBox K3 Pro | |
| AIDA64 / FP32 Ray-Trace | |
| Beelink GTR7 7840HS | |
| Beelink SER7 | |
| Gemiddeld Intel Core i7-13700 (16408 - 29348, n=2) | |
| Dell OptiPlex Micro | |
| Lenovo IdeaCentre Mini 01IRH8 | |
| GMK NucBox K3 Pro | |
| AIDA64 / FPU Julia | |
| Beelink GTR7 7840HS | |
| Gemiddeld Intel Core i7-13700 (83757 - 138865, n=2) | |
| Beelink SER7 | |
| Dell OptiPlex Micro | |
| Lenovo IdeaCentre Mini 01IRH8 | |
| GMK NucBox K3 Pro | |
| AIDA64 / CPU SHA3 | |
| Beelink GTR7 7840HS | |
| Gemiddeld Intel Core i7-13700 (3648 - 6169, n=2) | |
| Beelink SER7 | |
| Dell OptiPlex Micro | |
| Lenovo IdeaCentre Mini 01IRH8 | |
| GMK NucBox K3 Pro | |
| AIDA64 / CPU Queen | |
| Gemiddeld Intel Core i7-13700 (113697 - 128088, n=2) | |
| Beelink GTR7 7840HS | |
| Dell OptiPlex Micro | |
| Beelink SER7 | |
| Lenovo IdeaCentre Mini 01IRH8 | |
| GMK NucBox K3 Pro | |
| AIDA64 / FPU SinJulia | |
| Beelink GTR7 7840HS | |
| Beelink SER7 | |
| Gemiddeld Intel Core i7-13700 (10833 - 15314, n=2) | |
| Dell OptiPlex Micro | |
| Lenovo IdeaCentre Mini 01IRH8 | |
| GMK NucBox K3 Pro | |
| AIDA64 / FPU Mandel | |
| Beelink GTR7 7840HS | |
| Beelink SER7 | |
| Gemiddeld Intel Core i7-13700 (40920 - 72217, n=2) | |
| Dell OptiPlex Micro | |
| Lenovo IdeaCentre Mini 01IRH8 | |
| GMK NucBox K3 Pro | |
| AIDA64 / CPU AES | |
| Beelink GTR7 7840HS | |
| Beelink SER7 | |
| Gemiddeld Intel Core i7-13700 (76357 - 120512, n=2) | |
| GMK NucBox K3 Pro | |
| Dell OptiPlex Micro | |
| Lenovo IdeaCentre Mini 01IRH8 | |
| AIDA64 / CPU ZLib | |
| Gemiddeld Intel Core i7-13700 (1045 - 1703, n=2) | |
| Beelink GTR7 7840HS | |
| Dell OptiPlex Micro | |
| Lenovo IdeaCentre Mini 01IRH8 | |
| Beelink SER7 | |
| GMK NucBox K3 Pro | |
| AIDA64 / FP64 Ray-Trace | |
| Beelink GTR7 7840HS | |
| Beelink SER7 | |
| Gemiddeld Intel Core i7-13700 (8712 - 16164, n=2) | |
| Dell OptiPlex Micro | |
| Lenovo IdeaCentre Mini 01IRH8 | |
| GMK NucBox K3 Pro | |
| AIDA64 / CPU PhotoWorxx | |
| GMK NucBox K3 Pro | |
| Gemiddeld Intel Core i7-13700 (37819 - 48448, n=2) | |
| Beelink SER7 | |
| Beelink GTR7 7840HS | |
| Dell OptiPlex Micro | |
| Lenovo IdeaCentre Mini 01IRH8 | |
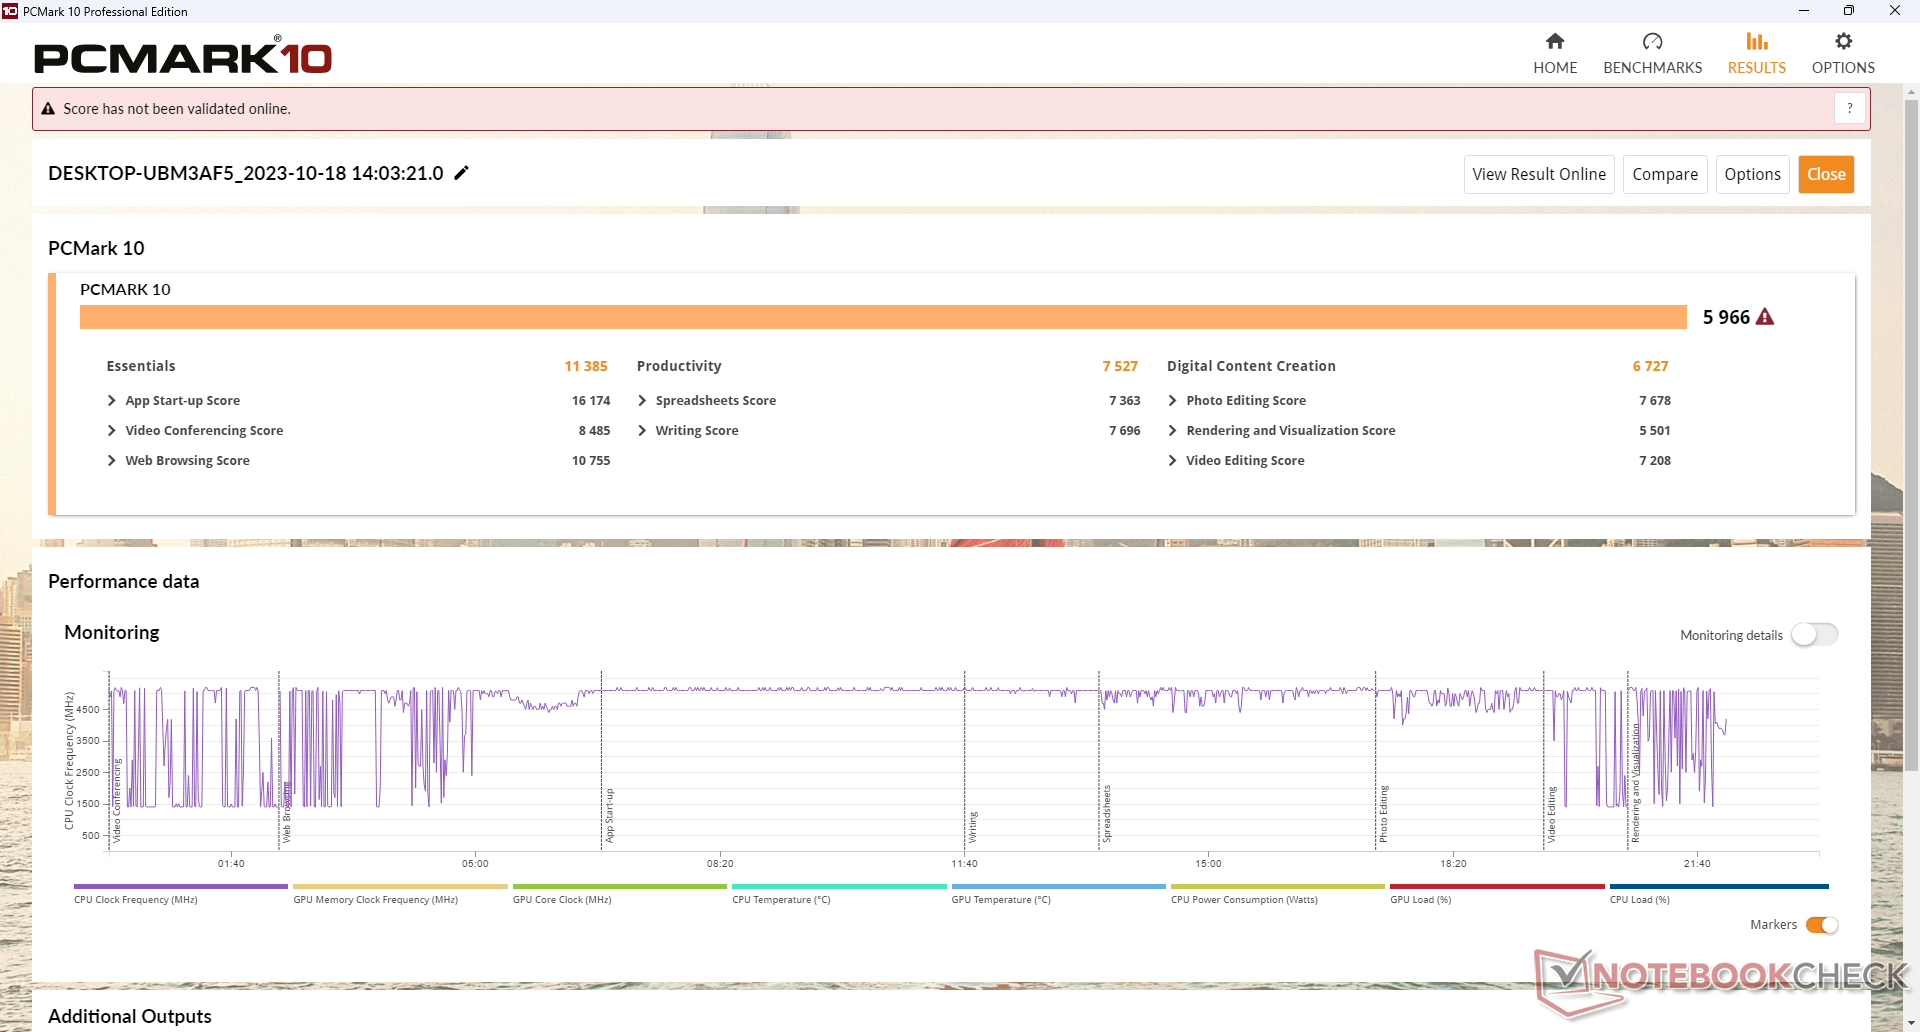
Systeemprestaties
PCMark resultaten zijn vergelijkbaar met deGMK NucBox K3 Pro maar liggen nog steeds achter op AMD-gebaseerde mini PC's zoals de Beelink SER7. De achterstand kan grotendeels worden toegeschreven aan de snellere geïntegreerde Radeon GPU op concurrerende Ryzen Zen 3+ of Zen 4 platforms.
CrossMark: Overall | Productivity | Creativity | Responsiveness
| PCMark 10 / Score | |
| Beelink GTR7 7840HS | |
| Beelink SER7 | |
| Lenovo IdeaCentre Mini 01IRH8 | |
| Dell OptiPlex Micro | |
| Gemiddeld Intel Core i7-13700, Intel UHD Graphics 770 (n=1) | |
| GMK NucBox K3 Pro | |
| PCMark 10 / Essentials | |
| Lenovo IdeaCentre Mini 01IRH8 | |
| Dell OptiPlex Micro | |
| Gemiddeld Intel Core i7-13700, Intel UHD Graphics 770 (n=1) | |
| Beelink GTR7 7840HS | |
| Beelink SER7 | |
| GMK NucBox K3 Pro | |
| PCMark 10 / Productivity | |
| Beelink GTR7 7840HS | |
| Beelink SER7 | |
| GMK NucBox K3 Pro | |
| Lenovo IdeaCentre Mini 01IRH8 | |
| Dell OptiPlex Micro | |
| Gemiddeld Intel Core i7-13700, Intel UHD Graphics 770 (n=1) | |
| PCMark 10 / Digital Content Creation | |
| Beelink GTR7 7840HS | |
| Beelink SER7 | |
| Lenovo IdeaCentre Mini 01IRH8 | |
| Dell OptiPlex Micro | |
| Gemiddeld Intel Core i7-13700, Intel UHD Graphics 770 (n=1) | |
| GMK NucBox K3 Pro | |
| CrossMark / Overall | |
| Dell OptiPlex Micro | |
| Gemiddeld Intel Core i7-13700, Intel UHD Graphics 770 (n=1) | |
| Lenovo IdeaCentre Mini 01IRH8 | |
| Beelink SER7 | |
| GMK NucBox K3 Pro | |
| Beelink GTR7 7840HS | |
| Apple Mac Mini M2 | |
| CrossMark / Productivity | |
| Dell OptiPlex Micro | |
| Gemiddeld Intel Core i7-13700, Intel UHD Graphics 770 (n=1) | |
| Lenovo IdeaCentre Mini 01IRH8 | |
| Beelink SER7 | |
| Beelink GTR7 7840HS | |
| GMK NucBox K3 Pro | |
| Apple Mac Mini M2 | |
| CrossMark / Creativity | |
| Dell OptiPlex Micro | |
| Gemiddeld Intel Core i7-13700, Intel UHD Graphics 770 (n=1) | |
| Beelink SER7 | |
| Lenovo IdeaCentre Mini 01IRH8 | |
| Apple Mac Mini M2 | |
| GMK NucBox K3 Pro | |
| Beelink GTR7 7840HS | |
| CrossMark / Responsiveness | |
| Beelink GTR7 7840HS | |
| Dell OptiPlex Micro | |
| Gemiddeld Intel Core i7-13700, Intel UHD Graphics 770 (n=1) | |
| Lenovo IdeaCentre Mini 01IRH8 | |
| GMK NucBox K3 Pro | |
| Beelink SER7 | |
| Apple Mac Mini M2 | |
| PCMark 10 Score | 5966 punten | |
Help | ||
| AIDA64 / Memory Copy | |
| GMK NucBox K3 Pro | |
| Beelink SER7 | |
| Beelink GTR7 7840HS | |
| Gemiddeld Intel Core i7-13700 (61152 - 73900, n=2) | |
| Dell OptiPlex Micro | |
| Lenovo IdeaCentre Mini 01IRH8 | |
| AIDA64 / Memory Read | |
| Gemiddeld Intel Core i7-13700 (71285 - 81167, n=2) | |
| Dell OptiPlex Micro | |
| GMK NucBox K3 Pro | |
| Beelink SER7 | |
| Beelink GTR7 7840HS | |
| Lenovo IdeaCentre Mini 01IRH8 | |
| AIDA64 / Memory Write | |
| Beelink SER7 | |
| Beelink GTR7 7840HS | |
| Gemiddeld Intel Core i7-13700 (60029 - 73720, n=2) | |
| Dell OptiPlex Micro | |
| GMK NucBox K3 Pro | |
| Lenovo IdeaCentre Mini 01IRH8 | |
| AIDA64 / Memory Latency | |
| GMK NucBox K3 Pro | |
| Dell OptiPlex Micro | |
| Beelink GTR7 7840HS | |
| Beelink SER7 | |
| Lenovo IdeaCentre Mini 01IRH8 | |
| Gemiddeld Intel Core i7-13700 (71.8 - 87, n=2) | |
* ... kleiner is beter
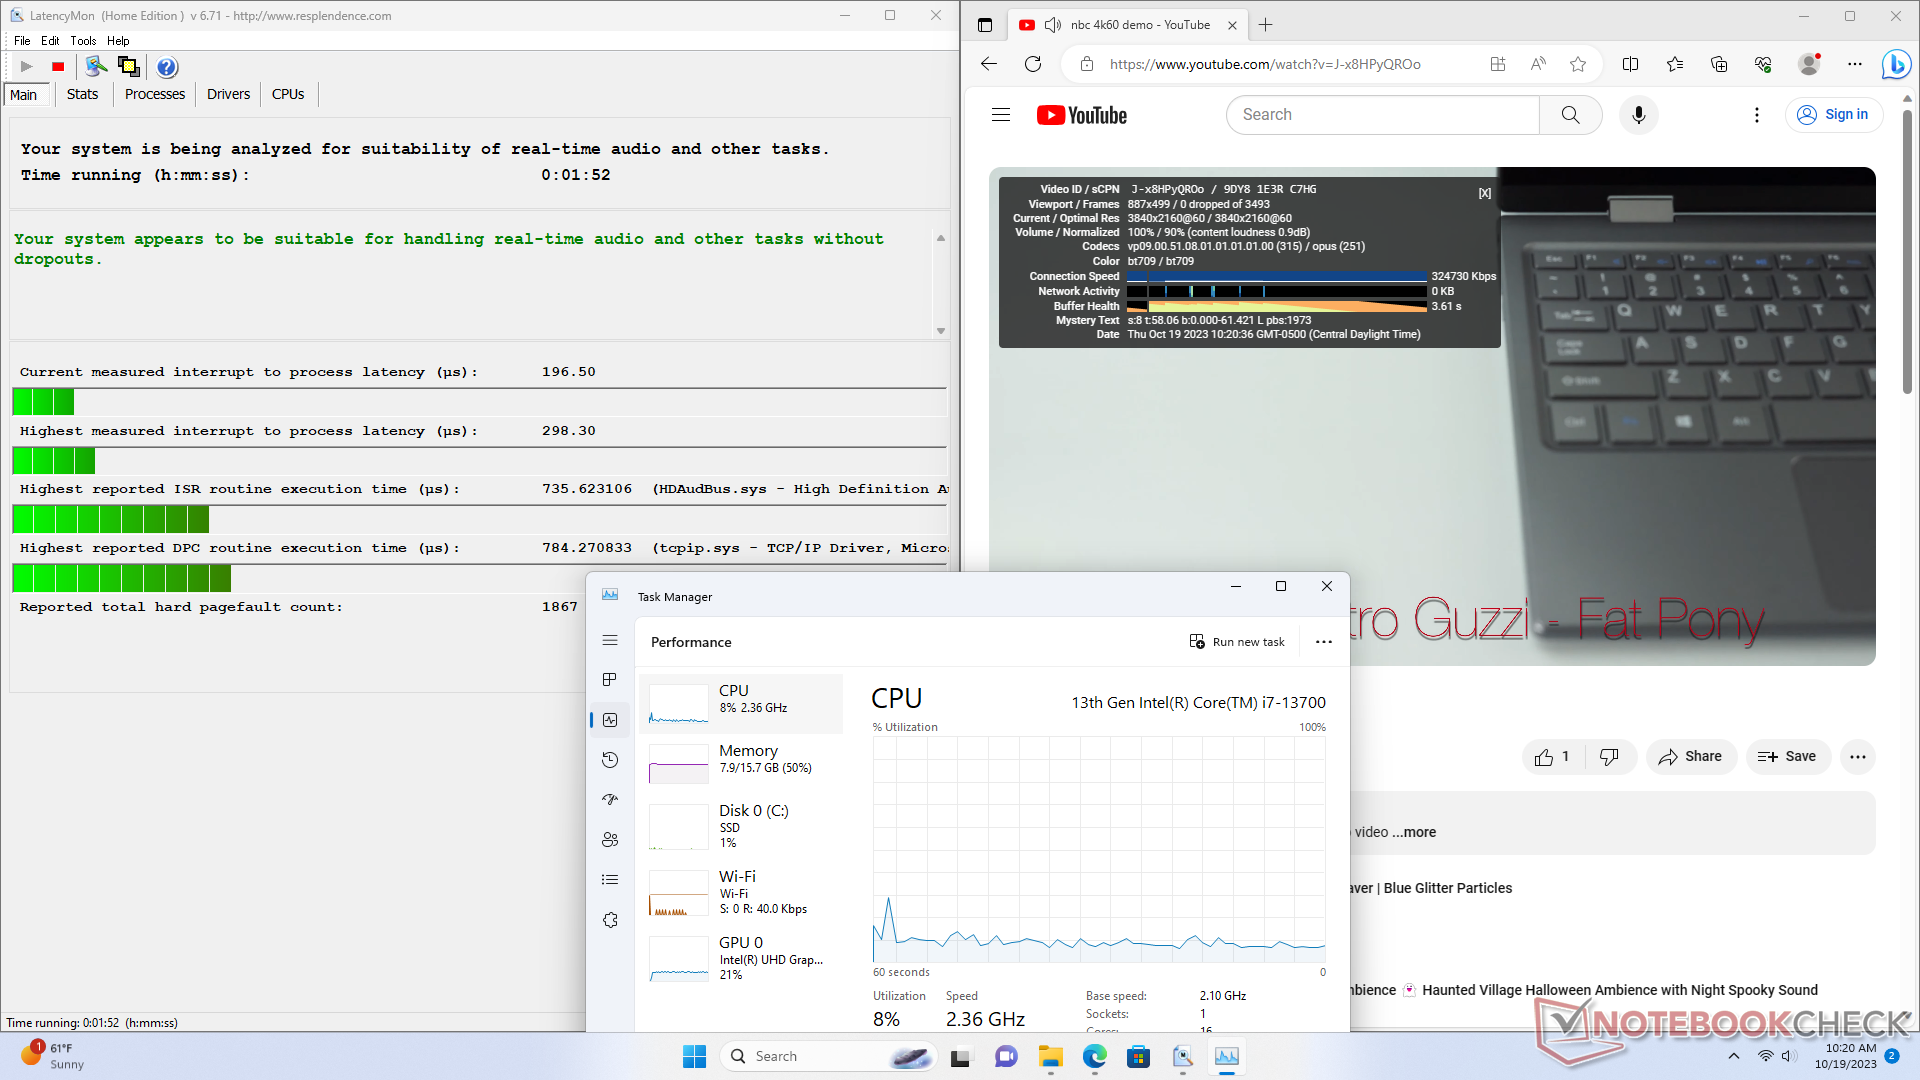
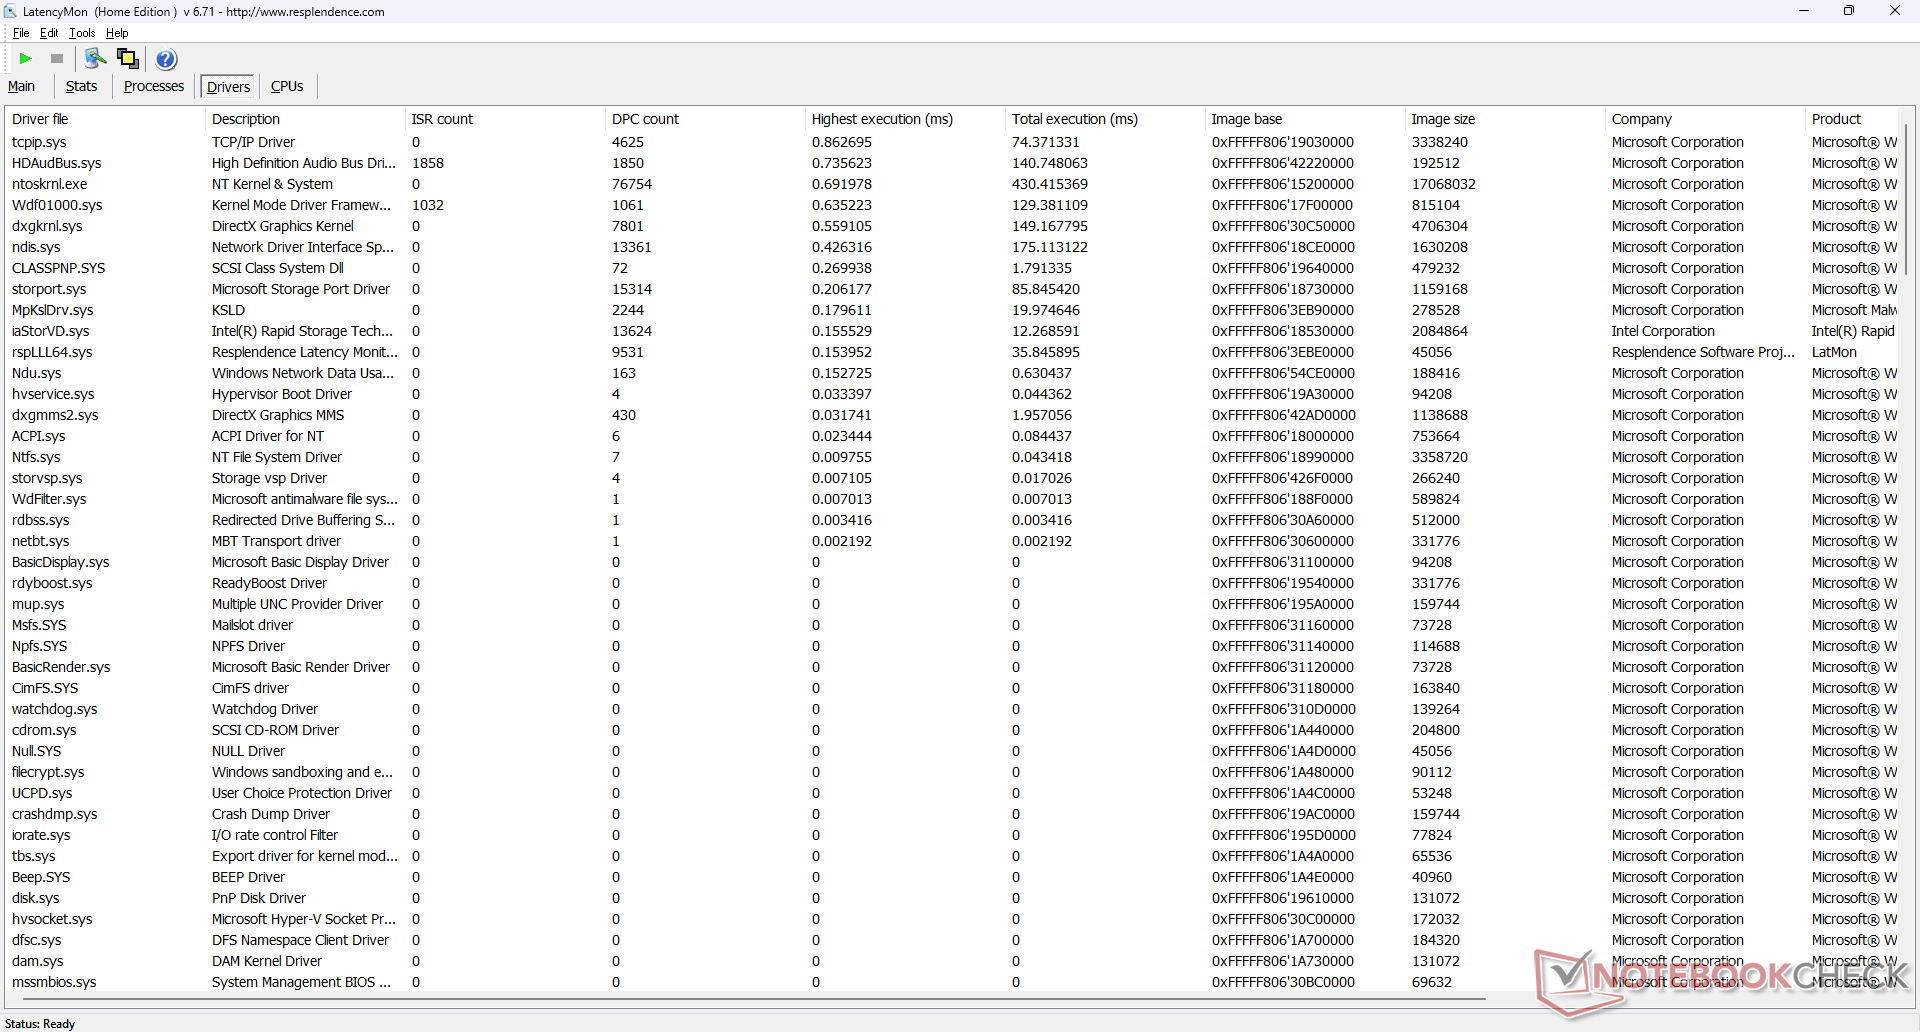
DPC latentie
LatencyMon laat geen grote DPC-problemen zien tijdens het openen van meerdere browsertabbladen van onze startpagina en geen dropped frames tijdens het afspelen van 4K bij 60 FPS.
| DPC Latencies / LatencyMon - interrupt to process latency (max), Web, Youtube, Prime95 | |
| Lenovo IdeaCentre Mini 01IRH8 | |
| GMK NucBox K3 Pro | |
| Beelink GTR7 7840HS | |
| Beelink SER7 | |
| Dell OptiPlex Micro | |
* ... kleiner is beter
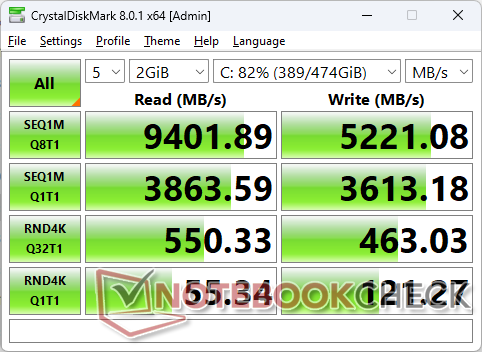
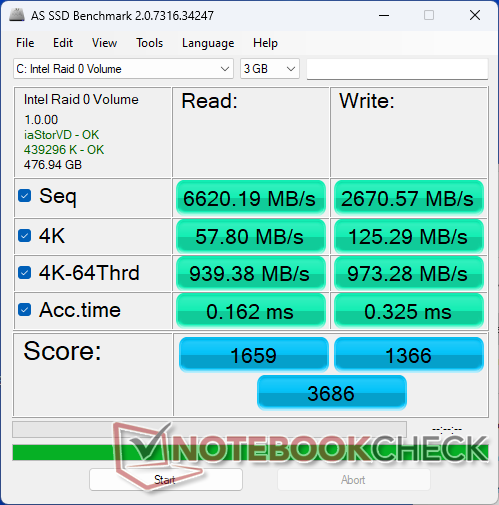
Opslagapparaten
Onze eenheid gebruikt twee SK hynix BC901 NVMe SSD's in RAID 0-configuratie, wat ongewoon is omdat elke schijf slechts 30 mm lang is in plaats van de gebruikelijke 80 mm. Door de kortere lengte en het ontbreken van warmteverspreiders is de kans groter dat de prestaties afnemen wanneer de schijven onder druk komen te staan. Helaas is dit precies wat er gebeurt, zoals blijkt uit onze DiskSpd loop-testresultaten hieronder, waarbij de overdrachtsnelheden alleen tijdens de eerste minuut tot 8600 MB/s opliepen, voordat er gas werd teruggenomen tot 1500 tot 2500 MB/s.
Merk op dat het systeem desgewenst nog steeds twee volledige 2280 M.2 SSD's kan ondersteunen.

| Drive Performance rating - Percent | |
| Beelink GTR7 7840HS | |
| Dell OptiPlex Micro | |
| Lenovo IdeaCentre Mini 01IRH8 | |
| Beelink SER7 | |
| GMK NucBox K3 Pro | |
| DiskSpd | |
| seq read | |
| Beelink GTR7 7840HS | |
| Dell OptiPlex Micro | |
| Beelink SER7 | |
| Lenovo IdeaCentre Mini 01IRH8 | |
| GMK NucBox K3 Pro | |
| seq write | |
| Beelink GTR7 7840HS | |
| Beelink SER7 | |
| Dell OptiPlex Micro | |
| GMK NucBox K3 Pro | |
| Lenovo IdeaCentre Mini 01IRH8 | |
| seq q8 t1 read | |
| Dell OptiPlex Micro | |
| Beelink GTR7 7840HS | |
| Beelink SER7 | |
| Lenovo IdeaCentre Mini 01IRH8 | |
| GMK NucBox K3 Pro | |
| seq q8 t1 write | |
| Dell OptiPlex Micro | |
| Beelink GTR7 7840HS | |
| GMK NucBox K3 Pro | |
| Lenovo IdeaCentre Mini 01IRH8 | |
| Beelink SER7 | |
| 4k q1 t1 read | |
| Lenovo IdeaCentre Mini 01IRH8 | |
| Beelink GTR7 7840HS | |
| GMK NucBox K3 Pro | |
| Beelink SER7 | |
| Dell OptiPlex Micro | |
| 4k q1 t1 write | |
| Beelink GTR7 7840HS | |
| GMK NucBox K3 Pro | |
| Lenovo IdeaCentre Mini 01IRH8 | |
| Beelink SER7 | |
| Dell OptiPlex Micro | |
| 4k q32 t16 read | |
| Beelink SER7 | |
| Beelink GTR7 7840HS | |
| GMK NucBox K3 Pro | |
| Lenovo IdeaCentre Mini 01IRH8 | |
| Dell OptiPlex Micro | |
| 4k q32 t16 write | |
| Beelink GTR7 7840HS | |
| Beelink SER7 | |
| GMK NucBox K3 Pro | |
| Lenovo IdeaCentre Mini 01IRH8 | |
| Dell OptiPlex Micro | |
* ... kleiner is beter
Disk Throttling: DiskSpd Read Loop, Queue Depth 8
GPU-prestaties
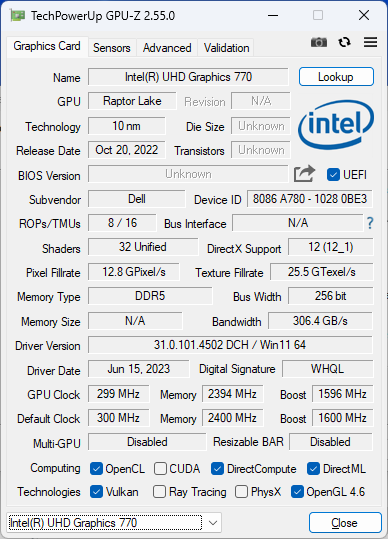
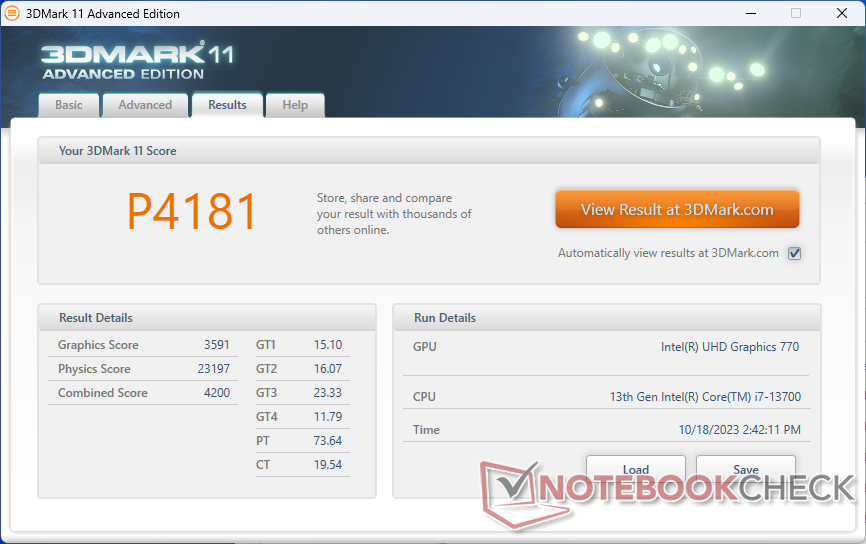
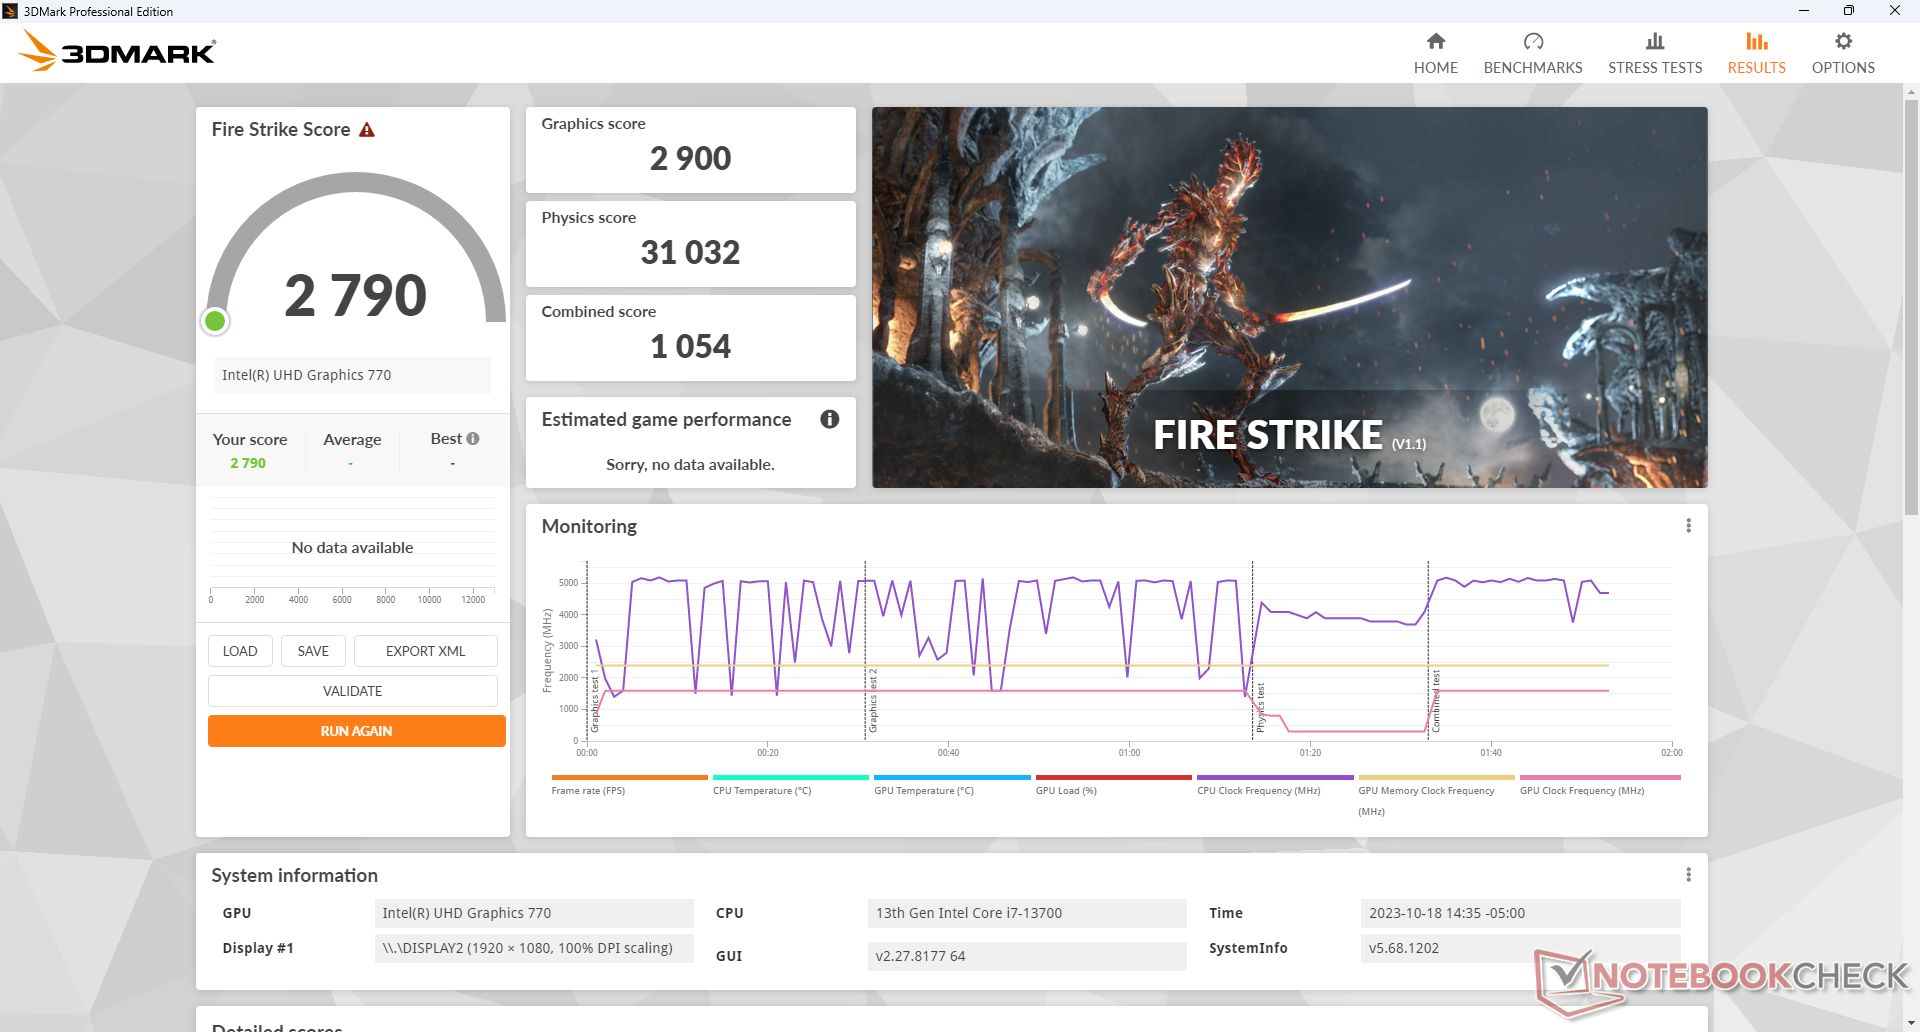
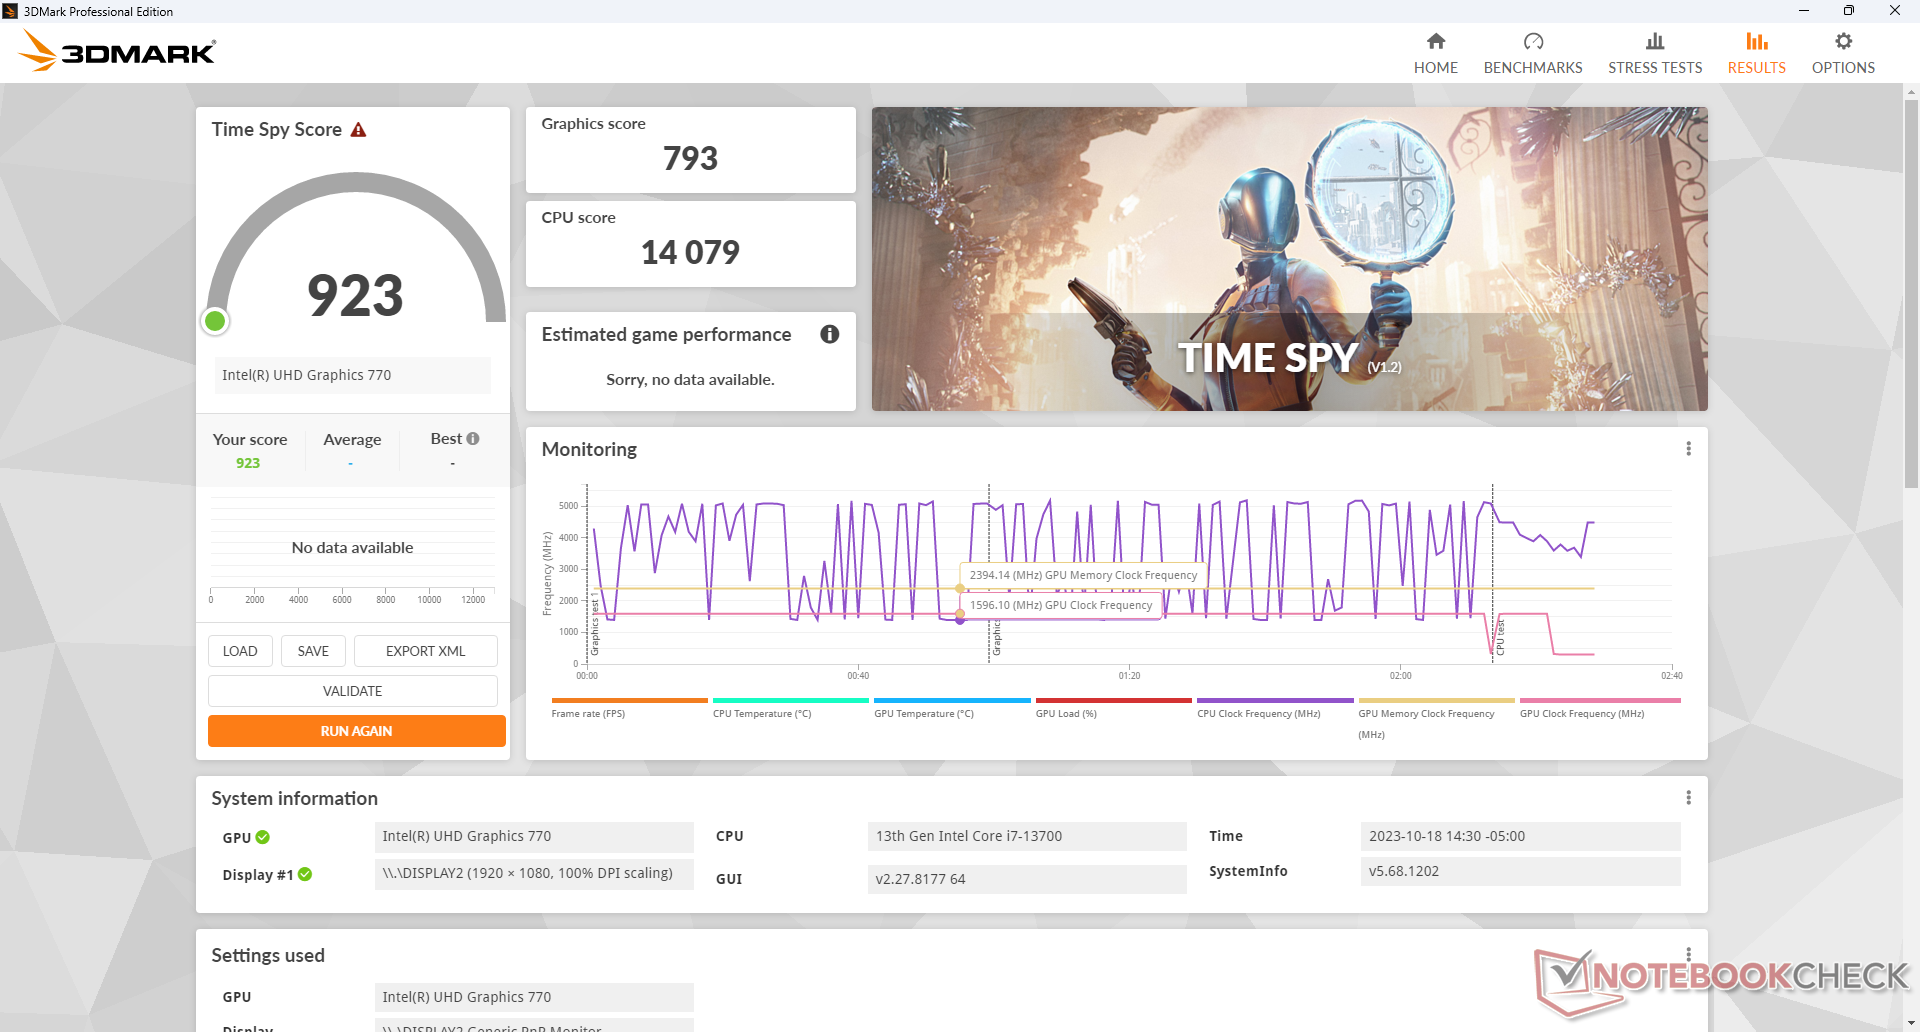
De grafische prestaties zijn matig, vooral in vergelijking met de indrukwekkendere CPU. DeUHD Graphics 770 is verouderd en is alleen echt nuttig voor streamingdoeleinden of basis 4K60 video-uitvoer. Desalniettemin zou dit geen probleem moeten zijn voor het doelpubliek, aangezien de OptiPlex Micro niet ontworpen is om een grafische krachtpatser te zijn.
| 3DMark Performance rating - Percent | |
| Intel NUC 12, NUC12SNKi72_Serpent Canyon | |
| Beelink GTR7 7840HS | |
| Acemagic AM20 | |
| Lenovo IdeaCentre Mini 01IRH8 | |
| Geekom A5 | |
| GMK NucBox K3 Pro | |
| Minisforum Venus Series UN1245 | |
| Dell OptiPlex Micro | |
| Gemiddeld Intel UHD Graphics 770 | |
| Acemagic AD15 | |
| 3DMark 11 - 1280x720 Performance GPU | |
| Intel NUC 12, NUC12SNKi72_Serpent Canyon | |
| Beelink GTR7 7840HS | |
| Acemagic AM20 | |
| Geekom A5 | |
| Lenovo IdeaCentre Mini 01IRH8 | |
| GMK NucBox K3 Pro | |
| Minisforum Venus Series UN1245 | |
| Dell OptiPlex Micro | |
| Gemiddeld Intel UHD Graphics 770 (3268 - 3591, n=6) | |
| Acemagic AD15 | |
| 3DMark 11 Performance | 4181 punten | |
| 3DMark Fire Strike Score | 2790 punten | |
| 3DMark Time Spy Score | 923 punten | |
Help | ||
| Blender | |
| v3.3 Classroom METAL | |
| Apple Mac Mini M2 | |
| v3.3 Classroom HIP/AMD | |
| Geekom A5 | |
| Acemagic AM20 | |
| v3.3 Classroom CPU | |
| Minisforum Venus Series UN1245 | |
| GMK NucBox K3 Pro | |
| Acemagic AD15 | |
| Apple Mac Mini M2 | |
| Geekom A5 | |
| Acemagic AM20 | |
| Beelink GTR7 7840HS | |
| Lenovo IdeaCentre Mini 01IRH8 | |
| Gemiddeld Intel UHD Graphics 770 (320 - 533, n=5) | |
| Intel NUC 12, NUC12SNKi72_Serpent Canyon | |
| Dell OptiPlex Micro | |
* ... kleiner is beter
| The Witcher 3 | |
| 1024x768 Low Graphics & Postprocessing | |
| Beelink GTR7 7840HS | |
| Acemagic AM20 | |
| Lenovo IdeaCentre Mini 01IRH8 | |
| Geekom A5 | |
| GMK NucBox K3 Pro | |
| Minisforum Venus Series UN1245 | |
| Dell OptiPlex Micro | |
| Gemiddeld Intel UHD Graphics 770 (41.8 - 58, n=4) | |
| Acemagic AD15 | |
| 1366x768 Medium Graphics & Postprocessing | |
| Beelink GTR7 7840HS | |
| GMK NucBox K3 Pro | |
| Lenovo IdeaCentre Mini 01IRH8 | |
| Geekom A5 | |
| Acemagic AM20 | |
| Minisforum Venus Series UN1245 | |
| Dell OptiPlex Micro | |
| Gemiddeld Intel UHD Graphics 770 (34.2 - 37.9, n=2) | |
| Final Fantasy XV Benchmark | |
| 1280x720 Lite Quality | |
| Beelink GTR7 7840HS | |
| Acemagic AM20 | |
| Geekom A5 | |
| GMK NucBox K3 Pro | |
| Lenovo IdeaCentre Mini 01IRH8 | |
| Minisforum Venus Series UN1245 | |
| Dell OptiPlex Micro | |
| Gemiddeld Intel UHD Graphics 770 (21.3 - 28.2, n=6) | |
| Acemagic AD15 | |
| 1920x1080 Standard Quality | |
| Beelink GTR7 7840HS | |
| Acemagic AM20 | |
| Geekom A5 | |
| GMK NucBox K3 Pro | |
| Lenovo IdeaCentre Mini 01IRH8 | |
| Minisforum Venus Series UN1245 | |
| Dell OptiPlex Micro | |
| Gemiddeld Intel UHD Graphics 770 (11.3 - 14.6, n=6) | |
| Acemagic AD15 | |
| 1920x1080 High Quality | |
| Beelink GTR7 7840HS | |
| Acemagic AM20 | |
| Geekom A5 | |
| GMK NucBox K3 Pro | |
| Lenovo IdeaCentre Mini 01IRH8 | |
| Minisforum Venus Series UN1245 | |
| Dell OptiPlex Micro | |
| Gemiddeld Intel UHD Graphics 770 (8 - 10.2, n=6) | |
| Acemagic AD15 | |
| Dota 2 Reborn | |
| 1280x720 min (0/3) fastest | |
| Beelink GTR7 7840HS | |
| Dell OptiPlex Micro | |
| Minisforum Venus Series UN1245 | |
| Geekom A5 | |
| Gemiddeld Intel UHD Graphics 770 (102.4 - 154.6, n=4) | |
| Acemagic AM20 | |
| GMK NucBox K3 Pro | |
| Acemagic AD15 | |
| Lenovo IdeaCentre Mini 01IRH8 | |
| 1366x768 med (1/3) | |
| Beelink GTR7 7840HS | |
| Geekom A5 | |
| Acemagic AM20 | |
| Dell OptiPlex Micro | |
| GMK NucBox K3 Pro | |
| Minisforum Venus Series UN1245 | |
| Gemiddeld Intel UHD Graphics 770 (74.4 - 96.1, n=4) | |
| Lenovo IdeaCentre Mini 01IRH8 | |
| Acemagic AD15 | |
| 1920x1080 high (2/3) | |
| Beelink GTR7 7840HS | |
| Acemagic AM20 | |
| Geekom A5 | |
| GMK NucBox K3 Pro | |
| Lenovo IdeaCentre Mini 01IRH8 | |
| Minisforum Venus Series UN1245 | |
| Dell OptiPlex Micro | |
| Gemiddeld Intel UHD Graphics 770 (38 - 44.2, n=4) | |
| Acemagic AD15 | |
| 1920x1080 ultra (3/3) best looking | |
| Beelink GTR7 7840HS | |
| Acemagic AM20 | |
| Geekom A5 | |
| GMK NucBox K3 Pro | |
| Lenovo IdeaCentre Mini 01IRH8 | |
| Minisforum Venus Series UN1245 | |
| Dell OptiPlex Micro | |
| Gemiddeld Intel UHD Graphics 770 (35.4 - 40.8, n=4) | |
| Acemagic AD15 | |
| X-Plane 11.11 | |
| 1280x720 low (fps_test=1) | |
| Beelink GTR7 7840HS | |
| Acemagic AM20 | |
| Geekom A5 | |
| Dell OptiPlex Micro | |
| Gemiddeld Intel UHD Graphics 770 (28.5 - 53.5, n=3) | |
| Lenovo IdeaCentre Mini 01IRH8 | |
| GMK NucBox K3 Pro | |
| Acemagic AD15 | |
| 1920x1080 med (fps_test=2) | |
| Beelink GTR7 7840HS | |
| Acemagic AM20 | |
| Geekom A5 | |
| GMK NucBox K3 Pro | |
| Lenovo IdeaCentre Mini 01IRH8 | |
| Dell OptiPlex Micro | |
| Gemiddeld Intel UHD Graphics 770 (21.7 - 33.8, n=3) | |
| Acemagic AD15 | |
| 1920x1080 high (fps_test=3) | |
| Beelink GTR7 7840HS | |
| Acemagic AM20 | |
| Geekom A5 | |
| Dell OptiPlex Micro | |
| Lenovo IdeaCentre Mini 01IRH8 | |
| Gemiddeld Intel UHD Graphics 770 (18.8 - 30.7, n=3) | |
| GMK NucBox K3 Pro | |
| Acemagic AD15 | |
| Cyberpunk 2077 1.6 | |
| 1280x720 Low Preset | |
| Beelink GTR7 7840HS | |
| Lenovo IdeaCentre Mini 01IRH8 | |
| Gemiddeld Intel UHD Graphics 770 (18.6 - 22.2, n=2) | |
| Dell OptiPlex Micro | |
| 1920x1080 Low Preset | |
| Beelink GTR7 7840HS | |
| Lenovo IdeaCentre Mini 01IRH8 | |
| Gemiddeld Intel UHD Graphics 770 (10.2 - 11.8, n=2) | |
| Dell OptiPlex Micro | |
Witcher 3 FPS Chart
| lage | gem. | hoge | ultra | |
|---|---|---|---|---|
| The Witcher 3 (2015) | 58 | 37.9 | ||
| Dota 2 Reborn (2015) | 153.1 | 96.1 | 44.2 | 40.8 |
| Final Fantasy XV Benchmark (2018) | 28.2 | 14.6 | 10.2 | |
| X-Plane 11.11 (2018) | 51.4 | 32.7 | 29.7 | |
| Cyberpunk 2077 1.6 (2022) | 10.2 | |||
| Tiny Tina's Wonderlands (2022) | 16.4 |
Uitstoot
Systeemgeluid
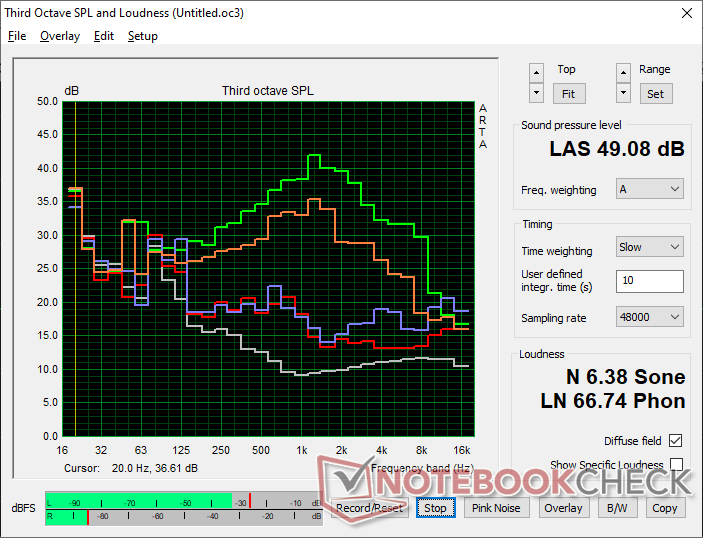
De interne ventilator is altijd actief met een minimum van 28,2 dB(A) tegen een stille achtergrond van 23,2 dB(A). Hij blijft relatief stil met ongeveer 30 dB(A) bij het uitvoeren van typische belastingen zoals browsers of spreadsheets, maar extreme belastingen zoals Prime95 stress kunnen een ventilatorgeluid van bijna 50 dB(A) veroorzaken, waardoor hij luider is dan de meeste andere mini-pc's. Met andere woorden, de OptiPlex Micro wordt pas luidruchtig als er veeleisende toepassingen worden ingevoerd.
Geluidsniveau
| Onbelast |
| 28.2 / 28.2 / 29.1 dB (A) |
| Belasting |
| 30.2 / 49.1 dB (A) |
 | ||
30 dB stil 40 dB(A) hoorbaar 50 dB(A) luid |
||
min: | ||
| Dell OptiPlex Micro UHD Graphics 770, i7-13700 | Apple Mac Mini M2 M2 10-Core GPU, M2, Apple SSD AP0512Z | Lenovo IdeaCentre Mini 01IRH8 Iris Xe G7 96EUs, i7-13700H, Samsung PM9B1 512GB MZVL4512HBLU | GMK NucBox K3 Pro UHD Graphics 64EUs, i7-12650H, Lexar NM610 Pro NM610P001T-HNNNG | Beelink GTR7 7840HS Radeon 780M, R7 7840HS, Crucial P3 Plus CT1000P3PSSD8 | Beelink SER7 Radeon 780M, R7 7840HS, Crucial P3 Plus CT1000P3PSSD8 | |
|---|---|---|---|---|---|---|
| Noise | 15% | 2% | 4% | 1% | 5% | |
| uit / omgeving * (dB) | 23.2 | 24.7 -6% | 23.4 -1% | 23.1 -0% | 25.6 -10% | 24.5 -6% |
| Idle Minimum * (dB) | 28.2 | 24.7 12% | 30.4 -8% | 25 11% | 28.1 -0% | 25.1 11% |
| Idle Average * (dB) | 28.2 | 24.7 12% | 30.4 -8% | 25.5 10% | 28.1 -0% | 25.1 11% |
| Idle Maximum * (dB) | 29.1 | 24.7 15% | 30.4 -4% | 25.5 12% | 28.1 3% | 25.1 14% |
| Load Average * (dB) | 30.2 | 24.7 18% | 30.7 -2% | 39.9 -32% | 34.9 -16% | 35.9 -19% |
| Witcher 3 ultra * (dB) | 42.6 | 33.9 20% | 39.9 6% | 36.4 15% | 35.6 16% | |
| Load Maximum * (dB) | 49.1 | 29.4 40% | 41 16% | 39.9 19% | 42.4 14% | 45.4 8% |
* ... kleiner is beter
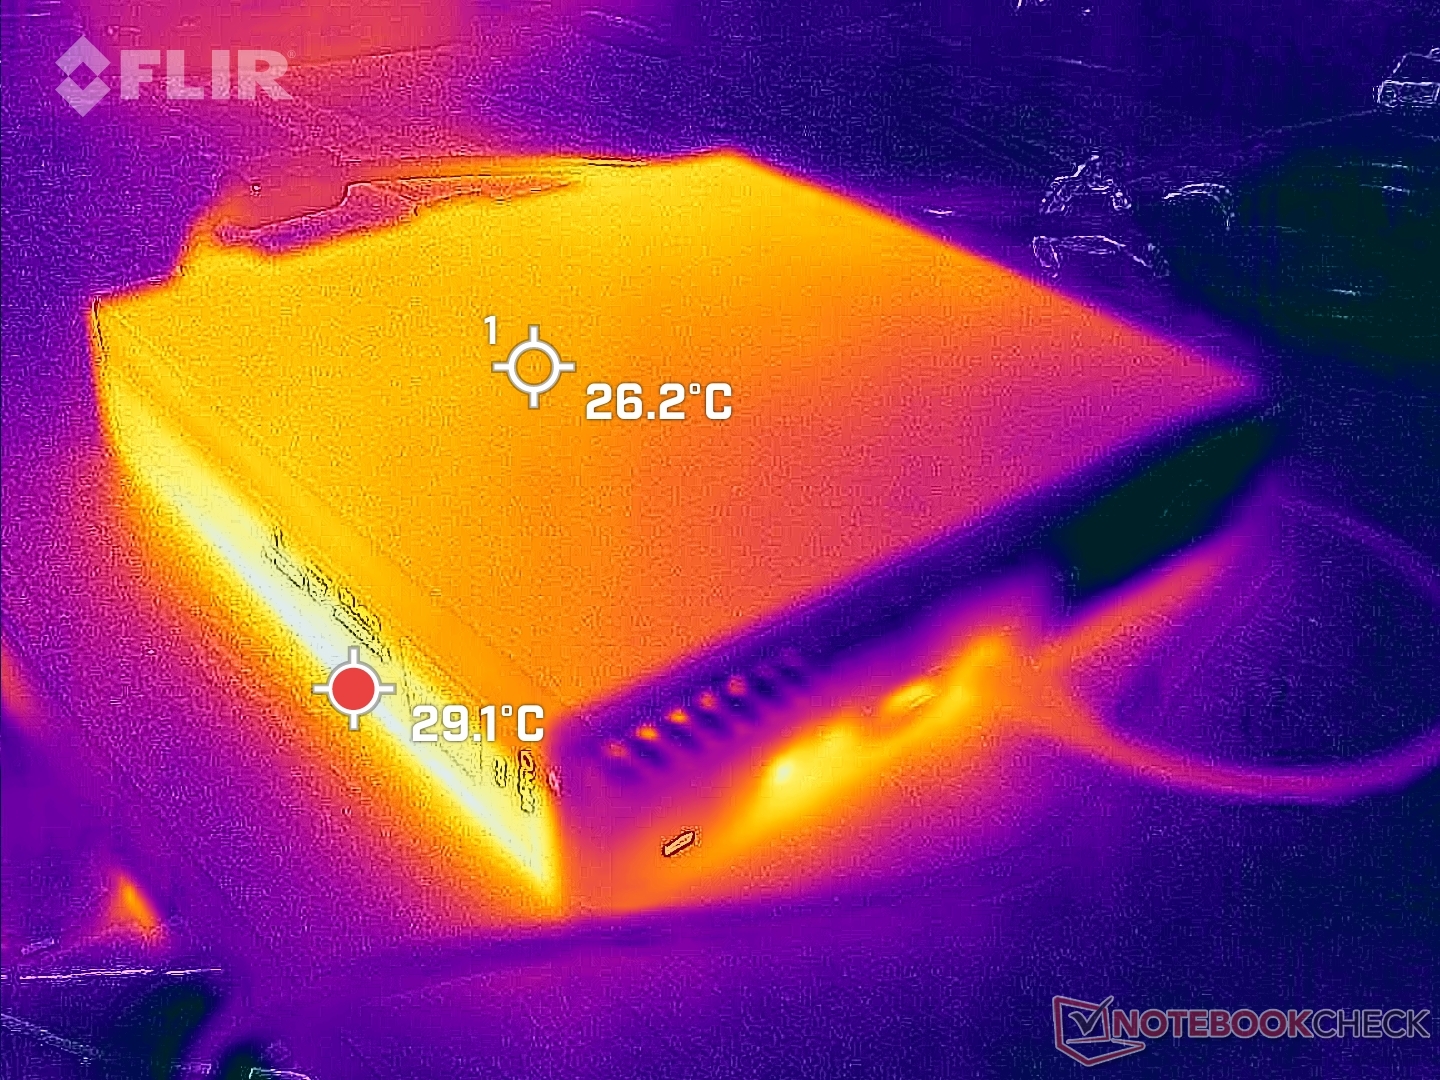
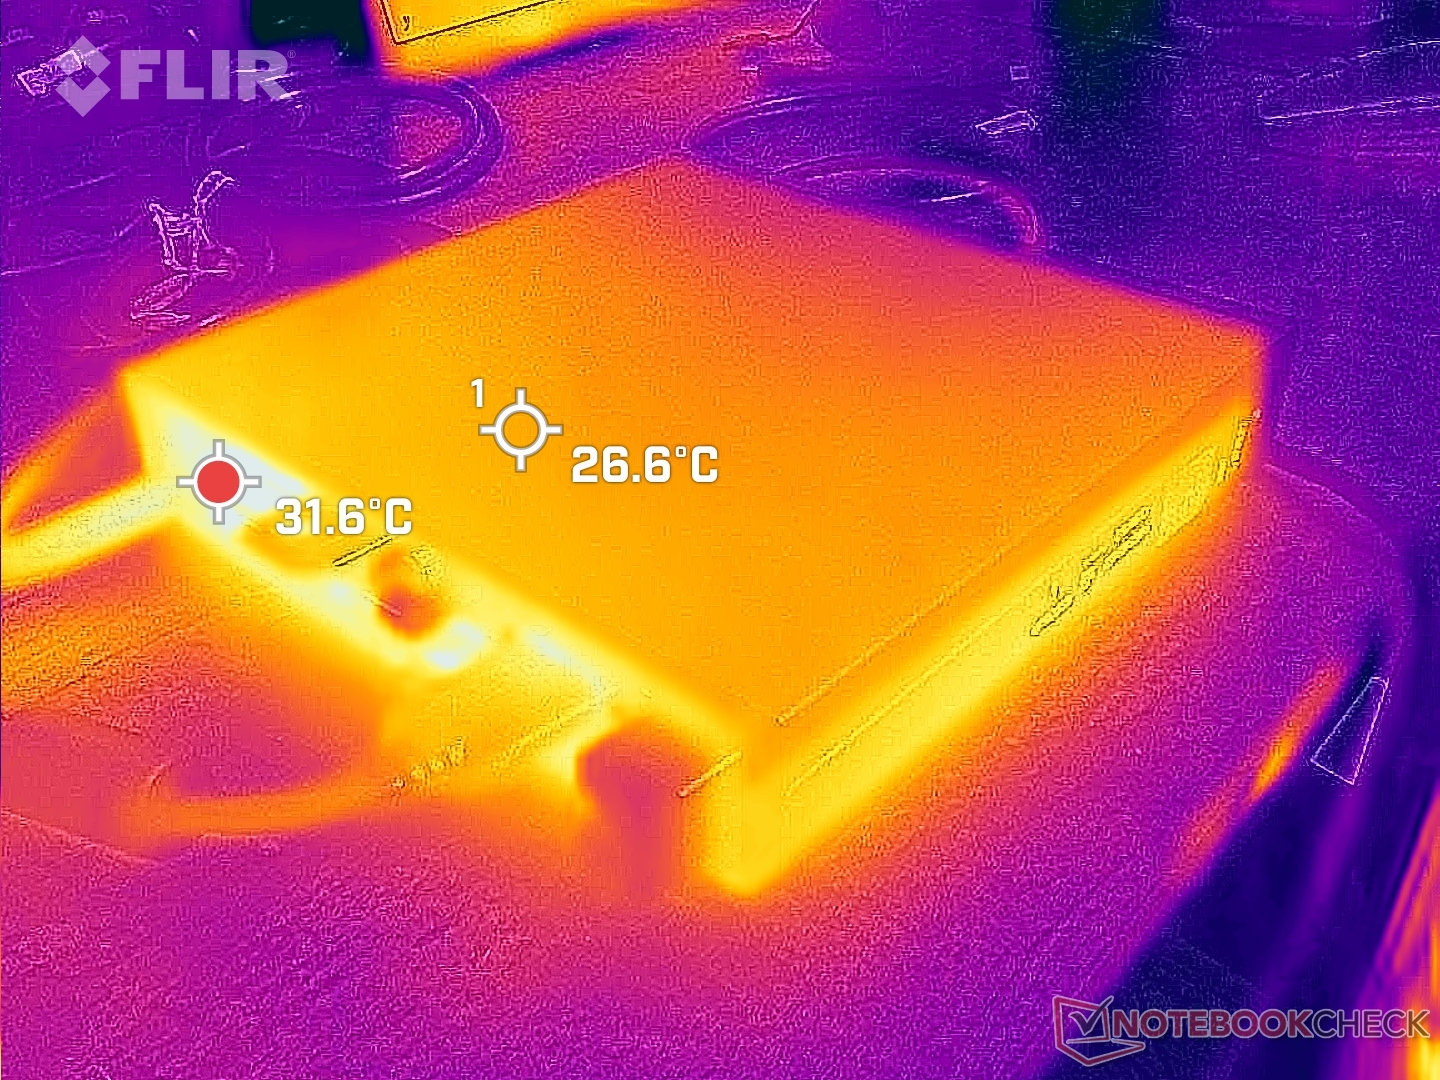
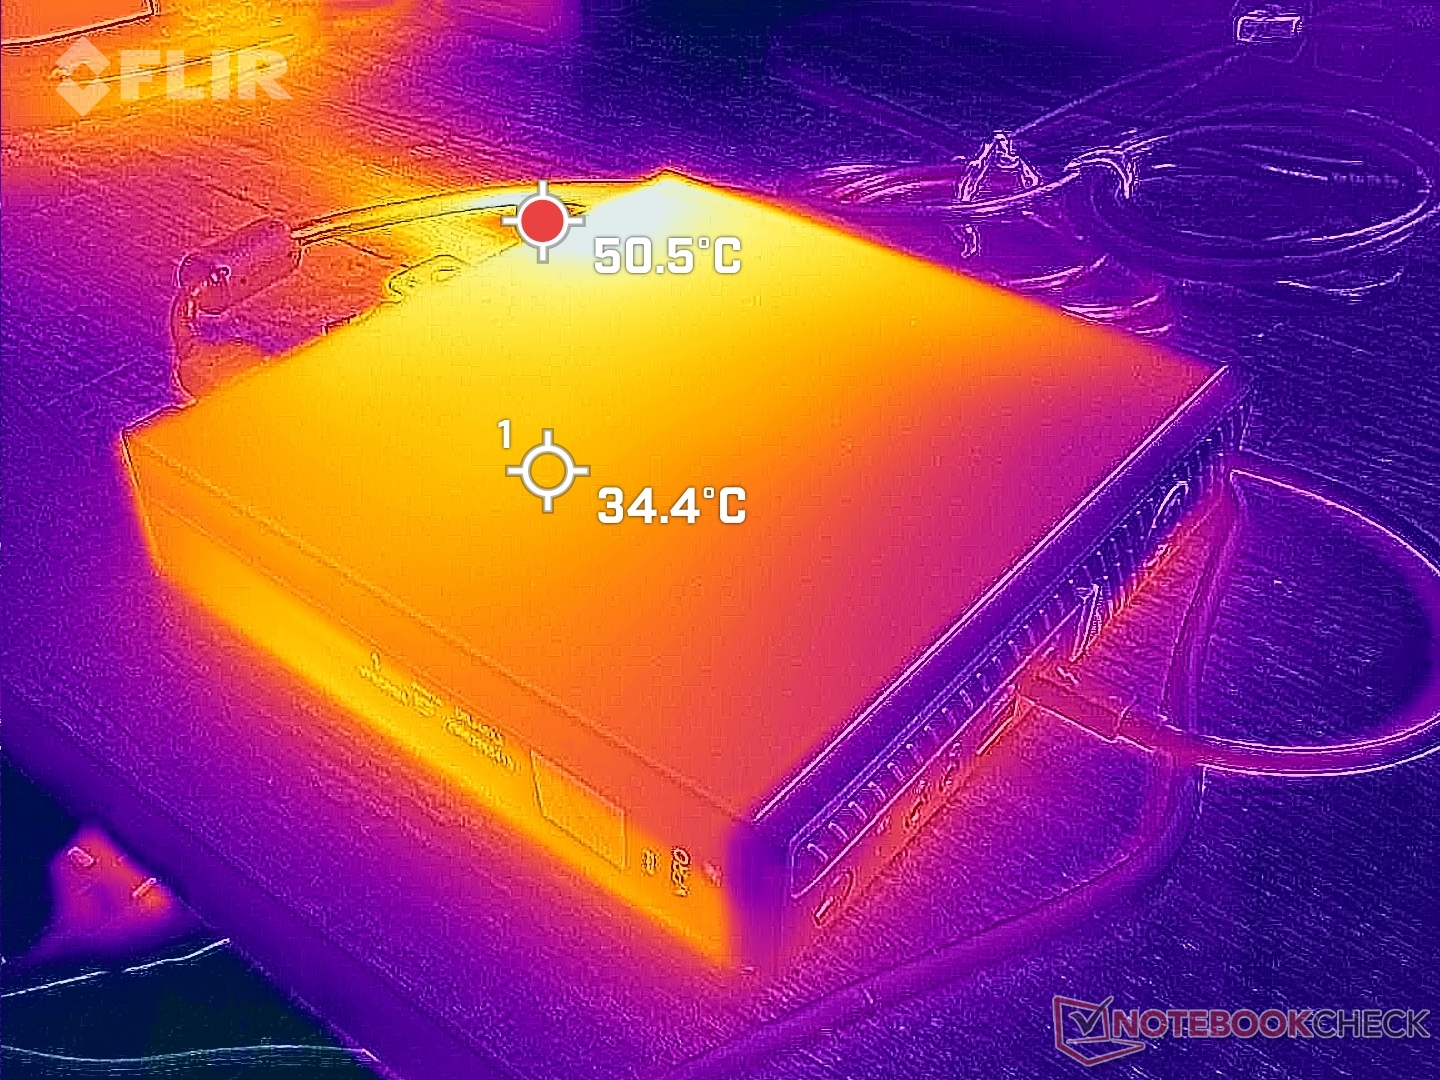
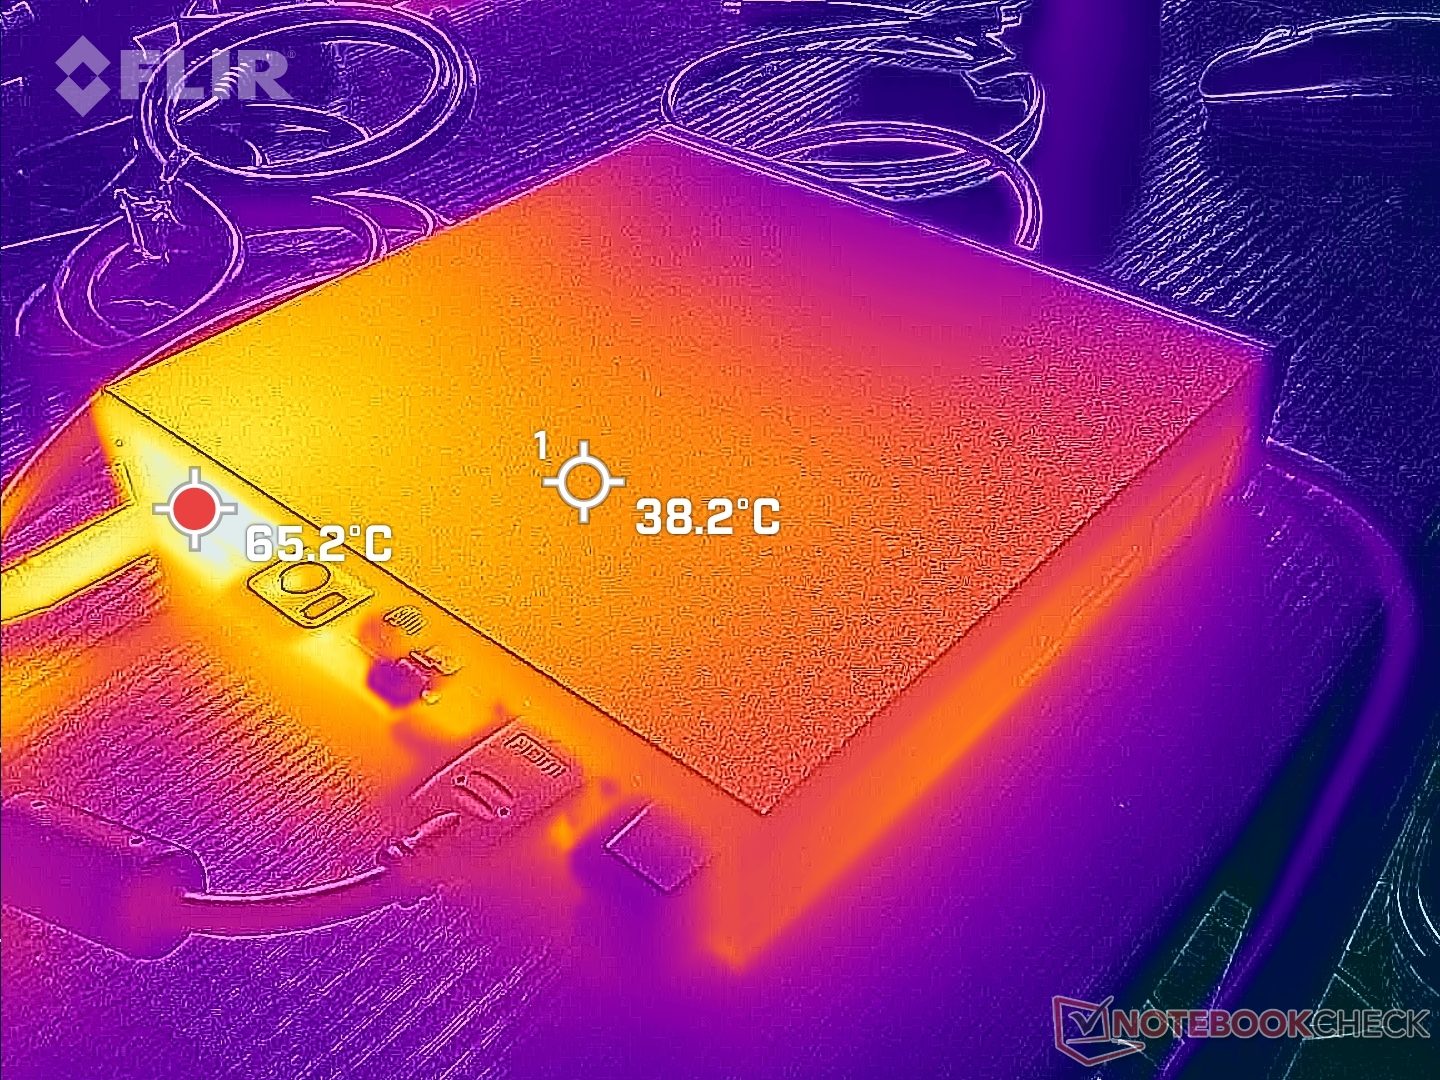
Temperatuur - Hot Top
De oppervlaktetemperaturen kunnen behoorlijk hoog oplopen, omdat het model een desktopklasse CPU in een grotendeels metalen buitenkant herbergt. De oppervlaktetemperatuur is 30 tot 35 C wanneer u gewoon op het web surft en kan oplopen tot 51 C wanneer u zware belastingen uitvoert. U moet zeker op de temperatuur letten als u voorwerpen op het apparaat plaatst.
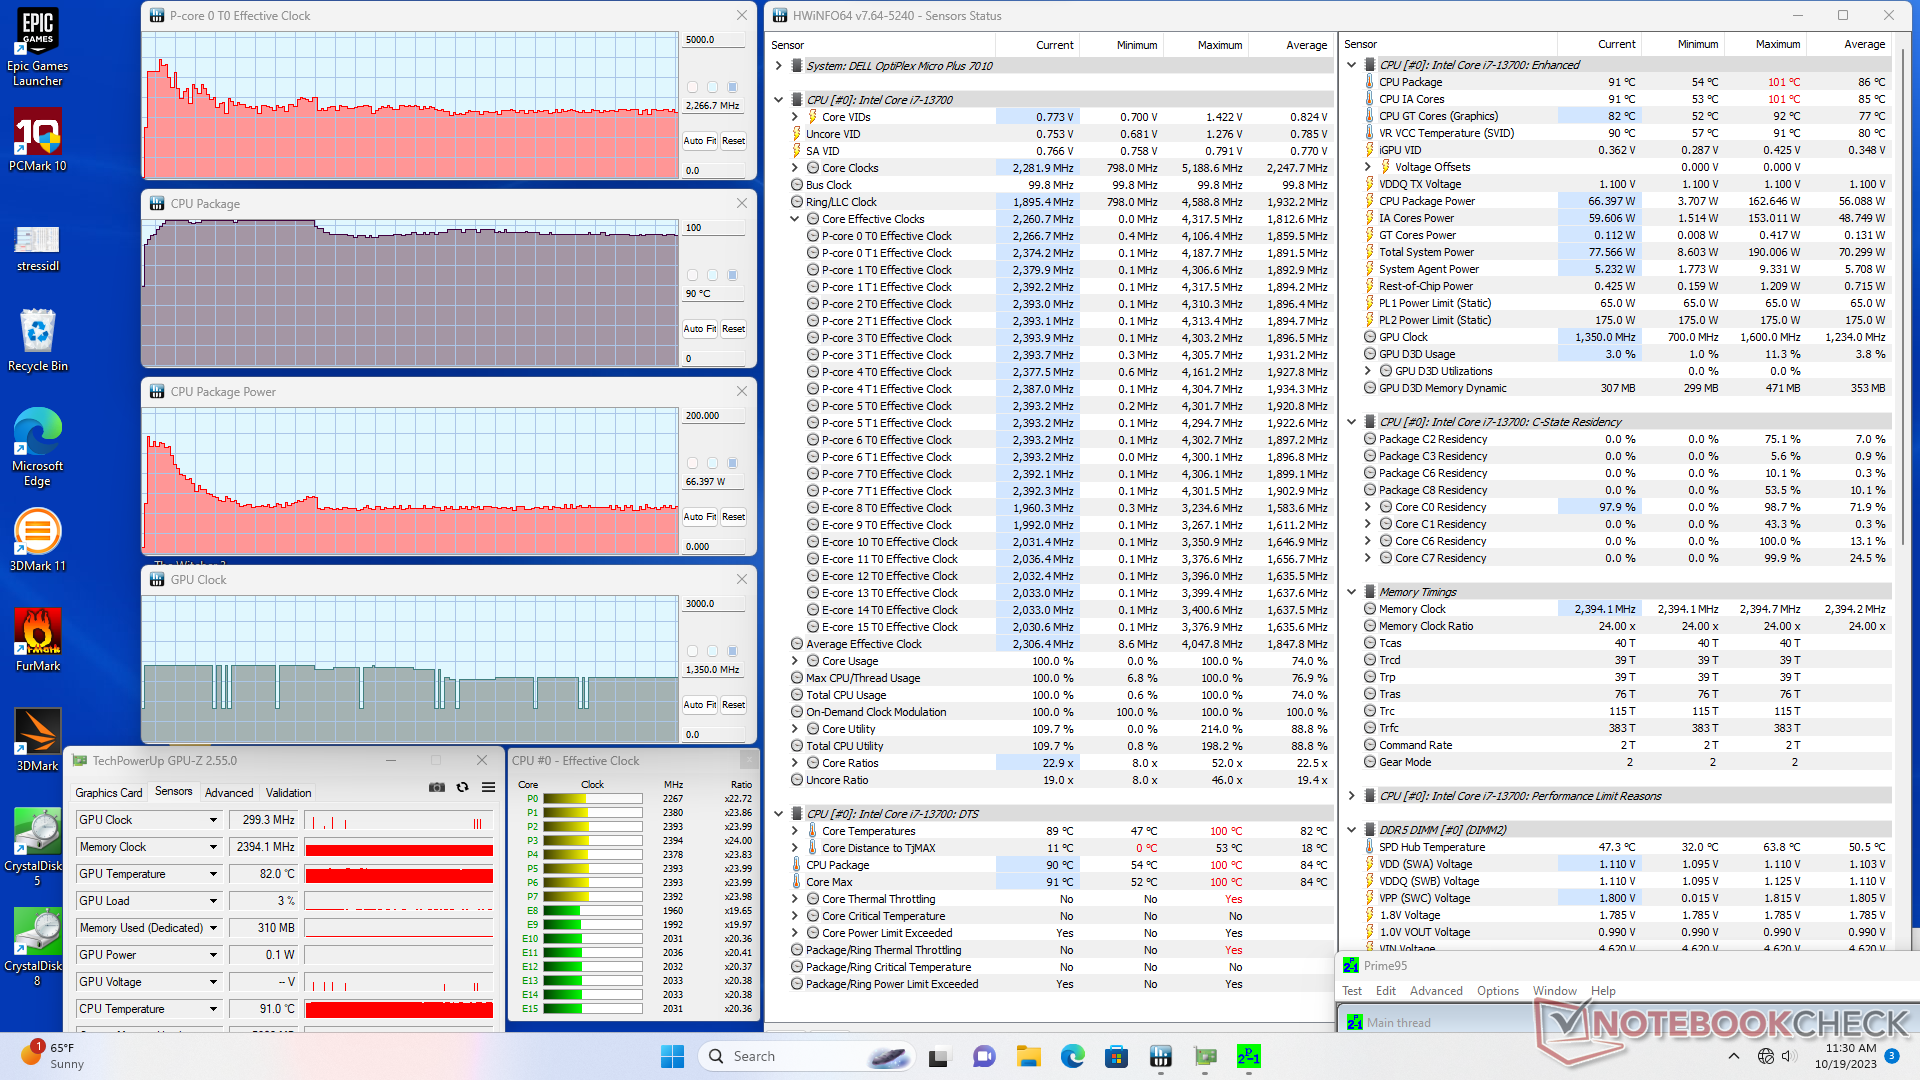
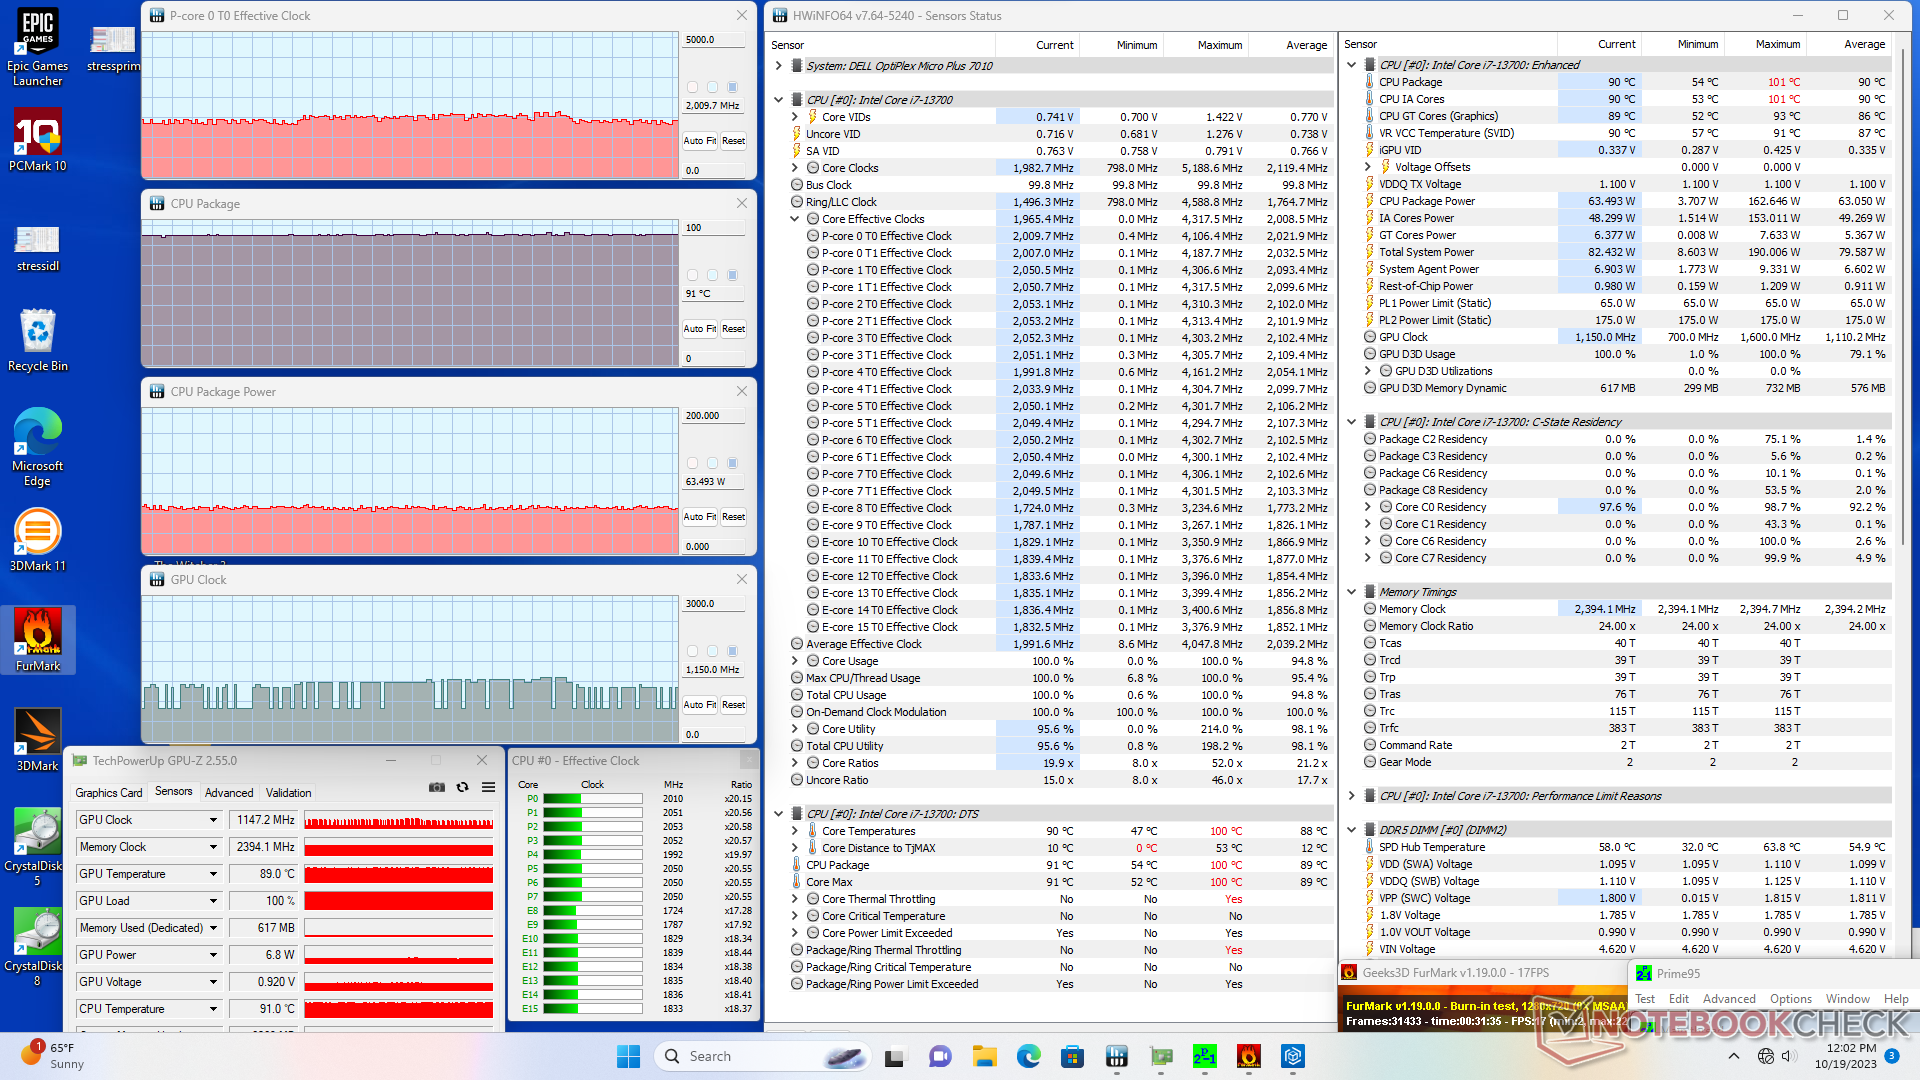
Stresstest
De kerntemperaturen kunnen erg hoog oplopen, wat correleert met de hoge oppervlaktetemperaturen en het throttling-gedrag dat hierboven is genoemd. Tijdens het draaien van Prime95 bijvoorbeeld, steeg de CPU naar 3,6 GHz, 155 W en bijna 100 C, gedurende hooguit een minuut of twee. Daarna stabiliseerde de CPU zich op 2,7 GHz en 66 W om een iets koelere kerntemperatuur van 90 C te handhaven.Lenovo IdeaCentre Mini met de langzamere Core i7-13700H zou in plaats daarvan een koelere kerntemperatuur van 81 C opleveren.
Bovendien is er niet veel voor nodig om zulke hoge kerntemperaturen te bereiken. De kerntemperatuur zou zich stabiliseren op 94 C alleen al door het uitvoeren van Witcher 3 hoge belastingen te vertegenwoordigen, vergeleken met slechts 68 C op deBeelink GTR7.
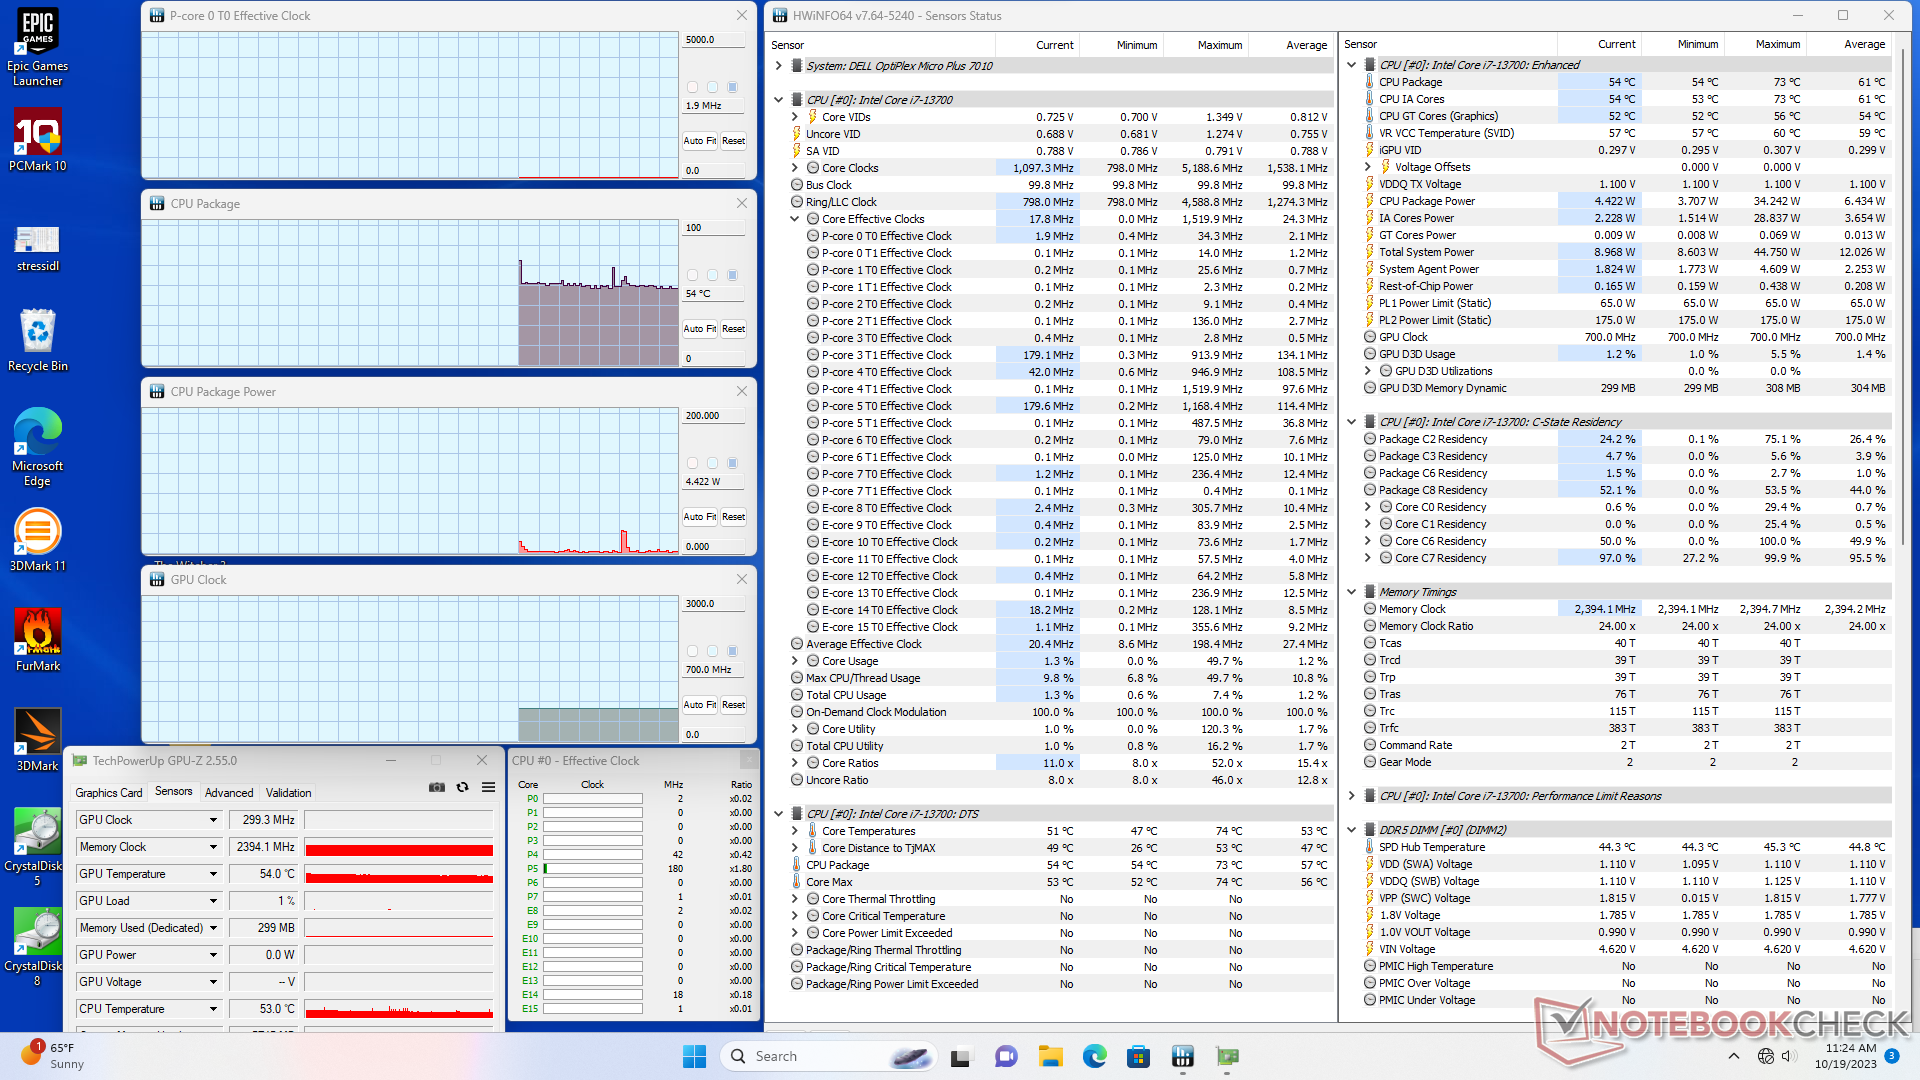
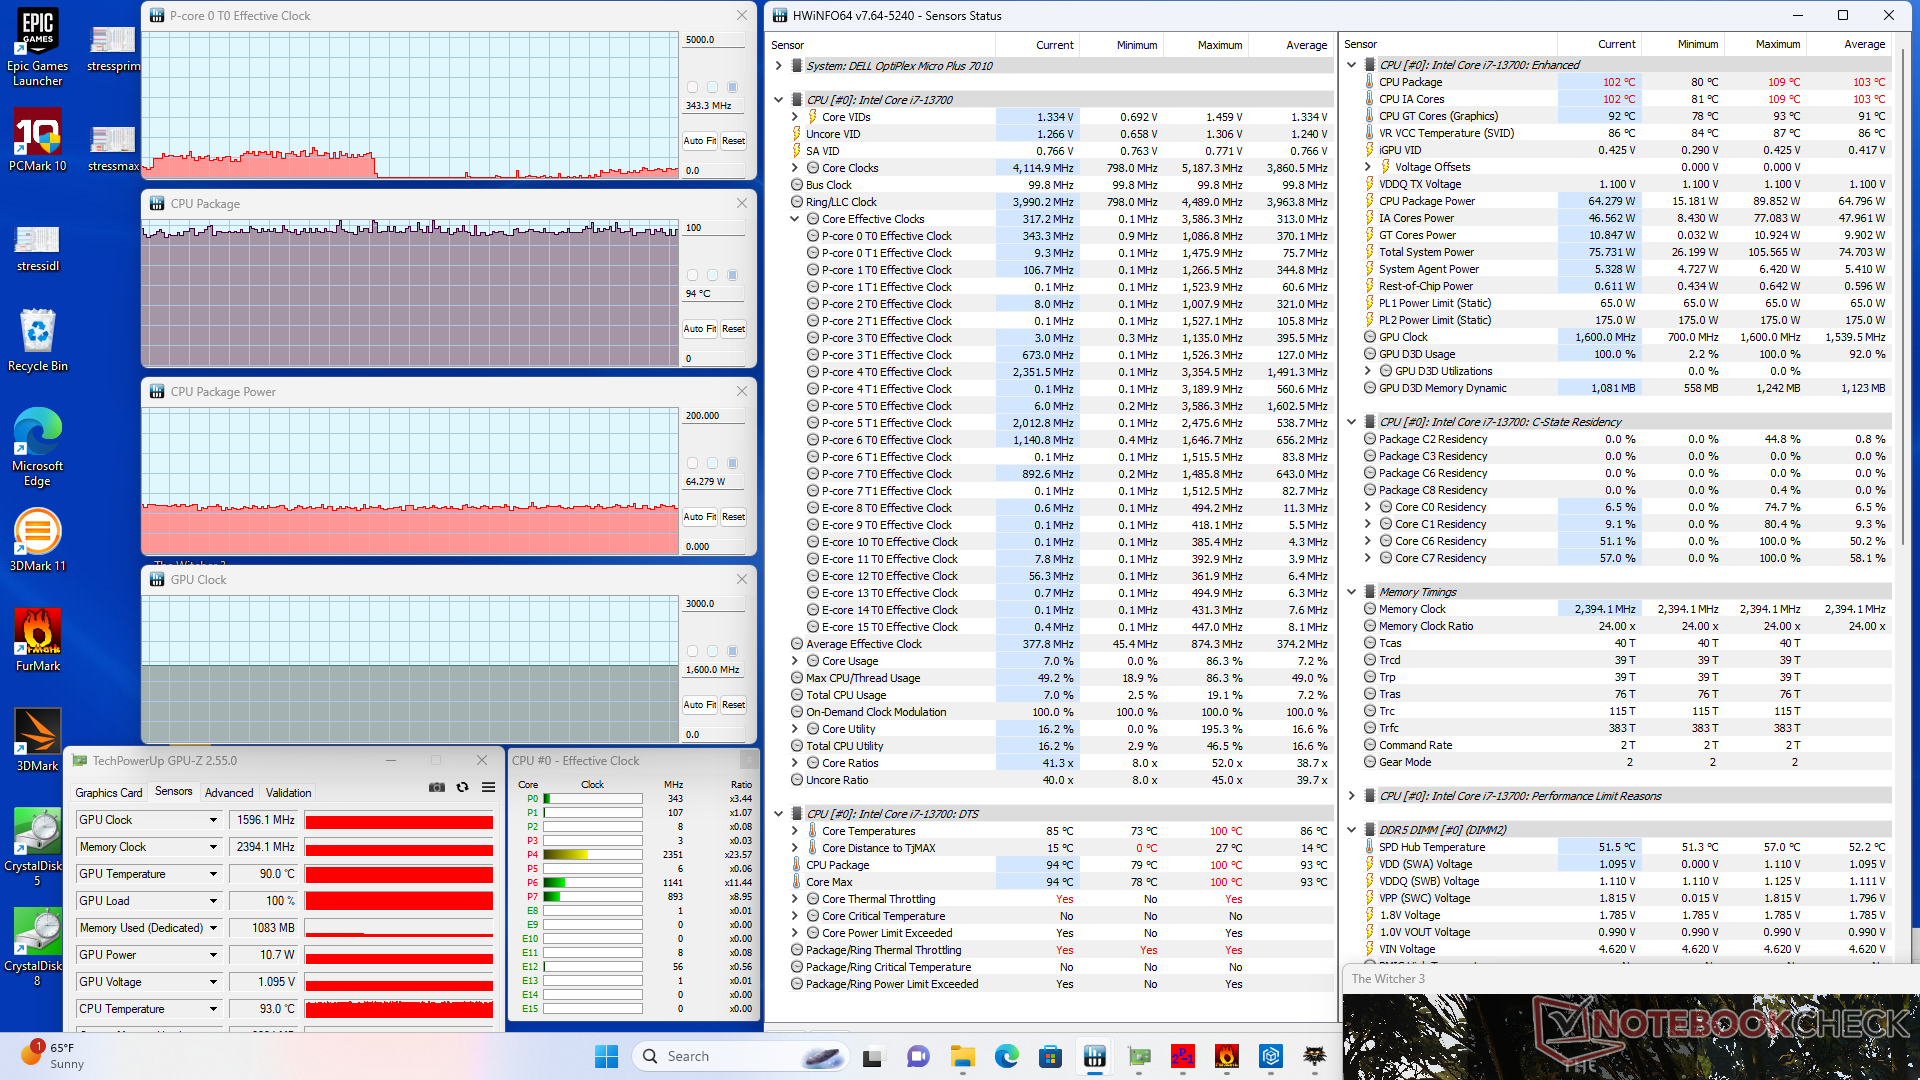
| CPU Klok (GHz) | GPU Klok (MHz) | Gemiddelde CPU Temperatuur (°C) | |
| Inactief systeem | -- | -- | 54 |
| Prime95 Stress | 2.3 | -- | 90 |
| Prime95 + FurMark Stress | 2.0 | 700 - 1350 | 91 |
| Witcher 3 Stress | ~0.3 | 1596 | 94 |
Luidsprekers
Het model integreert monogeluid, in tegenstelling tot andere mini-pc's waar geïntegreerde luidsprekers zeldzaam zijn. De luidspreker is luid genoeg voor kleine kantoren, maar zeker niet krachtig genoeg voor vergaderzalen.
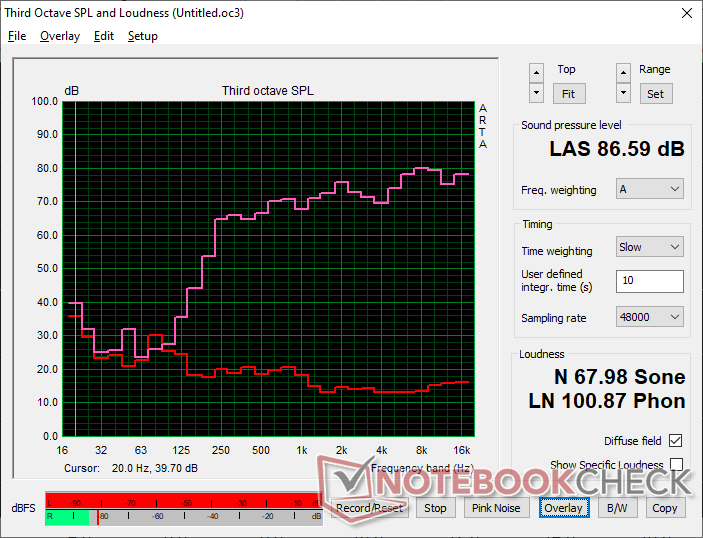
Dell OptiPlex Micro audioanalyse
(+) | luidsprekers kunnen relatief luid spelen (86.6 dB)
Bas 100 - 315 Hz
(-) | bijna geen lage tonen - gemiddeld 22% lager dan de mediaan
(±) | lineariteit van de lage tonen is gemiddeld (12.2% delta ten opzichte van de vorige frequentie)
Midden 400 - 2000 Hz
(+) | evenwichtige middens - slechts 2.6% verwijderd van de mediaan
(+) | de middentonen zijn lineair (4.1% delta ten opzichte van de vorige frequentie)
Hoog 2 - 16 kHz
(+) | evenwichtige hoogtepunten - slechts 4.7% verwijderd van de mediaan
(+) | de hoge tonen zijn lineair (4.4% delta naar de vorige frequentie)
Algemeen 100 - 16.000 Hz
(±) | lineariteit van het totale geluid is gemiddeld (15.9% verschil met de mediaan)
Vergeleken met dezelfde klasse
» 7% van alle geteste apparaten in deze klasse waren beter, 7% vergelijkbaar, 86% slechter
» De beste had een delta van 13%, het gemiddelde was 24%, de slechtste was 64%
Vergeleken met alle geteste toestellen
» 25% van alle geteste apparaten waren beter, 5% gelijk, 70% slechter
» De beste had een delta van 4%, het gemiddelde was 23%, de slechtste was 134%
Apple MacBook Pro 16 2021 M1 Pro audioanalyse
(+) | luidsprekers kunnen relatief luid spelen (84.7 dB)
Bas 100 - 315 Hz
(+) | goede baars - slechts 3.8% verwijderd van de mediaan
(+) | de lage tonen zijn lineair (5.2% delta naar de vorige frequentie)
Midden 400 - 2000 Hz
(+) | evenwichtige middens - slechts 1.3% verwijderd van de mediaan
(+) | de middentonen zijn lineair (2.1% delta ten opzichte van de vorige frequentie)
Hoog 2 - 16 kHz
(+) | evenwichtige hoogtepunten - slechts 1.9% verwijderd van de mediaan
(+) | de hoge tonen zijn lineair (2.7% delta naar de vorige frequentie)
Algemeen 100 - 16.000 Hz
(+) | het totale geluid is lineair (4.6% verschil met de mediaan)
Vergeleken met dezelfde klasse
» 0% van alle geteste apparaten in deze klasse waren beter, 0% vergelijkbaar, 100% slechter
» De beste had een delta van 5%, het gemiddelde was 17%, de slechtste was 45%
Vergeleken met alle geteste toestellen
» 0% van alle geteste apparaten waren beter, 0% gelijk, 100% slechter
» De beste had een delta van 4%, het gemiddelde was 23%, de slechtste was 134%
Energiebeheer
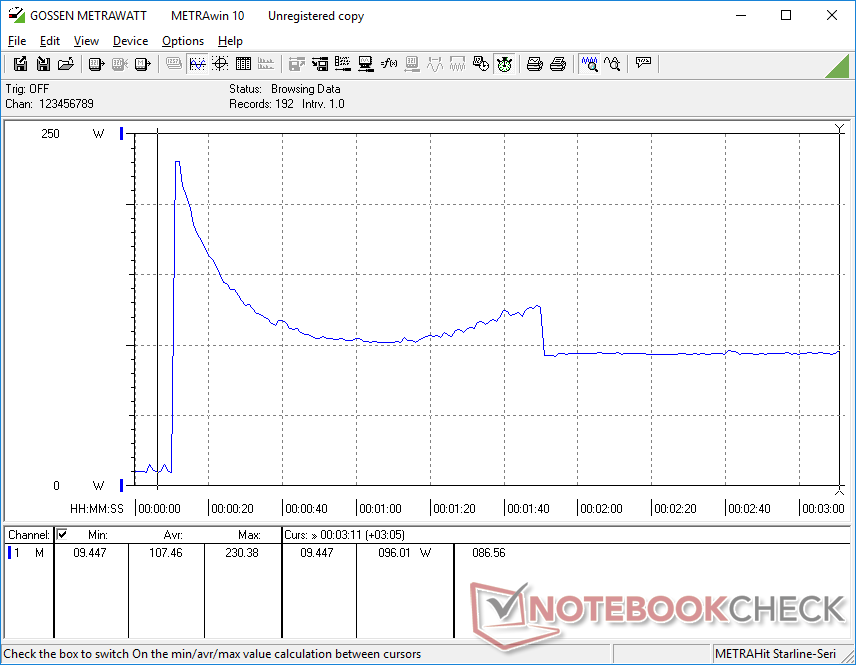
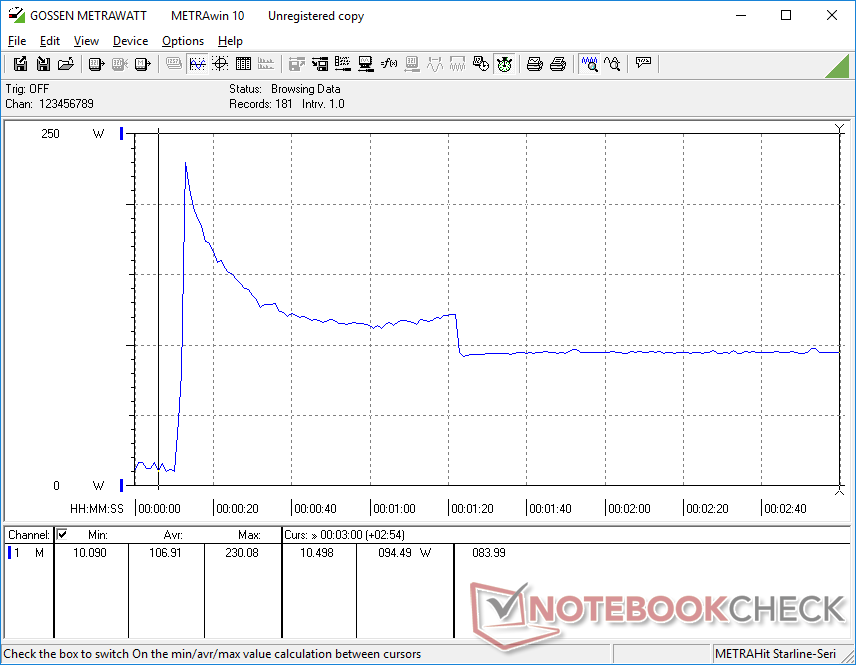
Stroomverbruik - Veeleisende kleine machine
Het stroomverbruik kan vrij hoog zijn, wat misschien niet onverwacht is gezien de desktop processor die erin zit. Het hoge Turbo Boost-potentieel van de Core i7-13700 kan ervoor zorgen dat het systeem wel 190 W tot 230 W verbruikt tijdens het starten van toepassingen of het uitvoeren van CPU-intensieve taken, zoals de grafieken hieronder laten zien. De lage Turbo Boost-duurzaamheid van de mini PC betekent echter dat dergelijke extreme stroomopnames slechts tijdelijk zijn.
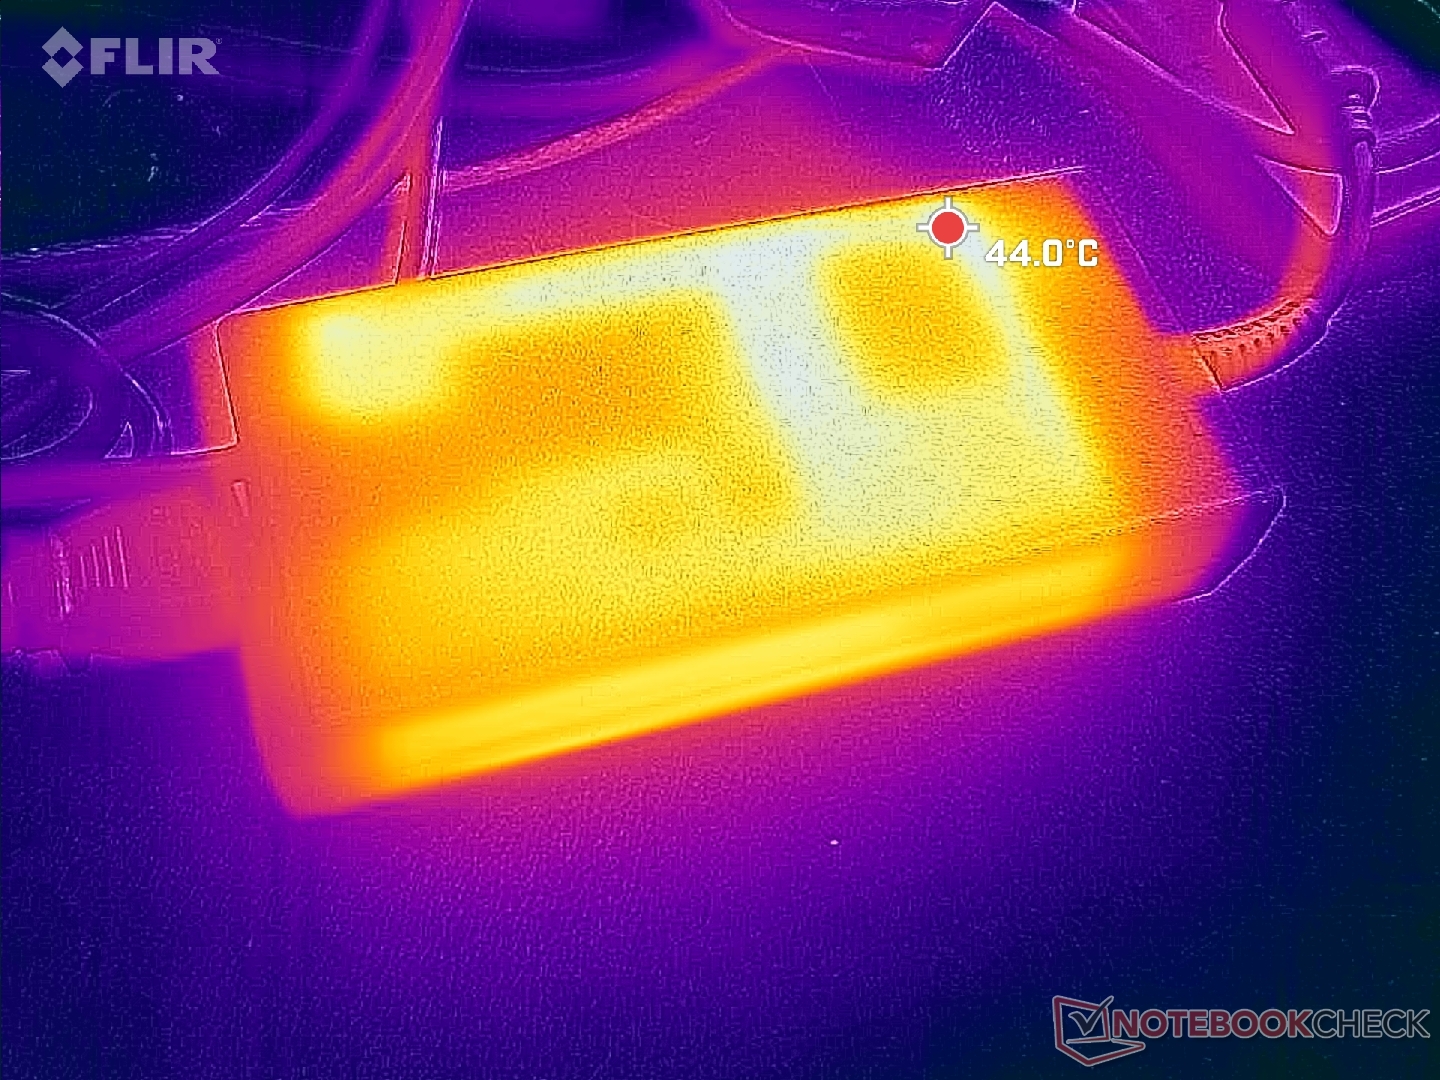
USB-C Power Delivery wordt niet ondersteund en dus moet de meegeleverde 180 W voedingsmodule (~15,4 x 7,5 x 3,2 cm) altijd aangesloten zijn om het systeem te laten werken. Ter vergelijking, sommige mini PC's zoals de Beelink SER7 kunnen uitsluitend werken op USB-C AC-adapters van derden, terwijl andere zoals de Lenovo IdeaCentre Mini helemaal geen externe voeding hebben.
| Uit / Standby | |
| Inactief | |
| Belasting |
|
Key:
min: | |
| Dell OptiPlex Micro i7-13700, UHD Graphics 770, , , x, | Apple Mac Mini M2 M2, M2 10-Core GPU, Apple SSD AP0512Z, , x, | Lenovo IdeaCentre Mini 01IRH8 i7-13700H, Iris Xe G7 96EUs, Samsung PM9B1 512GB MZVL4512HBLU, , x, | GMK NucBox K3 Pro i7-12650H, UHD Graphics 64EUs, Lexar NM610 Pro NM610P001T-HNNNG, , x, | Beelink GTR7 7840HS R7 7840HS, Radeon 780M, Crucial P3 Plus CT1000P3PSSD8, , x, | Beelink SER7 R7 7840HS, Radeon 780M, Crucial P3 Plus CT1000P3PSSD8, , x, | |
|---|---|---|---|---|---|---|
| Power Consumption | 62% | 4% | -18% | 5% | -8% | |
| Idle Minimum * (Watt) | 3.7 | 2.2 41% | 6.7 -81% | 7.1 -92% | 5.5 -49% | 6.7 -81% |
| Idle Average * (Watt) | 7.2 | 6.7 7% | 10.1 -40% | 5.8 19% | 7.3 -1% | |
| Idle Maximum * (Watt) | 8.7 | 2.6 70% | 7.1 18% | 18.6 -114% | 7.7 11% | 11.6 -33% |
| Load Average * (Watt) | 69.5 | 28.7 59% | 68.5 1% | 45.3 35% | 70.6 -2% | 64.1 8% |
| Witcher 3 ultra * (Watt) | 77.1 | 58.3 24% | 55.2 28% | 79.8 -4% | 75.8 2% | |
| Load Maximum * (Watt) | 230.6 | 51.5 78% | 104.3 55% | 52.9 77% | 111.8 52% | 94.8 59% |
* ... kleiner is beter
Power Consumption Witcher 3 / Stresstest
Power Consumption external Monitor
Pro
Contra
Verdict - Grote CPU voor een micro-formaat
Hoogtepunten van de OptiPlex Micro zijn de verwijderbare desktop CPU, onderhoudsgemak zonder gereedschap, hoge processorprestaties per volume en vier afzonderlijke video-out poorten. Gebruikers die multitasken tussen twee of meer monitoren voor grafieken, spreadsheets en tekstverwerking zullen de OptiPlex Micro een betrouwbare "set and forget" optie vinden.
Het draaien van een volwaardige Core i7 CPU die ontworpen is voor desktops in een mini PC-formaat heeft zijn nadelen. Vooral het Turbo Boost-potentieel is lager, waardoor de gemiddelde prestaties een stuk langzamer zijn dan die van een groter OptiPlex-systeem met dezelfde processor. Ten tweede zijn de kerntemperaturen met meer dan 90 C erg hoog, wat weliswaar technisch veilig is, maar over het algemeen niet ideaal, vooral wanneer de meeste andere mini PC's koeler werken. En tot slot is de verouderde geïntegreerde GPU onvoldoende voor de meeste moderne 3D renderingen en dit wordt nog erger gemaakt door het ontbreken van USB4 of Thunderbolt eGPU ondersteuning. Wij raden mini PC's met Iris Xe of Radeon 680M/780M grafische kaarten aan als uw werkbelasting een beetje grafische bewerking inhoudt.
Gebruikers van een mini PC die waarde hechten aan ruwe CPU-prestaties zullen de OptiPlex Micro de moeite waard vinden. Anders zijn alternatieven zoals de Intel NUC 13 Pro of Beelink GTR7 beter uitgebalanceerd wat betreft CPU- en GPU-prestaties.
De SSD throttling is ook jammer om te zien. Speciale SSD-hitteverspreiders hadden dit probleem waarschijnlijk kunnen oplossen, maar dit zou het gewicht en de prijs hebben doen toenemen.
Prijs en beschikbaarheid
Dell levert de OptiPlex Micro Plus 7010 momenteel vanaf 929 USD, maar op dit moment zijn alleen configuraties met de langzamere Core T-serie CPU's beschikbaar.
Dell OptiPlex Micro
- 24-10-2023 v7 (old)
Allen Ngo
Transparantie
De selectie van te beoordelen apparaten wordt gemaakt door onze redactie. Het testexemplaar werd ten behoeve van deze beoordeling door de fabrikant of detailhandelaar in bruikleen aan de auteur verstrekt. De kredietverstrekker had geen invloed op deze recensie, noch ontving de fabrikant vóór publicatie een exemplaar van deze recensie. Er bestond geen verplichting om deze recensie te publiceren. Als onafhankelijk mediabedrijf is Notebookcheck niet onderworpen aan het gezag van fabrikanten, detailhandelaren of uitgevers.
[transparency_disclaimer]Dit is hoe Notebookcheck test
Elk jaar beoordeelt Notebookcheck onafhankelijk honderden laptops en smartphones met behulp van gestandaardiseerde procedures om ervoor te zorgen dat alle resultaten vergelijkbaar zijn. We hebben onze testmethoden al zo'n 20 jaar voortdurend ontwikkeld en daarbij de industriestandaard bepaald. In onze testlaboratoria wordt gebruik gemaakt van hoogwaardige meetapparatuur door ervaren technici en redacteuren. Deze tests omvatten een validatieproces in meerdere fasen. Ons complexe beoordelingssysteem is gebaseerd op honderden goed onderbouwde metingen en benchmarks, waardoor de objectiviteit behouden blijft. Meer informatie over onze testmethoden kunt u hier vinden.
Price comparison

