Kort testrapport Lenovo ThinkPad L480 (i5-8250U, UHD 620, IPS, SSD) Laptop
| SD Card Reader | |
| average JPG Copy Test (av. of 3 runs) | |
| Dell Latitude 5490-TD70X (Toshiba Exceria Pro SDXC 64 GB UHS-II) | |
| HP ProBook 440 G5-3KX87ES (Toshiba Exceria Pro SDXC 64 GB UHS-II) | |
| Lenovo ThinkPad E480-20KQS00000 (Toshiba Exceria Pro M501) | |
| Lenovo ThinkPad E480-20KNCTO1WW (Toshiba Exceria Pro M501) | |
| Lenovo ThinkPad L470-20J5S00C00 (Toshiba Exceria Pro SDXC 64 GB UHS-II) | |
| Lenovo ThinkPad L480-20LS001AGE (Toshiba Exceria Pro M501 microSDXC 64GB) | |
| Gemiddelde van klas Office (19.8 - 198.5, n=22, laatste 2 jaar) | |
| maximum AS SSD Seq Read Test (1GB) | |
| Dell Latitude 5490-TD70X (Toshiba Exceria Pro SDXC 64 GB UHS-II) | |
| HP ProBook 440 G5-3KX87ES (Toshiba Exceria Pro SDXC 64 GB UHS-II) | |
| Lenovo ThinkPad E480-20KNCTO1WW (Toshiba Exceria Pro M501) | |
| Lenovo ThinkPad L480-20LS001AGE (Toshiba Exceria Pro M501 microSDXC 64GB) | |
| Lenovo ThinkPad L470-20J5S00C00 (Toshiba Exceria Pro SDXC 64 GB UHS-II) | |
| Lenovo ThinkPad E480-20KQS00000 (Toshiba Exceria Pro M501) | |
| Gemiddelde van klas Office (27.4 - 249, n=21, laatste 2 jaar) | |
| |||||||||||||||||||||||||
Helderheidsverdeling: 73 %
Helderheid in Batterij-modus: 2.3 cd/m²
Contrast: 1306:1 (Zwart: 0.17 cd/m²)
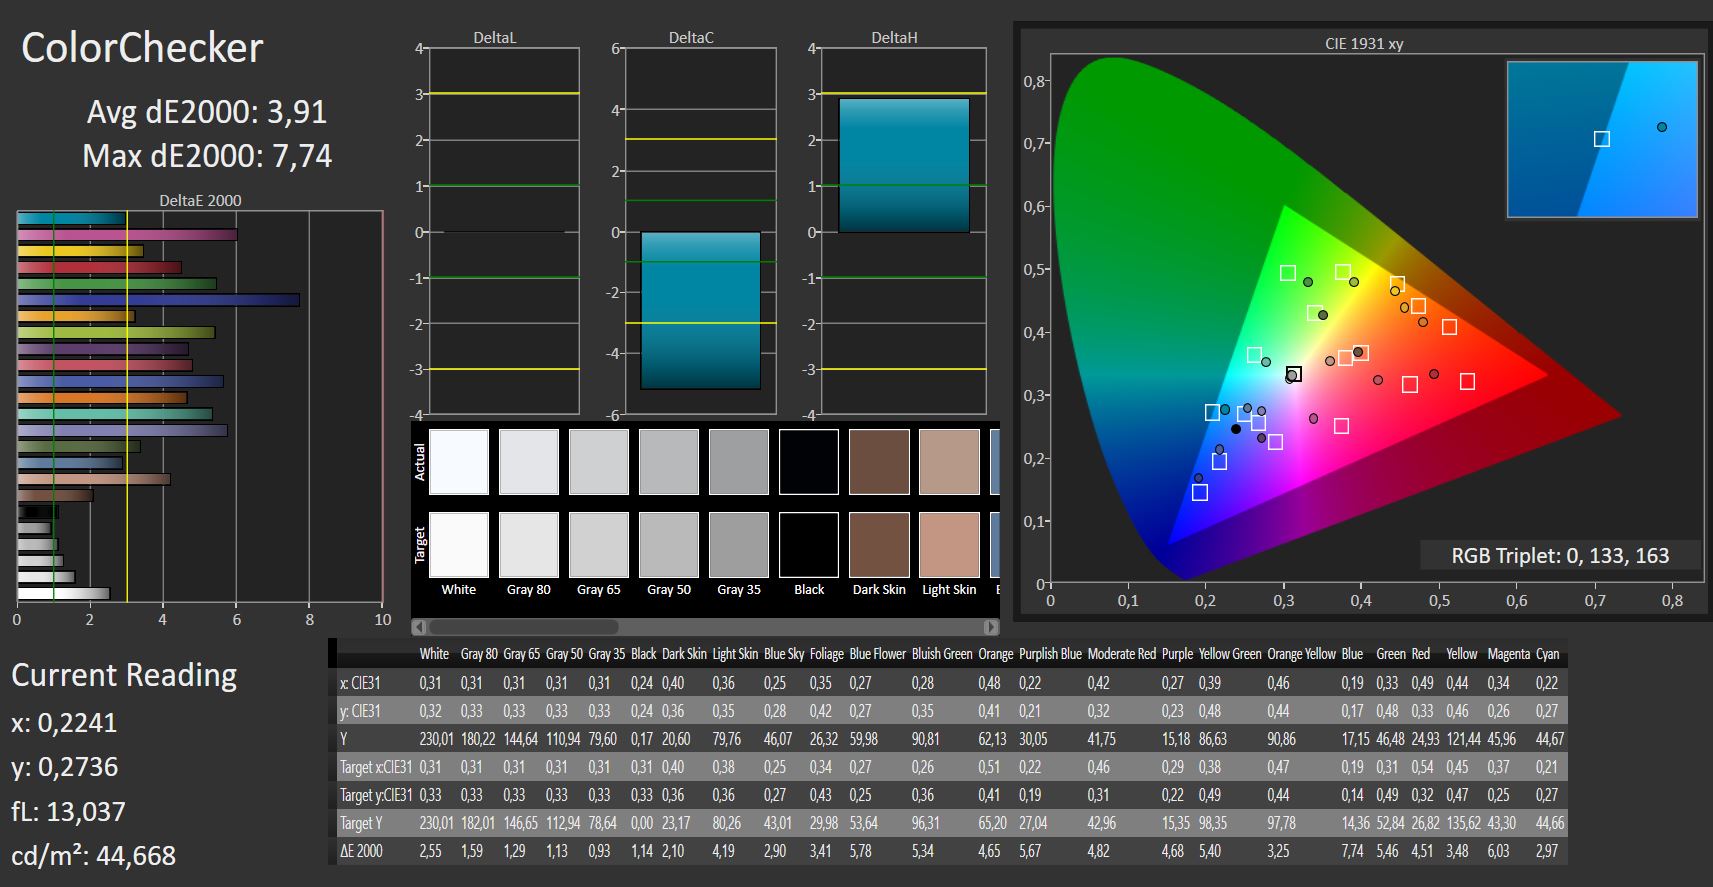
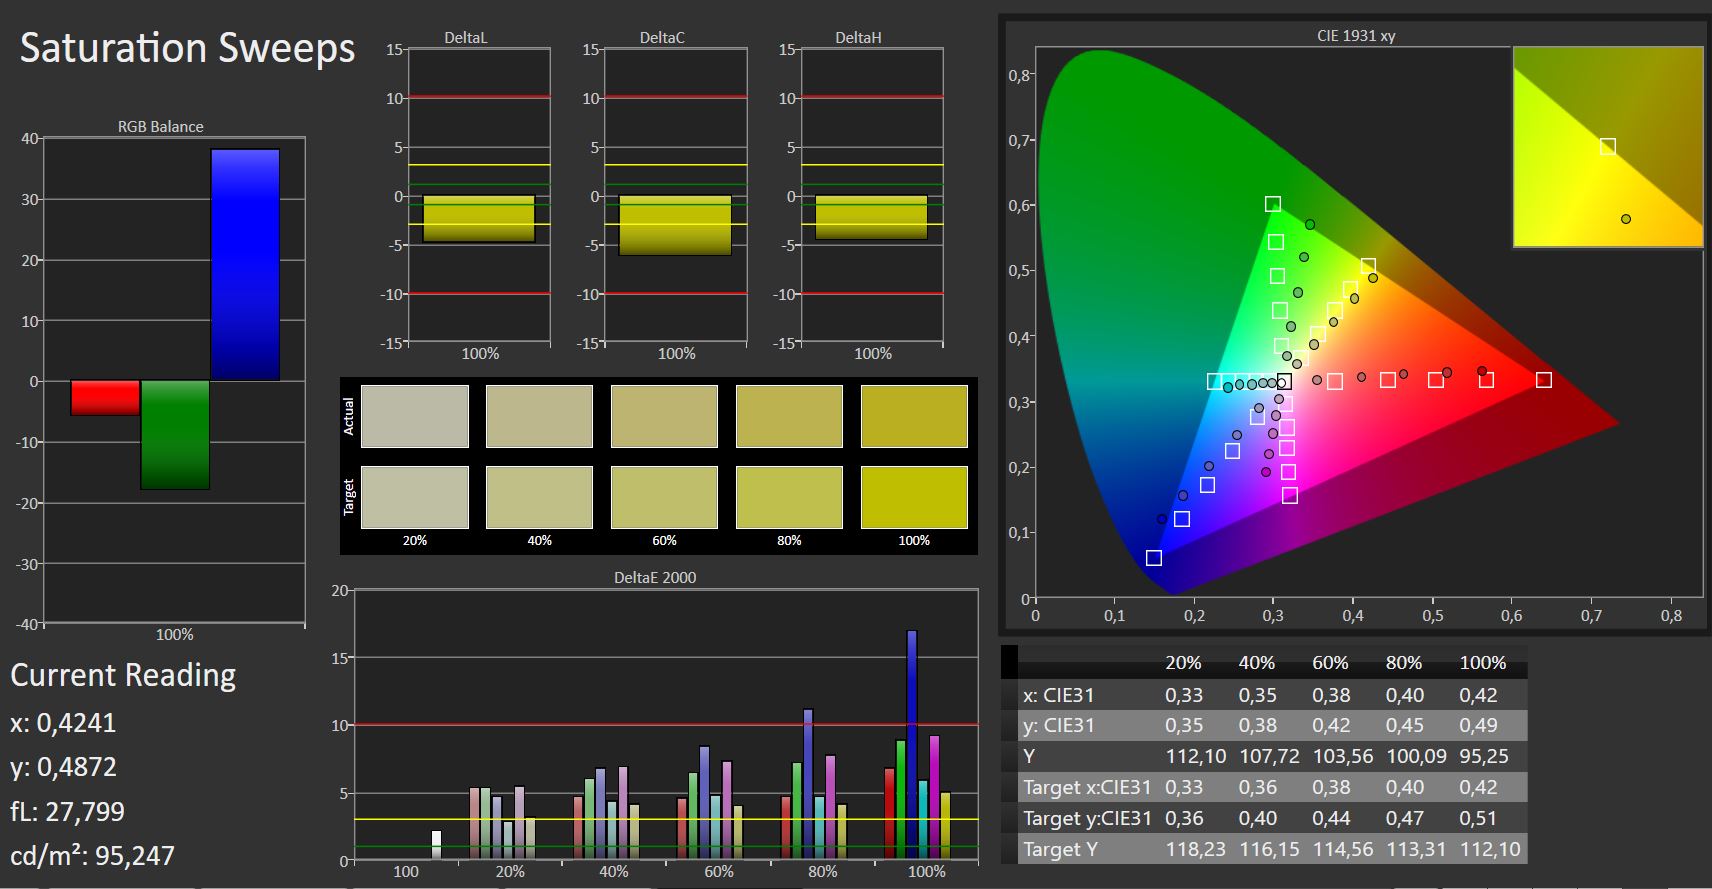
ΔE ColorChecker Calman: 3.91 | ∀{0.5-29.43 Ø4.72}
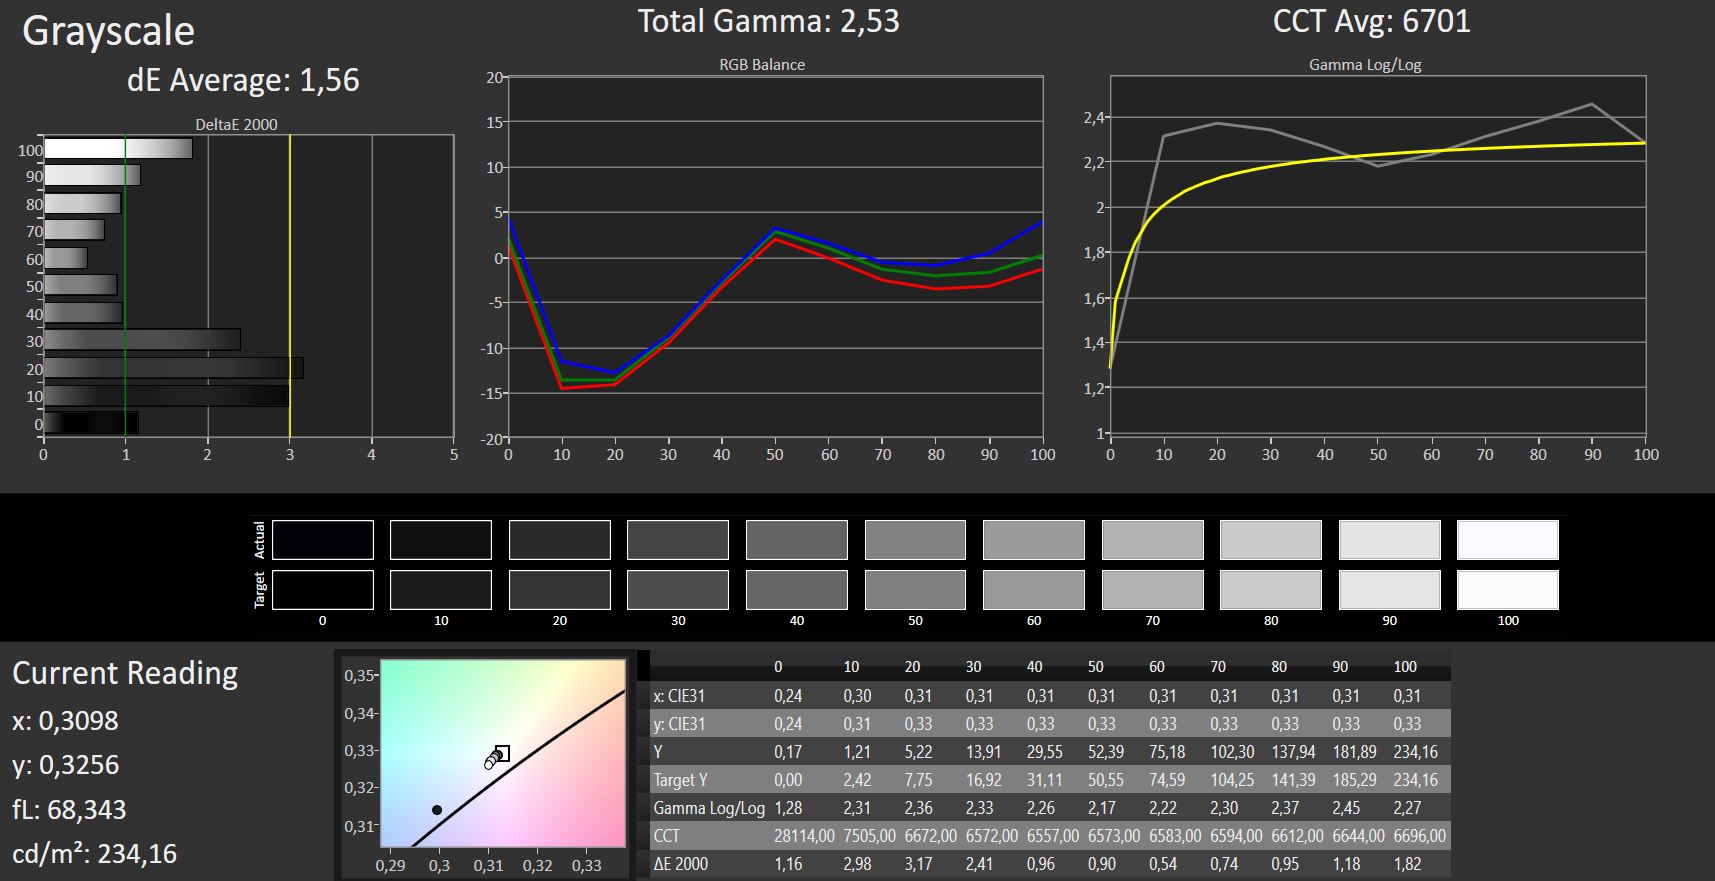
ΔE Greyscale Calman: 1.56 | ∀{0.09-98 Ø4.97}
55% sRGB (Argyll 1.6.3 3D)
35% AdobeRGB 1998 (Argyll 1.6.3 3D)
37.57% AdobeRGB 1998 (Argyll 3D)
54.7% sRGB (Argyll 3D)
36.37% Display P3 (Argyll 3D)
Gamma: 2.53
CCT: 6701 K
| Lenovo ThinkPad L480-20LS001AGE B140HAN02.4, 1920x1080, 14" | Lenovo ThinkPad L470-20J5S00C00 N140HCA-EAB, 1920x1080, 14" | Lenovo ThinkPad E480-20KNCTO1WW Innolux N140HCA-EAC, 1920x1080, 14" | Lenovo ThinkPad E480-20KQS00000 Innolux N140HCA-EAC, 1920x1080, 14" | HP ProBook 440 G5-3KX87ES LGD04B2, 1920x1080, 14" | Dell Latitude 5490-TD70X AU Optronics AUO263D, 1920x1080, 14" | |
|---|---|---|---|---|---|---|
| Display | 16% | 14% | 15% | 9% | 0% | |
| Display P3 Coverage (%) | 36.37 | 42.21 16% | 41.56 14% | 41.88 15% | 39.56 9% | 36.28 0% |
| sRGB Coverage (%) | 54.7 | 62.7 15% | 62.2 14% | 62.8 15% | 59.3 8% | 54.6 0% |
| AdobeRGB 1998 Coverage (%) | 37.57 | 43.71 16% | 42.96 14% | 43.29 15% | 40.88 9% | 37.48 0% |
| Response Times | 19% | 22% | 23% | 29% | 21% | |
| Response Time Grey 50% / Grey 80% * (ms) | 73 ? | 50.4 ? 31% | 44.8 ? 39% | 44 ? 40% | 40 ? 45% | 46.9 ? 36% |
| Response Time Black / White * (ms) | 33 ? | 30.8 ? 7% | 31.2 ? 5% | 31.2 ? 5% | 28.8 ? 13% | 31.2 ? 5% |
| PWM Frequency (Hz) | 25000 ? | 24880 ? | ||||
| Screen | -46% | -53% | -20% | -41% | -28% | |
| Brightness middle (cd/m²) | 222 | 274 23% | 262 18% | 251 13% | 236 6% | 227 2% |
| Brightness (cd/m²) | 209 | 256 22% | 245 17% | 231 11% | 221 6% | 211 1% |
| Brightness Distribution (%) | 73 | 85 16% | 83 14% | 80 10% | 88 21% | 88 21% |
| Black Level * (cd/m²) | 0.17 | 0.35 -106% | 0.19 -12% | 0.19 -12% | 0.26 -53% | 0.19 -12% |
| Contrast (:1) | 1306 | 783 -40% | 1379 6% | 1321 1% | 908 -30% | 1195 -8% |
| Colorchecker dE 2000 * | 3.91 | 6.1 -56% | 7 -79% | 5.1 -30% | 5.7 -46% | 5.6 -43% |
| Colorchecker dE 2000 max. * | 7.74 | 13.8 -78% | 23.6 -205% | 10.6 -37% | 22 -184% | 22.4 -189% |
| Greyscale dE 2000 * | 1.56 | 5.7 -265% | 6.4 -310% | 4.5 -188% | 3.8 -144% | 2.4 -54% |
| Gamma | 2.53 87% | 2.11 104% | 2.14 103% | 2.18 101% | 2.1 105% | 2.44 90% |
| CCT | 6701 97% | 6419 101% | 6065 107% | 6146 106% | 7318 89% | 6506 100% |
| Color Space (Percent of AdobeRGB 1998) (%) | 35 | 40.2 15% | 39.5 13% | 39.8 14% | 37.7 8% | 34.5 -1% |
| Color Space (Percent of sRGB) (%) | 55 | 62.4 13% | 61.9 13% | 62.5 14% | 59.2 8% | 54.4 -1% |
| Totaal Gemiddelde (Programma / Instellingen) | -4% /
-25% | -6% /
-29% | 6% /
-8% | -1% /
-22% | -2% /
-16% |
* ... kleiner is beter
Responstijd Scherm
| ↔ Responstijd Zwart naar Wit | ||
|---|---|---|
| 33 ms ... stijging ↗ en daling ↘ gecombineerd | ↗ 19 ms stijging | 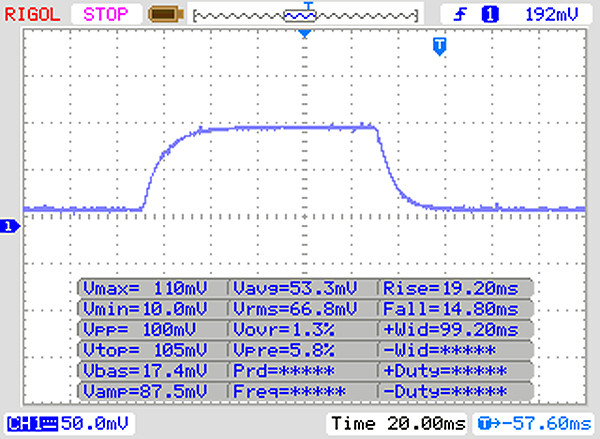 |
| ↘ 14 ms daling | ||
| Het scherm vertoonde trage responstijden in onze tests en is misschien te traag voor games. Ter vergelijking: alle testtoestellen variëren van 0.1 (minimum) tot 240 (maximum) ms. » 89 % van alle toestellen zijn beter. Dit betekent dat de gemeten responstijd slechter is dan het gemiddelde (19.8 ms) van alle geteste toestellen. | ||
| ↔ Responstijd 50% Grijs naar 80% Grijs | ||
| 73 ms ... stijging ↗ en daling ↘ gecombineerd | ↗ 36 ms stijging | 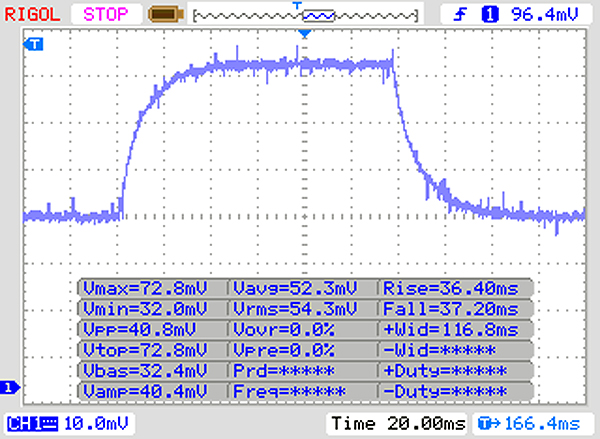 |
| ↘ 37 ms daling | ||
| Het scherm vertoonde trage responstijden in onze tests en is misschien te traag voor games. Ter vergelijking: alle testtoestellen variëren van 0.165 (minimum) tot 636 (maximum) ms. » 99 % van alle toestellen zijn beter. Dit betekent dat de gemeten responstijd slechter is dan het gemiddelde (31 ms) van alle geteste toestellen. | ||
Screen Flickering / PWM (Pulse-Width Modulation)
| Screen flickering / PWM niet waargenomen | 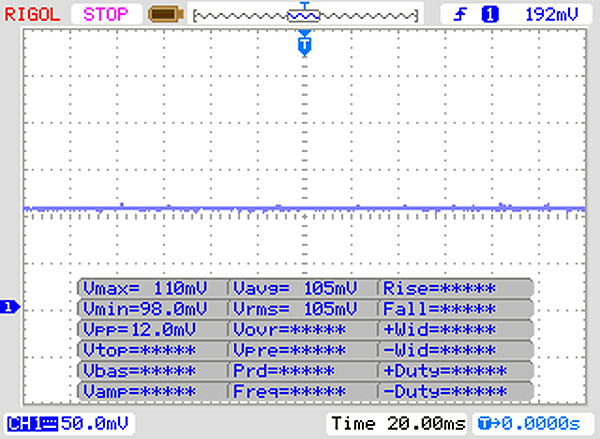 | ||
Ter vergelijking: 52 % van alle geteste toestellen maakten geen gebruik van PWM om de schermhelderheid te verlagen. Als het wel werd gebruikt, werd een gemiddelde van 7769 (minimum: 5 - maximum: 343500) Hz waargenomen. | |||
* ... kleiner is beter
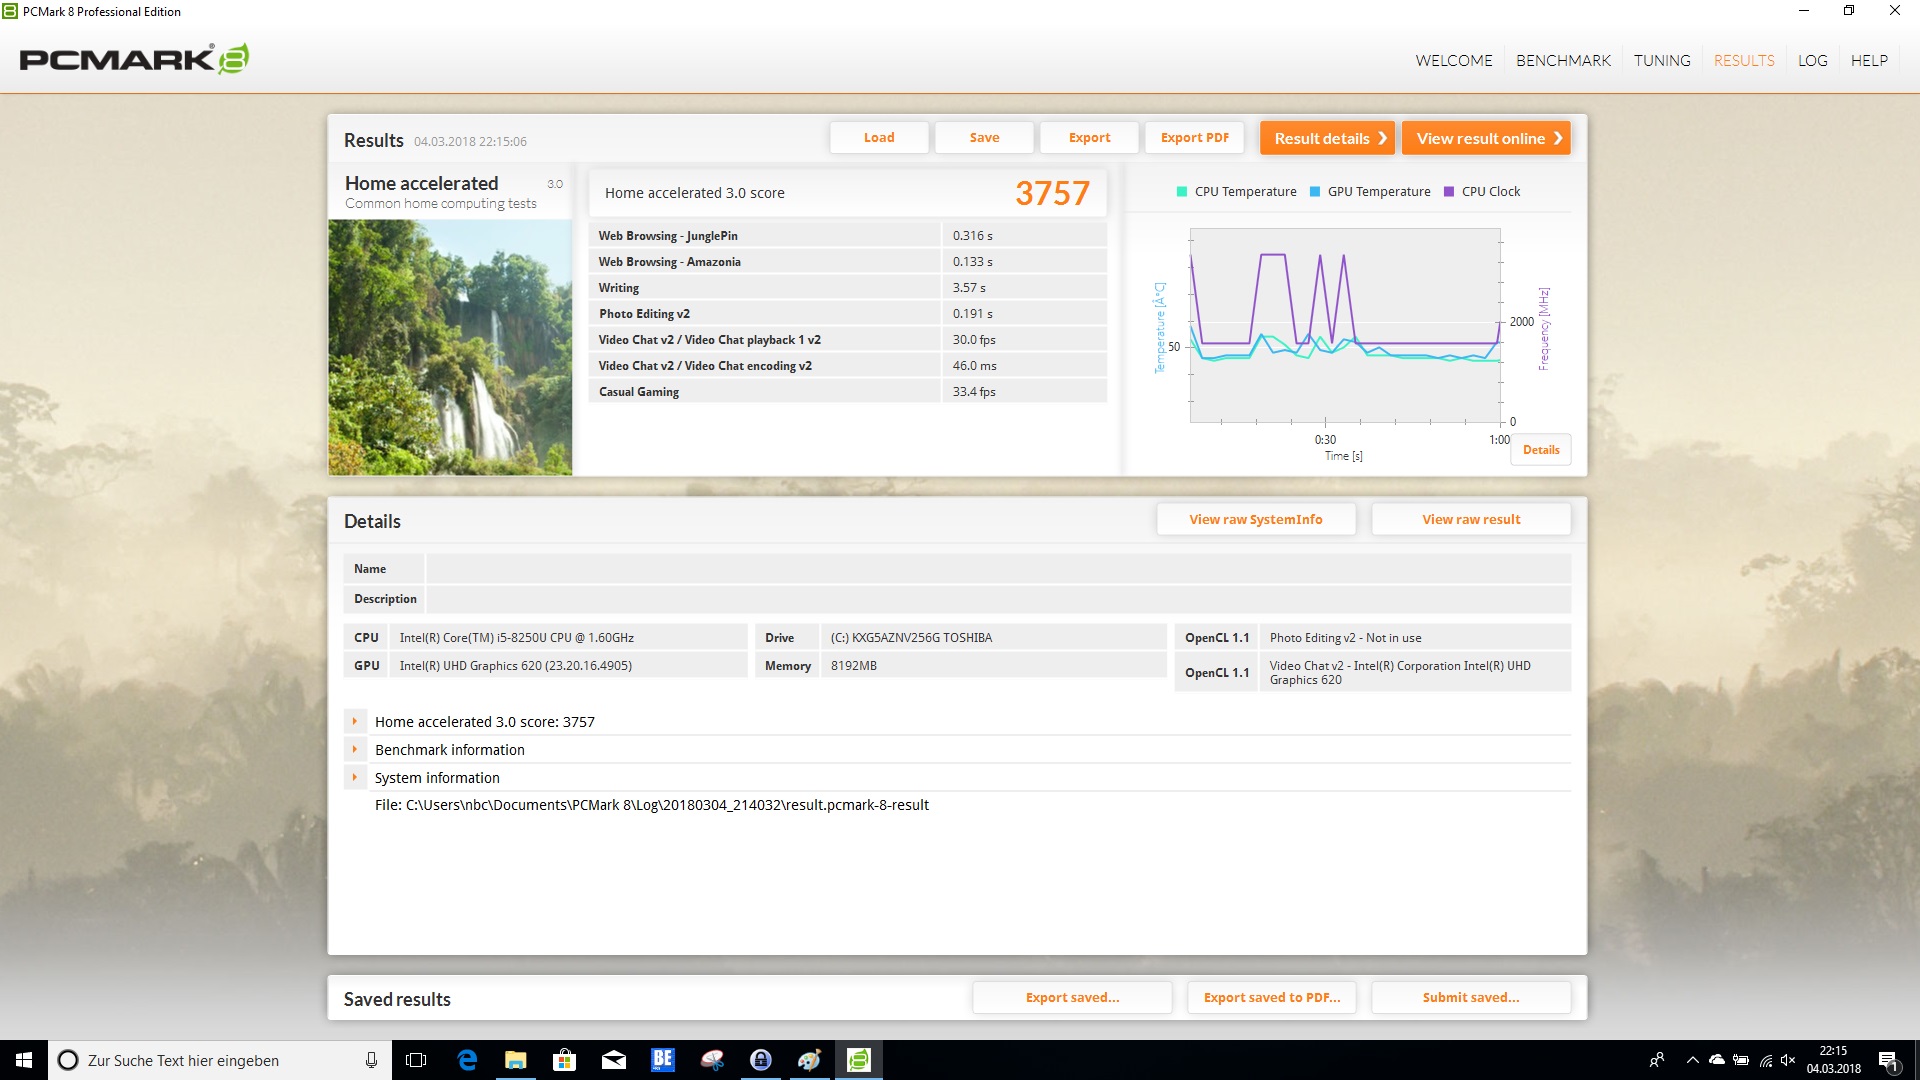
| PCMark 8 Home Score Accelerated v2 | 3757 punten | |
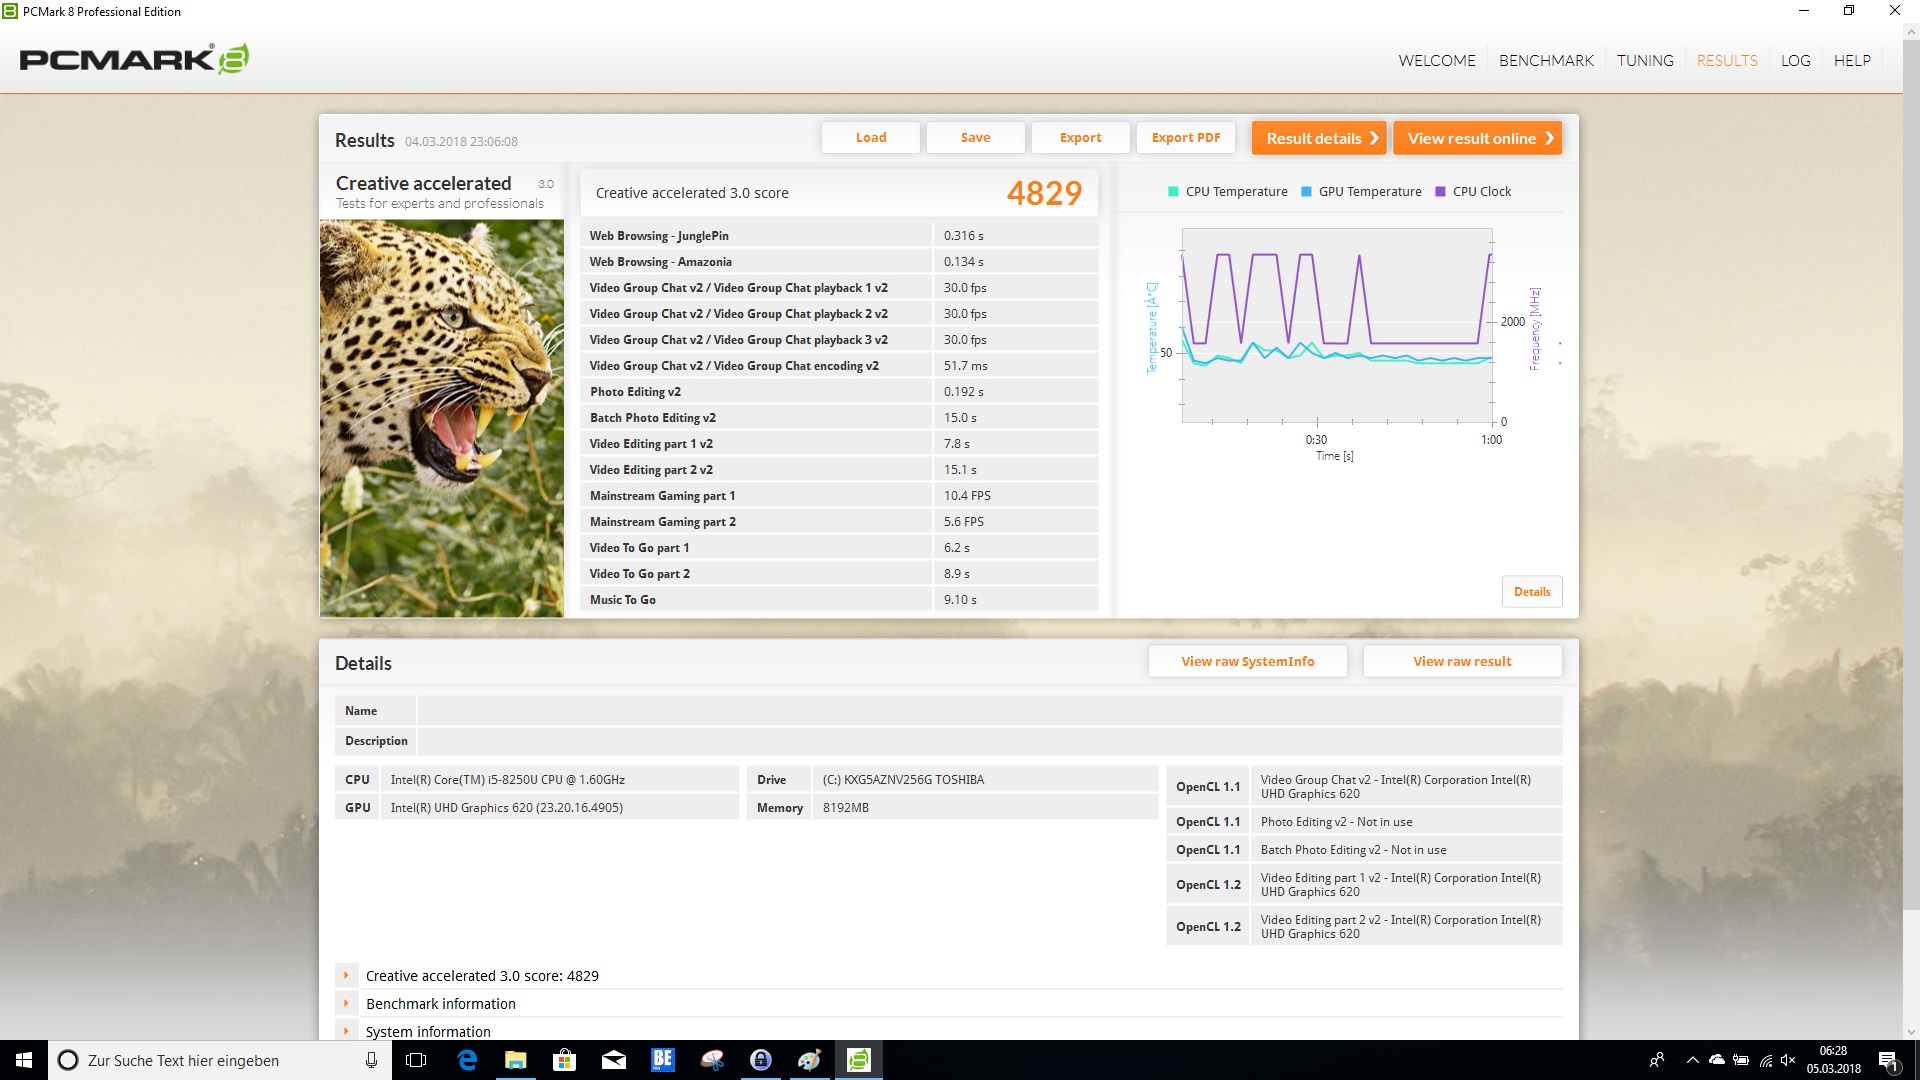
| PCMark 8 Creative Score Accelerated v2 | 4829 punten | |
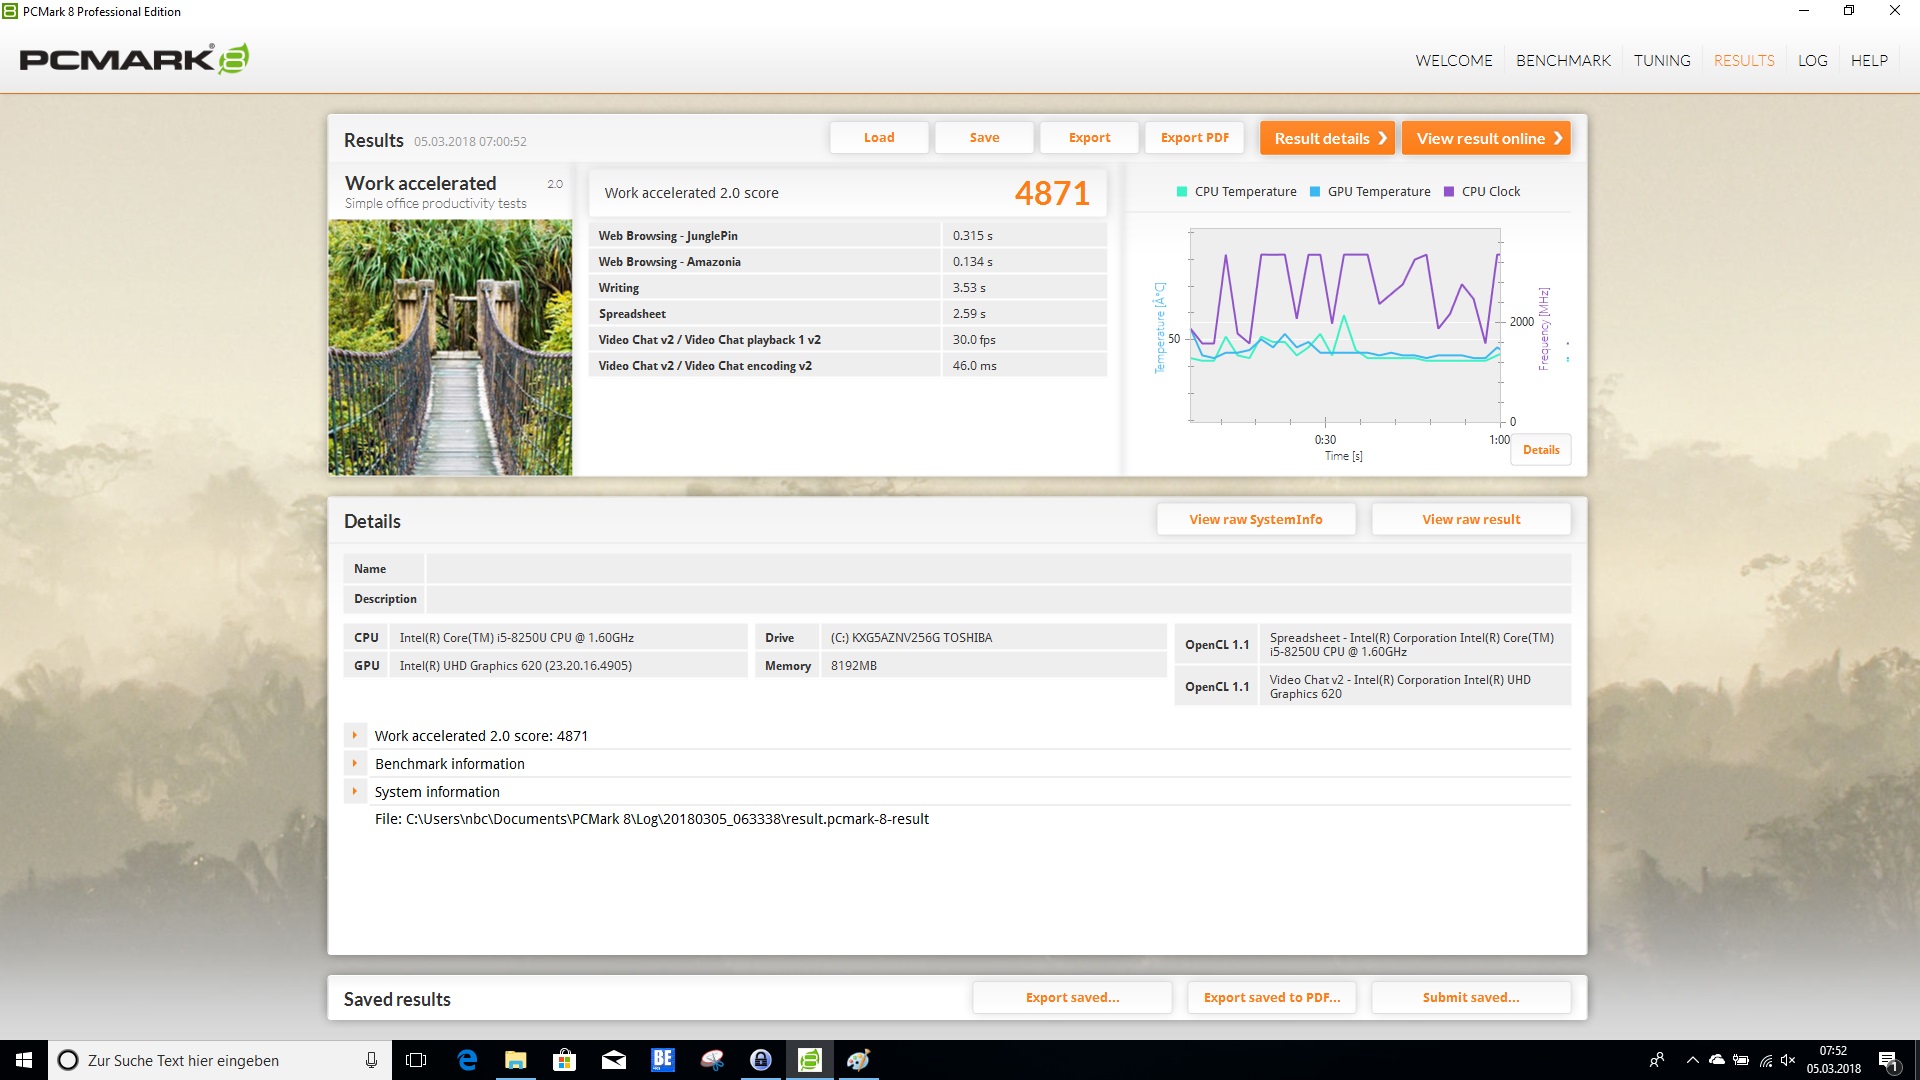
| PCMark 8 Work Score Accelerated v2 | 4871 punten | |
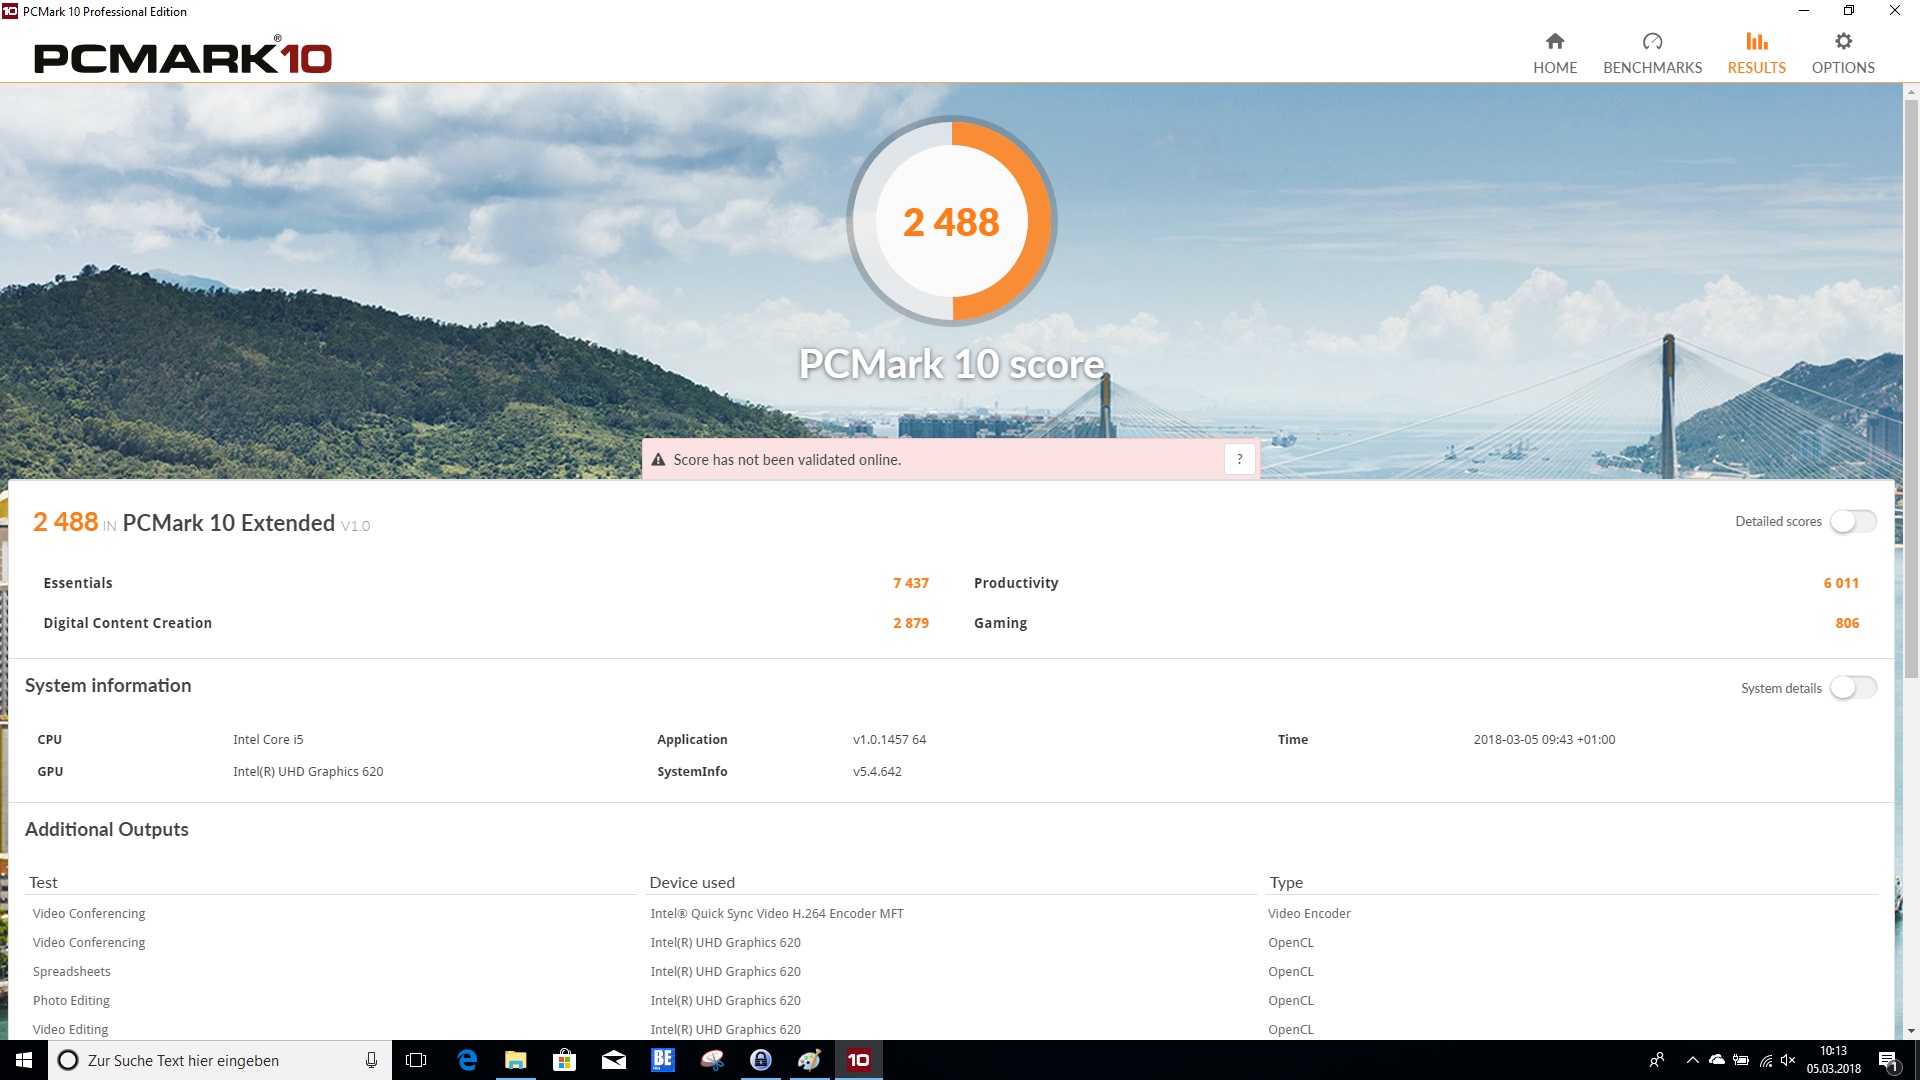
| PCMark 10 Score | 2488 punten | |
Help | ||
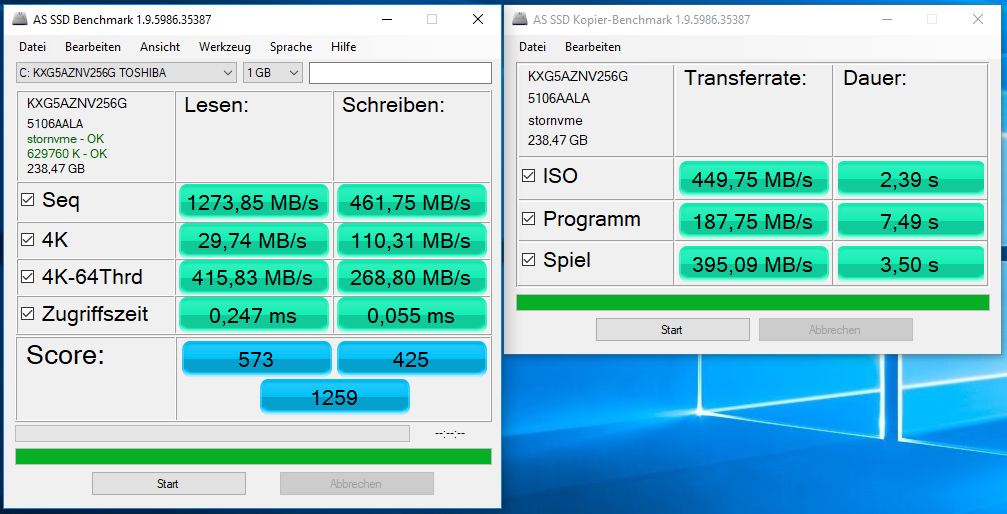
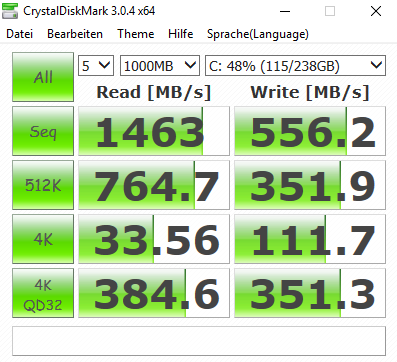
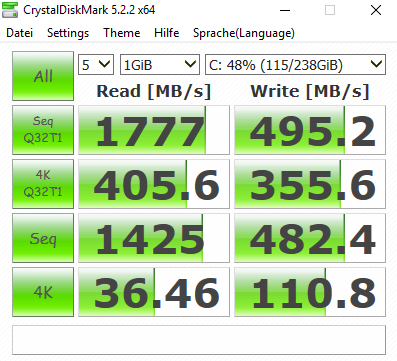
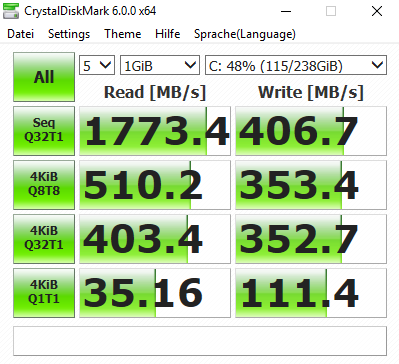
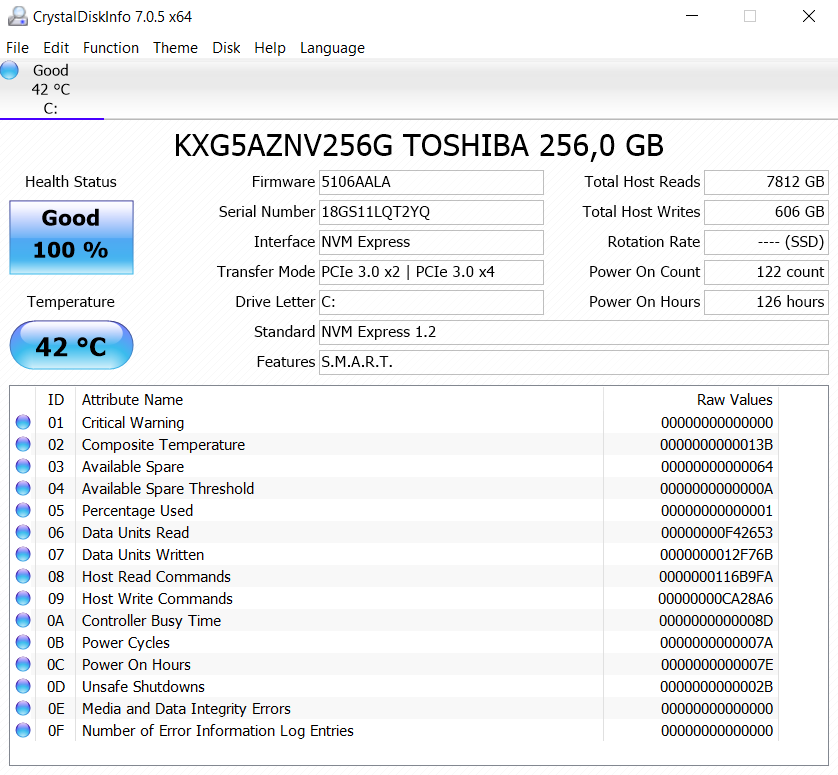
| Lenovo ThinkPad L480-20LS001AGE Toshiba KXG5AZNV256G | Lenovo ThinkPad L470-20J5S00C00 SanDisk X400 256GB, SATA (SD8SB8U-256G) | Lenovo ThinkPad E480-20KNCTO1WW Toshiba KBG30ZMT128G | Lenovo ThinkPad E480-20KQS00000 Lenovo LENSE20256GMSP34MEAT2TA | HP ProBook 440 G5-3KX87ES Intel SSD 600p SSDPEKKW256G7 | Dell Latitude 5490-TD70X Toshiba KSG60ZMV512G | |
|---|---|---|---|---|---|---|
| CrystalDiskMark 3.0 | -31% | -42% | -30% | 13% | -27% | |
| Read Seq (MB/s) | 1463 | 495.2 -66% | 909 -38% | 1295 -11% | 1181 -19% | 465.1 -68% |
| Write Seq (MB/s) | 556 | 485.7 -13% | 128.4 -77% | 160.6 -71% | 602 8% | 425 -24% |
| Read 512 (MB/s) | 765 | 323.4 -58% | 715 -7% | 872 14% | 923 21% | 410.1 -46% |
| Write 512 (MB/s) | 351.9 | 291.5 -17% | 127 -64% | 122 -65% | 600 71% | 360.7 3% |
| Read 4k (MB/s) | 33.56 | 34.2 2% | 33.35 -1% | 25.72 -23% | 35.48 6% | 27.34 -19% |
| Write 4k (MB/s) | 111.7 | 74.3 -33% | 82.3 -26% | 95.2 -15% | 139.8 25% | 89 -20% |
| Read 4k QD32 (MB/s) | 384.6 | 321.3 -16% | 197.5 -49% | 389.9 1% | 287.8 -25% | 295.6 -23% |
| Write 4k QD32 (MB/s) | 351.3 | 188 -46% | 100.2 -71% | 118.3 -66% | 417.1 19% | 300.2 -15% |

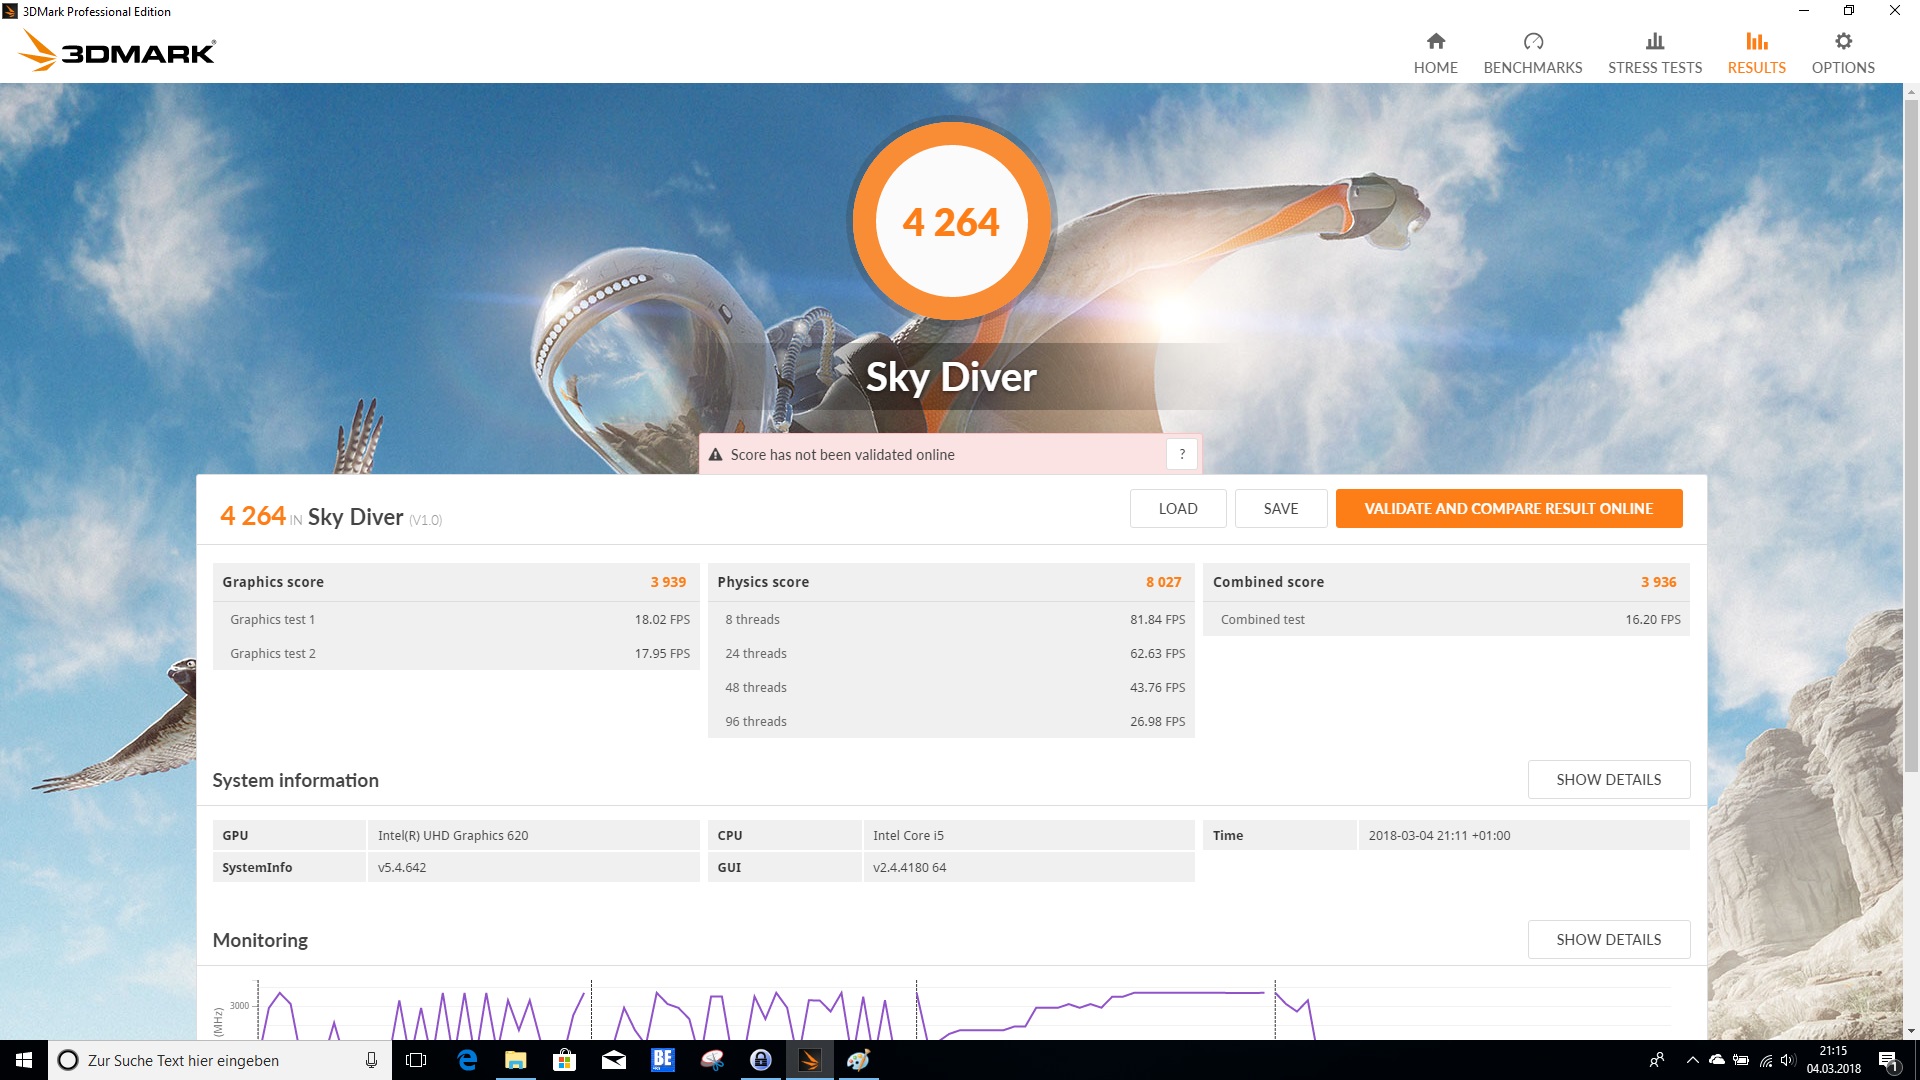
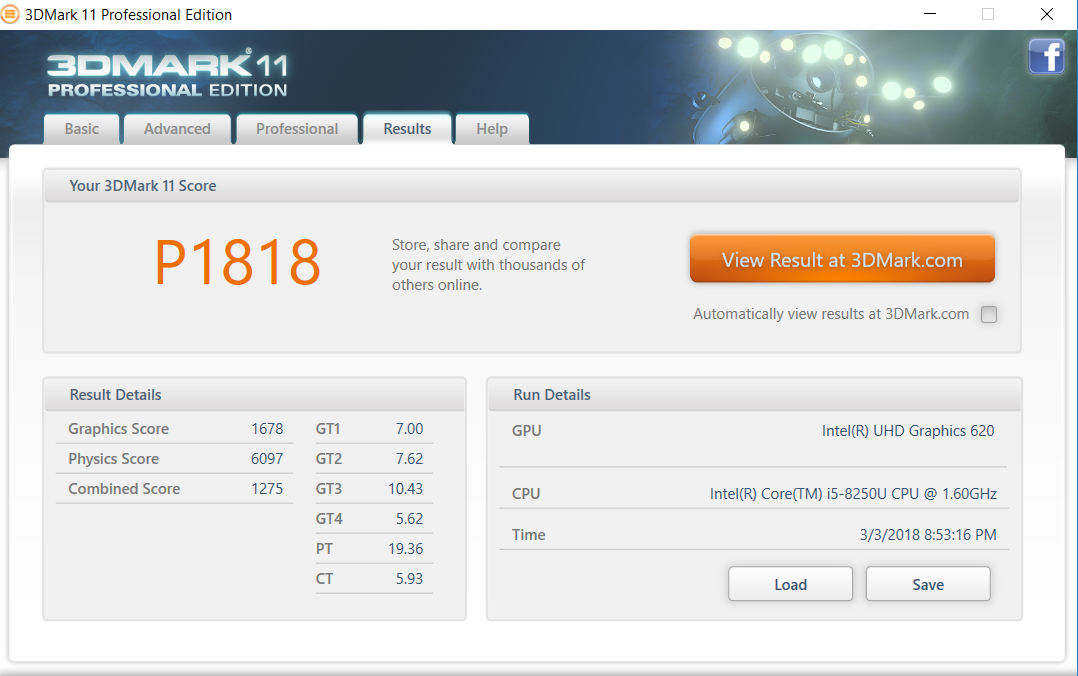
| 3DMark 11 Performance | 1818 punten | |
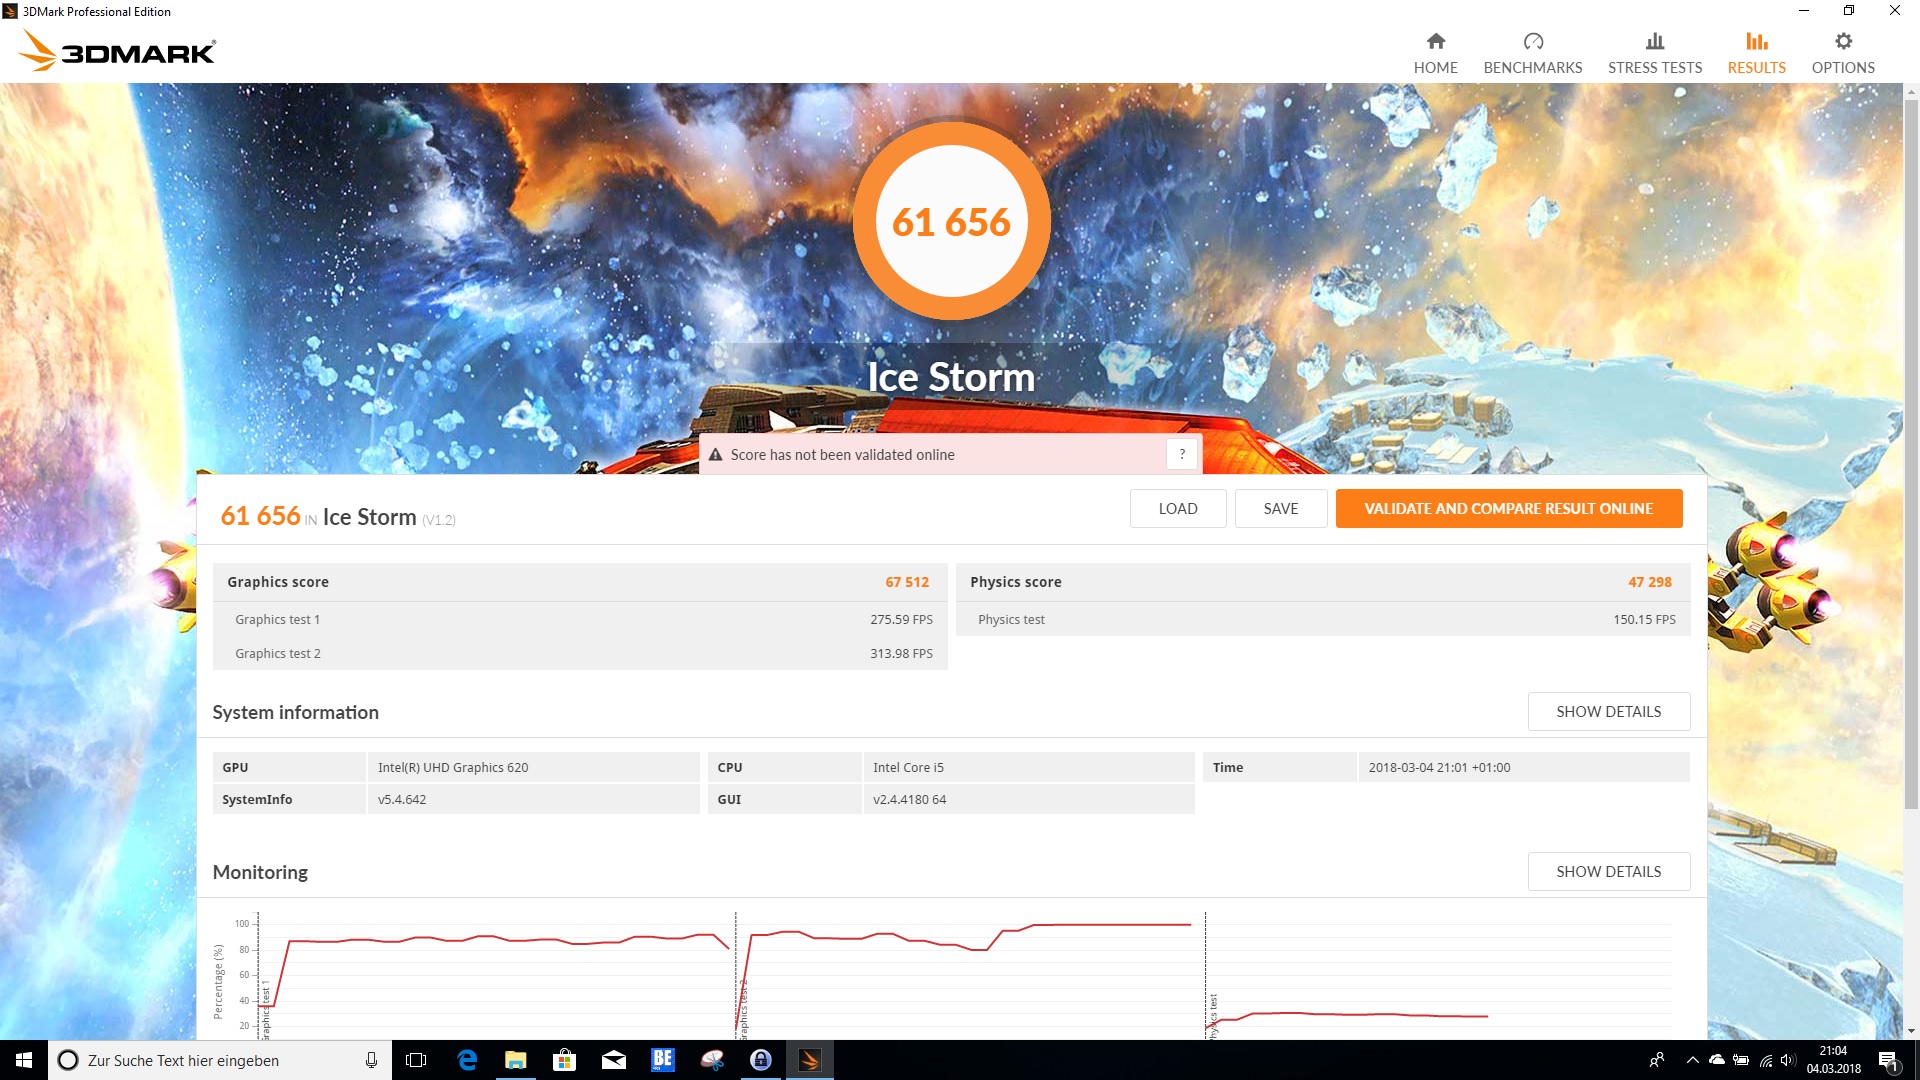
| 3DMark Ice Storm Standard Score | 61656 punten | |
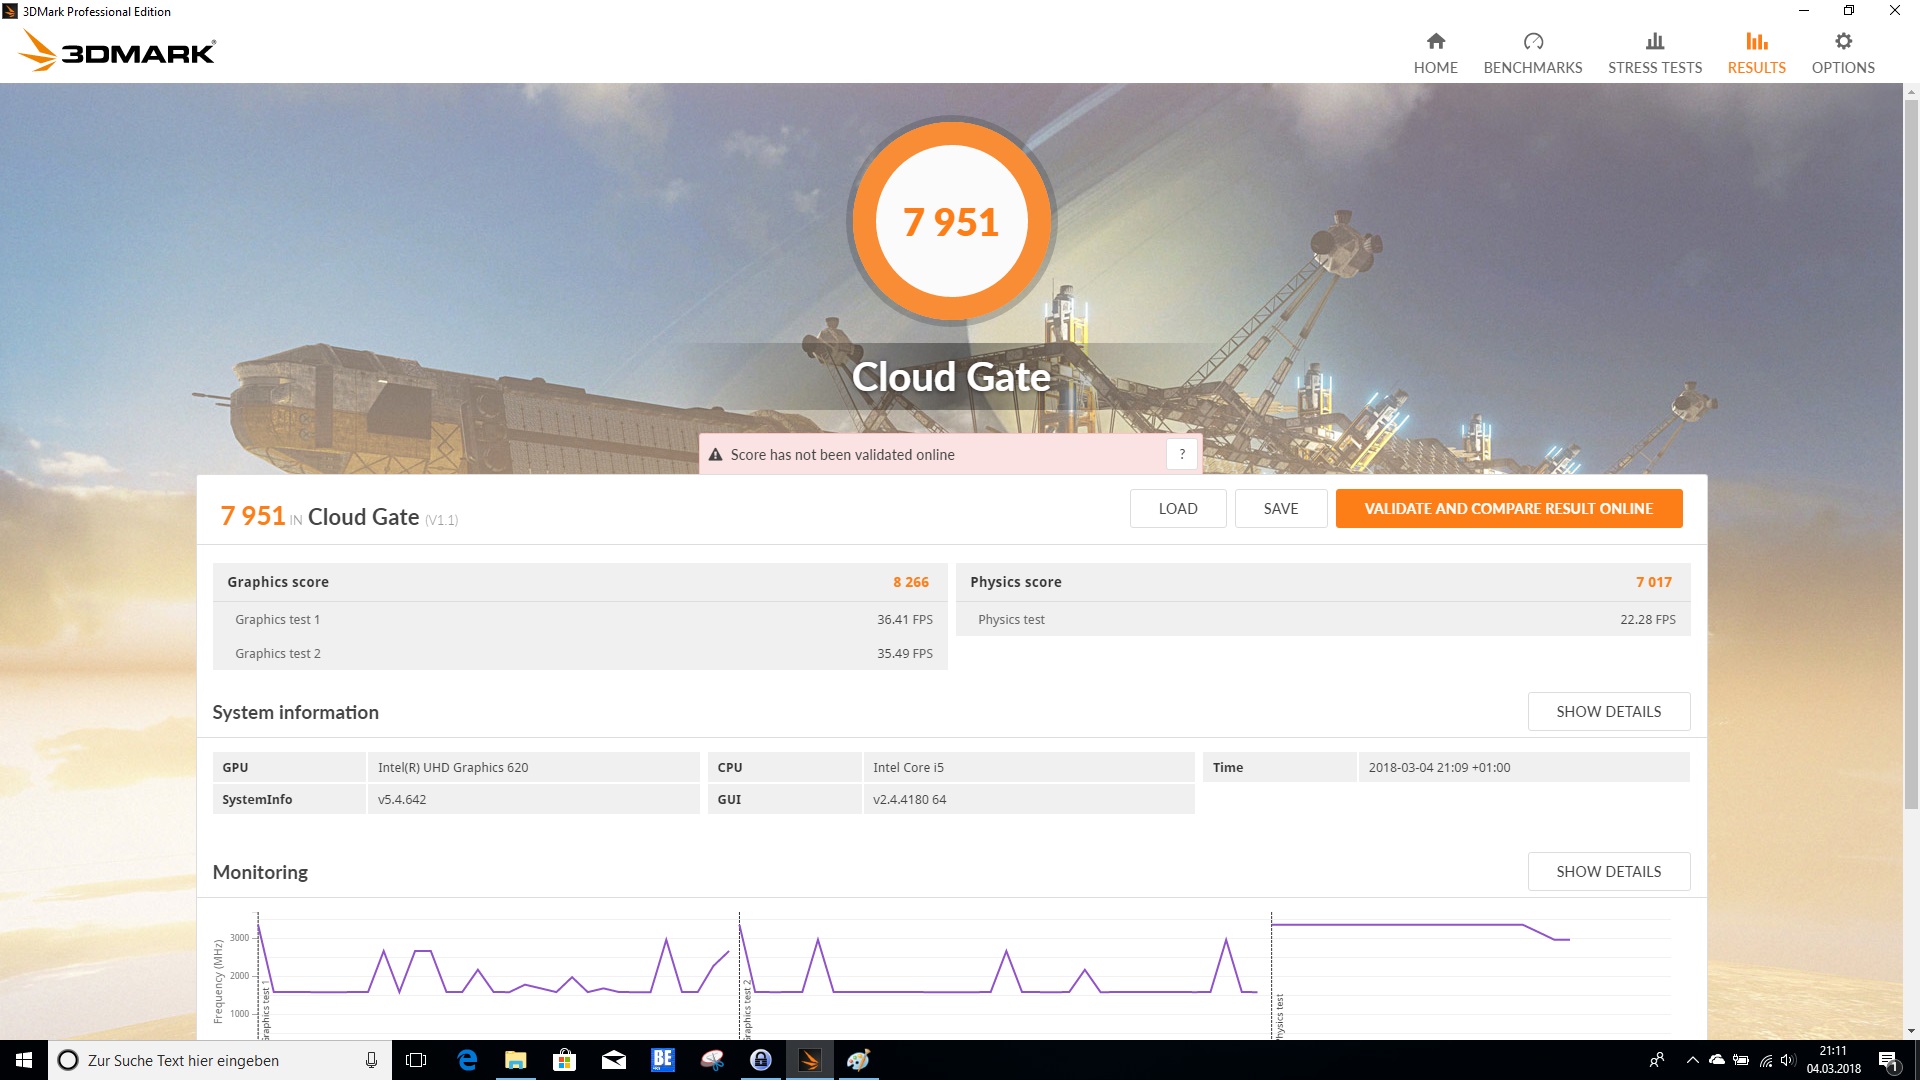
| 3DMark Cloud Gate Standard Score | 7951 punten | |
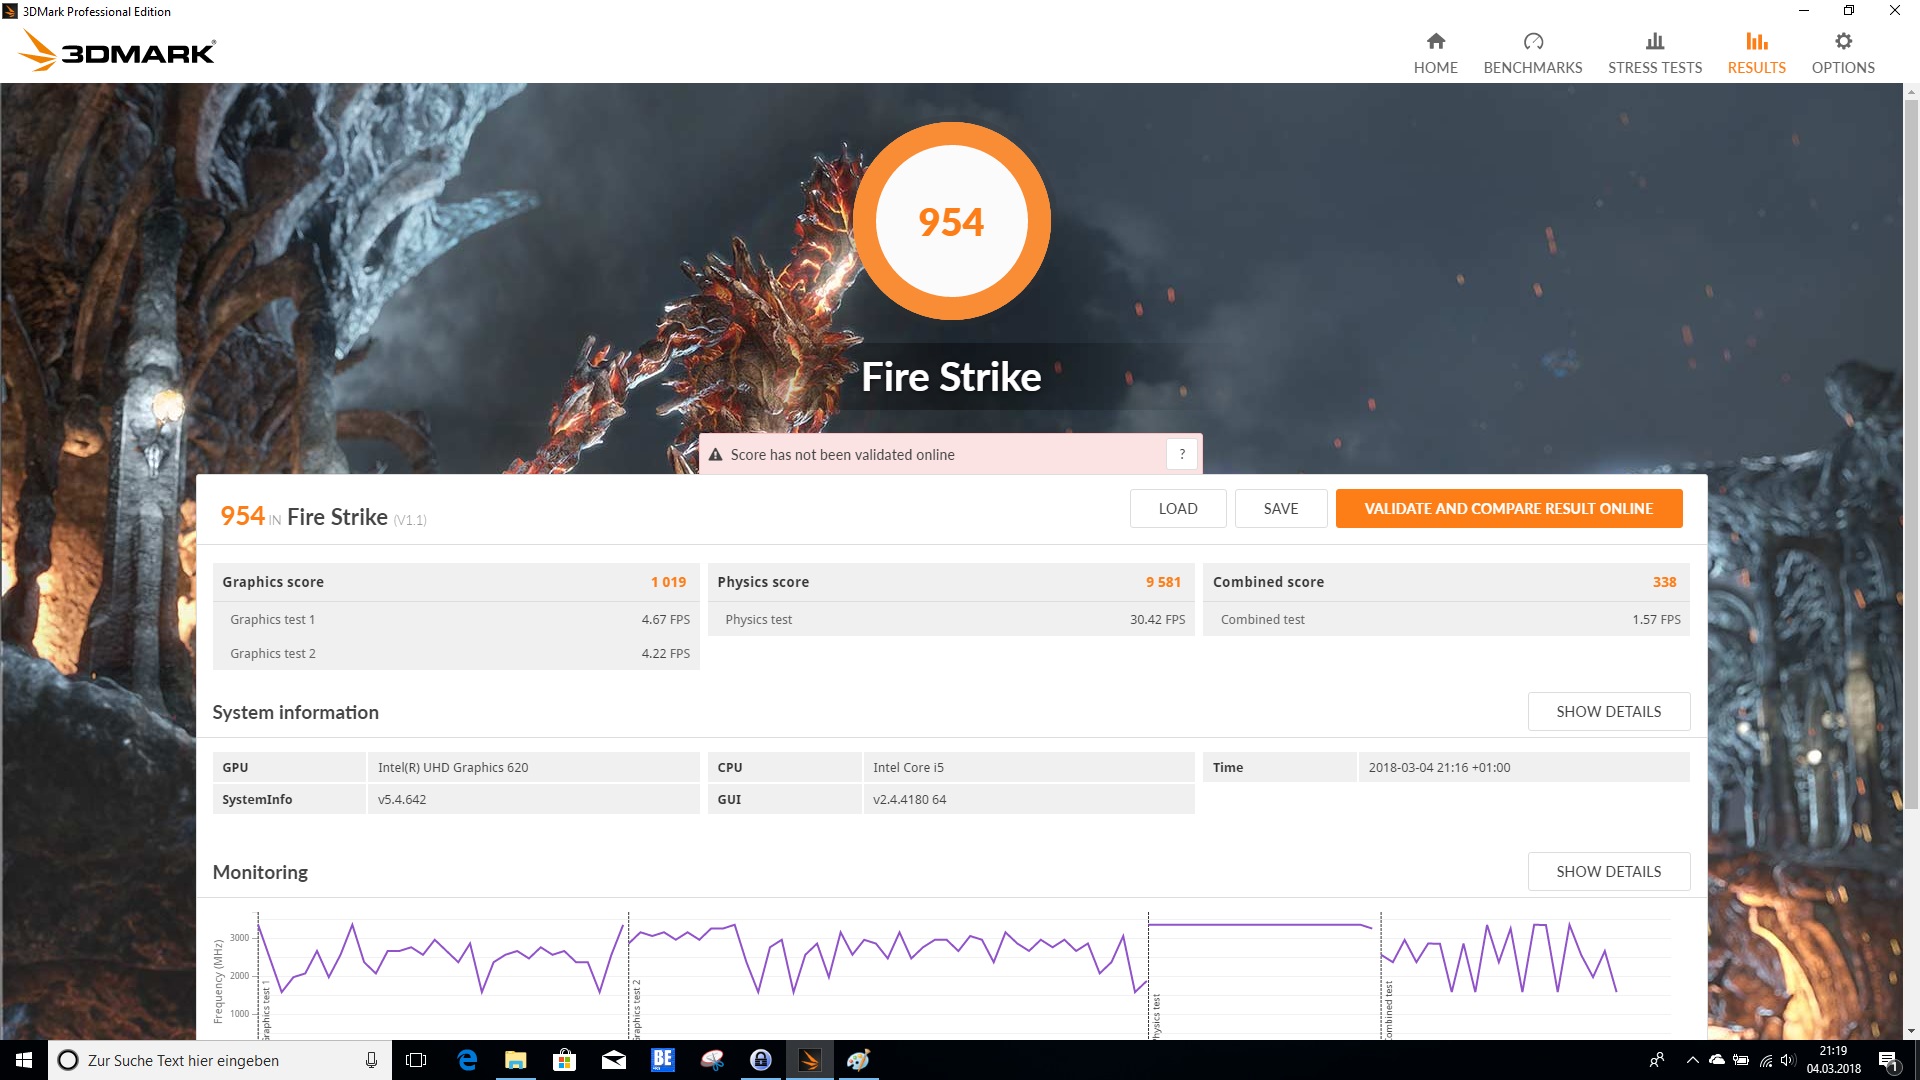
| 3DMark Fire Strike Score | 954 punten | |
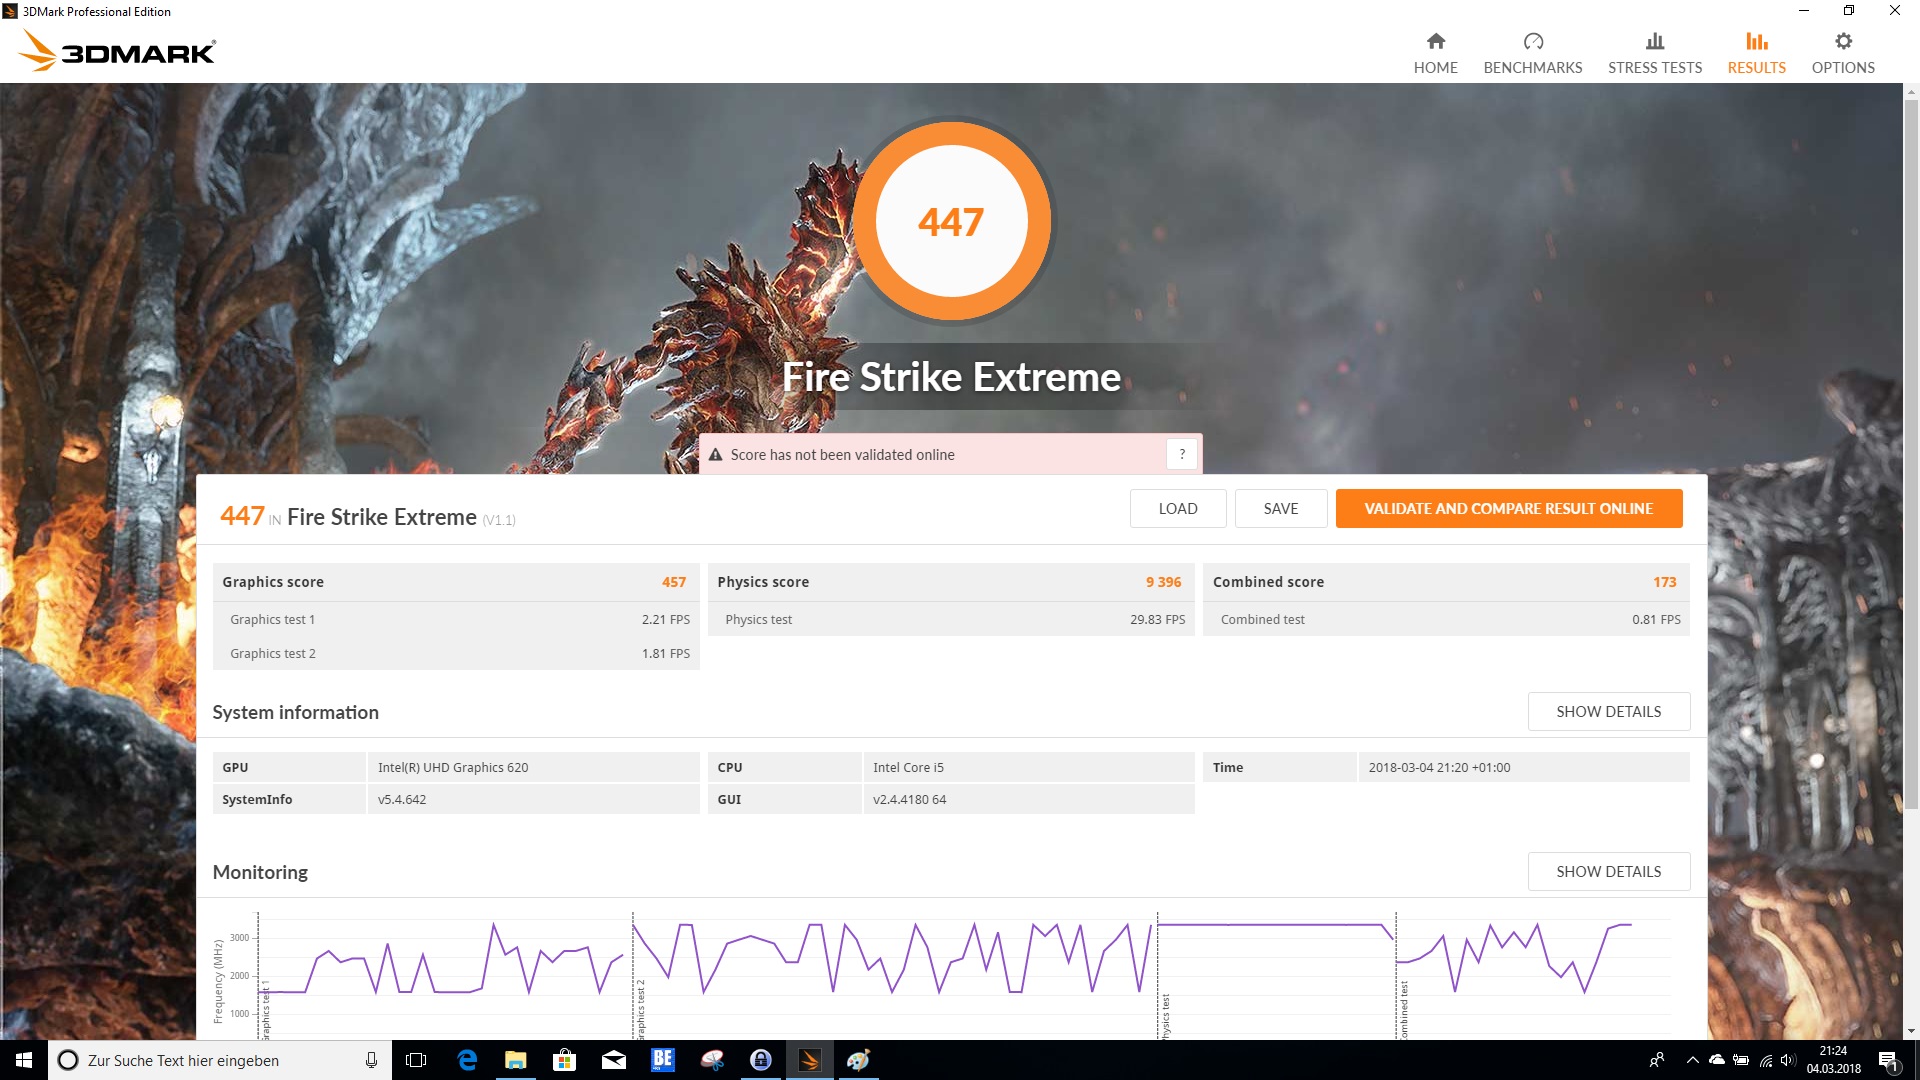
| 3DMark Fire Strike Extreme Score | 447 punten | |
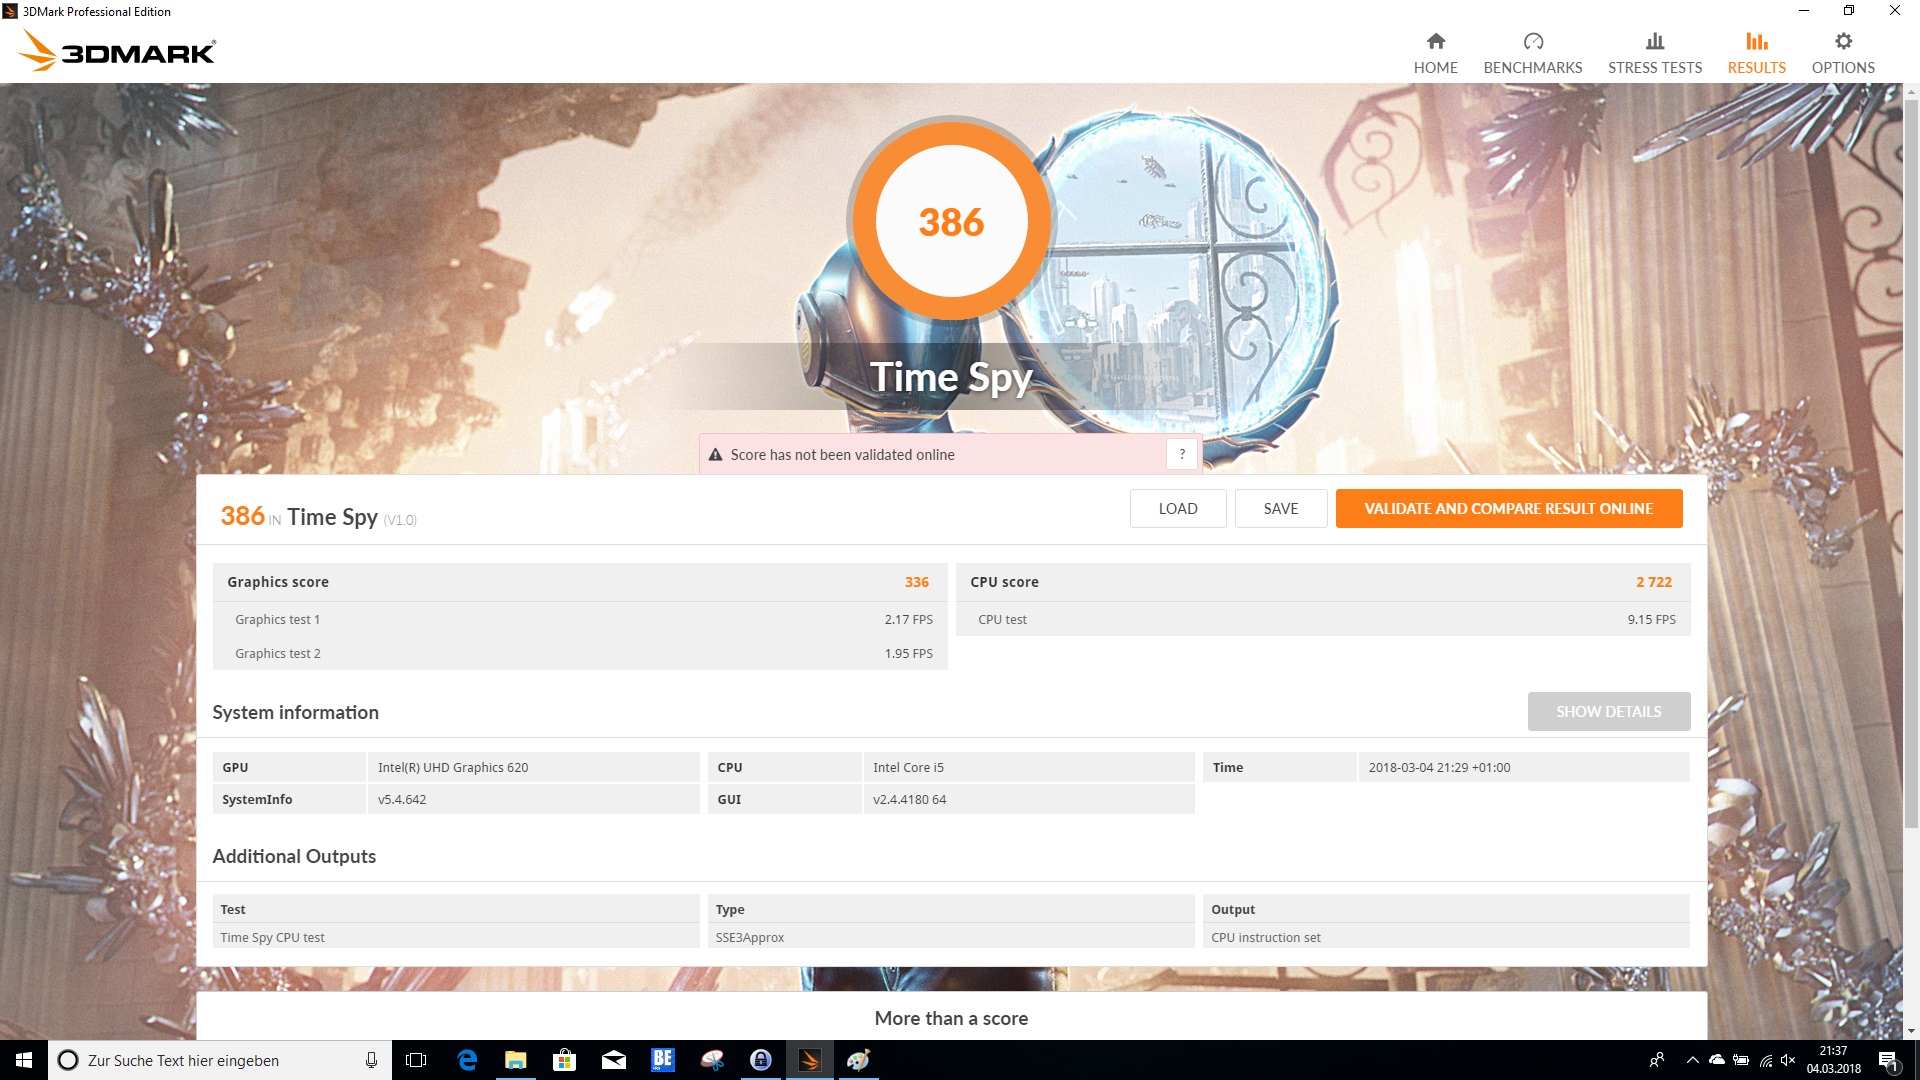
| 3DMark Time Spy Score | 386 punten | |
Help | ||
| lage | gem. | hoge | ultra | |
|---|---|---|---|---|
| BioShock Infinite (2013) | 47.4 | 27.8 | 23 | 7.7 |
| The Witcher 3 (2015) | 15.2 | 9.8 | 5.5 | |
| Rise of the Tomb Raider (2016) | 18.6 | 11.4 | 6.5 |
Geluidsniveau
| Onbelast |
| 30.4 / 30.4 / 30.4 dB (A) |
| Belasting |
| 32.3 / 37 dB (A) |
 | ||
30 dB stil 40 dB(A) hoorbaar 50 dB(A) luid |
||
min: | ||
| Lenovo ThinkPad L480-20LS001AGE UHD Graphics 620, i5-8250U, Toshiba KXG5AZNV256G | Lenovo ThinkPad L470-20J5S00C00 HD Graphics 620, i5-7200U, SanDisk X400 256GB, SATA (SD8SB8U-256G) | Lenovo ThinkPad E480-20KNCTO1WW UHD Graphics 620, i5-8250U, Toshiba KBG30ZMT128G | Lenovo ThinkPad E480-20KQS00000 Radeon RX 550 (Laptop), i5-8250U, Lenovo LENSE20256GMSP34MEAT2TA | HP ProBook 440 G5-3KX87ES UHD Graphics 620, i5-8250U, Intel SSD 600p SSDPEKKW256G7 | Dell Latitude 5490-TD70X UHD Graphics 620, i5-8350U, Toshiba KSG60ZMV512G | |
|---|---|---|---|---|---|---|
| Noise | 2% | 4% | -7% | 1% | -2% | |
| uit / omgeving * (dB) | 30.4 | 29.3 4% | 29.1 4% | 29.8 2% | 29.1 4% | 28.8 5% |
| Idle Minimum * (dB) | 30.4 | 29.3 4% | 29.1 4% | 29.8 2% | 29.1 4% | 28.8 5% |
| Idle Average * (dB) | 30.4 | 29.3 4% | 29.1 4% | 31.5 -4% | 29.1 4% | 28.8 5% |
| Idle Maximum * (dB) | 30.4 | 29.3 4% | 30.3 -0% | 33.3 -10% | 30.7 -1% | 30.9 -2% |
| Load Average * (dB) | 32.3 | 33.8 -5% | 31.8 2% | 39.1 -21% | 34.5 -7% | 35.6 -10% |
| Load Maximum * (dB) | 37 | 37.5 -1% | 33.8 9% | 40.4 -9% | 36 3% | 41.4 -12% |
| Witcher 3 ultra * (dB) | 39.1 |
* ... kleiner is beter
(±) De maximumtemperatuur aan de bovenzijde bedraagt 43 °C / 109 F, vergeleken met het gemiddelde van 34.3 °C / 94 F, variërend van 21.2 tot 62.5 °C voor de klasse Office.
(±) De bodem warmt op tot een maximum van 41.7 °C / 107 F, vergeleken met een gemiddelde van 36.8 °C / 98 F
(+) Bij onbelast gebruik bedraagt de gemiddelde temperatuur voor de bovenzijde 24 °C / 75 F, vergeleken met het apparaatgemiddelde van 29.5 °C / 85 F.
(+) De palmsteunen en het touchpad zijn met een maximum van ###max## °C / 75.2 F koeler dan de huidtemperatuur en voelen daarom koel aan.
(+) De gemiddelde temperatuur van de handpalmsteun van soortgelijke toestellen bedroeg 27.5 °C / 81.5 F (+3.5 °C / 6.3 F).
| Lenovo ThinkPad L480-20LS001AGE UHD Graphics 620, i5-8250U, Toshiba KXG5AZNV256G | Lenovo ThinkPad L470-20J5S00C00 HD Graphics 620, i5-7200U, SanDisk X400 256GB, SATA (SD8SB8U-256G) | Lenovo ThinkPad E480-20KNCTO1WW UHD Graphics 620, i5-8250U, Toshiba KBG30ZMT128G | Lenovo ThinkPad E480-20KQS00000 Radeon RX 550 (Laptop), i5-8250U, Lenovo LENSE20256GMSP34MEAT2TA | HP ProBook 440 G5-3KX87ES UHD Graphics 620, i5-8250U, Intel SSD 600p SSDPEKKW256G7 | Dell Latitude 5490-TD70X UHD Graphics 620, i5-8350U, Toshiba KSG60ZMV512G | |
|---|---|---|---|---|---|---|
| Heat | 4% | 9% | -25% | 3% | 5% | |
| Maximum Upper Side * (°C) | 43 | 40.1 7% | 36.7 15% | 51.9 -21% | 39 9% | 38.3 11% |
| Maximum Bottom * (°C) | 41.7 | 51 -22% | 42.8 -3% | 71.6 -72% | 45.5 -9% | 44.7 -7% |
| Idle Upper Side * (°C) | 25.7 | 22 14% | 23.4 9% | 24.8 4% | 24.8 4% | 23.7 8% |
| Idle Bottom * (°C) | 27.1 | 22.4 17% | 22.8 16% | 30 -11% | 25 8% | 25.4 6% |
* ... kleiner is beter
Lenovo ThinkPad L480-20LS001AGE audioanalyse
(-) | niet erg luide luidsprekers (68.3 dB)
Bas 100 - 315 Hz
(-) | bijna geen lage tonen - gemiddeld 21.3% lager dan de mediaan
(±) | lineariteit van de lage tonen is gemiddeld (10.9% delta ten opzichte van de vorige frequentie)
Midden 400 - 2000 Hz
(+) | evenwichtige middens - slechts 4.2% verwijderd van de mediaan
(±) | lineariteit van de middentonen is gemiddeld (14% delta ten opzichte van de vorige frequentie)
Hoog 2 - 16 kHz
(+) | evenwichtige hoogtepunten - slechts 2.6% verwijderd van de mediaan
(±) | lineariteit van de hoogtepunten is gemiddeld (9.1% delta ten opzichte van de vorige frequentie)
Algemeen 100 - 16.000 Hz
(±) | lineariteit van het totale geluid is gemiddeld (24.3% verschil met de mediaan)
Vergeleken met dezelfde klasse
» 71% van alle geteste apparaten in deze klasse waren beter, 8% vergelijkbaar, 21% slechter
» De beste had een delta van 7%, het gemiddelde was 21%, de slechtste was 53%
Vergeleken met alle geteste toestellen
» 74% van alle geteste apparaten waren beter, 6% gelijk, 21% slechter
» De beste had een delta van 4%, het gemiddelde was 24%, de slechtste was 134%
Lenovo ThinkPad E480-20KQS00000 audioanalyse
(±) | luidspreker luidheid is gemiddeld maar goed (76.6 dB)
Bas 100 - 315 Hz
(±) | verminderde zeebaars - gemiddeld 13.2% lager dan de mediaan
(±) | lineariteit van de lage tonen is gemiddeld (12.4% delta ten opzichte van de vorige frequentie)
Midden 400 - 2000 Hz
(±) | hogere middens - gemiddeld 5.2% hoger dan de mediaan
(±) | lineariteit van de middentonen is gemiddeld (9.6% delta ten opzichte van de vorige frequentie)
Hoog 2 - 16 kHz
(+) | evenwichtige hoogtepunten - slechts 3.8% verwijderd van de mediaan
(±) | lineariteit van de hoogtepunten is gemiddeld (10.2% delta ten opzichte van de vorige frequentie)
Algemeen 100 - 16.000 Hz
(±) | lineariteit van het totale geluid is gemiddeld (19.9% verschil met de mediaan)
Vergeleken met dezelfde klasse
» 42% van alle geteste apparaten in deze klasse waren beter, 9% vergelijkbaar, 49% slechter
» De beste had een delta van 7%, het gemiddelde was 21%, de slechtste was 53%
Vergeleken met alle geteste toestellen
» 51% van alle geteste apparaten waren beter, 7% gelijk, 42% slechter
» De beste had een delta van 4%, het gemiddelde was 24%, de slechtste was 134%
| Uit / Standby | |
| Inactief | |
| Belasting |
|
Key:
min: | |
| Lenovo ThinkPad L480-20LS001AGE i5-8250U, UHD Graphics 620, Toshiba KXG5AZNV256G, IPS, 1920x1080, 14" | Lenovo ThinkPad L470-20J5S00C00 i5-7200U, HD Graphics 620, SanDisk X400 256GB, SATA (SD8SB8U-256G), IPS, 1920x1080, 14" | Lenovo ThinkPad E480-20KNCTO1WW i5-8250U, UHD Graphics 620, Toshiba KBG30ZMT128G, IPS LED, 1920x1080, 14" | Lenovo ThinkPad E480-20KQS00000 i5-8250U, Radeon RX 550 (Laptop), Lenovo LENSE20256GMSP34MEAT2TA, IPS LED, 1920x1080, 14" | HP ProBook 440 G5-3KX87ES i5-8250U, UHD Graphics 620, Intel SSD 600p SSDPEKKW256G7, IPS LED, 1920x1080, 14" | Dell Latitude 5490-TD70X i5-8350U, UHD Graphics 620, Toshiba KSG60ZMV512G, IPS, 1920x1080, 14" | |
|---|---|---|---|---|---|---|
| Power Consumption | 9% | 9% | -26% | -20% | -12% | |
| Idle Minimum * (Watt) | 3.3 | 2.6 21% | 3.5 -6% | 4.1 -24% | 4.4 -33% | 3.3 -0% |
| Idle Average * (Watt) | 6.6 | 6.3 5% | 5.3 20% | 6.3 5% | 7.1 -8% | 5.54 16% |
| Idle Maximum * (Watt) | 7.3 | 7 4% | 6.1 16% | 7.1 3% | 10.2 -40% | 6.59 10% |
| Load Average * (Watt) | 40.4 | 29.1 28% | 30 26% | 54.8 -36% | 36.5 10% | 42.4 -5% |
| Load Maximum * (Watt) | 37.4 | 42.3 -13% | 42.3 -13% | 66.4 -78% | 48.7 -30% | 67.6 -81% |
| Witcher 3 ultra * (Watt) | 43.8 |
* ... kleiner is beter
| Lenovo ThinkPad L480-20LS001AGE i5-8250U, UHD Graphics 620, 45 Wh | Lenovo ThinkPad L470-20J5S00C00 i5-7200U, HD Graphics 620, 48 Wh | Lenovo ThinkPad E480-20KNCTO1WW i5-8250U, UHD Graphics 620, 45 Wh | Lenovo ThinkPad E480-20KQS00000 i5-8250U, Radeon RX 550 (Laptop), 48 Wh | HP ProBook 440 G5-3KX87ES i5-8250U, UHD Graphics 620, 48 Wh | Dell Latitude 5490-TD70X i5-8350U, UHD Graphics 620, 68 Wh | |
|---|---|---|---|---|---|---|
| Batterijduur | 31% | 7% | 0% | 6% | 55% | |
| Reader / Idle (h) | 16.9 | 23.3 38% | 18.4 9% | 19.4 15% | 13.7 -19% | 25.9 53% |
| H.264 (h) | 8 | 10.8 35% | 7.2 -10% | 8.9 11% | 3.7 -54% | 13.2 65% |
| WiFi v1.3 (h) | 7.7 | 8 4% | 8.3 8% | 5.7 -26% | 6.9 -10% | 15 95% |
| Load (h) | 1.5 | 2.2 47% | 1.8 20% | 1.5 0% | 3.1 107% | 1.6 7% |
Pro
Contra

Dit is de verkorte versie van het originele artikel. Het volledige, Engelse testrapport vind je hier.
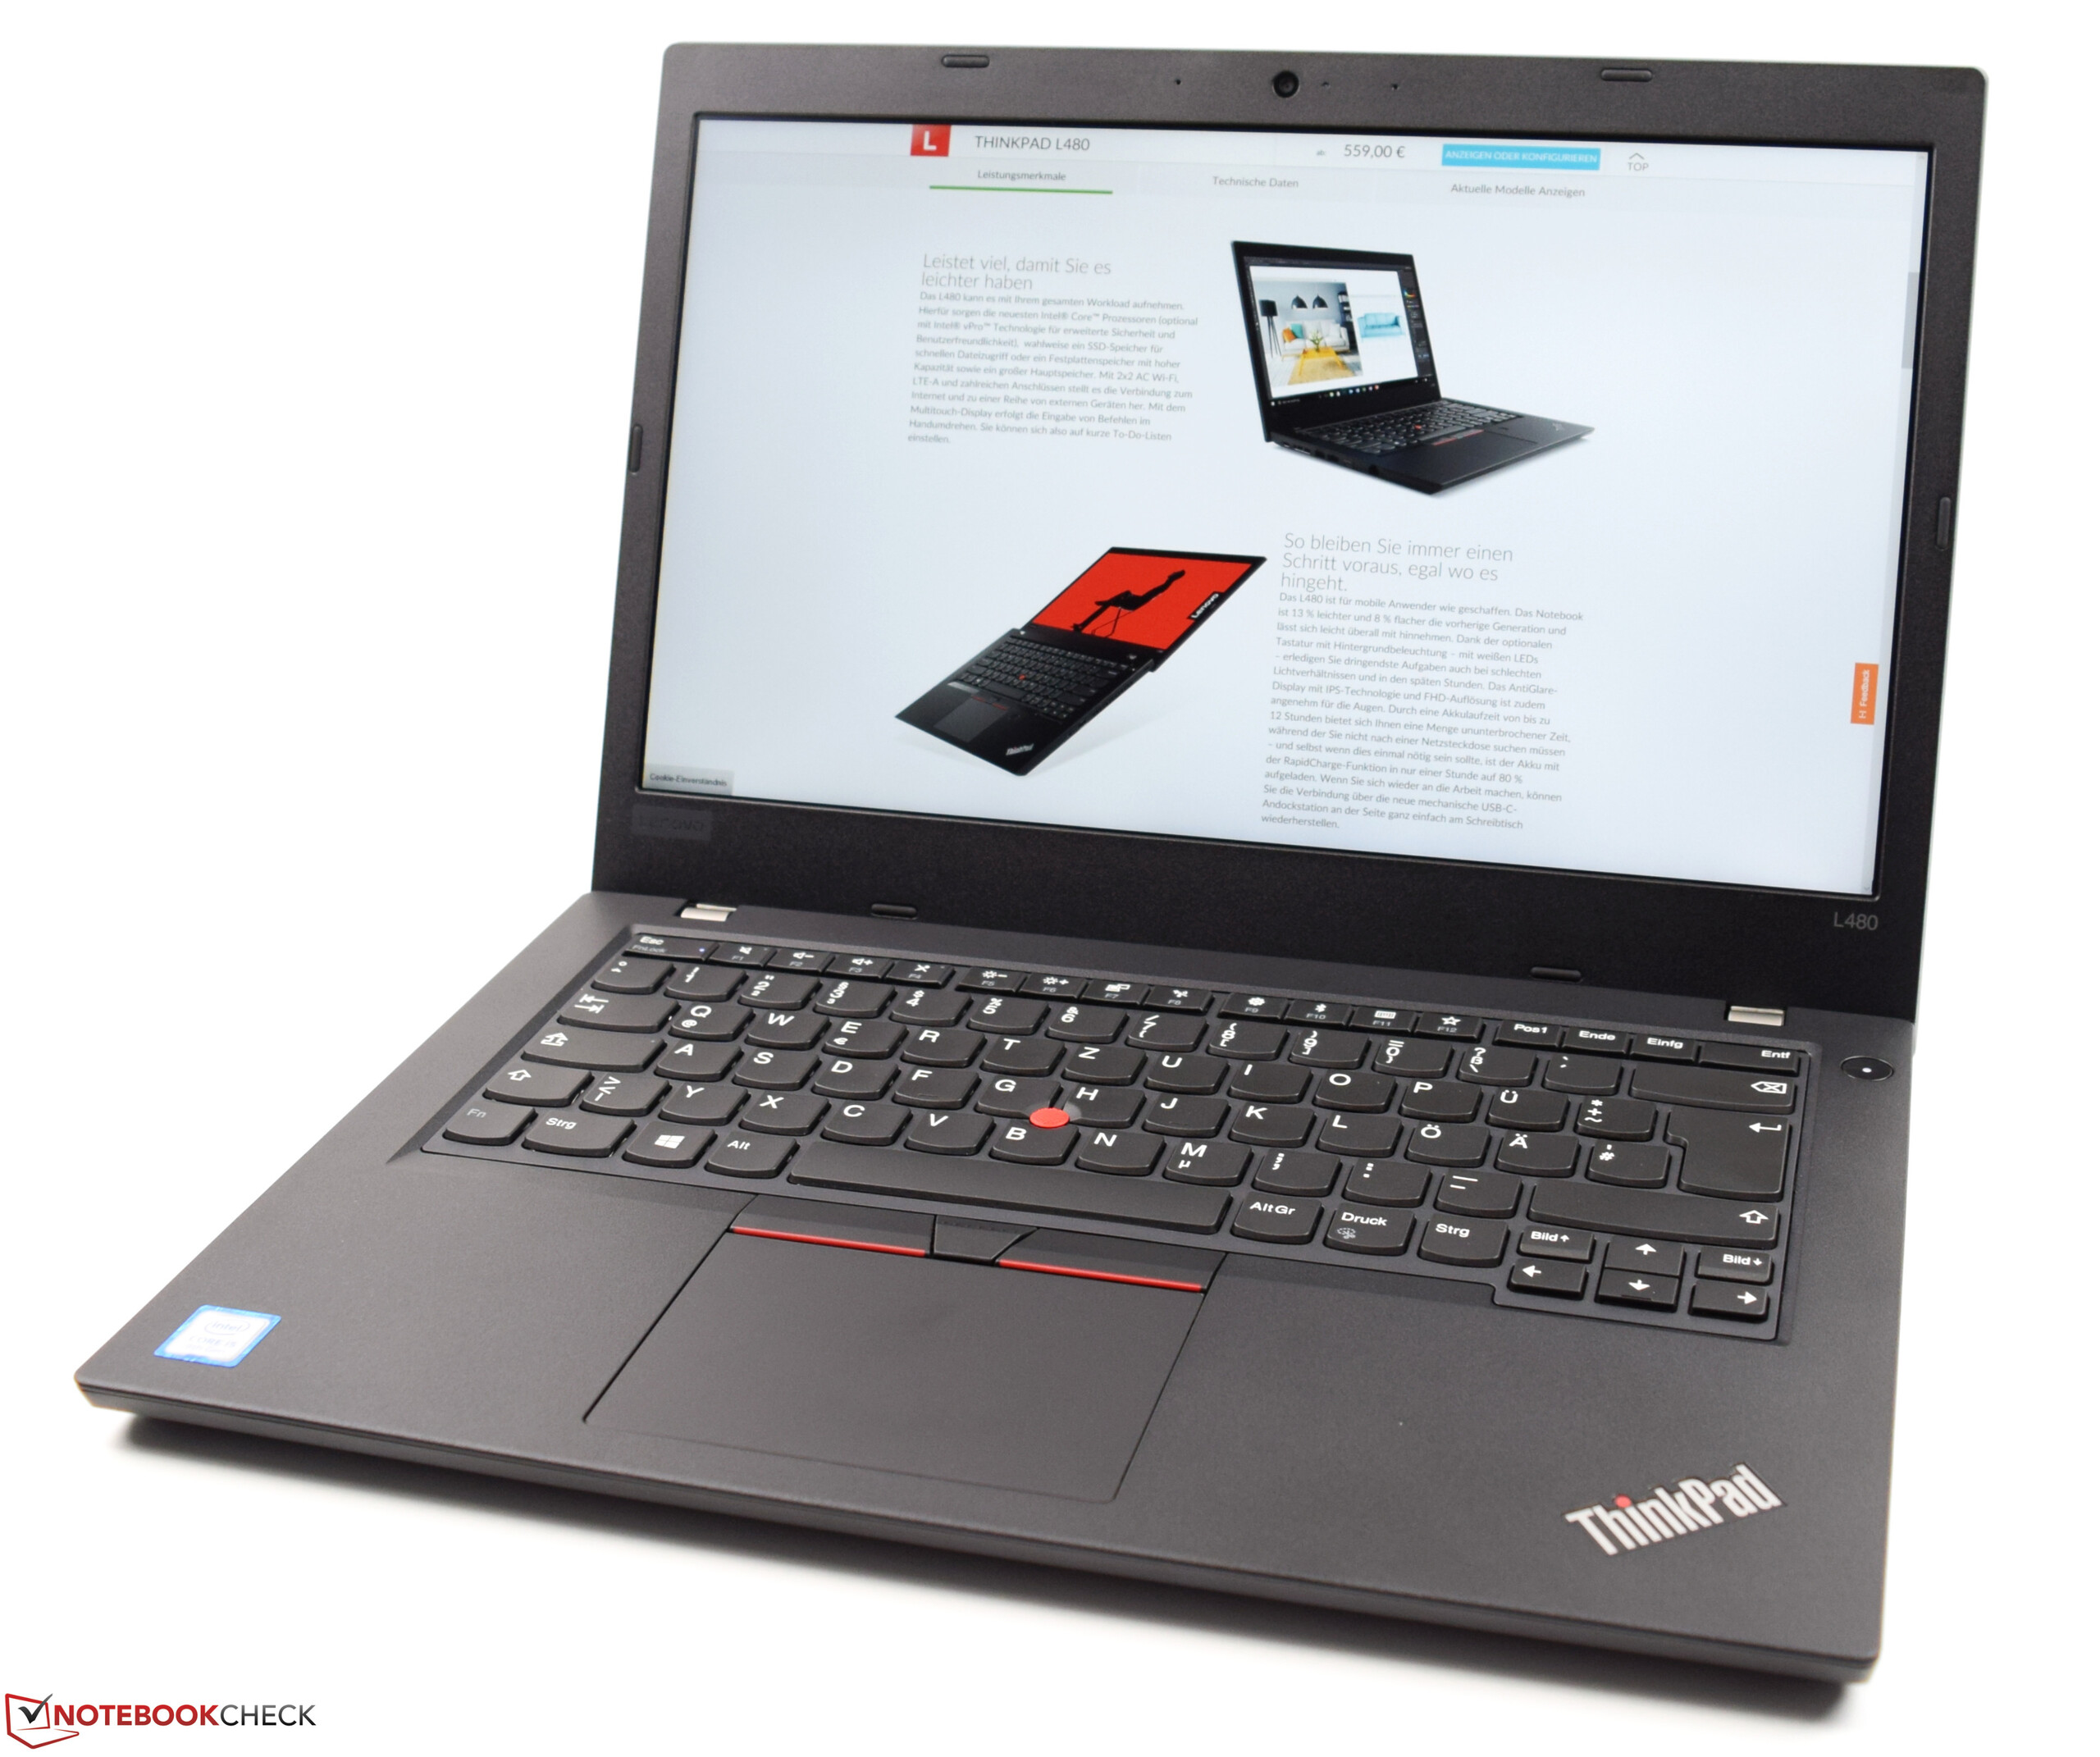
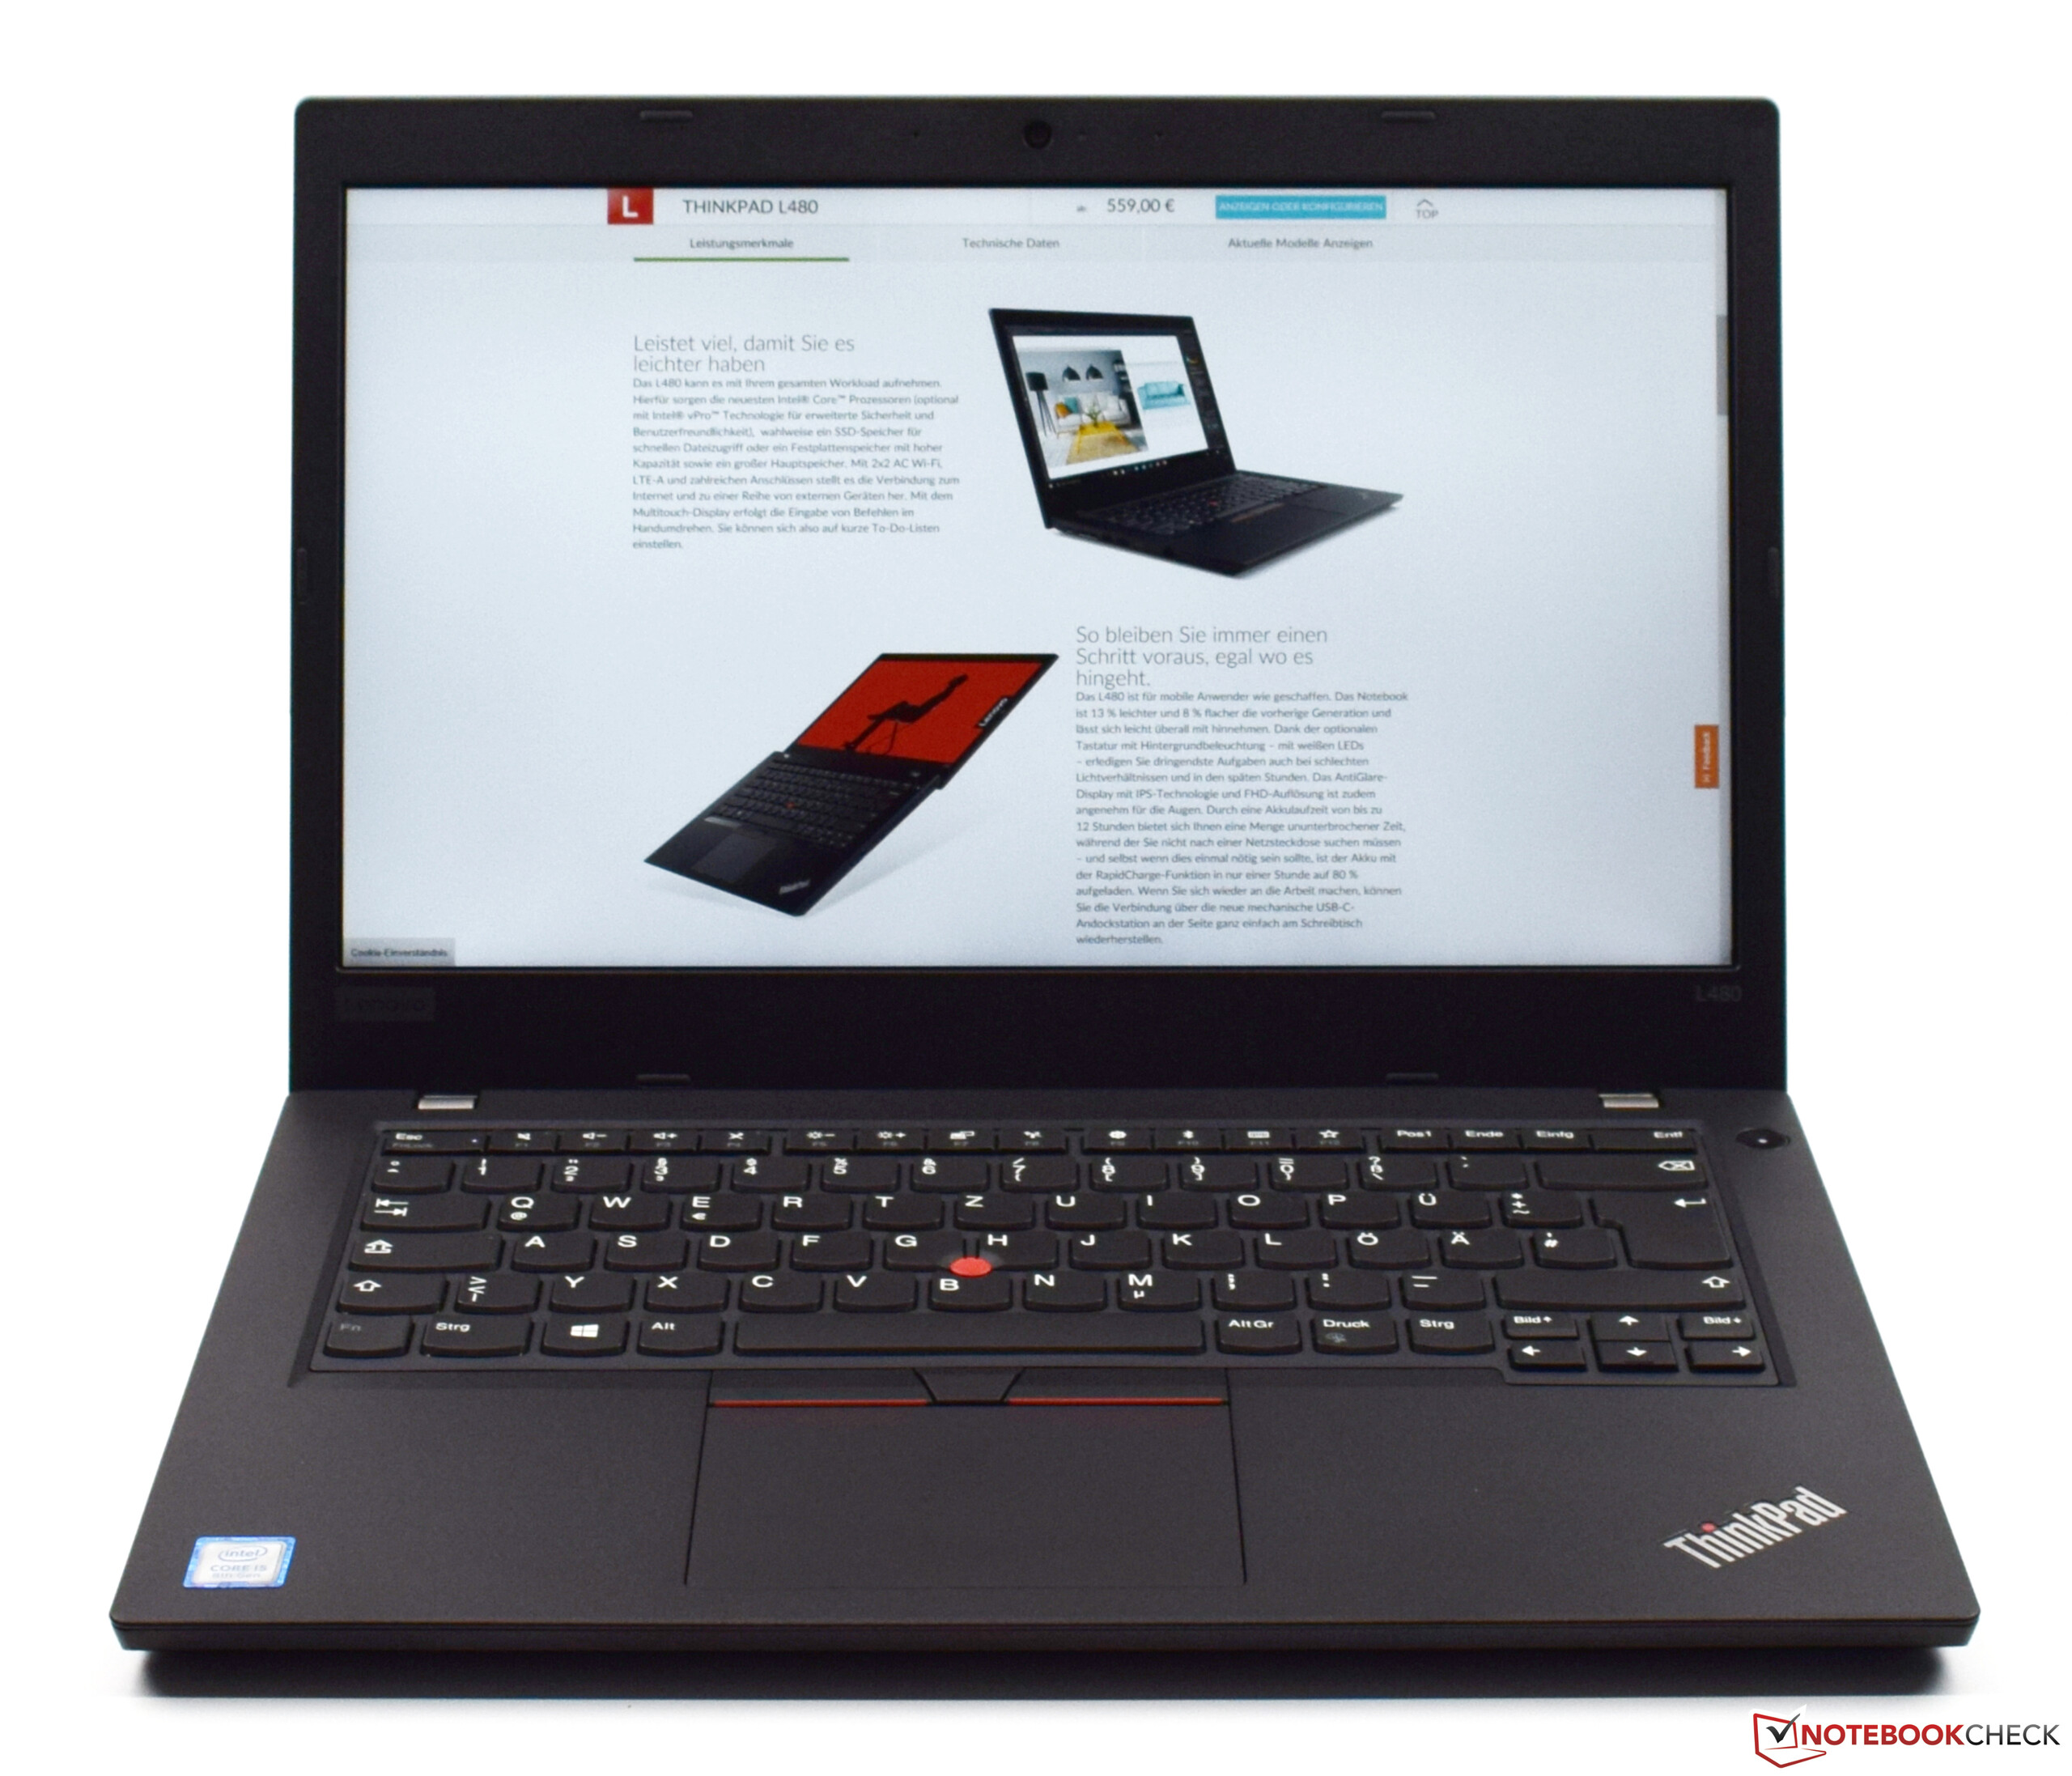
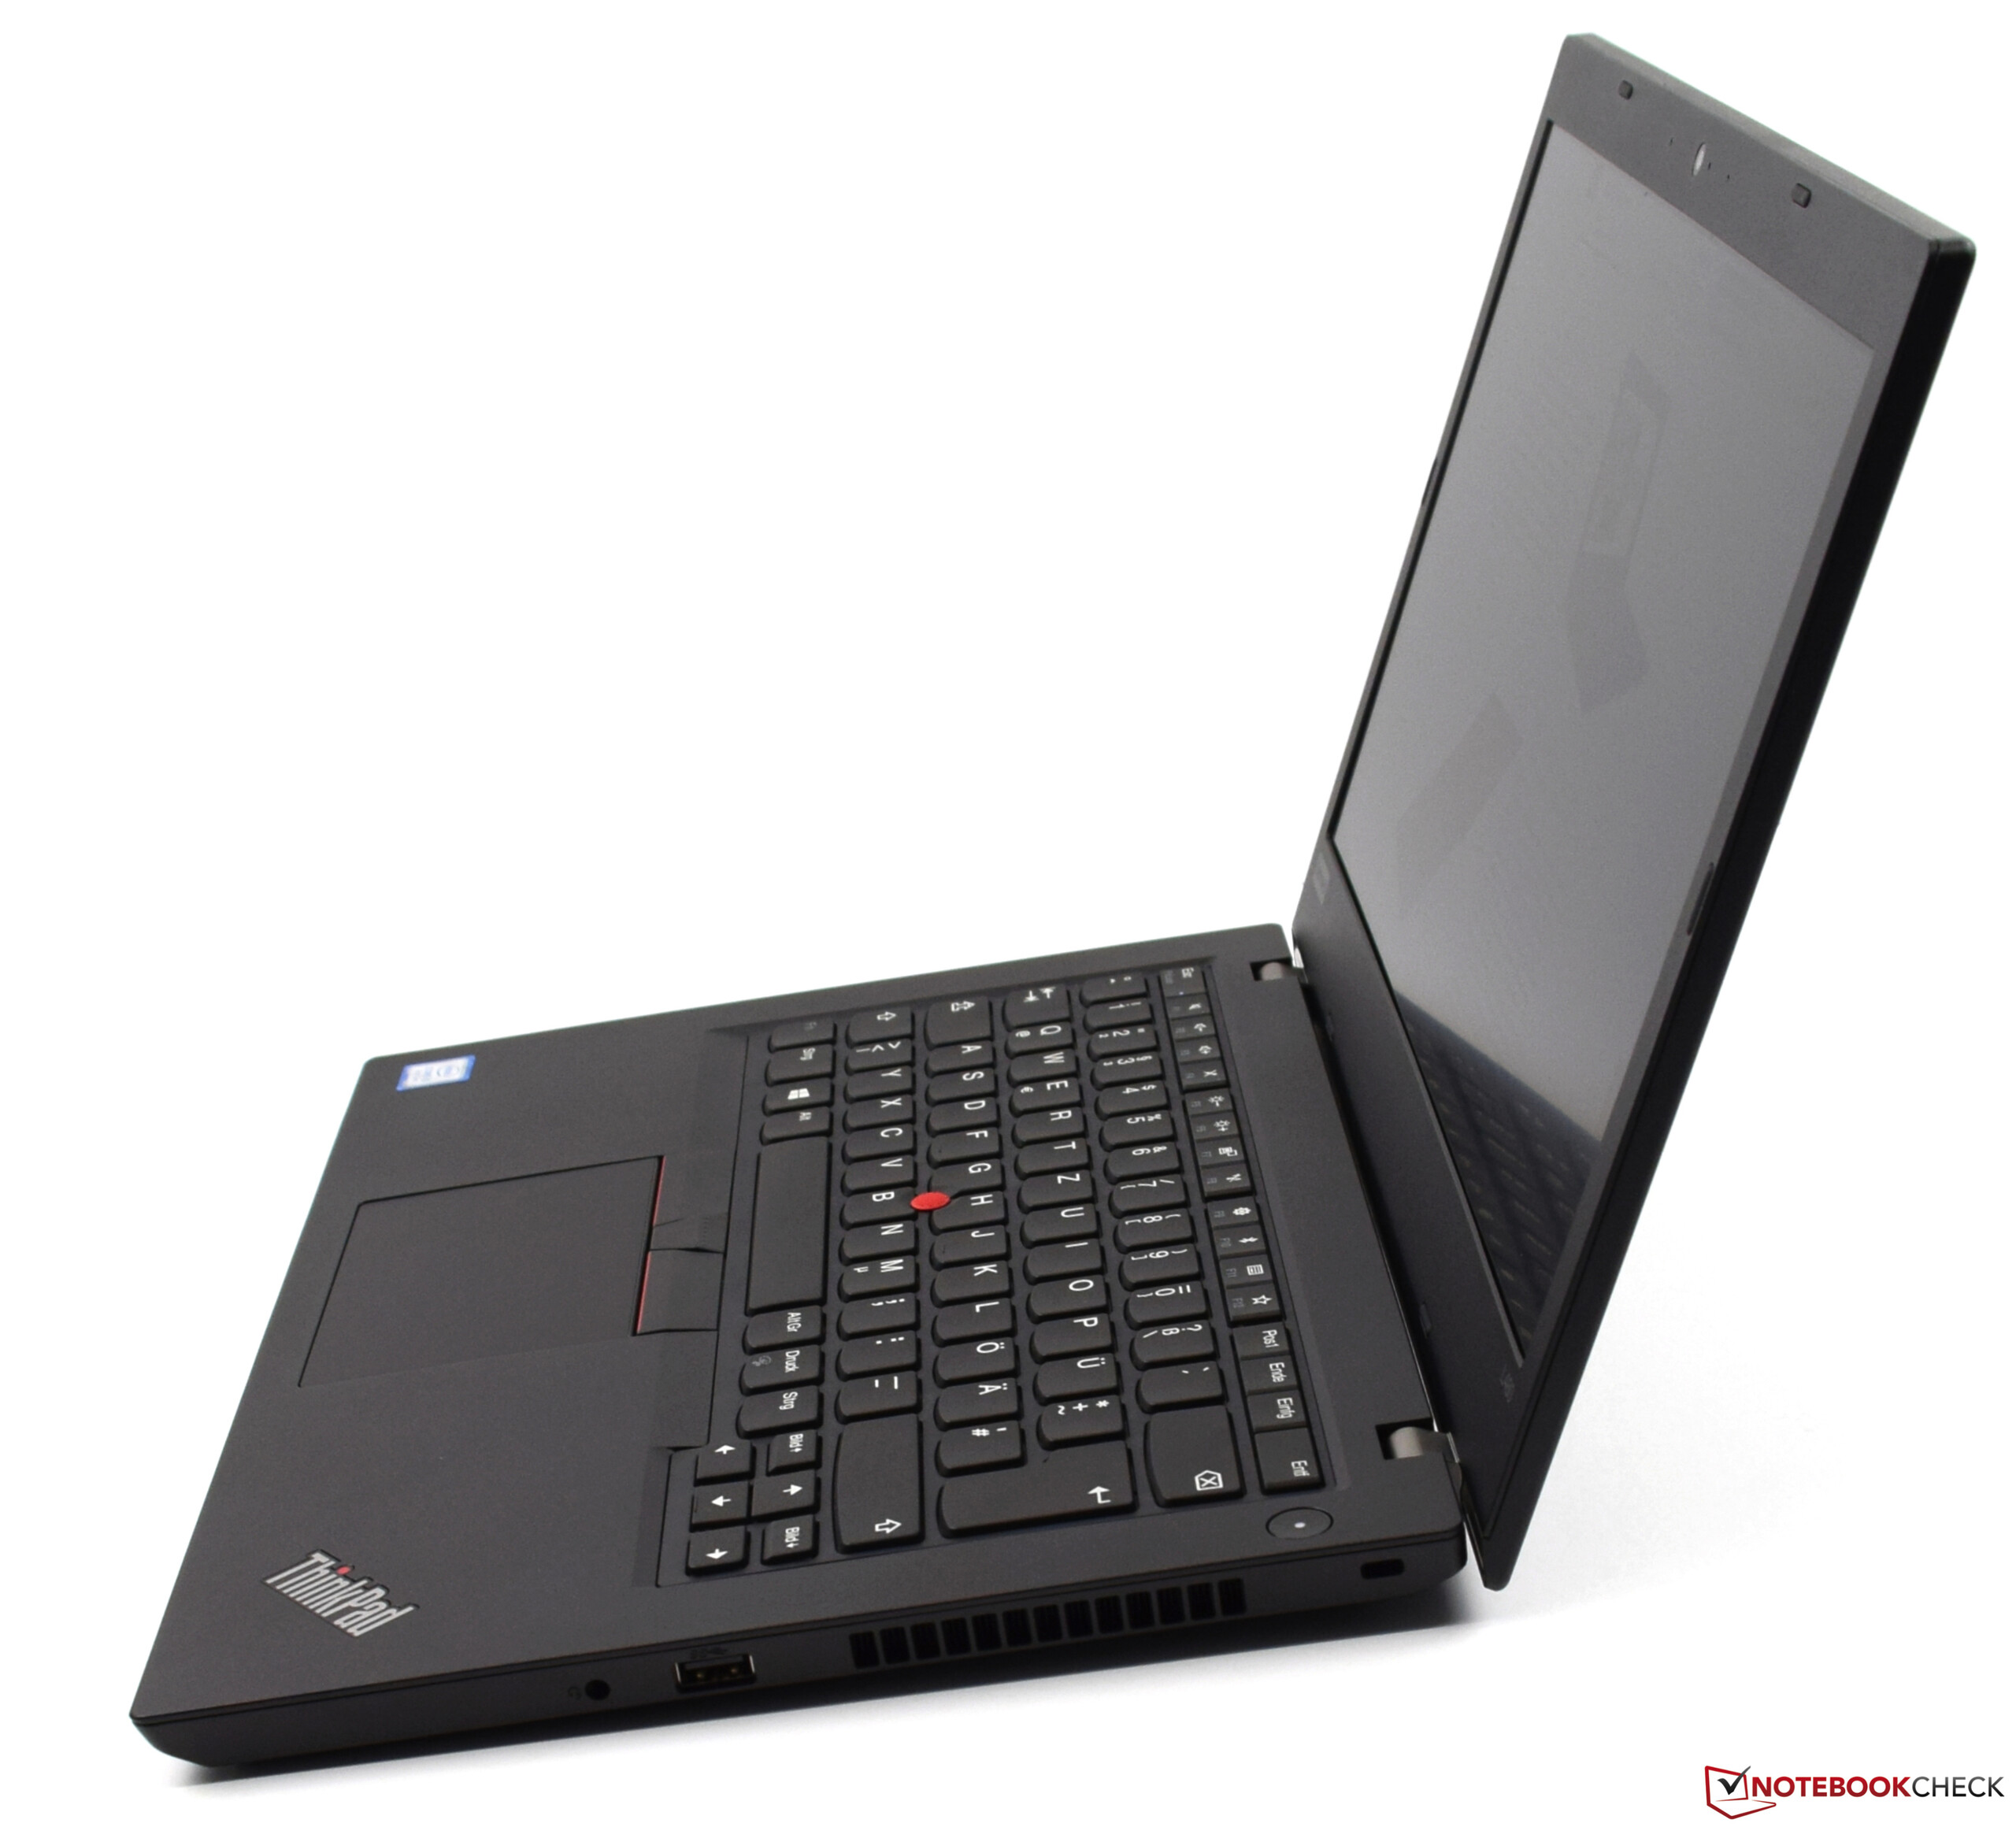
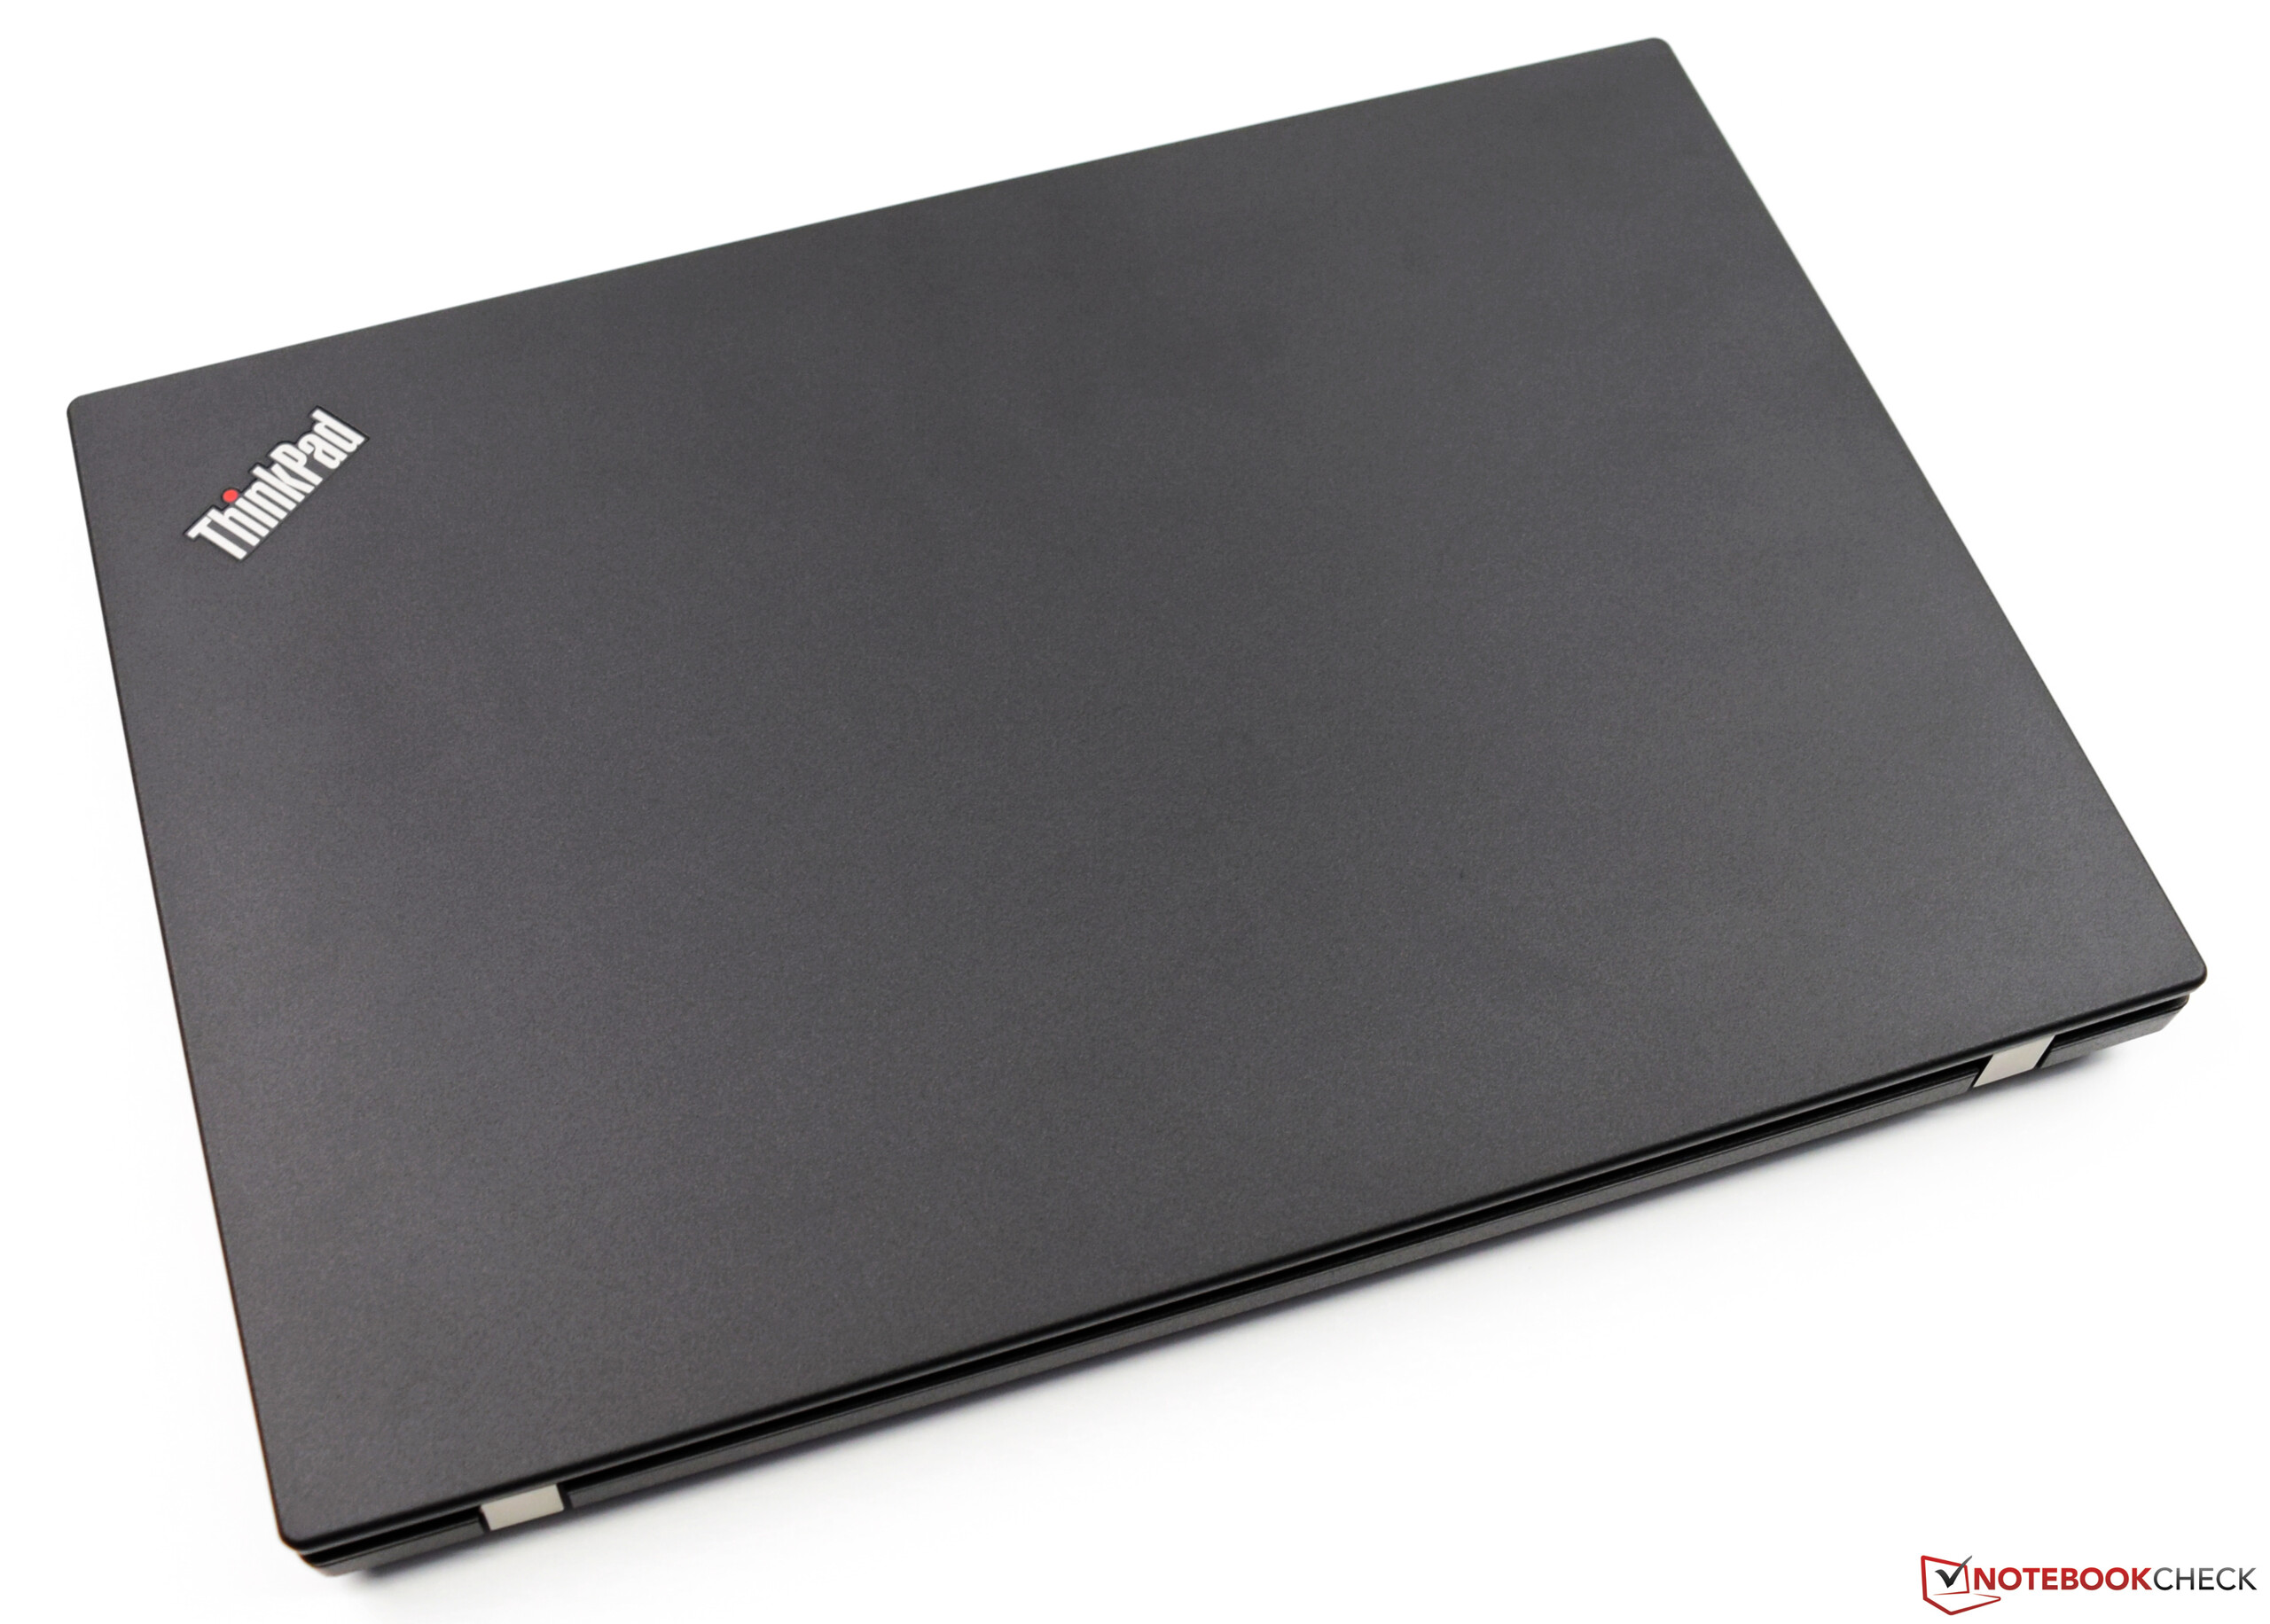
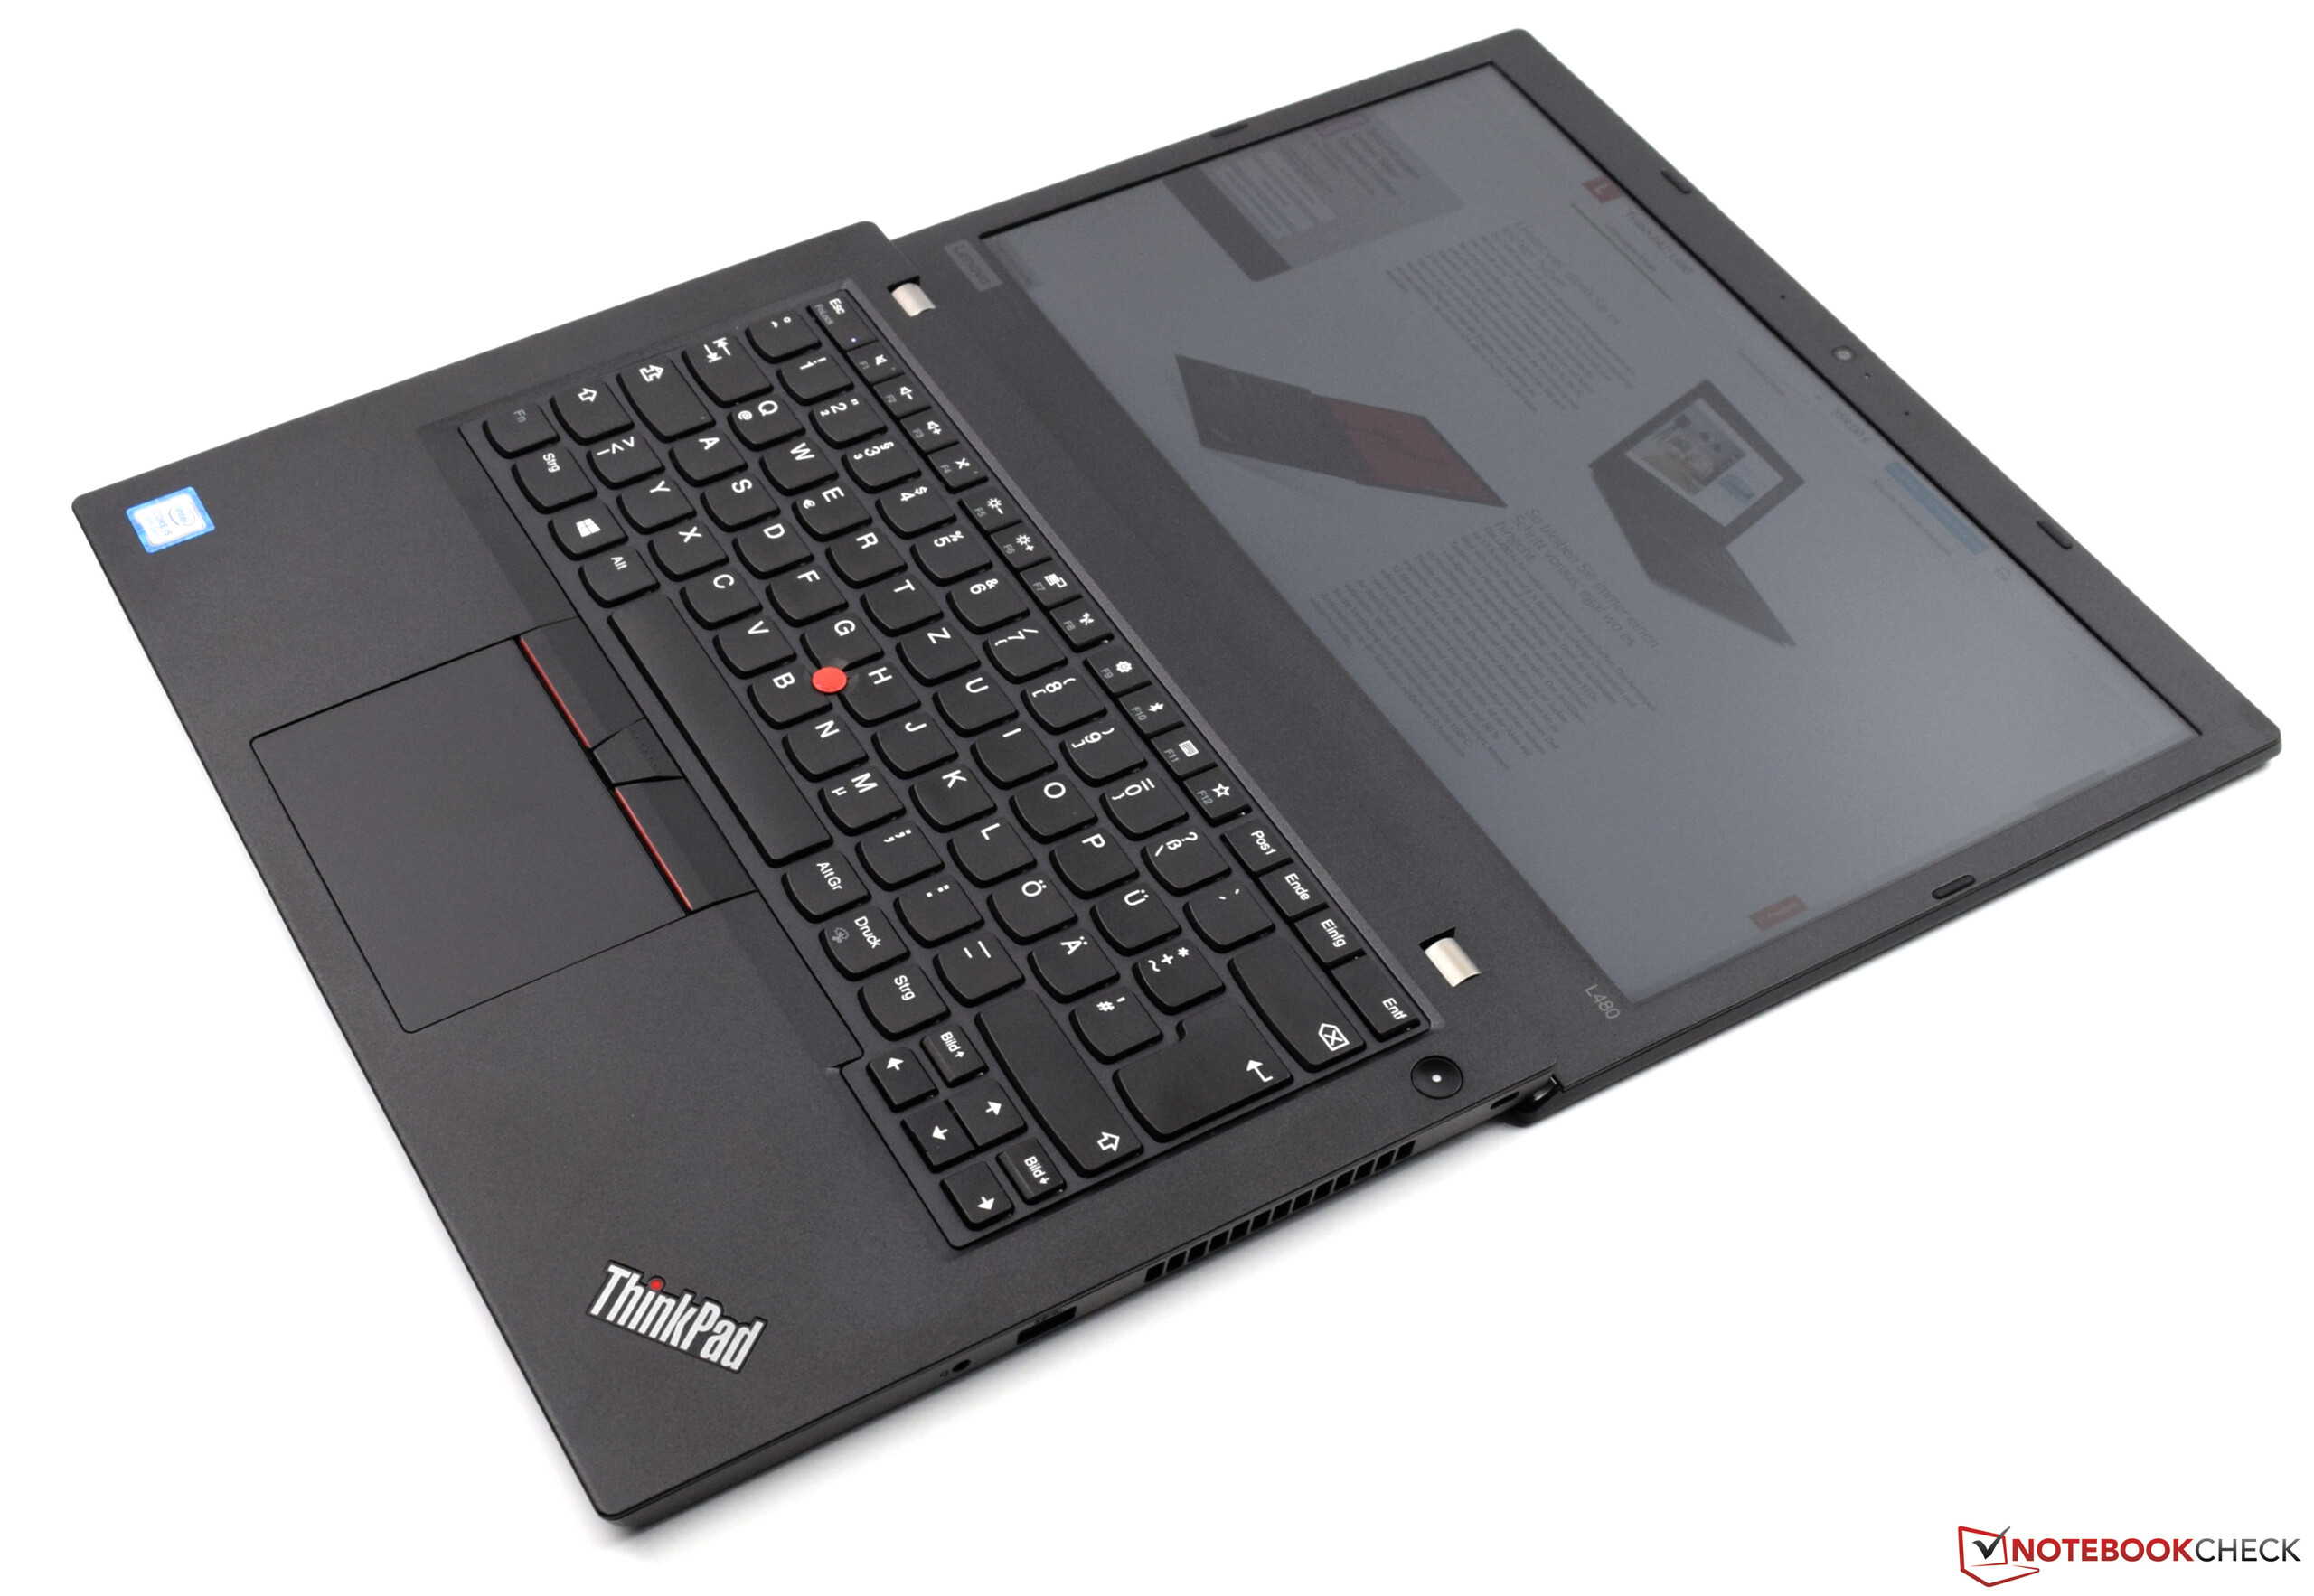
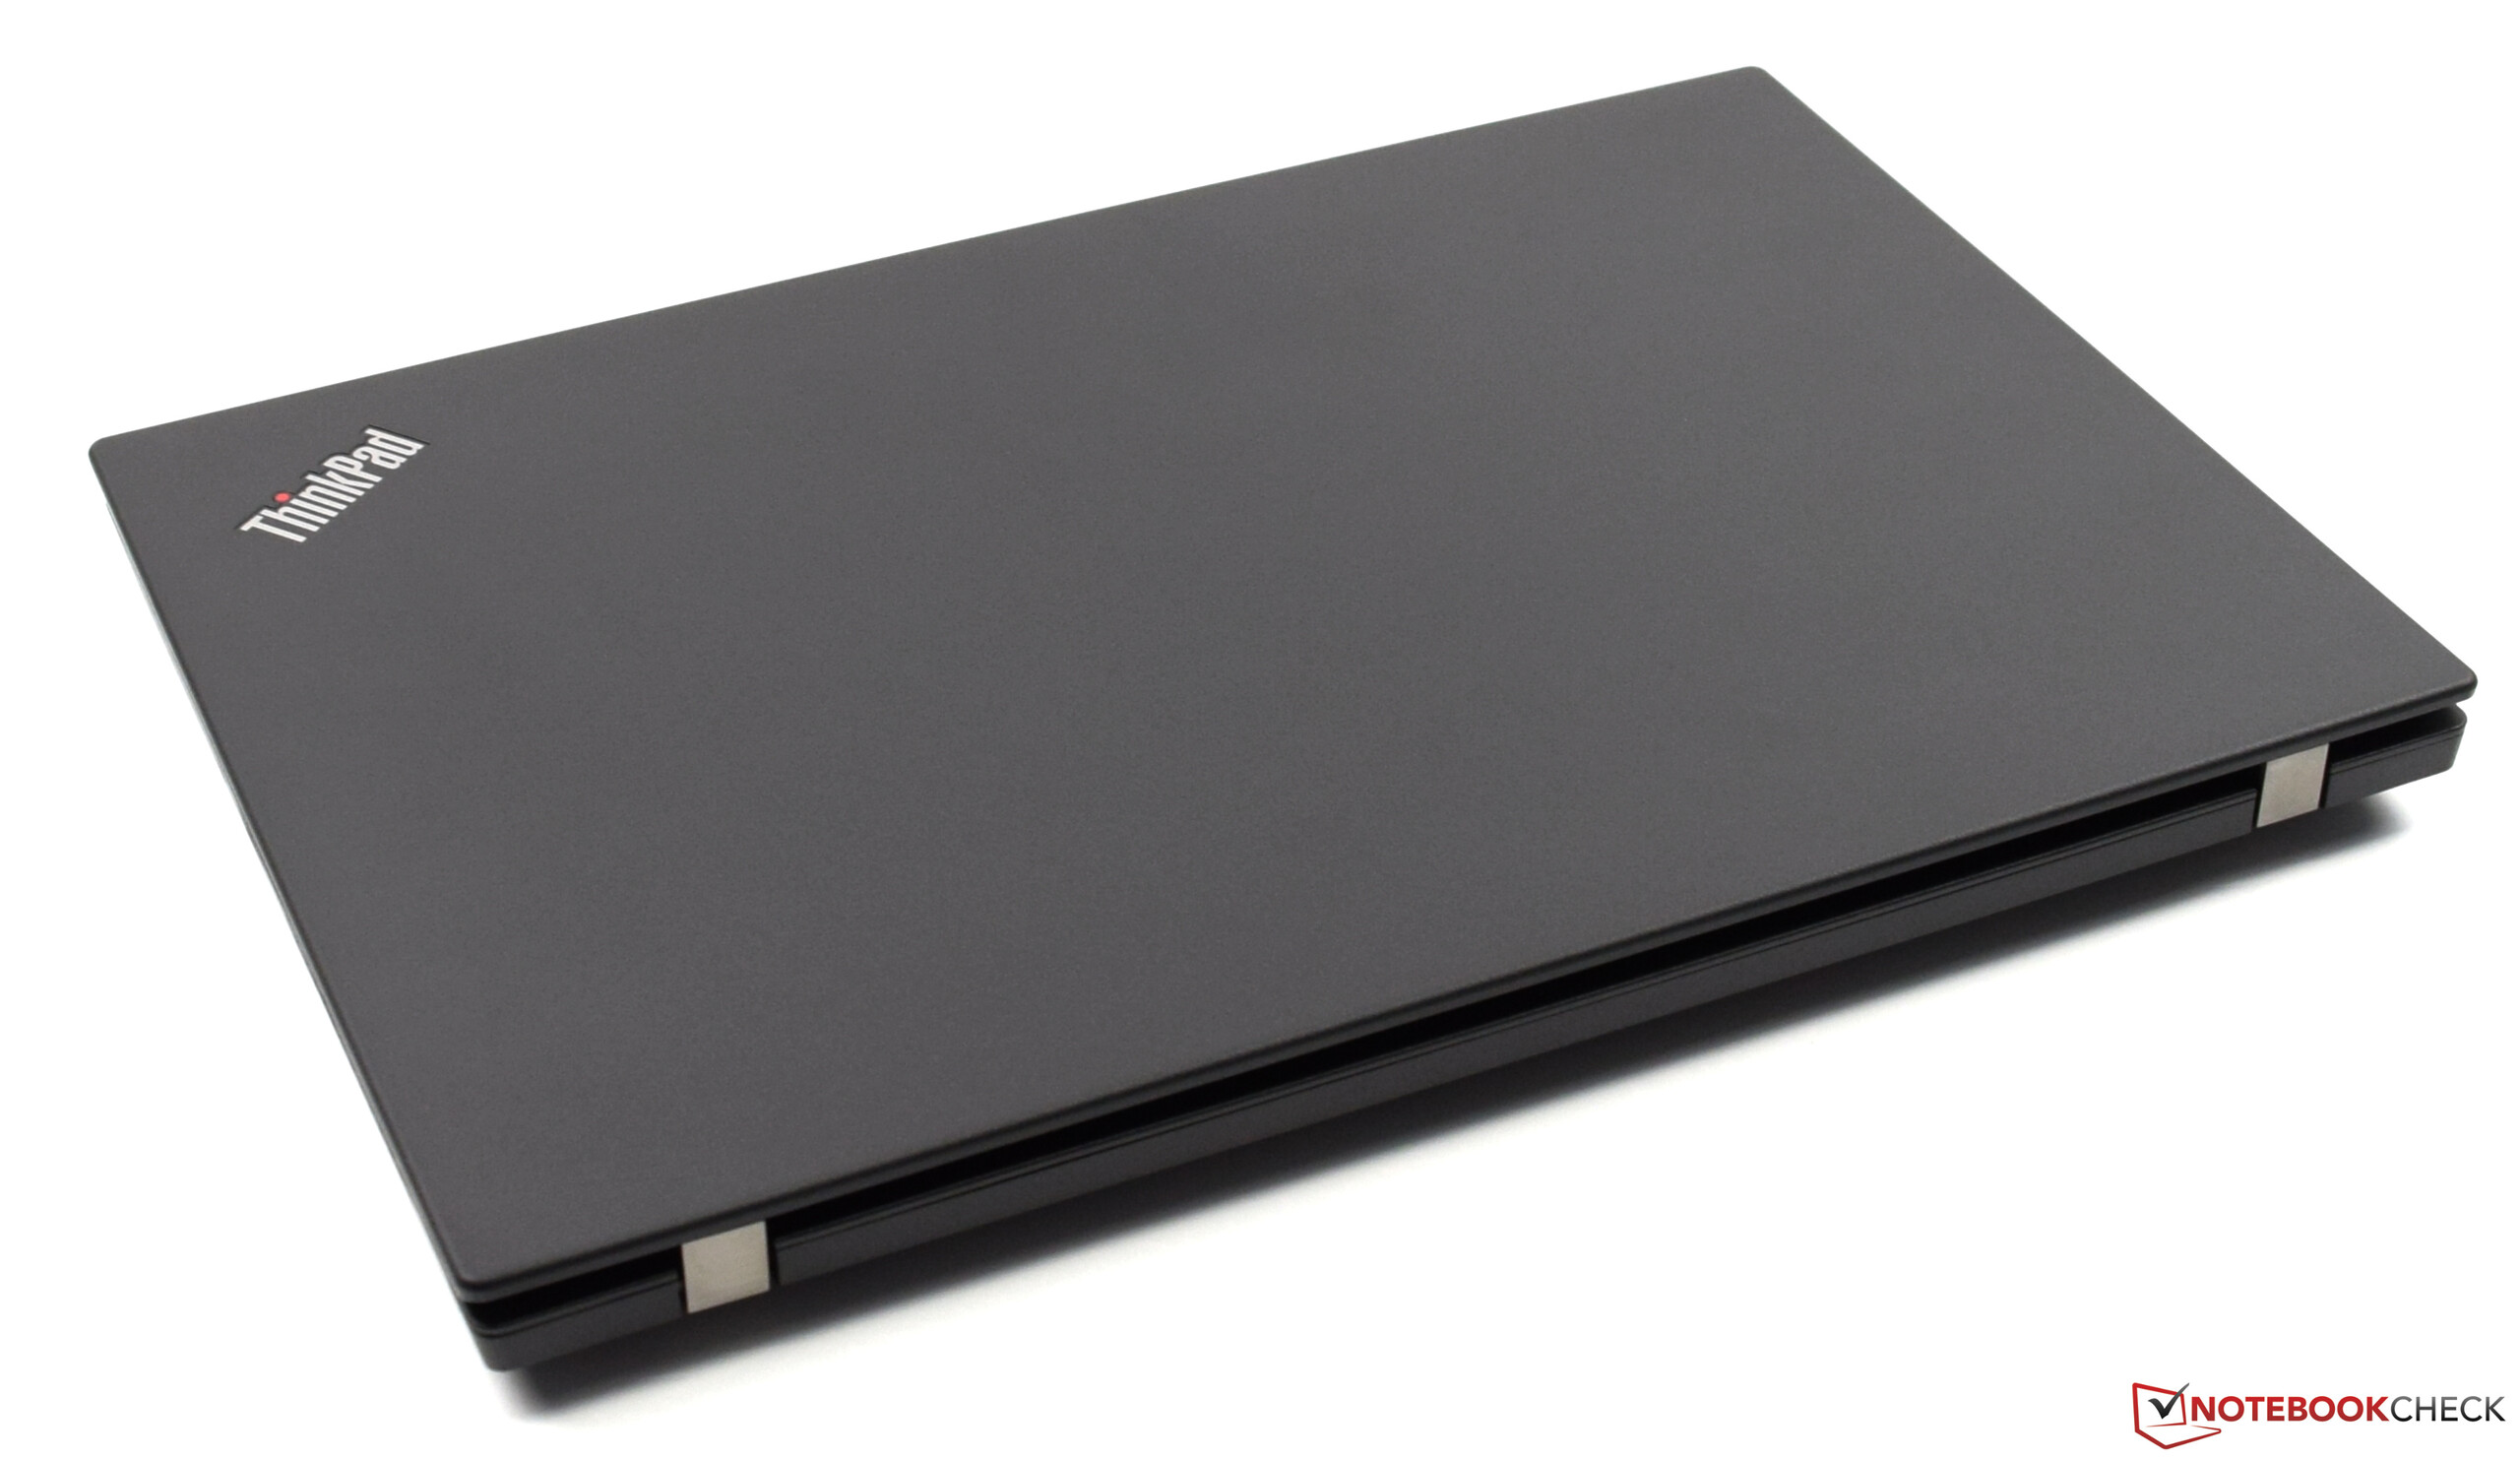
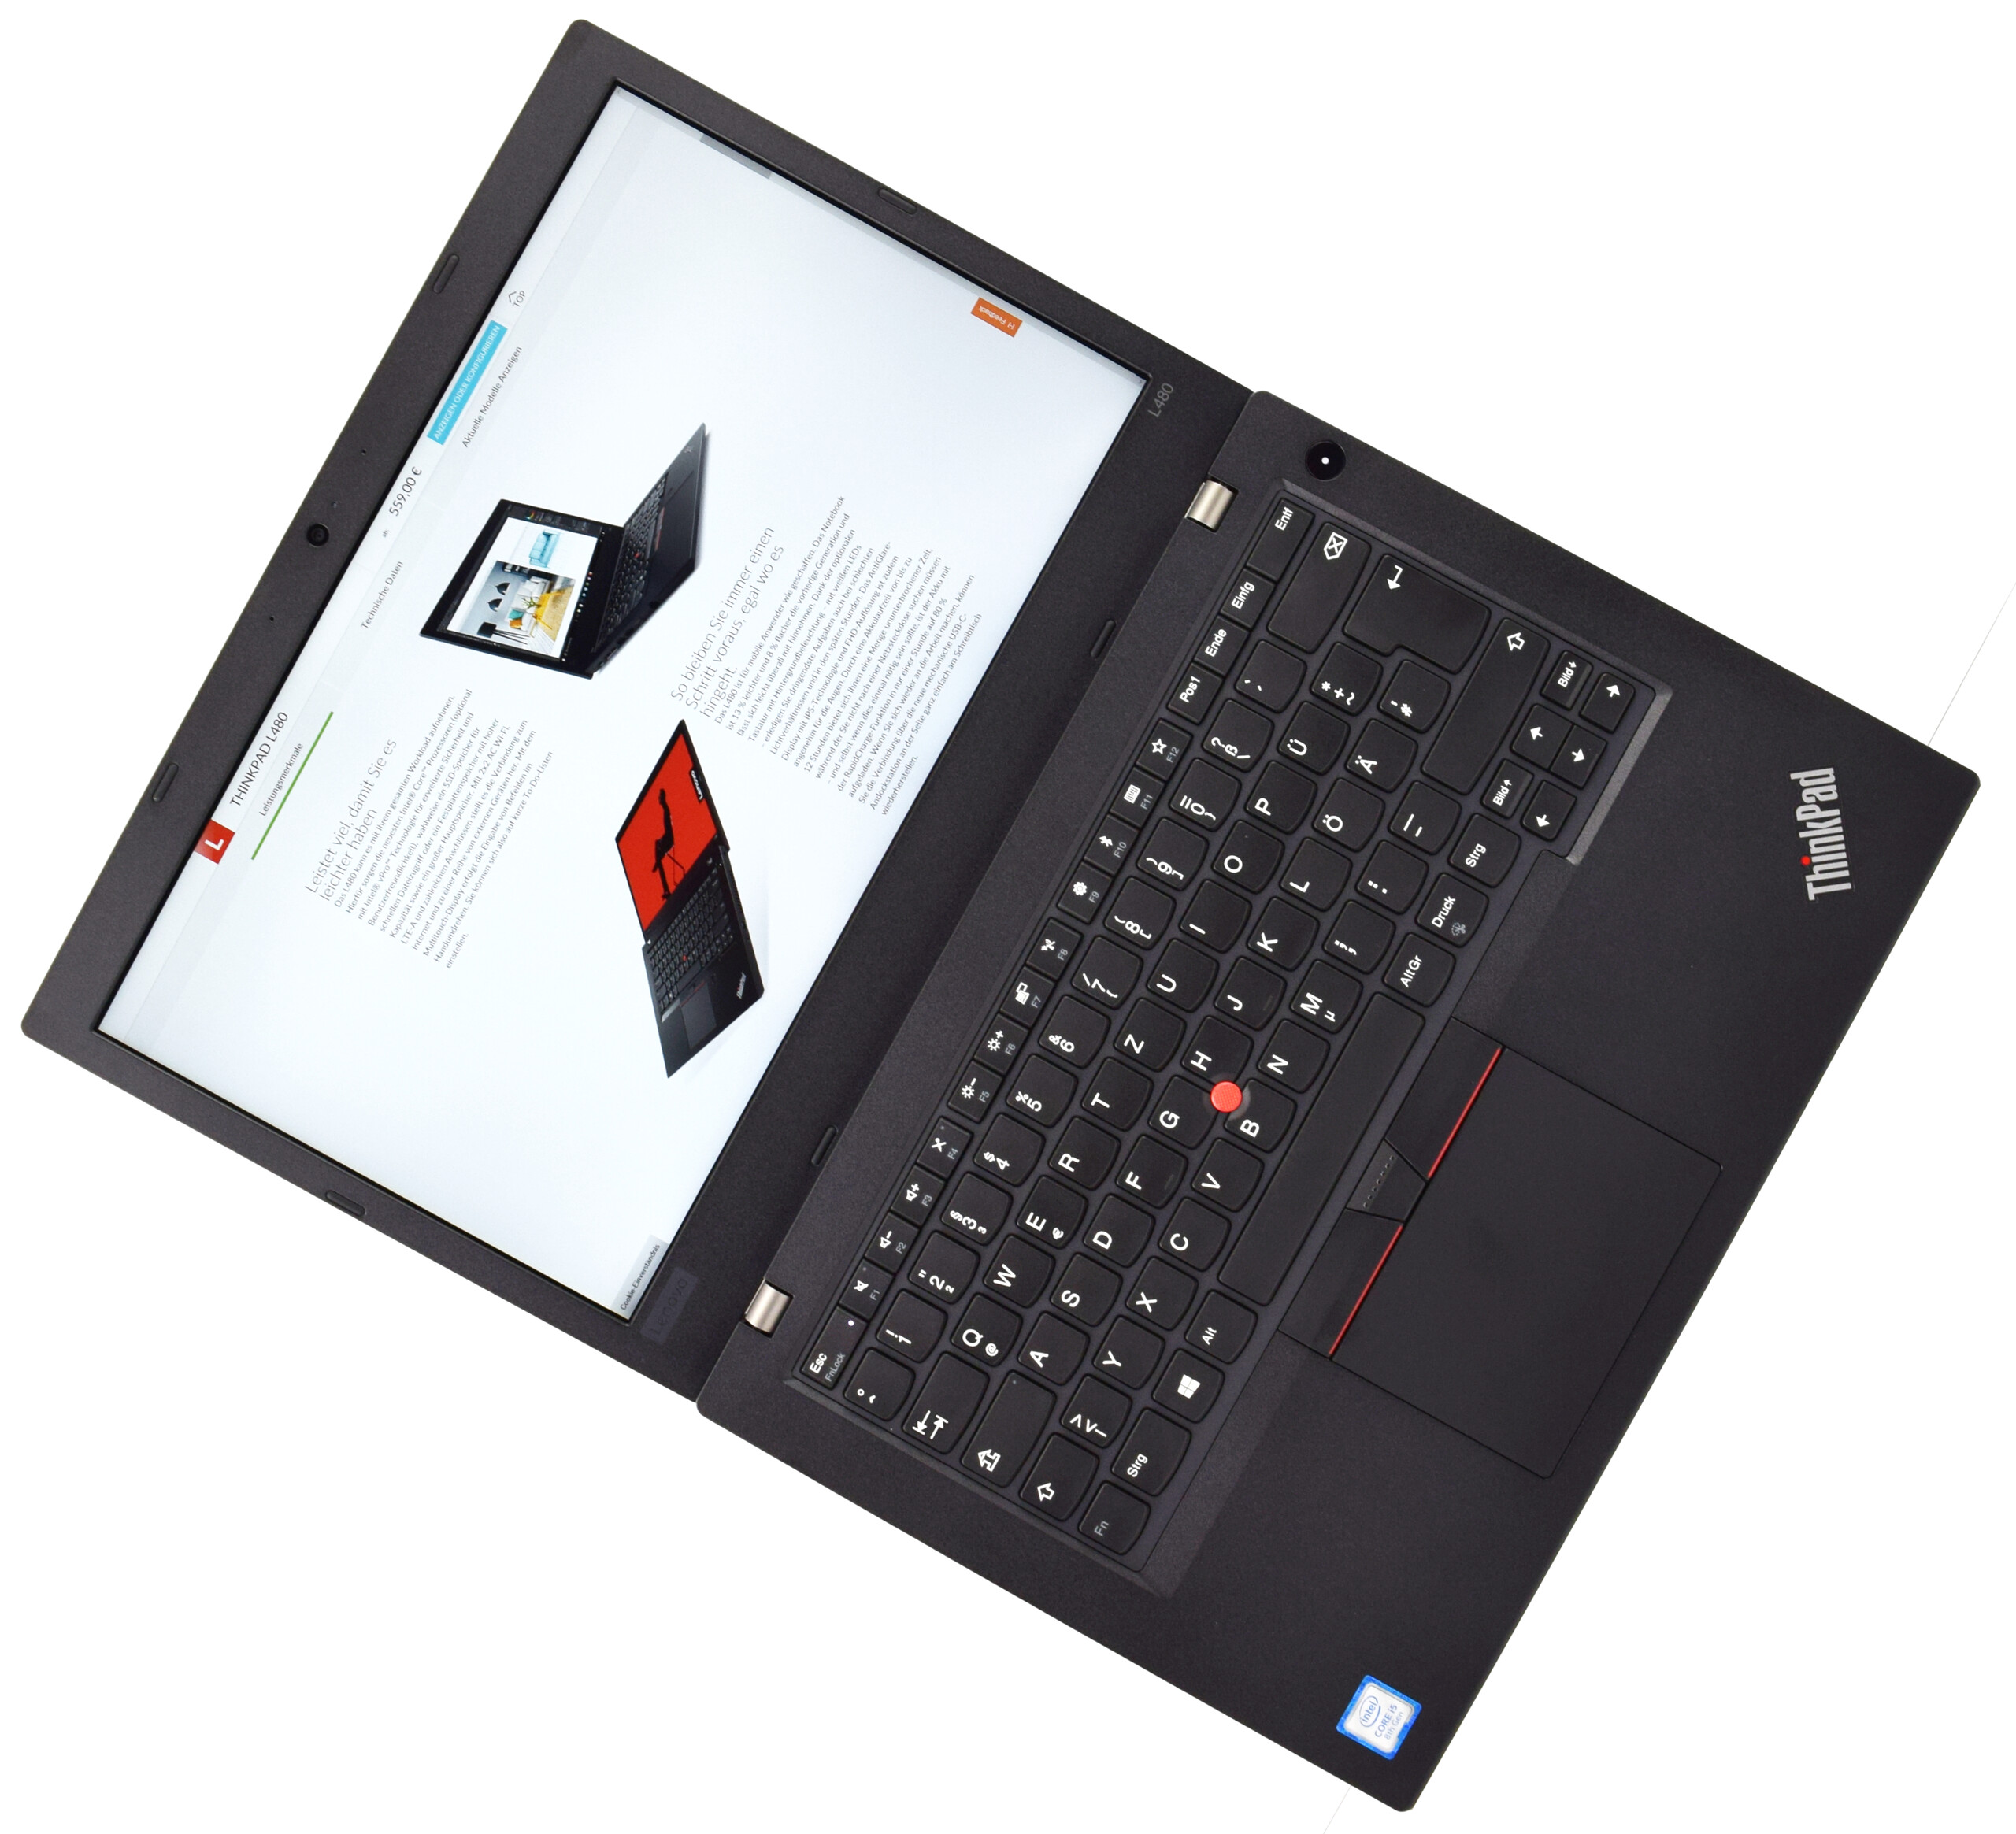
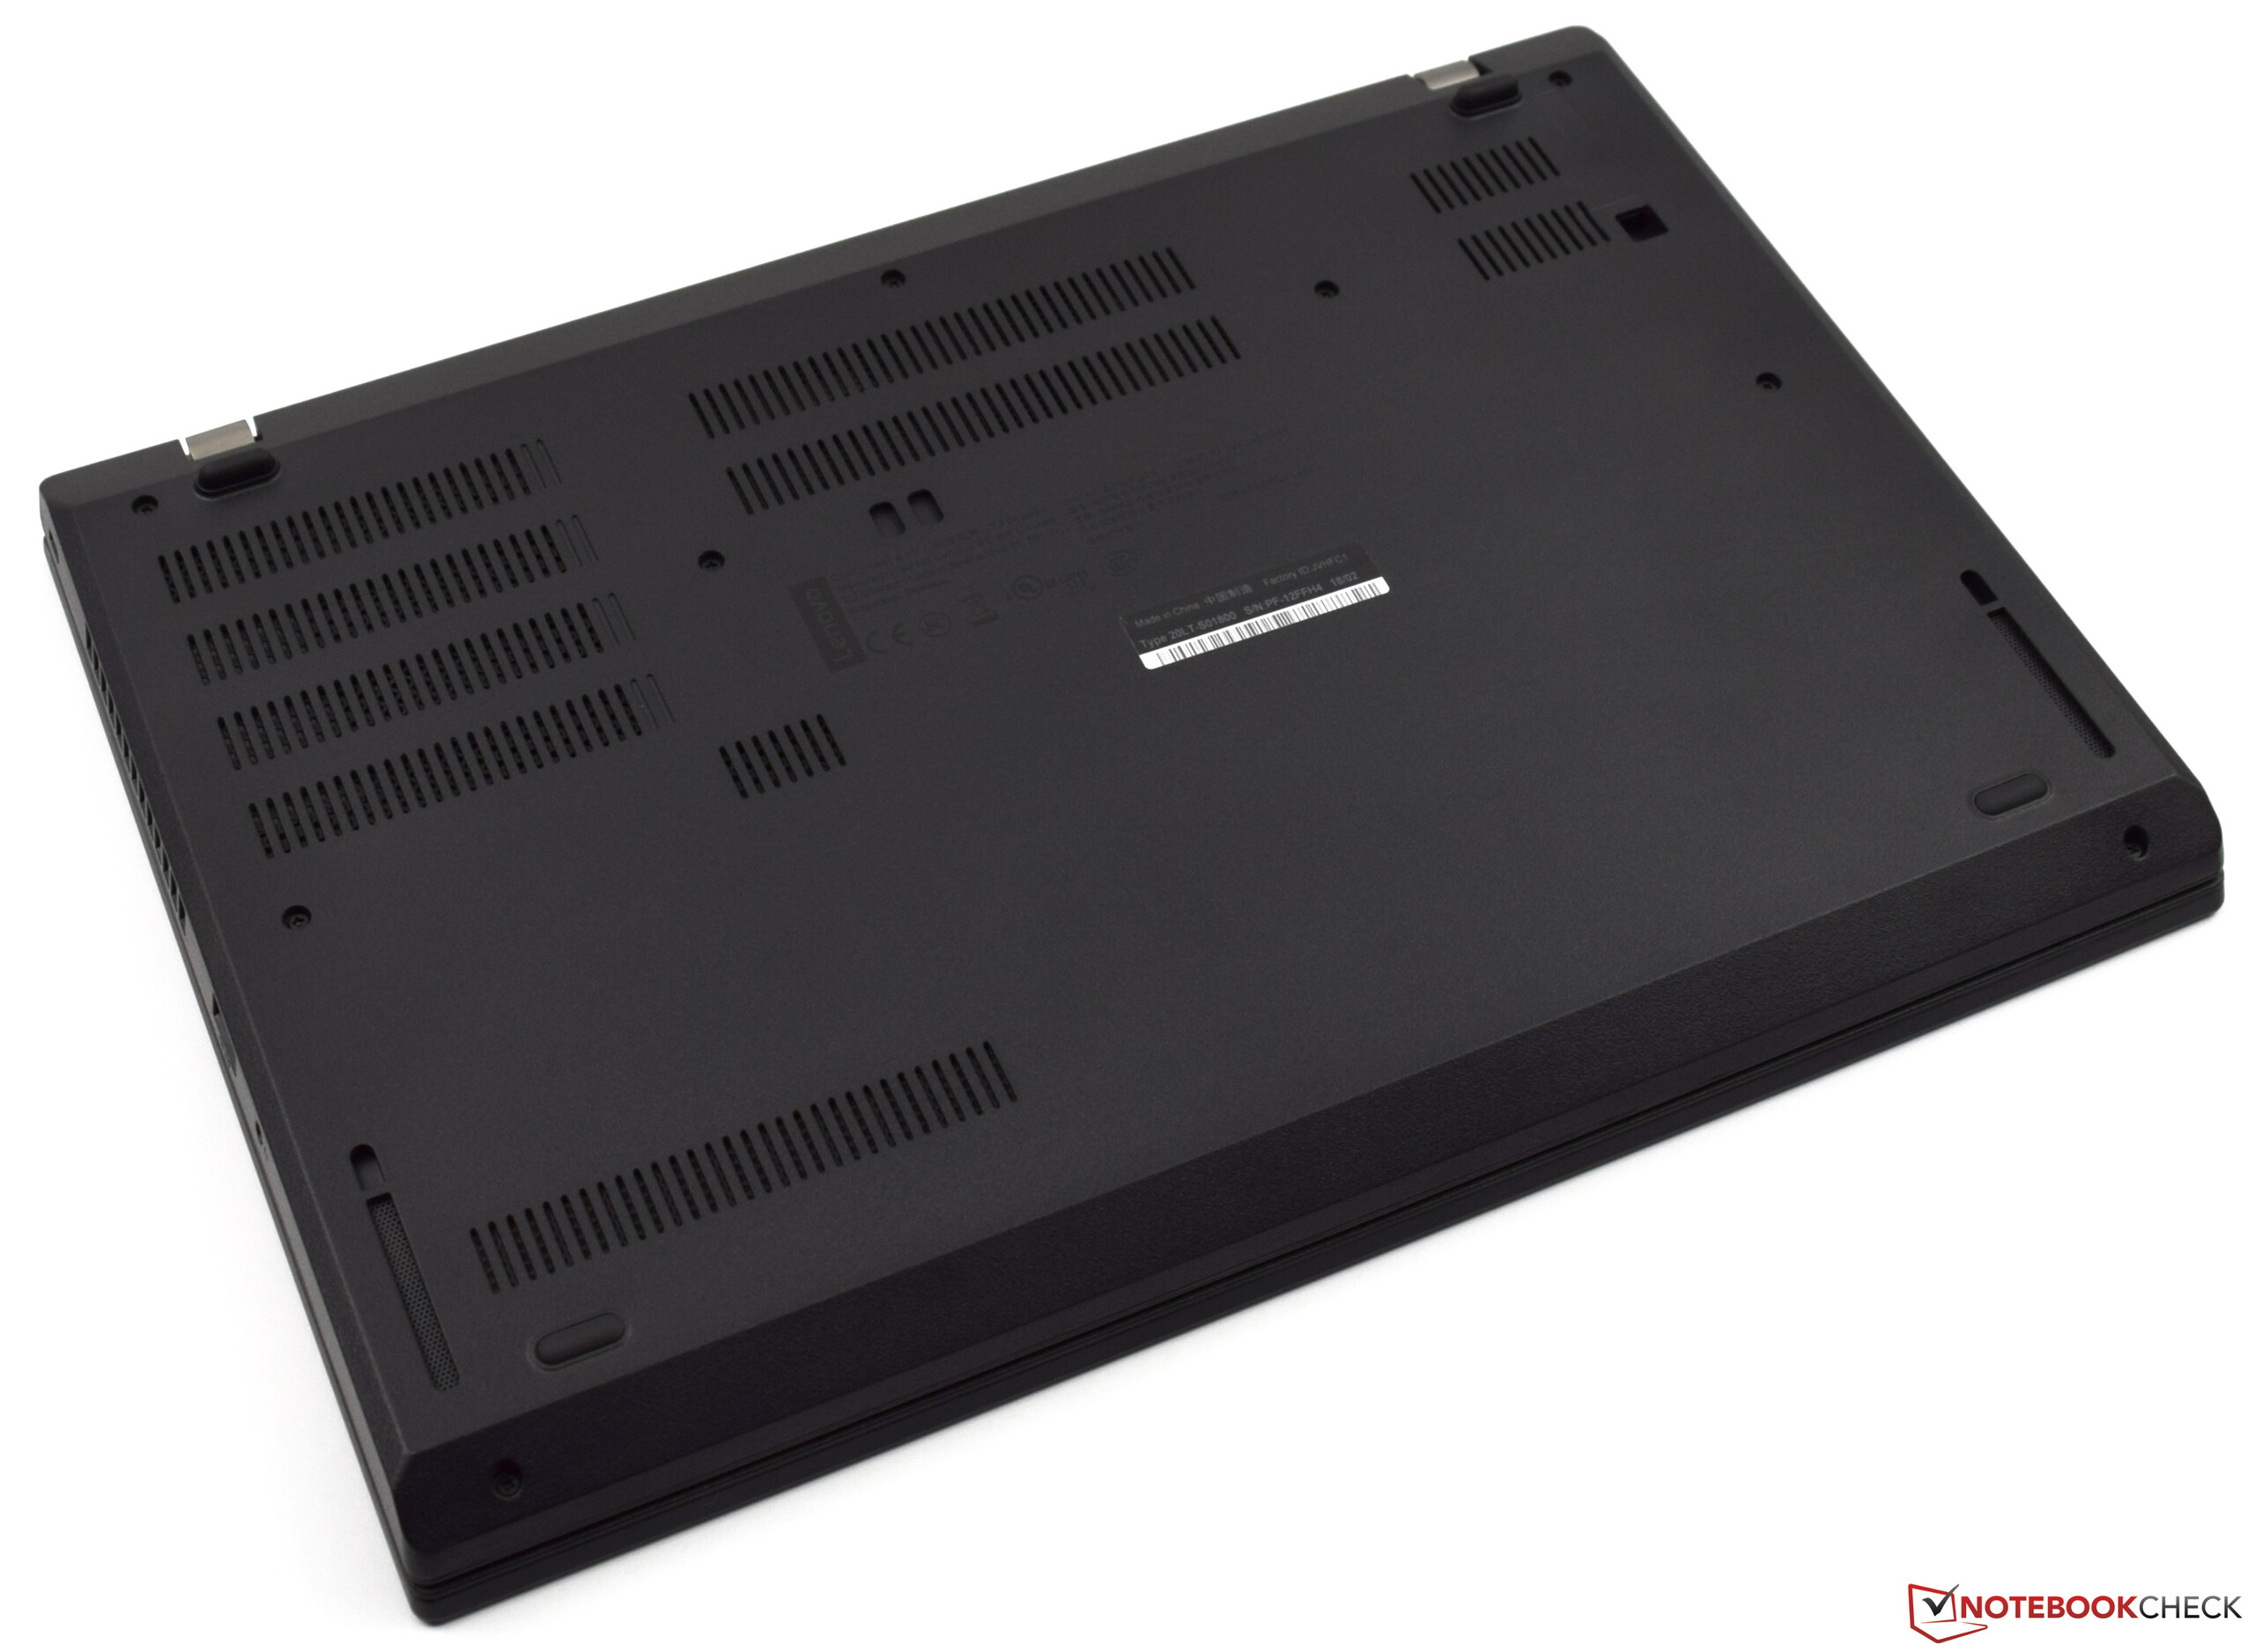
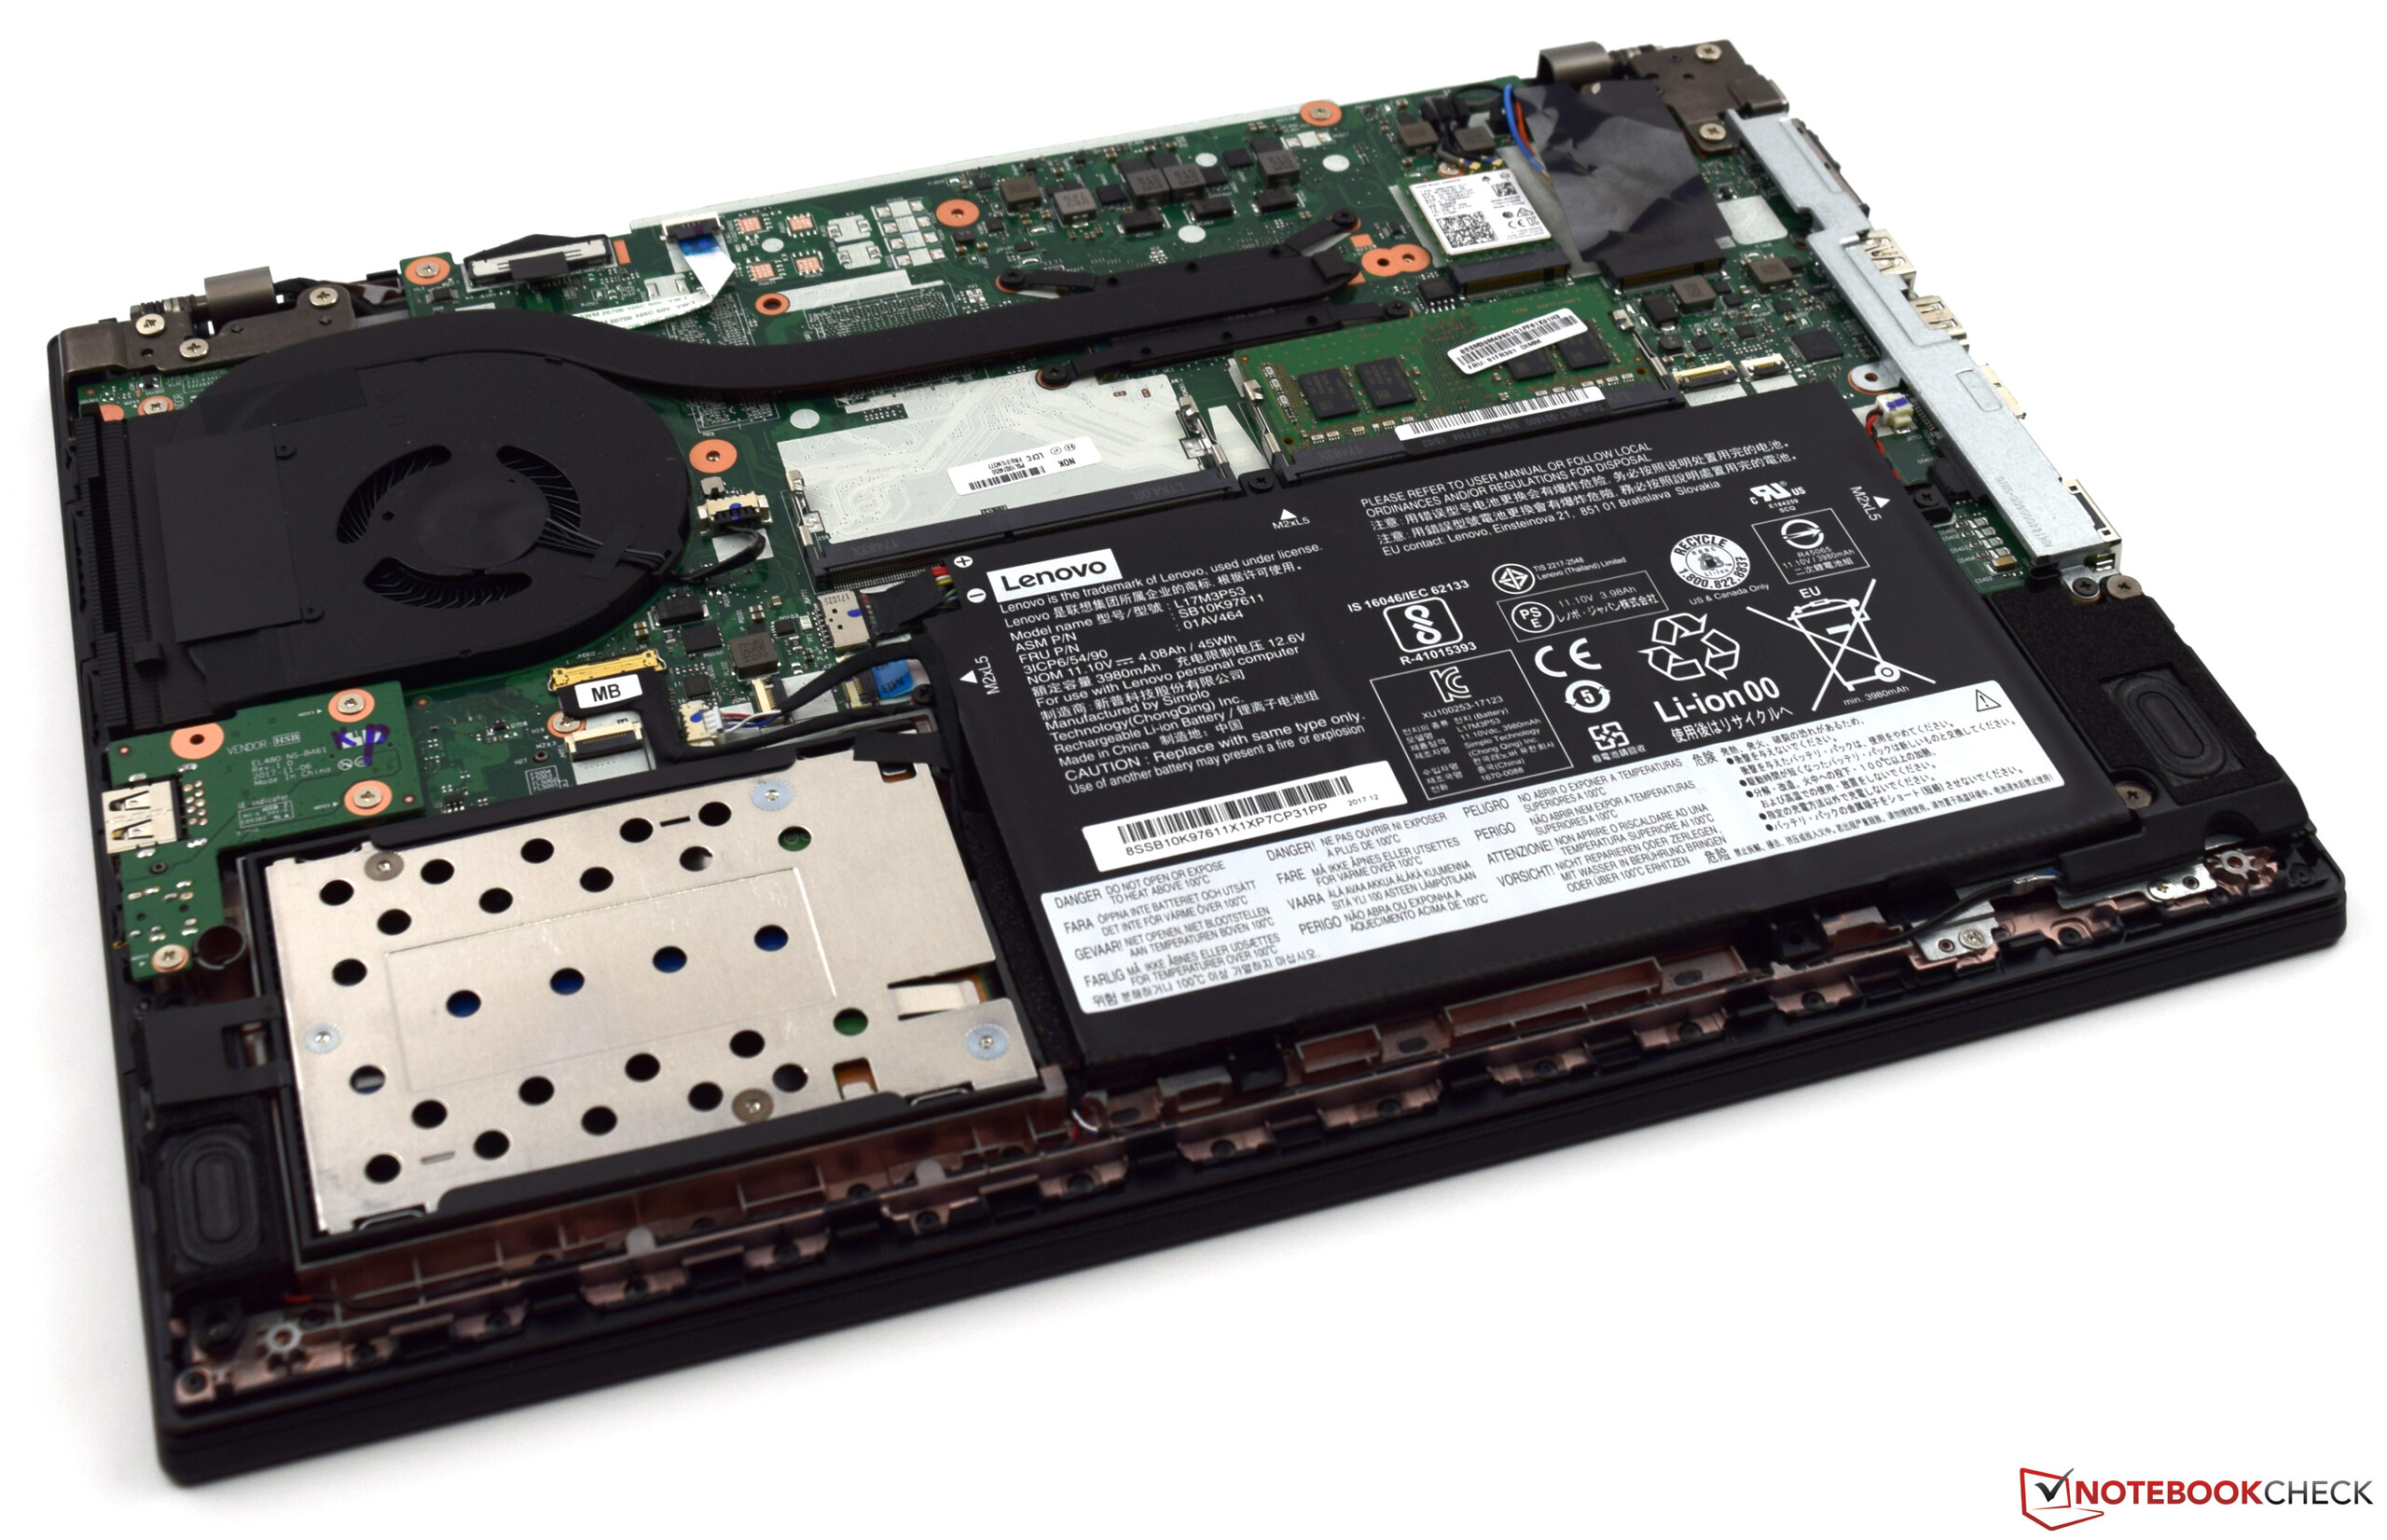
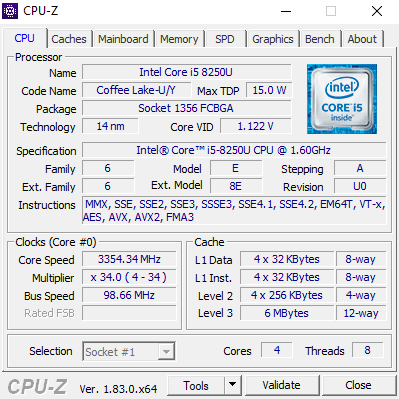
De Lenovo ThinkPad L480 is de belichaaming van het 14-inch zakelijke notebook. De configuratie van ons testmodel heeft een snelle en toch efficiënte processor. De Intel Core i5-8250U biedt voldoende prestaties voor de meeste kantoortaken en de prestaties zouden toekomstbestendig moeten zijn. De 8 GB RAM en 256 GB SSD zijn ook voldoende. De slanke, stabiele behuizing en het IPS-paneel complementeren de uitrusting.
Voor minder dan € 1.000 krijgen kopens een complete zakelijk notebook met de fantastische invoerapparaten waar de ThinkPad familie bekend om is. De veelheid aan configuratieopties maakt het mogelijk de perfecte zakelijke metgezel samen te stellen.
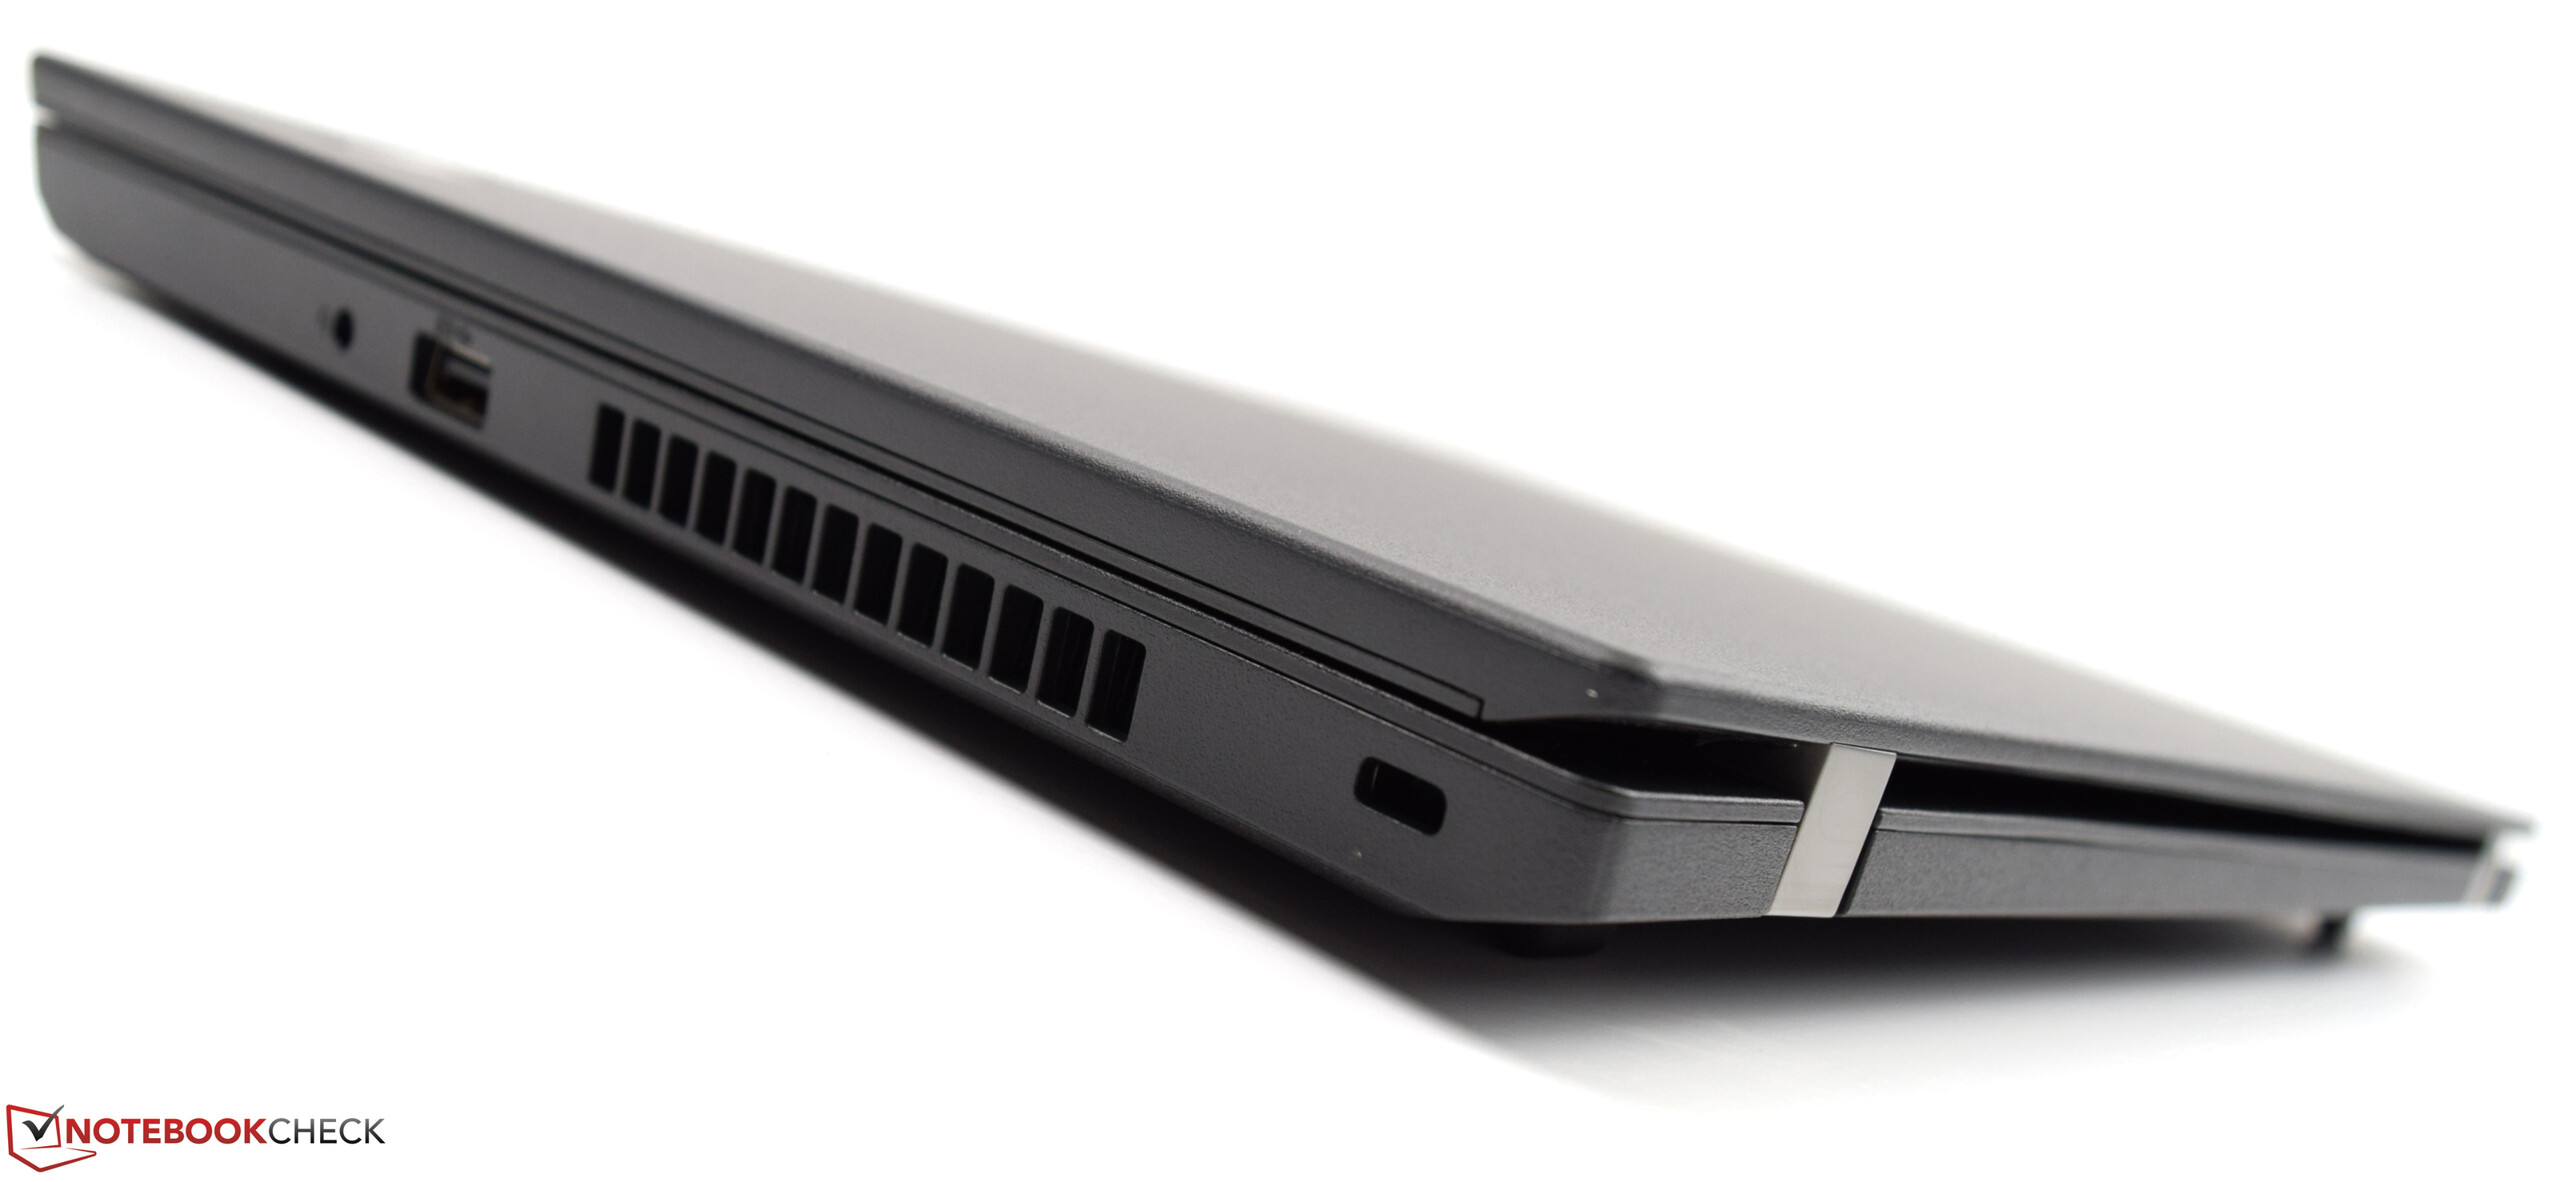
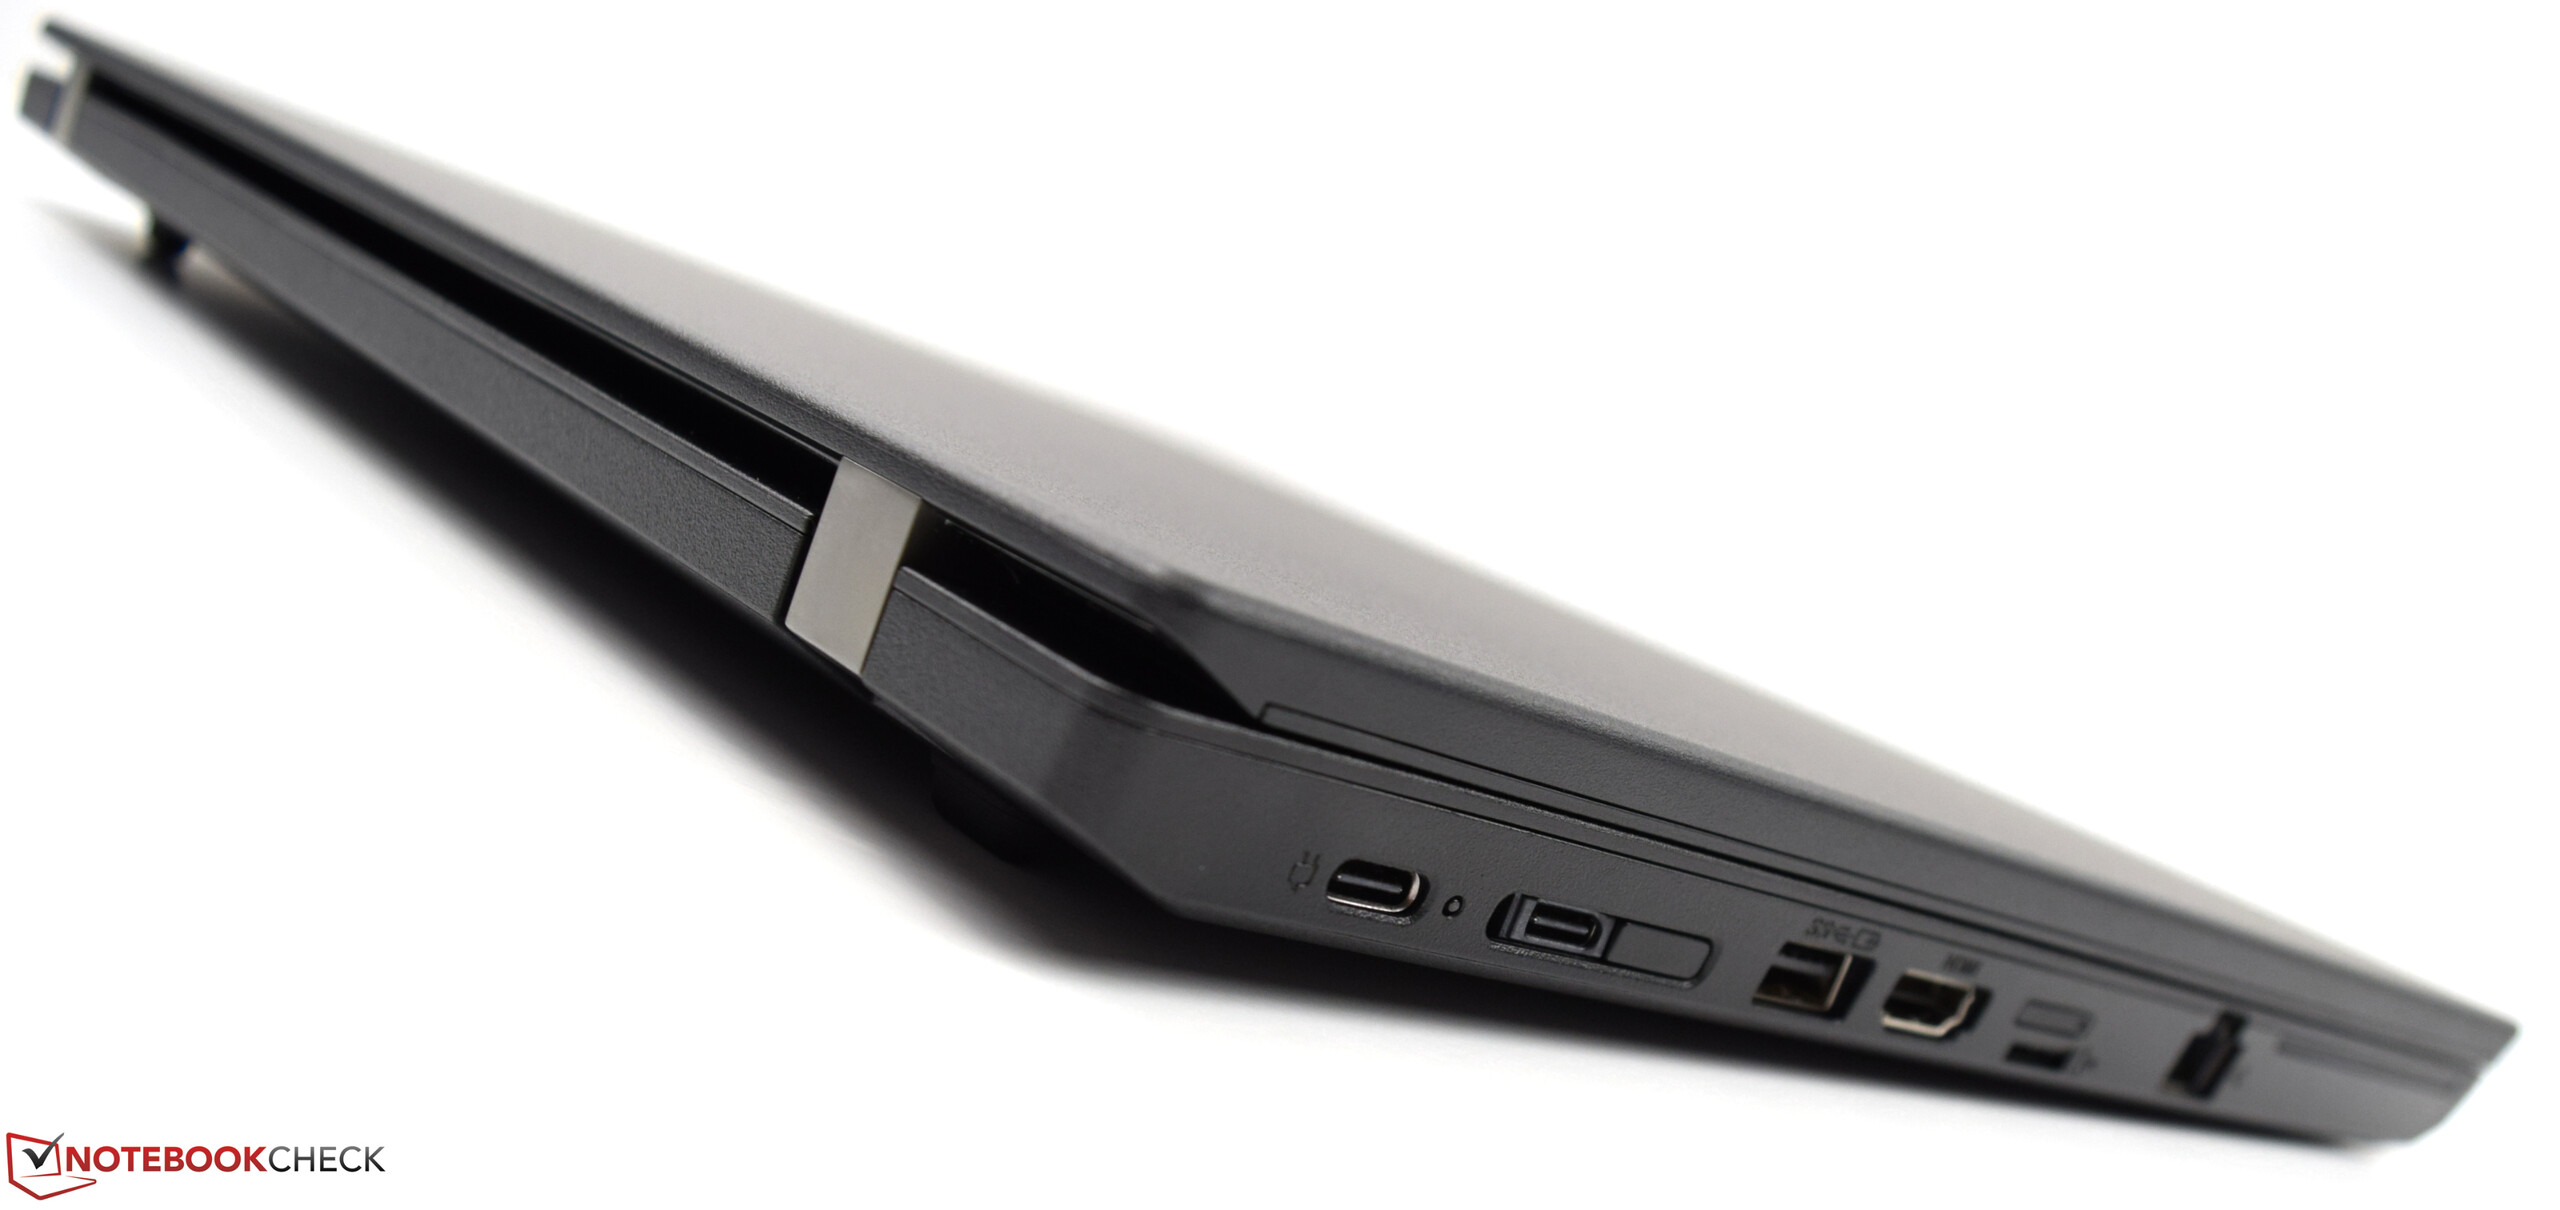
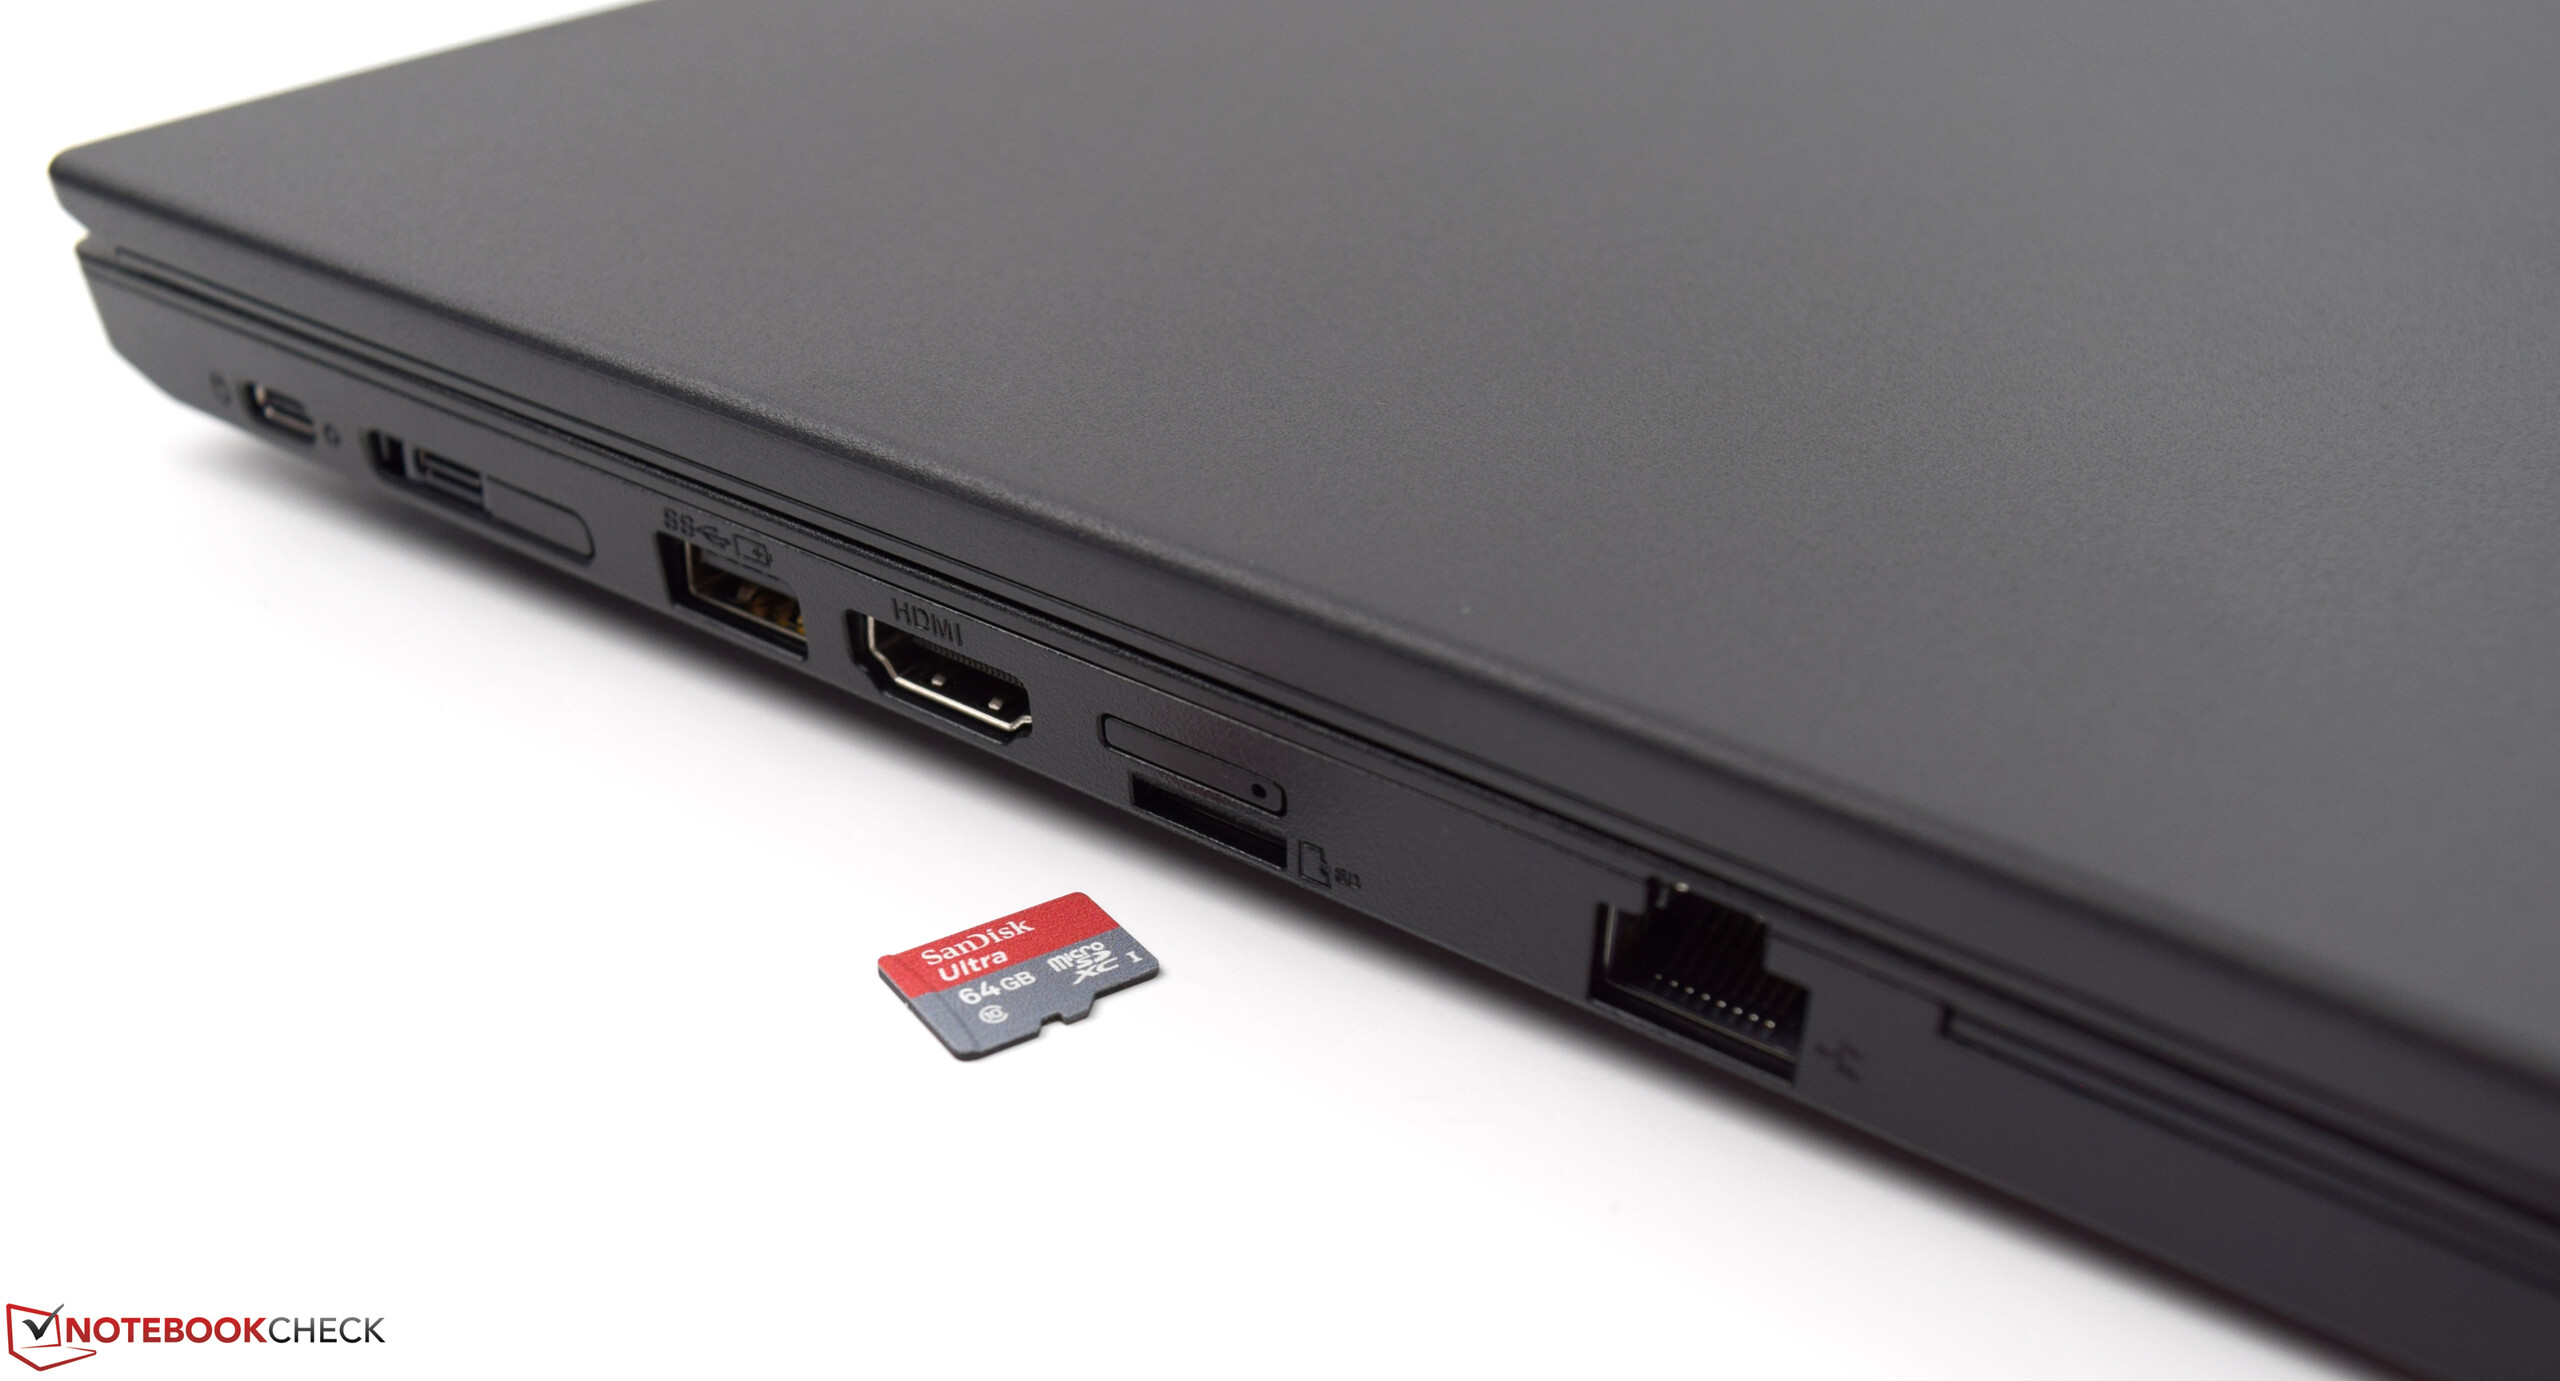
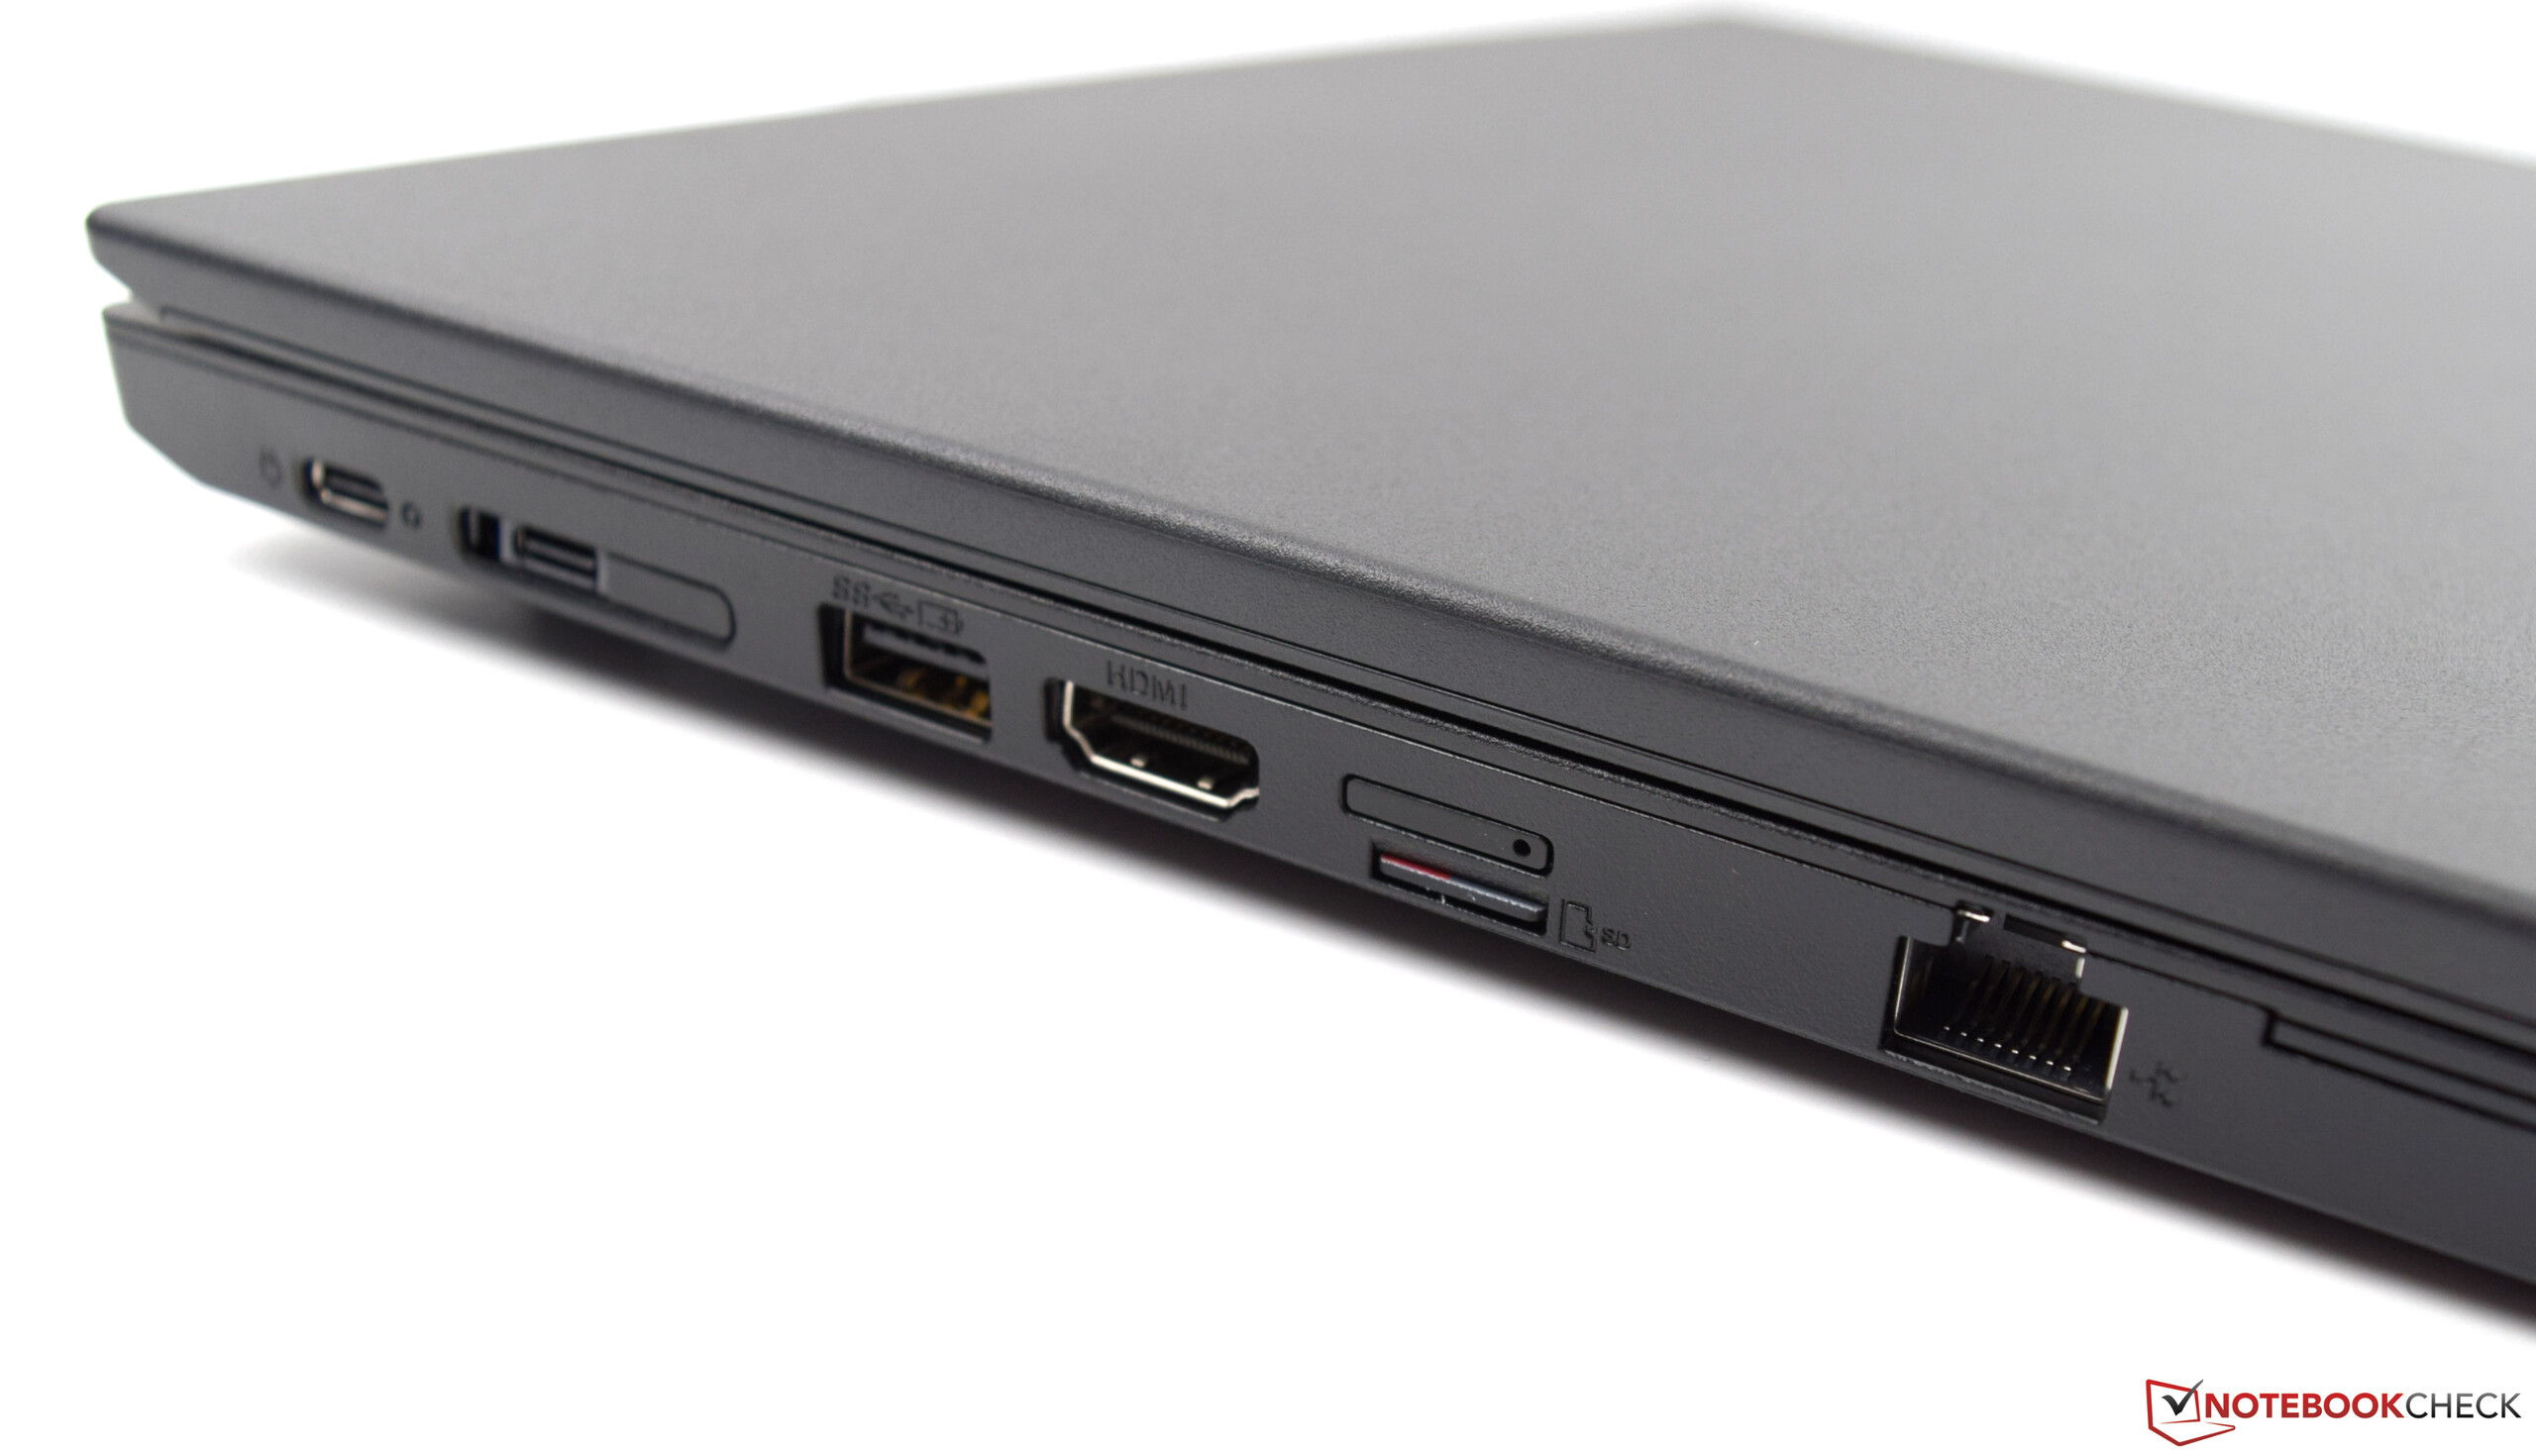
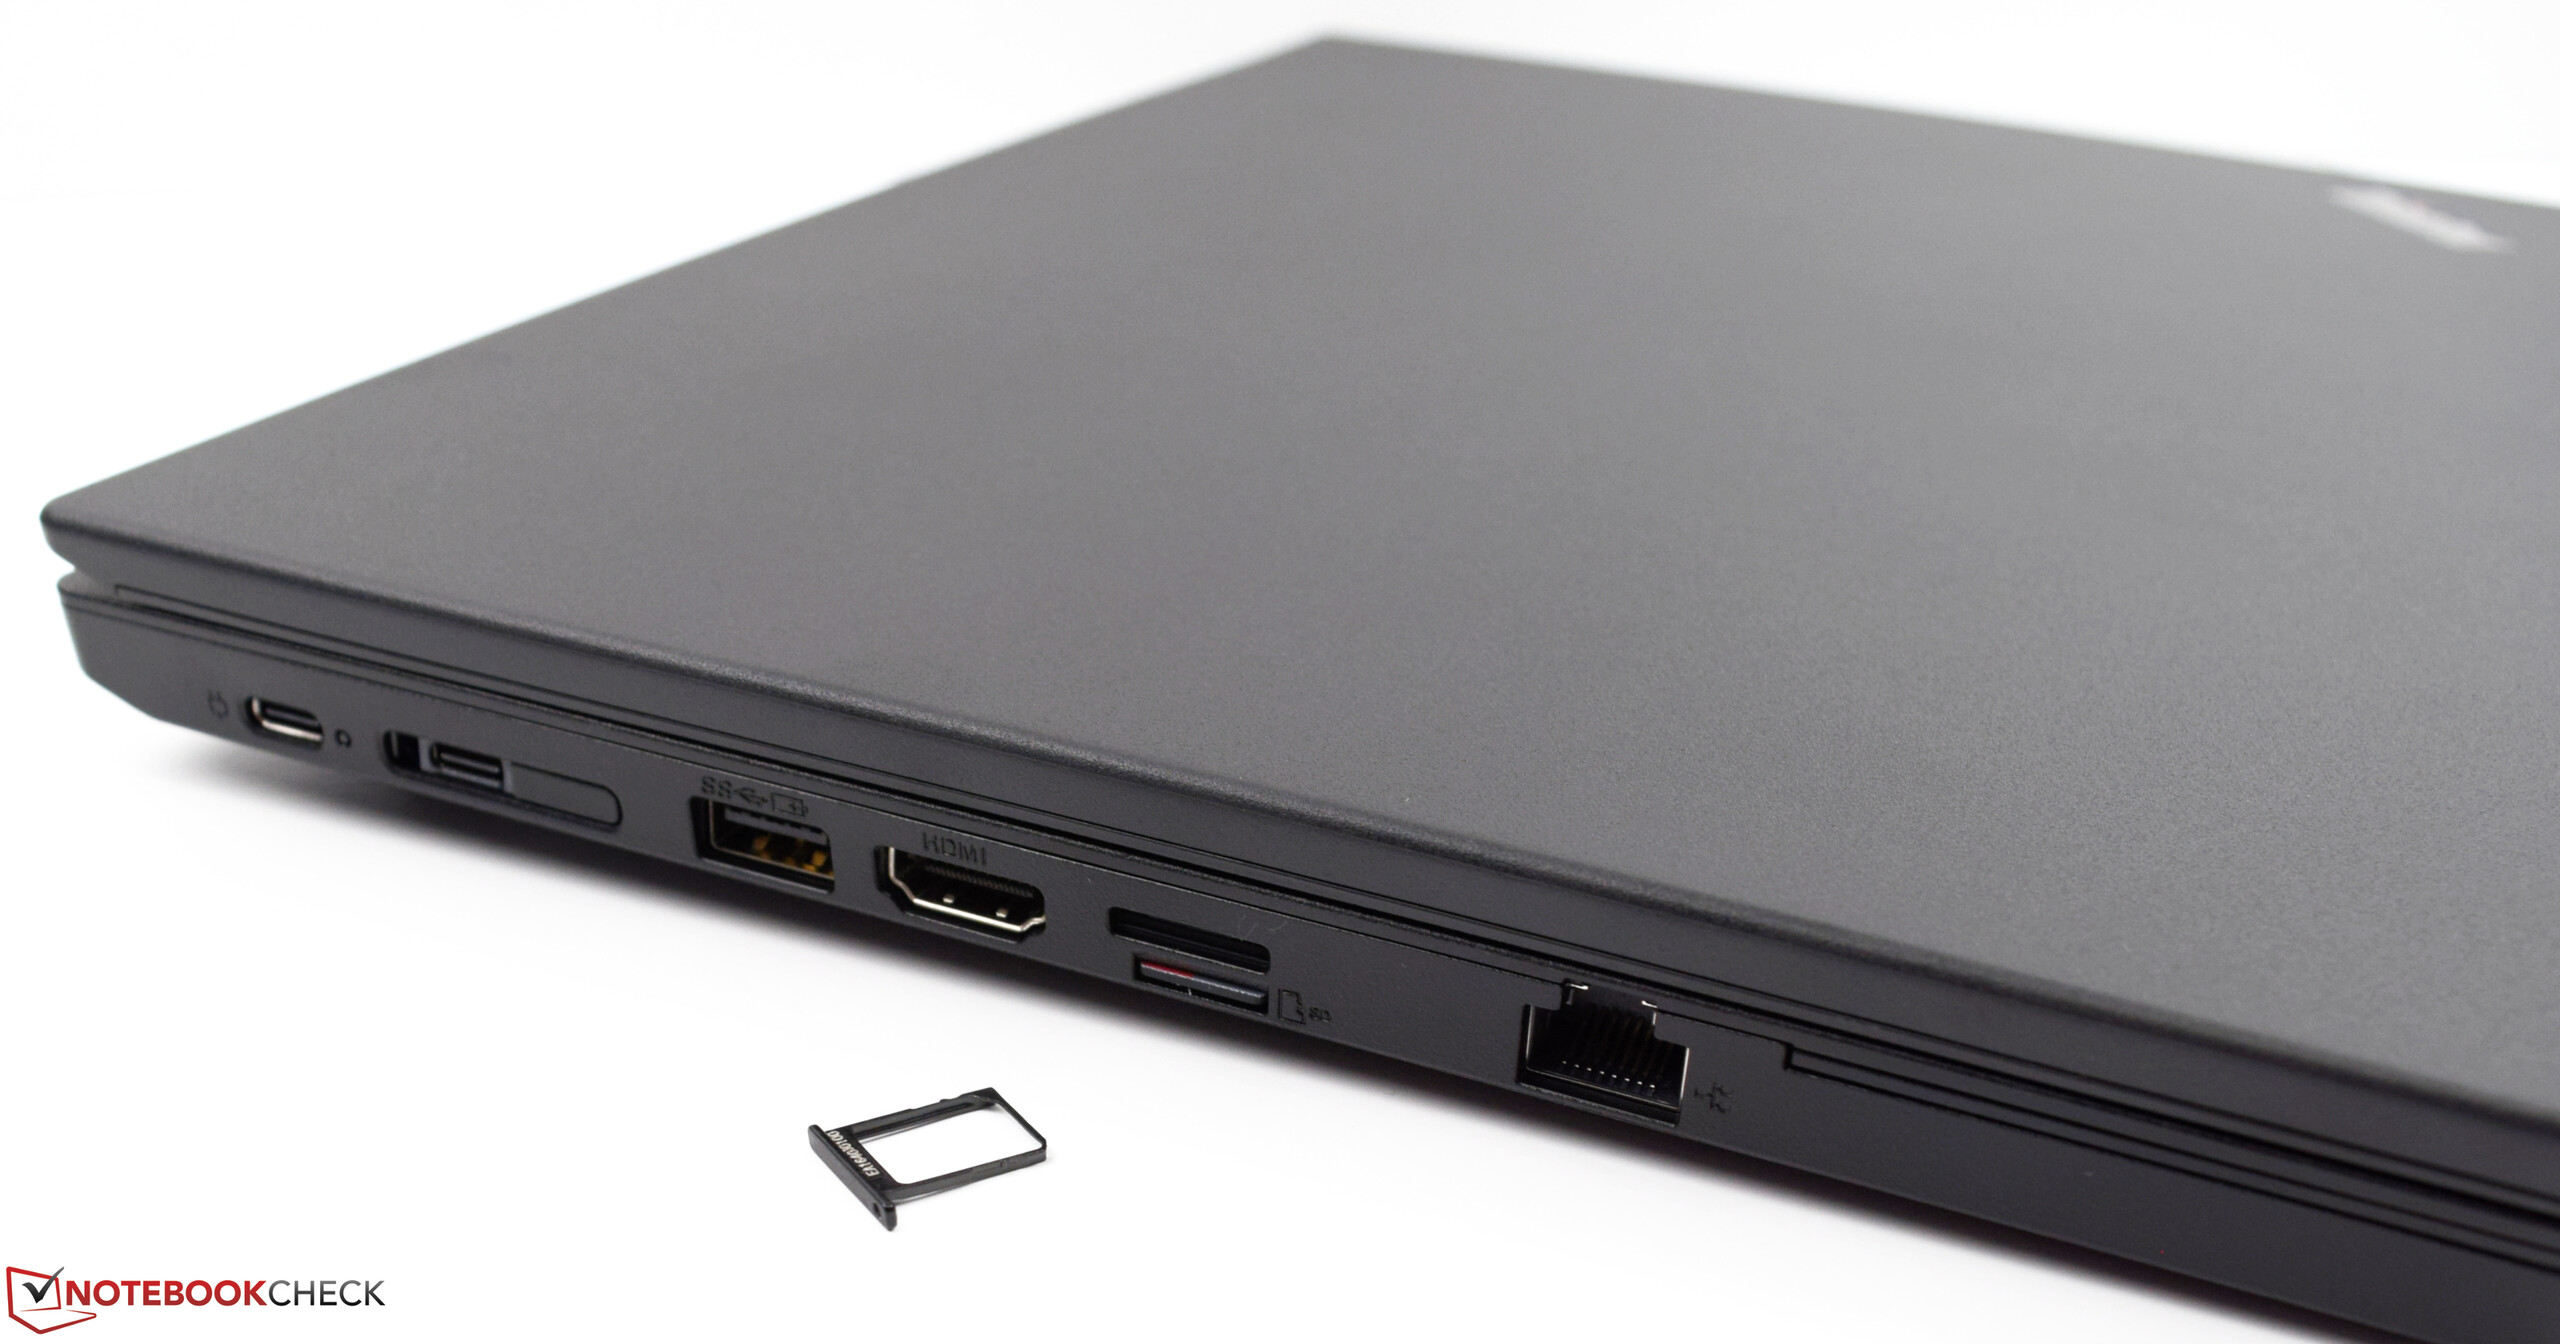
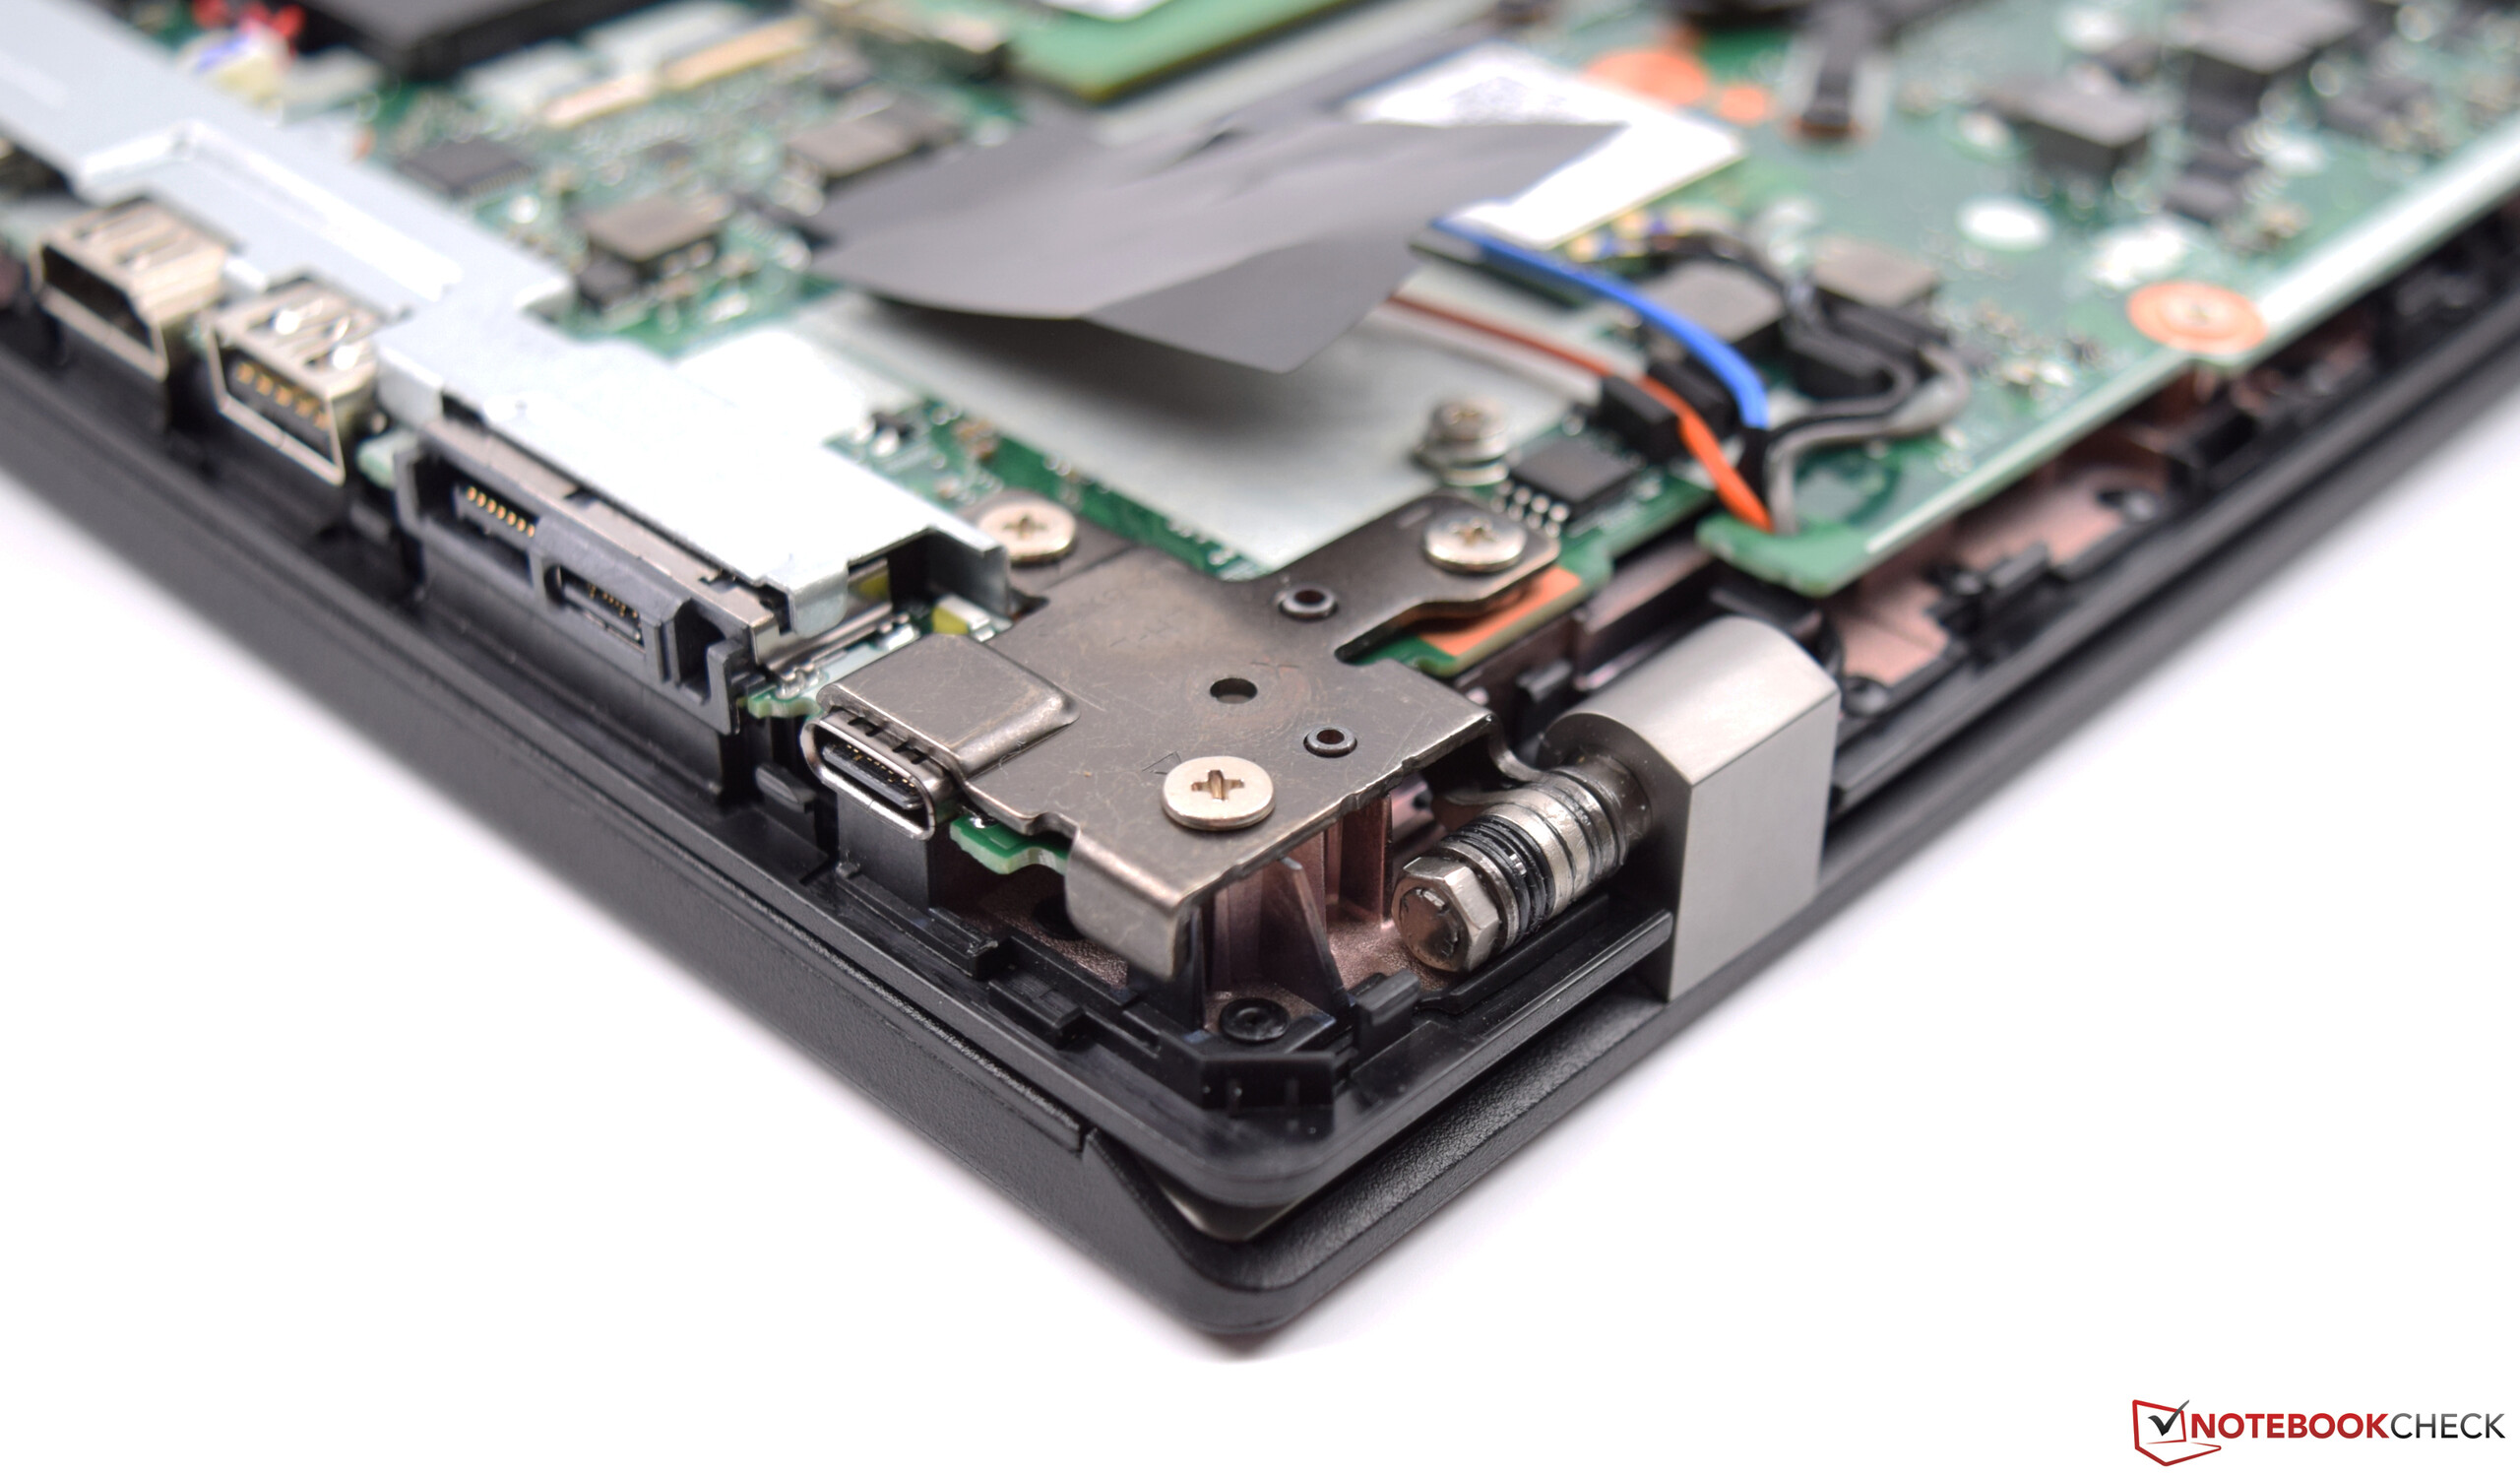
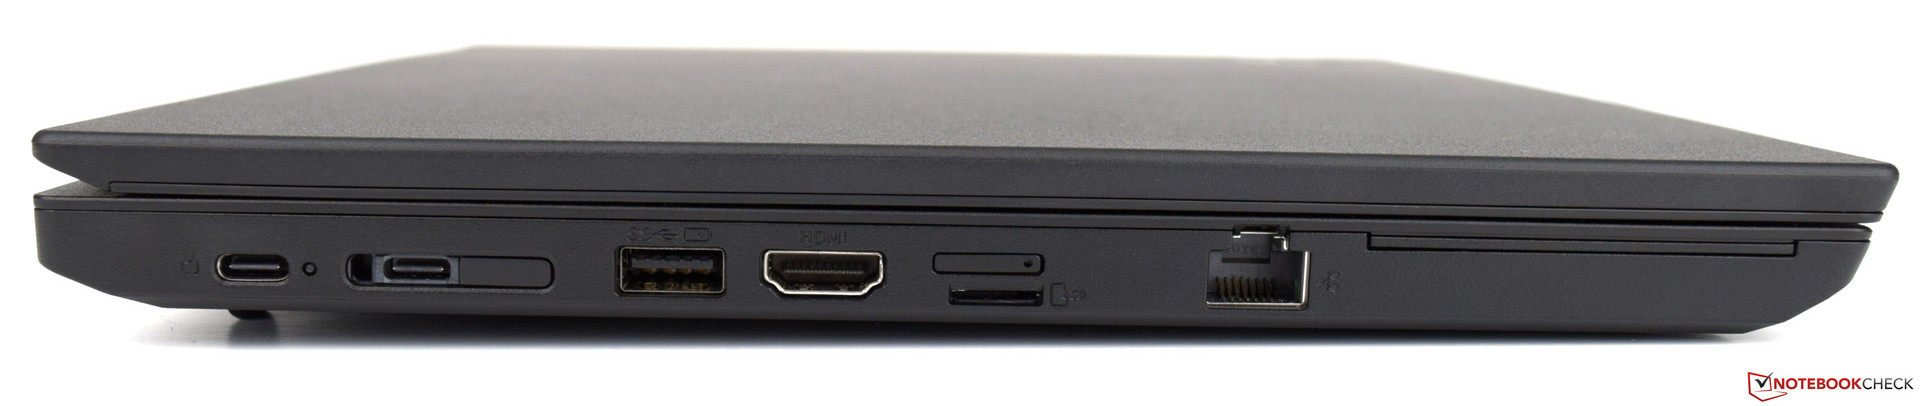
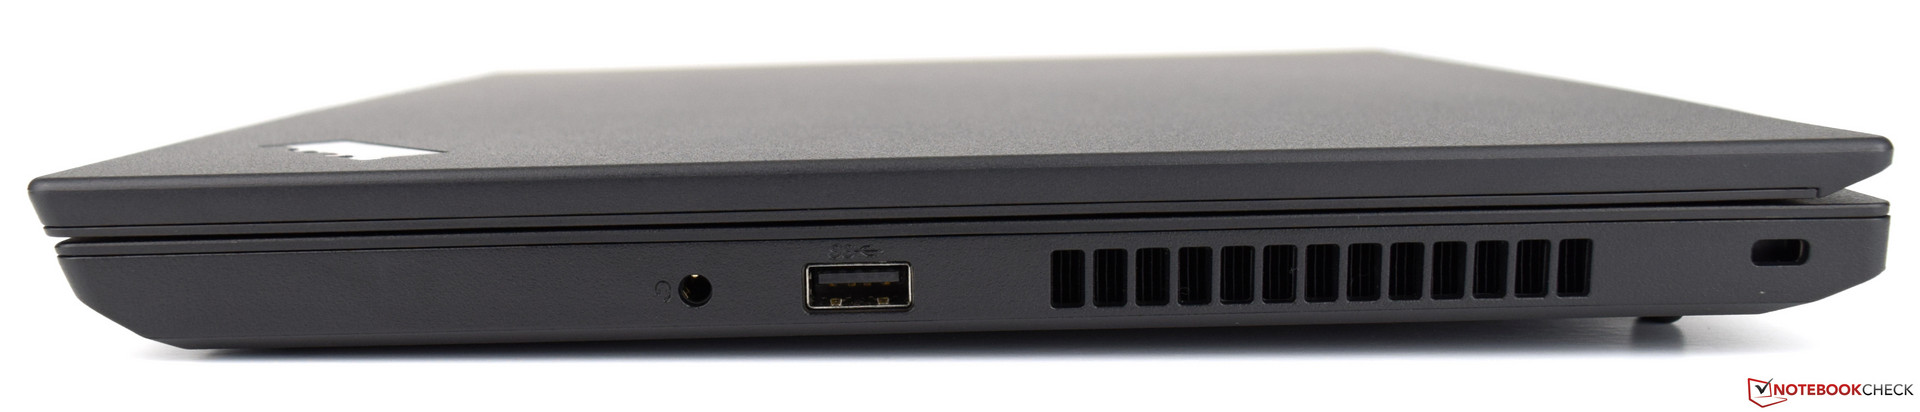
Het beeldscherm laat echter gemixte gevoelens achter bij ons. Het hebben van een IPS-paneel is goed, maar de helderheid voldoet echter niet aan de verwachtingen. Gebruikers zullen dan ook compromissen moeten sluiten qua buiten werken. Daarnaast is de batterijlevensduur niet echt goed in vergelijking met de concurrentie. Prestaties en het uitgebreide aanbod van poorten is goed. Een opvallend punt is de vervanging van de SD-kaartlezer voor een MicroSD-variant.
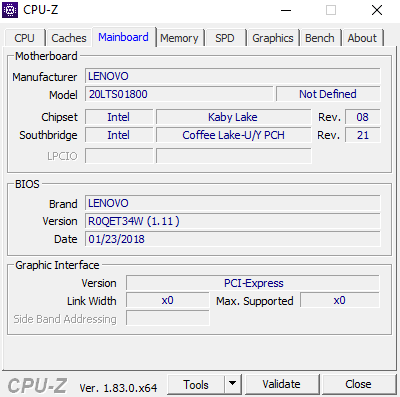
Lenovo ThinkPad L480-20LS001AGE
- 13-03-2018 v6 (old)
Sebastian Bade