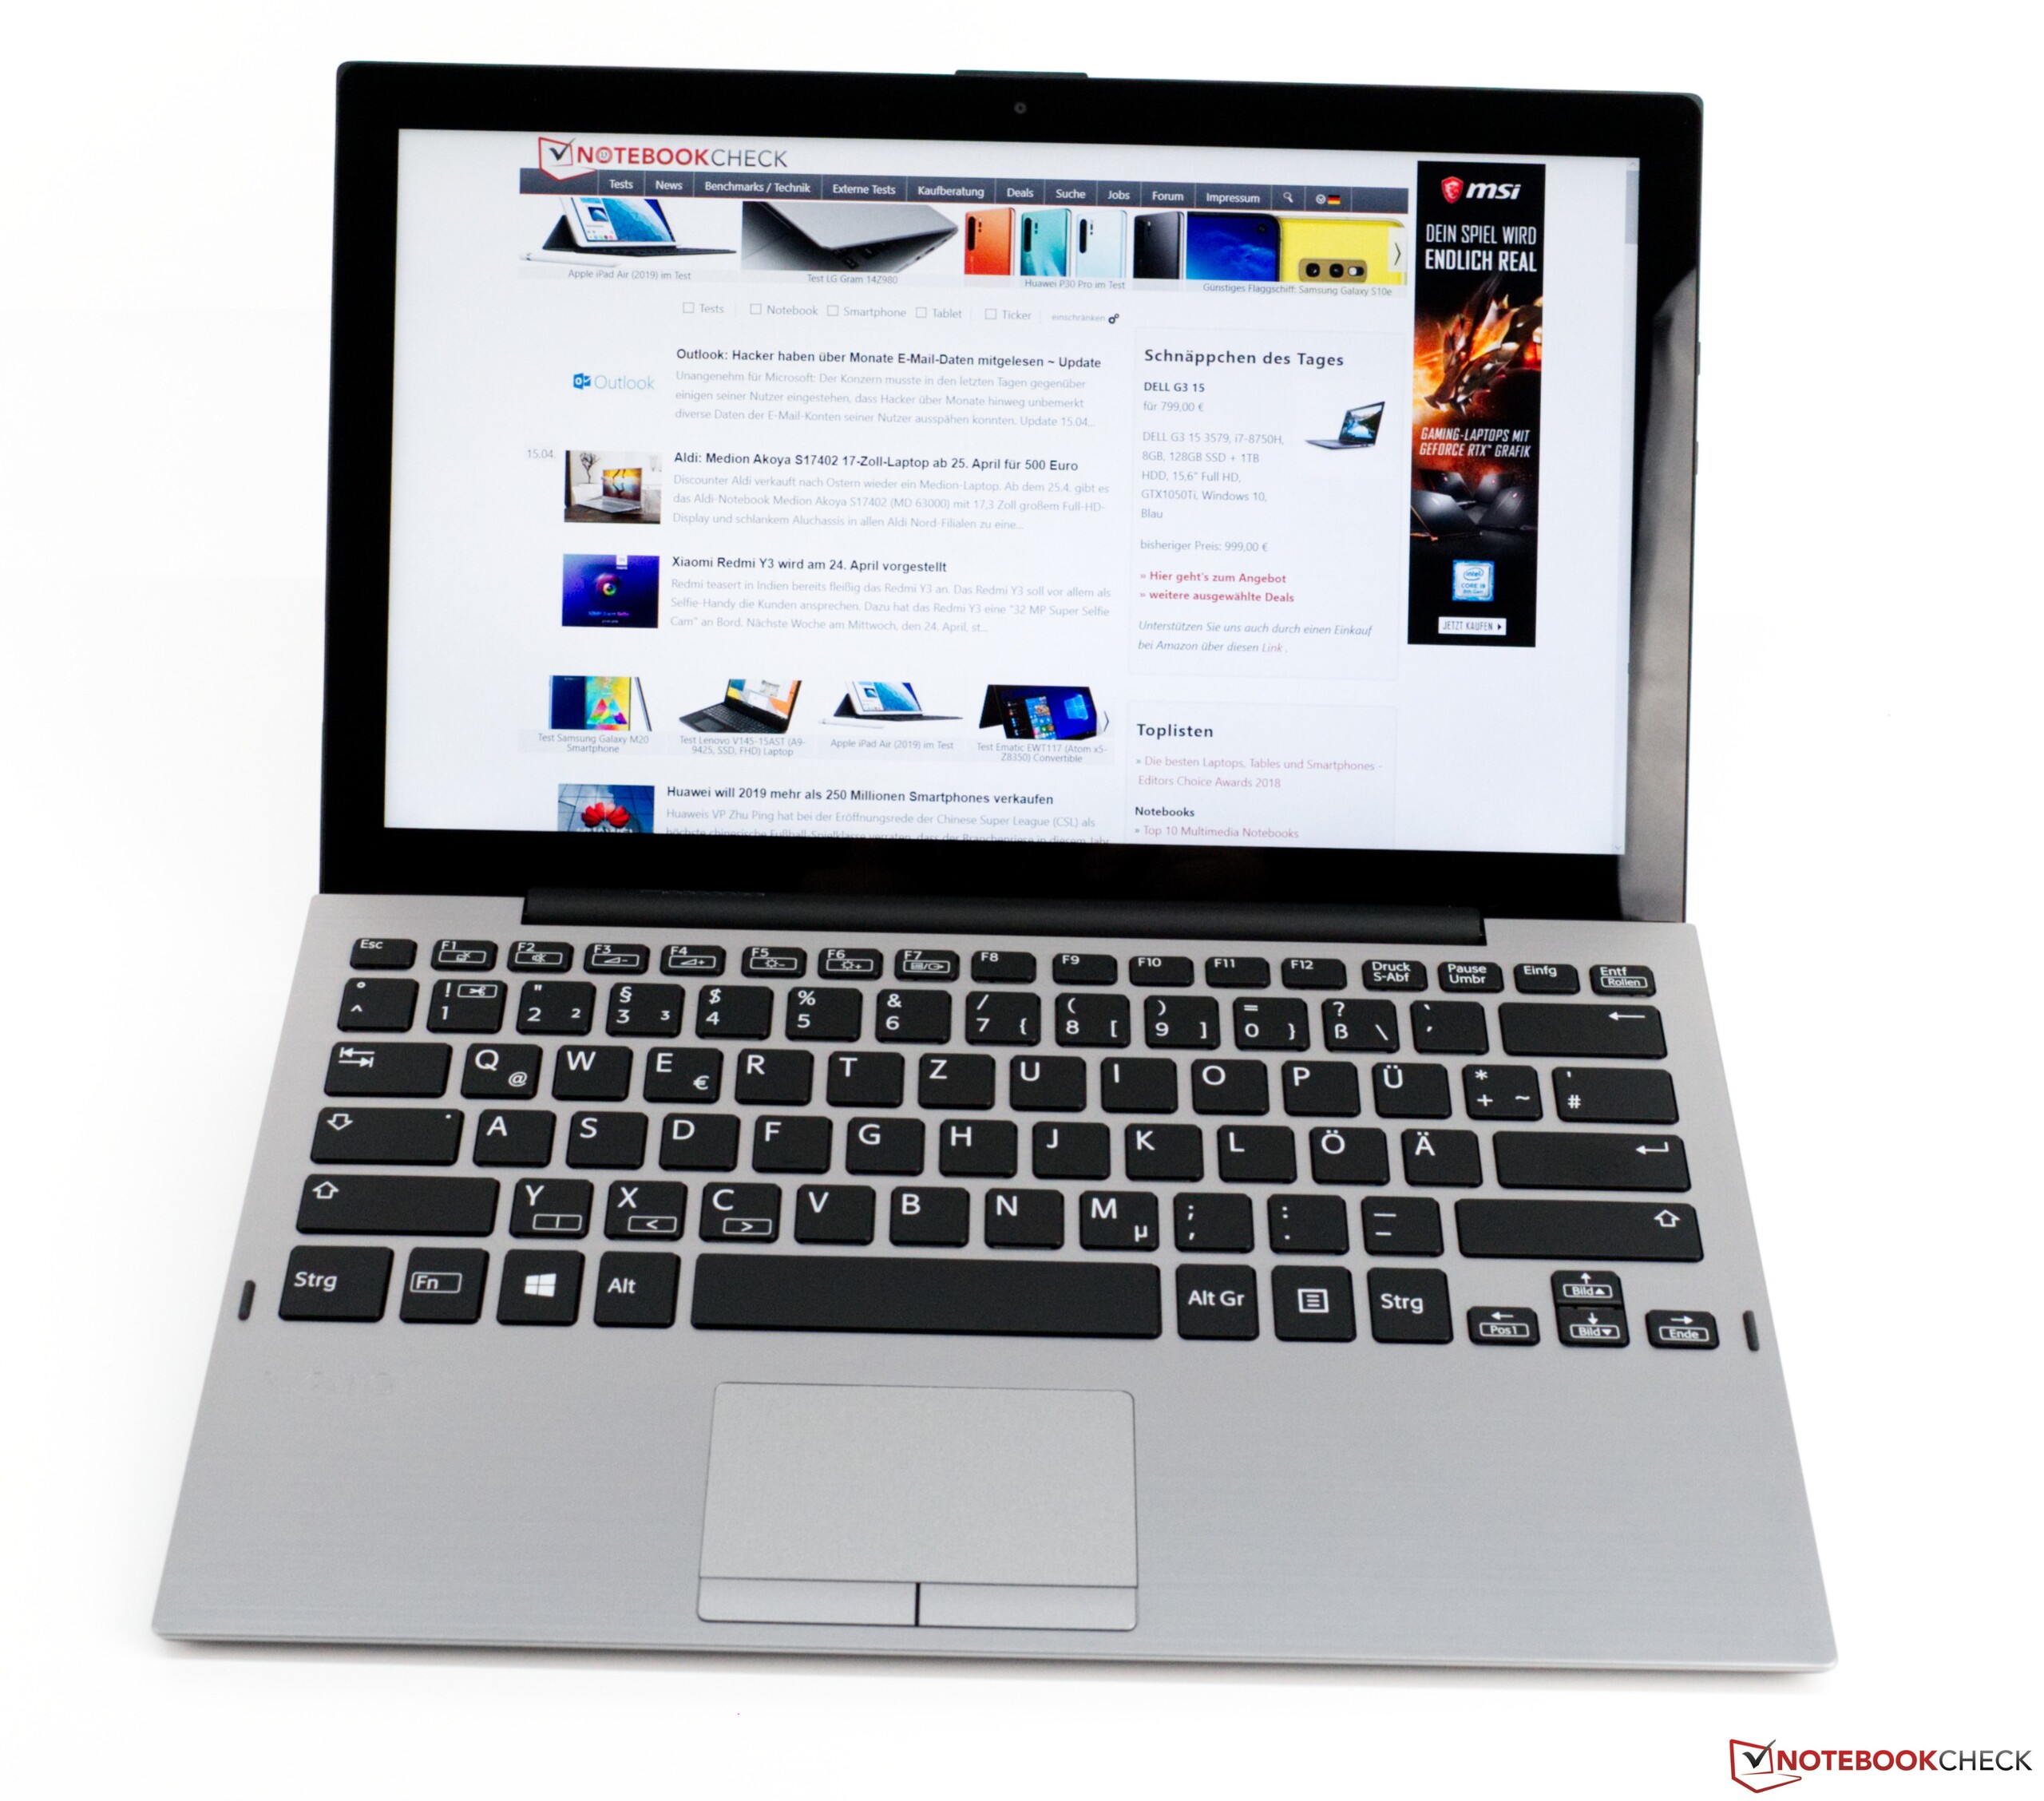
Kort testrapport VAIO A12 (Core i7-8500Y, 16 GB RAM, 512 GB SSD, FHD) Convertible
| SD Card Reader | |
| average JPG Copy Test (av. of 3 runs) | |
| Dell Latitude 5290 2-in-1 (Toshiba Exceria Pro M501 UHS-II) | |
| Lenovo ThinkPad X1 Tablet G3-20KJ001NGE (Toshiba Exceria Pro M501 UHS-II) | |
| Microsoft Surface Pro 6, Core i7, 512 GB (Toshiba Exceria Pro M501 microSDXC 64GB) | |
| Gemiddelde van klas Convertible (28.1 - 197, n=23, laatste 2 jaar) | |
| VAIO A12-92993 (Toshiba Exceria Pro SDXC 64 GB UHS-II) | |
| maximum AS SSD Seq Read Test (1GB) | |
| Dell Latitude 5290 2-in-1 (Toshiba Exceria Pro M501 UHS-II) | |
| Gemiddelde van klas Convertible (28.9 - 254, n=22, laatste 2 jaar) | |
| Microsoft Surface Pro 6, Core i7, 512 GB (Toshiba Exceria Pro M501 microSDXC 64GB) | |
| Lenovo ThinkPad X1 Tablet G3-20KJ001NGE (Toshiba Exceria Pro M501 UHS-II) | |
| VAIO A12-92993 (Toshiba Exceria Pro SDXC 64 GB UHS-II) | |
| |||||||||||||||||||||||||
Helderheidsverdeling: 89 %
Helderheid in Batterij-modus: 315 cd/m²
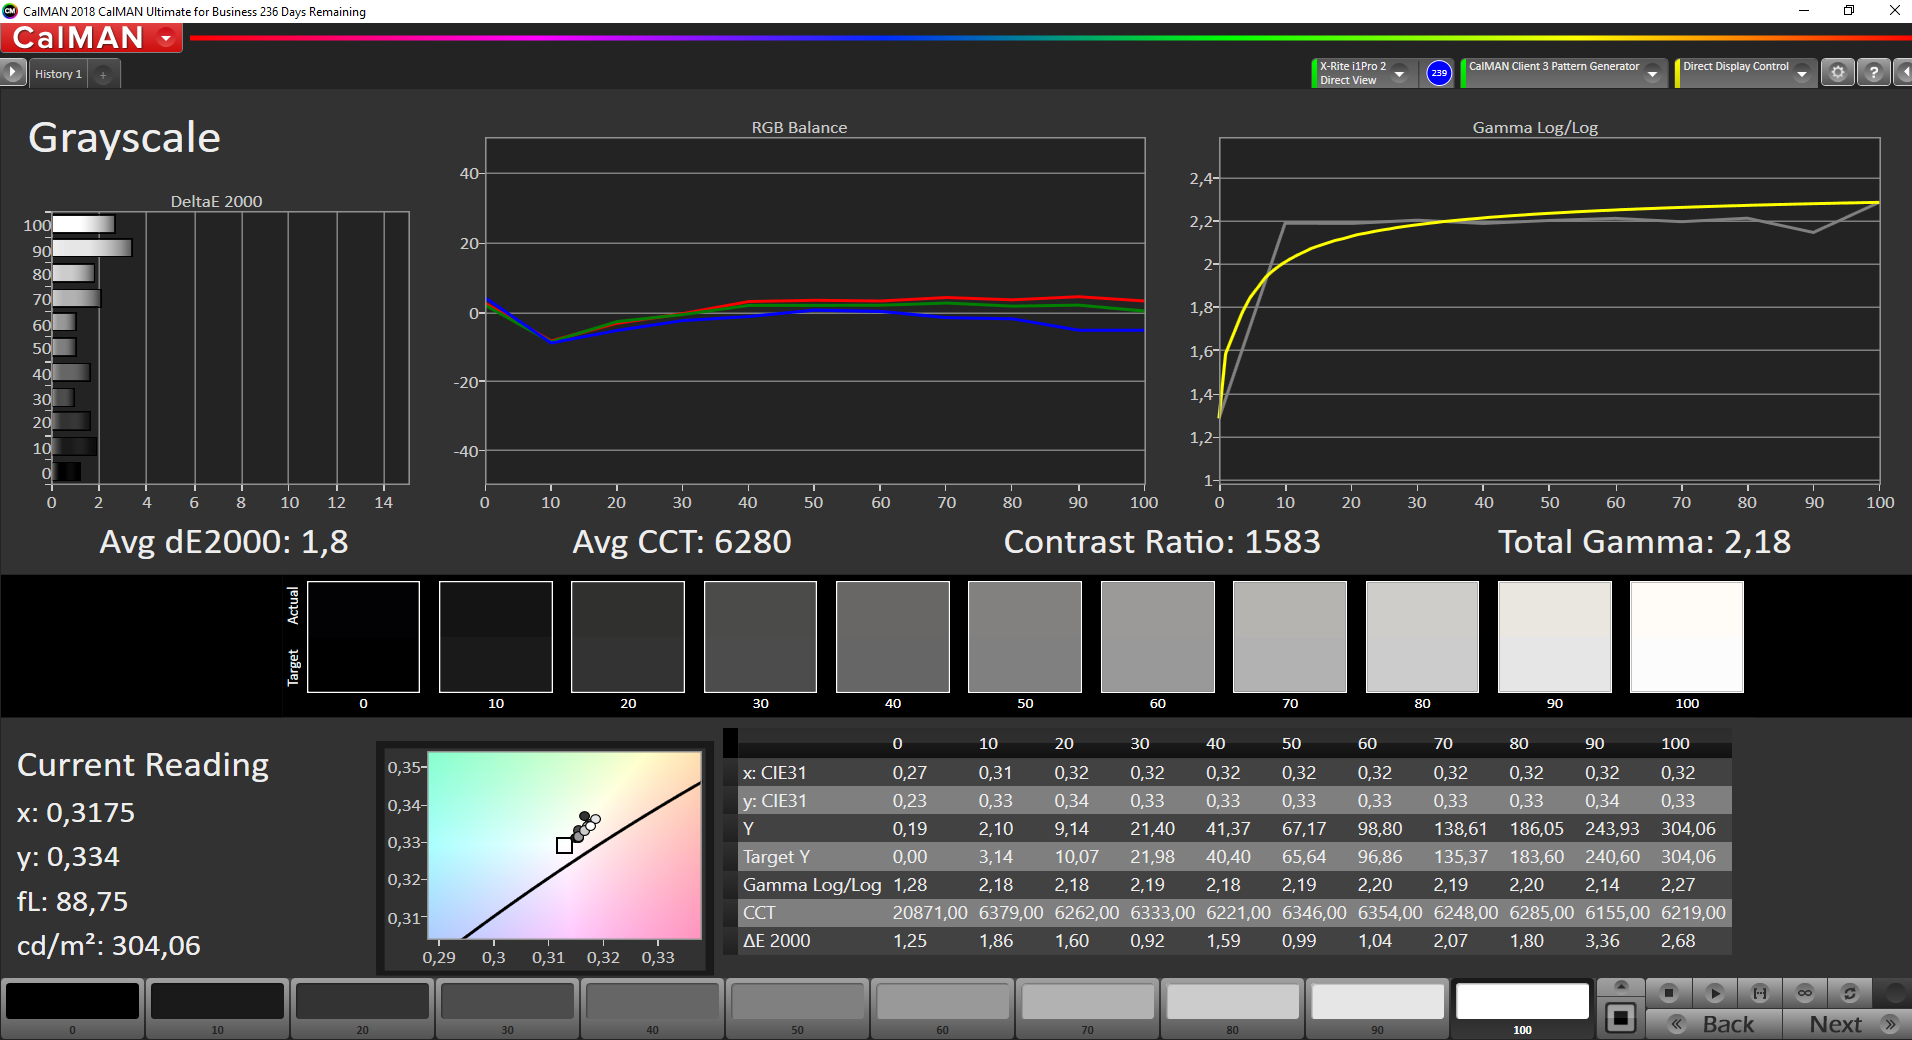
Contrast: 1500:1 (Zwart: 0.21 cd/m²)
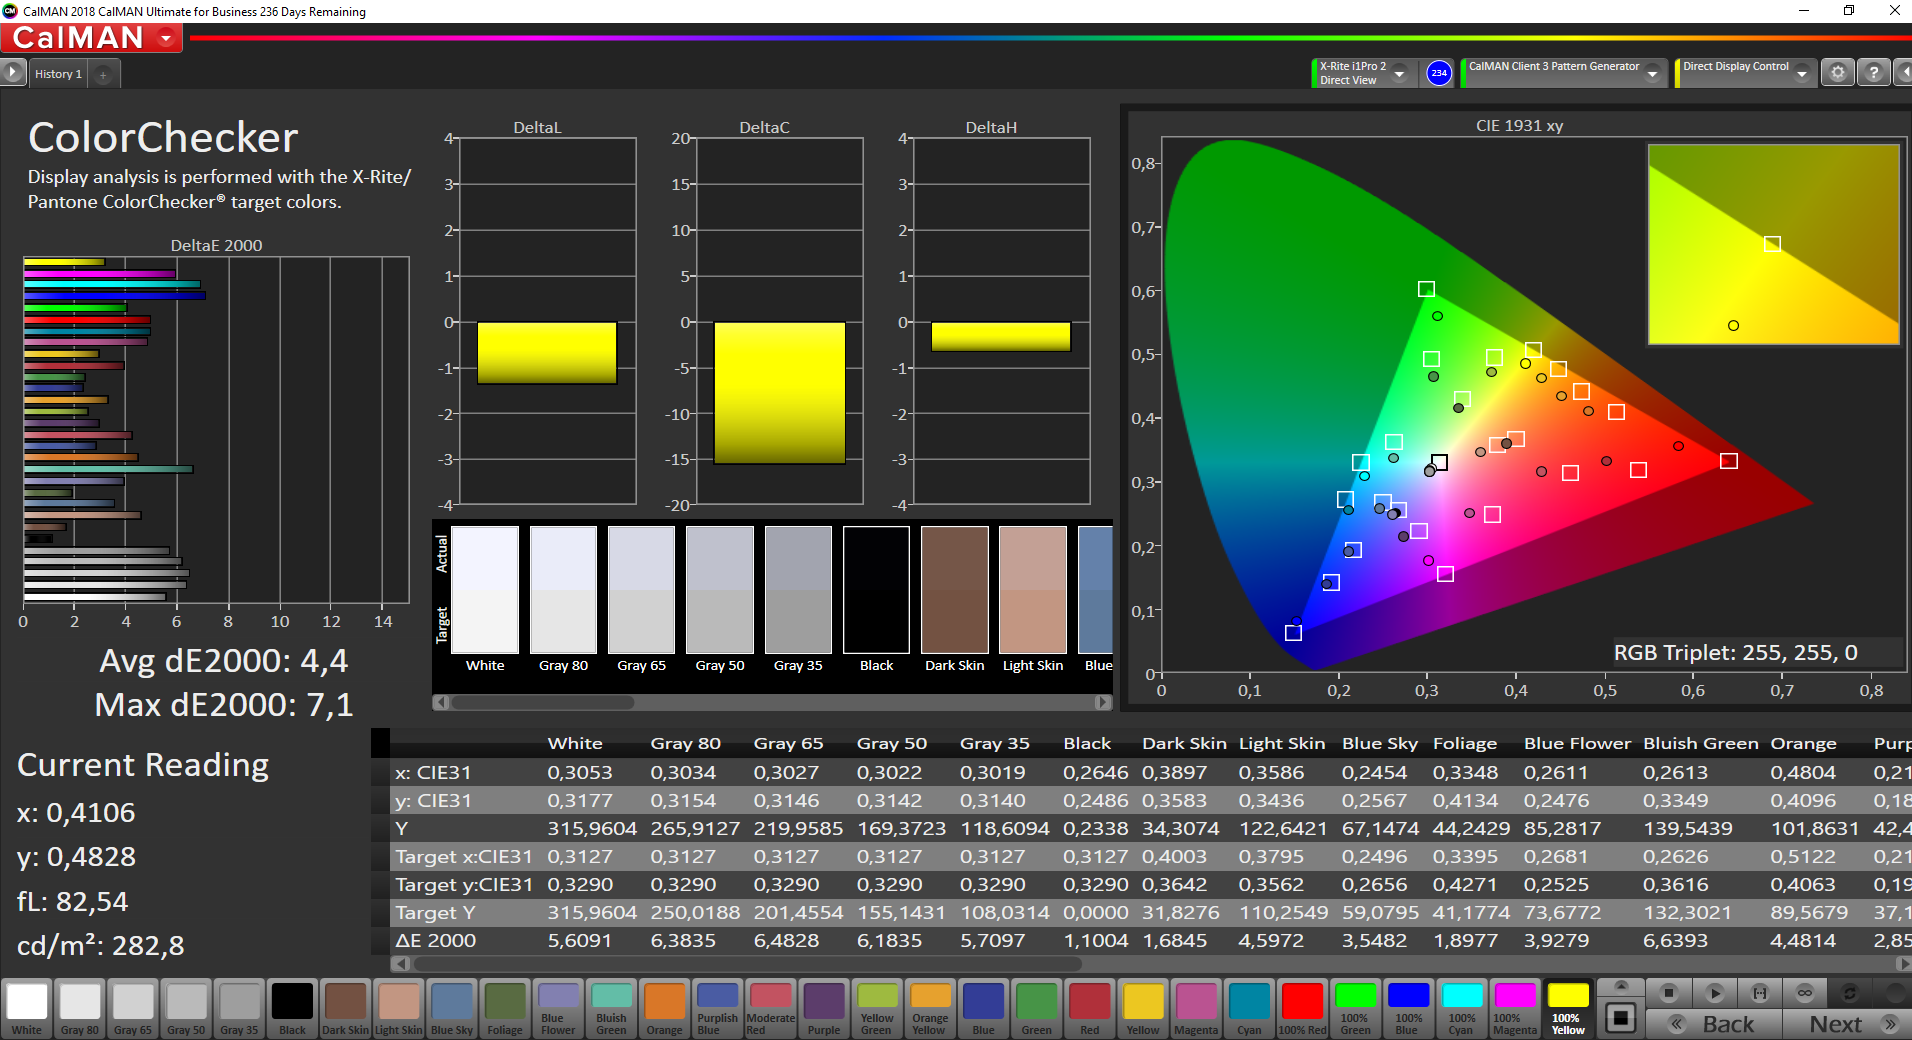
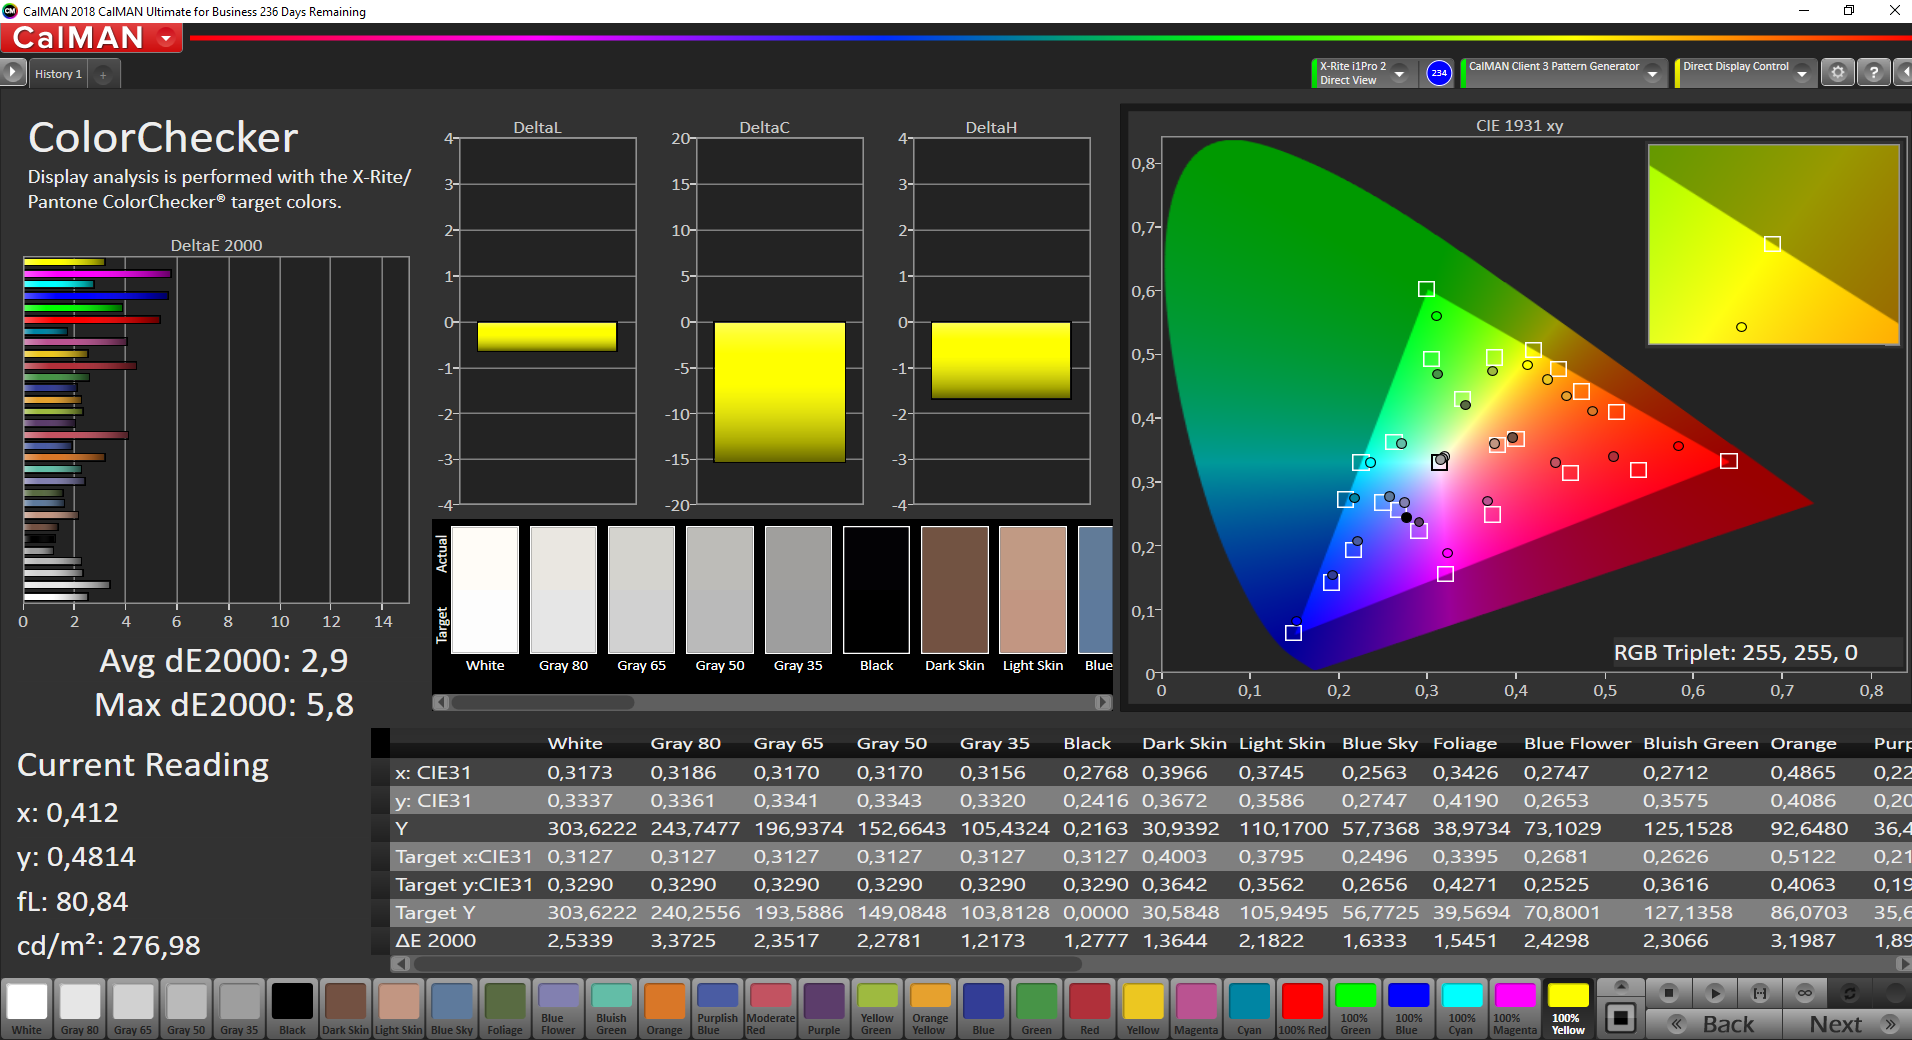
ΔE ColorChecker Calman: 4.4 | ∀{0.5-29.43 Ø4.72}
calibrated: 2.9
ΔE Greyscale Calman: 4.8 | ∀{0.09-98 Ø4.97}
69.5% sRGB (Argyll 1.6.3 3D)
44% AdobeRGB 1998 (Argyll 1.6.3 3D)
47.52% AdobeRGB 1998 (Argyll 3D)
69.3% sRGB (Argyll 3D)
46% Display P3 (Argyll 3D)
Gamma: 2.02
CCT: 7307 K
| VAIO A12-92993 InfoVision IVO04E6, , 1920x1080, 12.5" | Microsoft Surface Pro 6, Core i7, 512 GB LGPhilips LP123WQ112604, , 2736x1824, 12.3" | Dell Latitude 5290 2-in-1 SHP1479, , 1920x1280, 12.3" | Lenovo ThinkPad X1 Tablet G3-20KJ001NGE LP130QP1-SPA1, , 3000x2000, 13" | HP Elite x2 1013 G3-2TT14EA AU Optronics AUO101A, , 3000x2000, 13" | HP Spectre Folio 13t-ak000 AU Optronics AUO572D, , 1920x1080, 13.3" | |
|---|---|---|---|---|---|---|
| Display | 42% | 48% | 46% | 44% | 43% | |
| Display P3 Coverage (%) | 46 | 67.1 46% | 70.5 53% | 68.1 48% 67.8 47% | 67.5 47% | 66.2 44% |
| sRGB Coverage (%) | 69.3 | 95.5 38% | 98.6 42% | 99.4 43% 99.1 43% | 96.7 40% | 97.4 41% |
| AdobeRGB 1998 Coverage (%) | 47.52 | 67.9 43% | 71.5 50% | 69.9 47% 69.3 46% | 68.2 44% | 68.1 43% |
| Response Times | 19% | -13% | -14% | 13% | -10% | |
| Response Time Grey 50% / Grey 80% * (ms) | 52.8 ? | 43 ? 19% | 56.8 ? -8% | 47.2 ? 11% | 47 ? 11% | 52 ? 2% |
| Response Time Black / White * (ms) | 30.4 ? | 25 ? 18% | 36 ? -18% | 42.4 ? -39% | 26 ? 14% | 37.2 ? -22% |
| PWM Frequency (Hz) | 990 ? | 22000 ? | 1852 ? | |||
| Screen | 19% | 10% | 20% | 5% | 22% | |
| Brightness middle (cd/m²) | 315 | 484 54% | 548 74% | 474 50% | 452 43% | 389.8 24% |
| Brightness (cd/m²) | 294 | 473 61% | 545 85% | 418 42% | 412 40% | 396 35% |
| Brightness Distribution (%) | 89 | 91 2% | 86 -3% | 76 -15% | 85 -4% | 88 -1% |
| Black Level * (cd/m²) | 0.21 | 0.33 -57% | 0.51 -143% | 0.33 -57% | 0.48 -129% | 0.27 -29% |
| Contrast (:1) | 1500 | 1467 -2% | 1075 -28% | 1436 -4% | 942 -37% | 1444 -4% |
| Colorchecker dE 2000 * | 4.4 | 4.29 2% | 3.65 17% | 3.2 27% | 4.05 8% | 2.72 38% |
| Colorchecker dE 2000 max. * | 7.1 | 6.46 9% | 7.15 -1% | 6.1 14% | 6.64 6% | 5.49 23% |
| Colorchecker dE 2000 calibrated * | 2.9 | 1.34 54% | 1.81 38% | 0.9 69% | 1.56 46% | 1.25 57% |
| Greyscale dE 2000 * | 4.8 | 4.3 10% | 5.5 -15% | 4.5 6% | 4.87 -1% | 4.2 12% |
| Gamma | 2.02 109% | 2.51 88% | 2.154 102% | 2.07 106% | 2.71 81% | 2.1 105% |
| CCT | 7307 89% | 7315 89% | 7052 92% | 5881 111% | 7160 91% | 7470 87% |
| Color Space (Percent of AdobeRGB 1998) (%) | 44 | 62 41% | 65.2 48% | 64 45% | 62 41% | 62.2 41% |
| Color Space (Percent of sRGB) (%) | 69.5 | 95 37% | 99.1 43% | 99.4 43% | 97 40% | 98.2 41% |
| Totaal Gemiddelde (Programma / Instellingen) | 27% /
23% | 15% /
15% | 17% /
25% | 21% /
13% | 18% /
22% |
* ... kleiner is beter


Responstijd Scherm
| ↔ Responstijd Zwart naar Wit | ||
|---|---|---|
| 30.4 ms ... stijging ↗ en daling ↘ gecombineerd | ↗ 15.6 ms stijging | 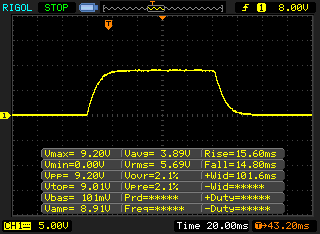 |
| ↘ 14.8 ms daling | ||
| Het scherm vertoonde trage responstijden in onze tests en is misschien te traag voor games. Ter vergelijking: alle testtoestellen variëren van 0.1 (minimum) tot 240 (maximum) ms. » 82 % van alle toestellen zijn beter. Dit betekent dat de gemeten responstijd slechter is dan het gemiddelde (19.9 ms) van alle geteste toestellen. | ||
| ↔ Responstijd 50% Grijs naar 80% Grijs | ||
| 52.8 ms ... stijging ↗ en daling ↘ gecombineerd | ↗ 24.4 ms stijging | 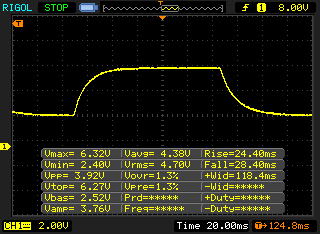 |
| ↘ 28.4 ms daling | ||
| Het scherm vertoonde trage responstijden in onze tests en is misschien te traag voor games. Ter vergelijking: alle testtoestellen variëren van 0.165 (minimum) tot 636 (maximum) ms. » 89 % van alle toestellen zijn beter. Dit betekent dat de gemeten responstijd slechter is dan het gemiddelde (31.1 ms) van alle geteste toestellen. | ||
Screen Flickering / PWM (Pulse-Width Modulation)
| Screen flickering / PWM waargenomen | 990 Hz | ≤ 99 % helderheid instelling | 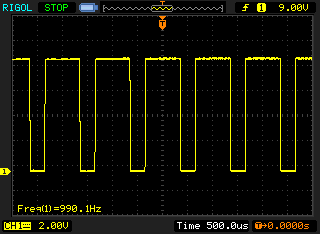 |
De achtergrondverlichting van het scherm flikkert op 990 Hz (in het slechtste geval, bijvoorbeeld bij gebruik van PWM) aan een helderheid van 99 % en lager. Boven deze helderheid zou er geen flickering / PWM mogen optreden. De frequentie van 990 Hz is redelijk hoog en de meeste mensen die gevoelig zijn aan flickering zouden dit dus niet mogen waarnemen of geïrriteerde ogen krijgen. Ter vergelijking: 52 % van alle geteste toestellen maakten geen gebruik van PWM om de schermhelderheid te verlagen. Als het wel werd gebruikt, werd een gemiddelde van 7784 (minimum: 5 - maximum: 343500) Hz waargenomen. | |||
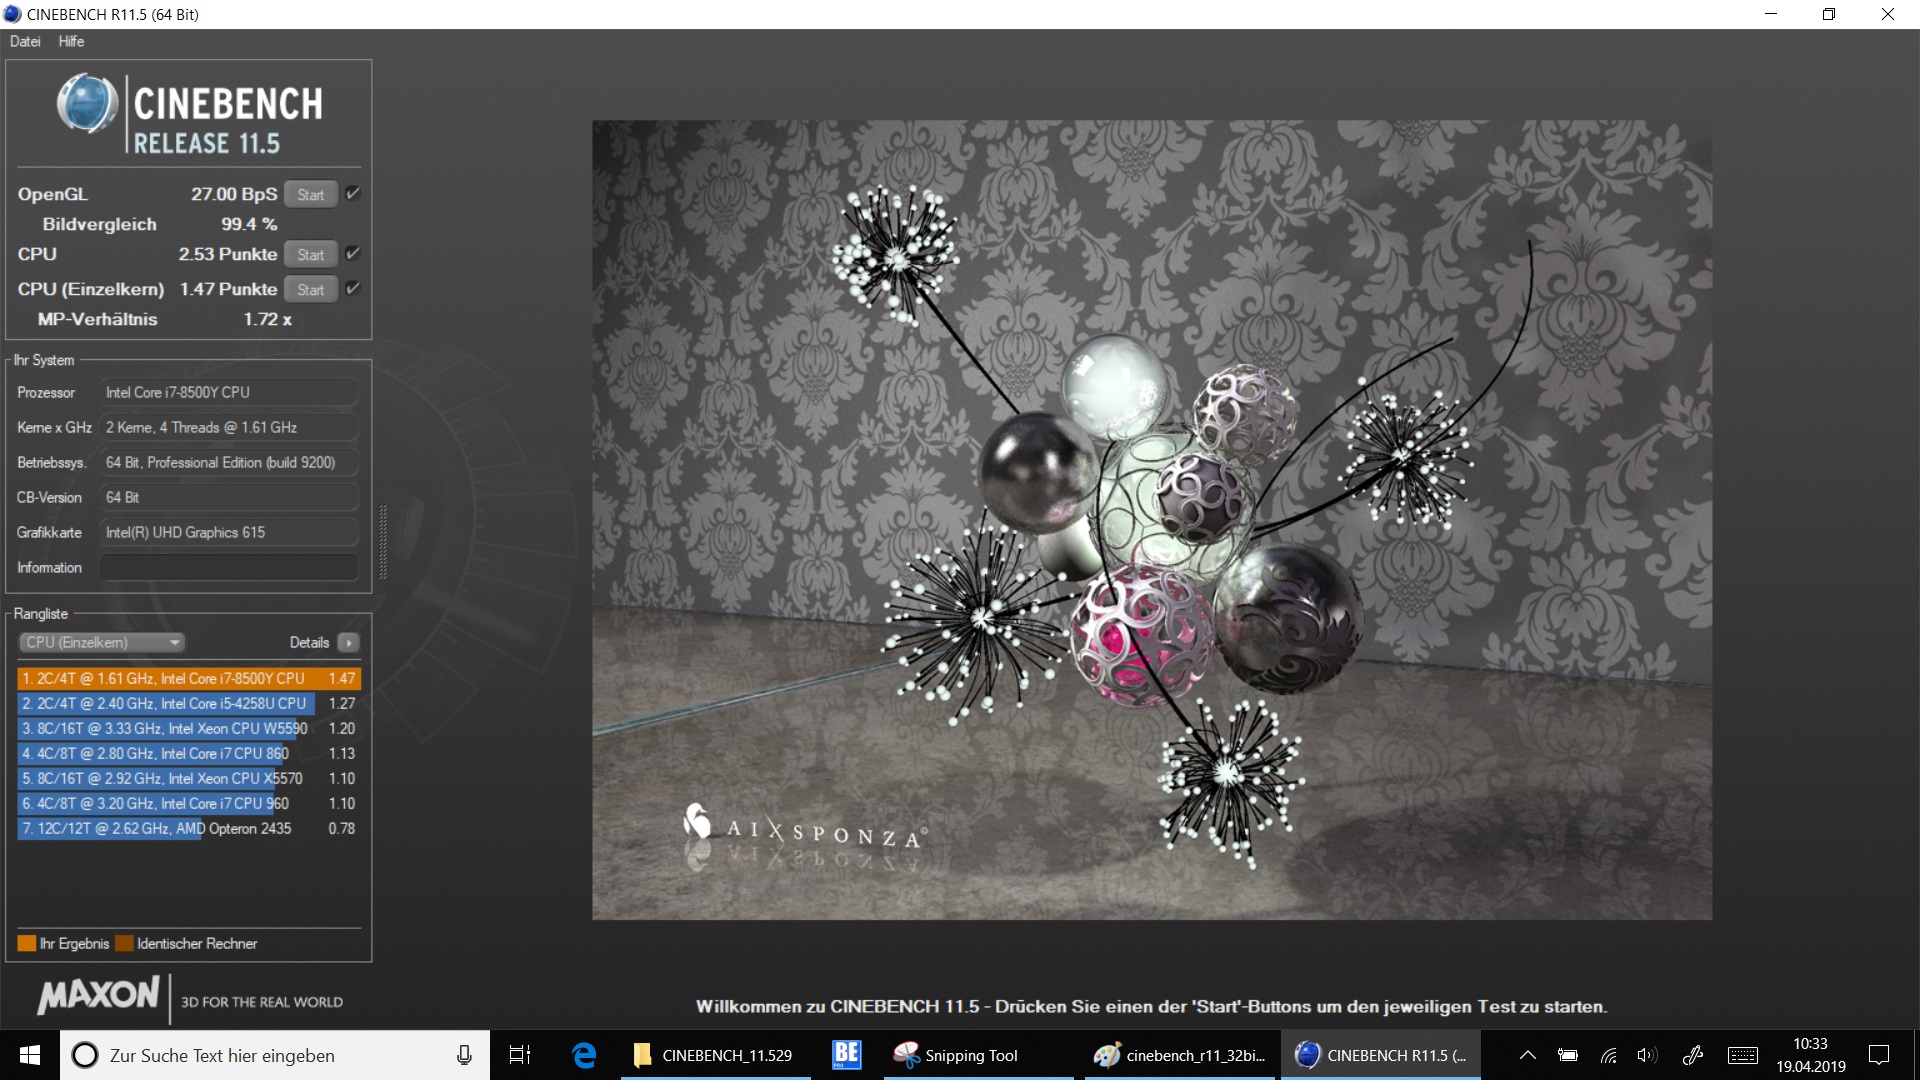
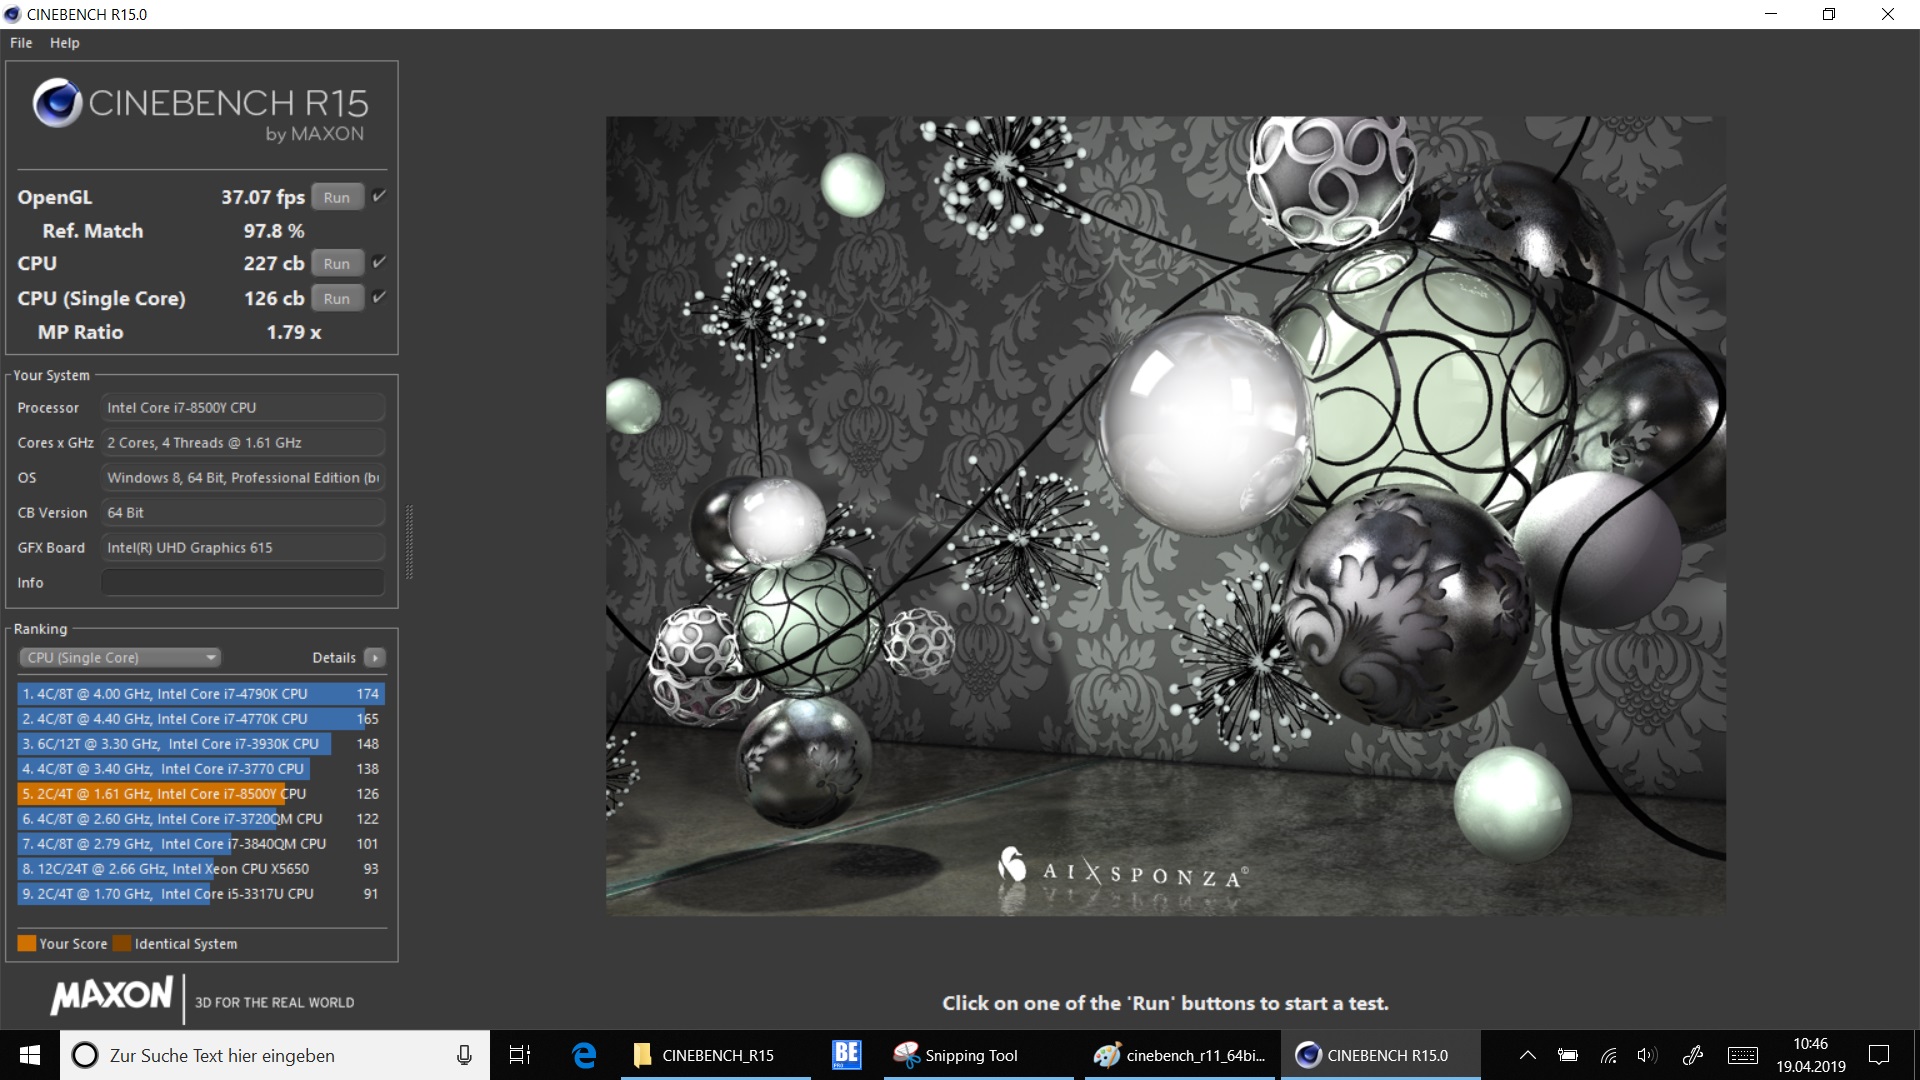
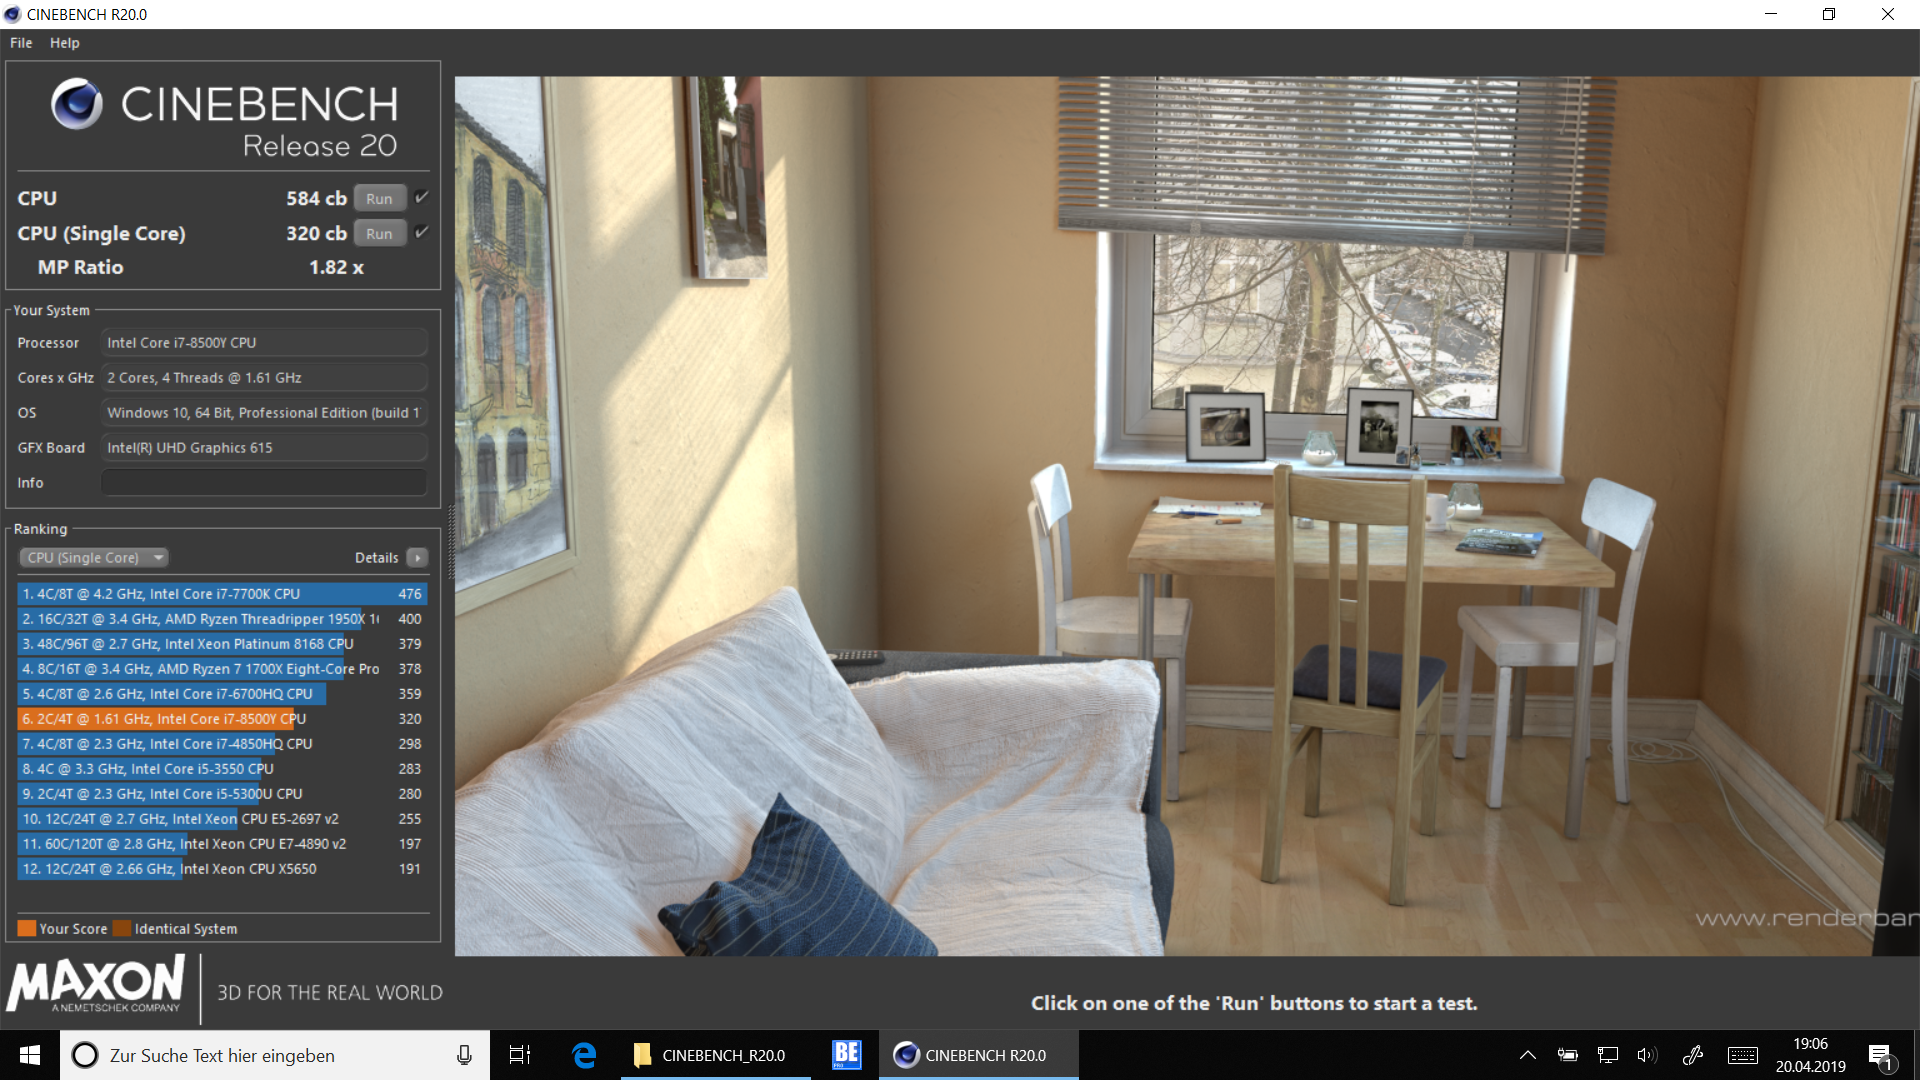
| Cinebench R20 | |
| CPU (Single Core) | |
| Gemiddelde van klas Convertible (273 - 834, n=50, laatste 2 jaar) | |
| VAIO A12-92993 | |
| Gemiddeld Intel Core i7-8500Y (304 - 320, n=2) | |
| CPU (Multi Core) | |
| Gemiddelde van klas Convertible (595 - 12102, n=50, laatste 2 jaar) | |
| Gemiddeld Intel Core i7-8500Y (584 - 591, n=2) | |
| VAIO A12-92993 | |
| HWBOT x265 Benchmark v2.2 - 4k Preset | |
| Gemiddelde van klas Convertible (3.43 - 36.2, n=49, laatste 2 jaar) | |
| VAIO A12-92993 | |
| Gemiddeld Intel Core i7-8500Y (n=1) | |
| Blender - v2.79 BMW27 CPU | |
| HP Spectre Folio 13t-ak000 | |
| Gemiddeld Intel Core i7-8500Y (1772 - 2159, n=2) | |
| VAIO A12-92993 | |
| Gemiddelde van klas Convertible (105 - 1051, n=49, laatste 2 jaar) | |
* ... kleiner is beter
| PCMark 8 Home Score Accelerated v2 | 3493 punten | |
| PCMark 8 Creative Score Accelerated v2 | 4126 punten | |
| PCMark 8 Work Score Accelerated v2 | 4700 punten | |
| PCMark 10 Score | 3161 punten | |
Help | ||
| VAIO A12-92993 Samsung SSD PM981 MZVLB512HAJQ | Microsoft Surface Pro 6, Core i7, 512 GB Toshiba KBG30ZPZ512G | Dell Latitude 5290 2-in-1 Toshiba XG5 KXG50ZNV256G | Lenovo ThinkPad X1 Tablet G3-20KJ001NGE Samsung PM961 MZVLW256HEHP | HP Elite x2 1013 G3-2TT14EA Samsung PM961 MZVLW256HEHP | HP Spectre Folio 13t-ak000 Samsung PM961 MZVLW256HEHP | Gemiddeld Samsung SSD PM981 MZVLB512HAJQ | |
|---|---|---|---|---|---|---|---|
| CrystalDiskMark 5.2 / 6 | -40% | -27% | -3% | -16% | -17% | 39% | |
| Write 4K (MB/s) | 113.9 | 83.2 -27% | 121.7 7% | 95.4 -16% | 91 -20% | 140 23% | 126.7 ? 11% |
| Read 4K (MB/s) | 46.8 | 43.84 -6% | 32.66 -30% | 39.19 -16% | 36.84 -21% | 52.4 12% | 44 ? -6% |
| Write Seq (MB/s) | 1868 | 636 -66% | 359.3 -81% | 1197 -36% | 948 -49% | 1617 ? -13% | |
| Read Seq (MB/s) | 2226 | 900 -60% | 1463 -34% | 1705 -23% | 922 -59% | 1716 ? -23% | |
| Write 4K Q32T1 (MB/s) | 313.4 | 192.9 -38% | 353.6 13% | 399.2 27% | 355.8 14% | 227.8 -27% | 413 ? 32% |
| Read 4K Q32T1 (MB/s) | 284.6 | 247.4 -13% | 387 36% | 260.7 -8% | 256.9 -10% | 299.2 5% | 420 ? 48% |
| Write Seq Q32T1 (MB/s) | 1881 | 861 -54% | 358.1 -81% | 1287 -32% | 1222 -35% | 1259 -33% | 2076 ? 10% |
| Read Seq Q32T1 (MB/s) | 3402 | 1615 -53% | 1779 -48% | 3025 -11% | 3460 2% | 3112 -9% | 3130 ? -8% |
| Write 4K Q8T8 (MB/s) | 410.2 | 381 -7% | 1264 ? 208% | ||||
| Read 4K Q8T8 (MB/s) | 527 | 750 42% | 1193 ? 126% | ||||
| AS SSD | -146% | -58% | -25% | -37% | -4% | -1% | |
| Seq Read (MB/s) | 2650 | 1154 -56% | 1385 -48% | 2243 -15% | 2062 -22% | 1693 -36% | 1976 ? -25% |
| Seq Write (MB/s) | 1328 | 393.6 -70% | 302.1 -77% | 847 -36% | 832 -37% | 1214 -9% | 1637 ? 23% |
| 4K Read (MB/s) | 56.8 | 34.42 -39% | 30.97 -45% | 42.48 -25% | 41.45 -27% | 42.69 -25% | 50.5 ? -11% |
| 4K Write (MB/s) | 142.5 | 68.9 -52% | 102.7 -28% | 112.2 -21% | 91.1 -36% | 95.9 -33% | 112 ? -21% |
| 4K-64 Read (MB/s) | 1316 | 494.1 -62% | 472.7 -64% | 741 -44% | 669 -49% | 1621 23% | 1203 ? -9% |
| 4K-64 Write (MB/s) | 767 | 171.3 -78% | 411.2 -46% | 597 -22% | 596 -22% | 605 -21% | 1504 ? 96% |
| Access Time Read * (ms) | 0.04 | 0.213 -433% | 0.082 -105% | 0.041 -2% | 0.063 -58% | 0.051 -27% | 0.05092 ? -27% |
| Access Time Write * (ms) | 0.029 | 0.3 -934% | 0.053 -83% | 0.032 -10% | 0.041 -41% | 0.037 -28% | 0.08337 ? -187% |
| Score Read (Points) | 1638 | 644 -61% | 642 -61% | 1008 -38% | 917 -44% | 1833 12% | 1451 ? -11% |
| Score Write (Points) | 1042 | 280 -73% | 544 -48% | 794 -24% | 770 -26% | 823 -21% | 1780 ? 71% |
| Score Total (Points) | 3462 | 1225 -65% | 1469 -58% | 2257 -35% | 2105 -39% | 3569 3% | 3966 ? 15% |
| Copy ISO MB/s (MB/s) | 1941 | 985 -49% | 512 -74% | 761 -61% | 1374 -29% | 1755 ? -10% | |
| Copy Program MB/s (MB/s) | 273.1 | 143.1 -48% | 226.9 -17% | 237.3 -13% | 631 131% | 454 ? 66% | |
| Copy Game MB/s (MB/s) | 876 | 676 -23% | 317.3 -64% | 512 -42% | 971 11% | 1057 ? 21% | |
| Totaal Gemiddelde (Programma / Instellingen) | -93% /
-107% | -43% /
-47% | -14% /
-15% | -27% /
-29% | -11% /
-8% | 19% /
16% |
* ... kleiner is beter

| 3DMark 11 Performance | 1291 punten | |
| 3DMark Ice Storm Standard Score | 41219 punten | |
| 3DMark Cloud Gate Standard Score | 5622 punten | |
| 3DMark Fire Strike Score | 858 punten | |
| 3DMark Fire Strike Extreme Score | 420 punten | |
| 3DMark Time Spy Score | 328 punten | |
Help | ||
(±) De maximumtemperatuur aan de bovenzijde bedraagt 42.4 °C / 108 F, vergeleken met het gemiddelde van 35.4 °C / 96 F, variërend van 19.6 tot 60 °C voor de klasse Convertible.
(-) De bodem warmt op tot een maximum van 47.1 °C / 117 F, vergeleken met een gemiddelde van 36.9 °C / 98 F
(+) Bij onbelast gebruik bedraagt de gemiddelde temperatuur voor de bovenzijde 24.7 °C / 76 F, vergeleken met het apparaatgemiddelde van 30.3 °C / 87 F.
(-) De palmsteunen en het touchpad kunnen zeer heet aanvoelen met een maximum van ###max## °C / 108.3 F.
(-) De gemiddelde temperatuur van de handpalmsteun van soortgelijke toestellen bedroeg 28 °C / 82.4 F (-14.4 °C / -25.9 F).
| VAIO A12-92993 UHD Graphics 615, i7-8500Y, Samsung SSD PM981 MZVLB512HAJQ | Microsoft Surface Pro 6, Core i7, 512 GB UHD Graphics 620, i7-8650U, Toshiba KBG30ZPZ512G | Dell Latitude 5290 2-in-1 UHD Graphics 620, i5-8350U, Toshiba XG5 KXG50ZNV256G | Lenovo ThinkPad X1 Tablet G3-20KJ001NGE UHD Graphics 620, i5-8250U, Samsung PM961 MZVLW256HEHP | HP Elite x2 1013 G3-2TT14EA UHD Graphics 620, i5-8350U, Samsung PM961 MZVLW256HEHP | HP Spectre Folio 13t-ak000 UHD Graphics 615, i7-8500Y, Samsung PM961 MZVLW256HEHP | |
|---|---|---|---|---|---|---|
| Heat | -9% | -15% | -7% | -21% | -18% | |
| Maximum Upper Side * (°C) | 42.4 | 40.4 5% | 44.4 -5% | 44.3 -4% | 49.4 -17% | 44.2 -4% |
| Maximum Bottom * (°C) | 47.1 | 43.8 7% | 52 -10% | 48.9 -4% | 47.1 -0% | 48.2 -2% |
| Idle Upper Side * (°C) | 26.6 | 33.5 -26% | 32 -20% | 30 -13% | 38 -43% | 33 -24% |
| Idle Bottom * (°C) | 24.9 | 30.2 -21% | 31.2 -25% | 26.6 -7% | 30.8 -24% | 35.6 -43% |
* ... kleiner is beter
VAIO A12-92993 audioanalyse
(±) | luidspreker luidheid is gemiddeld maar goed (74.8 dB)
Bas 100 - 315 Hz
(-) | bijna geen lage tonen - gemiddeld 26% lager dan de mediaan
(+) | de lage tonen zijn lineair (2.9% delta naar de vorige frequentie)
Midden 400 - 2000 Hz
(±) | hogere middens - gemiddeld 9.1% hoger dan de mediaan
(-) | de middentonen zijn niet lineair (15.3% delta ten opzichte van de vorige frequentie)
Hoog 2 - 16 kHz
(±) | higher highs - on average 12.9% higher than median
(±) | lineariteit van de hoogtepunten is gemiddeld (12.4% delta ten opzichte van de vorige frequentie)
Algemeen 100 - 16.000 Hz
(-) | het totale geluid is niet lineair (47.7% verschil met de mediaan)
Vergeleken met dezelfde klasse
» 99% van alle geteste apparaten in deze klasse waren beter, 0% vergelijkbaar, 0% slechter
» De beste had een delta van 6%, het gemiddelde was 20%, de slechtste was 57%
Vergeleken met alle geteste toestellen
» 96% van alle geteste apparaten waren beter, 0% gelijk, 4% slechter
» De beste had een delta van 4%, het gemiddelde was 24%, de slechtste was 134%
HP Spectre Folio 13t-ak000 audioanalyse
(-) | niet erg luide luidsprekers (68.3 dB)
Bas 100 - 315 Hz
(-) | bijna geen lage tonen - gemiddeld 21.7% lager dan de mediaan
(±) | lineariteit van de lage tonen is gemiddeld (11.9% delta ten opzichte van de vorige frequentie)
Midden 400 - 2000 Hz
(+) | evenwichtige middens - slechts 4% verwijderd van de mediaan
(±) | lineariteit van de middentonen is gemiddeld (8.6% delta ten opzichte van de vorige frequentie)
Hoog 2 - 16 kHz
(+) | evenwichtige hoogtepunten - slechts 3.6% verwijderd van de mediaan
(±) | lineariteit van de hoogtepunten is gemiddeld (8.3% delta ten opzichte van de vorige frequentie)
Algemeen 100 - 16.000 Hz
(±) | lineariteit van het totale geluid is gemiddeld (27.2% verschil met de mediaan)
Vergeleken met dezelfde klasse
» 83% van alle geteste apparaten in deze klasse waren beter, 4% vergelijkbaar, 13% slechter
» De beste had een delta van 6%, het gemiddelde was 20%, de slechtste was 57%
Vergeleken met alle geteste toestellen
» 83% van alle geteste apparaten waren beter, 4% gelijk, 13% slechter
» De beste had een delta van 4%, het gemiddelde was 24%, de slechtste was 134%
| Uit / Standby | |
| Inactief | |
| Belasting |
|
Key:
min: | |
| VAIO A12-92993 i7-8500Y, UHD Graphics 615, Samsung SSD PM981 MZVLB512HAJQ, IPS, 1920x1080, 12.5" | Microsoft Surface Pro 6, Core i7, 512 GB i7-8650U, UHD Graphics 620, Toshiba KBG30ZPZ512G, IPS, 2736x1824, 12.3" | Dell Latitude 5290 2-in-1 i5-8350U, UHD Graphics 620, Toshiba XG5 KXG50ZNV256G, IPS, 1920x1280, 12.3" | Lenovo ThinkPad X1 Tablet G3-20KJ001NGE i5-8250U, UHD Graphics 620, Samsung PM961 MZVLW256HEHP, IPS, 3000x2000, 13" | HP Elite x2 1013 G3-2TT14EA i5-8350U, UHD Graphics 620, Samsung PM961 MZVLW256HEHP, IPS, 3000x2000, 13" | HP Spectre Folio 13t-ak000 i7-8500Y, UHD Graphics 615, Samsung PM961 MZVLW256HEHP, IPS, 1920x1080, 13.3" | Gemiddeld Intel UHD Graphics 615 | Gemiddelde van klas Convertible | |
|---|---|---|---|---|---|---|---|---|
| Power Consumption | -29% | -28% | -63% | -38% | 4% | 7% | -56% | |
| Idle Minimum * (Watt) | 4.4 | 3.2 27% | 3 32% | 4.8 -9% | 4.9 -11% | 1.8 59% | 3.55 ? 19% | 4.24 ? 4% |
| Idle Average * (Watt) | 6.5 | 8.7 -34% | 7.2 -11% | 9 -38% | 8.9 -37% | 3.8 42% | 6.17 ? 5% | 7.03 ? -8% |
| Idle Maximum * (Watt) | 7.1 | 10.4 -46% | 10 -41% | 10.5 -48% | 11 -55% | 7.7 -8% | 7.61 ? -7% | 8.61 ? -21% |
| Load Average * (Watt) | 20.2 | 29.2 -45% | 37.1 -84% | 42.8 -112% | 32 -58% | 26.9 -33% | 18.2 ? 10% | 43.9 ? -117% |
| Load Maximum * (Watt) | 28 | 40.8 -46% | 38.2 -36% | 57.8 -106% | 36 -29% | 38.5 -38% | 25.4 ? 9% | 67.2 ? -140% |
* ... kleiner is beter
| VAIO A12-92993 i7-8500Y, UHD Graphics 615, 23.4 Wh | Microsoft Surface Pro 6, Core i7, 512 GB i7-8650U, UHD Graphics 620, 45 Wh | Dell Latitude 5290 2-in-1 i5-8350U, UHD Graphics 620, 42 Wh | Lenovo ThinkPad X1 Tablet G3-20KJ001NGE i5-8250U, UHD Graphics 620, 42 Wh | HP Elite x2 1013 G3-2TT14EA i5-8350U, UHD Graphics 620, 50 Wh | HP Spectre Folio 13t-ak000 i7-8500Y, UHD Graphics 615, 54.28 Wh | Gemiddelde van klas Convertible | |
|---|---|---|---|---|---|---|---|
| Batterijduur | 55% | -22% | 42% | 45% | 160% | 154% | |
| Reader / Idle (h) | 8.6 | 18.1 110% | 13.2 53% | 13 51% | 31.4 265% | 27.7 ? 222% | |
| H.264 (h) | 3.7 | 8.7 135% | 6.5 76% | 15.3 ? 314% | |||
| WiFi v1.3 (h) | 7.2 | 8.5 18% | 5 -31% | 6.6 -8% | 7.7 7% | 14.2 97% | 12.1 ? 68% |
| Load (h) | 1.6 | 2.2 38% | 1.4 -13% | 1.4 -13% | 2.3 44% | 3.5 119% | 1.779 ? 11% |
Pro
Contra

Dit is de verkorte versie van het originele artikel. Het volledige, Engelse testrapport vind je hier.
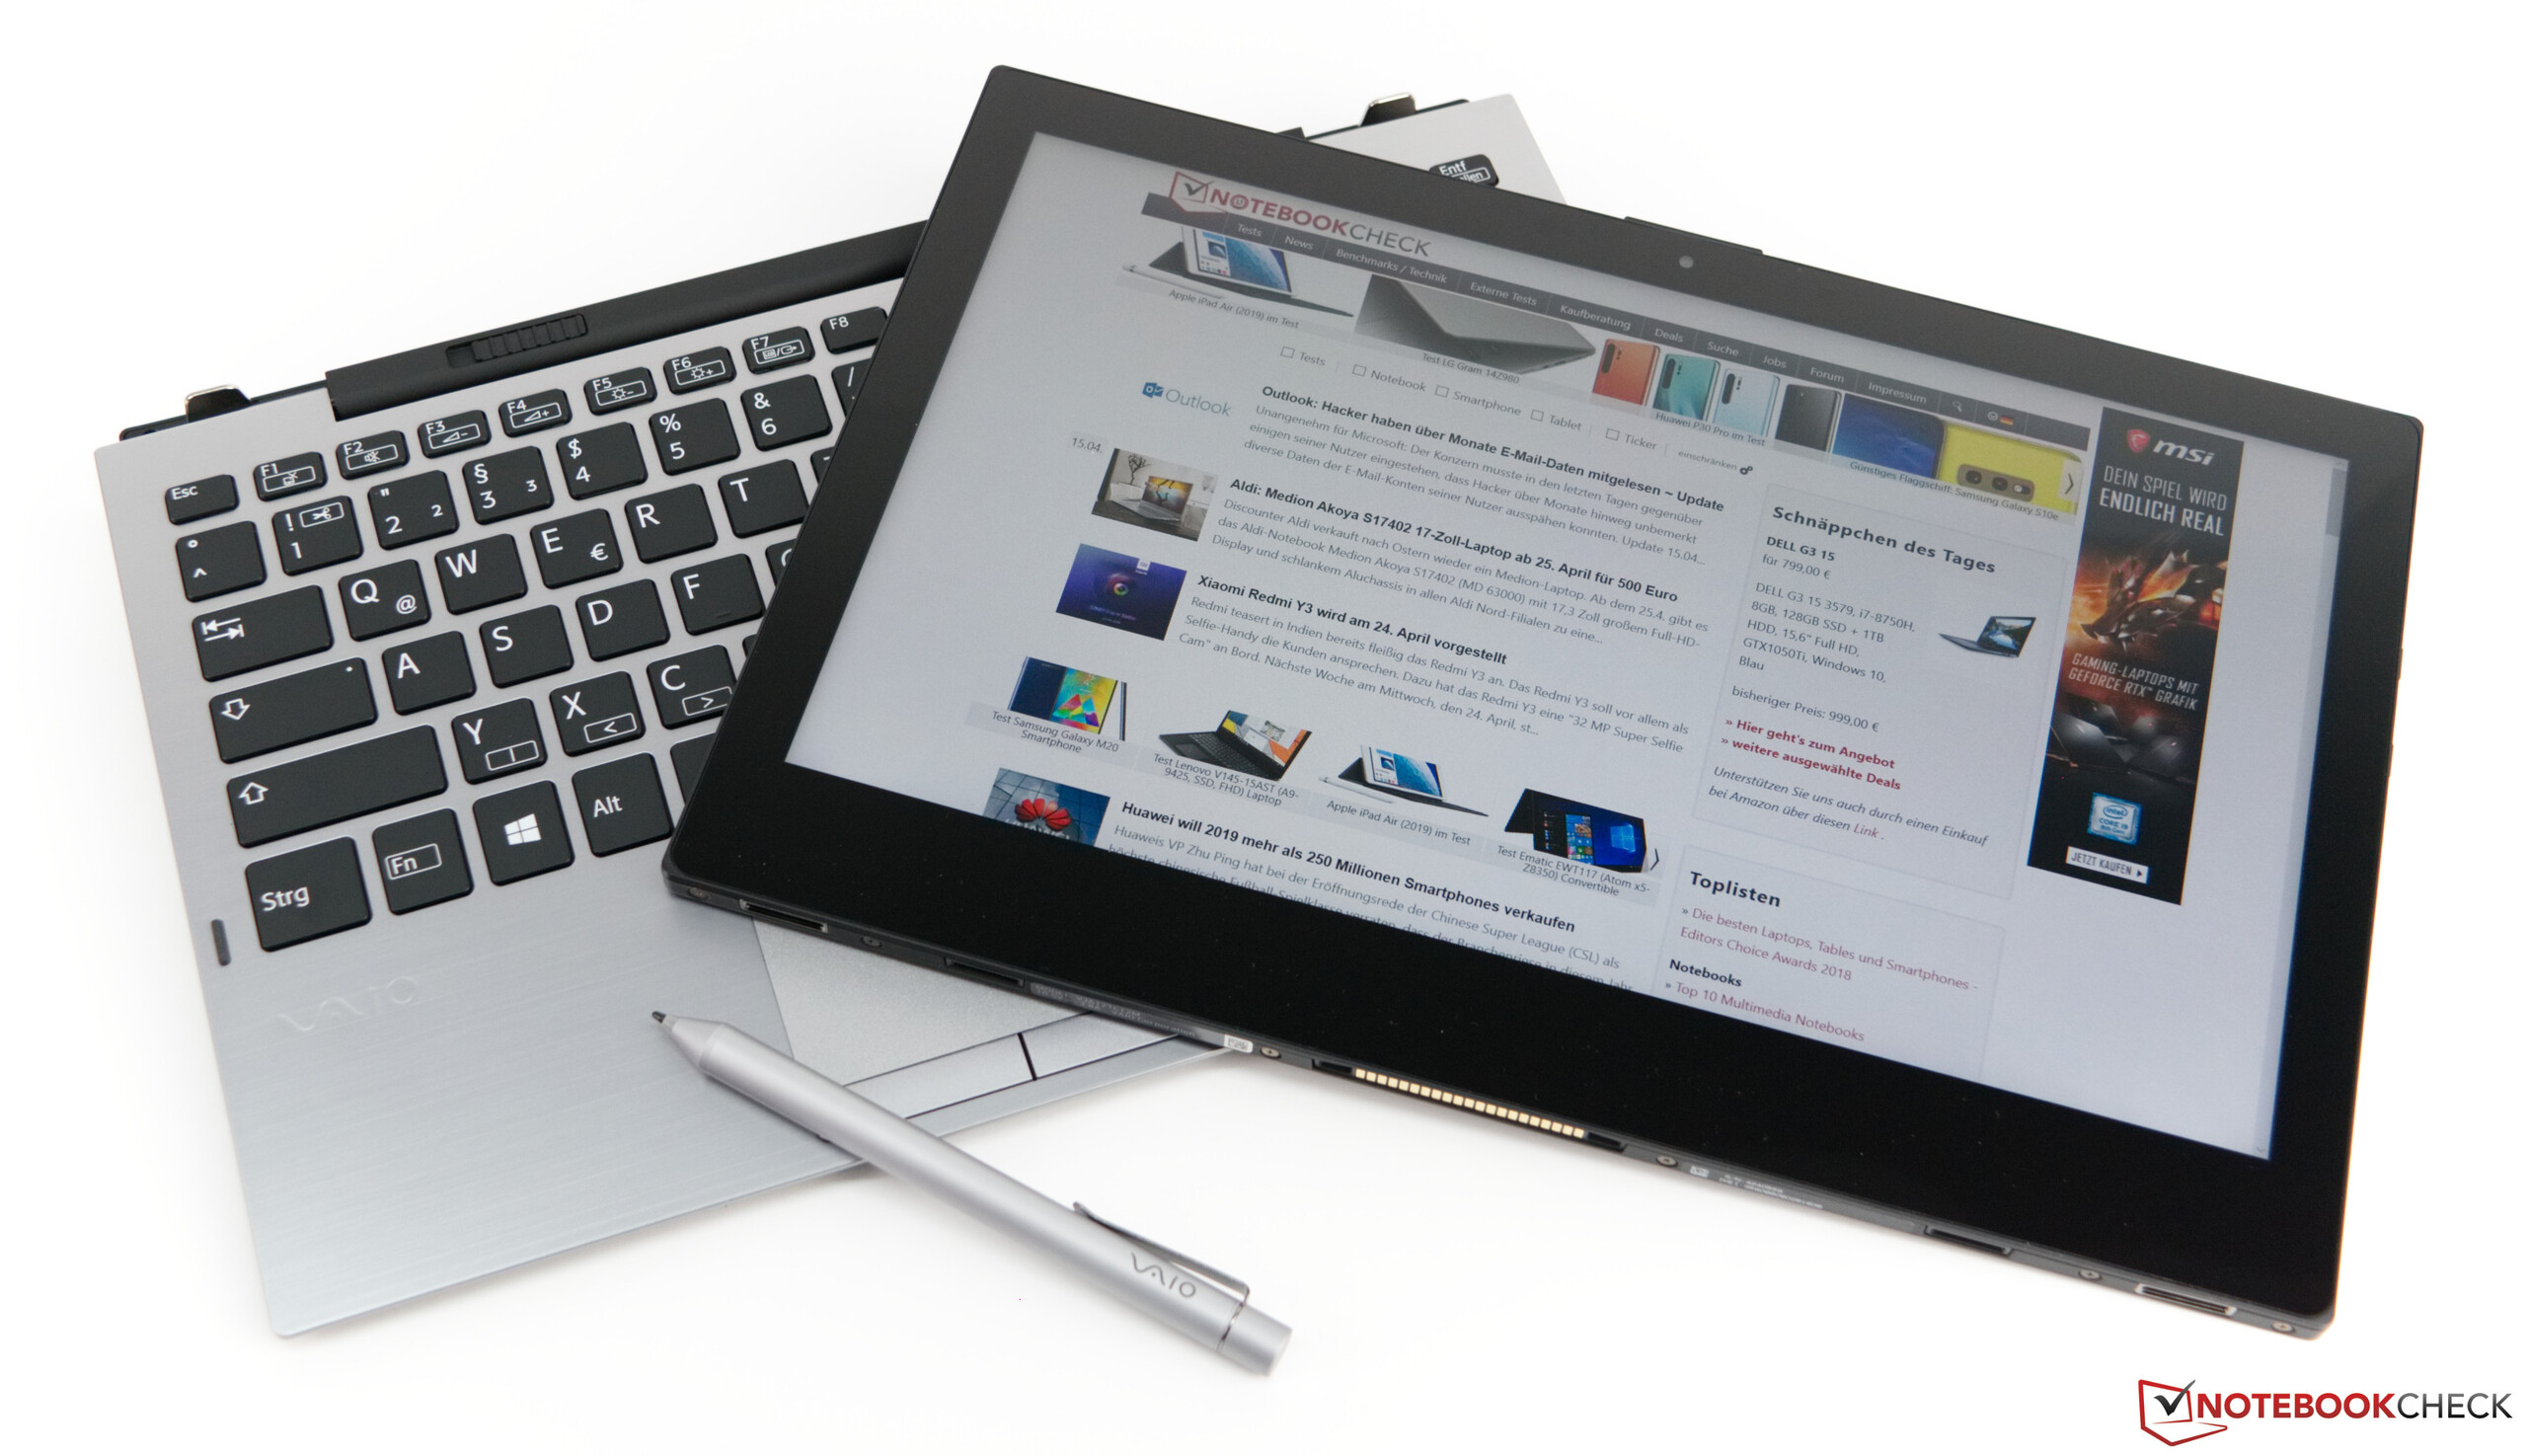
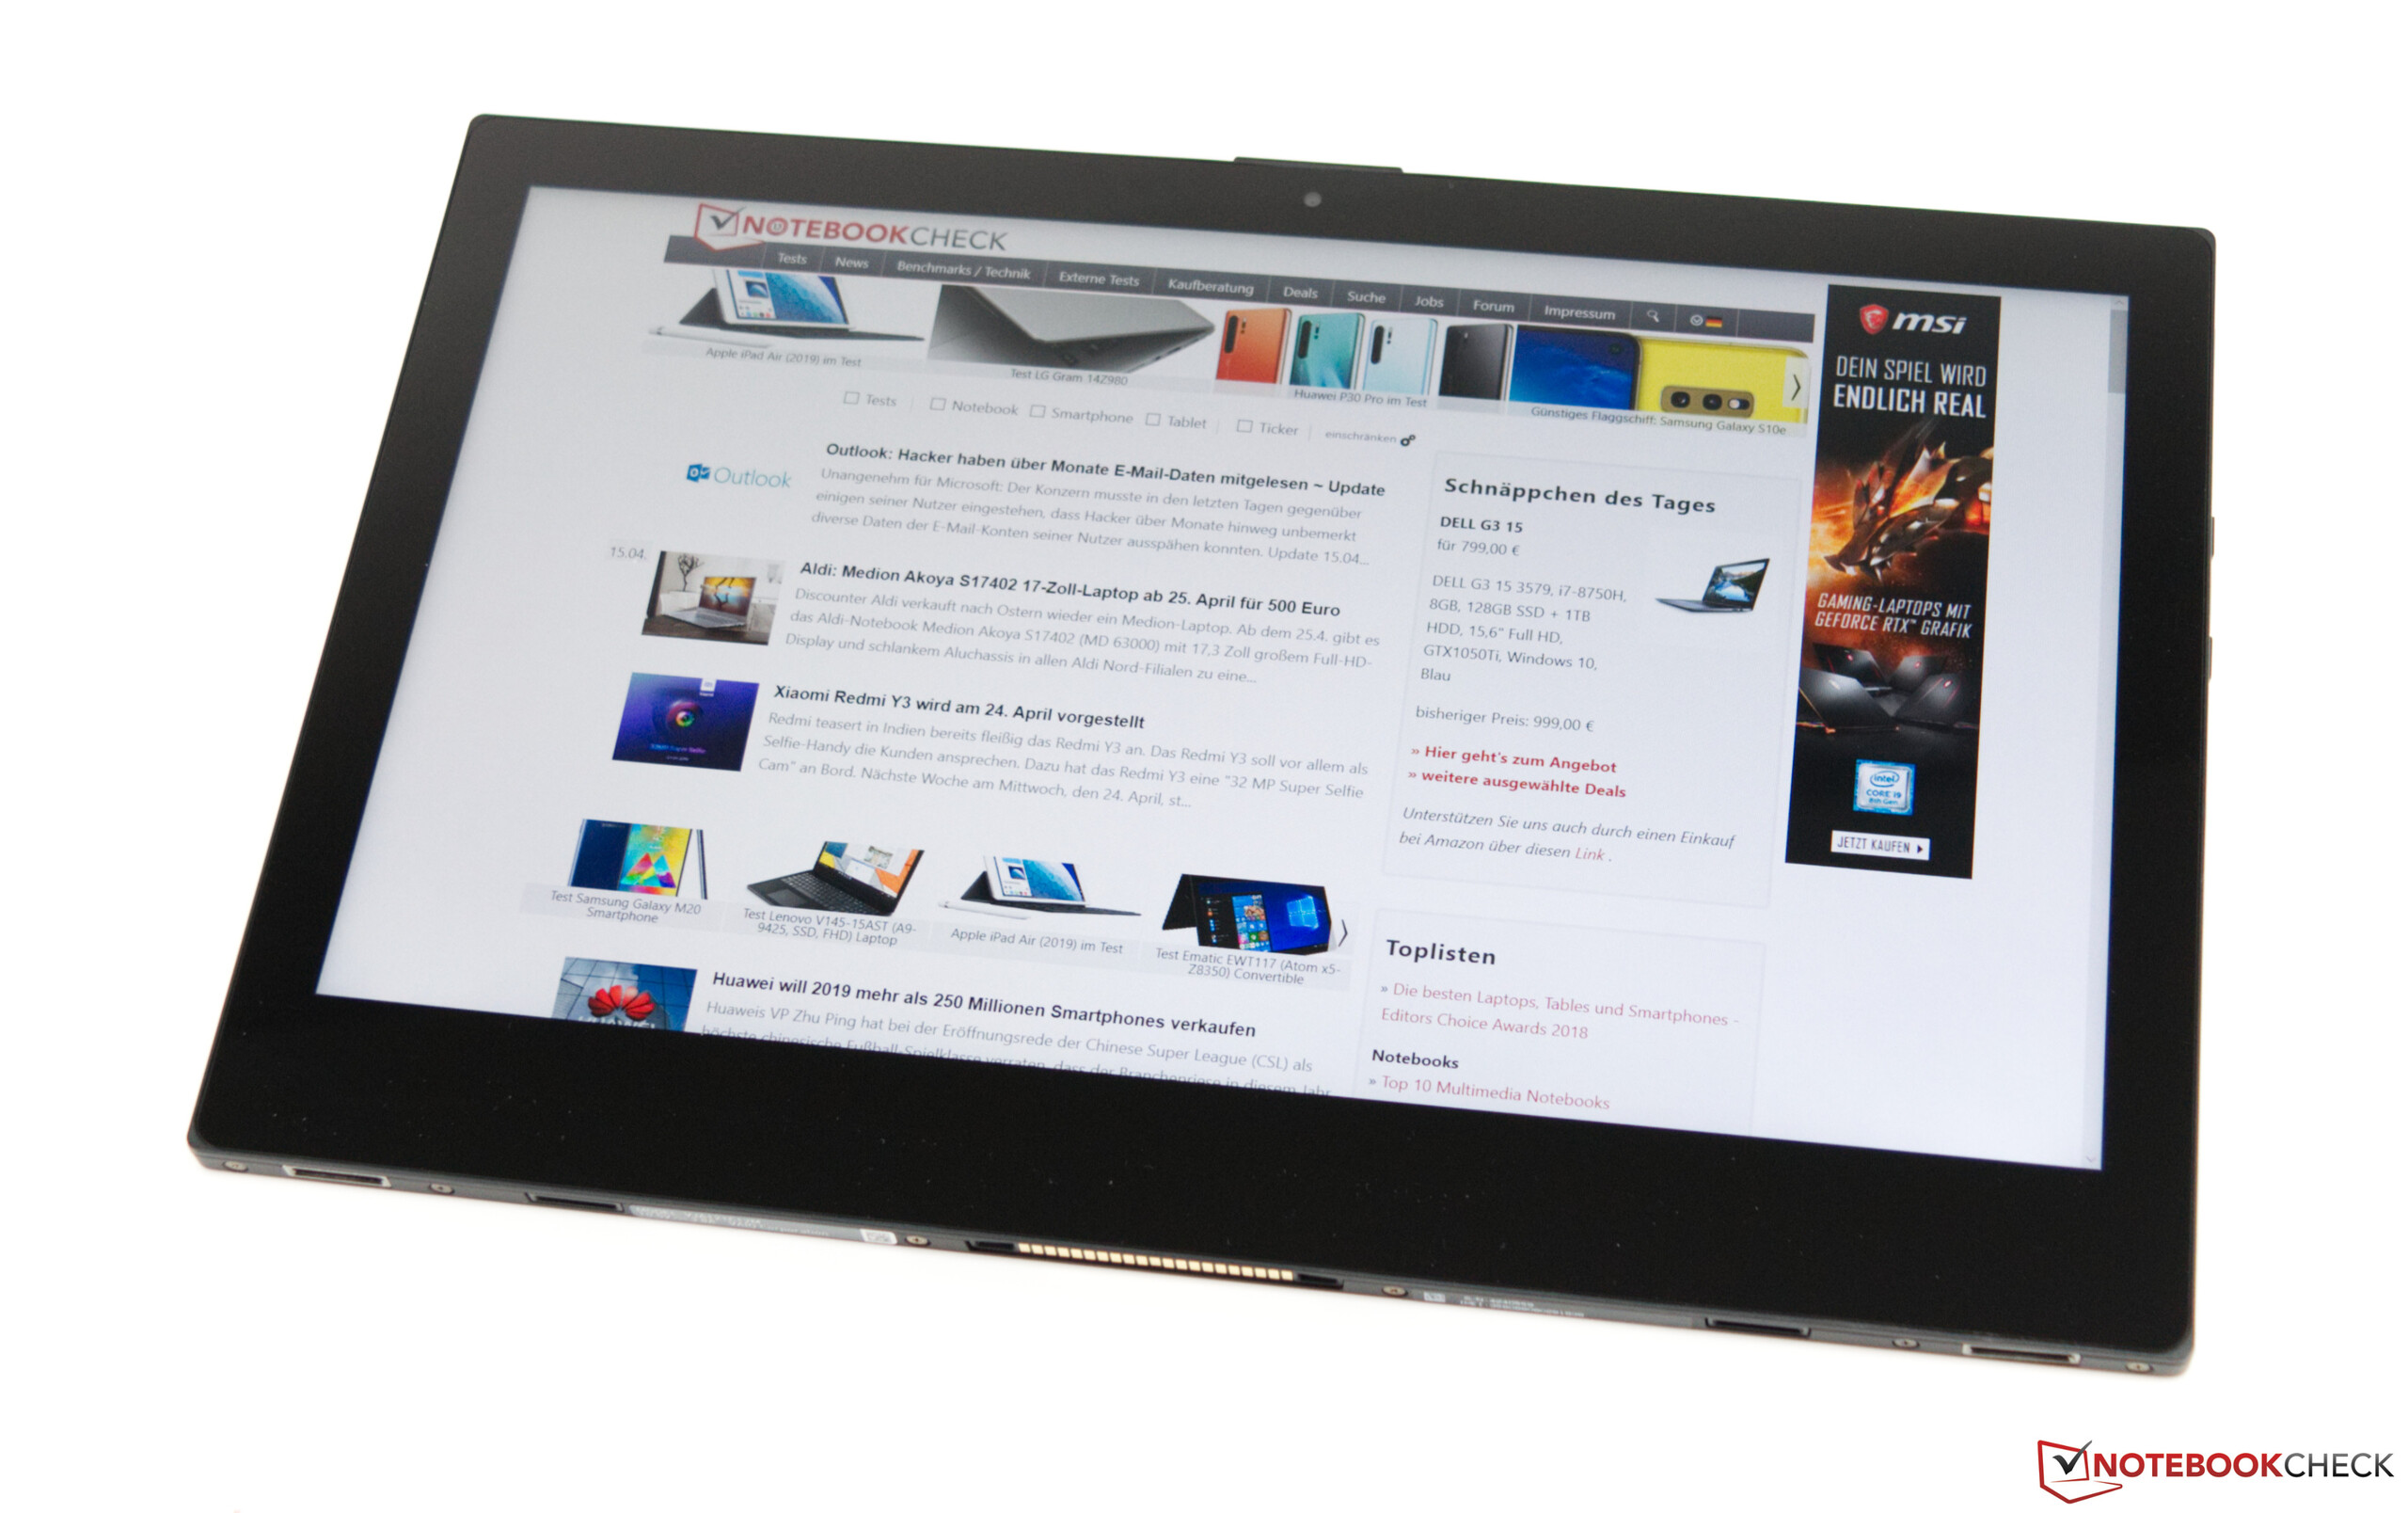
De VAIO A12 is ietwat een raadsel. De convertible is overprijsd en heeft vele minpunten, al doet de VAIO het op veel vlakken erg goed.
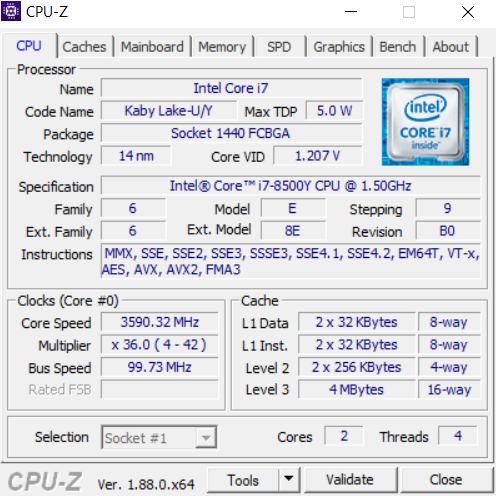
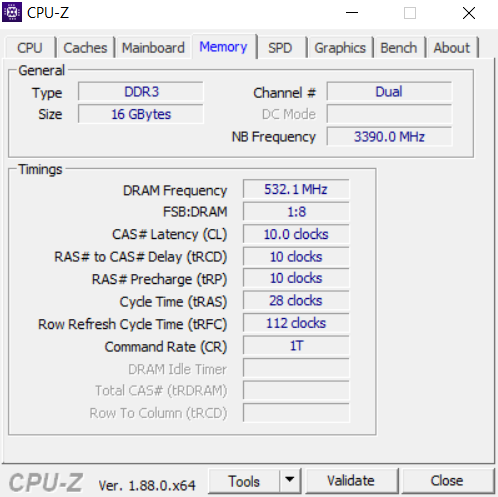
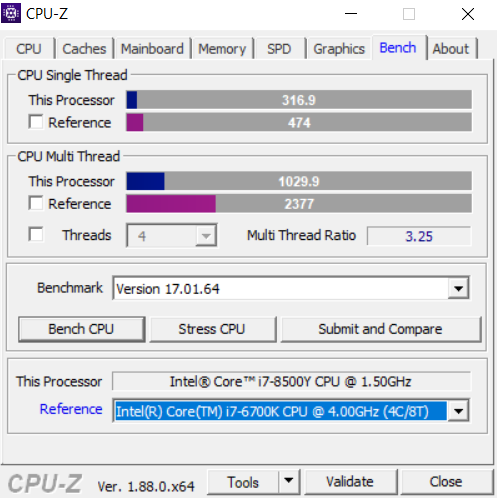
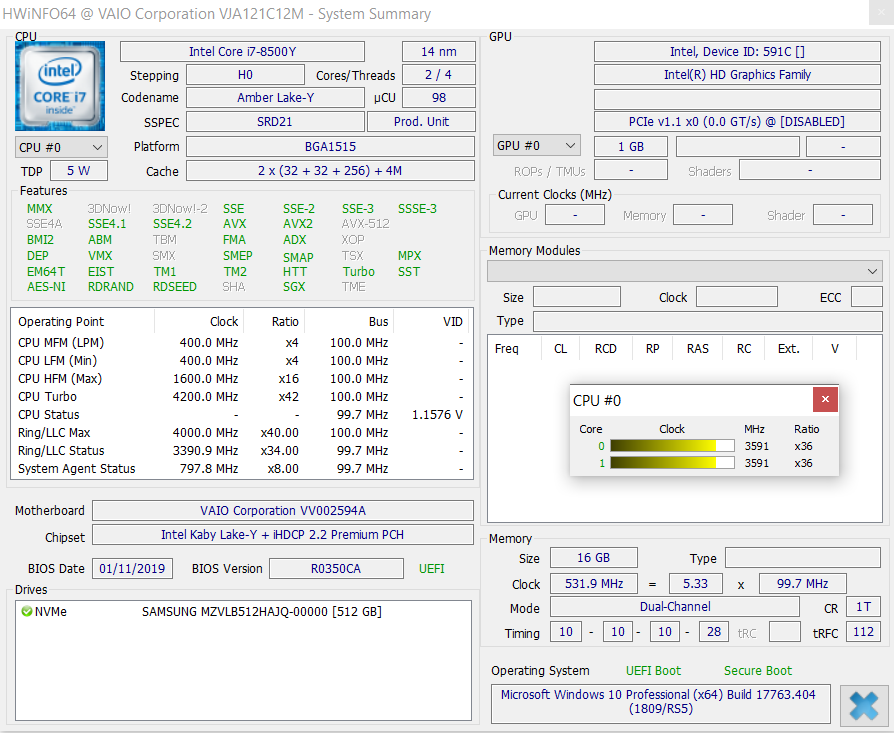
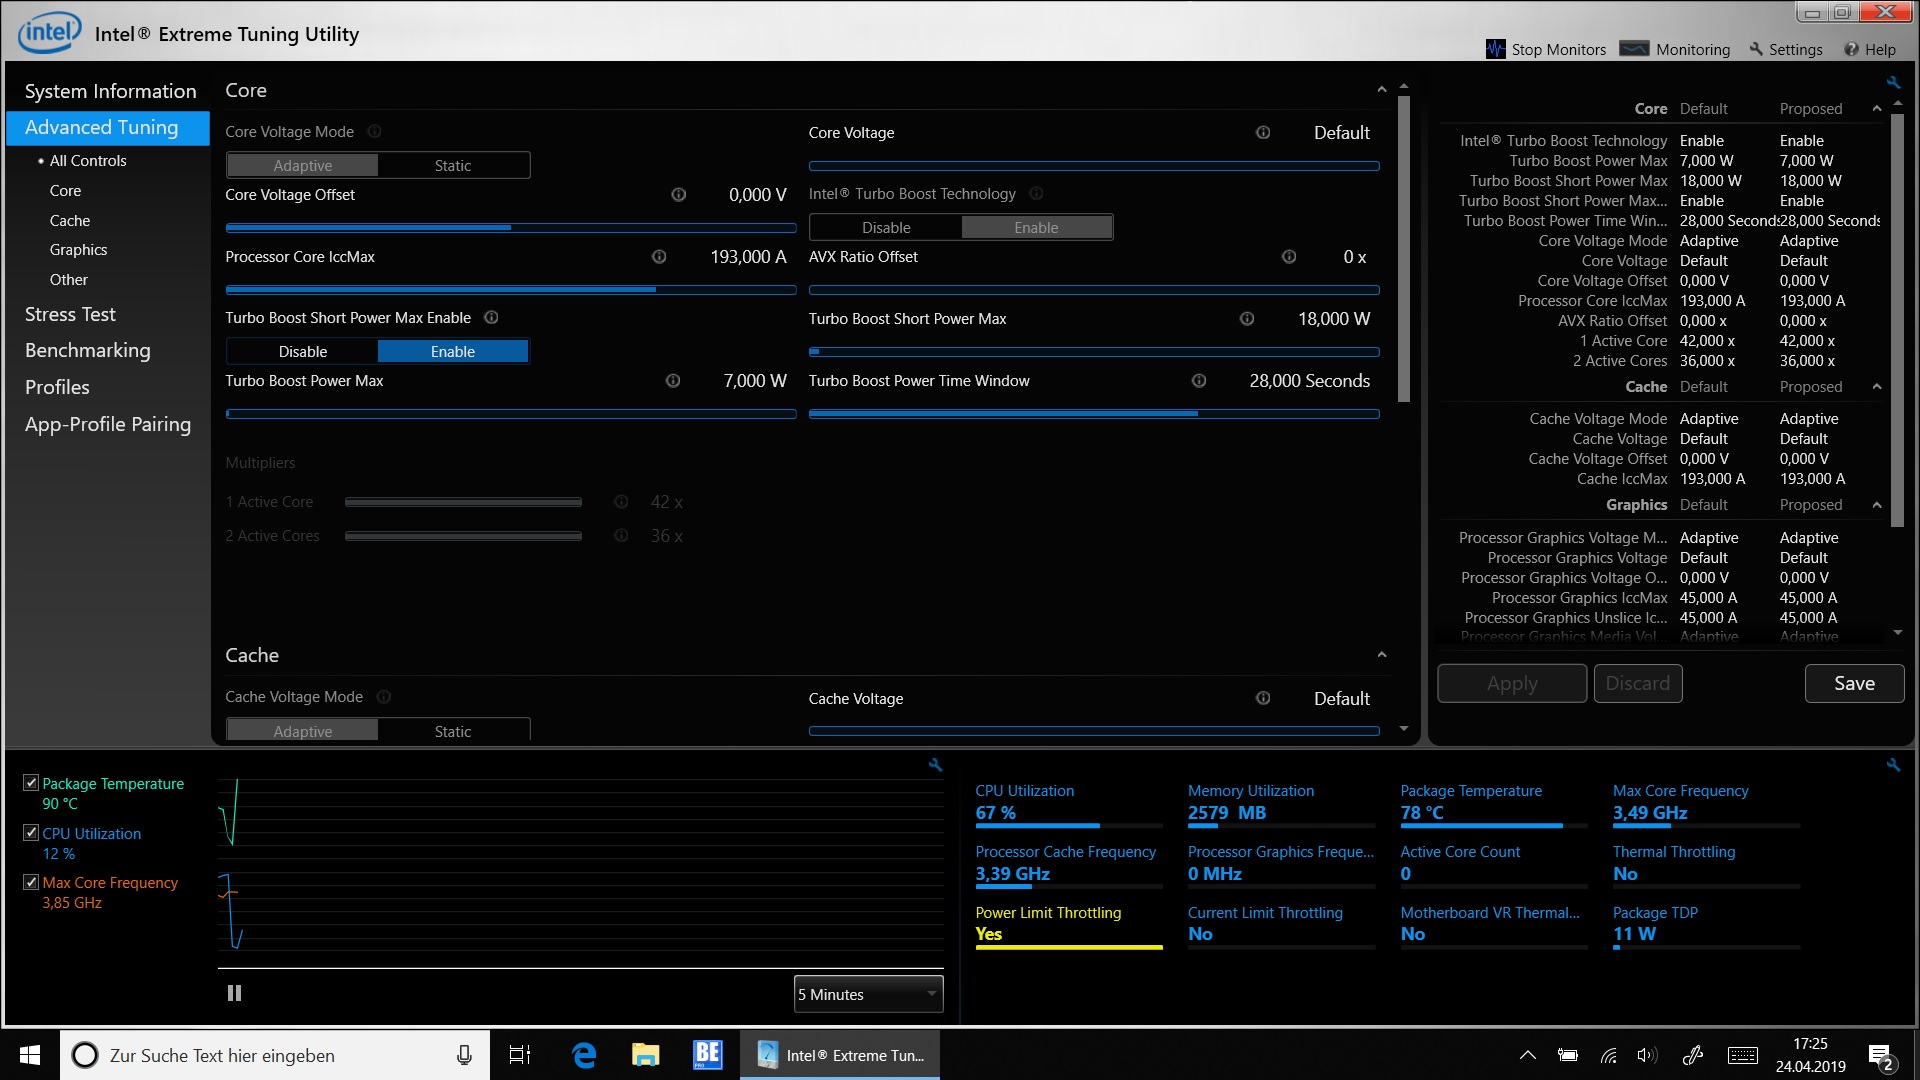
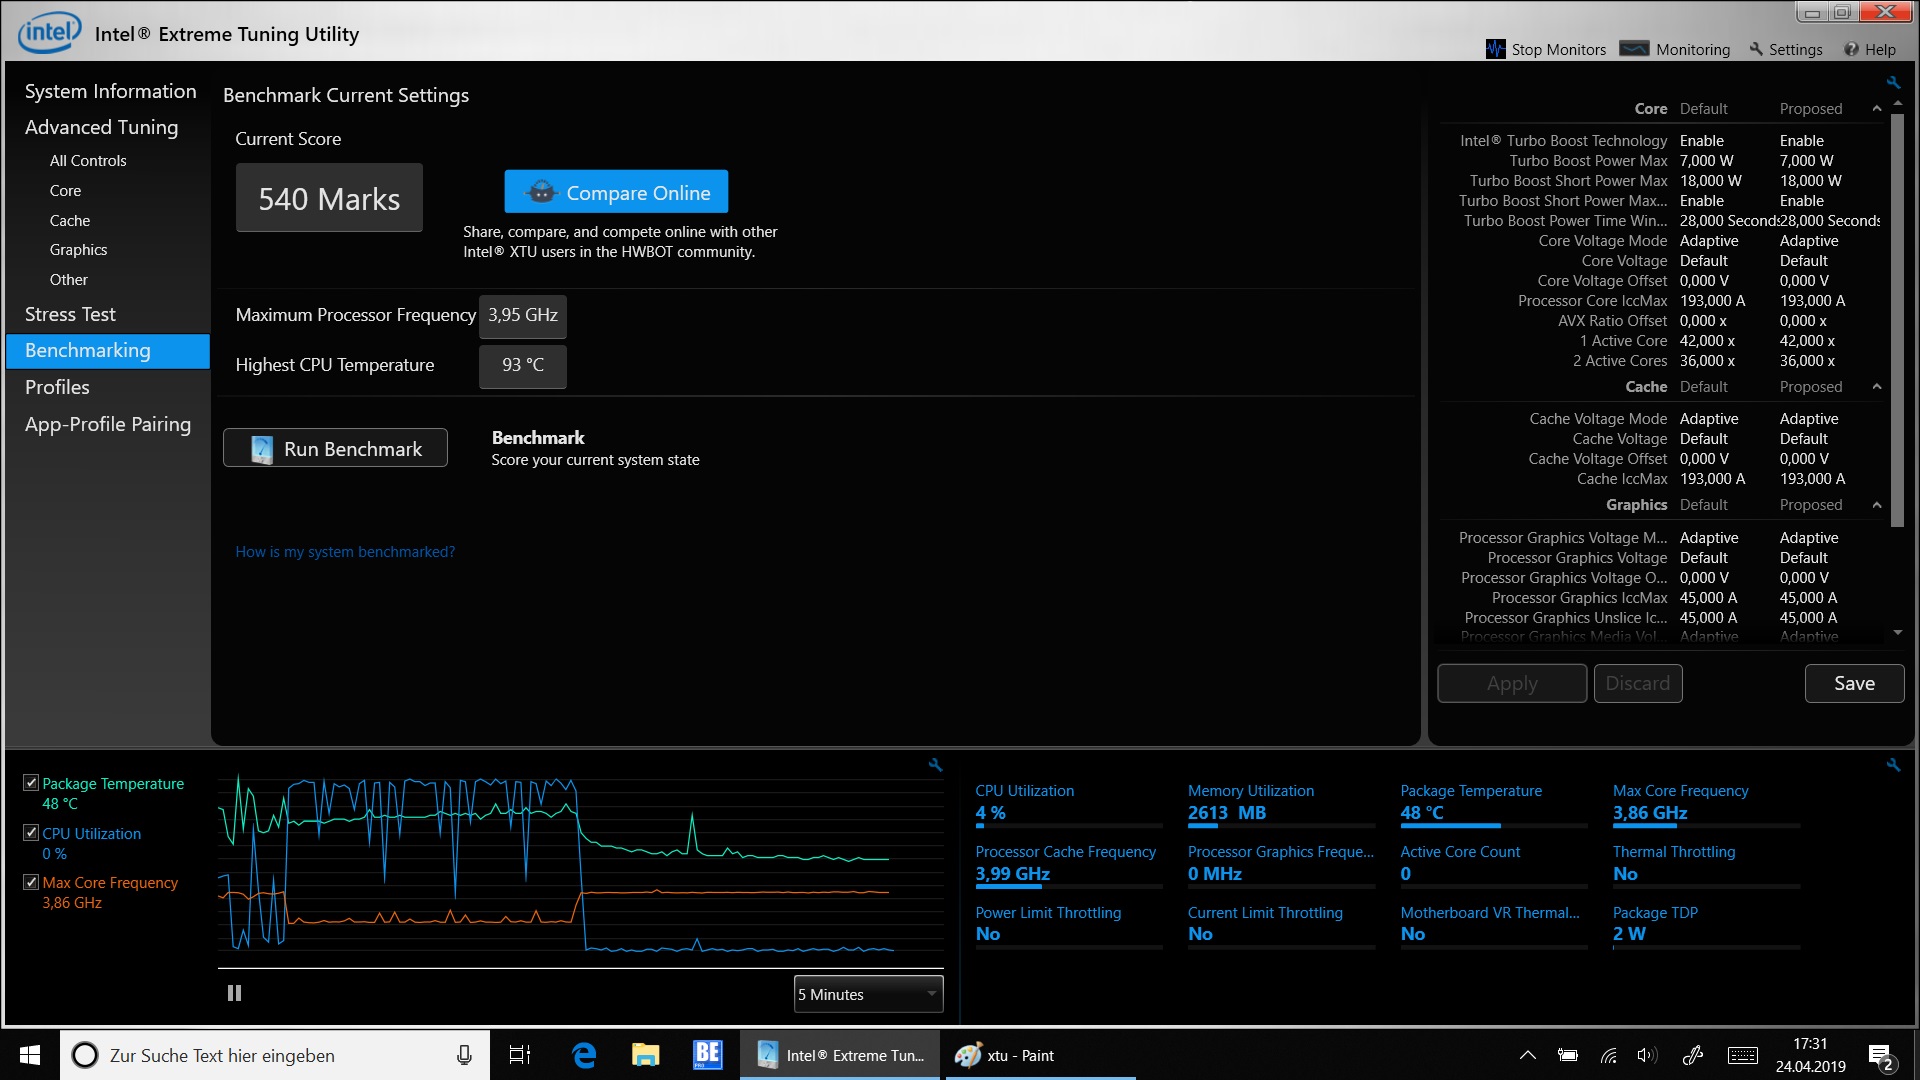
De Y-serie processor is energiezuiniger dan U-serie processoren en is nog steeds krachtig genoeg voor alledaagse kantoorwerkzaamheden. In veeleisender programma's bereikt de dual-core CPU echter zijn limiet. De 16 GB RAM lijkt teveel van het goede, al zijn we er niet op tegen en datzelfde geld ook voor de 512 GB SSD. We hadden geen onverwachte problemen met de prestaties en de A12 kon ons zelfs verrassen met relatief goede scores in de systeemtests.
De VAIO A12 is simpelweg te duur. Het biedt niets meer dan de concurrentie niet ook of zelfs beter doet. Wel zijn er een rits minpunten. Je kunt beter nog even verder kijken.
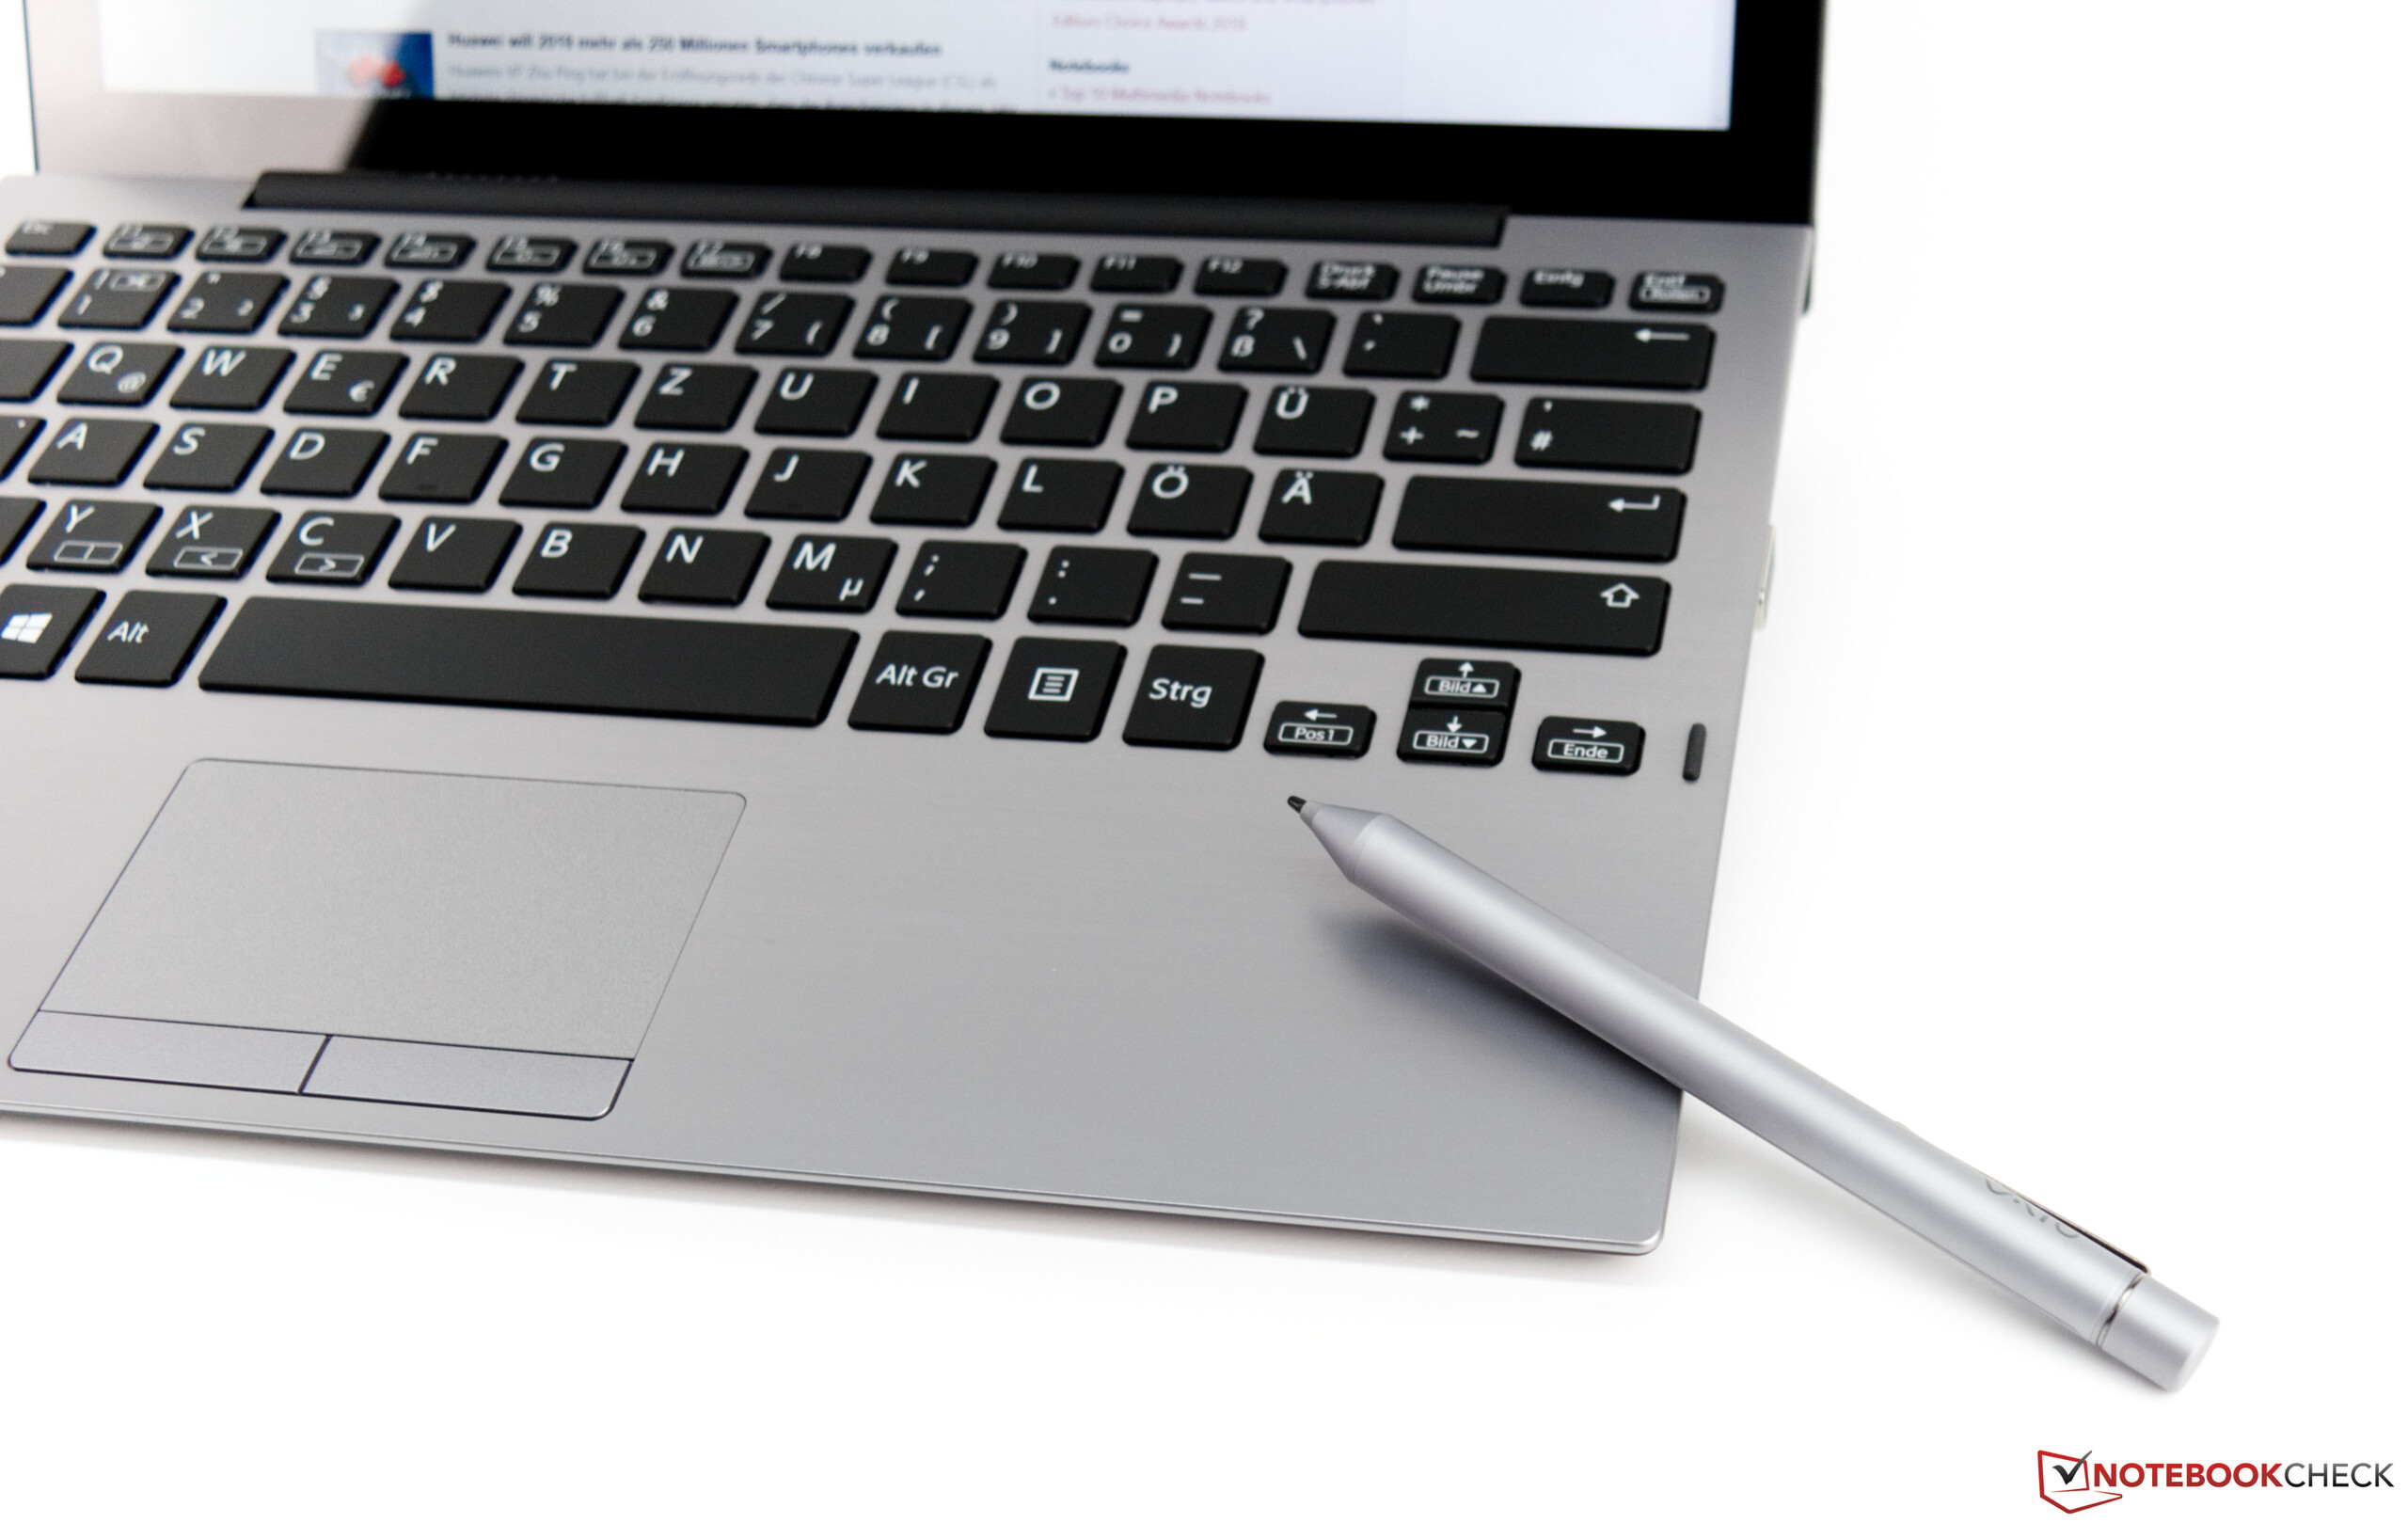
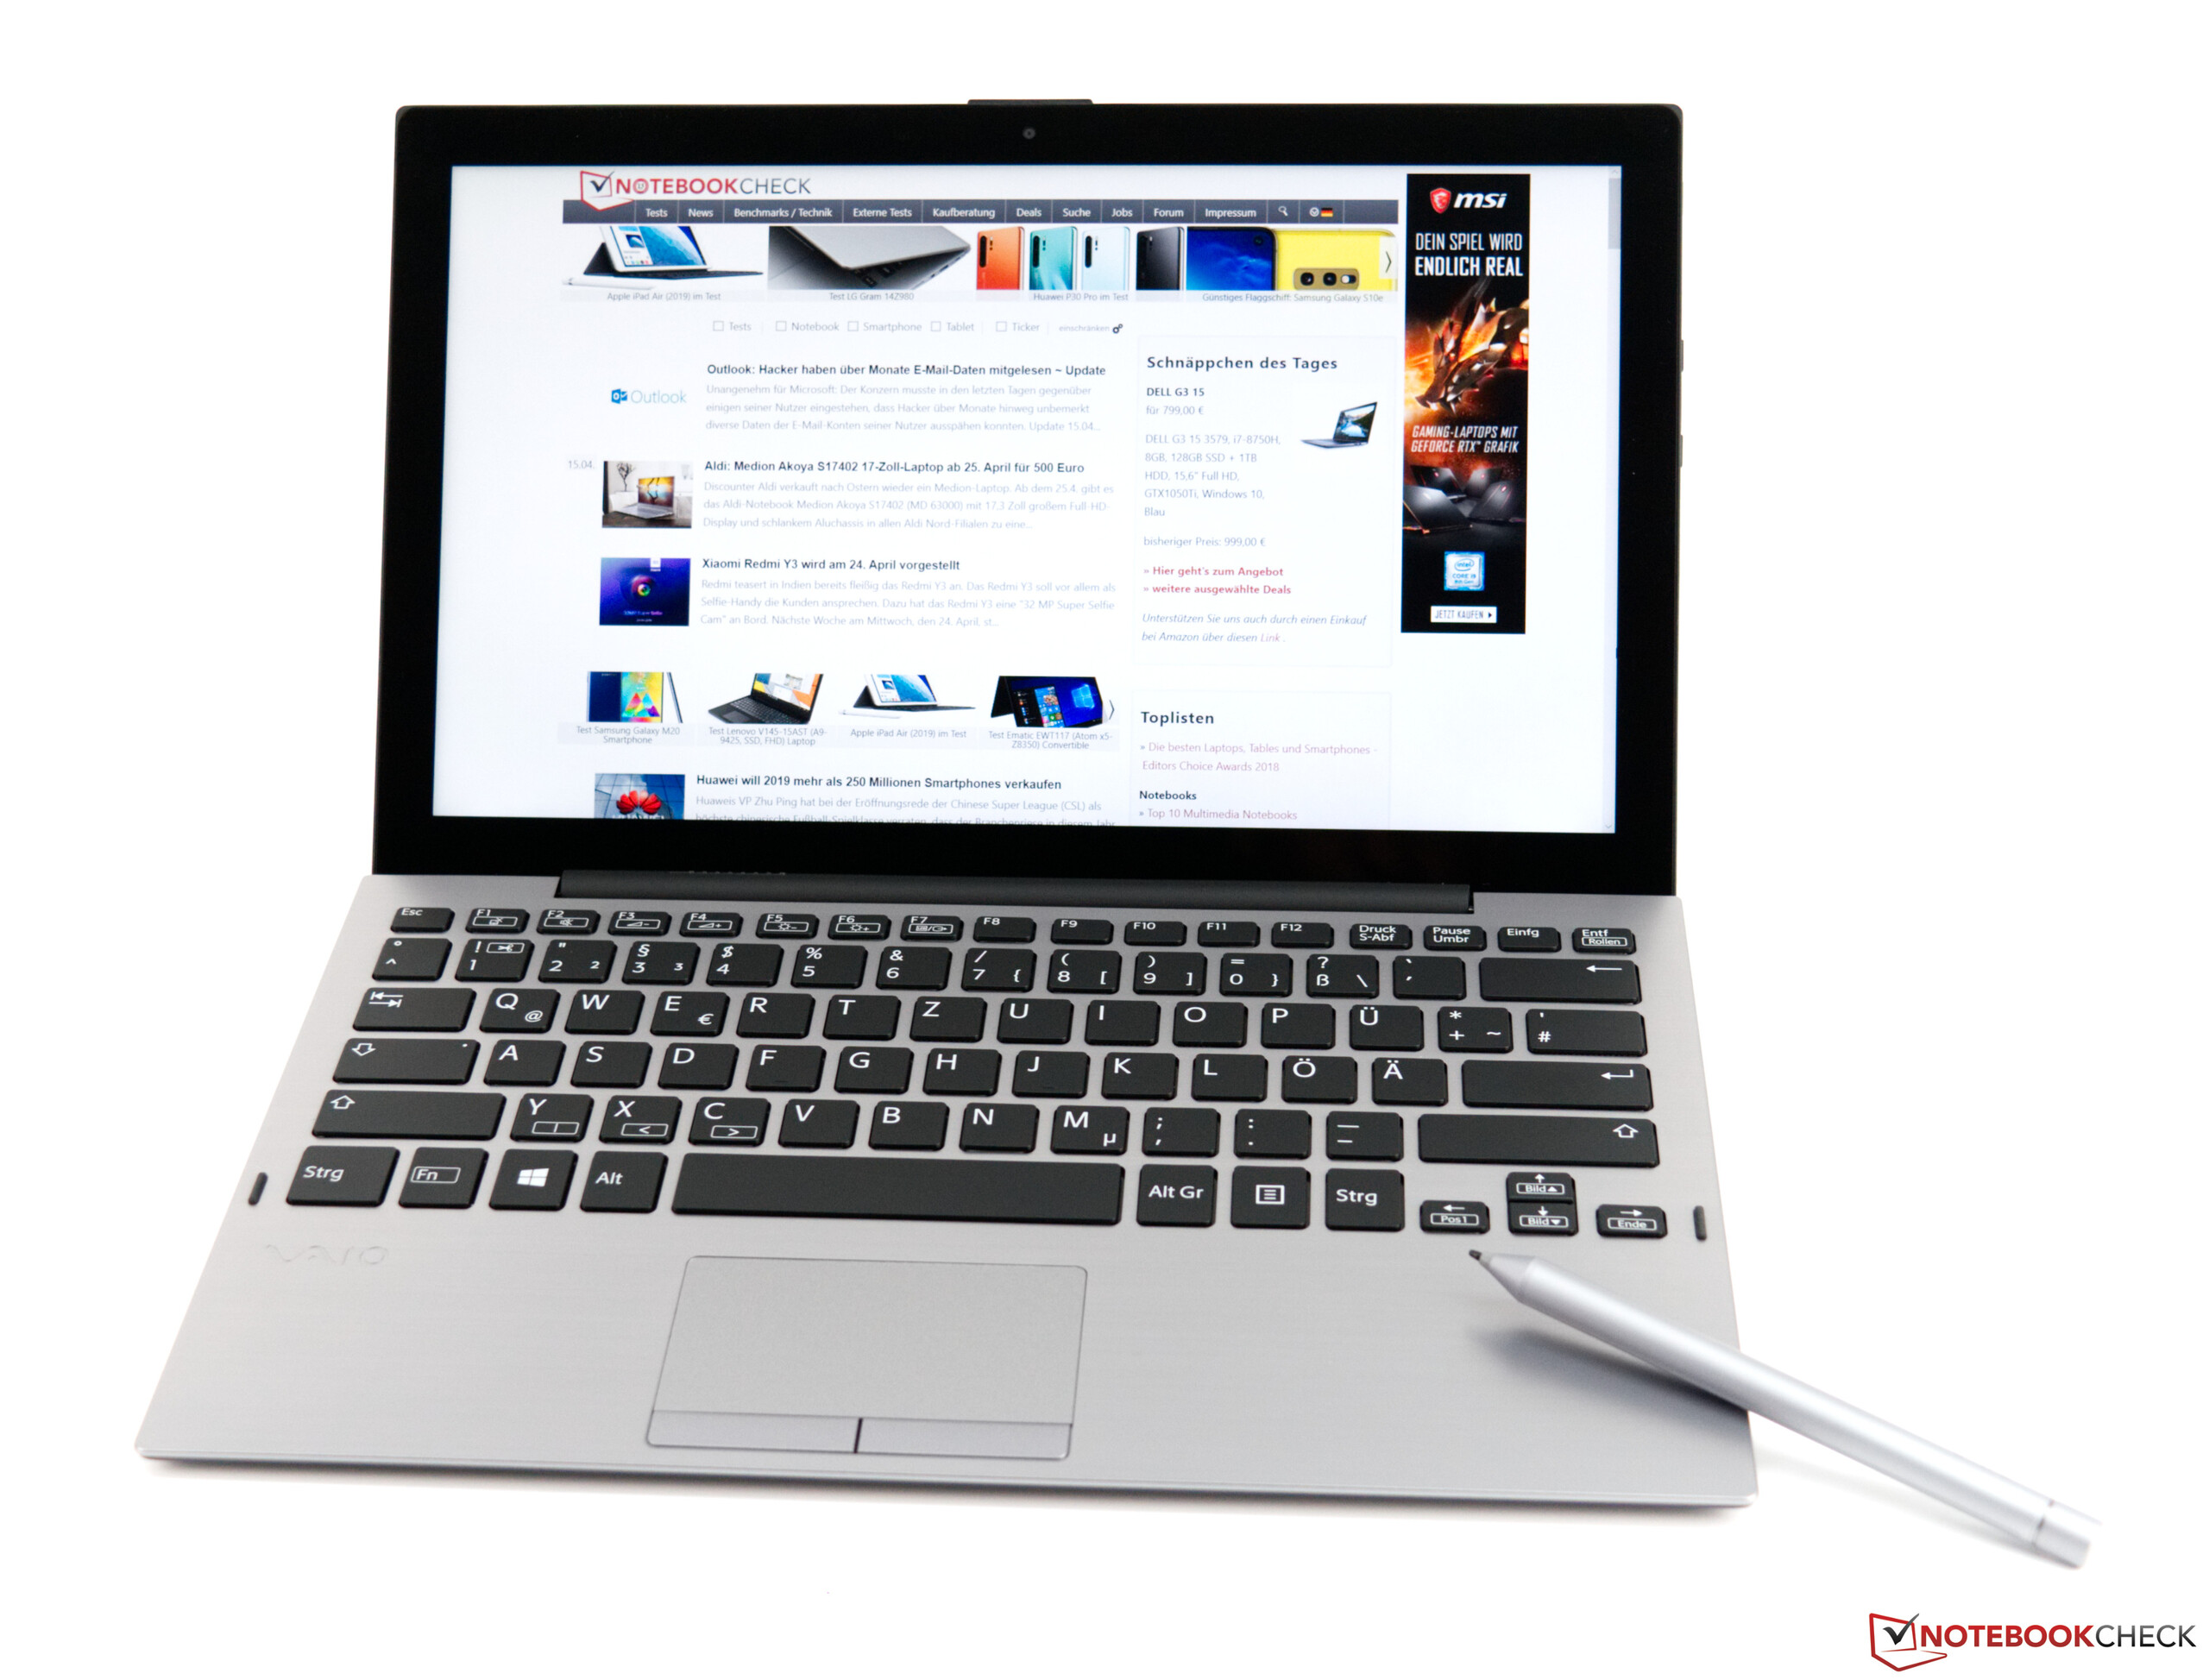
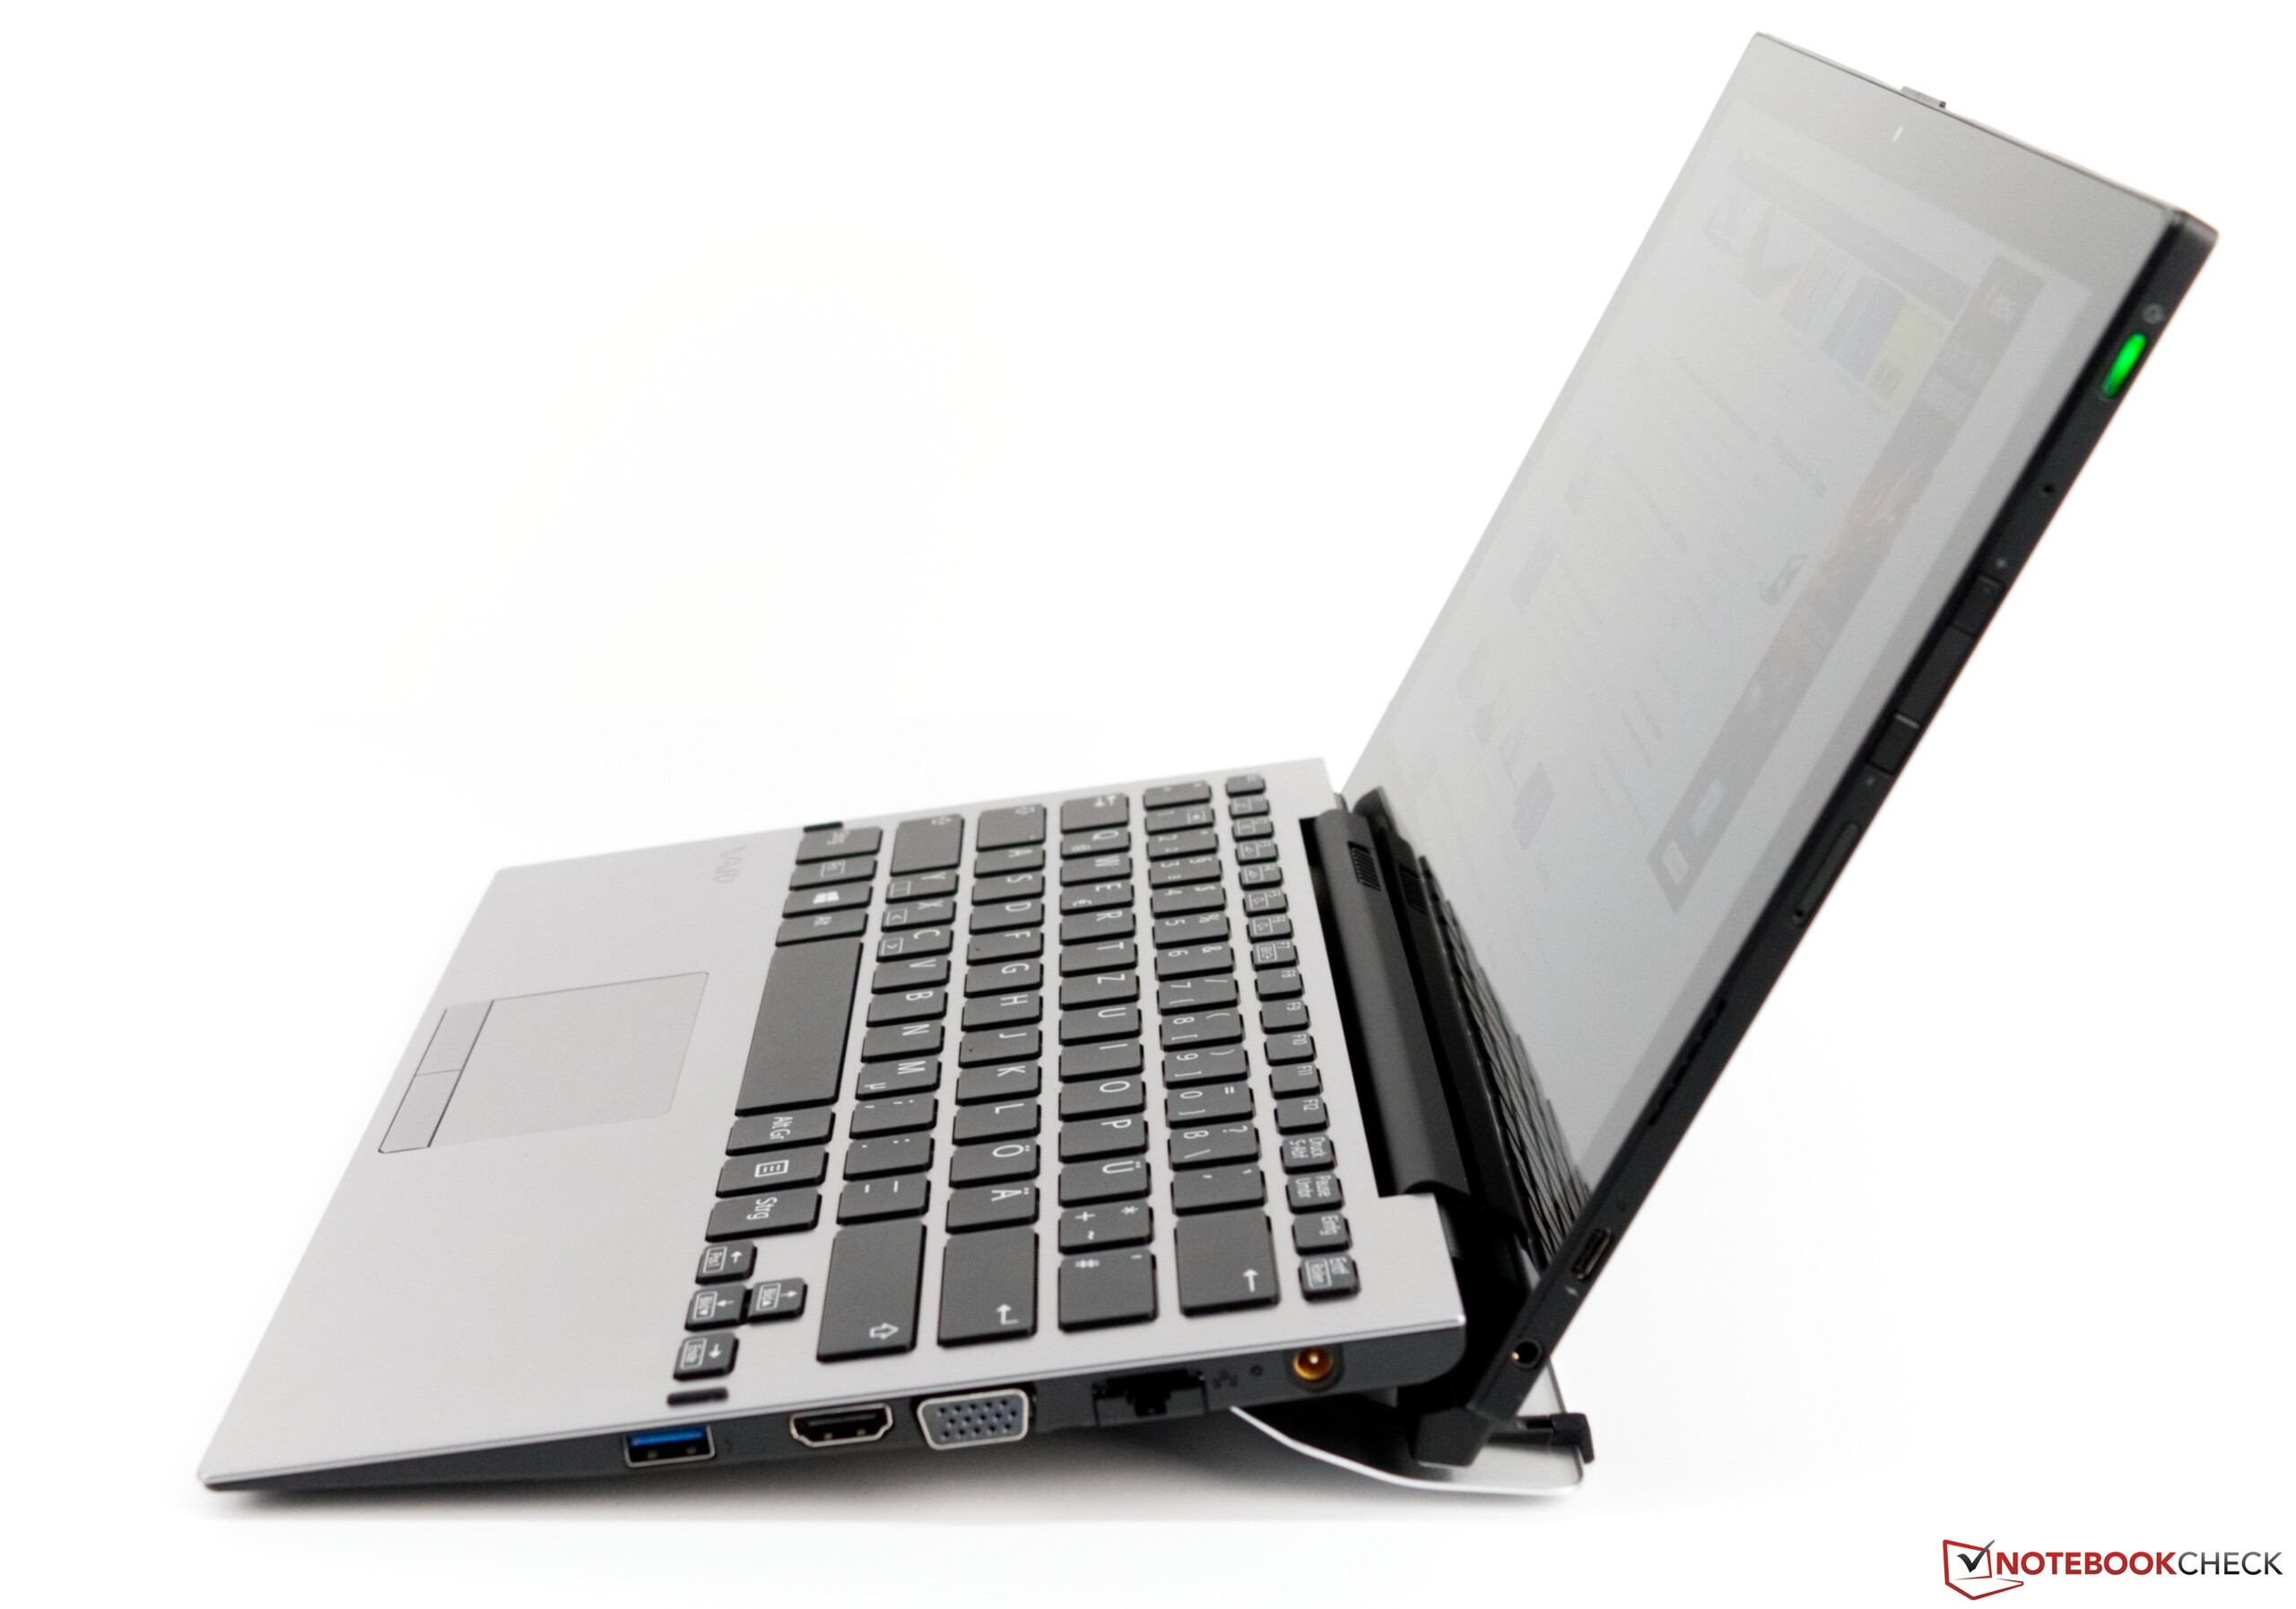
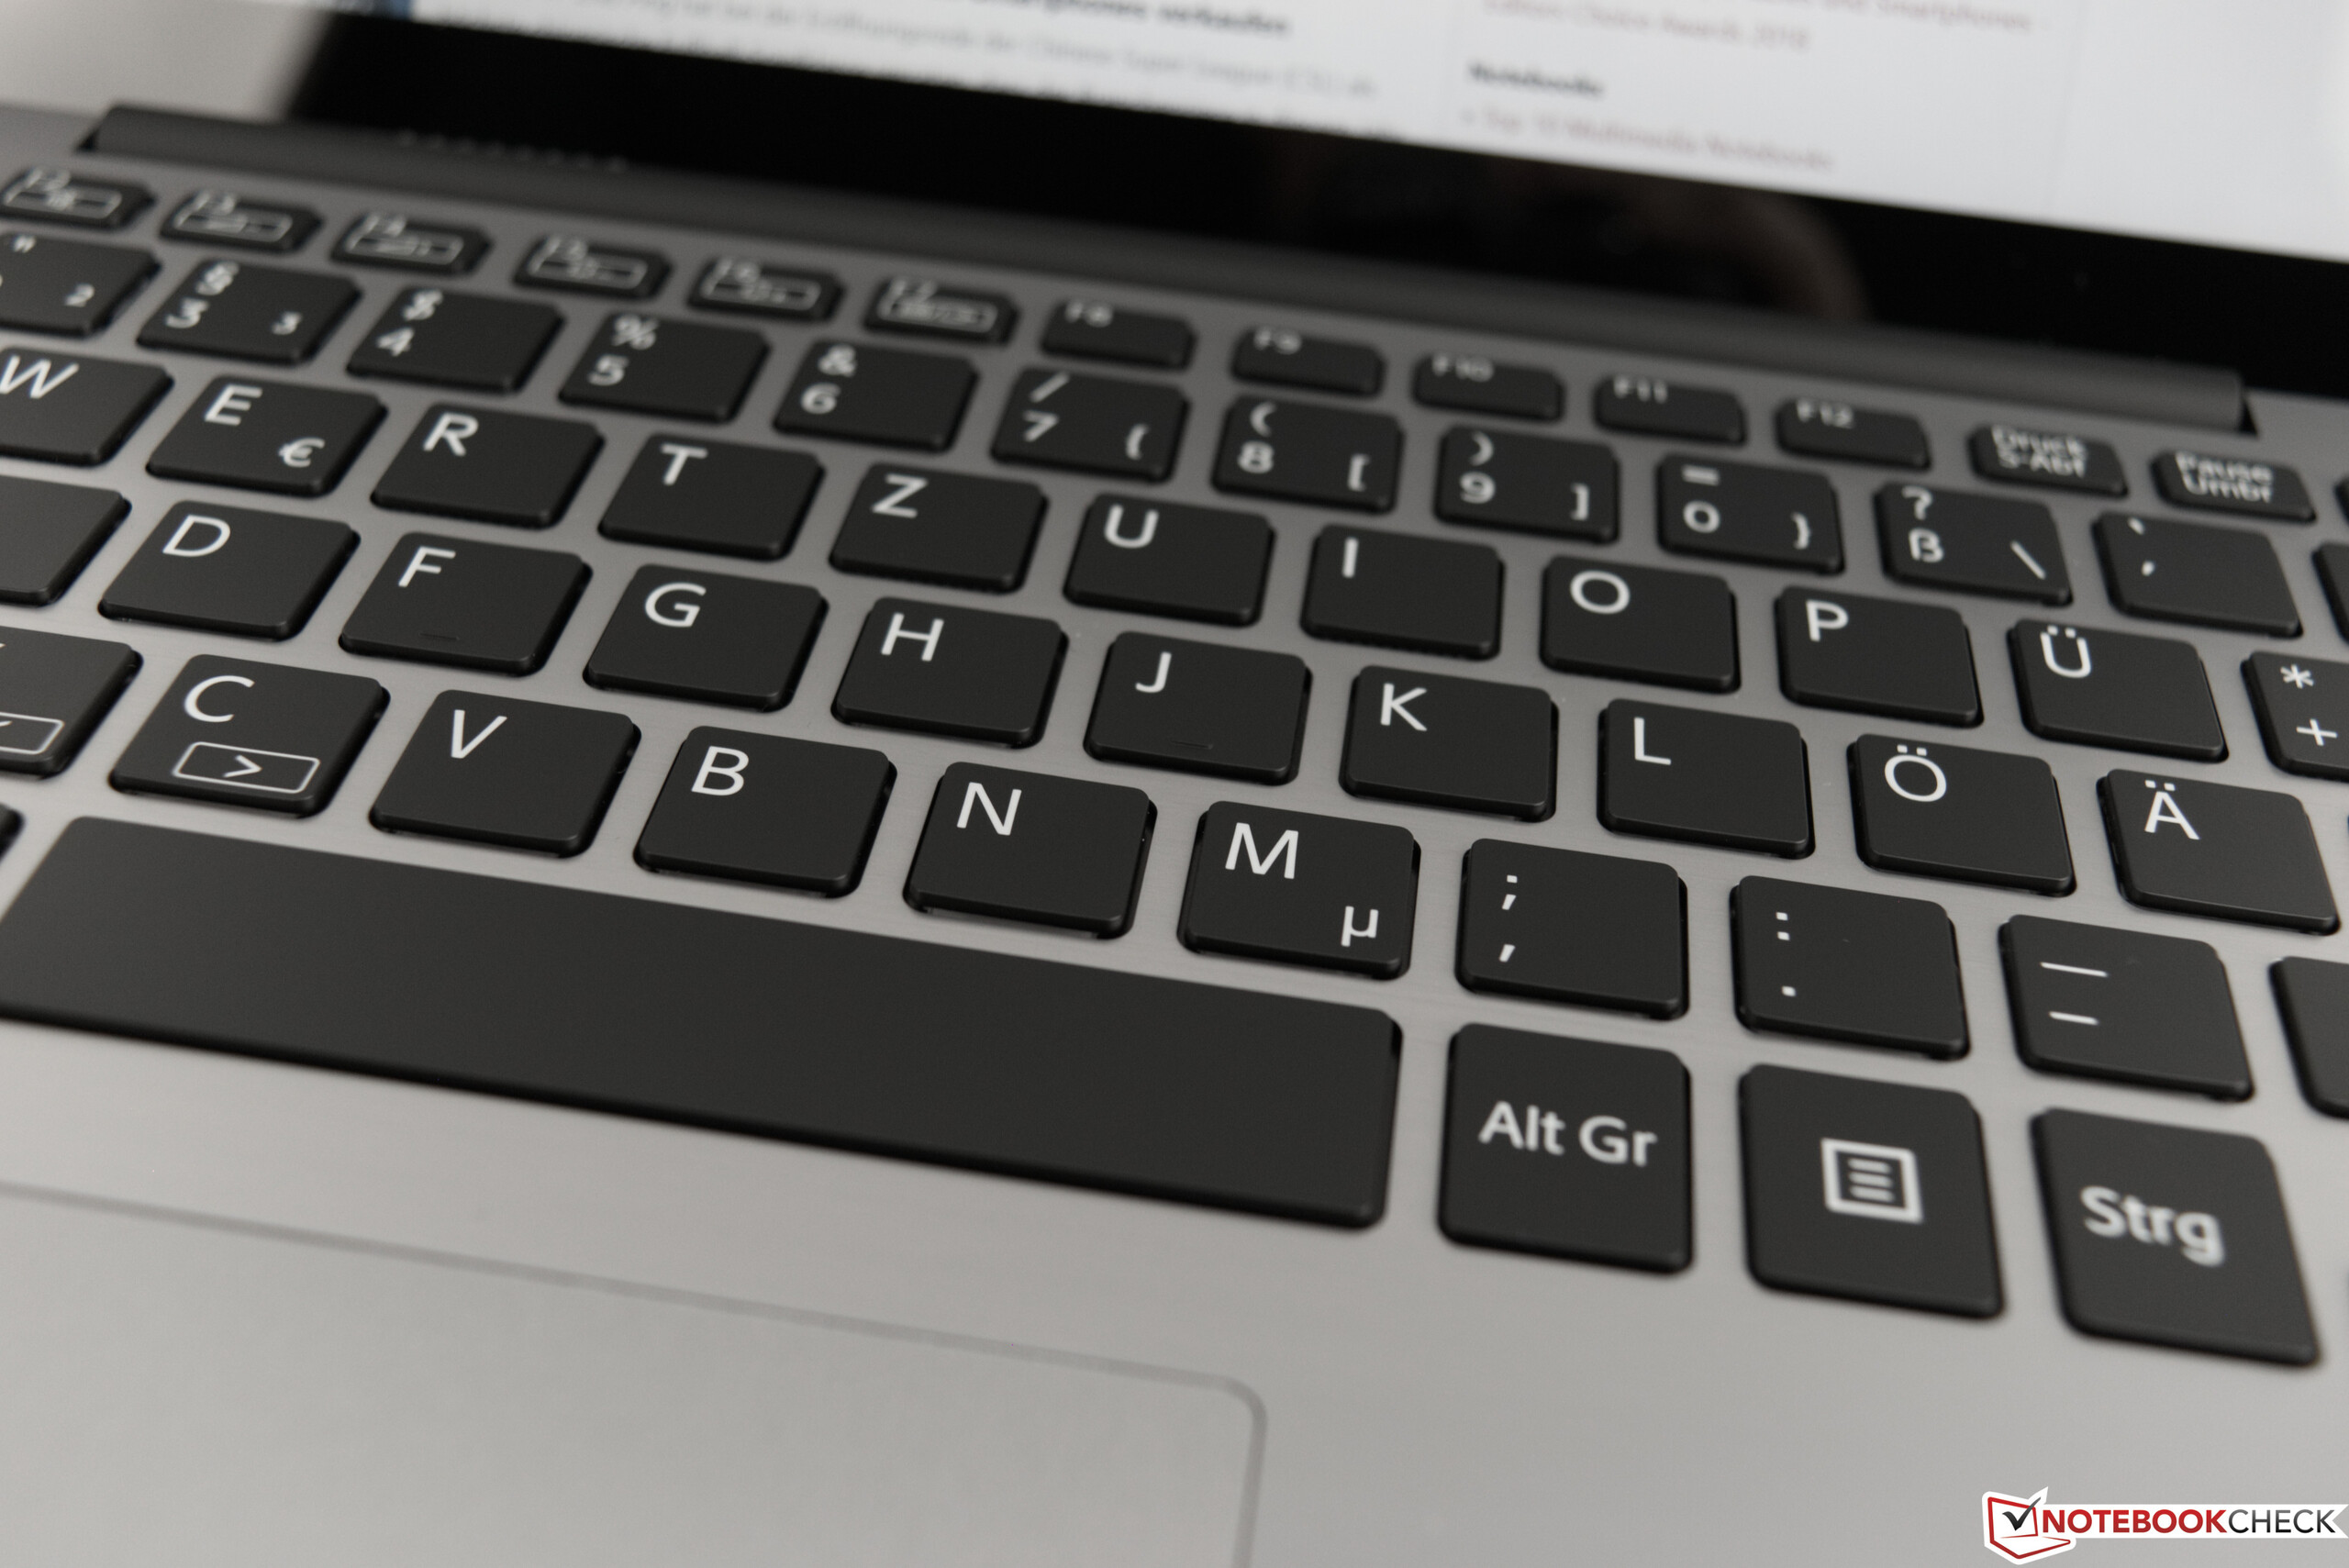
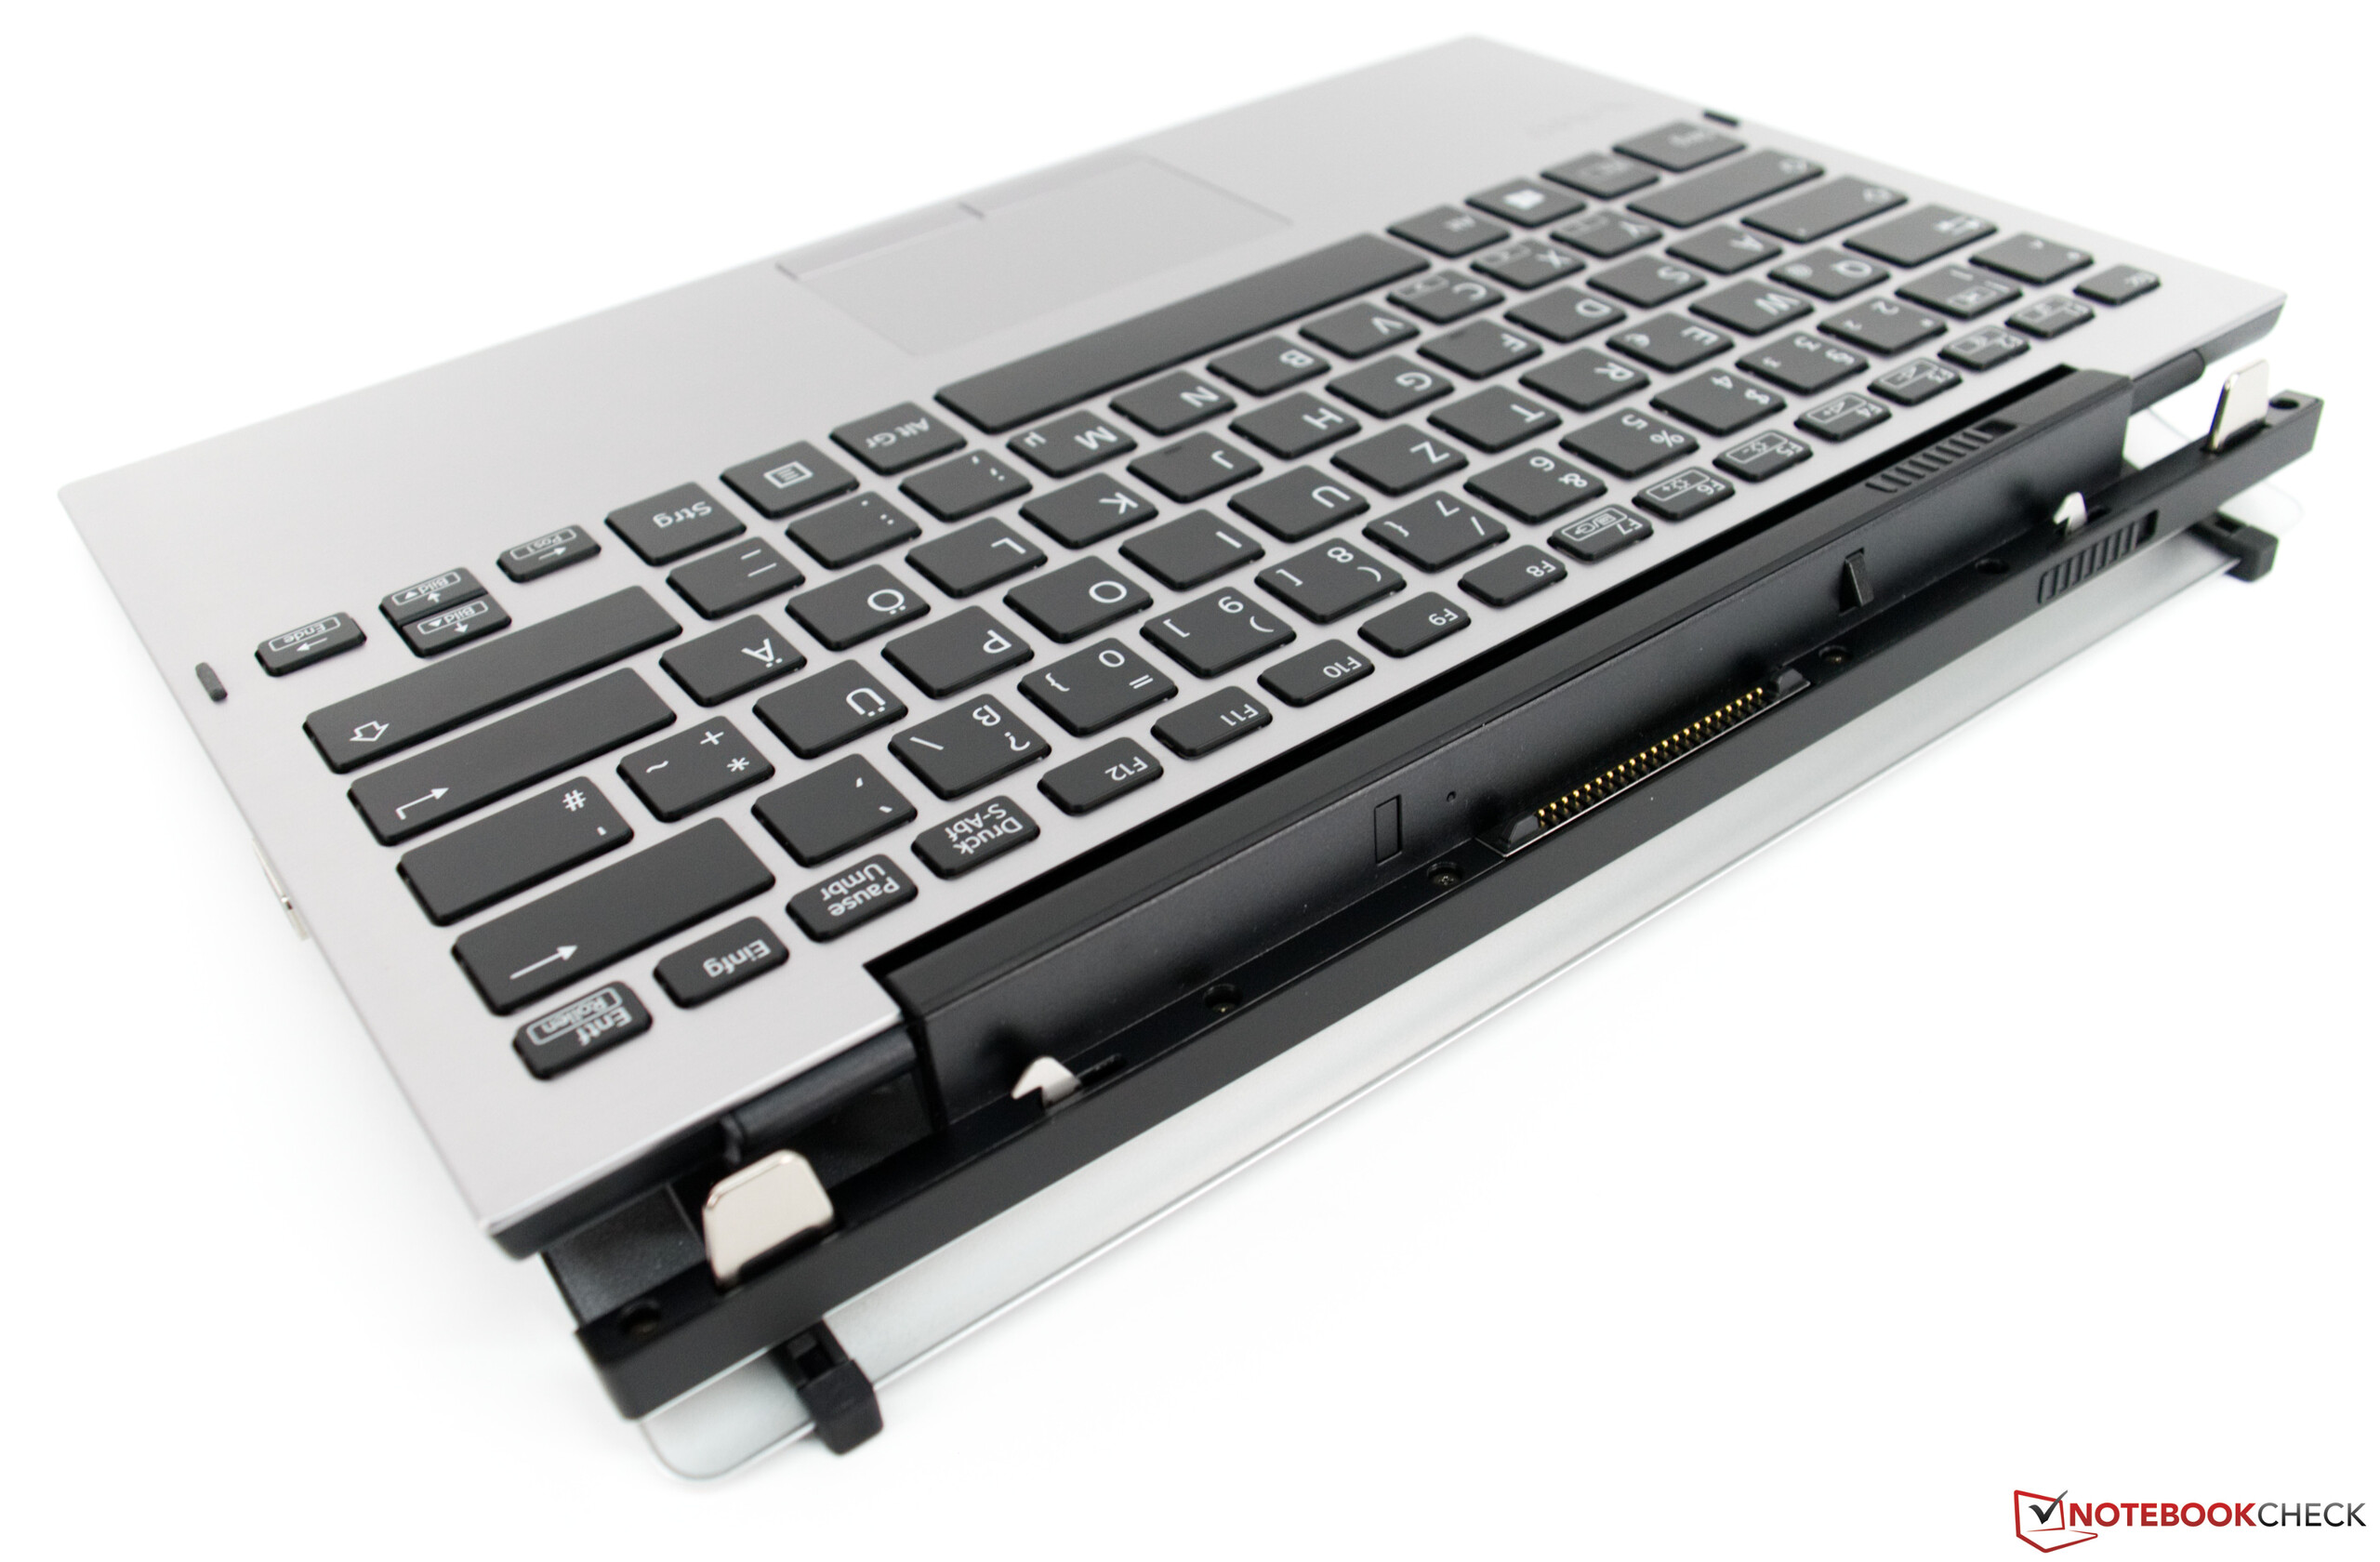
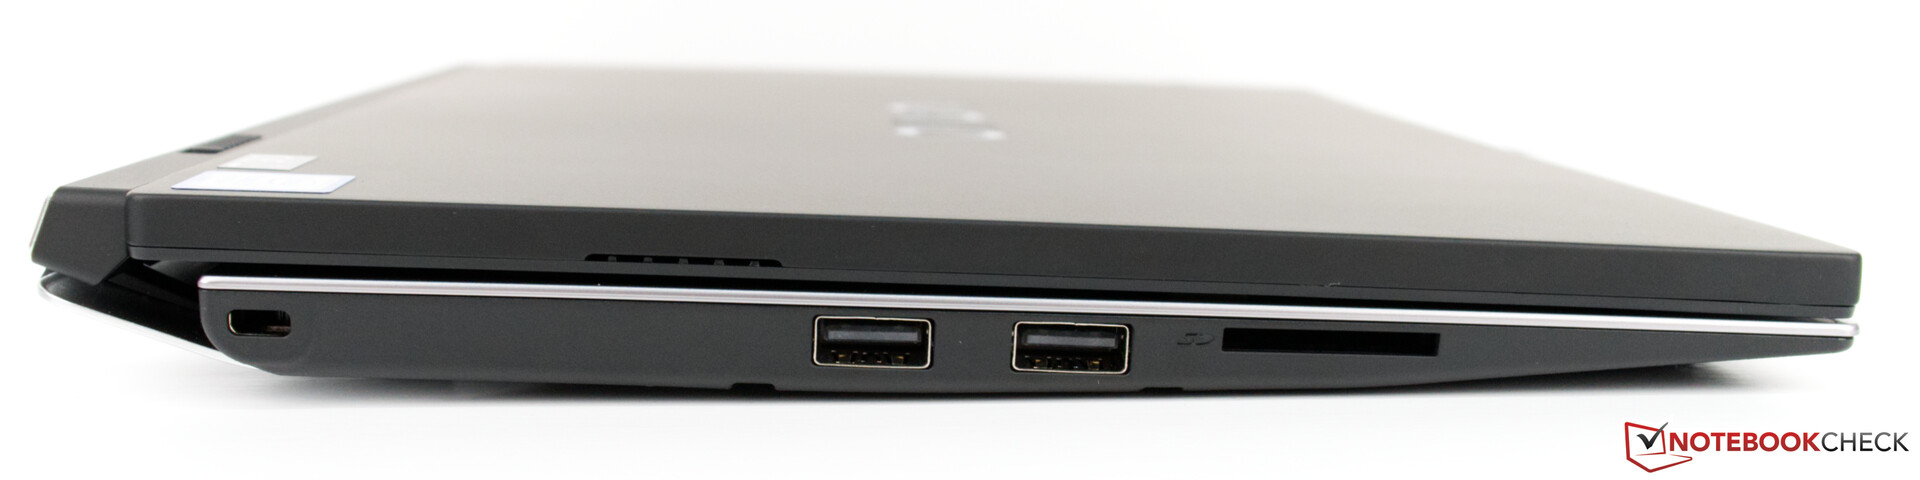
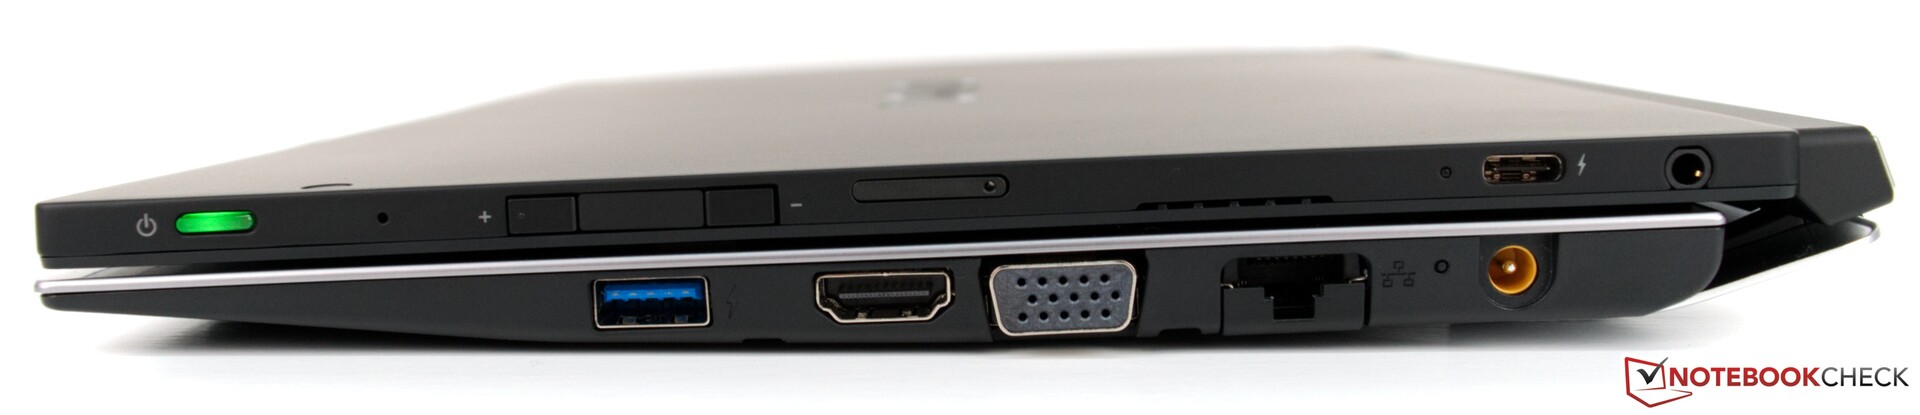
De A12 ziet er ook uit alsof het een stevig convertible is met zijn dikke design en gebruik van premium materialen, maar het tegendeel is waar. De convertible buigt naar onze mening teveel door en het toetsenbord dock buigt in het midden door tijdens typen. We waarderen ook dat VAIO de A12 uitrust met een volwaardige SD-kaartlezer, maar de beslissing om een USB 2.0-versie te gebruiken op een notebook van deze prijs is verbluffend.
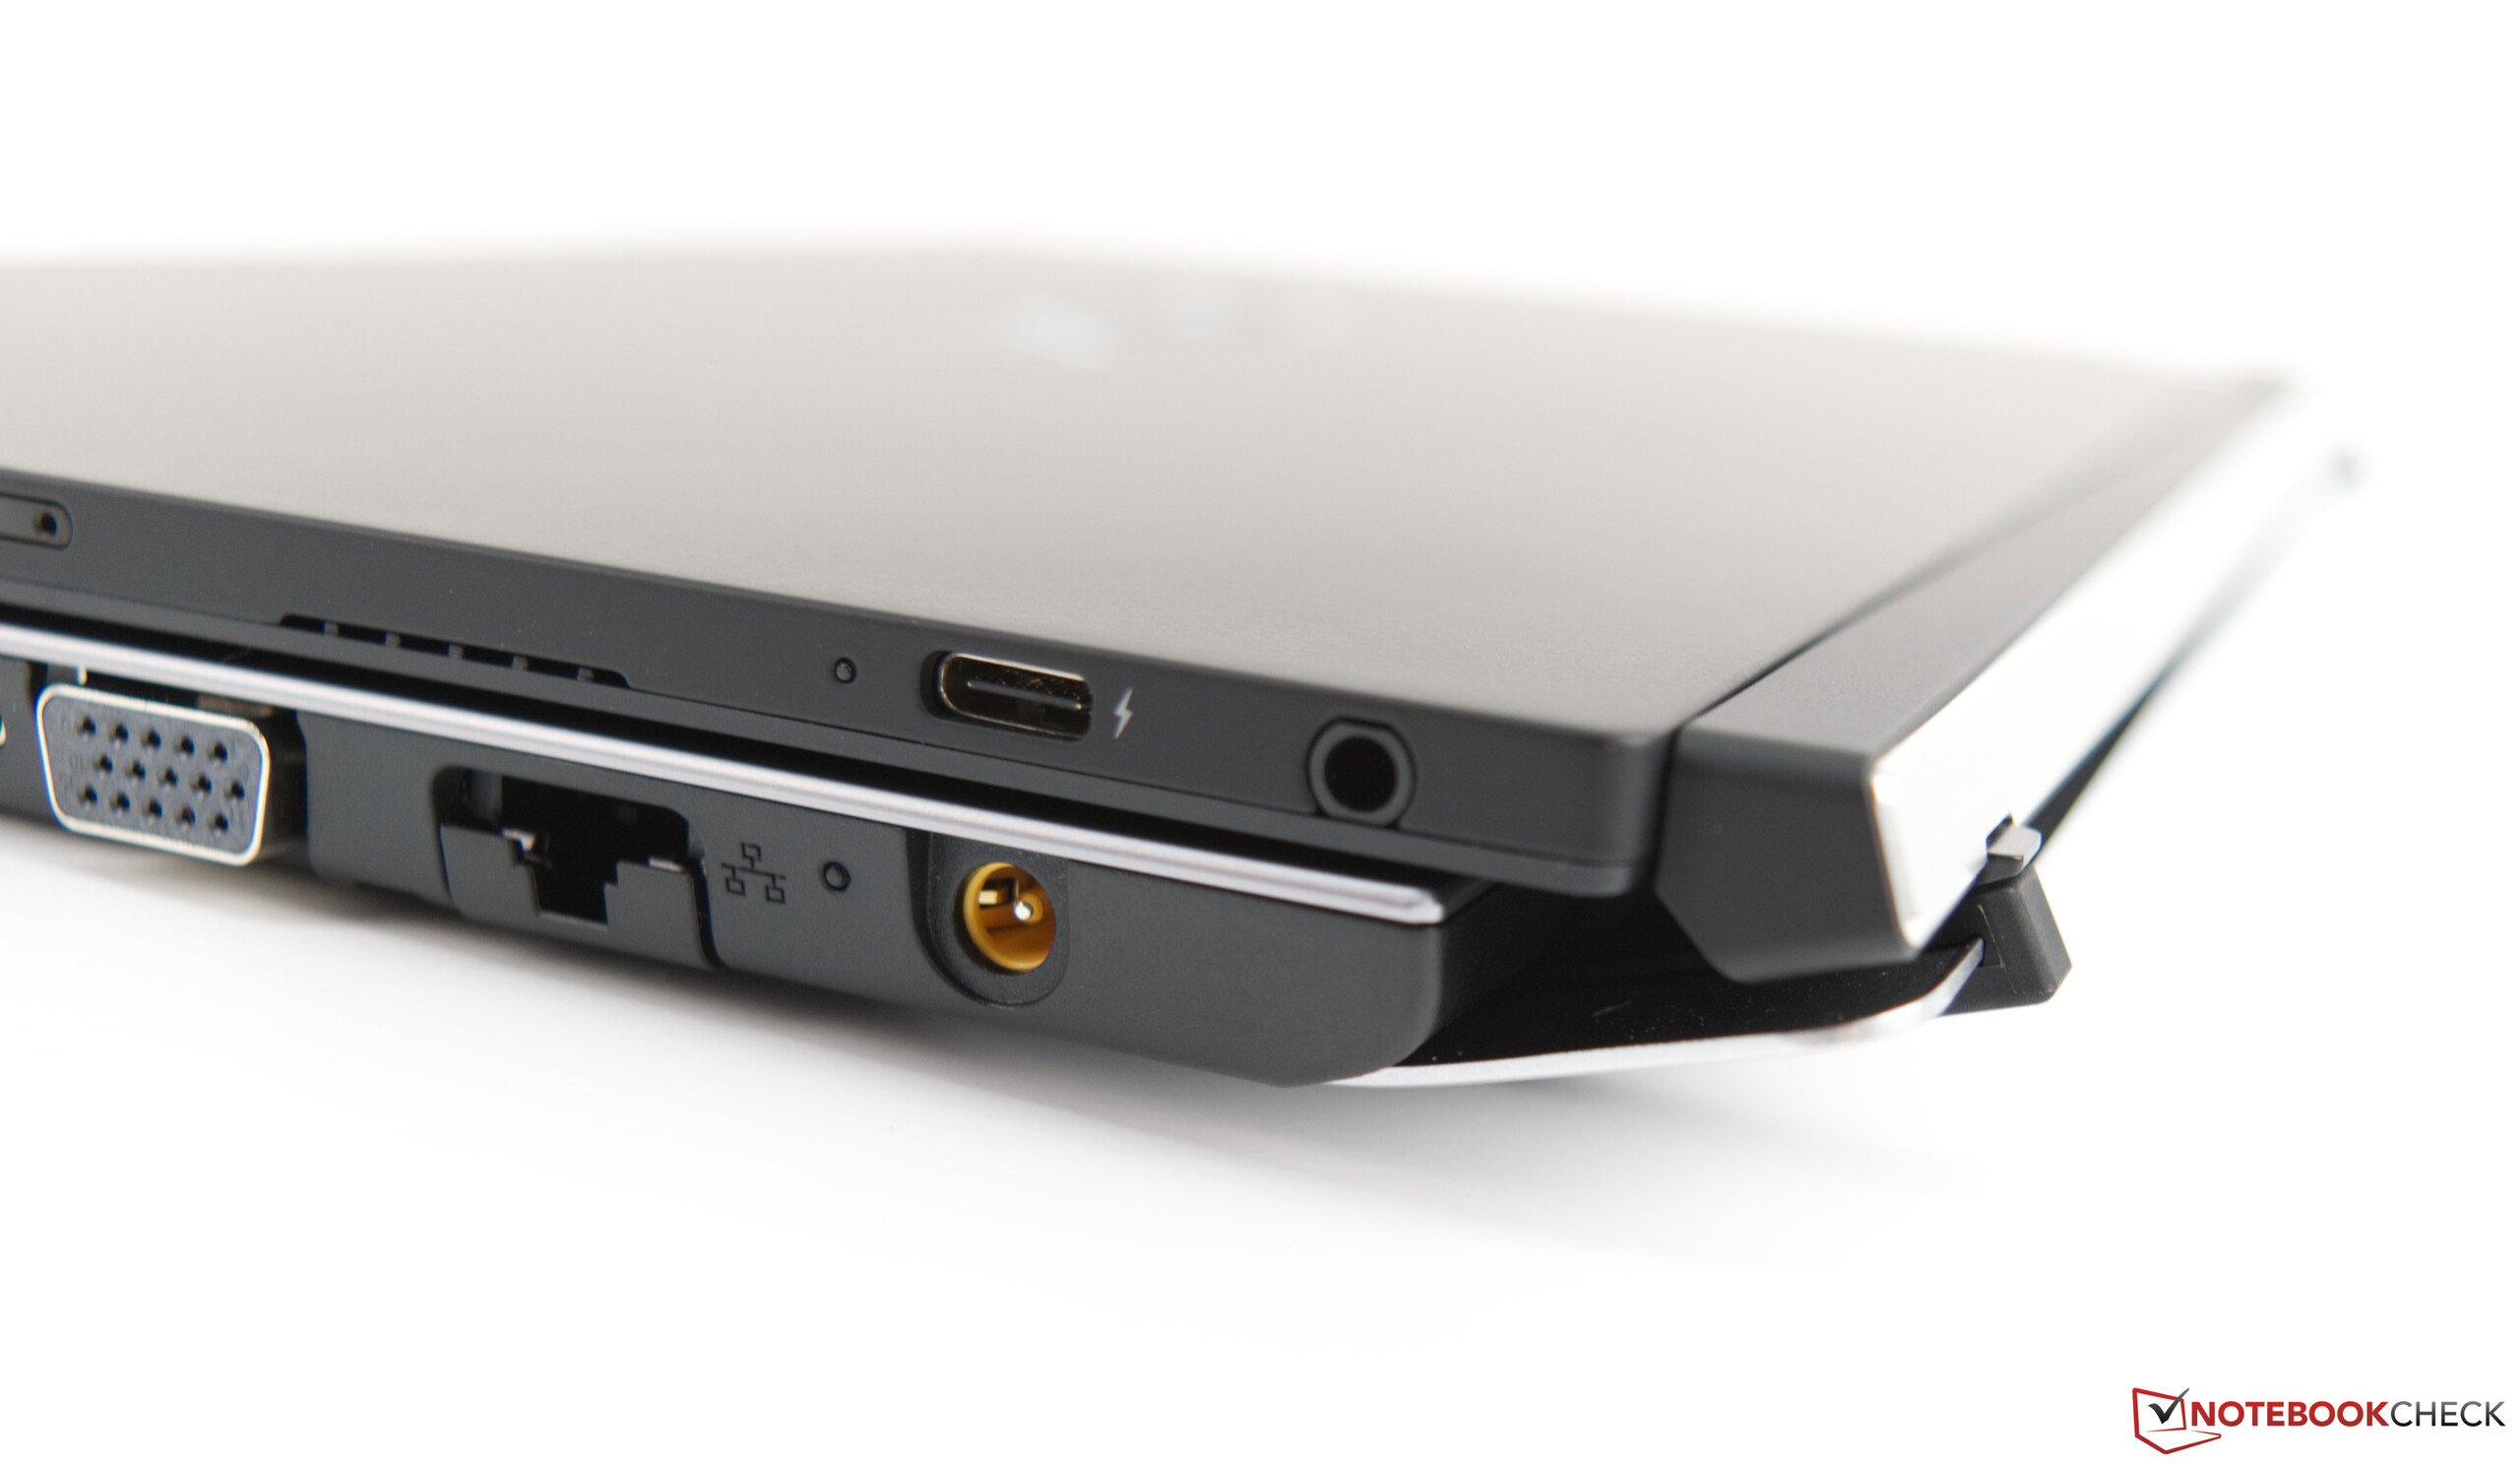
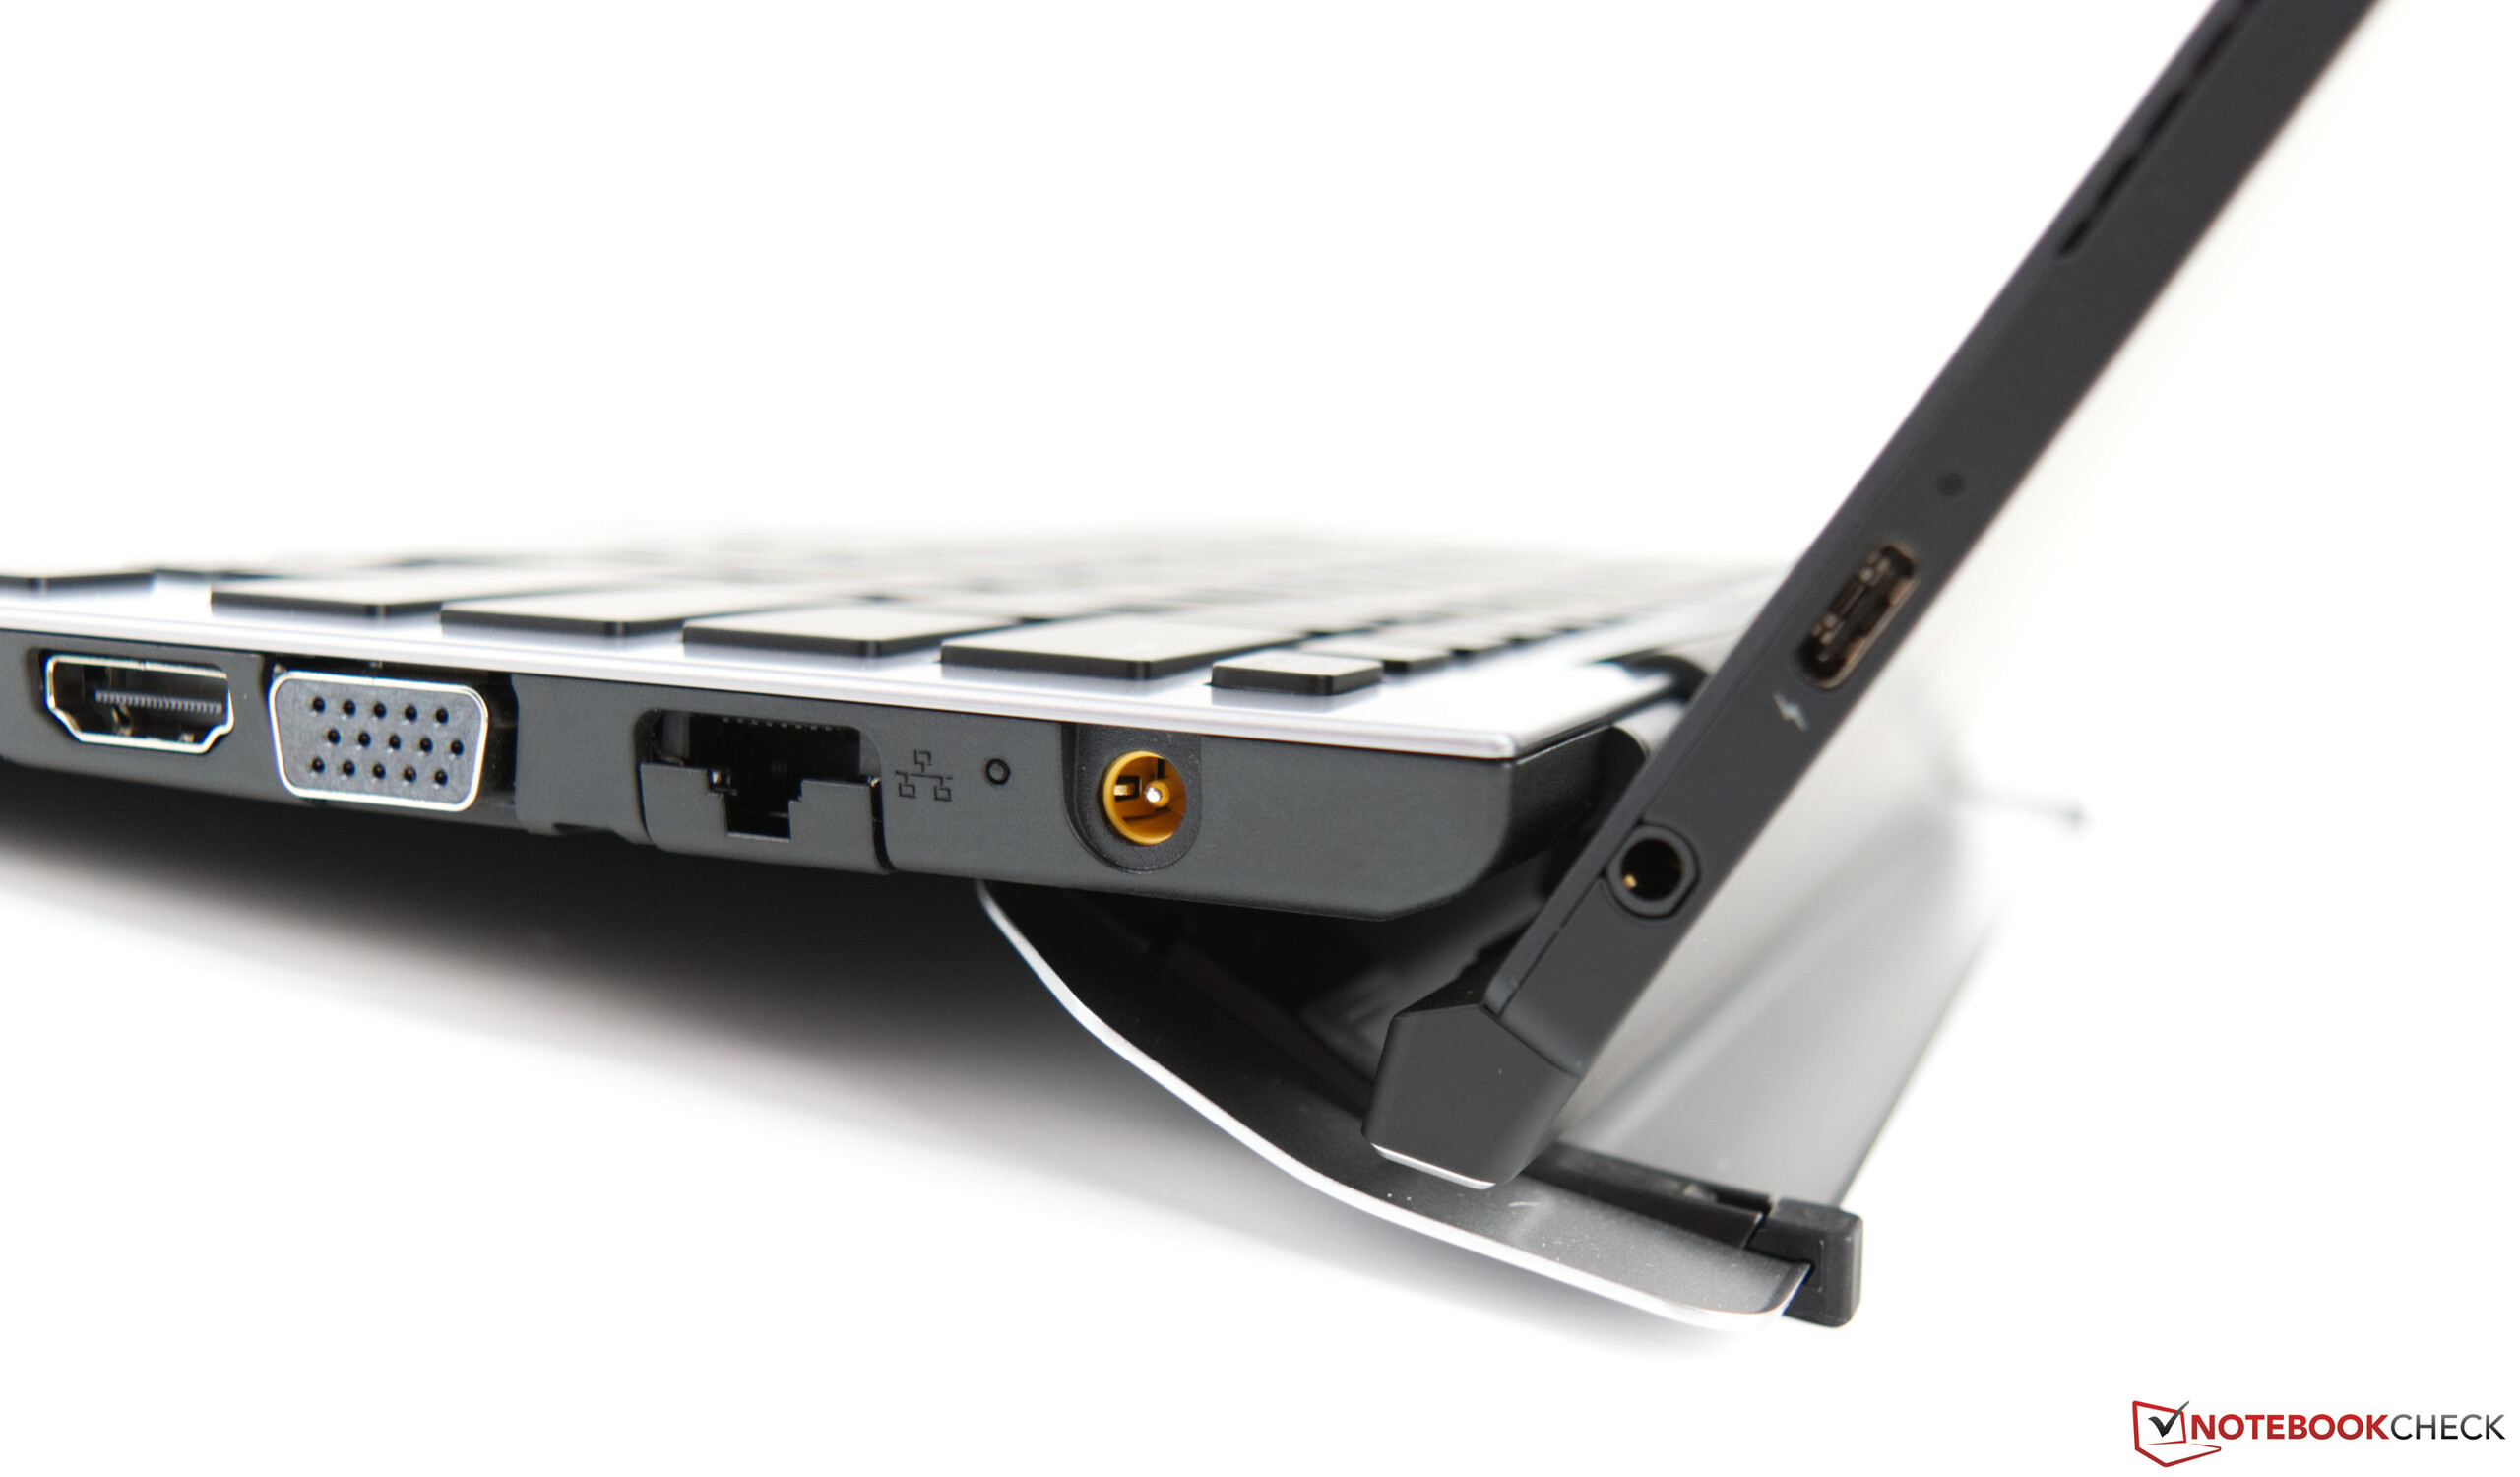
En we zouden niet zo kritisch zijn op de A12 als deze goedkoper was geweest. We kunnen vergevingsgezind zijn voor een apparaat met een dim beeldscherm, kleine batterij, ondermaatse luidsprekers en slecht geplaatste poorten als het een scherpe prijs had, maar bij een convertible van € 2799 is dat onacceptabel. De Surface Pro 6 heeft geen van de problemen van de A12, heeft een krachtiger CPU en is ook nog eens bijna € 800 goedkoper.
Kortom, de A12 voldoet niet aan onze verwachtingen en doet te weinig om het hoge prijskaartje te rechtvaardigen. Hoewel de VAIO A12 een respectabele 82% scoort, raden we aan om een van de concurrenten aan te schaffen: je bent dan goedkoper uit en zult er ook nog een beter apparaat voor krijgen.
VAIO A12-92993
- 02-05-2019 v6 (old)
Sebastian Bade
Price comparison
