Kort testrapport HP EliteBook x360 1030 G2 (Core i5, Full HD) Convertible
| Networking | |
| iperf3 transmit AX12 | |
| Lenovo ThinkPad X1 Carbon 2017-20HQS03P00 | |
| Lenovo ThinkPad Yoga 370-20JJS00100 | |
| HP EliteBook x360 1030 G2 | |
| iperf3 receive AX12 | |
| Lenovo ThinkPad Yoga 370-20JJS00100 | |
| Lenovo ThinkPad X1 Carbon 2017-20HQS03P00 | |
| HP EliteBook x360 1030 G2 | |
| |||||||||||||||||||||||||
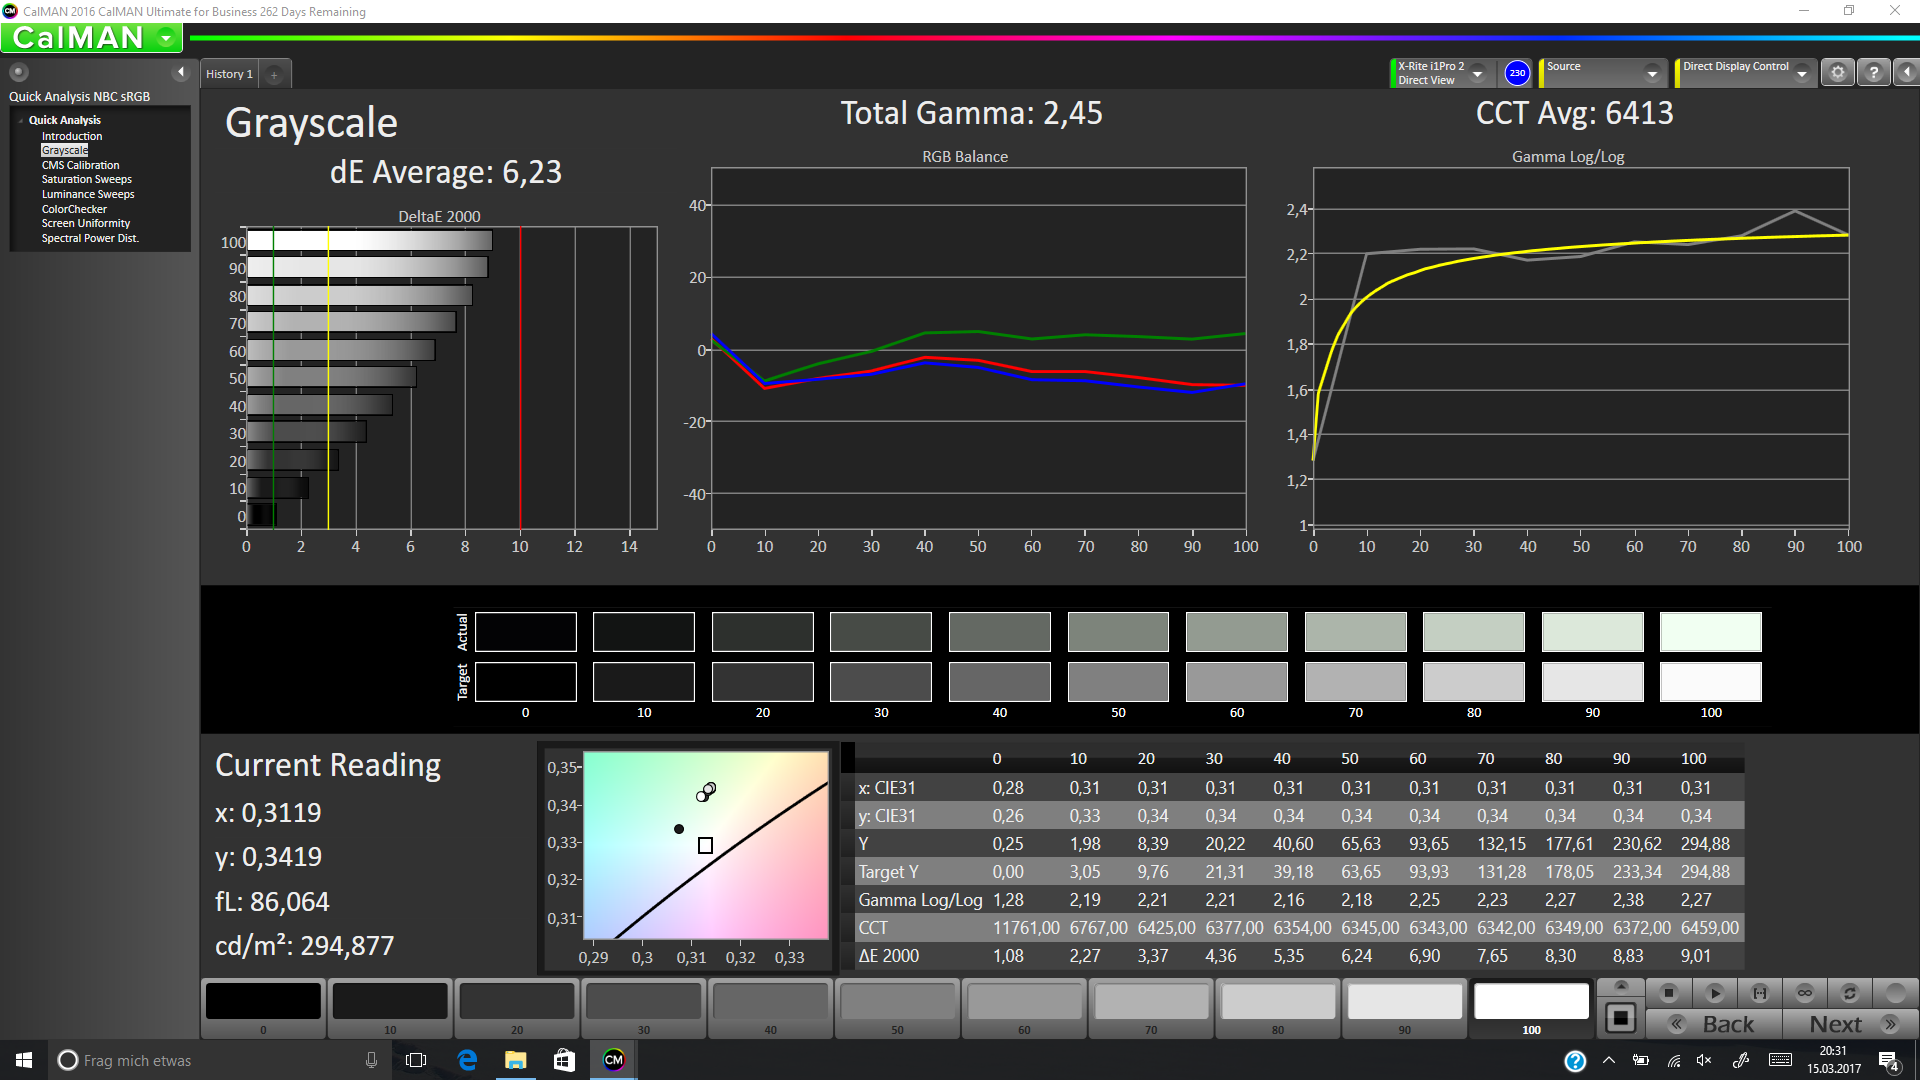
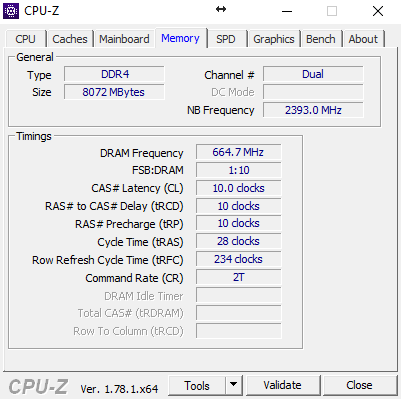
Helderheidsverdeling: 83 %
Helderheid in Batterij-modus: 261 cd/m²
Contrast: 1048:1 (Zwart: 0.25 cd/m²)
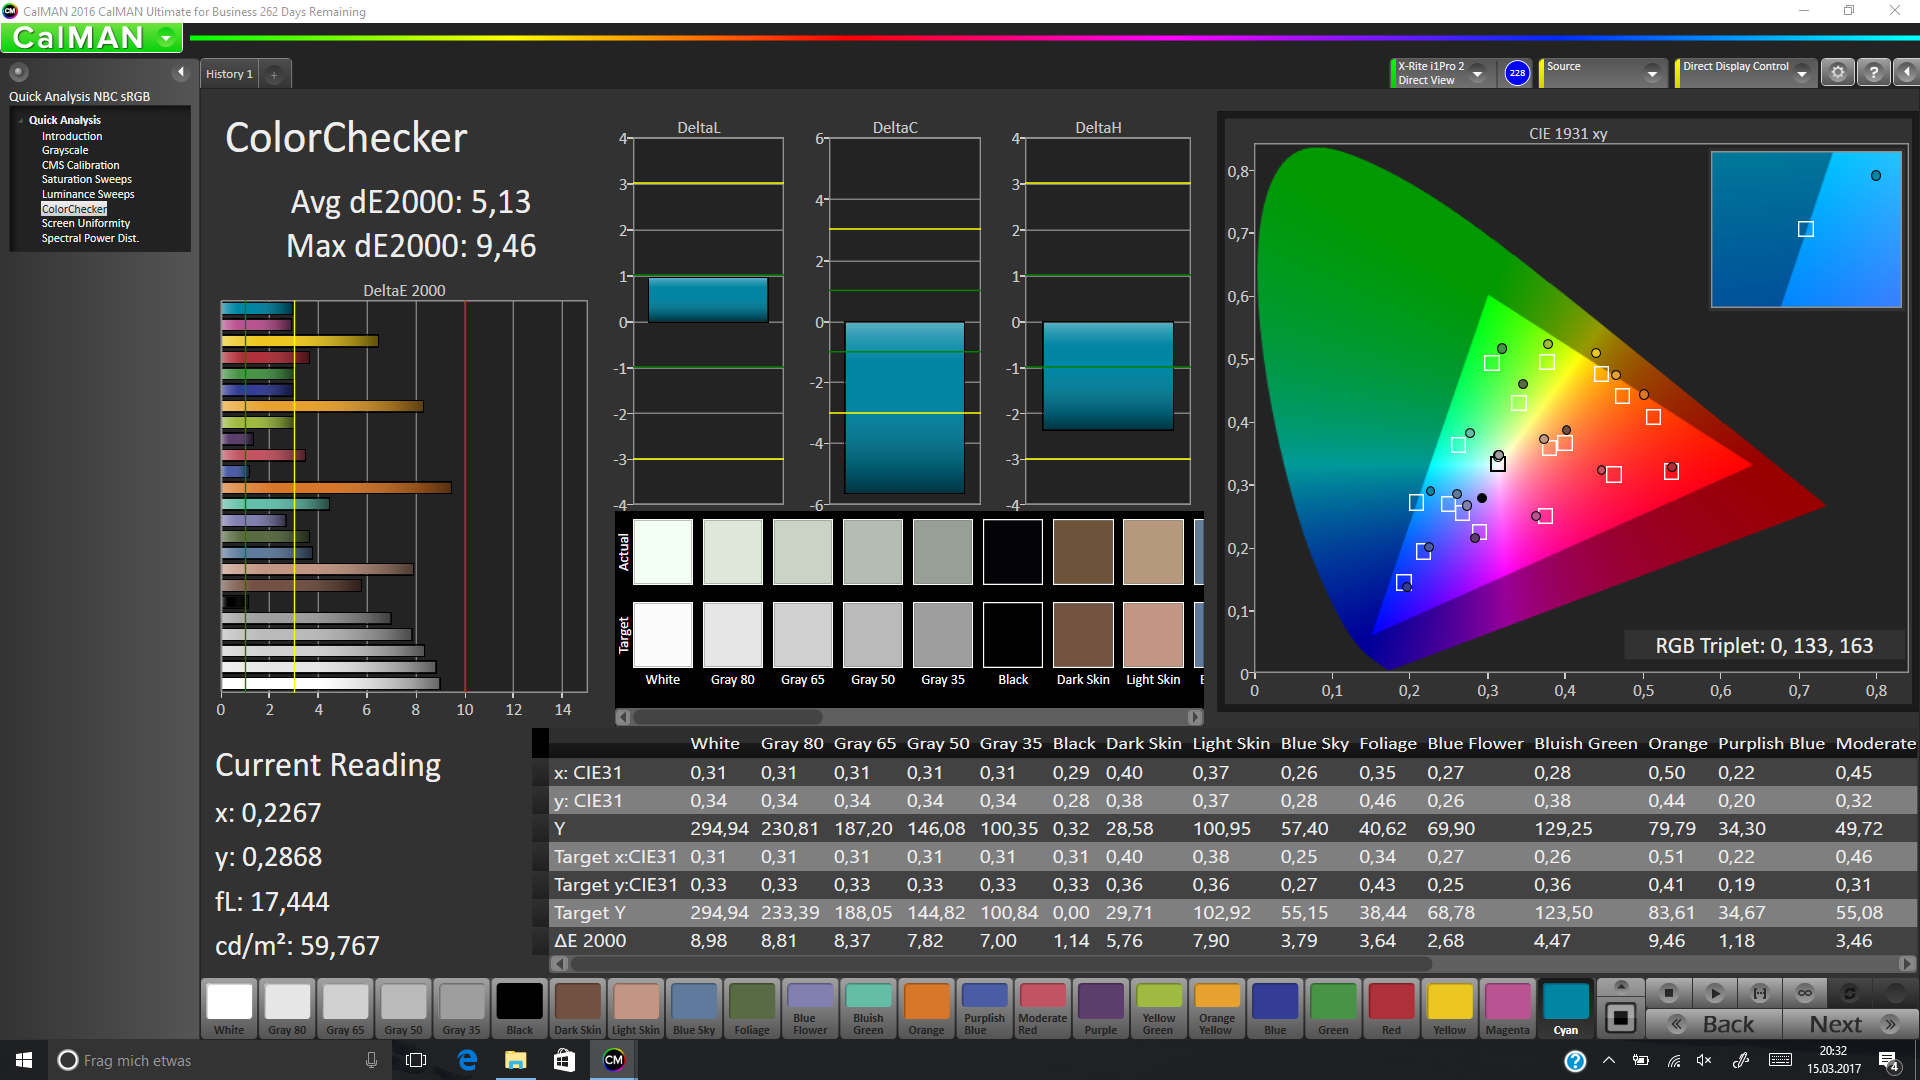
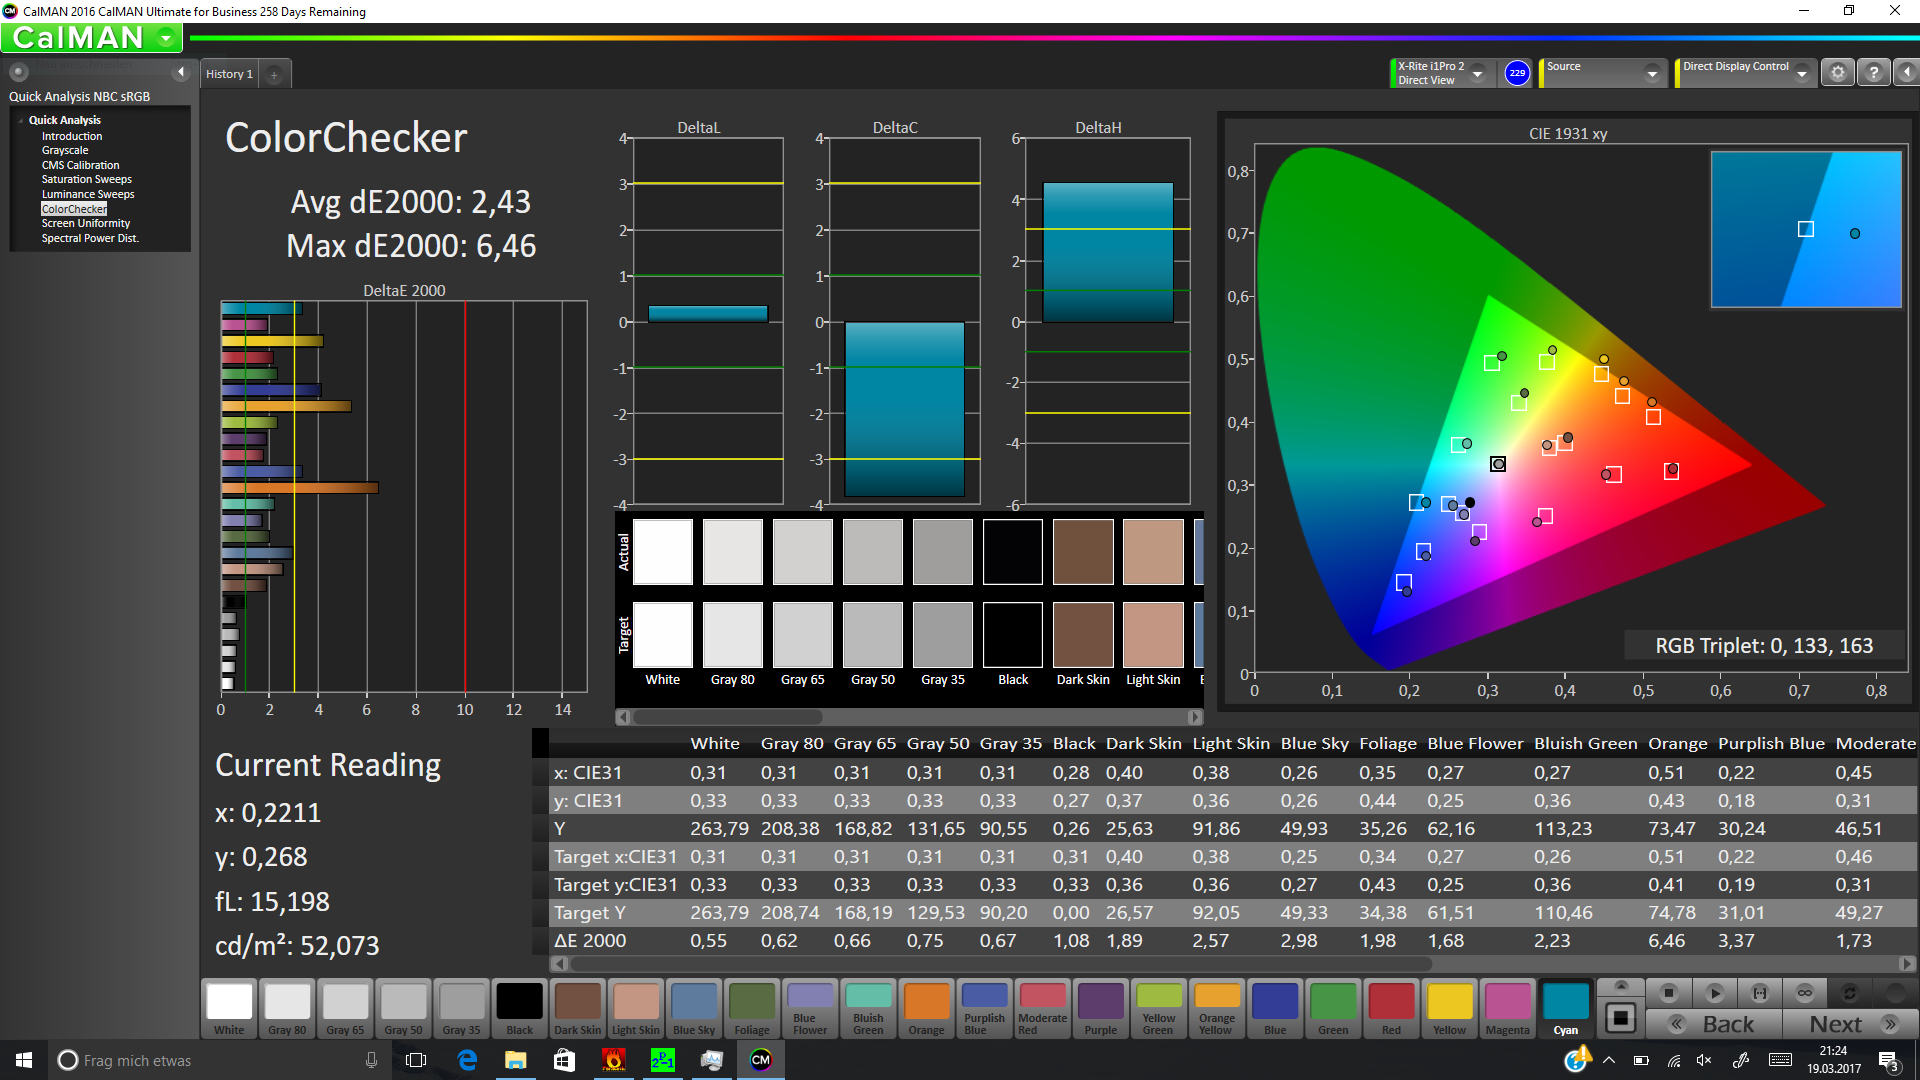
ΔE ColorChecker Calman: 5.13 | ∀{0.5-29.43 Ø4.71}
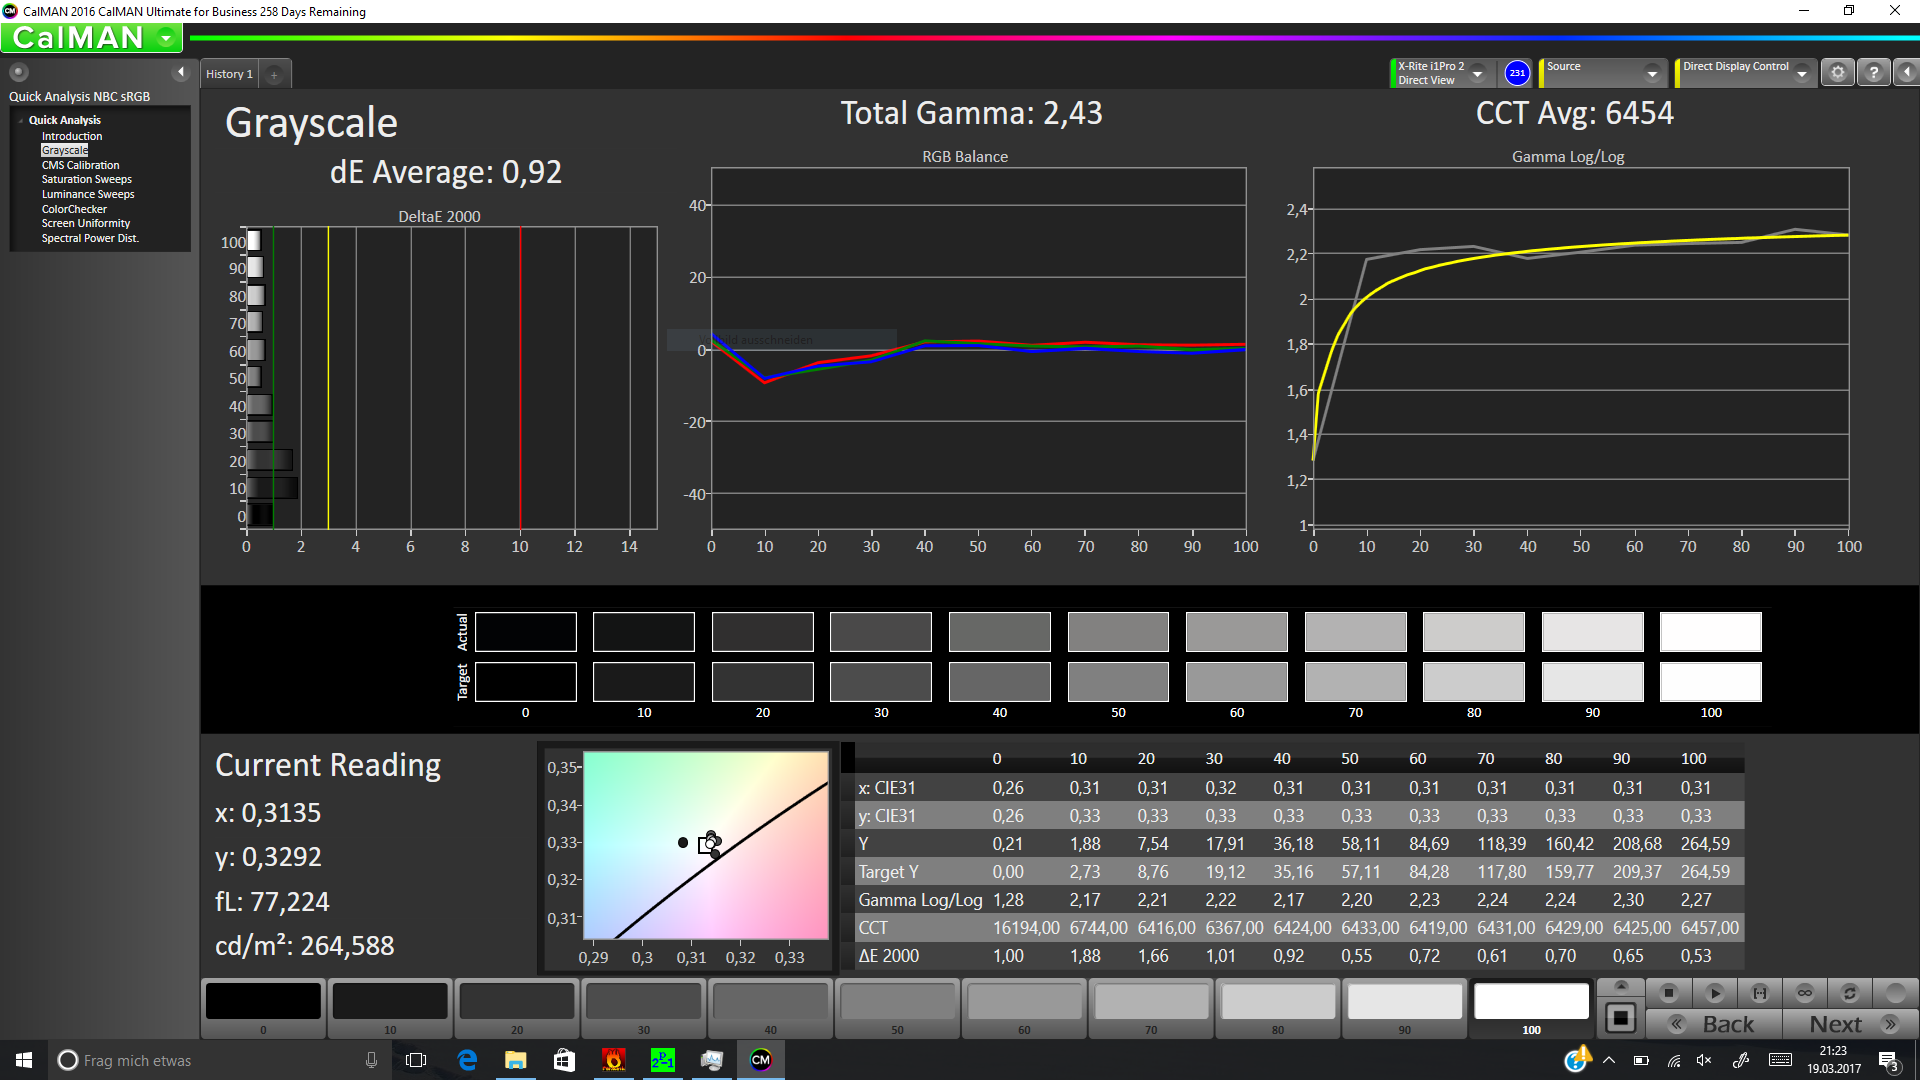
ΔE Greyscale Calman: 6.23 | ∀{0.09-98 Ø4.96}
88.57% sRGB (Argyll 1.6.3 3D)
57.84% AdobeRGB 1998 (Argyll 1.6.3 3D)
64.9% AdobeRGB 1998 (Argyll 3D)
88.8% sRGB (Argyll 3D)
65.5% Display P3 (Argyll 3D)
Gamma: 2.45
CCT: 6413 K
| HP EliteBook x360 1030 G2 CMN1374, 1920x1080, 13.3" | Lenovo Yoga 910-13IKB-80VF004CGE AU Optronics AUO323D / B139HAN03.2, 3840x2160, 13.9" | Lenovo ThinkPad X1 Yoga-20FRS1VS00 Samsung ATNA40JU01-0, 2560x1440, 14" | Lenovo ThinkPad X1 Carbon 2017-20HQS03P00 B140HAN03_1, 1920x1080, 14" | Dell Latitude 13 7370 Sharp LQ133M1, 1920x1080, 13.3" | HP Spectre x360 13-w023dx Chi Mei CMN1367, 1920x1080, 13.3" | Lenovo ThinkPad Yoga 370-20JJS00100 Sharp LQ133M1JX15, 1920x1080, 13.3" | |
|---|---|---|---|---|---|---|---|
| Display | -2% | -4% | -16% | 1% | 7% | ||
| Display P3 Coverage (%) | 65.5 | 62.2 -5% | 61.4 -6% | 52.2 -20% | 65.4 0% | 67.9 4% | |
| sRGB Coverage (%) | 88.8 | 90.1 1% | 85.9 -3% | 78.3 -12% | 90.4 2% | 97.3 10% | |
| AdobeRGB 1998 Coverage (%) | 64.9 | 63.5 -2% | 62.4 -4% | 53.9 -17% | 65.8 1% | 69.9 8% | |
| Response Times | 15% | 97% | 5% | -8% | 19% | 2% | |
| Response Time Grey 50% / Grey 80% * (ms) | 55.2 ? | 46 ? 17% | 1 ? 98% | 41.6 ? 25% | 50.4 ? 9% | 33.2 ? 40% | 42 ? 24% |
| Response Time Black / White * (ms) | 27.2 ? | 24 ? 12% | 1 ? 96% | 31.6 ? -16% | 33.6 ? -24% | 28 ? -3% | 32.8 ? -21% |
| PWM Frequency (Hz) | 240 ? | 217.4 ? | |||||
| Screen | -4% | 16% | 5% | -1% | -5% | 9% | |
| Brightness middle (cd/m²) | 262 | 348 33% | 279 6% | 311 19% | 261 0% | 334.6 28% | 374 43% |
| Brightness (cd/m²) | 256 | 310 21% | 277 8% | 288 13% | 241 -6% | 319 25% | 356 39% |
| Brightness Distribution (%) | 83 | 80 -4% | 91 10% | 85 2% | 85 2% | 90 8% | 87 5% |
| Black Level * (cd/m²) | 0.25 | 0.25 -0% | 0.24 4% | 0.26 -4% | 0.336 -34% | 0.33 -32% | |
| Contrast (:1) | 1048 | 1392 33% | 1296 24% | 1004 -4% | 996 -5% | 1133 8% | |
| Colorchecker dE 2000 * | 5.13 | 7.86 -53% | 5.15 -0% | 5.5 -7% | 4.3 16% | 6.21 -21% | 4.7 8% |
| Colorchecker dE 2000 max. * | 9.46 | 13.43 -42% | 8.28 12% | 9 5% | 8.66 8% | 12 -27% | 9.5 -0% |
| Greyscale dE 2000 * | 6.23 | 8.25 -32% | 5.44 13% | 6.2 -0% | 5.82 7% | 7.71 -24% | 6.5 -4% |
| Gamma | 2.45 90% | 2.05 107% | 2.28 96% | 2.02 109% | 2.44 90% | 2.36 93% | 2.19 100% |
| CCT | 6413 101% | 6834 95% | 5686 114% | 5950 109% | 6771 96% | 6458 101% | 7086 92% |
| Color Space (Percent of AdobeRGB 1998) (%) | 57.84 | 58 0% | 98 69% | 55.96 -3% | 49.18 -15% | 58.6 1% | 63.1 9% |
| Color Space (Percent of sRGB) (%) | 88.57 | 90 2% | 100 13% | 85.77 -3% | 77.84 -12% | 90 2% | 97.2 10% |
| Totaal Gemiddelde (Programma / Instellingen) | 3% /
-1% | 57% /
33% | 2% /
3% | -8% /
-5% | 5% /
-0% | 6% /
7% |
* ... kleiner is beter

Responstijd Scherm
| ↔ Responstijd Zwart naar Wit | ||
|---|---|---|
| 27.2 ms ... stijging ↗ en daling ↘ gecombineerd | ↗ 7.6 ms stijging |  |
| ↘ 19.6 ms daling | ||
| Het scherm vertoonde relatief trage responstijden in onze tests en is misschien te traag voor games. Ter vergelijking: alle testtoestellen variëren van 0.1 (minimum) tot 240 (maximum) ms. » 69 % van alle toestellen zijn beter. Dit betekent dat de gemeten responstijd slechter is dan het gemiddelde (19.8 ms) van alle geteste toestellen. | ||
| ↔ Responstijd 50% Grijs naar 80% Grijs | ||
| 55.2 ms ... stijging ↗ en daling ↘ gecombineerd | ↗ 21.2 ms stijging | 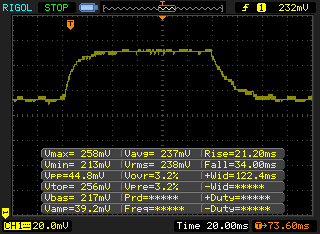 |
| ↘ 34 ms daling | ||
| Het scherm vertoonde trage responstijden in onze tests en is misschien te traag voor games. Ter vergelijking: alle testtoestellen variëren van 0.165 (minimum) tot 636 (maximum) ms. » 92 % van alle toestellen zijn beter. Dit betekent dat de gemeten responstijd slechter is dan het gemiddelde (30.9 ms) van alle geteste toestellen. | ||
Screen Flickering / PWM (Pulse-Width Modulation)
| Screen flickering / PWM niet waargenomen | ||
Ter vergelijking: 52 % van alle geteste toestellen maakten geen gebruik van PWM om de schermhelderheid te verlagen. Als het wel werd gebruikt, werd een gemiddelde van 7748 (minimum: 5 - maximum: 343500) Hz waargenomen. | ||
| Cinebench R15 | |
| CPU Single 64Bit | |
| Lenovo Yoga 910-13IKB-80VF004CGE | |
| HP EliteBook x360 1030 G2 | |
| Lenovo ThinkPad X1 Carbon 2017-20HQS03P00 | |
| Lenovo ThinkPad X1 Yoga-20FRS1VS00 | |
| HP Spectre x360 13-w023dx | |
| Lenovo ThinkPad Yoga 370-20JJS00100 | |
| Dell Latitude 13 7370 | |
| CPU Multi 64Bit | |
| Lenovo ThinkPad X1 Carbon 2017-20HQS03P00 | |
| Lenovo Yoga 910-13IKB-80VF004CGE | |
| HP EliteBook x360 1030 G2 | |
| HP Spectre x360 13-w023dx | |
| Lenovo ThinkPad Yoga 370-20JJS00100 | |
| Lenovo ThinkPad X1 Yoga-20FRS1VS00 | |
| Dell Latitude 13 7370 | |
| Cinebench R11.5 | |
| CPU Single 64Bit | |
| HP Spectre x360 13-w023dx | |
| HP EliteBook x360 1030 G2 | |
| Lenovo ThinkPad X1 Yoga-20FRS1VS00 | |
| Dell Latitude 13 7370 | |
| CPU Multi 64Bit | |
| HP EliteBook x360 1030 G2 | |
| HP Spectre x360 13-w023dx | |
| Lenovo ThinkPad X1 Yoga-20FRS1VS00 | |
| Dell Latitude 13 7370 | |
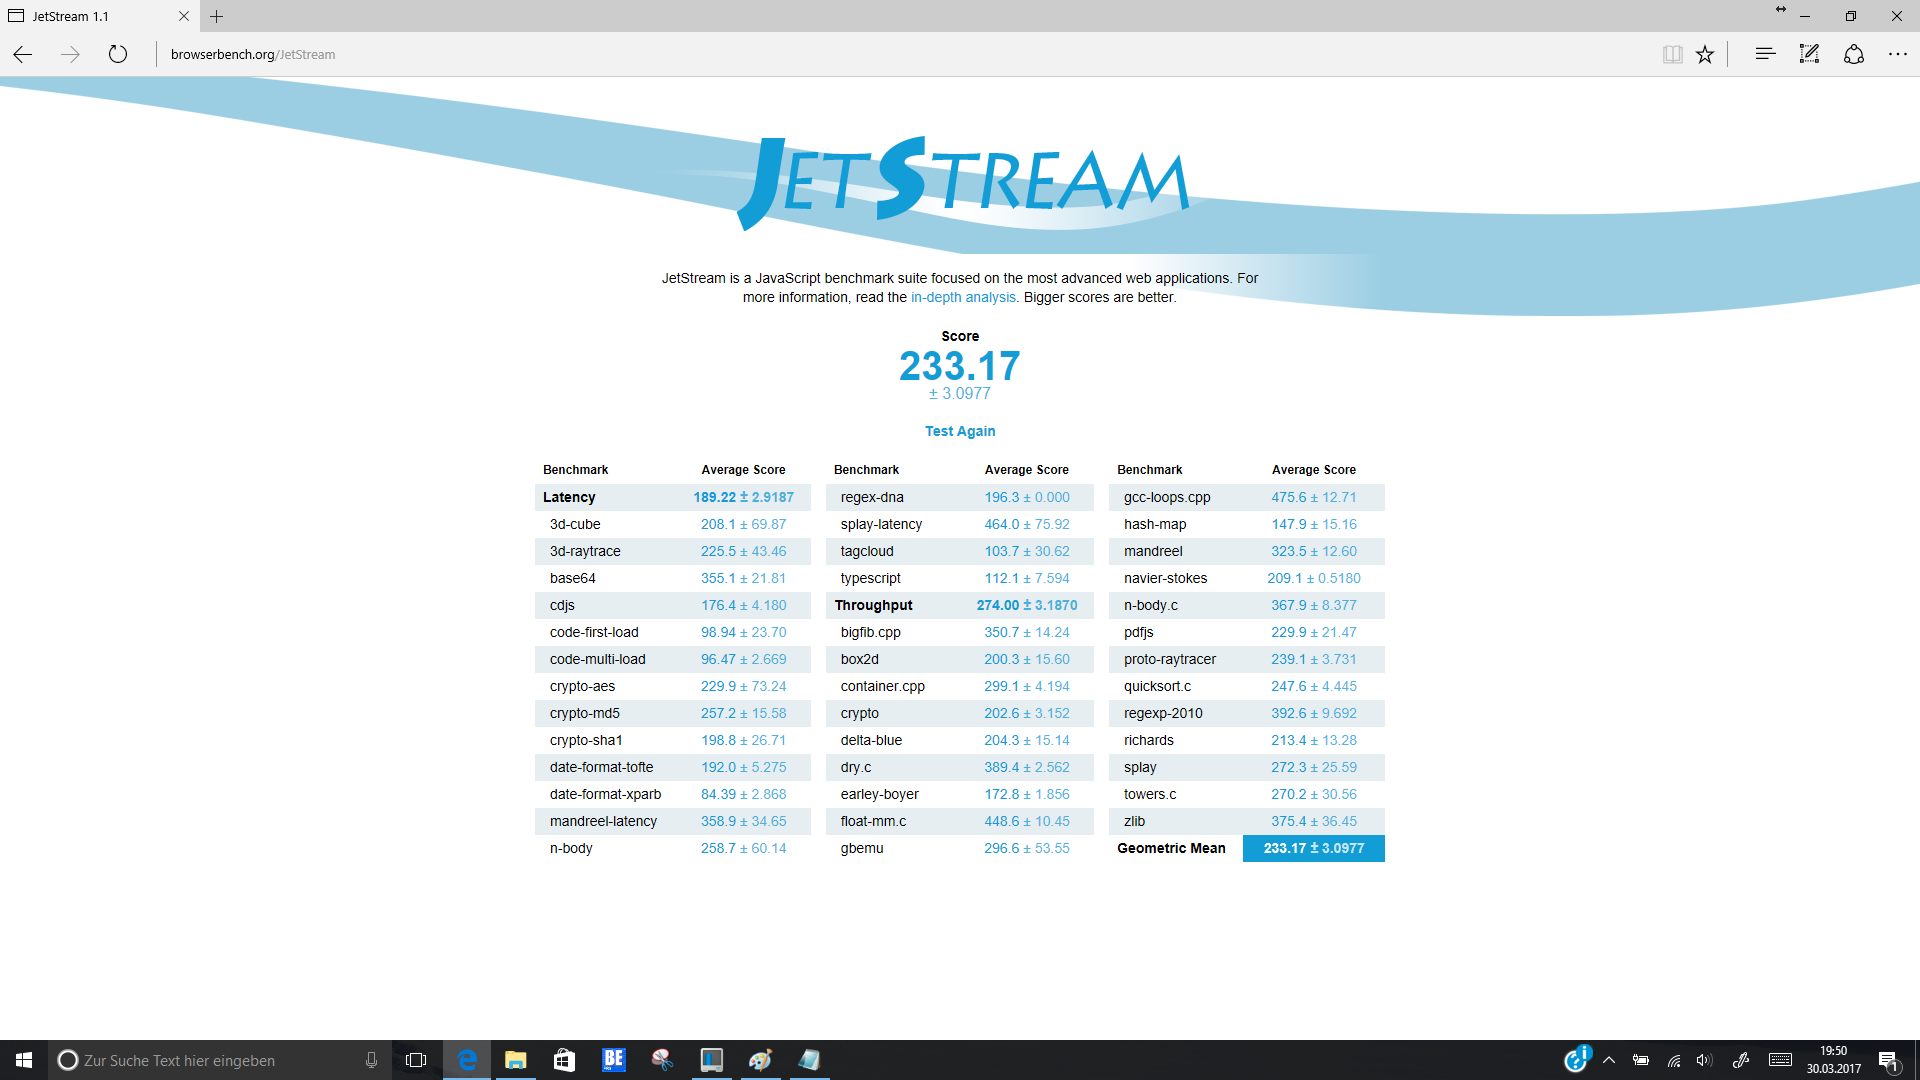
| JetStream 1.1 - 1.1 Total | |
| Lenovo Yoga 910-13IKB-80VF004CGE | |
| Lenovo ThinkPad X1 Carbon 2017-20HQS03P00 | |
| HP EliteBook x360 1030 G2 | |
| Lenovo ThinkPad Yoga 370-20JJS00100 | |
| Lenovo ThinkPad X1 Yoga-20FRS1VS00 | |
| Dell Latitude 13 7370 | |
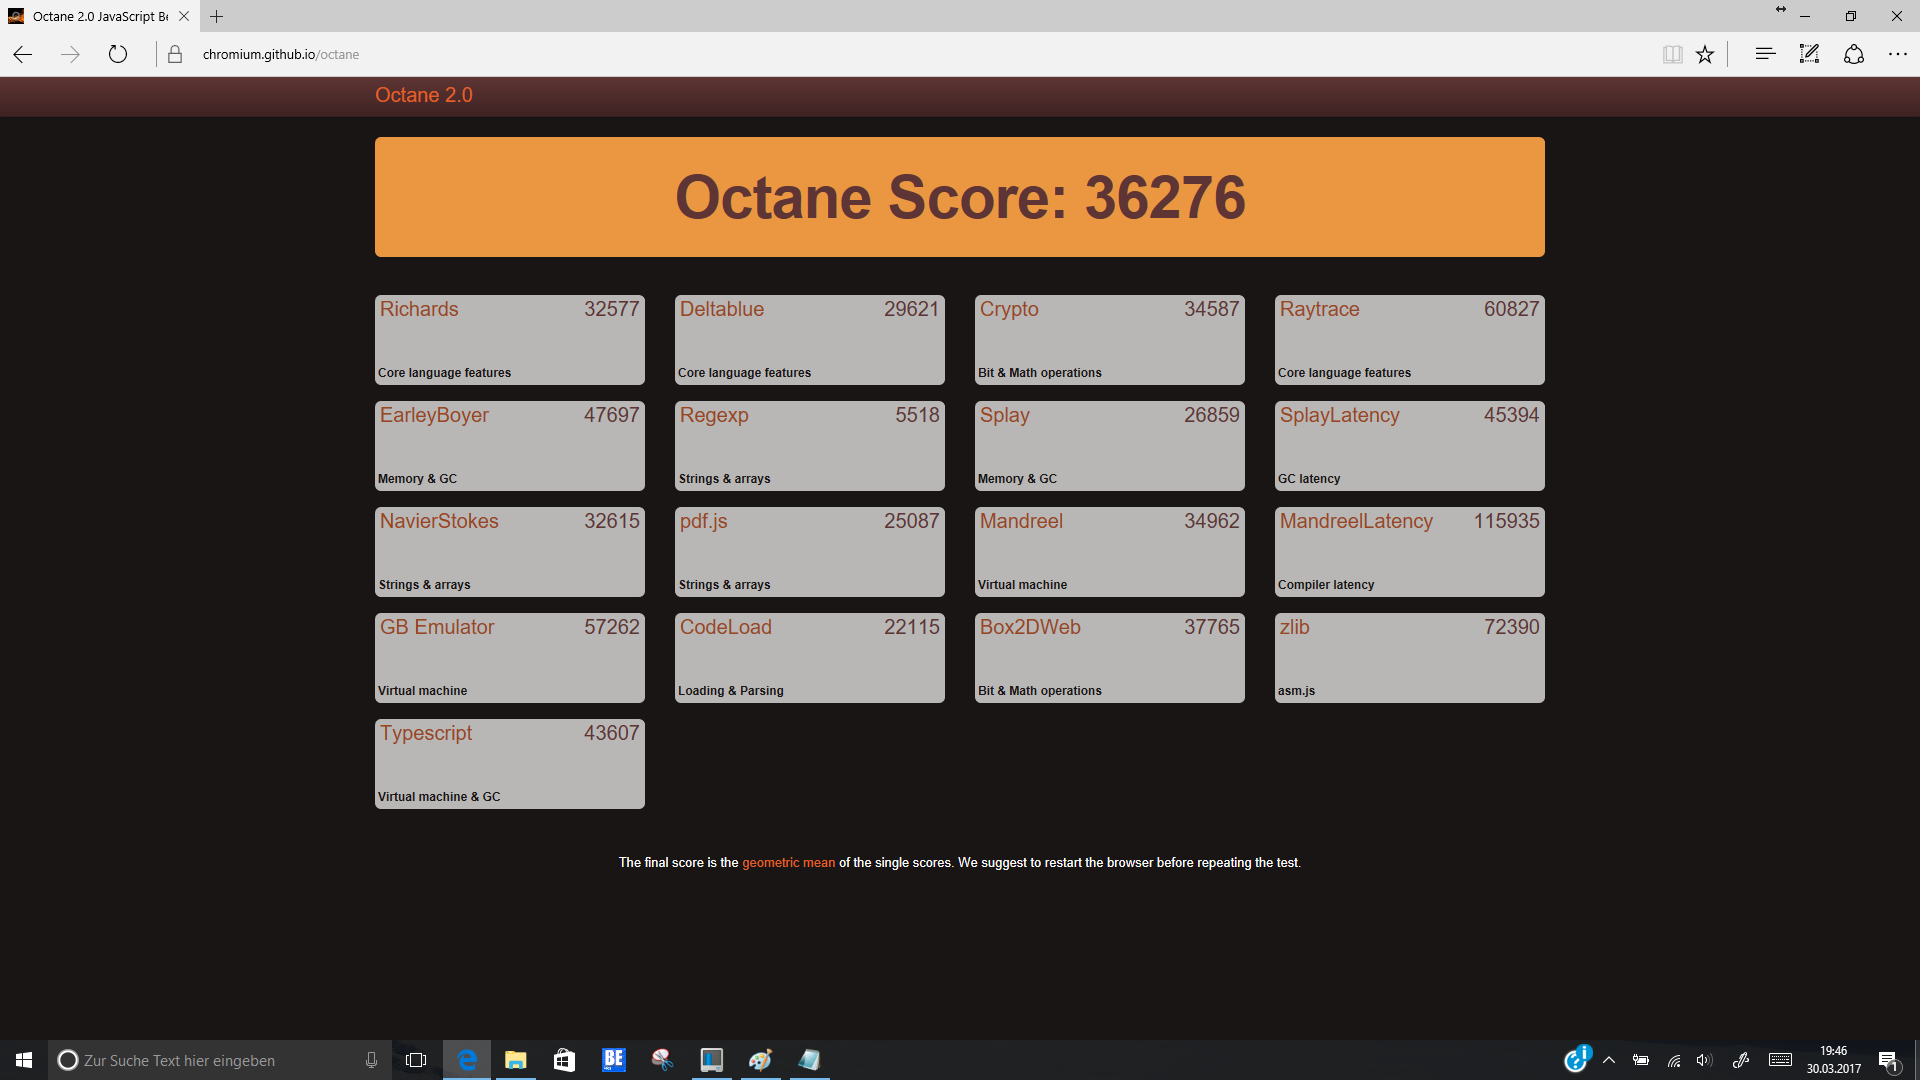
| Octane V2 - Total Score | |
| Lenovo Yoga 910-13IKB-80VF004CGE | |
| HP EliteBook x360 1030 G2 | |
| Lenovo ThinkPad X1 Carbon 2017-20HQS03P00 | |
| Lenovo ThinkPad Yoga 370-20JJS00100 | |
| Lenovo ThinkPad X1 Yoga-20FRS1VS00 | |
| Dell Latitude 13 7370 | |
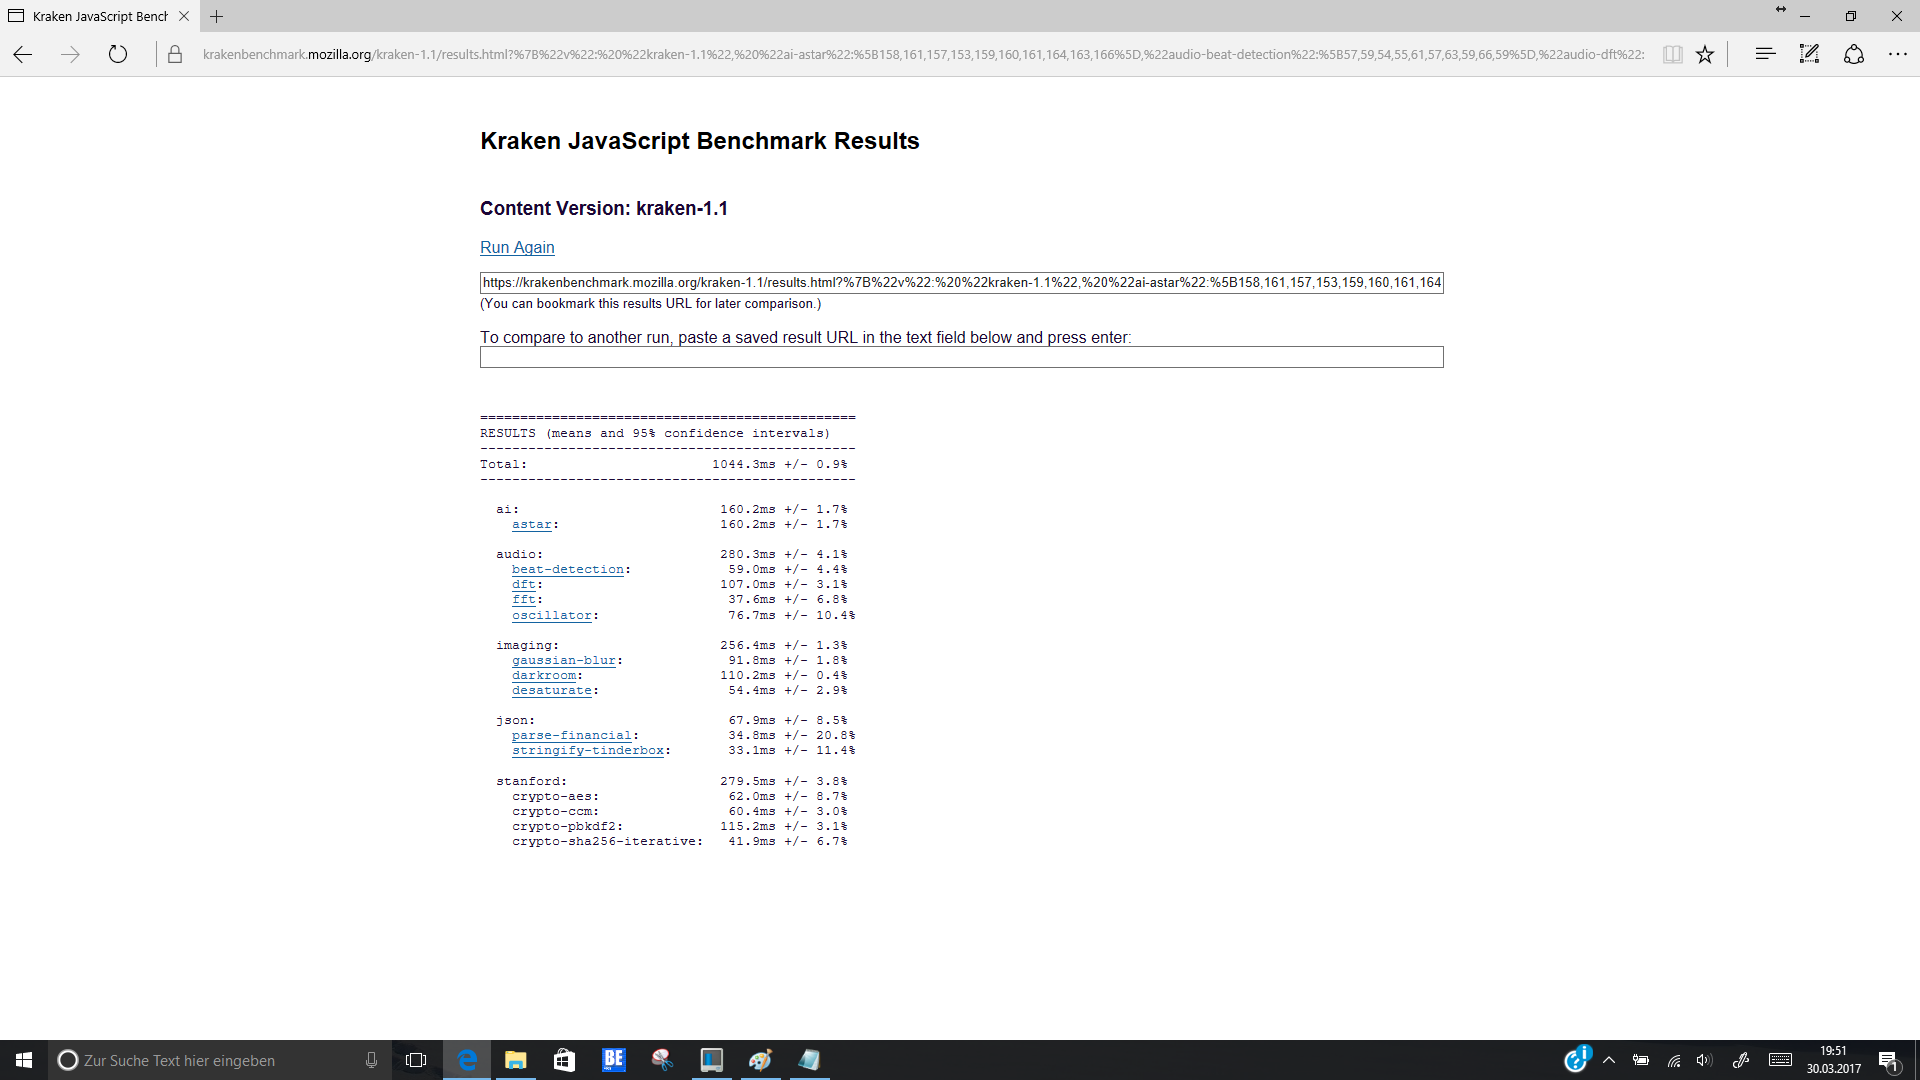
| Mozilla Kraken 1.1 - Total | |
| Dell Latitude 13 7370 | |
| Lenovo ThinkPad X1 Yoga-20FRS1VS00 | |
| Lenovo ThinkPad Yoga 370-20JJS00100 | |
| HP EliteBook x360 1030 G2 | |
| Lenovo ThinkPad X1 Carbon 2017-20HQS03P00 | |
| Lenovo Yoga 910-13IKB-80VF004CGE | |
* ... kleiner is beter
| PCMark 8 | |
| Home Score Accelerated v2 | |
| Lenovo ThinkPad X1 Carbon 2017-20HQS03P00 | |
| HP Spectre x360 13-w023dx | |
| HP EliteBook x360 1030 G2 | |
| Lenovo Yoga 910-13IKB-80VF004CGE | |
| Lenovo ThinkPad Yoga 370-20JJS00100 | |
| Lenovo ThinkPad X1 Yoga-20FRS1VS00 | |
| Dell Latitude 13 7370 | |
| Work Score Accelerated v2 | |
| Lenovo ThinkPad X1 Carbon 2017-20HQS03P00 | |
| HP Spectre x360 13-w023dx | |
| HP EliteBook x360 1030 G2 | |
| Lenovo ThinkPad X1 Yoga-20FRS1VS00 | |
| Lenovo ThinkPad Yoga 370-20JJS00100 | |
| Dell Latitude 13 7370 | |
| Creative Score Accelerated v2 | |
| Lenovo ThinkPad X1 Carbon 2017-20HQS03P00 | |
| HP EliteBook x360 1030 G2 | |
| HP Spectre x360 13-w023dx | |
| Lenovo ThinkPad Yoga 370-20JJS00100 | |
| Dell Latitude 13 7370 | |
| PCMark 7 | |
| Score | |
| Dell Latitude 13 7370 | |
| Productivity | |
| Dell Latitude 13 7370 | |
| PCMark 8 Home Score Accelerated v2 | 3774 punten | |
| PCMark 8 Creative Score Accelerated v2 | 4781 punten | |
| PCMark 8 Work Score Accelerated v2 | 4803 punten | |
Help | ||
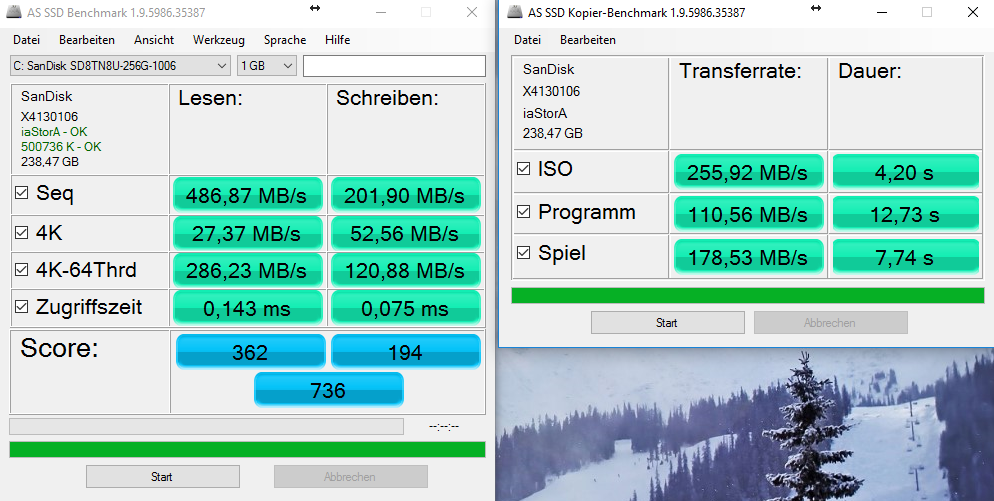
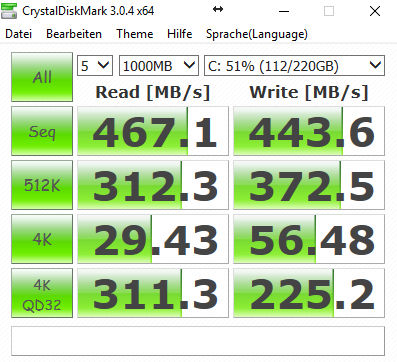
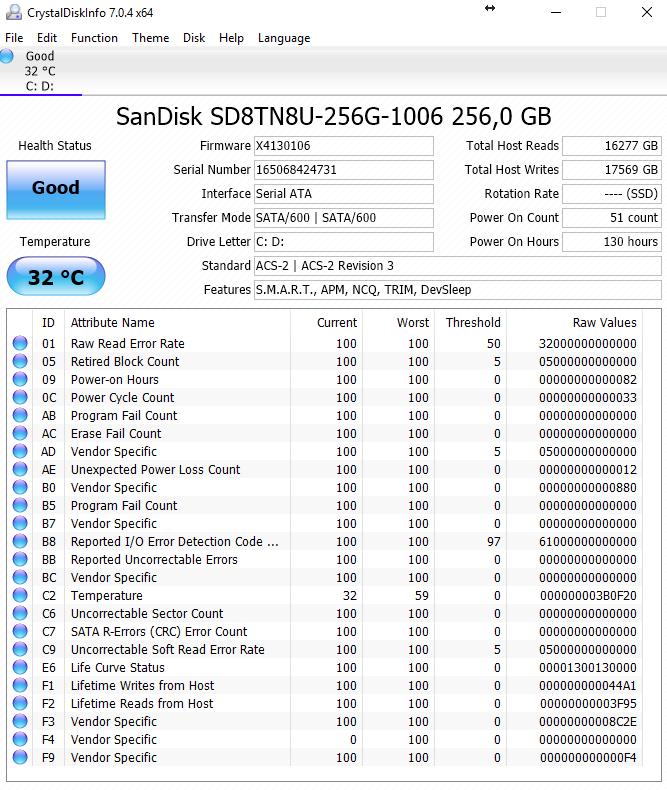
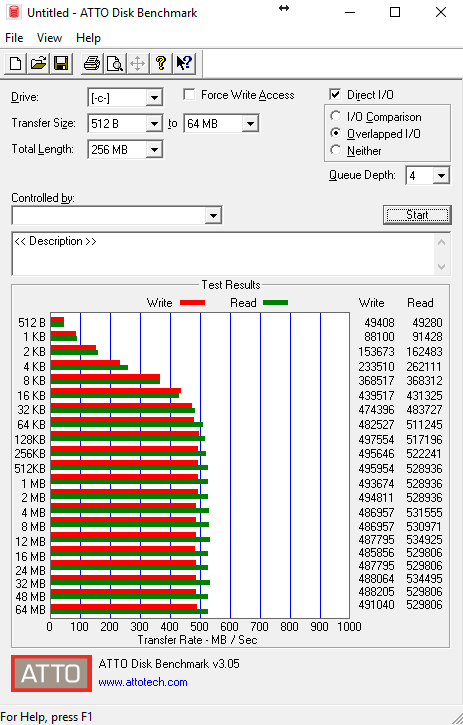
| HP EliteBook x360 1030 G2 Sandisk SD8TN8U-256G-1006 | Lenovo Yoga 910-13IKB-80VF004CGE Samsung PM951 NVMe MZVLV512 | Lenovo ThinkPad X1 Yoga-20FRS1VS00 Samsung SSD PM961 1TB M.2 PCIe 3.0 x4 NVMe (MZSLW1T0) | Lenovo ThinkPad X1 Carbon 2017-20HQS03P00 Samsung PM961 NVMe MZVLW512HMJP | Dell Latitude 13 7370 Toshiba NVMe THNSN5256GPU7 | HP Spectre x360 13-w023dx Samsung PM951 NVMe MZVLV512 | Lenovo ThinkPad Yoga 370-20JJS00100 Toshiba NVMe THNSF5512GPUK | |
|---|---|---|---|---|---|---|---|
| CrystalDiskMark 3.0 | 105% | 102% | 173% | 124% | 89% | 68% | |
| Read Seq (MB/s) | 467.1 | 1412 202% | 1510 223% | 1827 291% | 1354 190% | 1376 195% | 1070 129% |
| Write Seq (MB/s) | 443.6 | 578 30% | 1193 169% | 1383 212% | 1132 155% | 571 29% | 484.5 9% |
| Read 512 (MB/s) | 312.3 | 701 124% | 814 161% | 1140 265% | 679 117% | 680 118% | |
| Write 512 (MB/s) | 372.5 | 580 56% | 1098 195% | 1020 174% | 571 53% | 483.1 30% | |
| Read 4k (MB/s) | 29.43 | 43.5 48% | 37 26% | 61 107% | 42.13 43% | 42.66 45% | 30.55 4% |
| Write 4k (MB/s) | 56.5 | 159.7 183% | 126 123% | 172.2 205% | 105.8 87% | 137.9 144% | 127.3 125% |
| Read 4k QD32 (MB/s) | 311.3 | 570 83% | 404 30% | 601 93% | 400.5 29% | 535 72% | 460.8 48% |
| Write 4k QD32 (MB/s) | 225.2 | 488.7 117% | 319 42% | 495.6 120% | 328.4 46% | 361.2 60% | 414.5 84% |

| 3DMark | |
| 1280x720 Cloud Gate Standard Graphics | |
| Lenovo Yoga 910-13IKB-80VF004CGE | |
| Lenovo ThinkPad X1 Carbon 2017-20HQS03P00 | |
| HP EliteBook x360 1030 G2 | |
| HP Spectre x360 13-w023dx | |
| Lenovo ThinkPad X1 Yoga-20FRS1VS00 | |
| Lenovo ThinkPad Yoga 370-20JJS00100 | |
| Dell Latitude 13 7370 | |
| 1920x1080 Fire Strike Graphics | |
| Lenovo ThinkPad X1 Carbon 2017-20HQS03P00 | |
| Lenovo Yoga 910-13IKB-80VF004CGE | |
| HP EliteBook x360 1030 G2 | |
| HP Spectre x360 13-w023dx | |
| Lenovo ThinkPad X1 Yoga-20FRS1VS00 | |
| Lenovo ThinkPad Yoga 370-20JJS00100 | |
| Dell Latitude 13 7370 | |
| 3DMark 11 - 1280x720 Performance GPU | |
| Lenovo ThinkPad X1 Carbon 2017-20HQS03P00 | |
| Lenovo Yoga 910-13IKB-80VF004CGE | |
| HP Spectre x360 13-w023dx | |
| HP EliteBook x360 1030 G2 | |
| Lenovo ThinkPad X1 Yoga-20FRS1VS00 | |
| Lenovo ThinkPad Yoga 370-20JJS00100 | |
| Dell Latitude 13 7370 | |
| 3DMark 05 Standard | 12125 punten | |
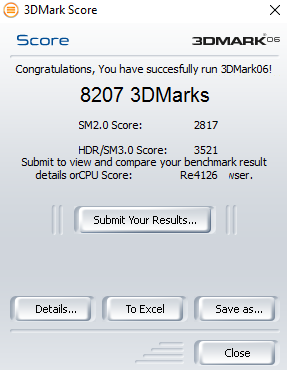
| 3DMark 06 Standard Score | 8207 punten | |
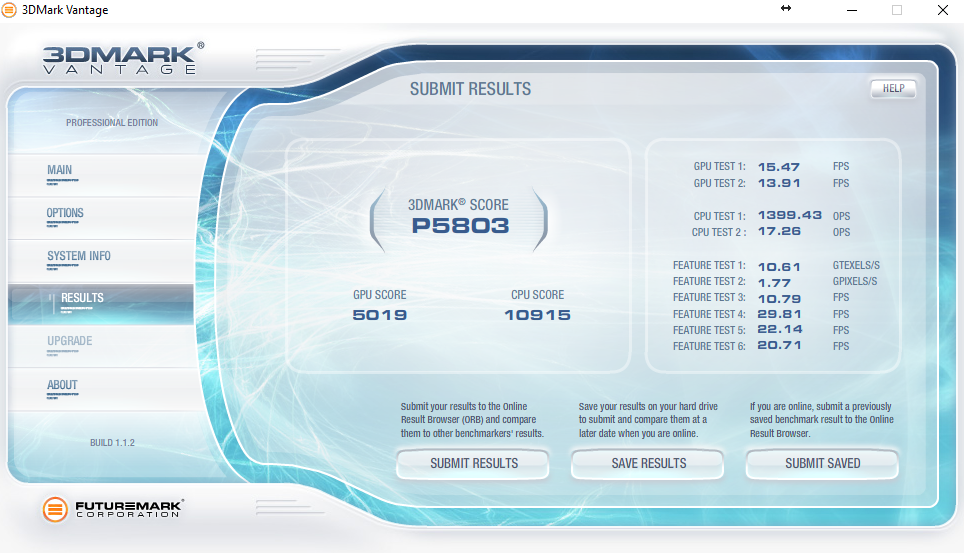
| 3DMark Vantage P Result | 5803 punten | |
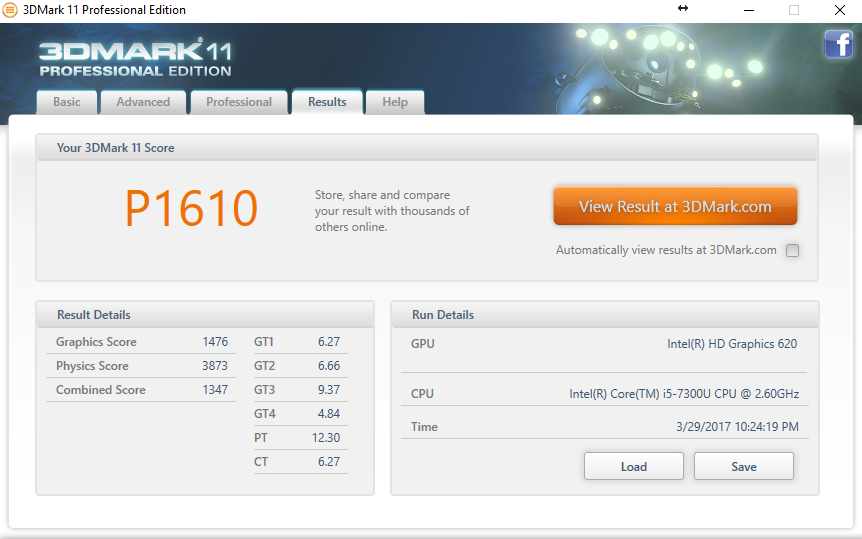
| 3DMark 11 Performance | 1610 punten | |
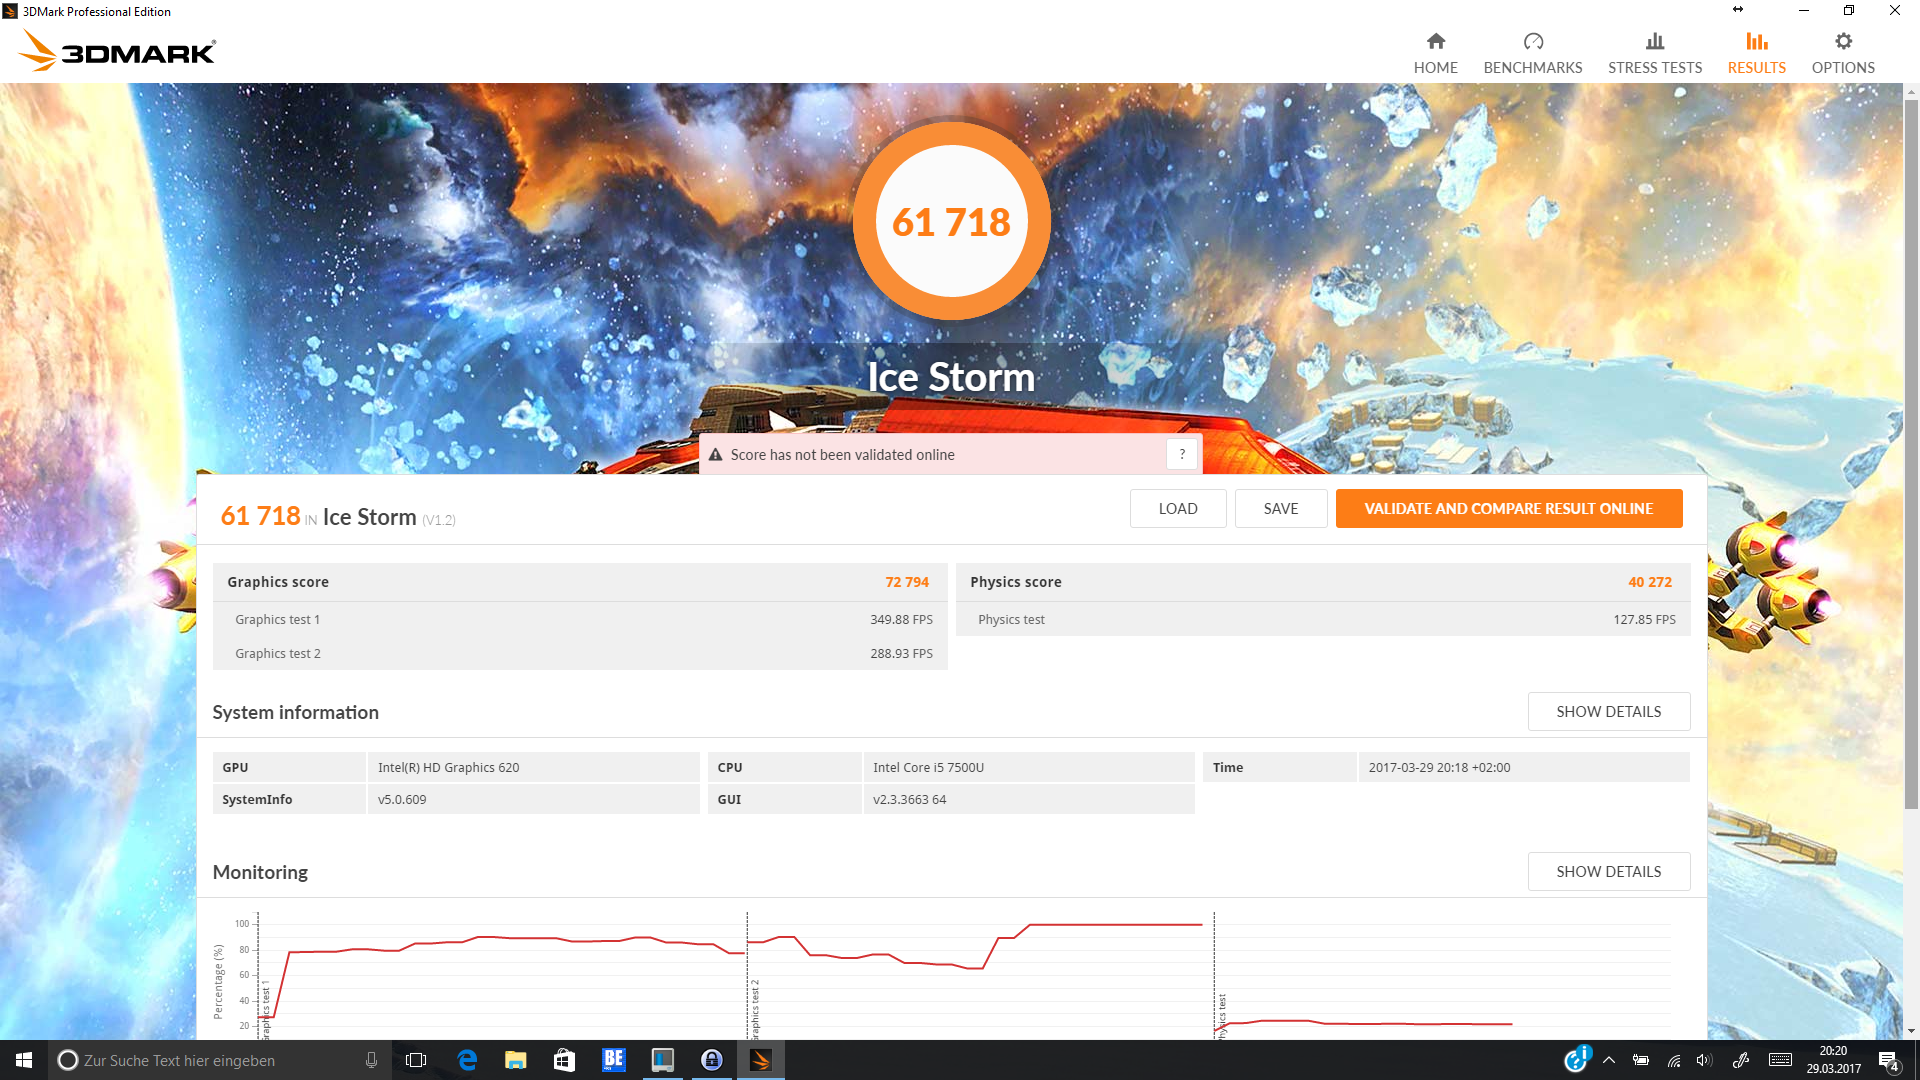
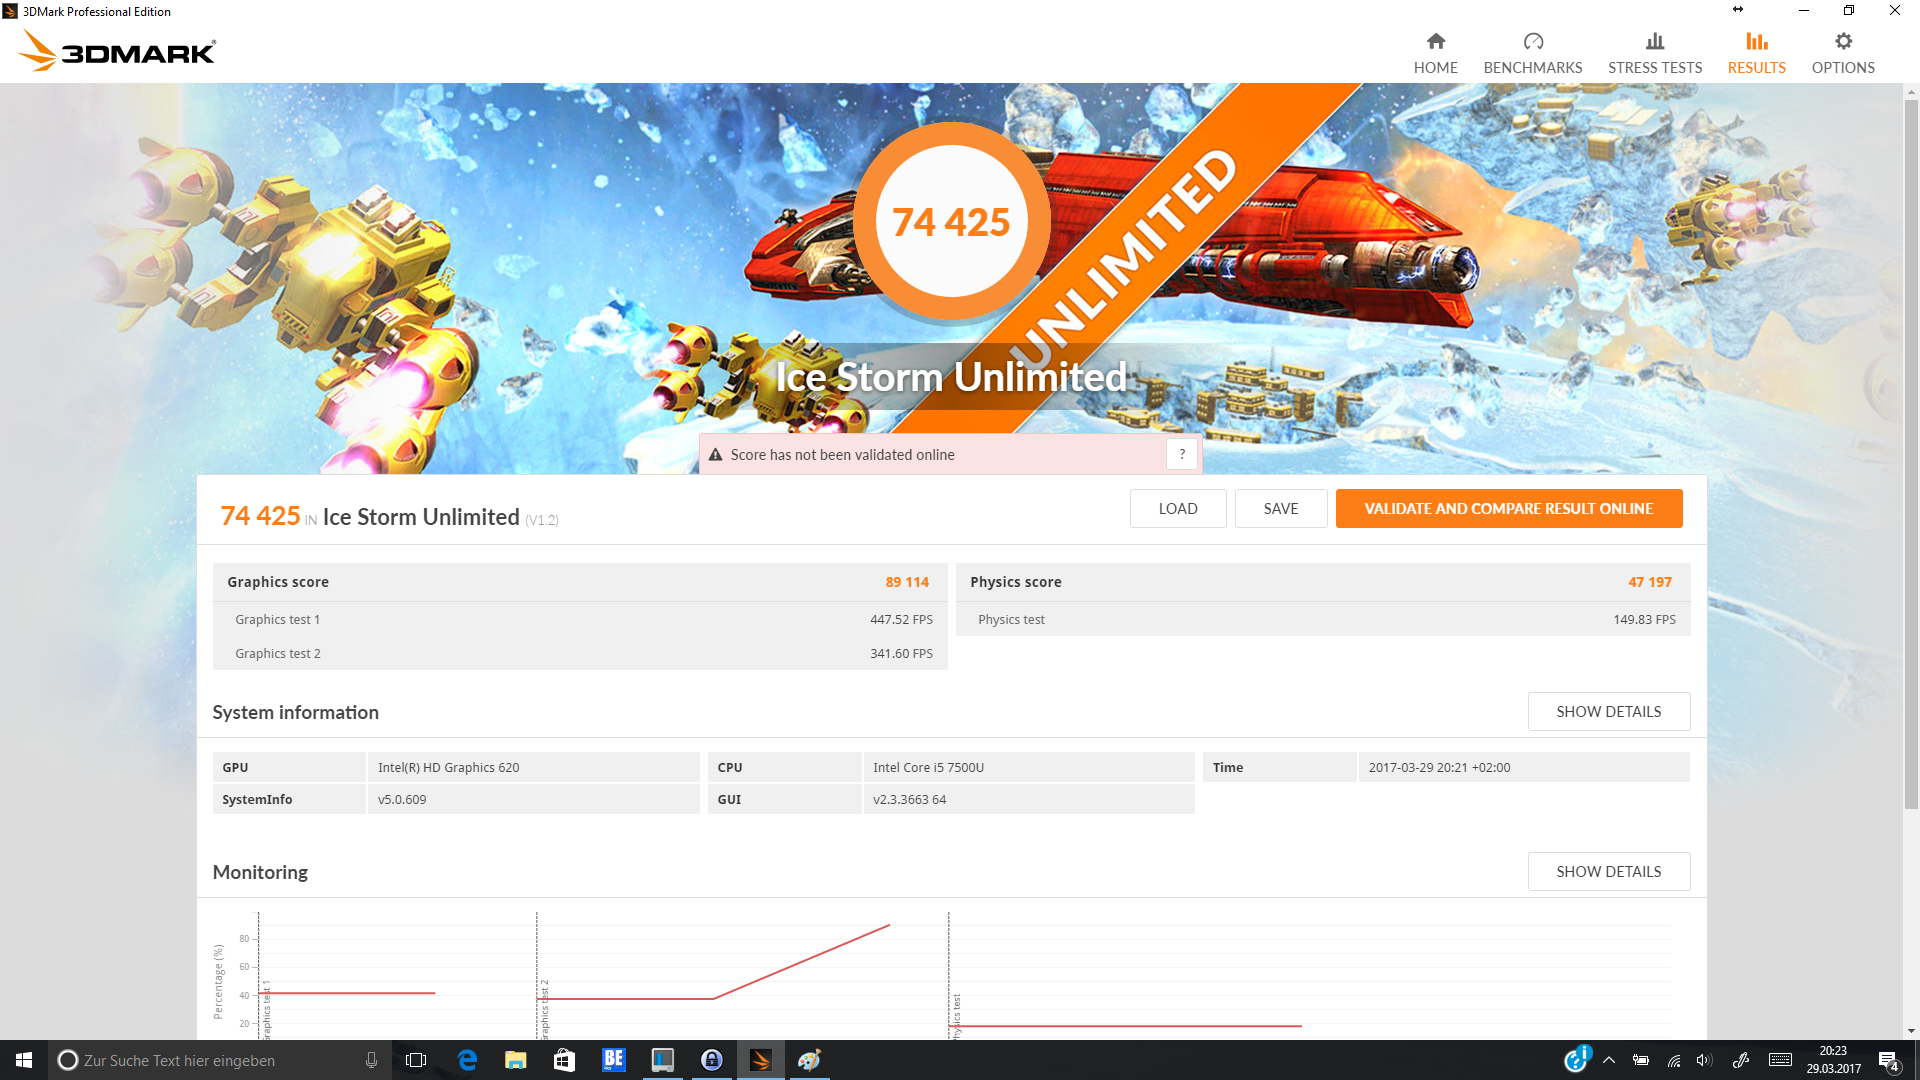
| 3DMark Ice Storm Standard Score | 61718 punten | |
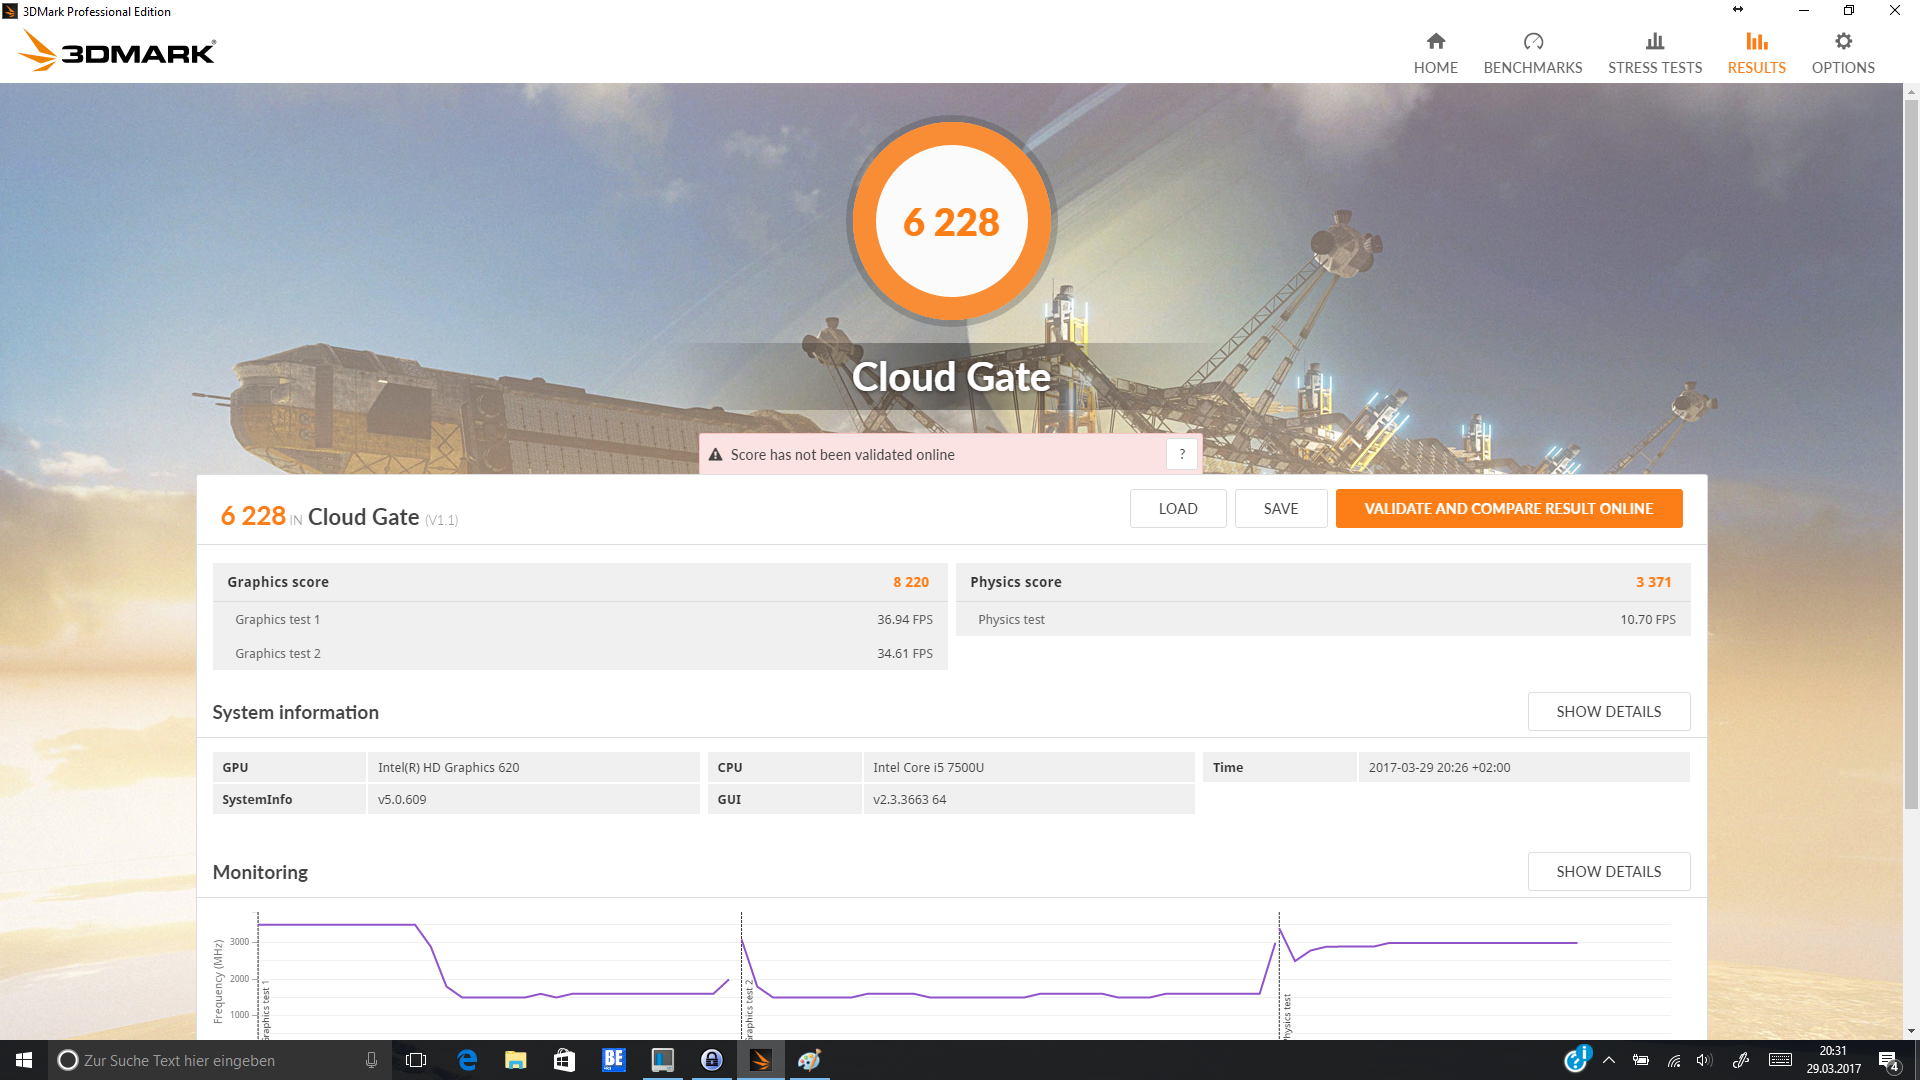
| 3DMark Cloud Gate Standard Score | 6228 punten | |
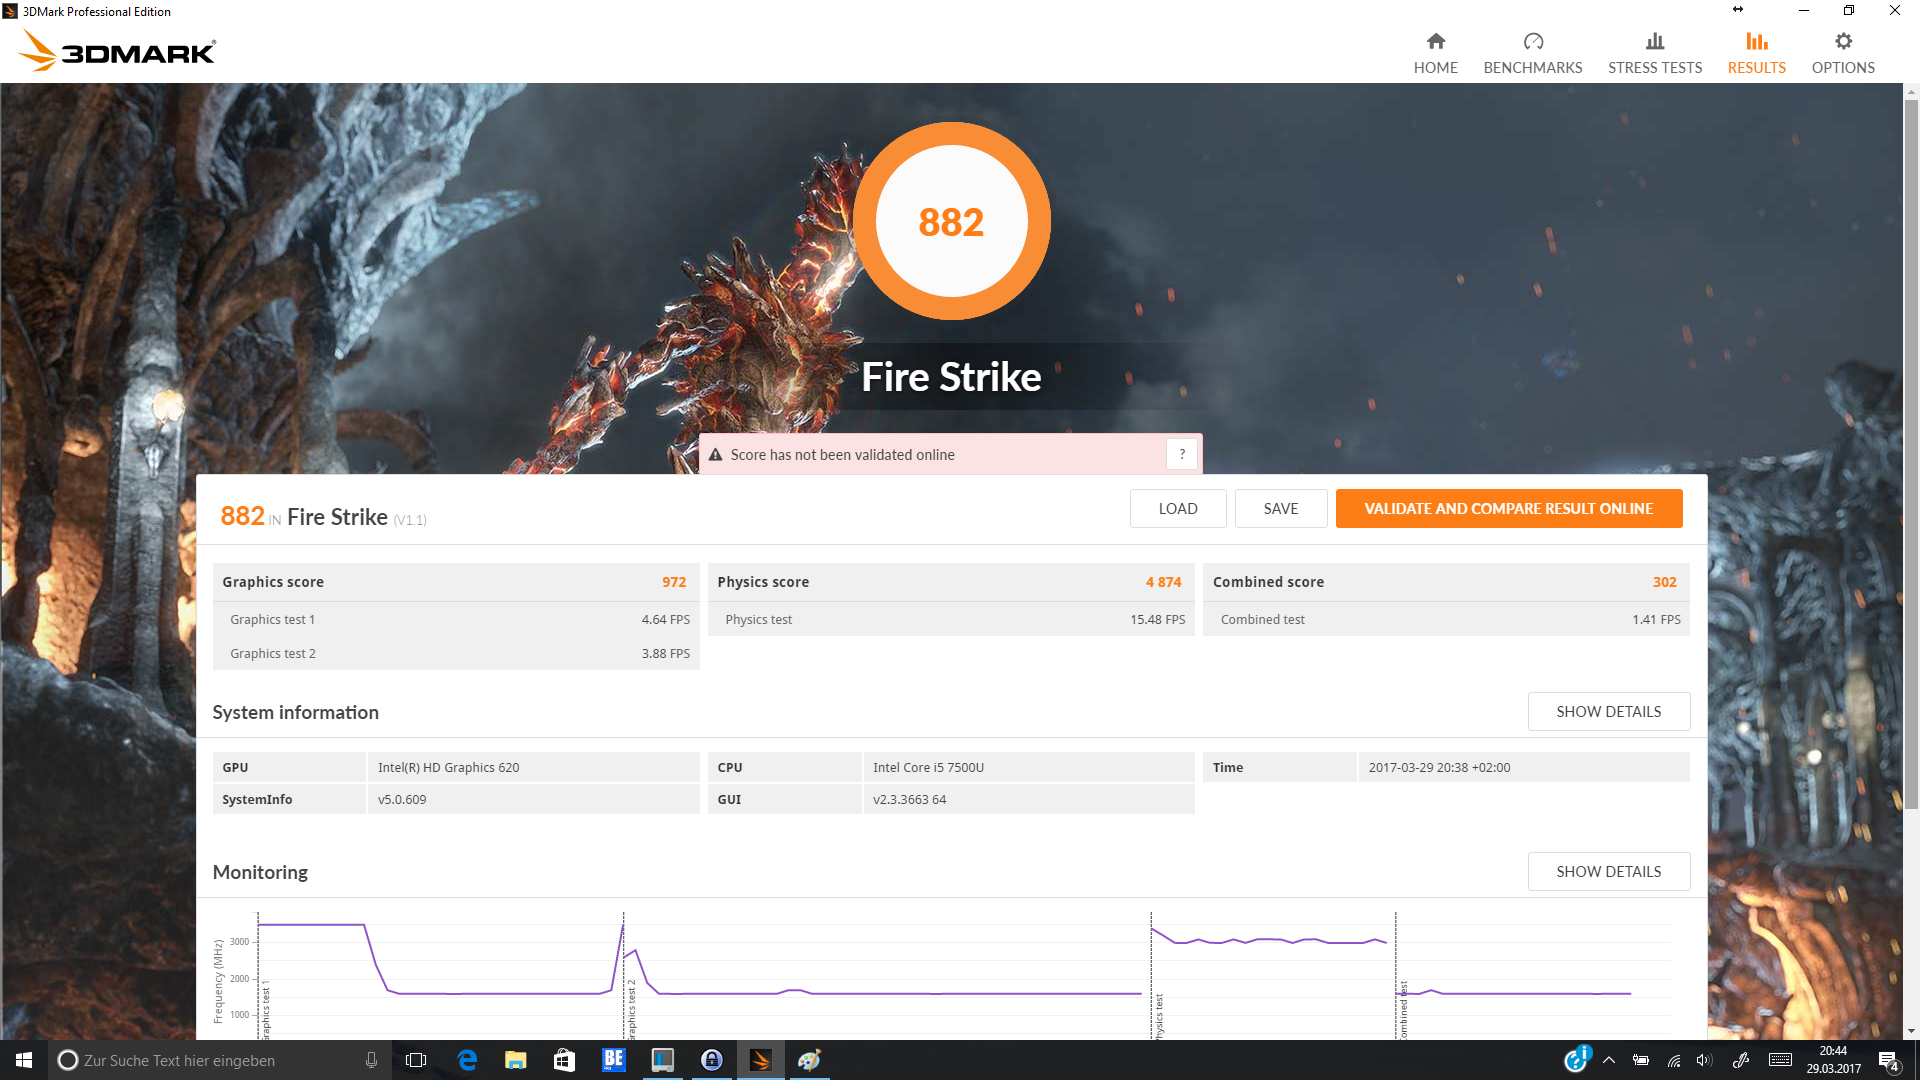
| 3DMark Fire Strike Score | 882 punten | |
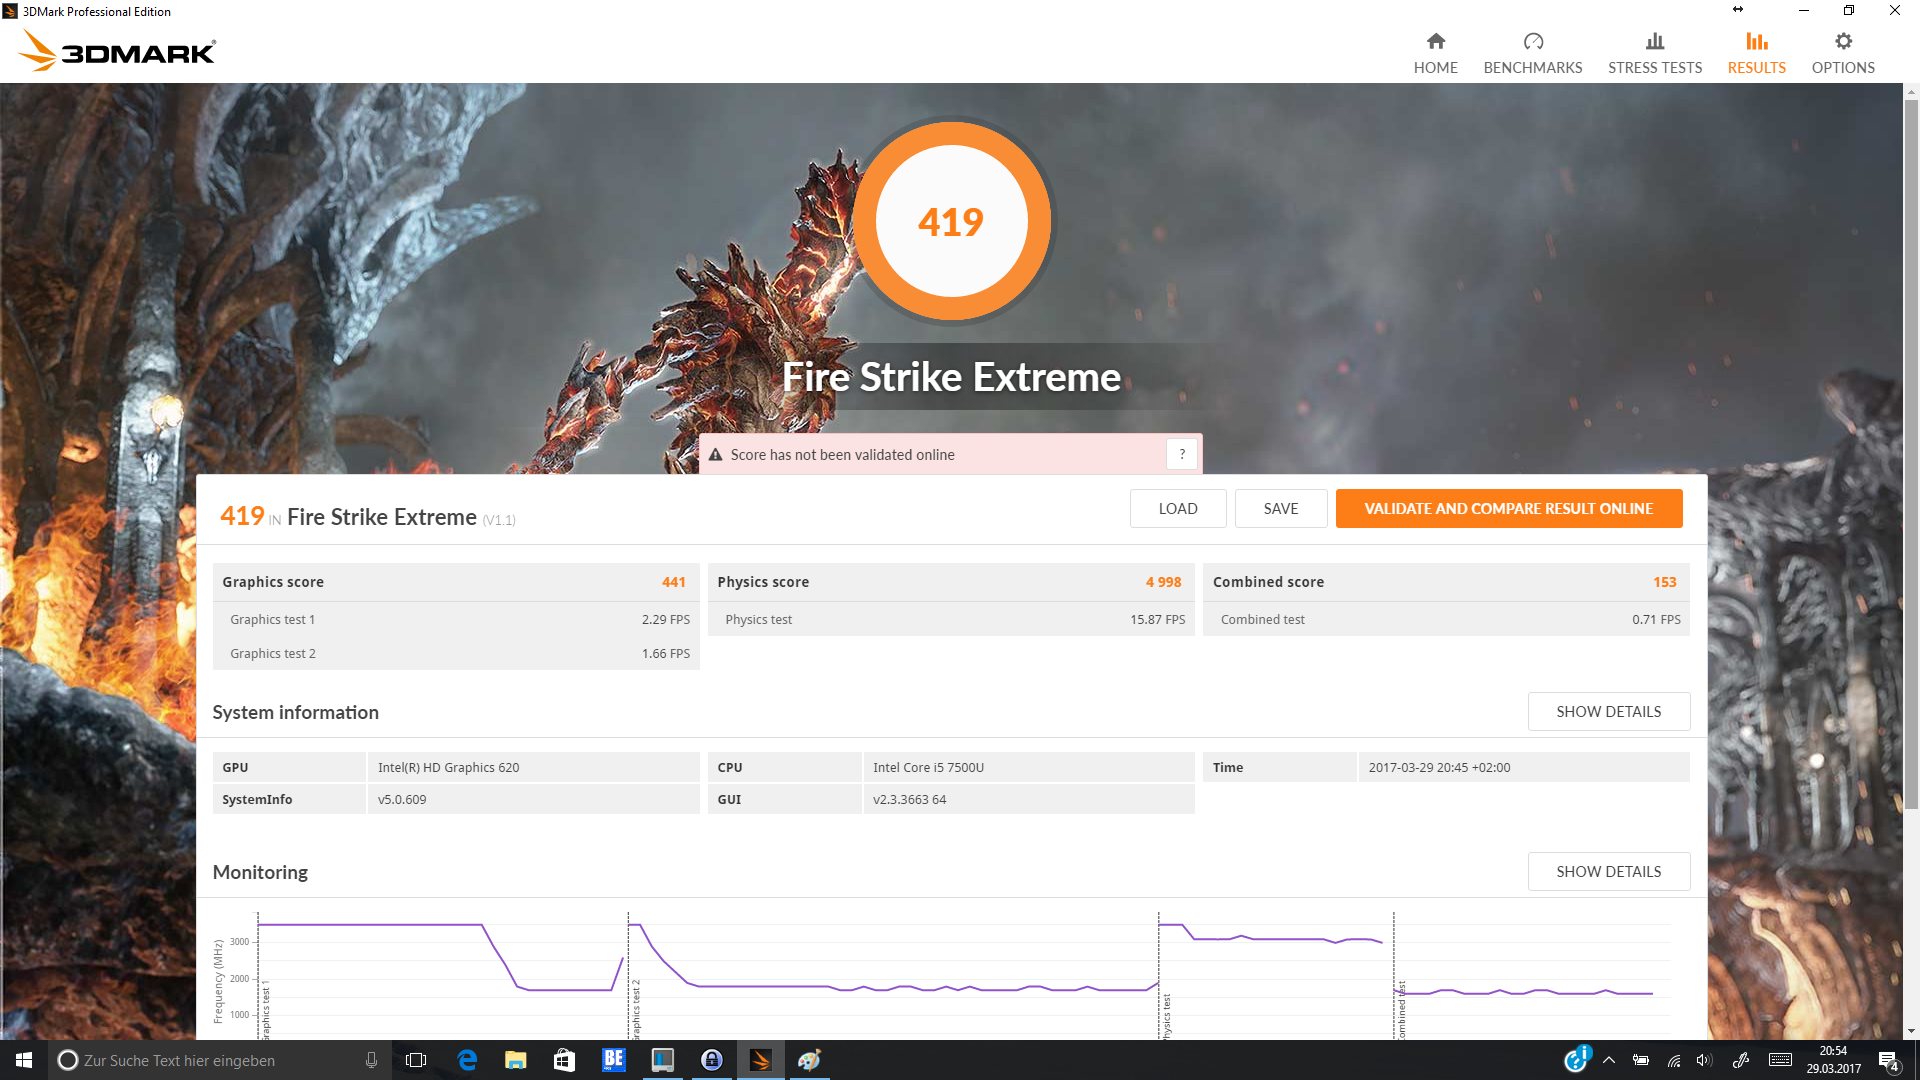
| 3DMark Fire Strike Extreme Score | 419 punten | |
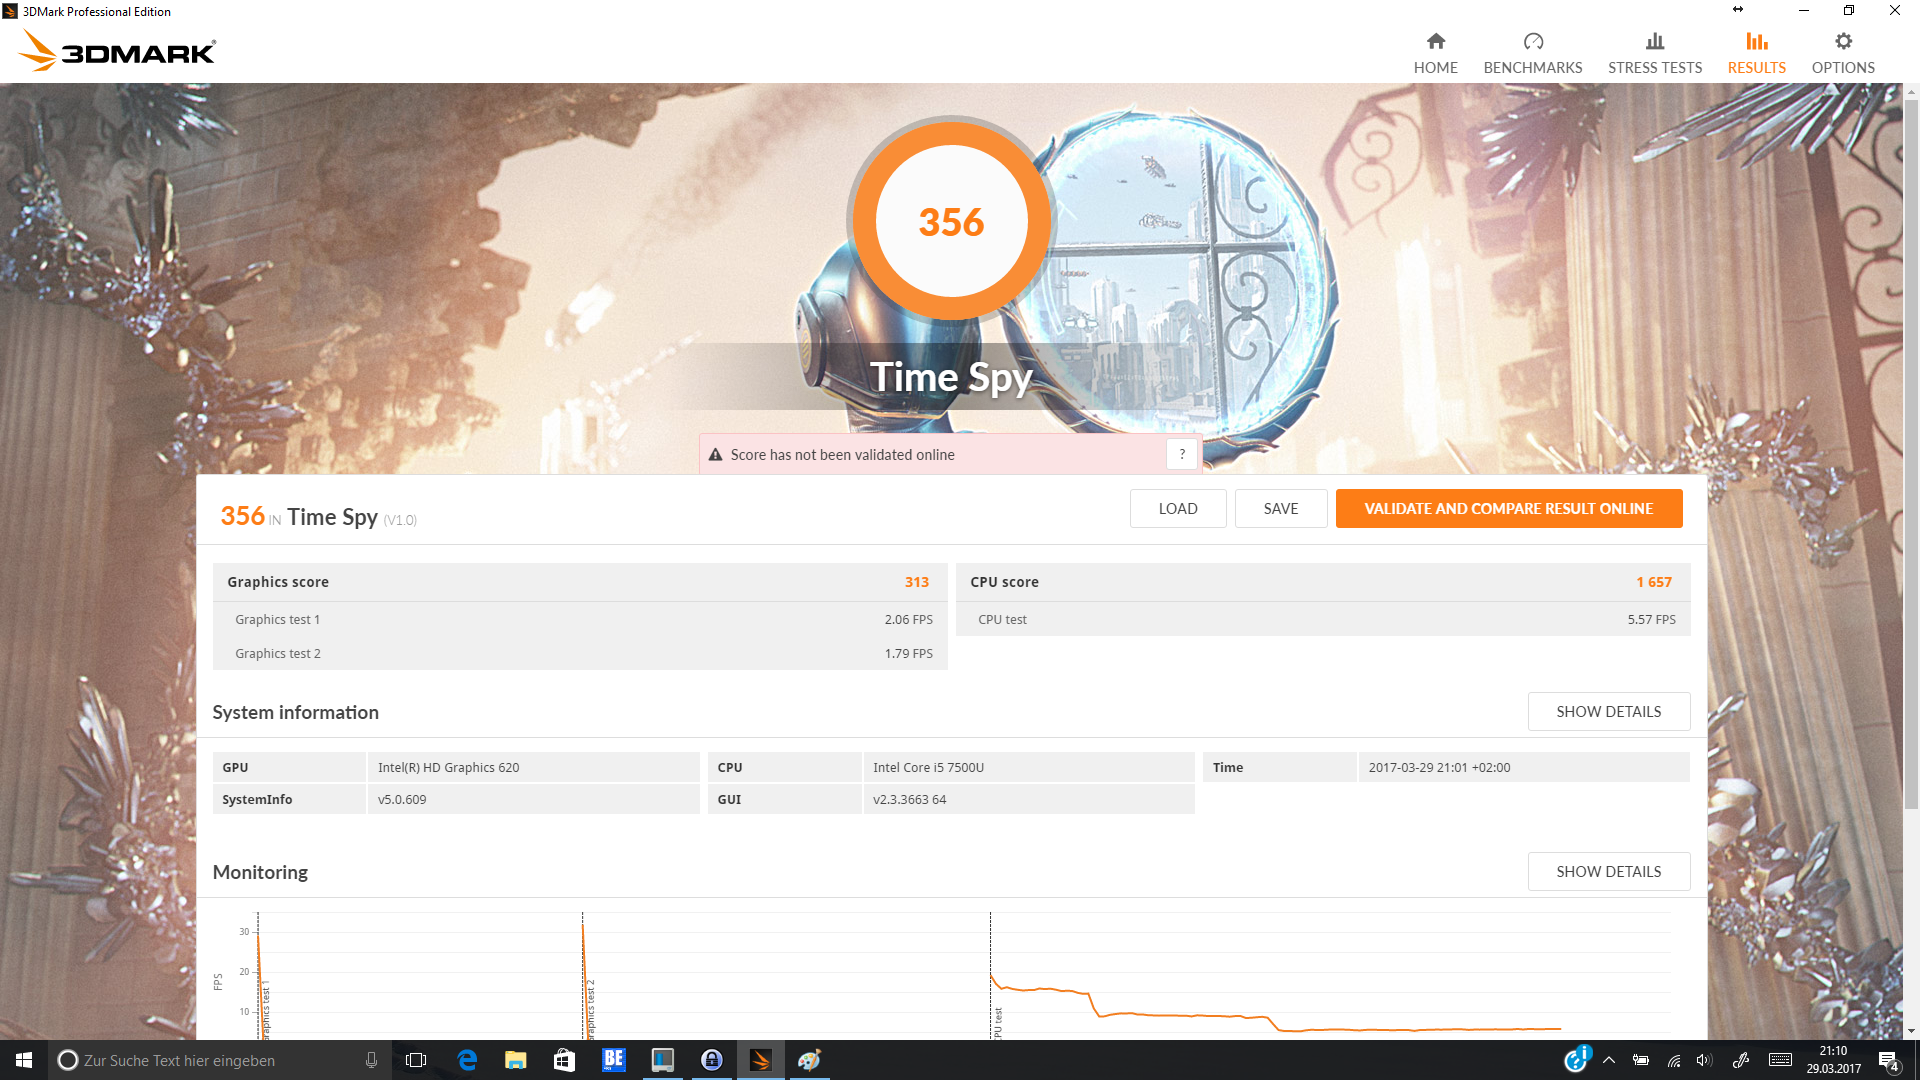
| 3DMark Time Spy Score | 356 punten | |
Help | ||
| lage | gem. | hoge | ultra | |
|---|---|---|---|---|
| BioShock Infinite (2013) | 54.4 | 30.7 | 24.9 | 7.8 |
| Battlefield 4 (2013) | 40.2 | 31.4 | 20.9 | 7.5 |
| The Witcher 3 (2015) | 14.4 | 12.3 | 5.5 | |
| Rise of the Tomb Raider (2016) | 17.6 | 11 | 6.7 |
Geluidsniveau
| Onbelast |
| 29 / 29 / 29 dB (A) |
| Belasting |
| 33.6 / 35.8 dB (A) |
 | ||
30 dB stil 40 dB(A) hoorbaar 50 dB(A) luid |
||
min: | ||
| HP EliteBook x360 1030 G2 i5-7300U, HD Graphics 620 | Lenovo Yoga 910-13IKB-80VF004CGE i7-7500U, HD Graphics 620 | Lenovo ThinkPad X1 Yoga-20FRS1VS00 6600U, HD Graphics 520 | Lenovo ThinkPad X1 Carbon 2017-20HQS03P00 i7-7500U, HD Graphics 620 | HP Spectre x360 13-w023dx i7-7500U, HD Graphics 620 | Lenovo ThinkPad Yoga 370-20JJS00100 i5-7200U, HD Graphics 620 | Dell Latitude 13 7370 6Y57, HD Graphics 515 | |
|---|---|---|---|---|---|---|---|
| Noise | -8% | -2% | -4% | -5% | -1% | ||
| uit / omgeving * (dB) | 29 | 31.7 -9% | 28.9 -0% | 29.3 -1% | 29.1 -0% | 28.6 1% | |
| Idle Minimum * (dB) | 29 | 31.7 -9% | 28.9 -0% | 29.3 -1% | 29.1 -0% | 28.6 1% | |
| Idle Average * (dB) | 29 | 31.7 -9% | 28.9 -0% | 29.3 -1% | 29.1 -0% | 28.6 1% | |
| Idle Maximum * (dB) | 29 | 31.7 -9% | 28.9 -0% | 32.2 -11% | 31.2 -8% | 31.2 -8% | |
| Load Average * (dB) | 33.6 | 38.4 -14% | 35.3 -5% | 34.3 -2% | 37.3 -11% | 33.7 -0% | |
| Load Maximum * (dB) | 35.8 | 34.7 3% | 38.9 -9% | 39.3 -10% | 39.6 -11% | 36.7 -3% |
* ... kleiner is beter
(+) De maximumtemperatuur aan de bovenzijde bedraagt 36.1 °C / 97 F, vergeleken met het gemiddelde van 35.4 °C / 96 F, variërend van 19.6 tot 60 °C voor de klasse Convertible.
(+) De bodem warmt op tot een maximum van 36.7 °C / 98 F, vergeleken met een gemiddelde van 36.9 °C / 98 F
(+) Bij onbelast gebruik bedraagt de gemiddelde temperatuur voor de bovenzijde 24.7 °C / 76 F, vergeleken met het apparaatgemiddelde van 30.3 °C / 87 F.
(+) De palmsteunen en het touchpad zijn met een maximum van ###max## °C / 77.9 F koeler dan de huidtemperatuur en voelen daarom koel aan.
(+) De gemiddelde temperatuur van de handpalmsteun van soortgelijke toestellen bedroeg 28 °C / 82.4 F (+2.5 °C / 4.5 F).
| HP EliteBook x360 1030 G2 i5-7300U, HD Graphics 620 | Lenovo Yoga 910-13IKB-80VF004CGE i7-7500U, HD Graphics 620 | Lenovo ThinkPad X1 Yoga-20FRS1VS00 6600U, HD Graphics 520 | Lenovo ThinkPad X1 Carbon 2017-20HQS03P00 i7-7500U, HD Graphics 620 | Dell Latitude 13 7370 6Y57, HD Graphics 515 | HP Spectre x360 13-w023dx i7-7500U, HD Graphics 620 | Lenovo ThinkPad Yoga 370-20JJS00100 i5-7200U, HD Graphics 620 | |
|---|---|---|---|---|---|---|---|
| Heat | -12% | -24% | -9% | -23% | -10% | -16% | |
| Maximum Upper Side * (°C) | 36.1 | 41.4 -15% | 45.5 -26% | 48 -33% | 43.2 -20% | 48.2 -34% | 42 -16% |
| Maximum Bottom * (°C) | 36.7 | 38.5 -5% | 47.1 -28% | 47.2 -29% | 50.8 -38% | 46 -25% | 48 -31% |
| Idle Upper Side * (°C) | 26.8 | 31 -16% | 31.1 -16% | 23.5 12% | 30.5 -14% | 24.6 8% | 28 -4% |
| Idle Bottom * (°C) | 26.5 | 29.6 -12% | 33.1 -25% | 22.6 15% | 31.2 -18% | 23.2 12% | 29.7 -12% |
* ... kleiner is beter
HP EliteBook x360 1030 G2 audioanalyse
(+) | luidsprekers kunnen relatief luid spelen (86.3 dB)
Analysis not possible as minimum curve is missing or too high
Lenovo ThinkPad Yoga 370-20JJS00100 audioanalyse
(±) | luidspreker luidheid is gemiddeld maar goed (79.4 dB)
Bas 100 - 315 Hz
(-) | bijna geen lage tonen - gemiddeld 23.5% lager dan de mediaan
(+) | de lage tonen zijn lineair (6.5% delta naar de vorige frequentie)
Midden 400 - 2000 Hz
(+) | evenwichtige middens - slechts 4.4% verwijderd van de mediaan
(+) | de middentonen zijn lineair (6.8% delta ten opzichte van de vorige frequentie)
Hoog 2 - 16 kHz
(+) | evenwichtige hoogtepunten - slechts 4.6% verwijderd van de mediaan
(+) | de hoge tonen zijn lineair (6.9% delta naar de vorige frequentie)
Algemeen 100 - 16.000 Hz
(±) | lineariteit van het totale geluid is gemiddeld (24.2% verschil met de mediaan)
Vergeleken met dezelfde klasse
» 74% van alle geteste apparaten in deze klasse waren beter, 5% vergelijkbaar, 21% slechter
» De beste had een delta van 6%, het gemiddelde was 20%, de slechtste was 57%
Vergeleken met alle geteste toestellen
» 73% van alle geteste apparaten waren beter, 6% gelijk, 21% slechter
» De beste had een delta van 4%, het gemiddelde was 23%, de slechtste was 134%
| Uit / Standby | |
| Inactief | |
| Belasting |
|
Key:
min: | |
| HP EliteBook x360 1030 G2 i5-7300U, HD Graphics 620, Sandisk SD8TN8U-256G-1006, IPS, 1920x1080, 13.3" | Lenovo Yoga 910-13IKB-80VF004CGE i7-7500U, HD Graphics 620, Samsung PM951 NVMe MZVLV512, IPS, 3840x2160, 13.9" | Lenovo ThinkPad X1 Yoga-20FRS1VS00 6600U, HD Graphics 520, Samsung SSD PM961 1TB M.2 PCIe 3.0 x4 NVMe (MZSLW1T0), OLED, 2560x1440, 14" | Lenovo ThinkPad X1 Carbon 2017-20HQS03P00 i7-7500U, HD Graphics 620, Samsung PM961 NVMe MZVLW512HMJP, IPS, 1920x1080, 14" | Dell Latitude 13 7370 6Y57, HD Graphics 515, Toshiba NVMe THNSN5256GPU7, IPS, 1920x1080, 13.3" | HP Spectre x360 13-w023dx i7-7500U, HD Graphics 620, Samsung PM951 NVMe MZVLV512, IPS, 1920x1080, 13.3" | Lenovo ThinkPad Yoga 370-20JJS00100 i5-7200U, HD Graphics 620, Toshiba NVMe THNSF5512GPUK, IPS LED, 1920x1080, 13.3" | |
|---|---|---|---|---|---|---|---|
| Power Consumption | -13% | -43% | -25% | -6% | -20% | -10% | |
| Idle Minimum * (Watt) | 3.2 | 4.3 -34% | 4.7 -47% | 3.84 -20% | 5 -56% | 5.5 -72% | 3.6 -13% |
| Idle Average * (Watt) | 5.5 | 6.3 -15% | 8.6 -56% | 6.3 -15% | 7.5 -36% | 6.7 -22% | 7.2 -31% |
| Idle Maximum * (Watt) | 6.5 | 9 -38% | 12.2 -88% | 8.6 -32% | 8 -23% | 7.1 -9% | 8.4 -29% |
| Load Average * (Watt) | 29.7 | 32.7 -10% | 29.7 -0% | 41.9 -41% | 15.3 48% | 33.1 -11% | 29.9 -1% |
| Load Maximum * (Watt) | 41.3 | 28.8 30% | 50.5 -22% | 48.7 -18% | 26.8 35% | 35.2 15% | 32.2 22% |
* ... kleiner is beter
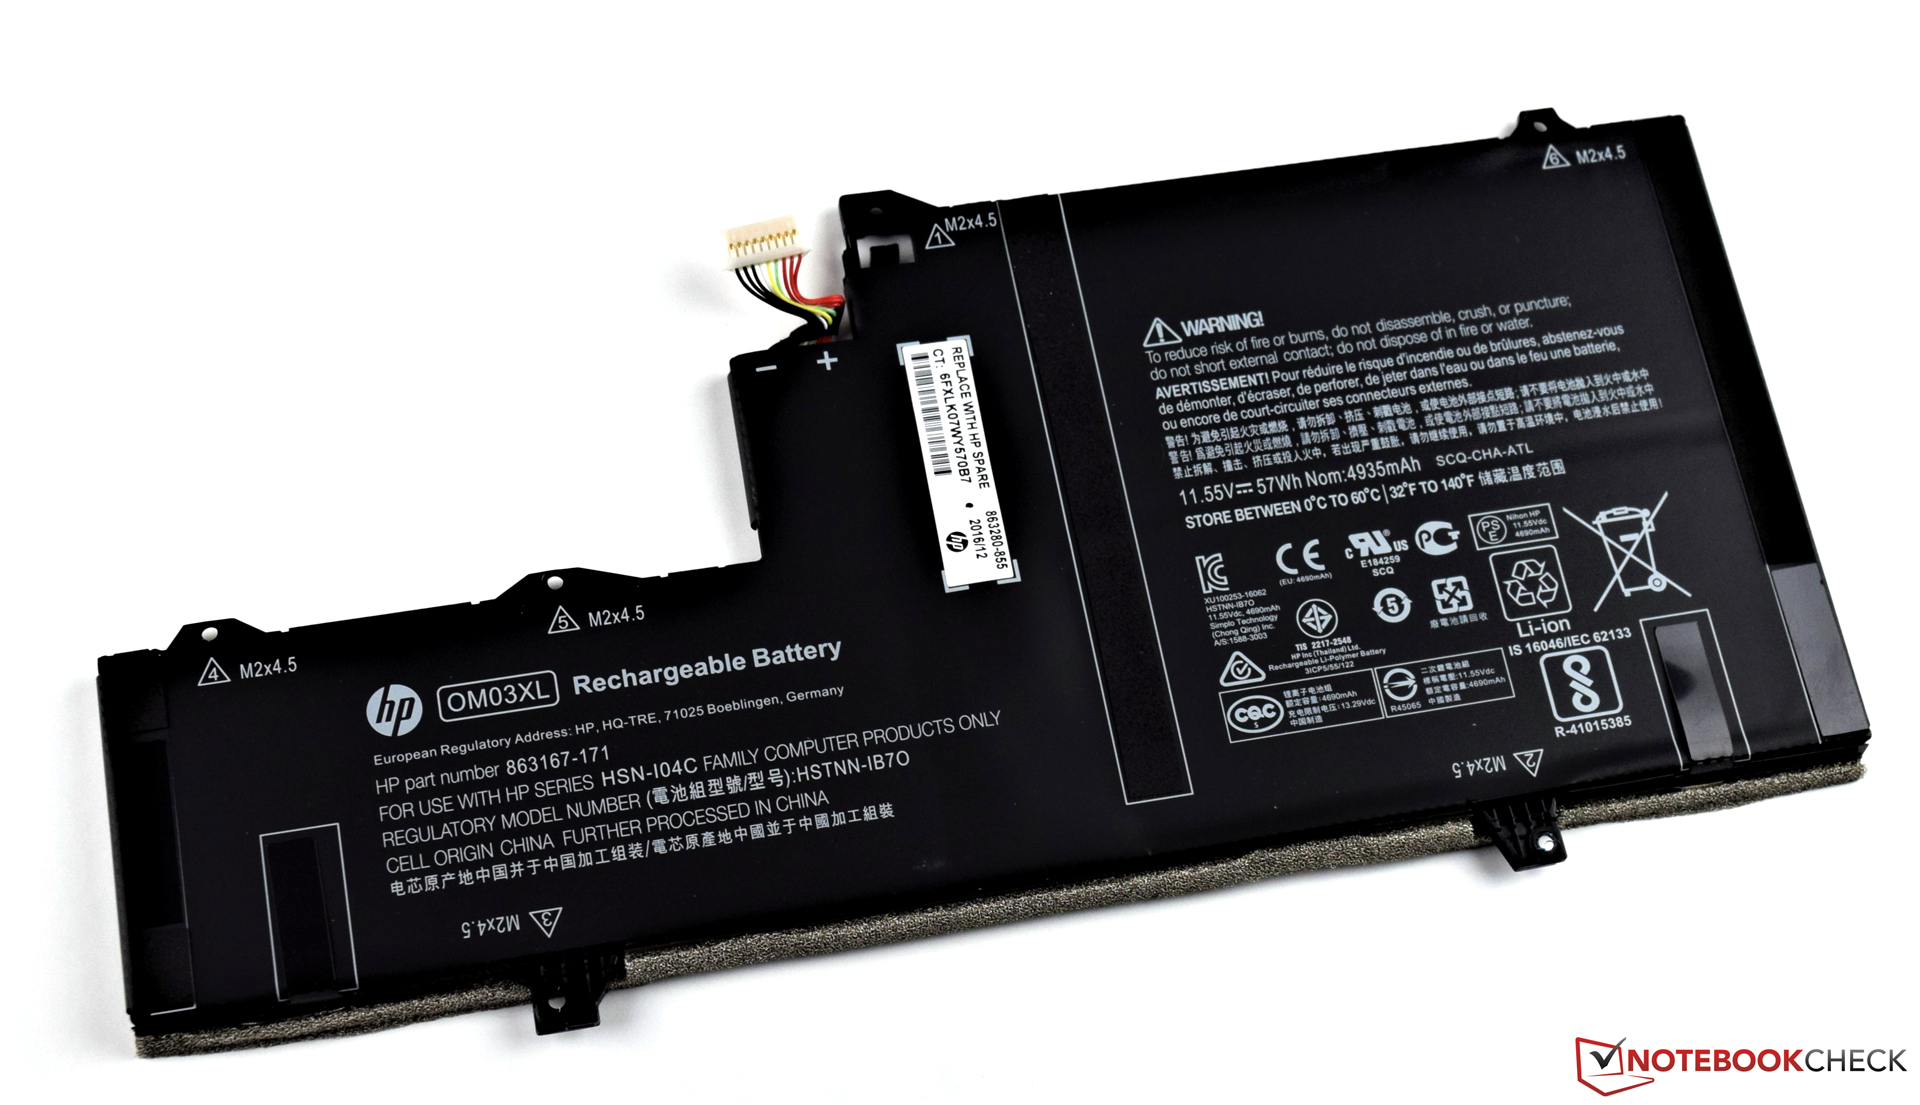
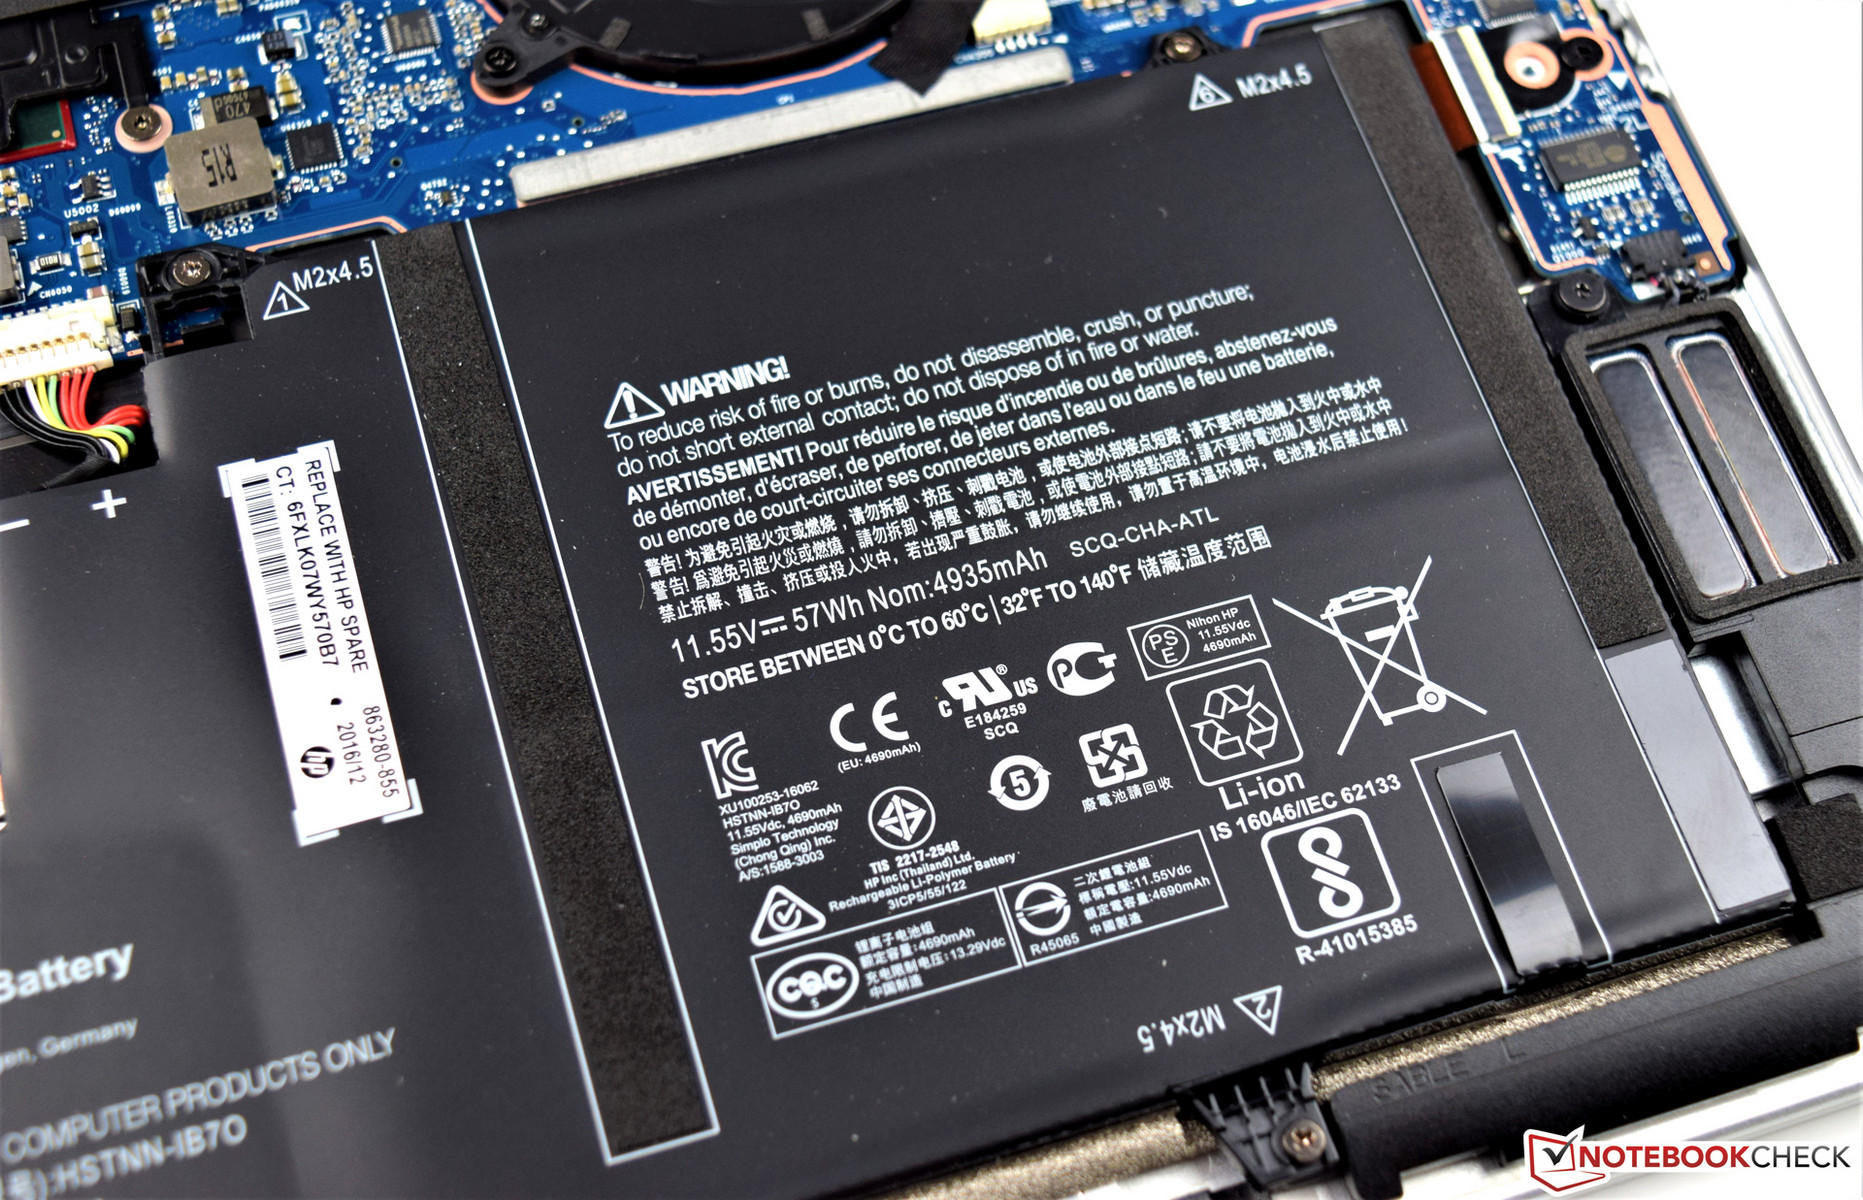

| HP EliteBook x360 1030 G2 i5-7300U, HD Graphics 620, 57 Wh | Lenovo Yoga 910-13IKB-80VF004CGE i7-7500U, HD Graphics 620, 78 Wh | Lenovo ThinkPad X1 Yoga-20FRS1VS00 6600U, HD Graphics 520, 56 Wh | Lenovo ThinkPad X1 Carbon 2017-20HQS03P00 i7-7500U, HD Graphics 620, 57 Wh | Dell Latitude 13 7370 6Y57, HD Graphics 515, 34 Wh | HP Spectre x360 13-w023dx i7-7500U, HD Graphics 620, 57.8 Wh | Lenovo ThinkPad Yoga 370-20JJS00100 i5-7200U, HD Graphics 620, 51 Wh | |
|---|---|---|---|---|---|---|---|
| Batterijduur | -17% | -40% | -20% | -43% | -24% | -25% | |
| Reader / Idle (h) | 23.1 | 17.8 -23% | 13.7 -41% | 20.9 -10% | 9.8 -58% | 20.6 -11% | 19.4 -16% |
| H.264 (h) | 11 | 8.7 -21% | 11.9 8% | 6.5 -41% | 9.6 -13% | ||
| WiFi v1.3 (h) | 10.5 | 10.7 2% | 5.3 -50% | 8.3 -21% | 6.1 -42% | 9.3 -11% | 8.1 -23% |
| Load (h) | 4.1 | 2.9 -29% | 2.2 -46% | 1.8 -56% | 2.9 -29% | 2 -51% | 2.1 -49% |
Pro
Contra
Dit is de verkorte versie van het originele artikel. Het volledige, Engelse testrapport vind je hier.
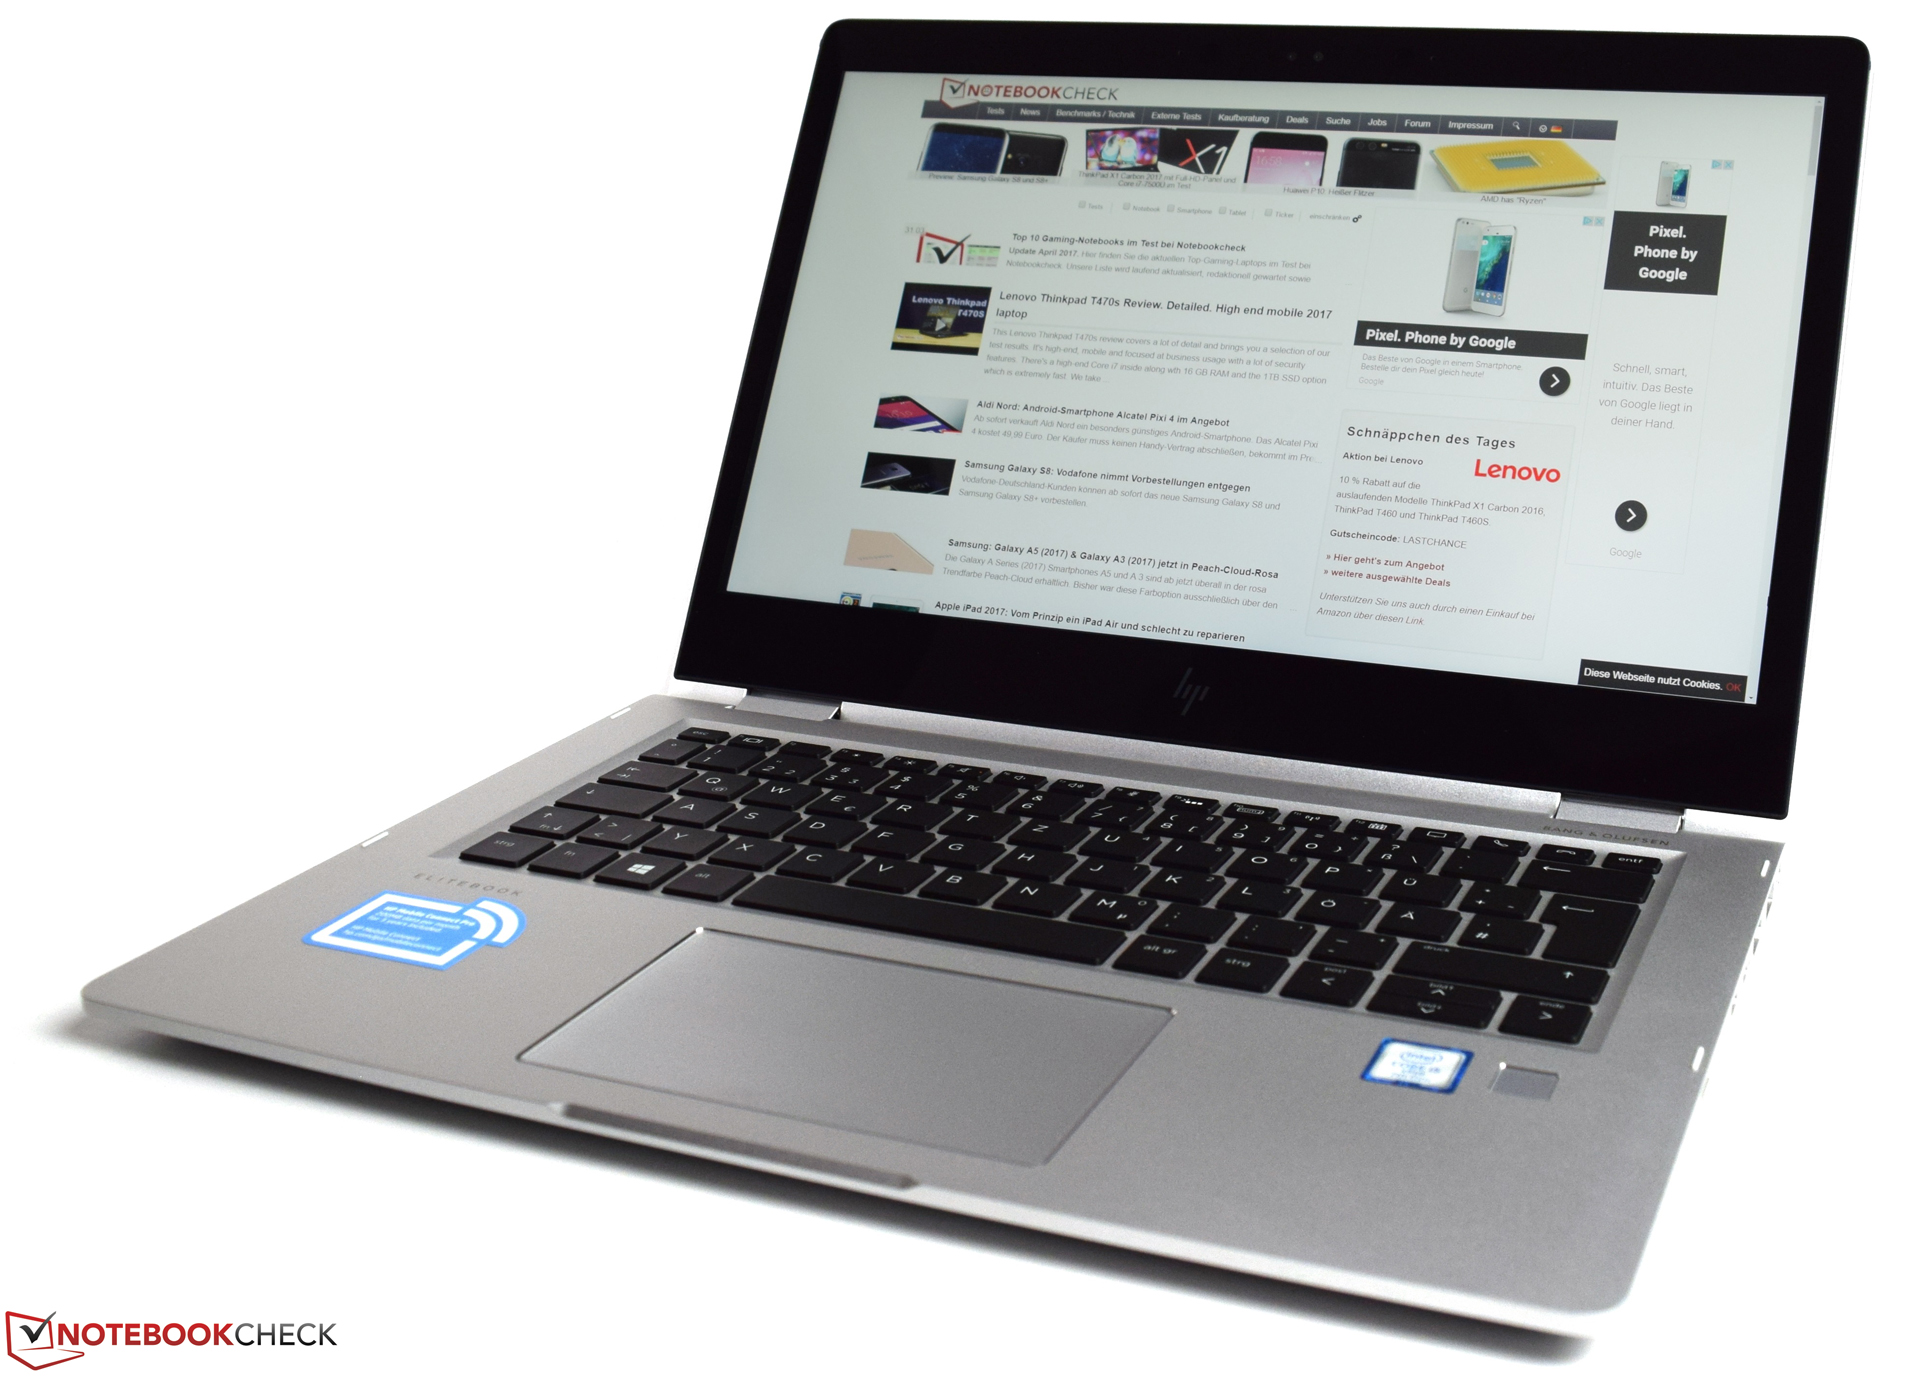
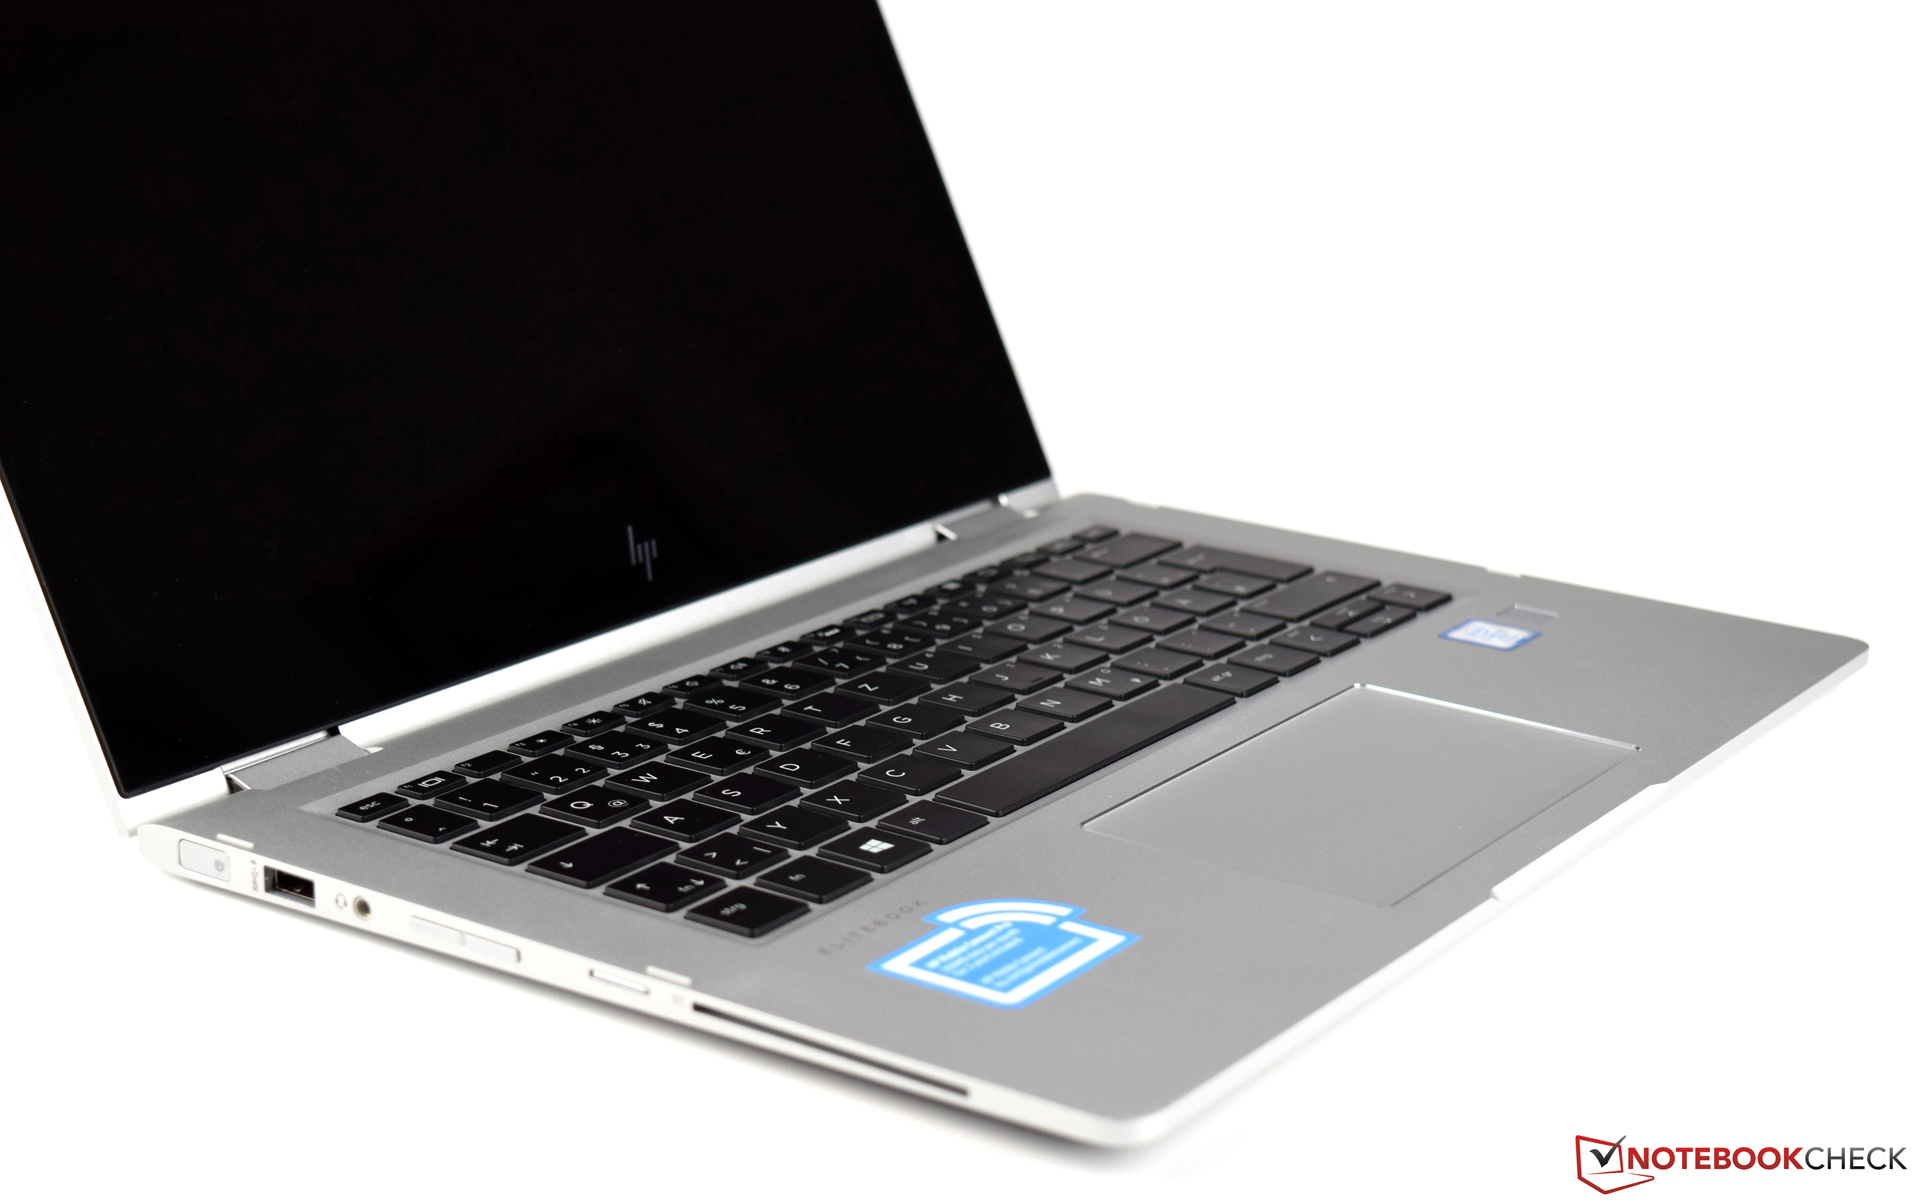
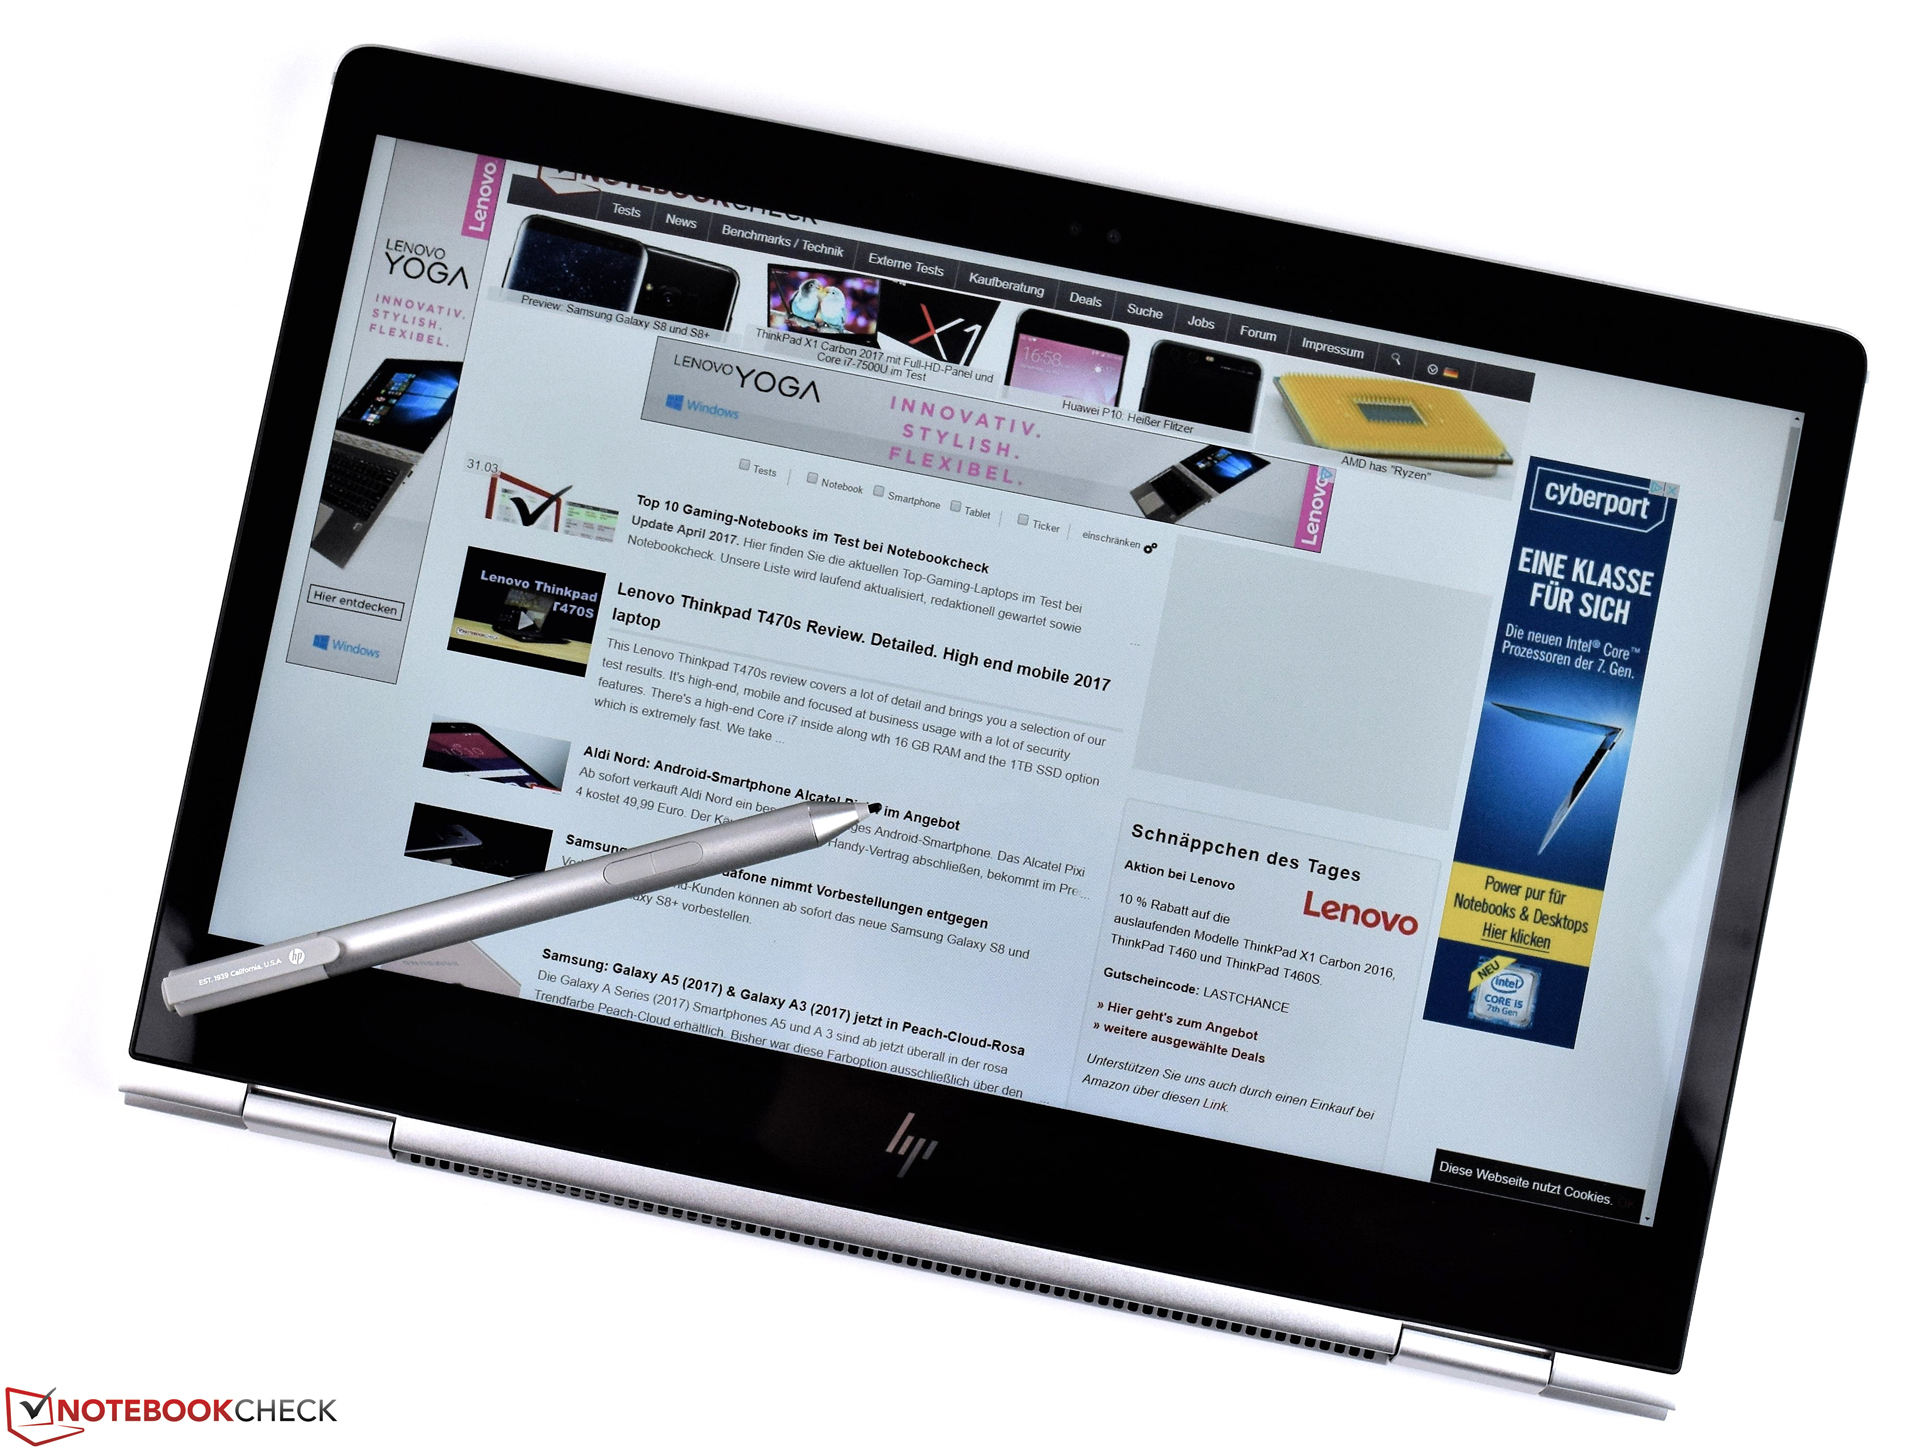
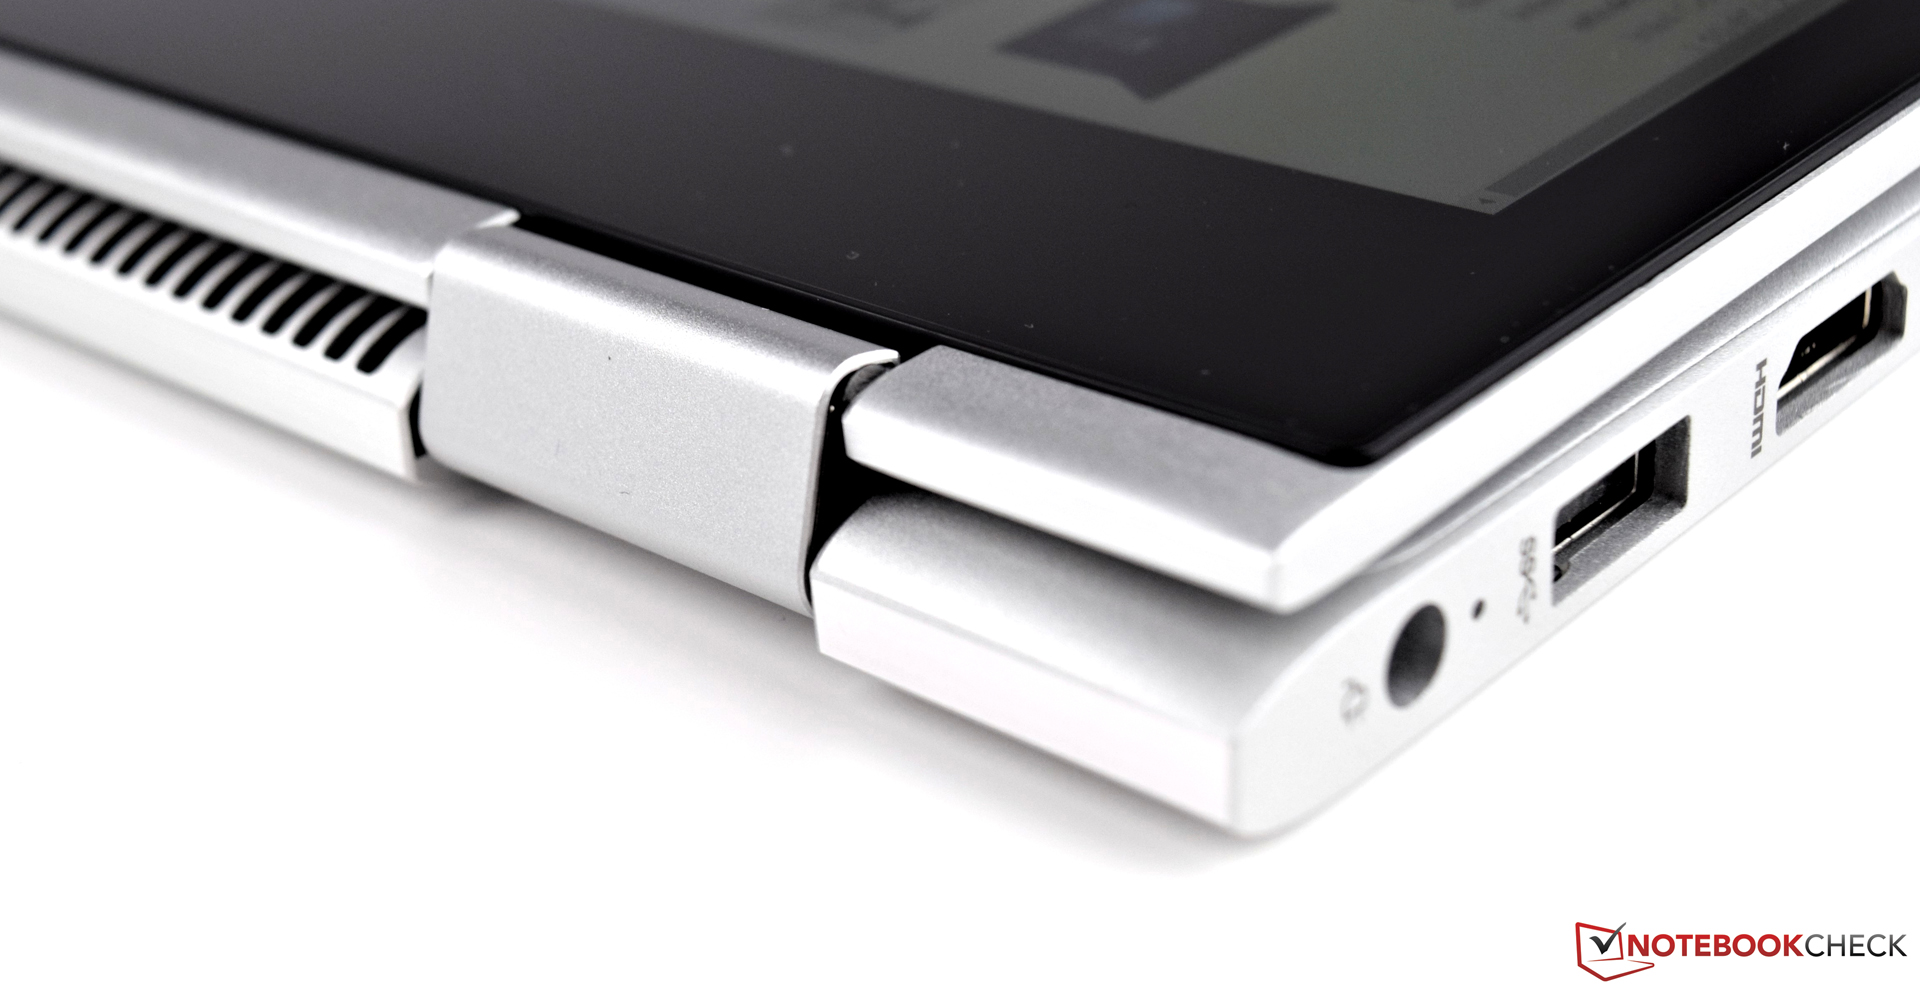
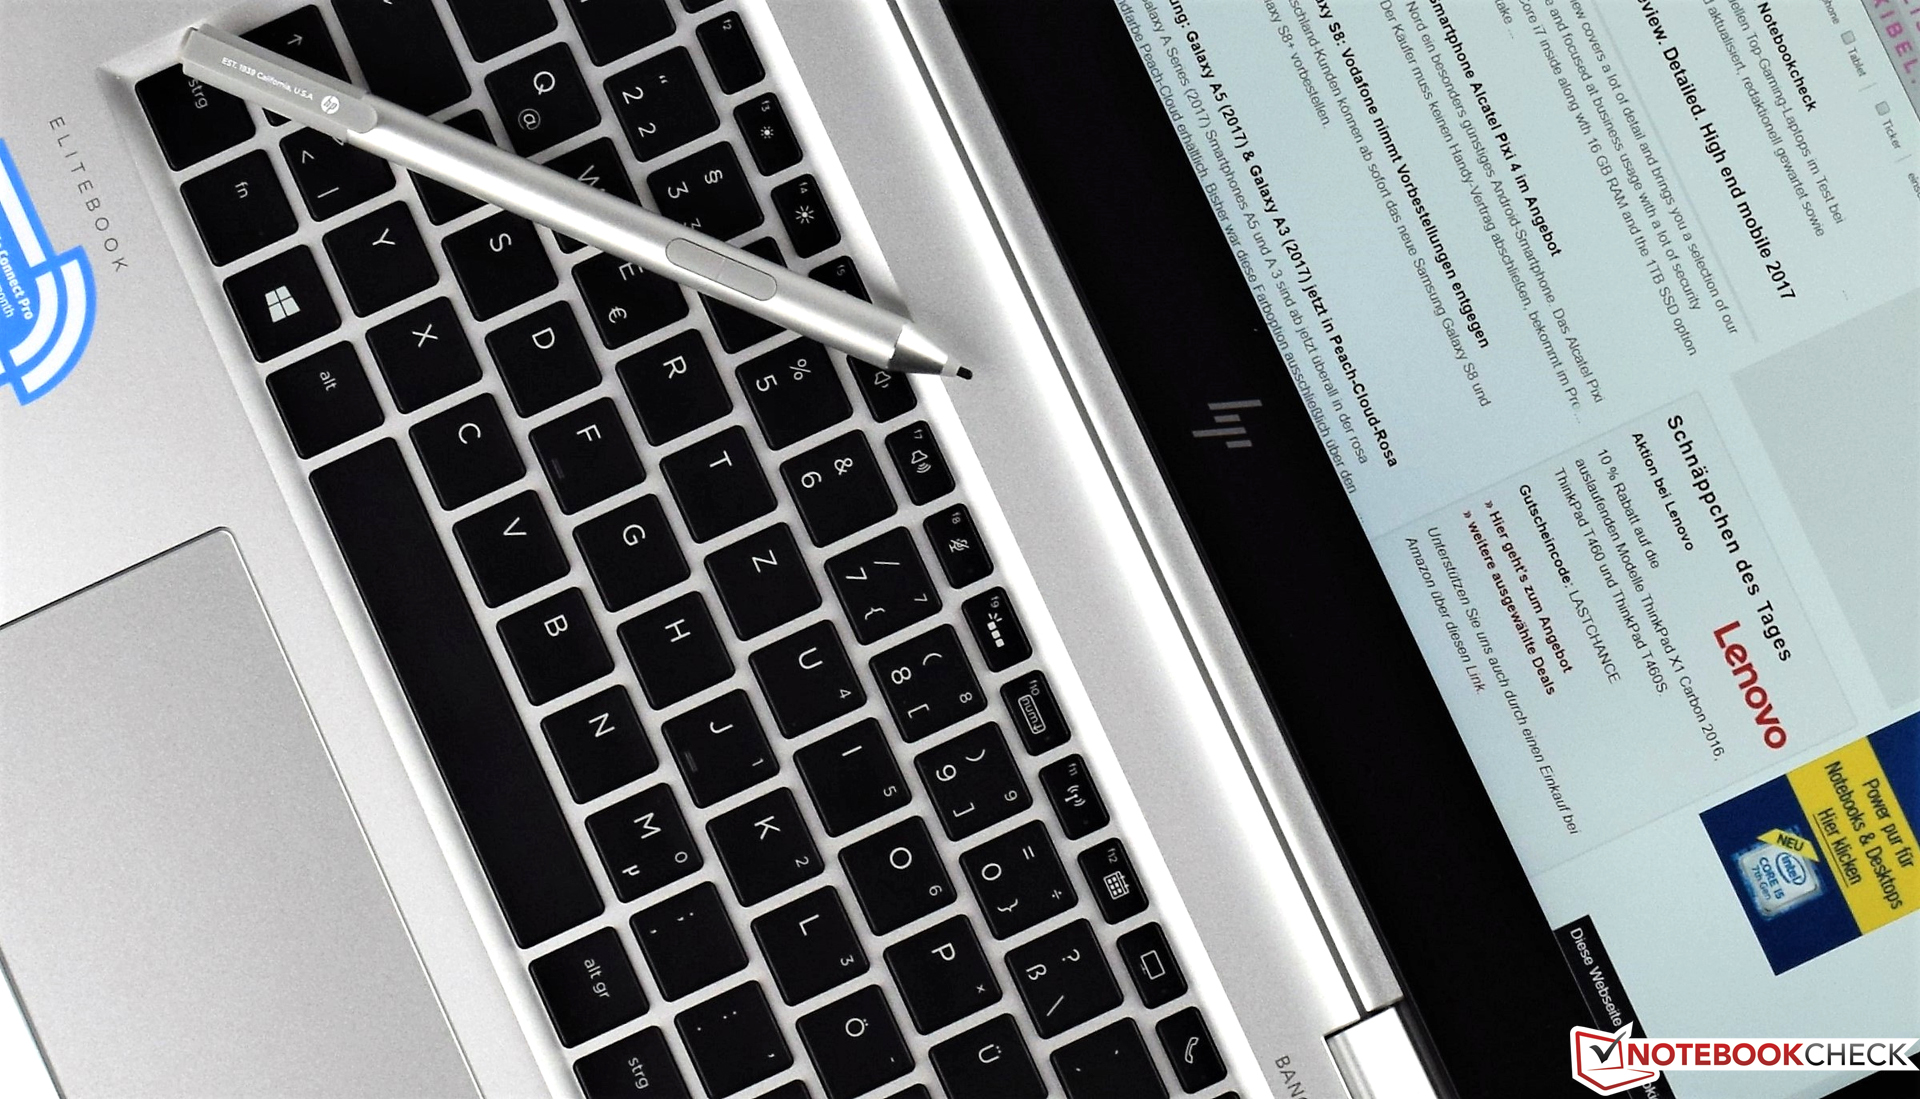
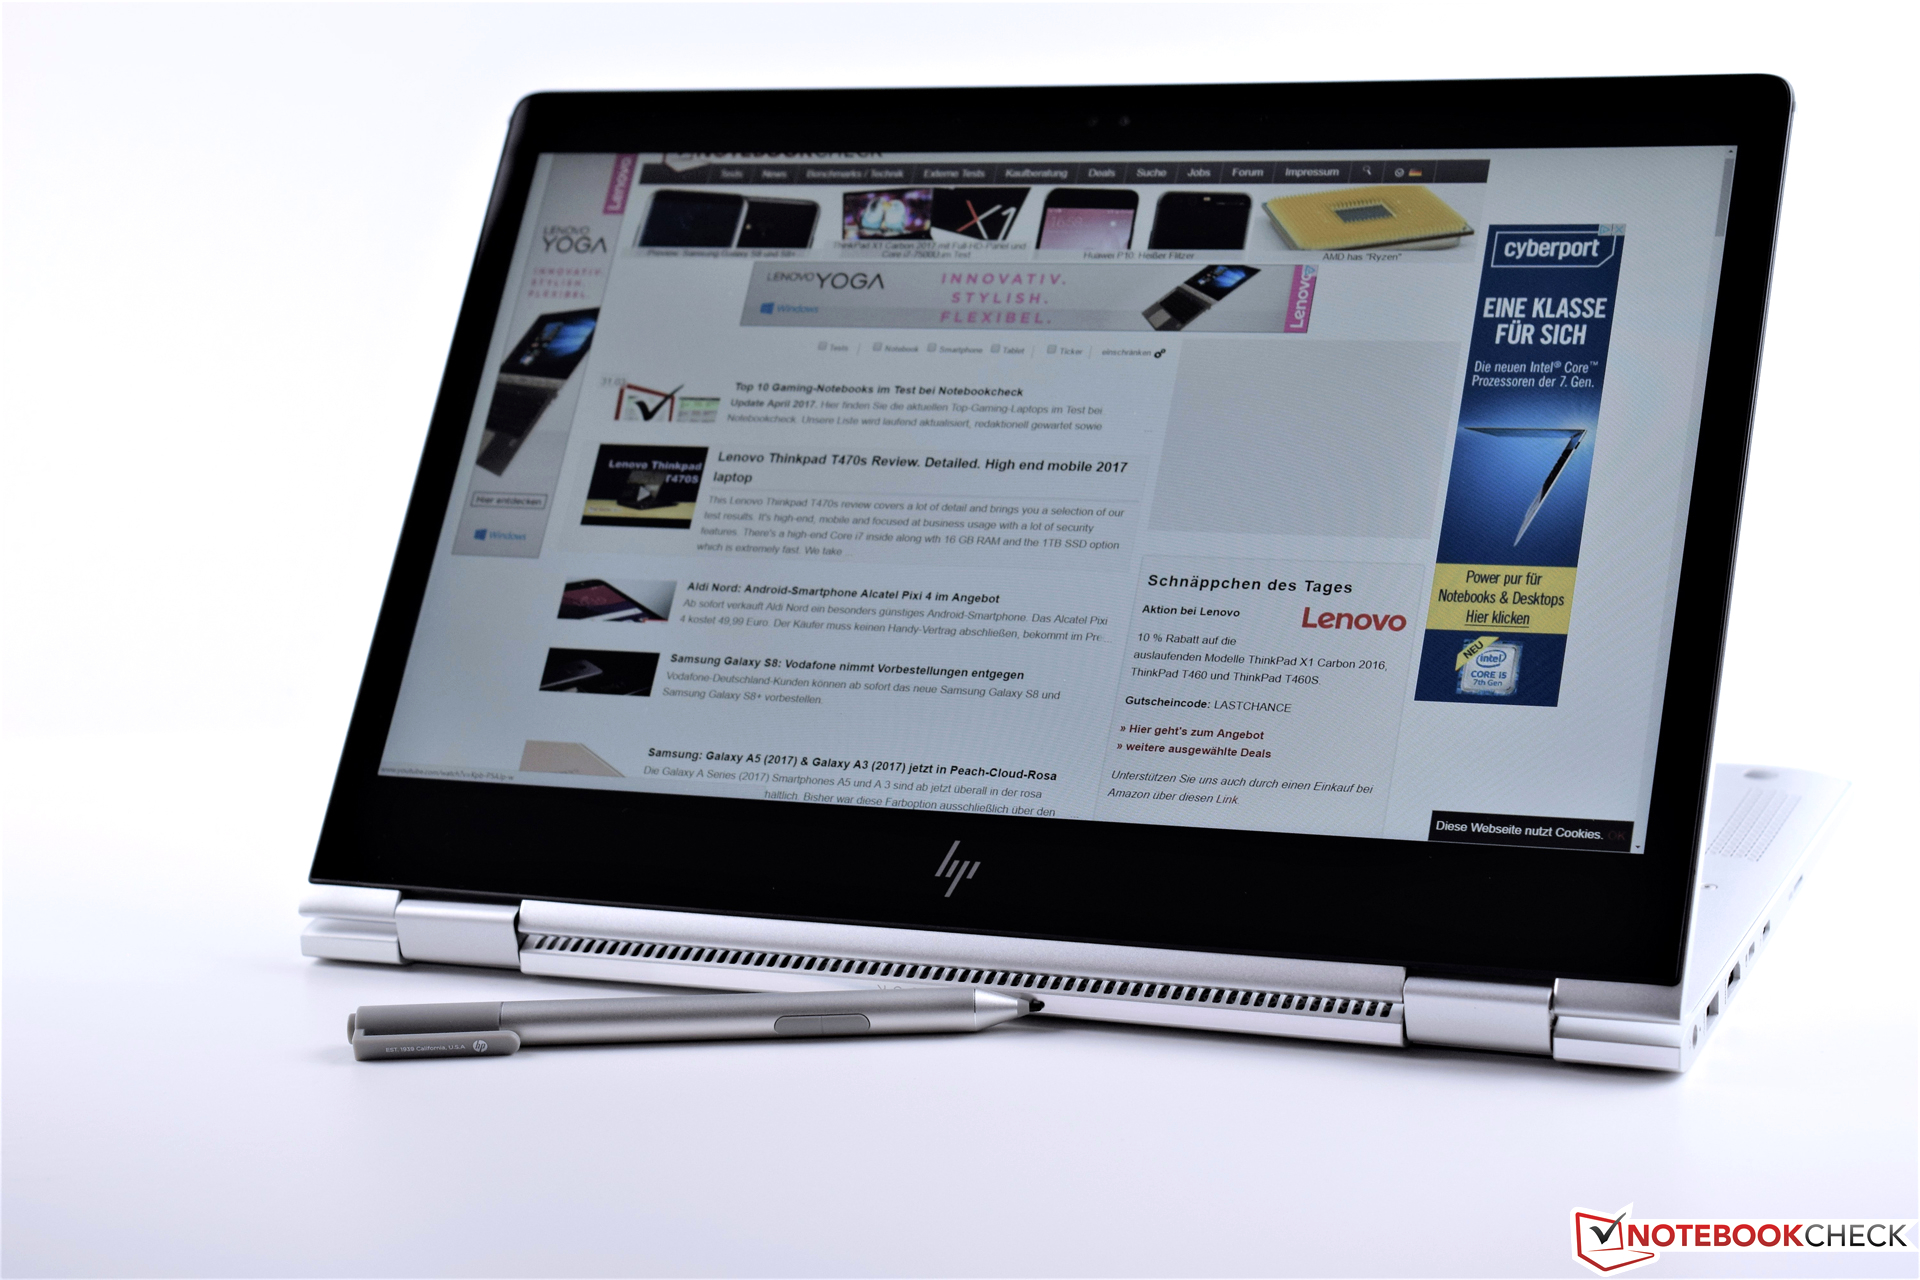
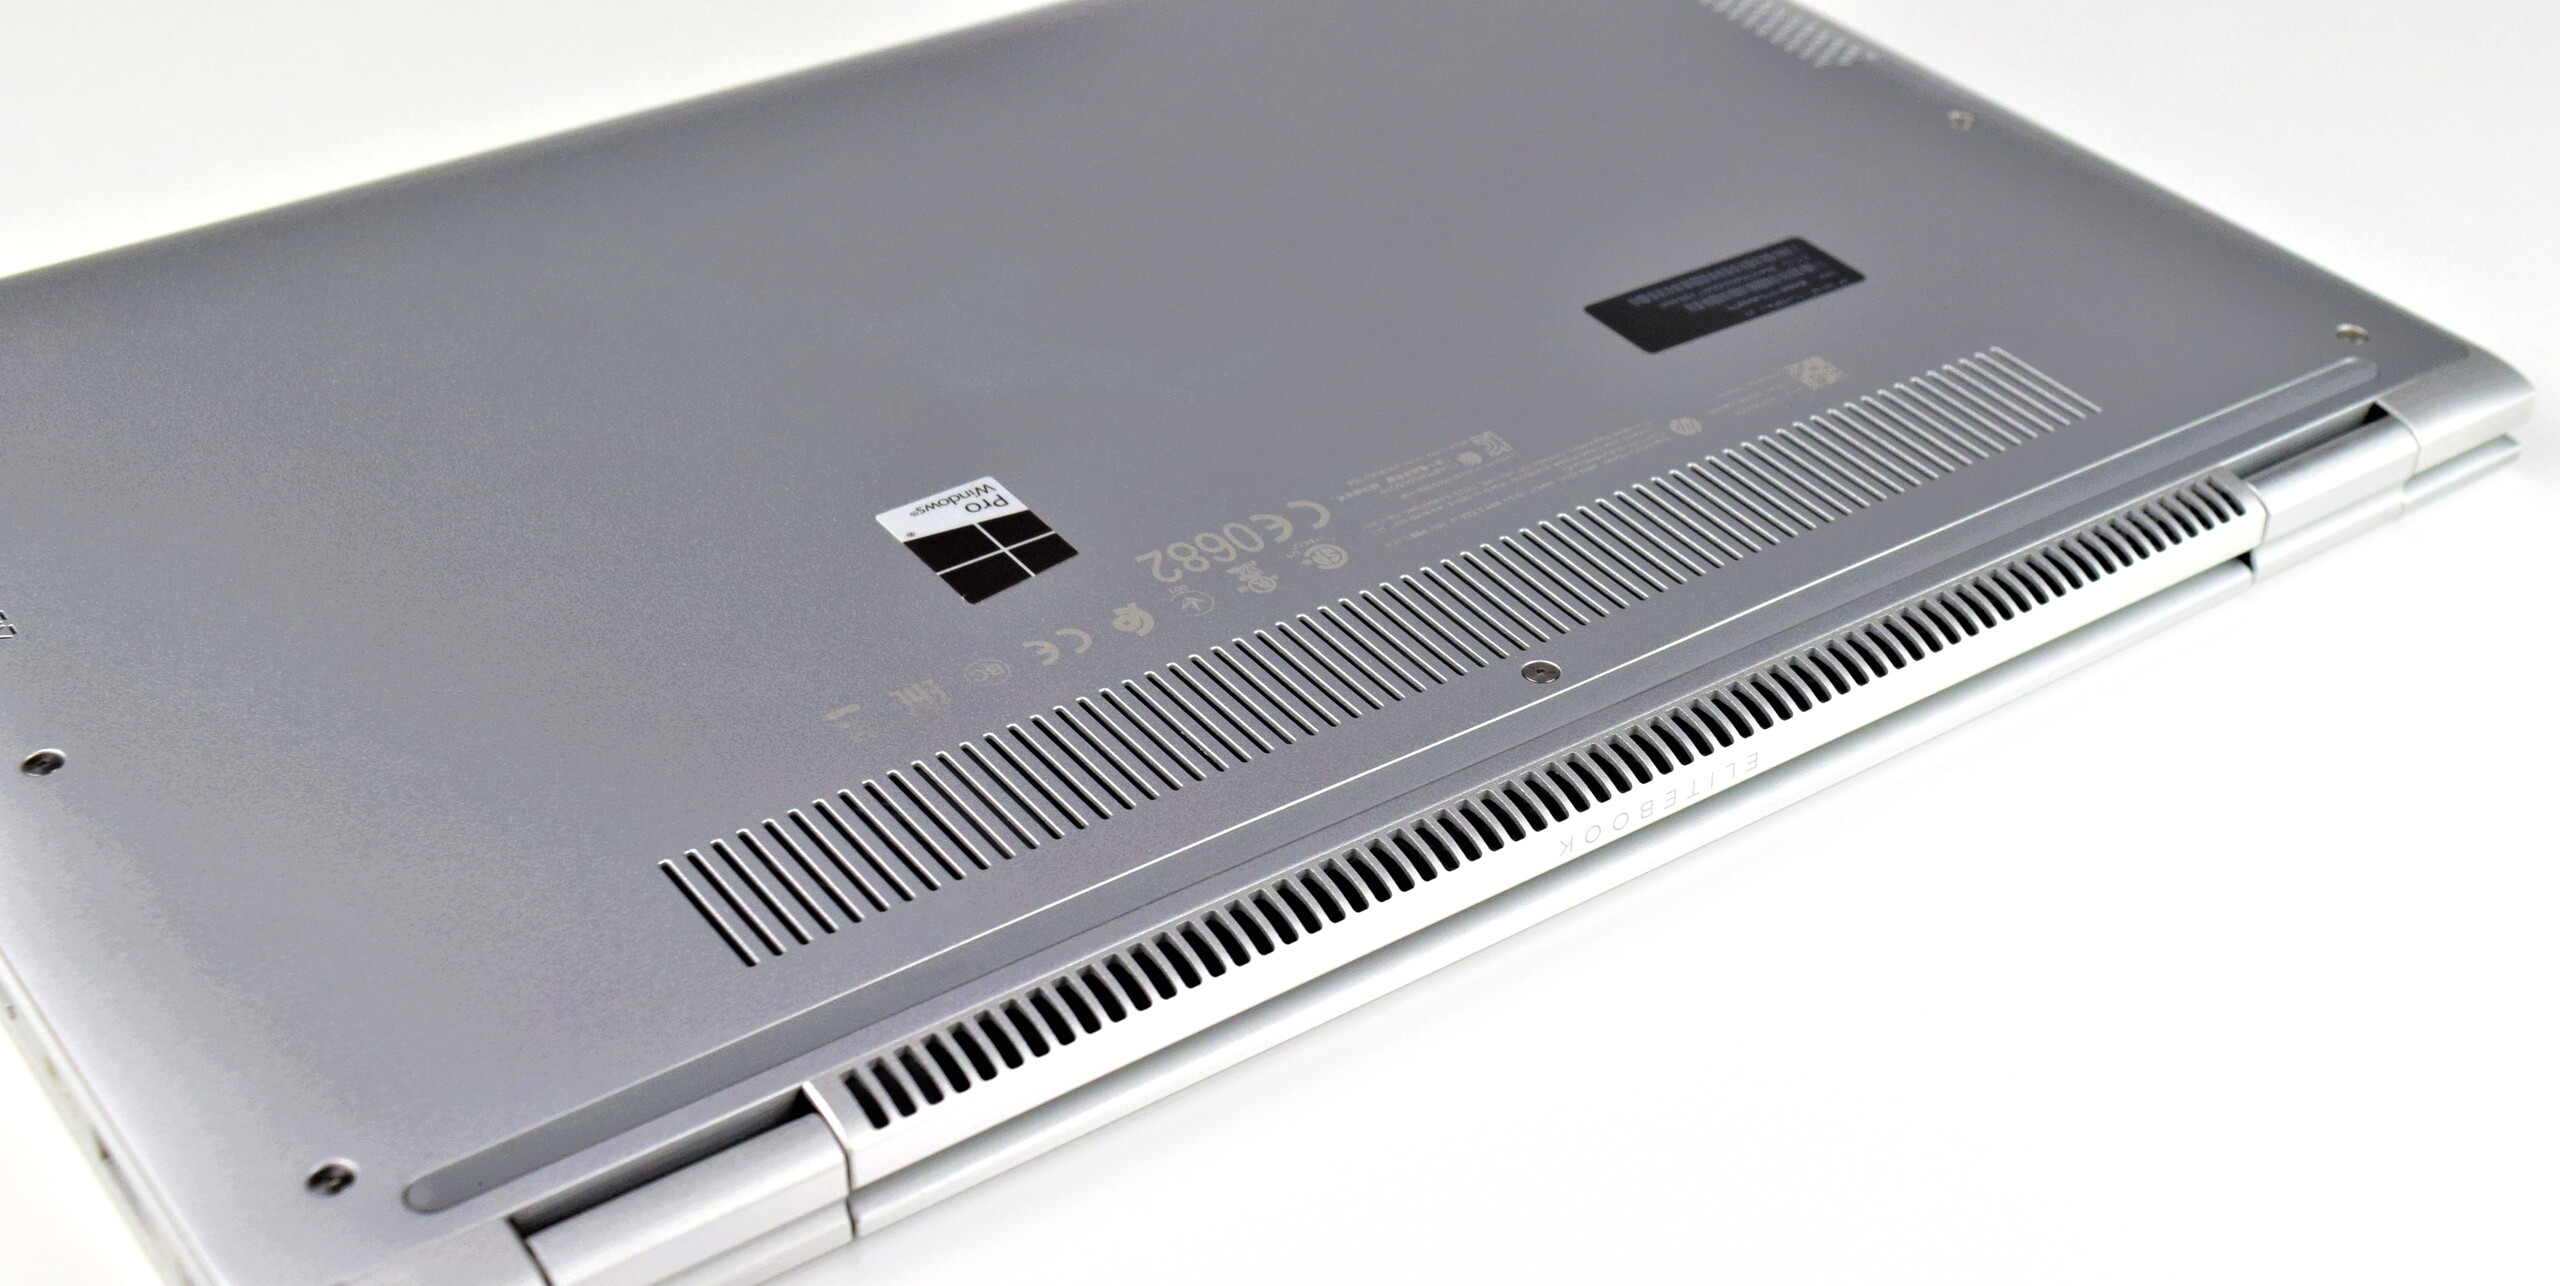
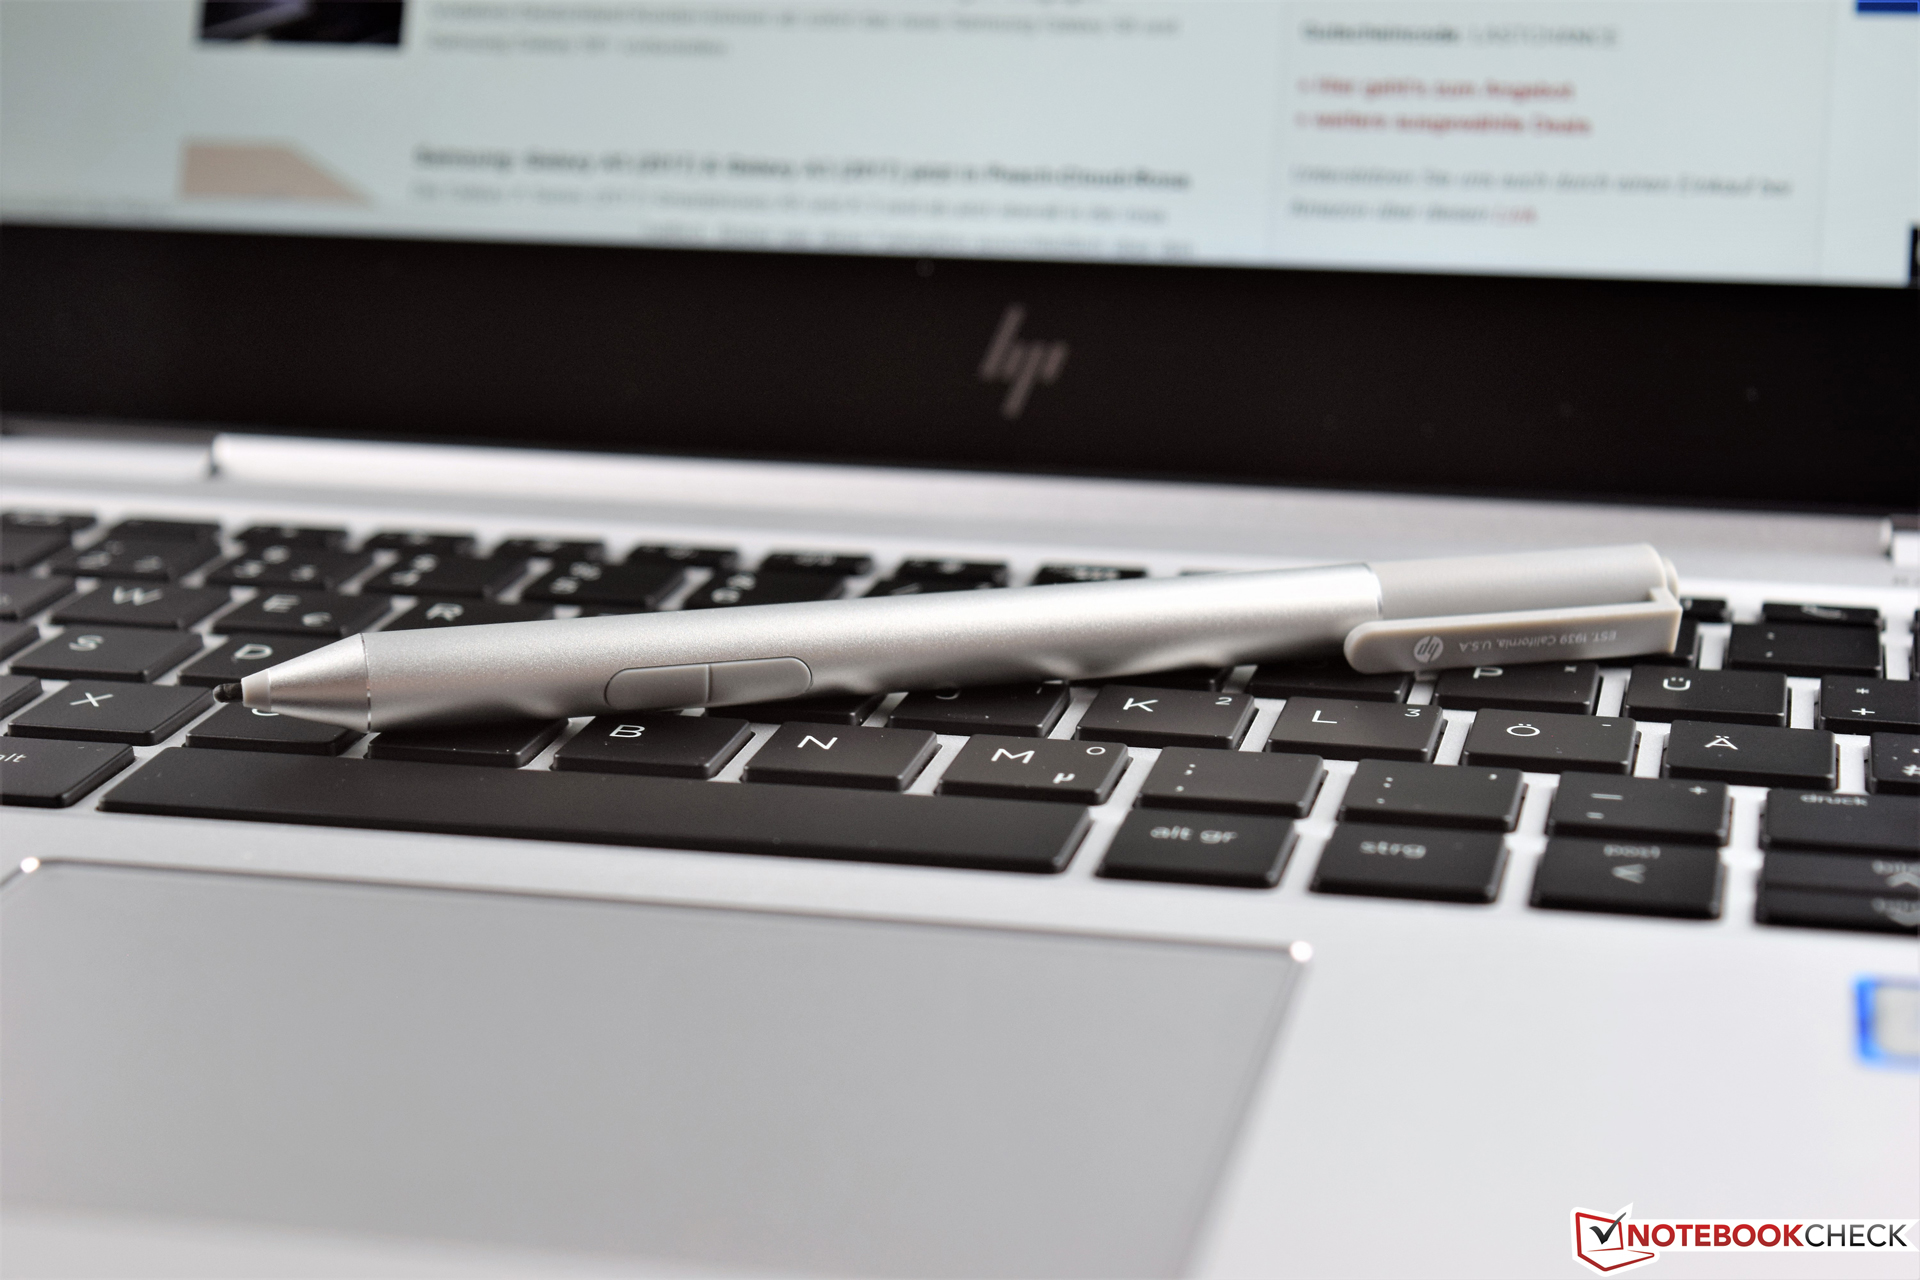
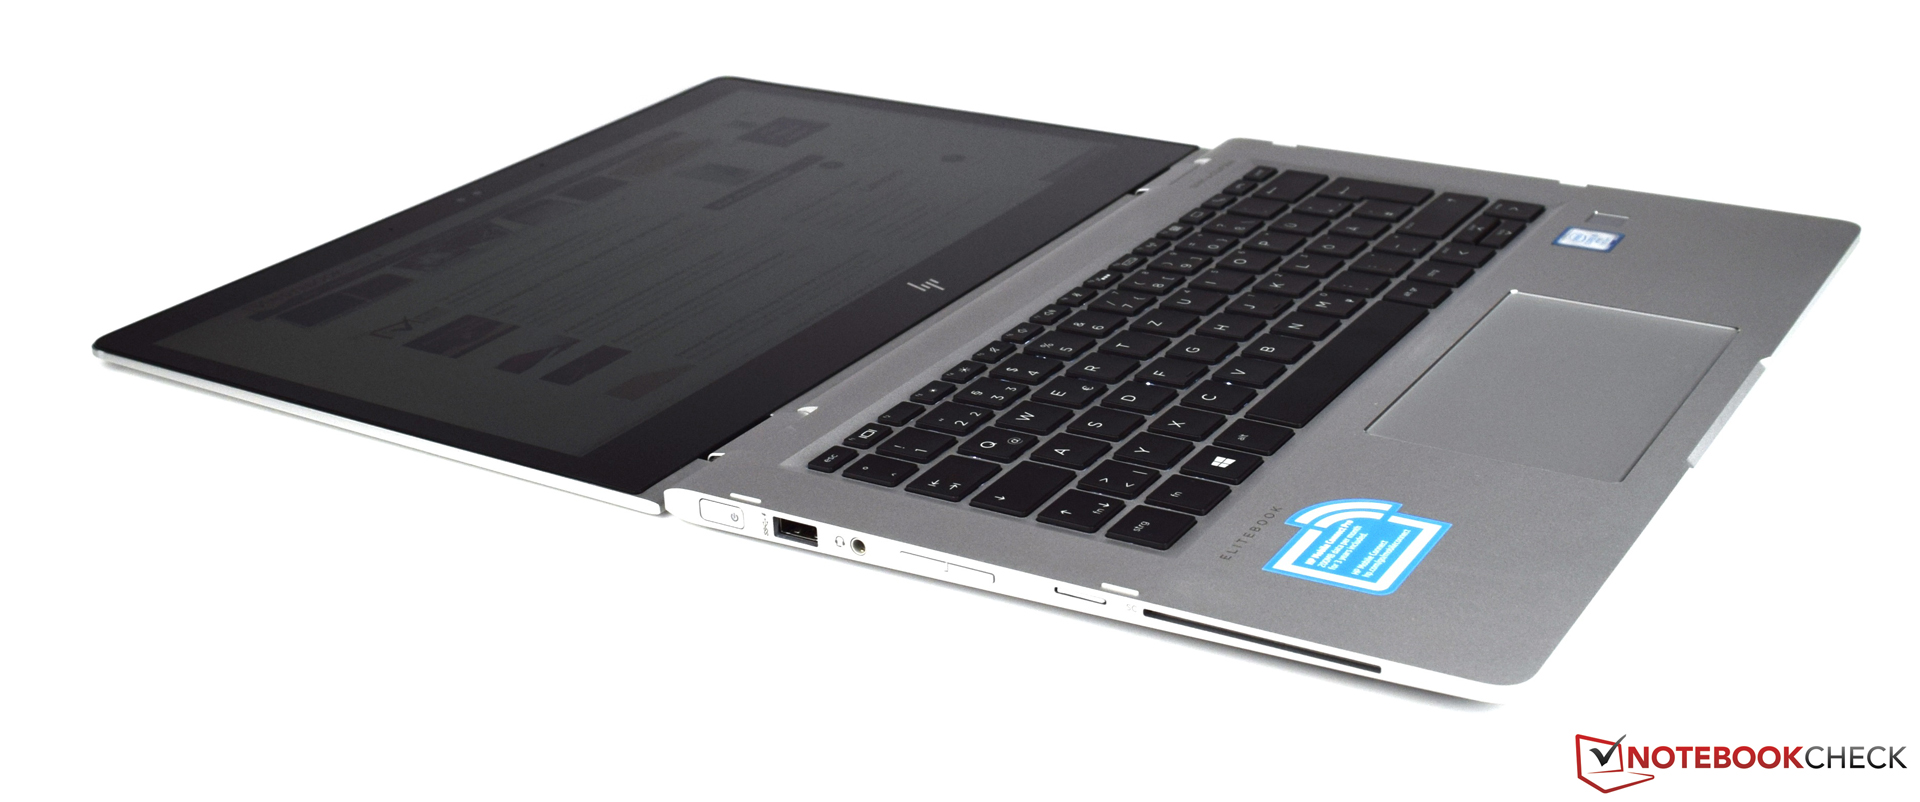
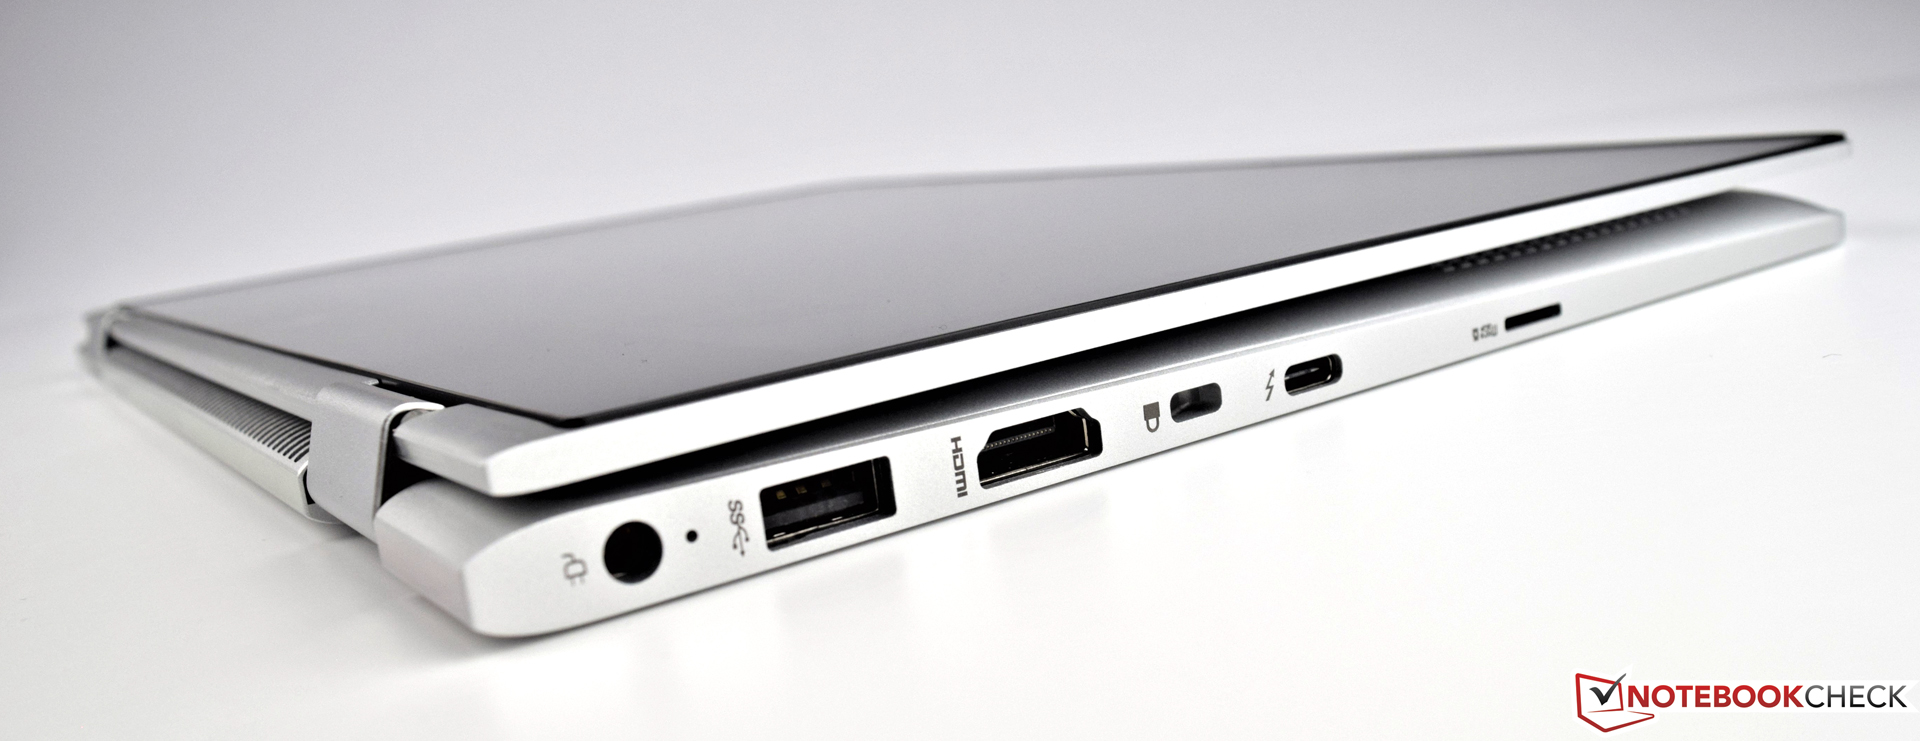
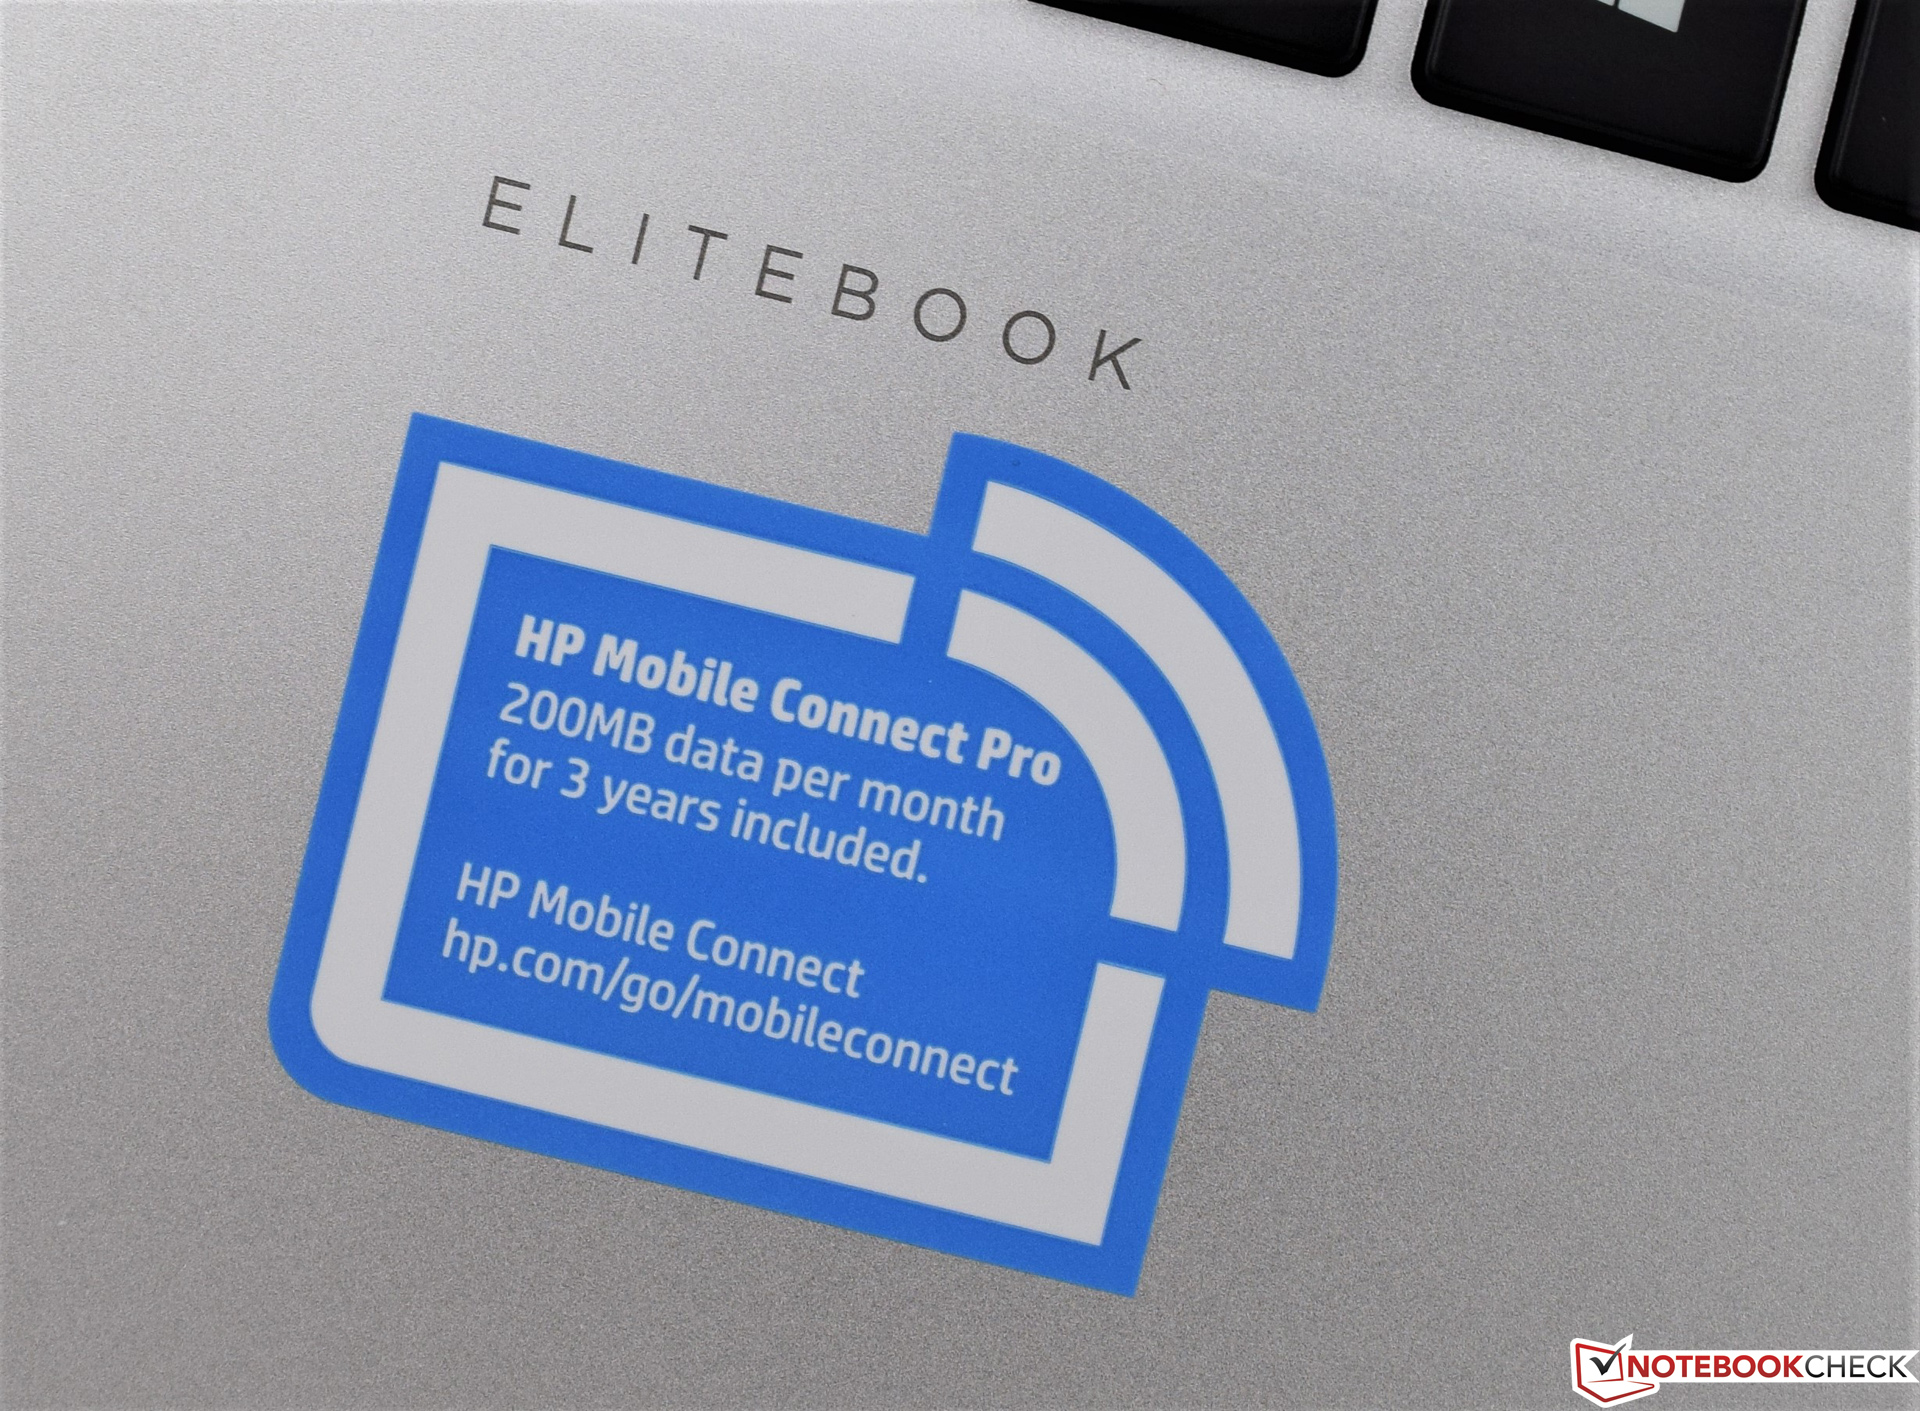
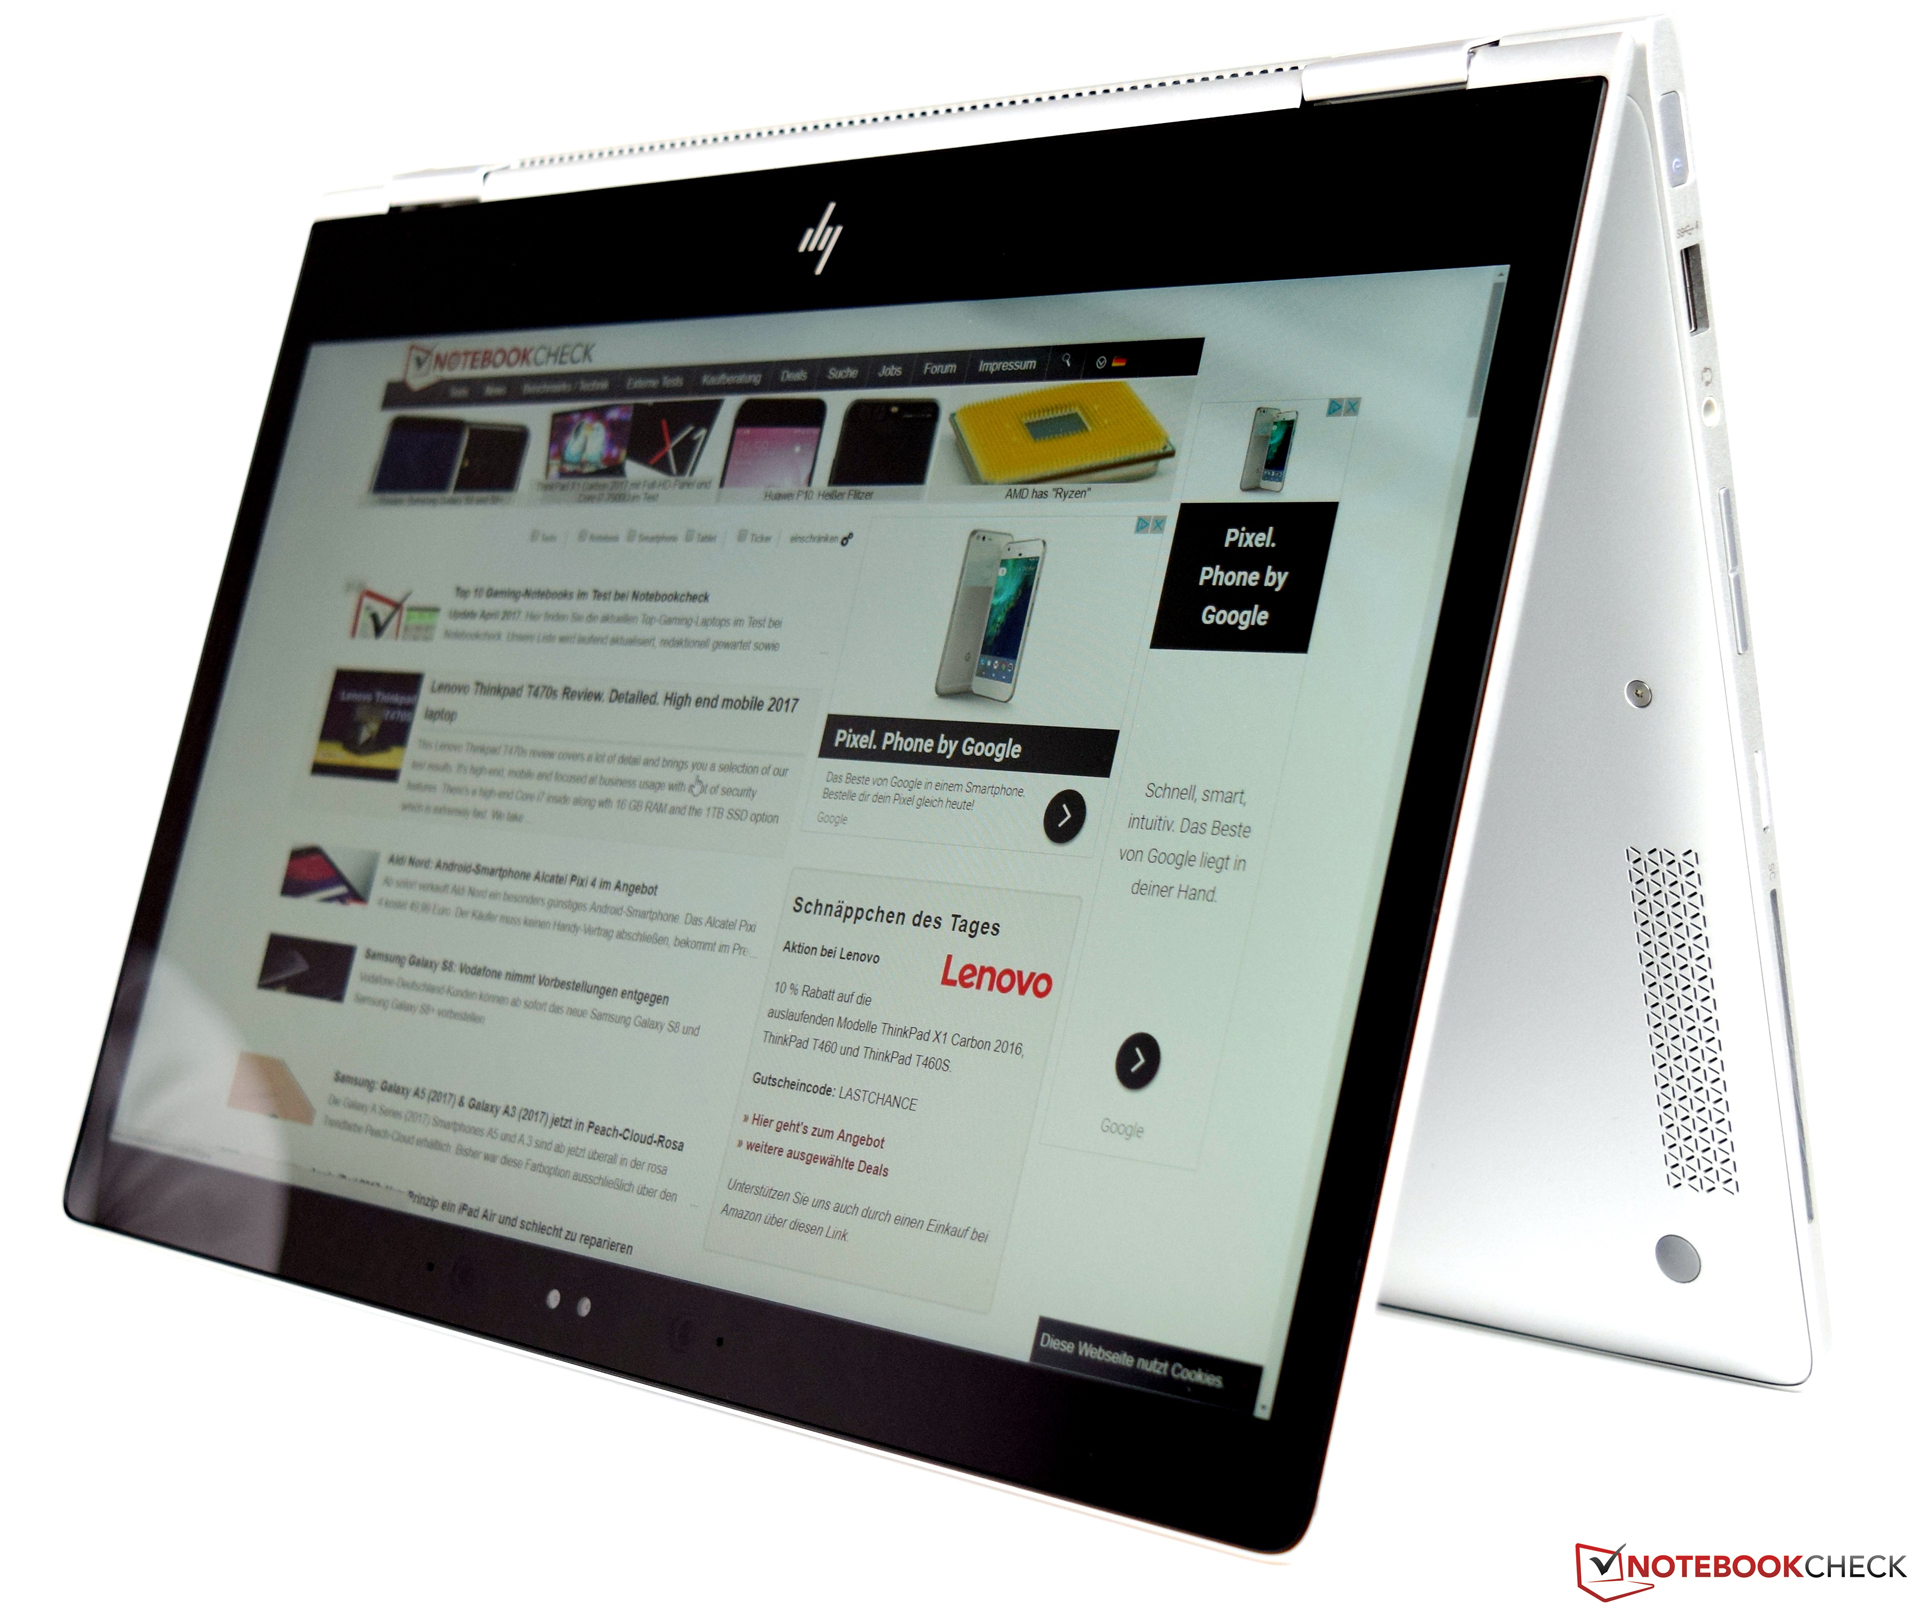
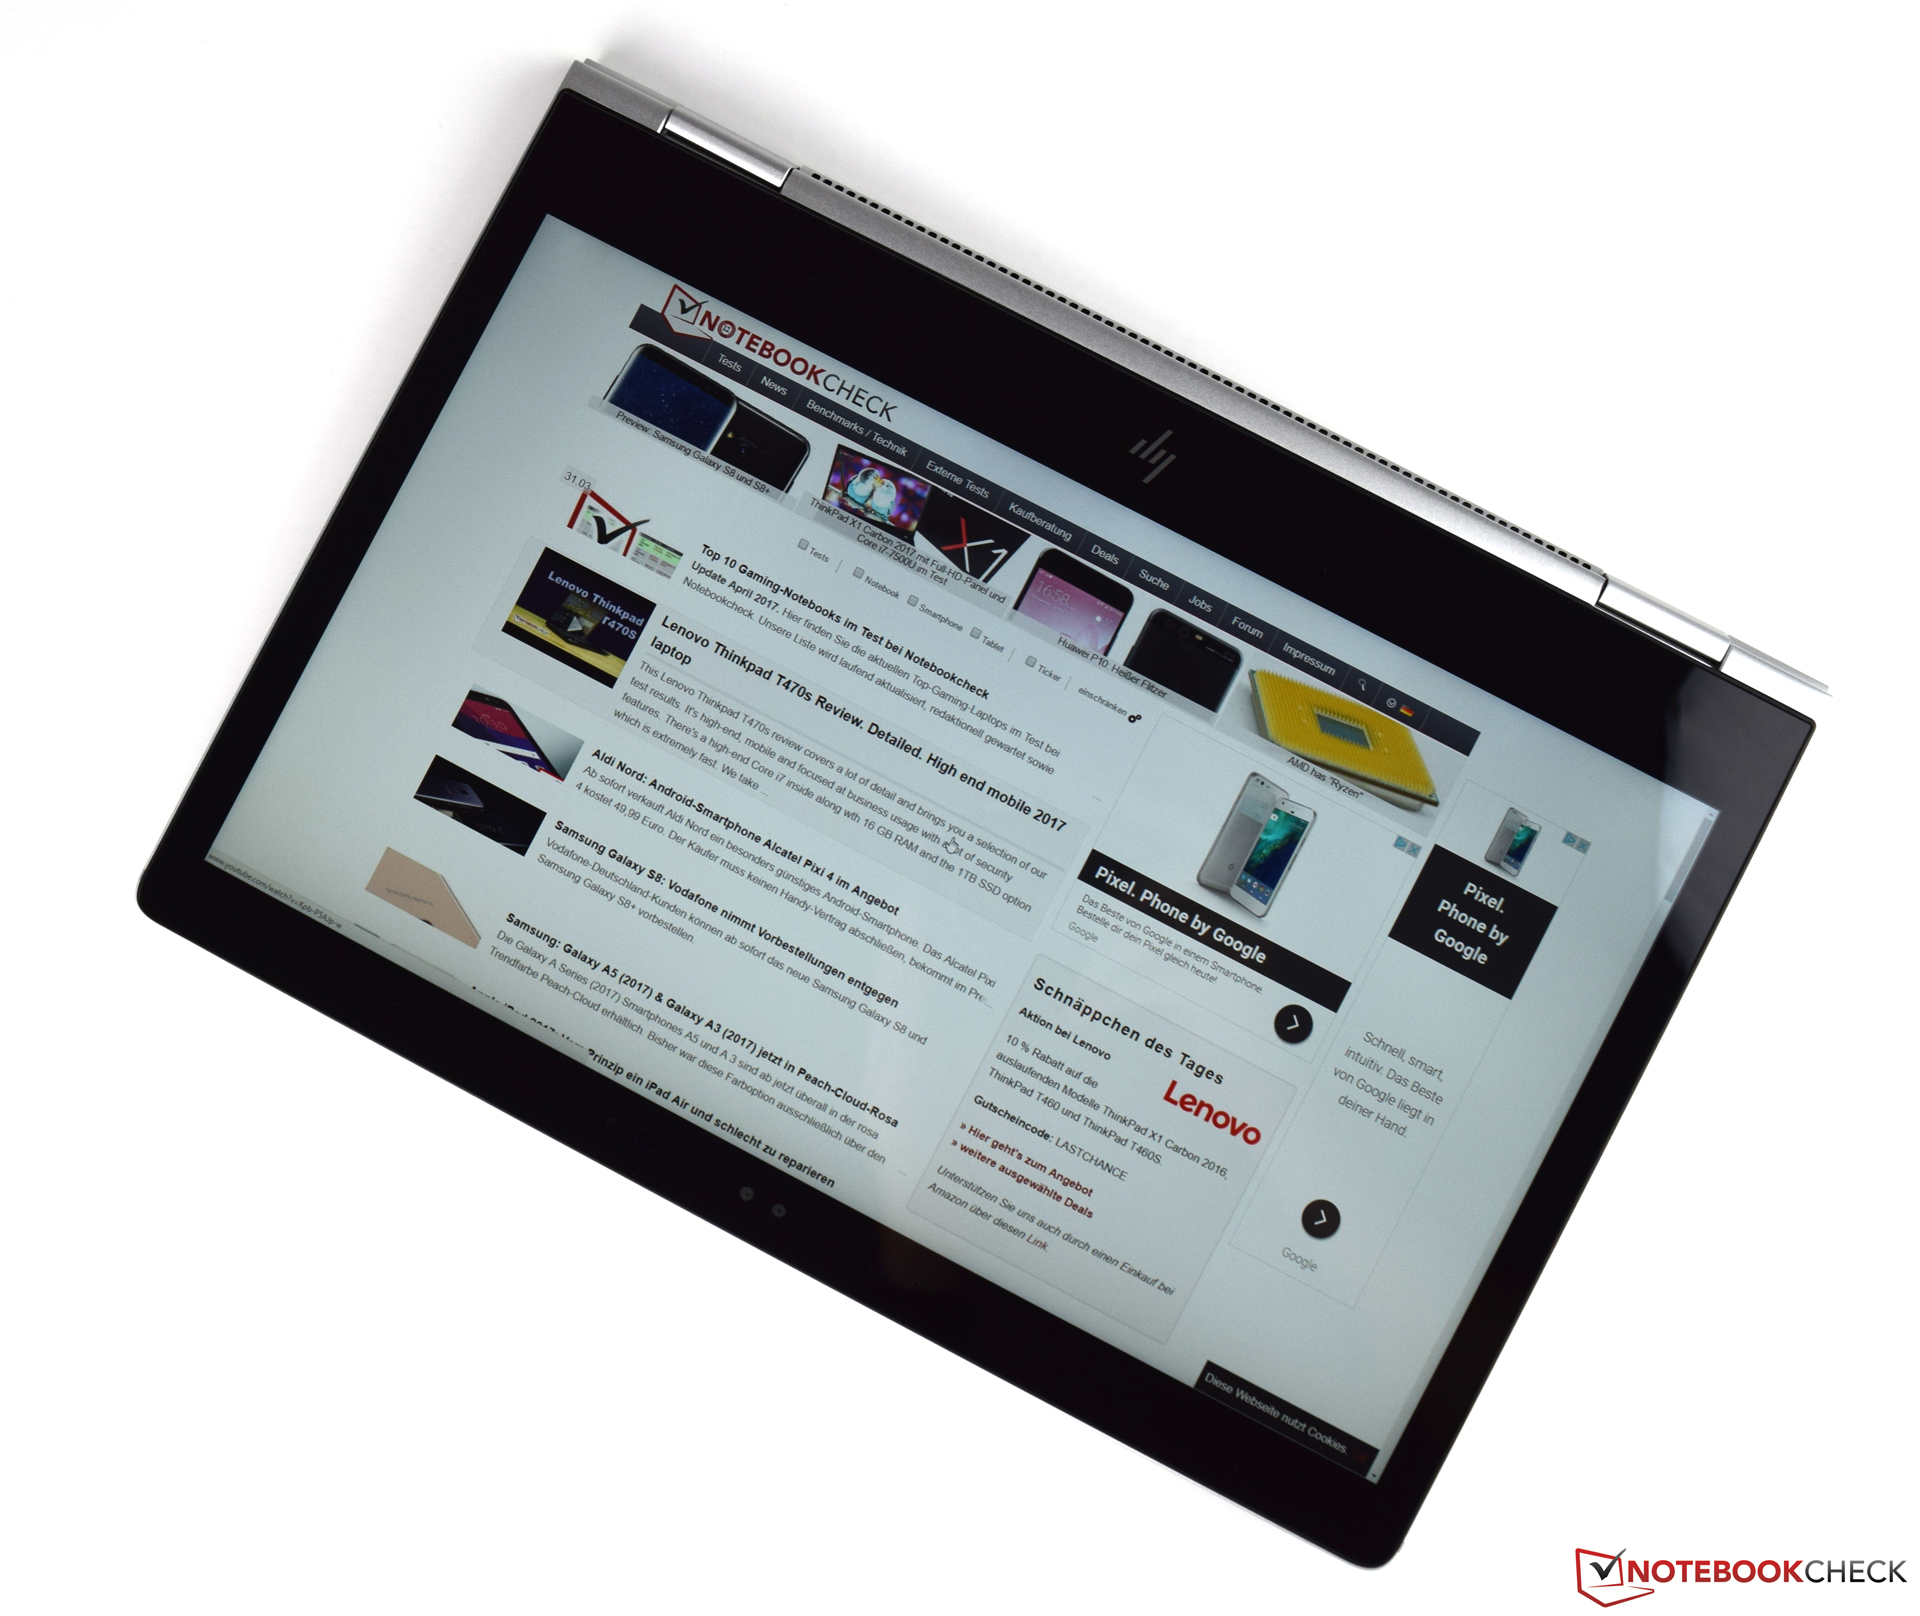
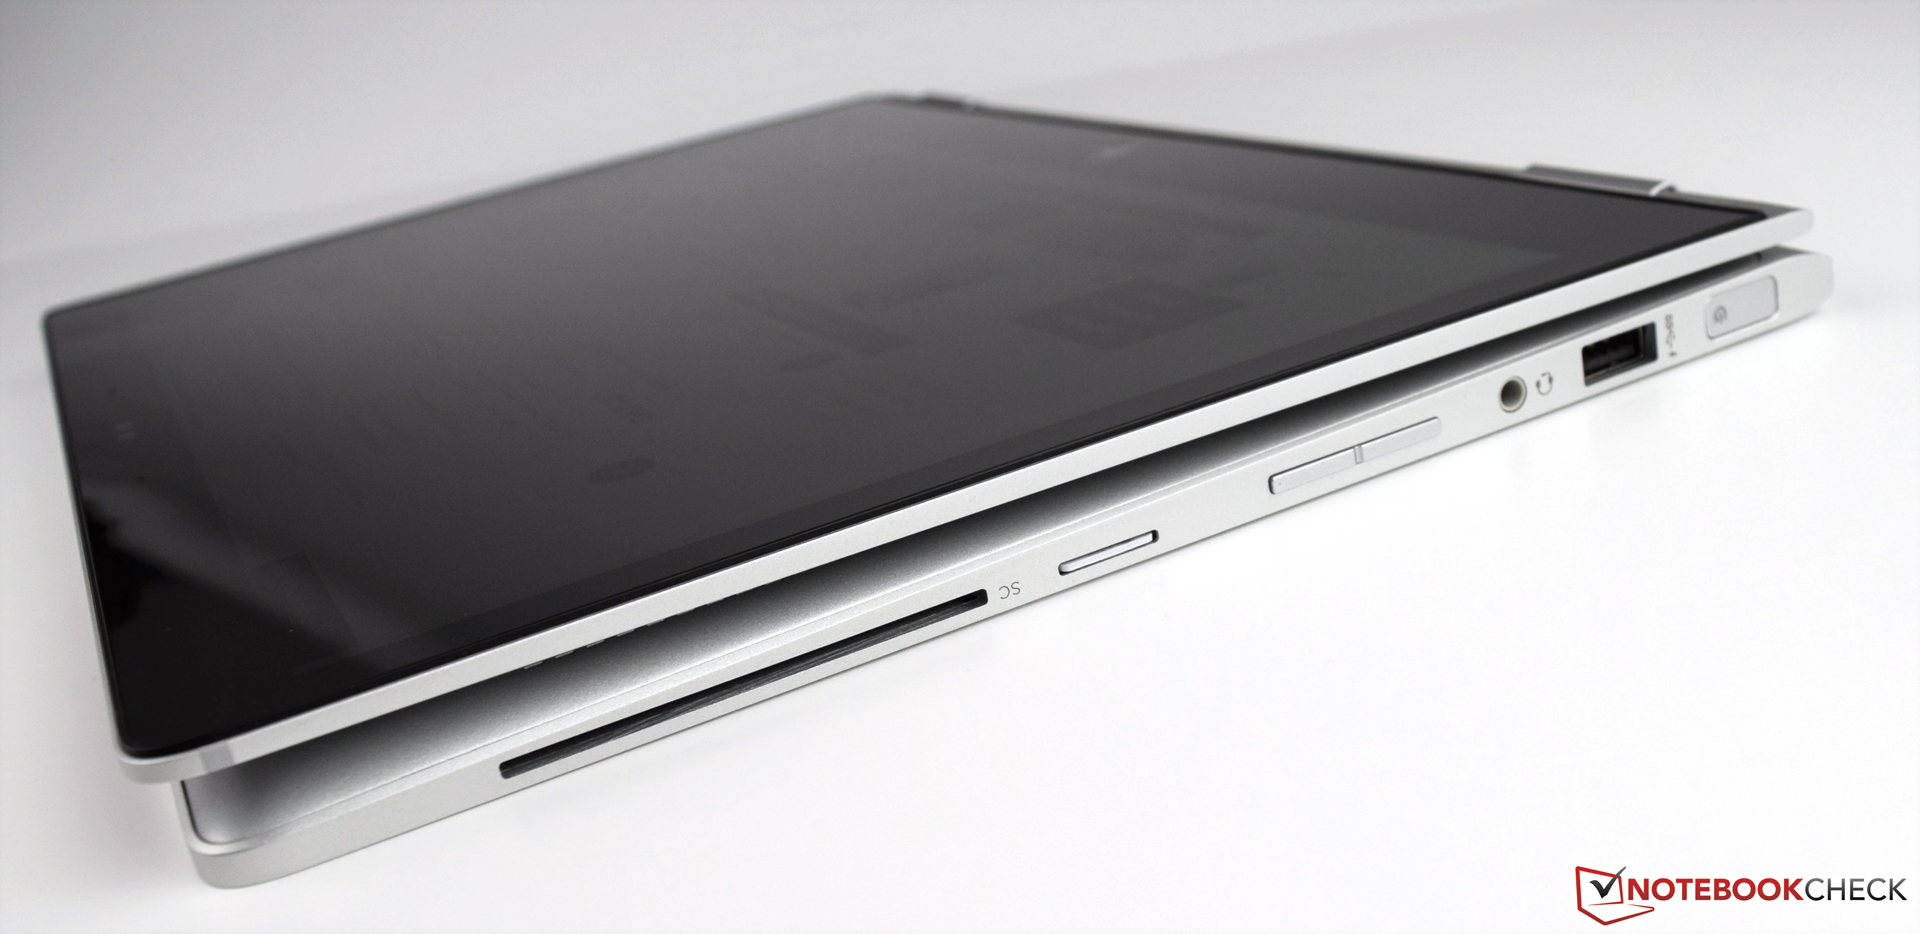
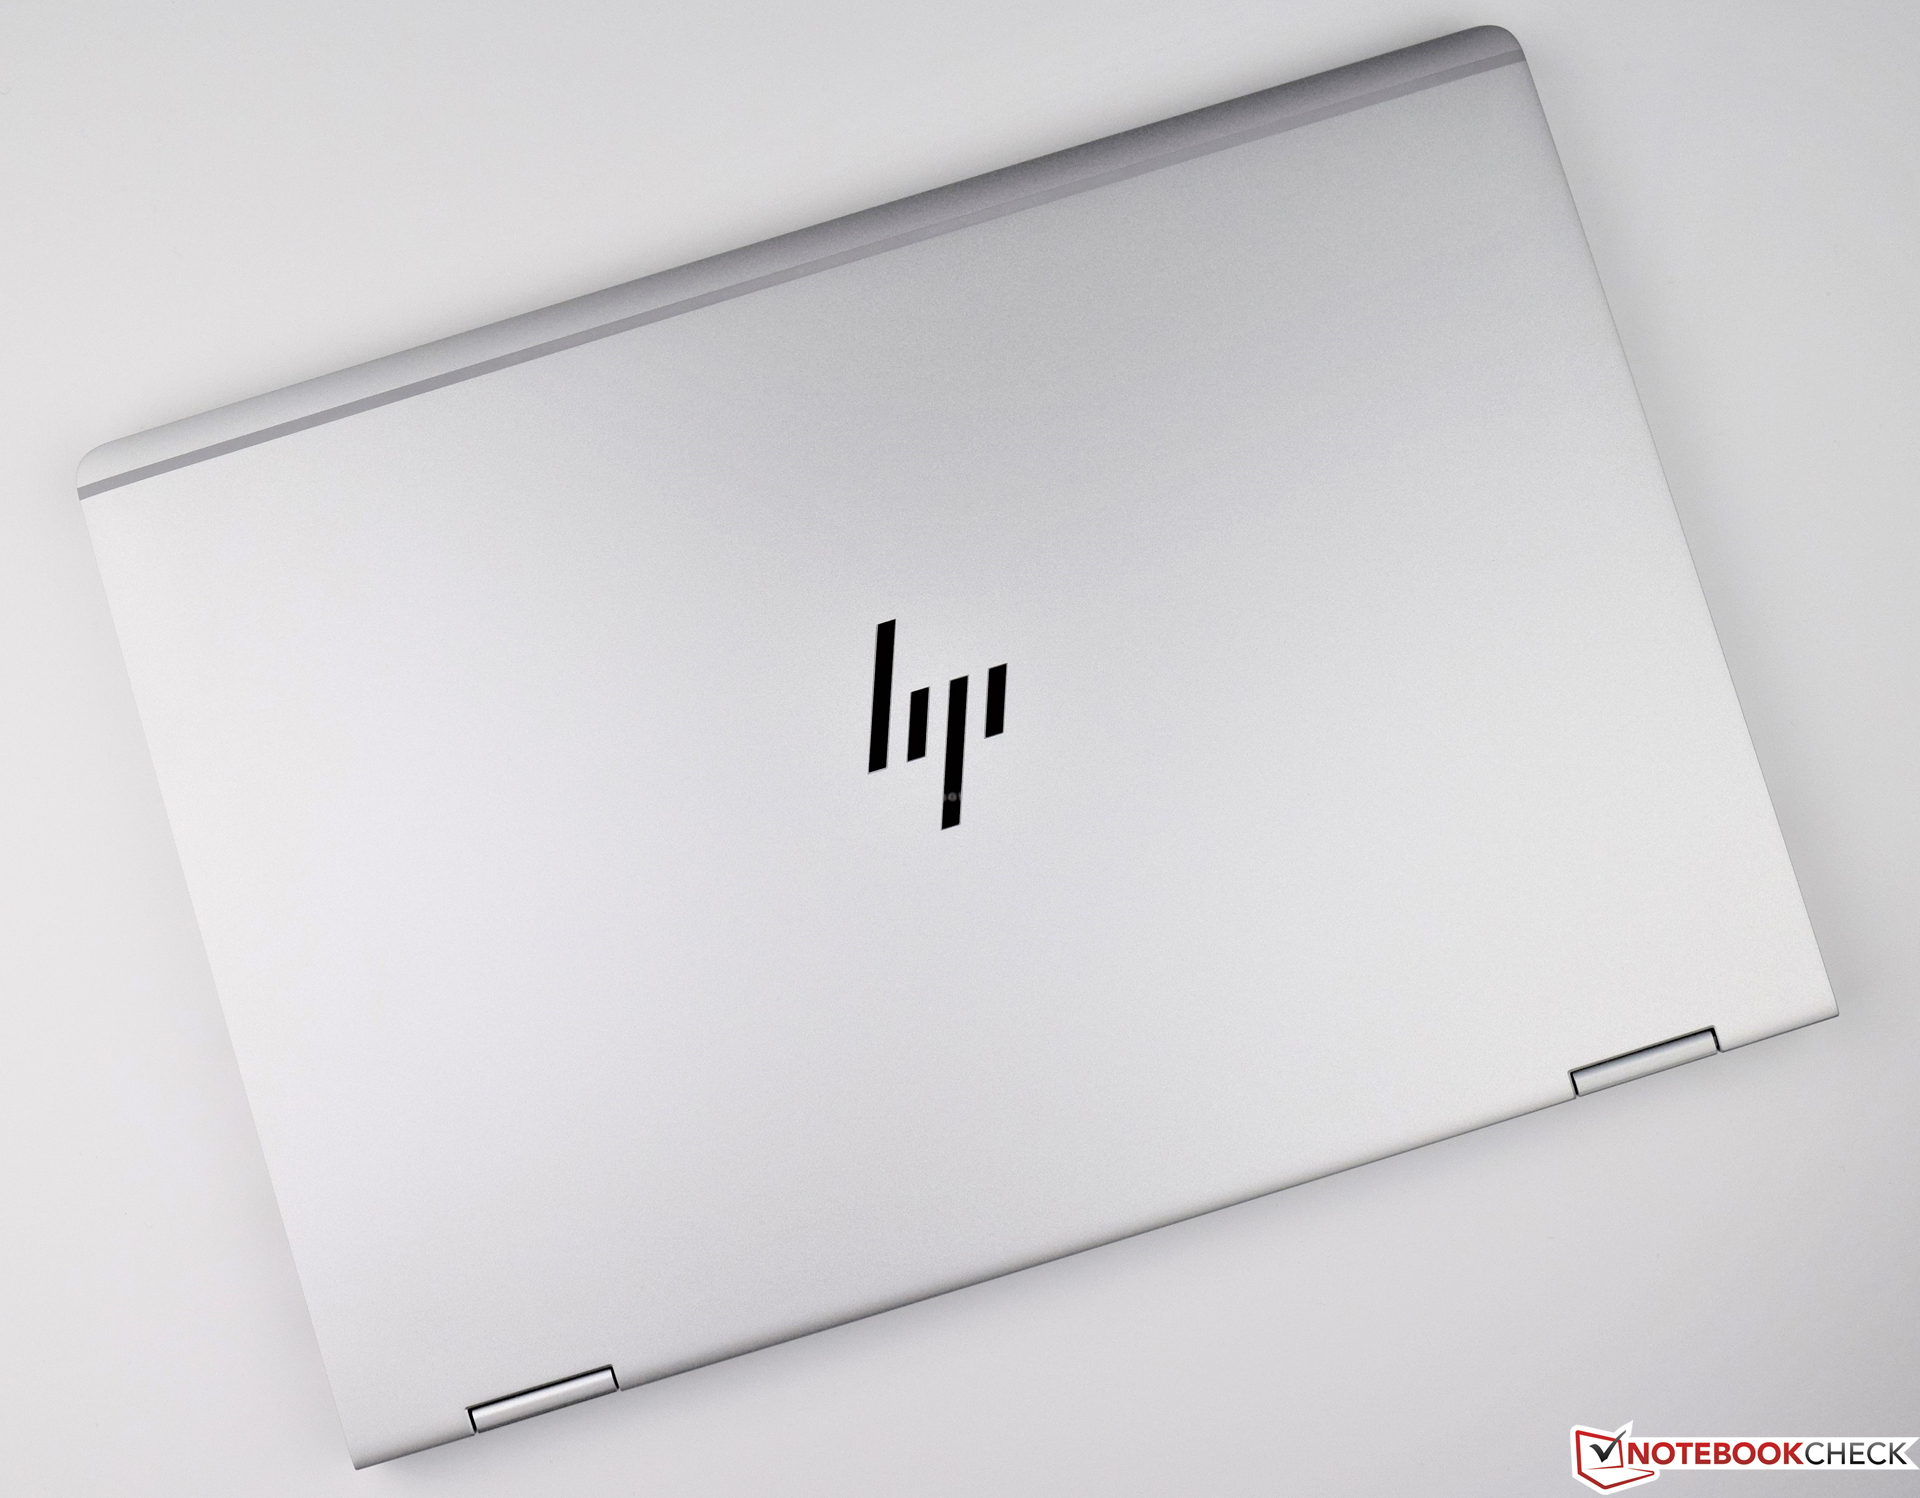
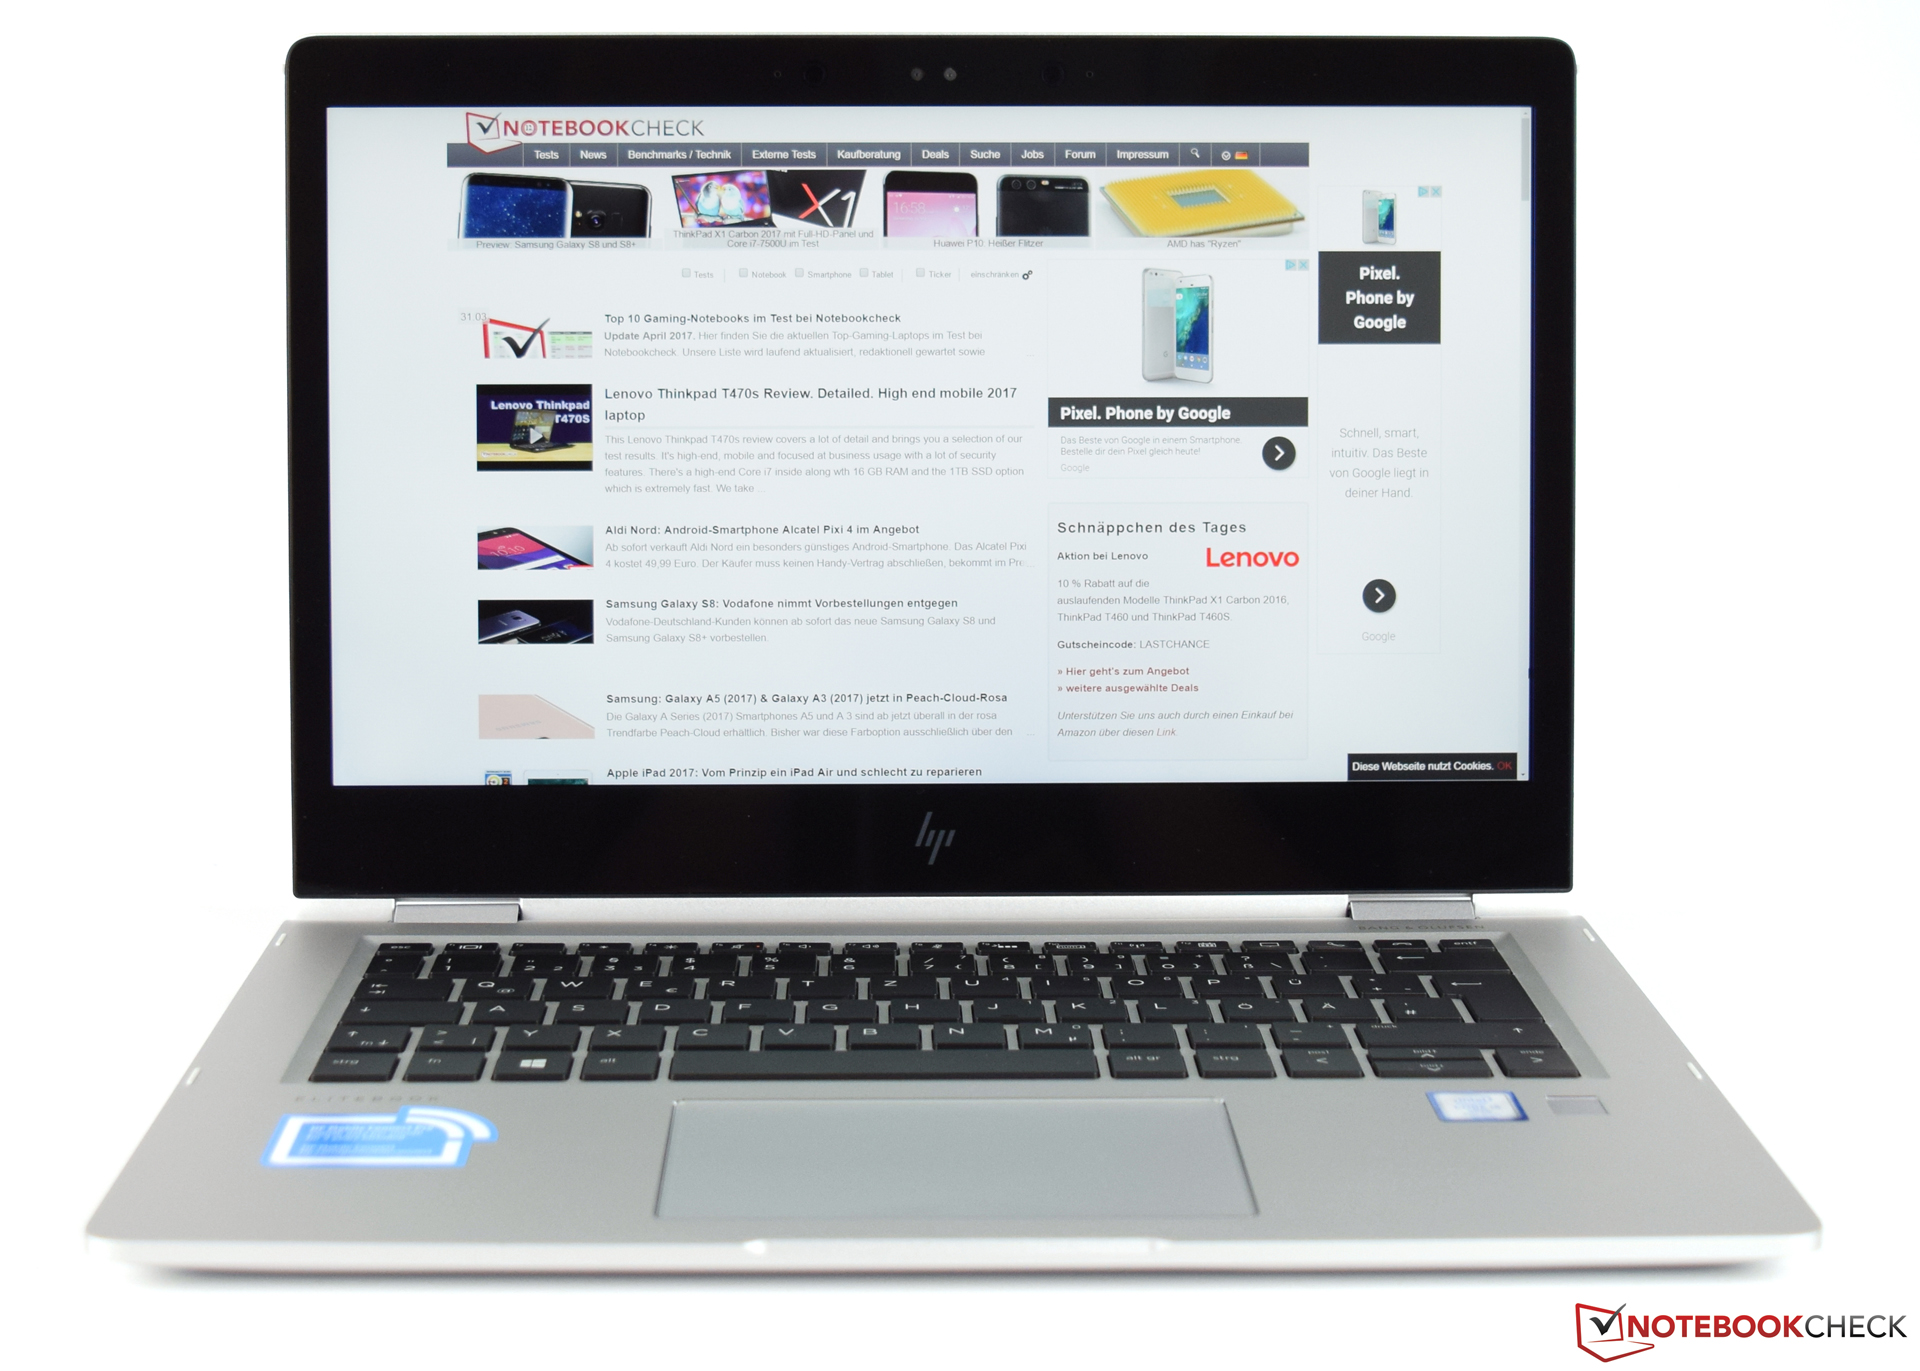
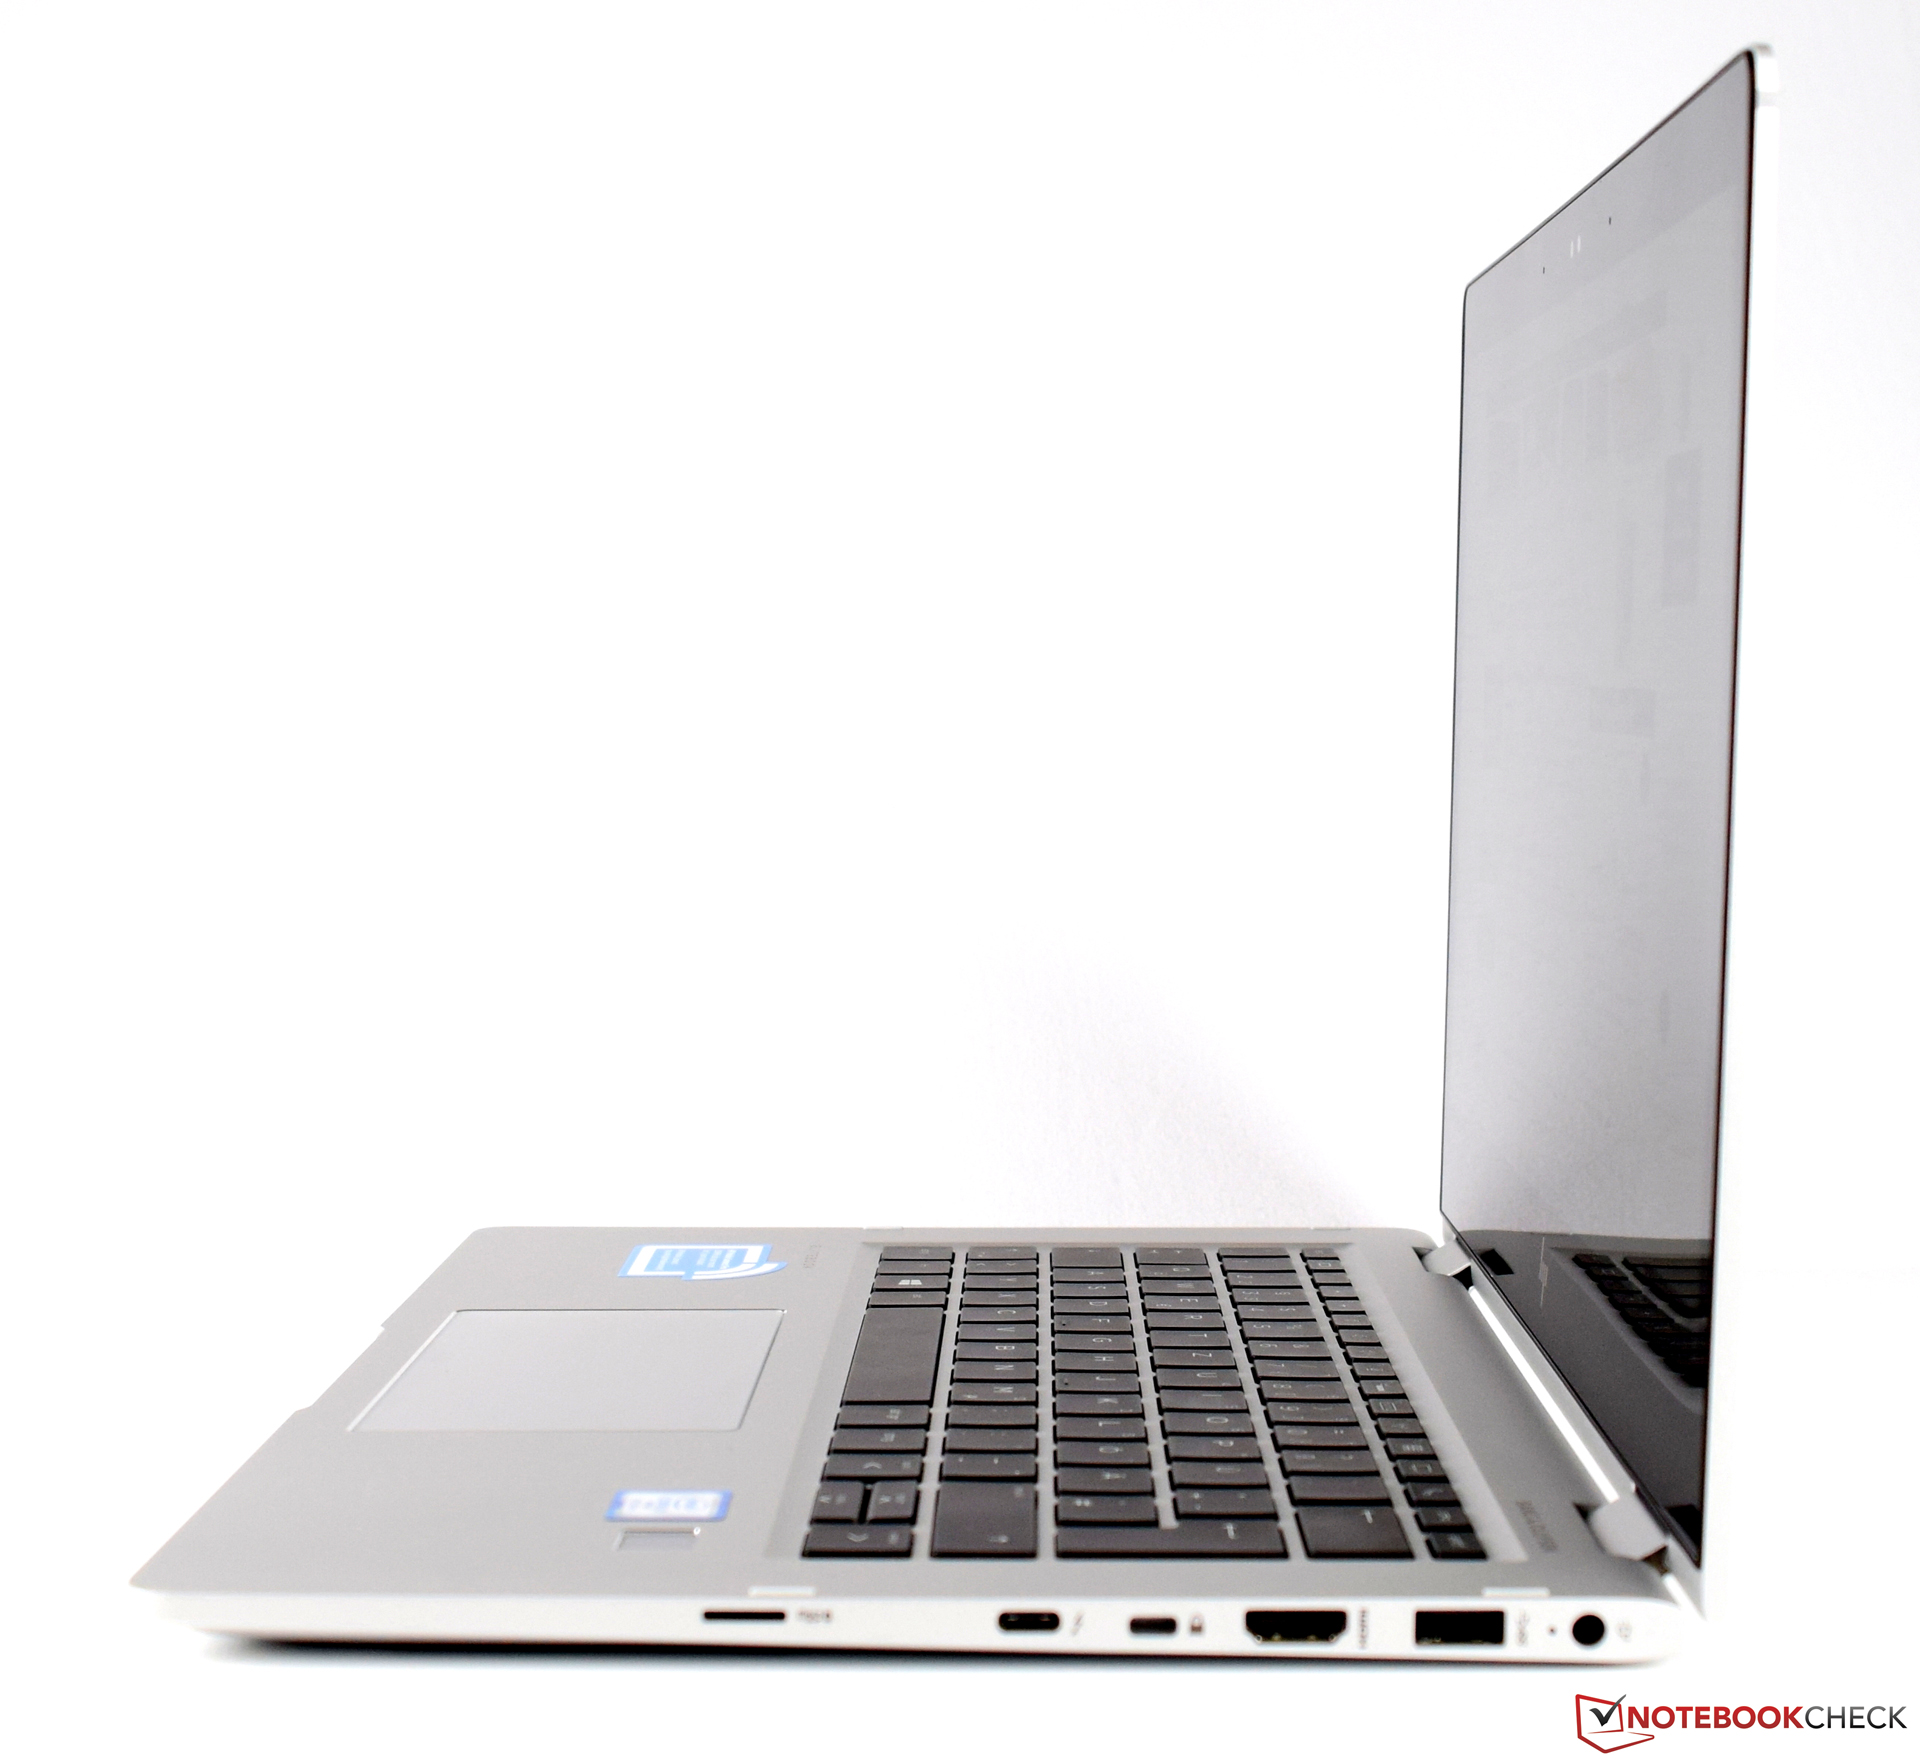
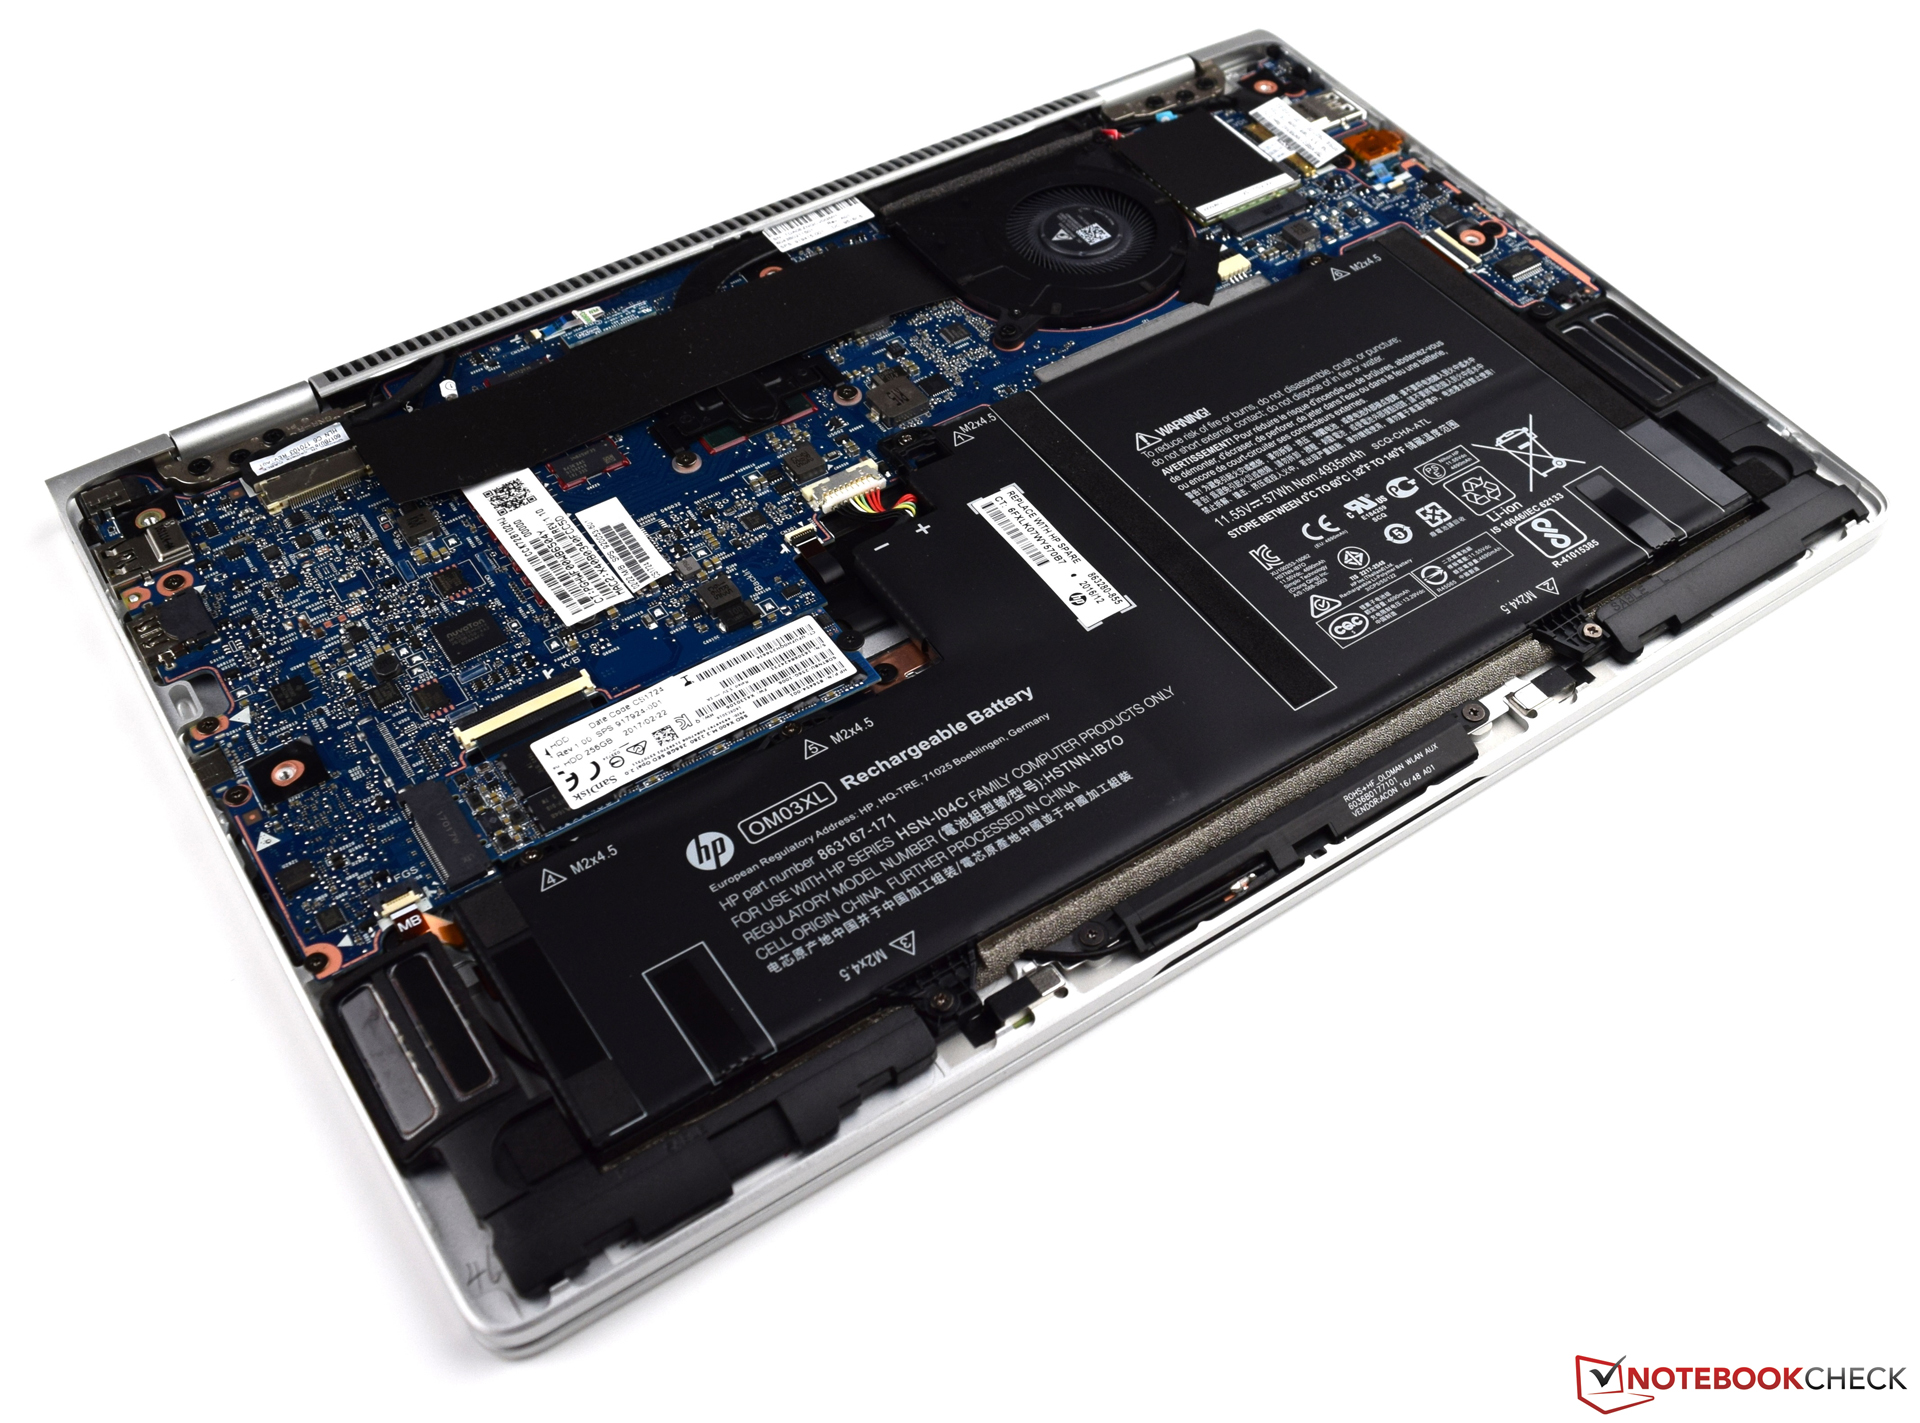
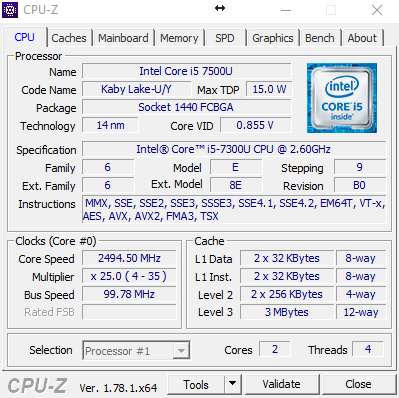
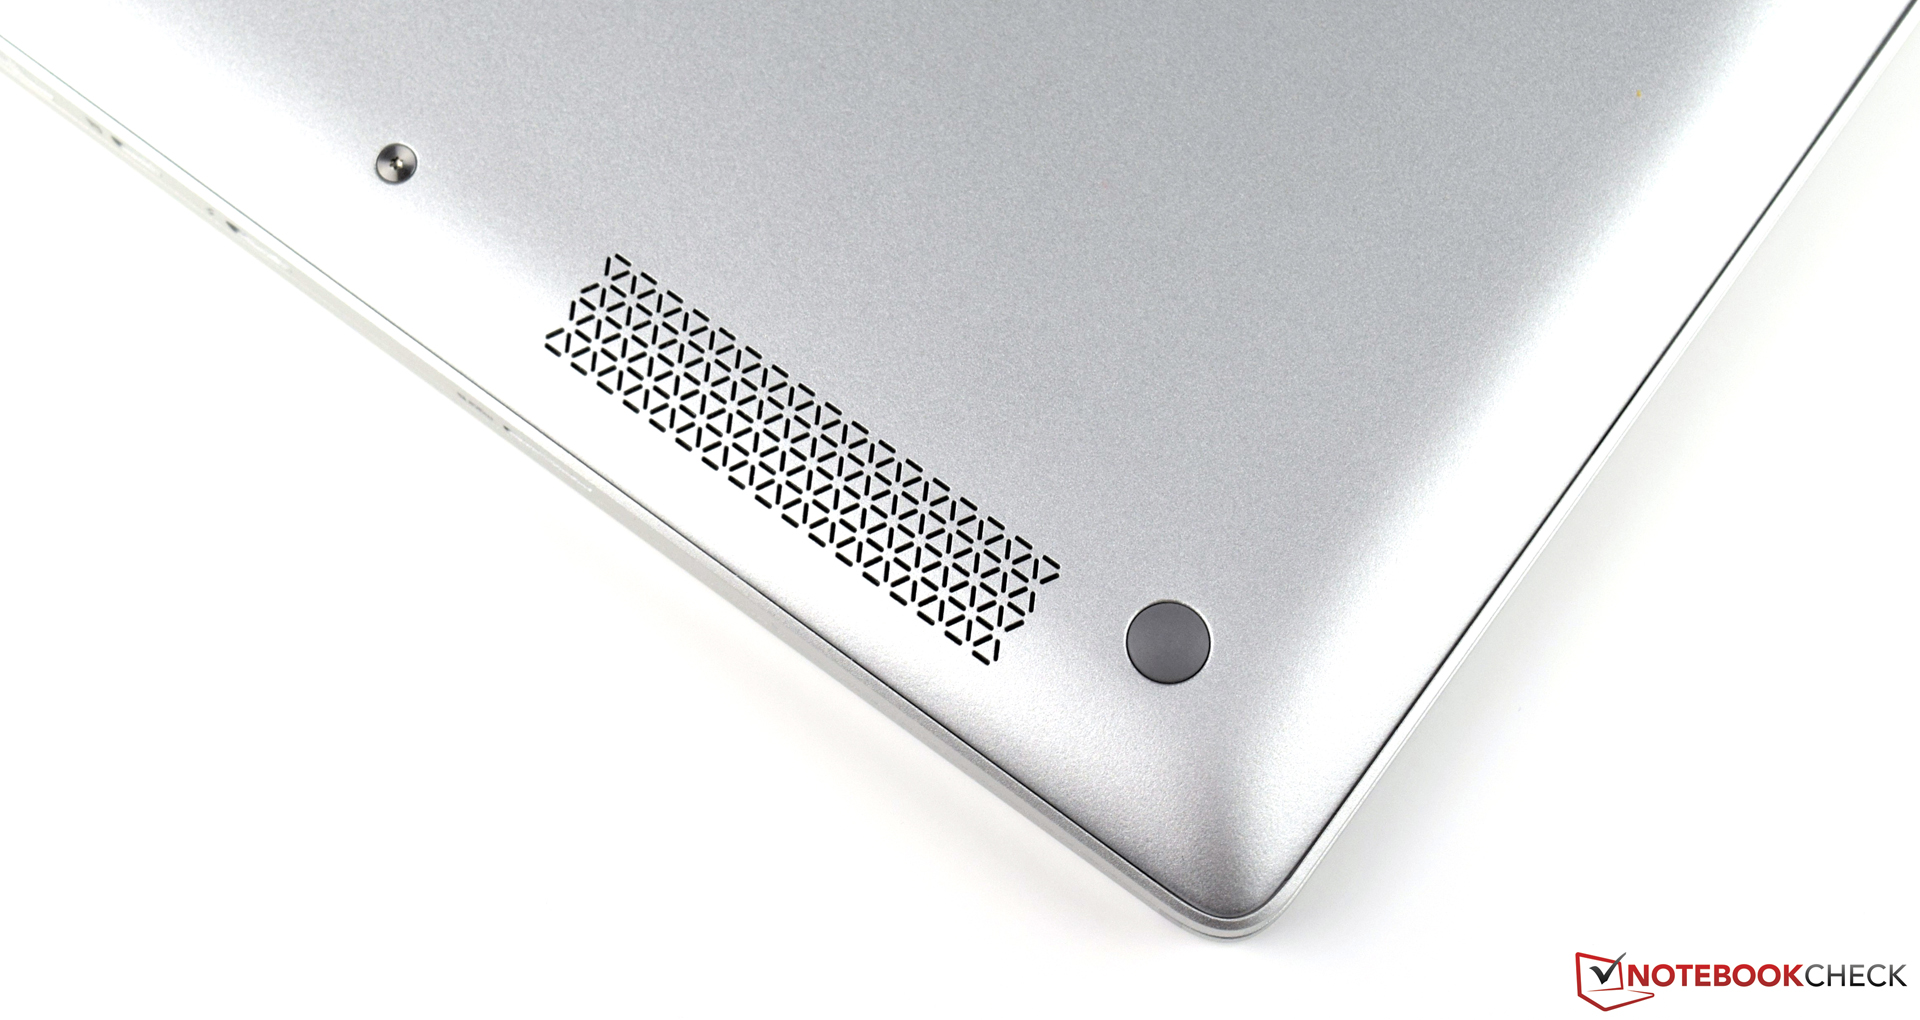
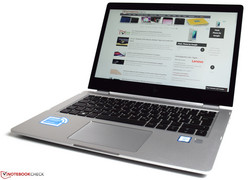
De EliteBook x360 1030 G2 is meer dan een klassieke business-notebook. Dankzij het 360-graden-scharnier is het toestel extreem flexibel en de HP Active Pen laat toe om je creativiteit volledig te laten gaan. De talrijke multimedia-functies zijn een ander pluspunt van het toestel. De EliteBook x360 1030 G2 blijkt een uitstekende all-rounder te zijn, met uitzondering van gaming-performance. Aangezien de notebook vooral bedoeld is voor de zakelijke sector, zijn er veel beveiligingsfeatures geïntegreerd, wat de prijs ook heeft opgedreven, zelfs voor de basisconfiguratie. Ons testtoestel beschikt over een Intel Core i5-7300U-processor en 8 GB RAM. De SSD met een capaciteit van 256 GB biedt genoeg opslagruimte om mee van start te kunnen en het Full-HD-scherm reageert prima op touch-input. Deze configuratie is verkrijgbaar voor 2000 euro (~$2125) op het moment van schrijven.
HP heeft een erg aantrekkelijk toestel gecreëerd. De EliteBook x360 1030 G2 is veelzijdig en weet indruk te maken met zijn erg lange batterijduur.
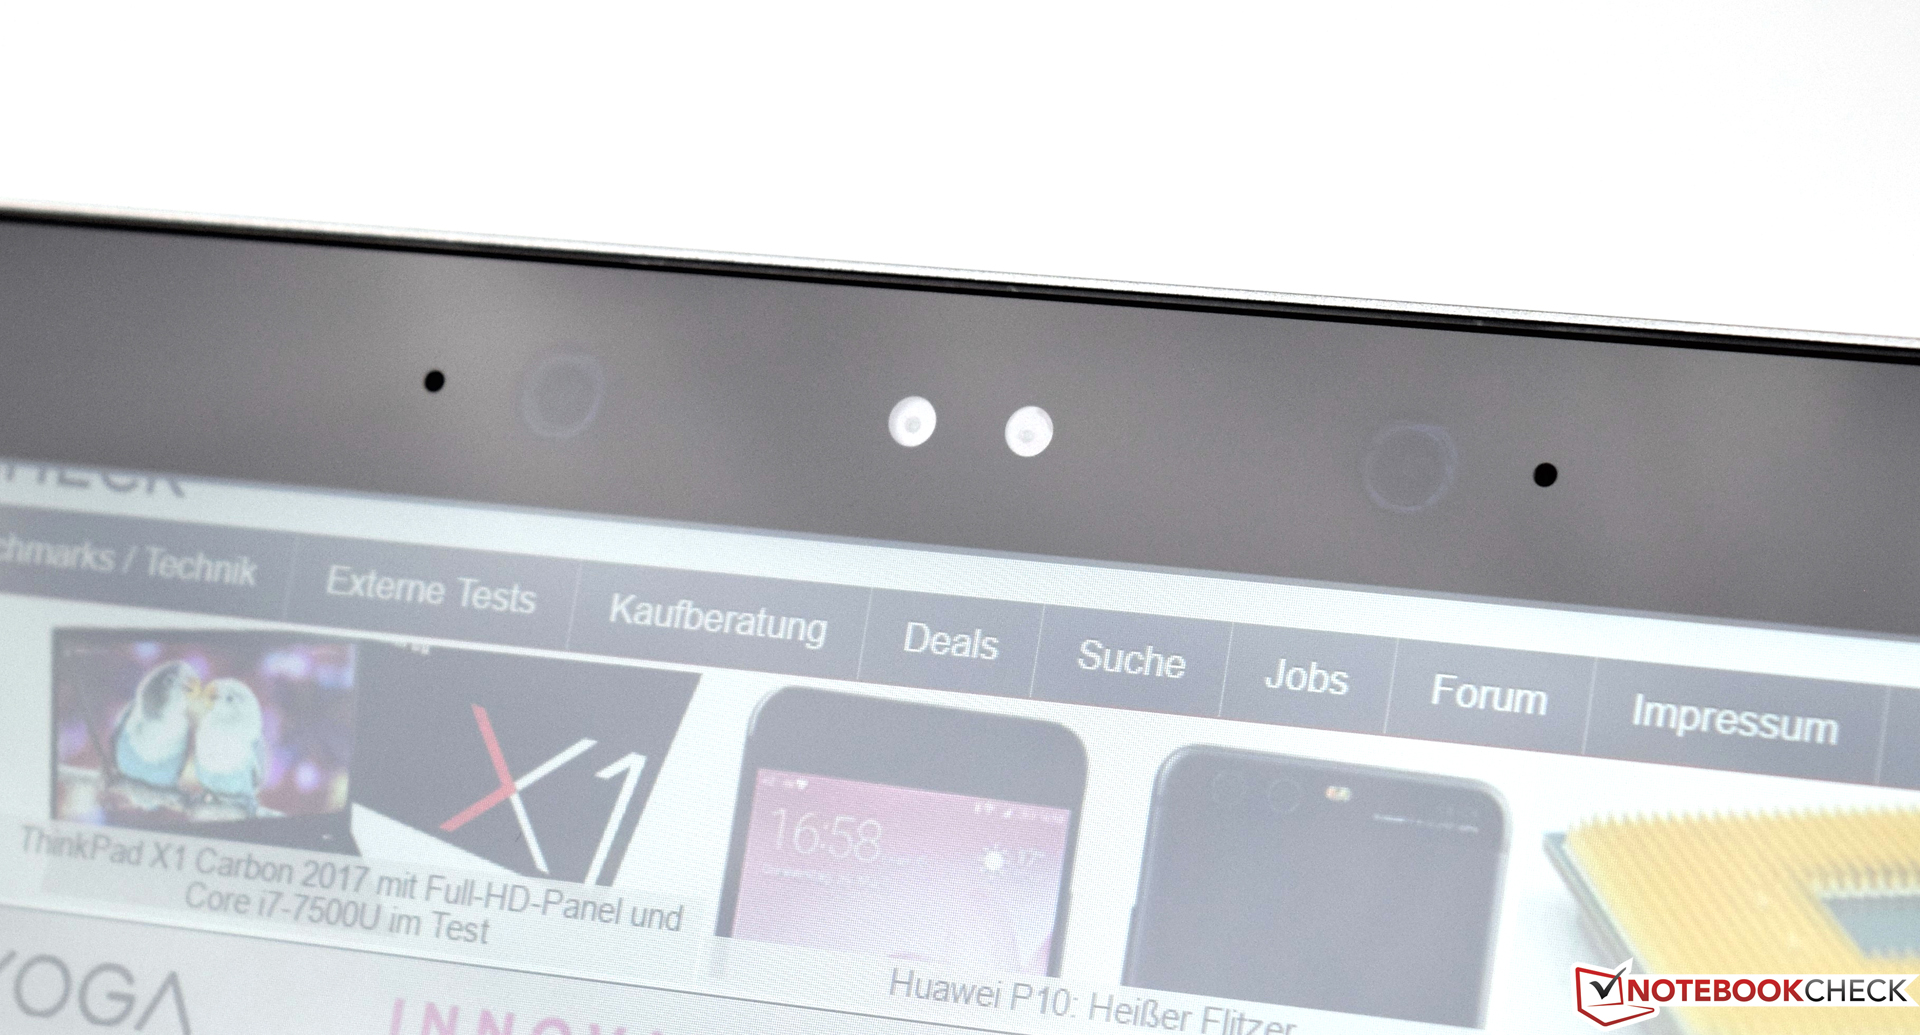
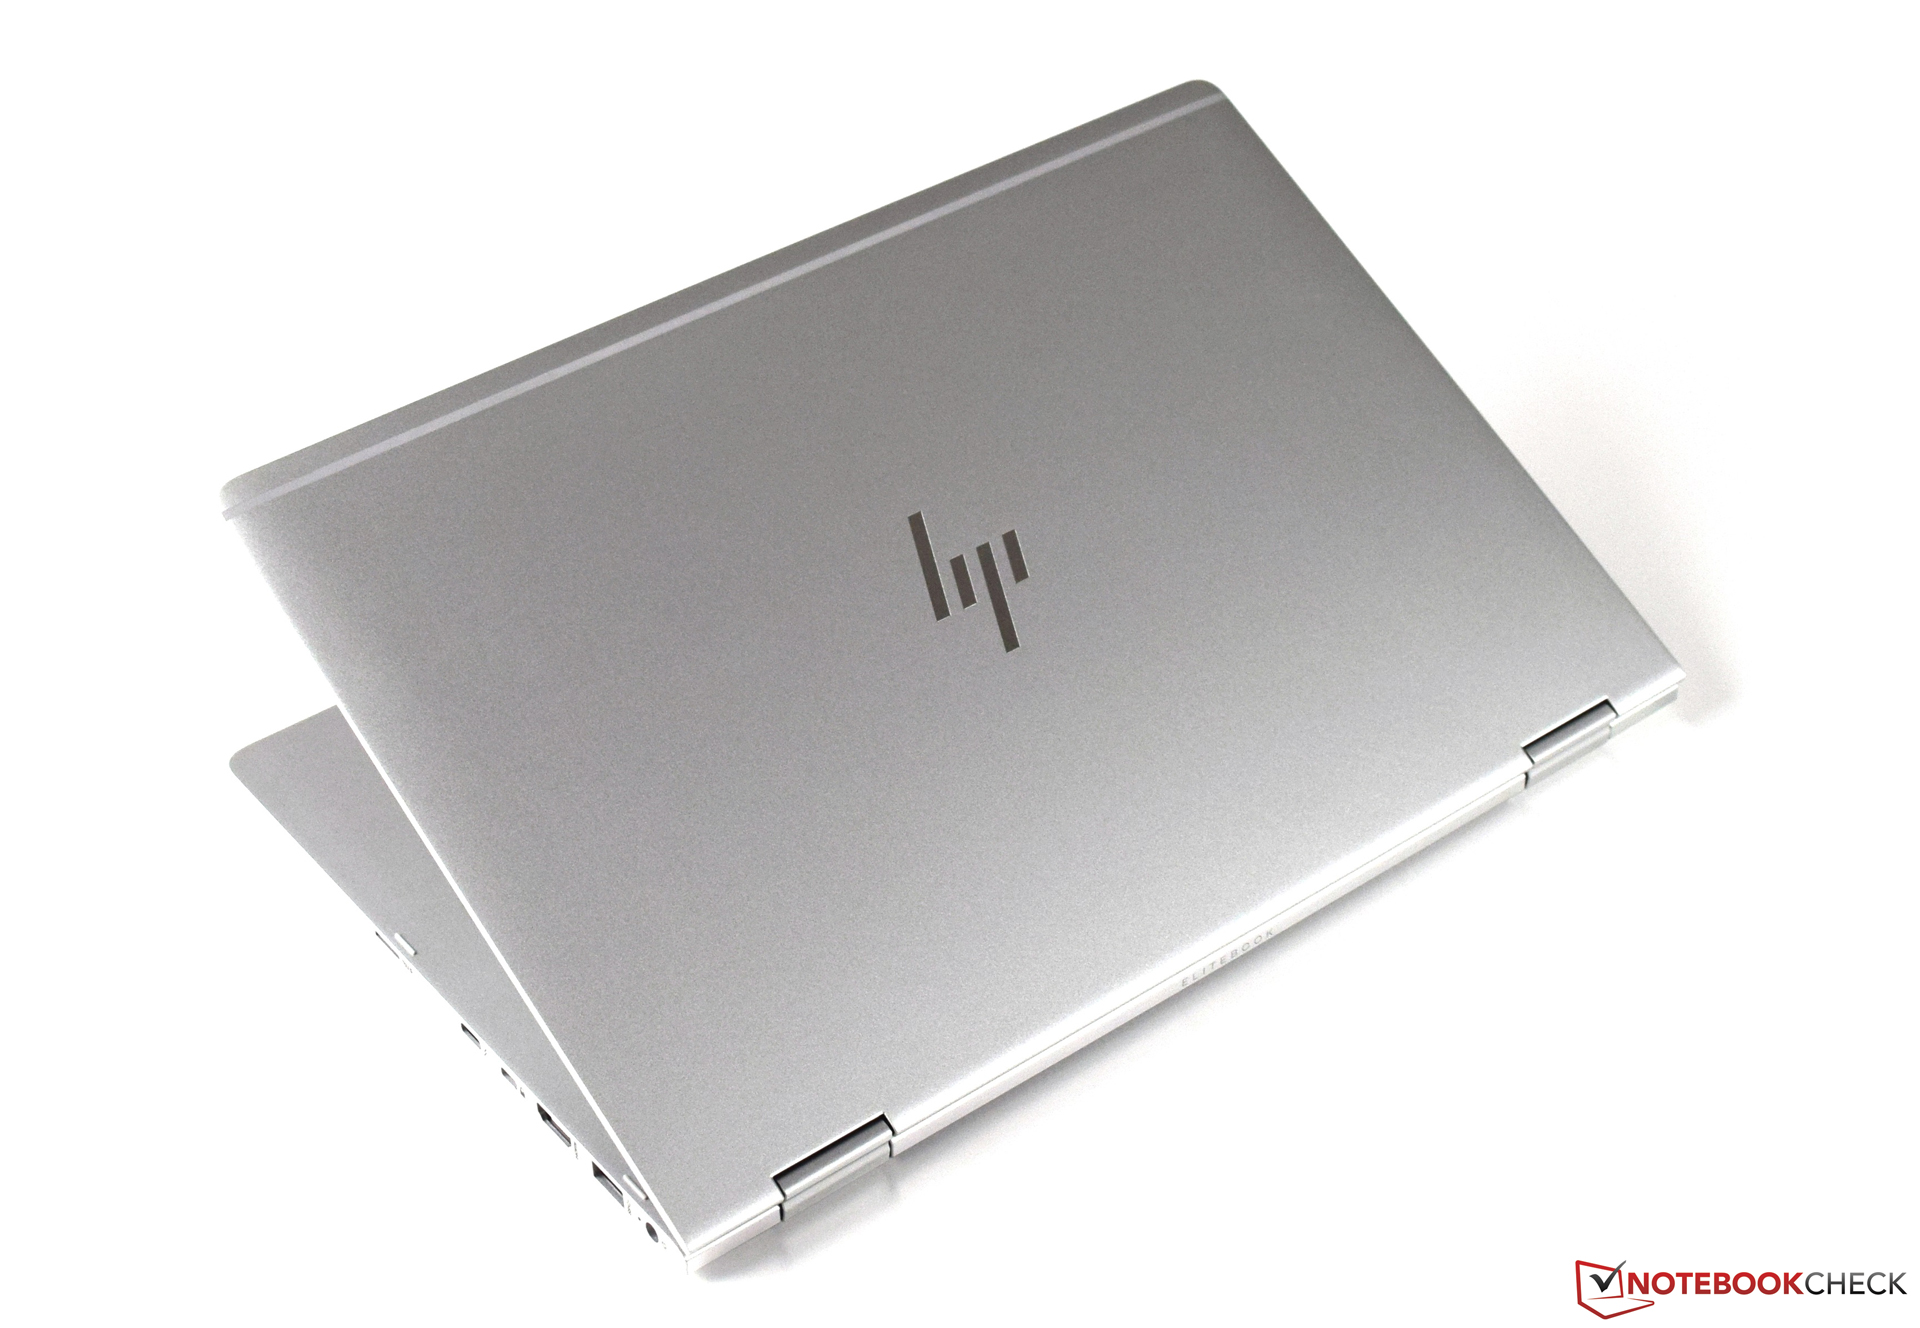
Toch hebben we een aantal punten van kritiek. Eén daarvan heeft betrekking op het scherm: de kijkhoeken zijn erg stabiel, maar de helderheid is aan de lage kant. Daarnaast kunnen de SSD-prestaties niet beantwoorden aan de verwachtingen voor een toestel van deze prijsklasse. HP zou beter alleen NVMe-SSD's gebruikt hebben. Afgezien van deze kritiek wist de HP EliteBook x360 1030 G2 ons zeker te overtuigen in onze tests. Natuurlijk speelde het elegante, dunne design geen onbelangrijke rol in de positieve indruk die het toestel maakte.
HP EliteBook x360 1030 G2
- 10-04-2017 v6 (old)
Sebastian Bade