Notebookcheck Logo

Kort testrapport Dell Latitude 13 7370 Ultrabook

The sound of silence. Met een randloos InfinityEdge beeldscherm, Core-m processor en passieve koeling, is de Latitude 13 7370 Dell's nieuwe interprestatie van een klassiek zakelijk notebook. Een veelbelovend concept - maar de uitvoering is niet foutloos.
Dell Latitude 13 7370 (Latitude Serie)
Processor
Intel Core m5-6Y57 2 x 1.1 - 2.8 GHz, Skylake
Grafische kaart
Intel HD Graphics 515, Core: 900 MHz, Geheugen: 933 MHz, 20.19.15.4390
Geheugen
8 GB 
, Dual-channel LPDDR3-1866, vastgesoldeerd, geen vrije sleuven
Beeldscherm
13.30 inch 16:9, 1920 x 1080 pixel 166 PPI, Sharp LQ133M1, IPS, glimmend: nee
Moederbord
Intel Skylake-Y Premium PCH
Opslag
Toshiba NVMe THNSN5256GPU7, 256 GB 
Geluidskaart
Intel Skylake-U/Y PCH - High Definition Audio
Verbindingen
1 USB 3.0, 2 USB 3.1 Gen2, 2 Thunderbolt, 1 HDMI, 2 DisplayPort, 1 Kensington Lock, Audio Verbindingen: Headset poort (3.5 mm stereo jack), Card Reader: microSD, 1 SmartCard, 1 Vingerafdruklezer, NFC
Netwerkmogelijkheden
Intel Dual Band Wireless-AC 8260 (a/b/g/n = Wi-Fi 4/ac = Wi-Fi 5/), Bluetooth 4.2
Afmetingen
hoogte x breedte x diepte (in mm): 14.3 x 305 x 211
Batterij
34 Wh Lithium-Polymer, 4-cellen
Besturingssysteem
Microsoft Windows 10 Pro 64 Bit
Camera
Webcam: HD
Bijkomende functionaliteiten
Luidsprekers: Stereo, Toetsenbord: Chiclet, Toetsenbordverlichting: ja, 45-Watt stroomadapter, Windows en driver DVDs, 36 Maanden Garantie, ventilatorloos
Gewicht
1.247 kg, Voeding: 271 g
Prijs
2200 Euro
Opmerking: De fabrikant kan onderdelen van verschillende leveranciers gebruiken, waaronder beeldschermen, schijven of geheugensticks met vergelijkbare specificaties.


2x Thunderbolt 3, Micro-HDMI, SIM-Slot, SmartCard reader
microSD reader, headset port, USB 3.0, Kensington Lock

Screen Flickering / PWM (Pulse-Width Modulation)

Om de schermhelderheid te verlagen schakelen sommige laptops het backlight erg snel aan en uit. Dit gebeurt aan een dergelijk hoge frequentie dat het niet zichtbaar is voor het menselijk oog. Als de frequentie te laag is kunnen personen met gevoelige ogen geïrriteerd geraken, hoofdpijn krijgen en zelfs flickering waarnemen.
Screen flickering / PWM niet waargenomen

Ter vergelijking: 53 % van alle geteste toestellen maakten geen gebruik van PWM om de schermhelderheid te verlagen. Als het wel werd gebruikt, werd een gemiddelde van 18100 (minimum: 5 - maximum: 3846000) Hz waargenomen.

241
cd/m²
234
cd/m²
240
cd/m²
247
cd/m²
261
cd/m²
253
cd/m²
223
cd/m²
236
cd/m²
230
cd/m²
Helderheidsverdeling
Sharp LQ133M1 tested with X-Rite i1Pro 2
Maximum: 261 cd/m² (Nits) Gemiddelde: 240.6 cd/m² Minimum: 13 cd/m²
Helderheidsverdeling: 85 %
Helderheid in Batterij-modus: 261 cd/m²
Contrast: 1004:1 (Zwart: 0.26 cd/m²)
ΔE Color 4.3 | 0.5-29.43 Ø5
ΔE Greyscale 5.82 | 0.57-98 Ø5.3
77.84% sRGB (Argyll 1.6.3 3D)
49.18% AdobeRGB 1998 (Argyll 1.6.3 3D)
53.9% AdobeRGB 1998 (Argyll 2.2.0 3D)
78.3% sRGB (Argyll 2.2.0 3D)
52.2% Display P3 (Argyll 2.2.0 3D)
Gamma: 2.44
Dell Latitude 13 7370
1920x1080, IPS
Lenovo ThinkPad X1 Carbon 20FB003RGE
2560x1440, IPS
HP EliteBook Folio 1040 G3
2560x1440, IPS
Toshiba Portege Z30-C-138
1920x1080, IPS
Apple MacBook 12 (Early 2016) 1.1 GHz
2304x1440, IPS
Display
25%
28%
28%
25%
Display P3 Coverage
52.2
66.7
28%
67.9
30%
67.9
30%
66.8
28%
sRGB Coverage
78.3
94.7
21%
96.8
24%
98
25%
95.4
22%
AdobeRGB 1998 Coverage
53.9
68.4
27%
70
30%
69.8
29%
68
26%
Response Times
21%
15%
17%
14%
Response Time Grey 50% / Grey 80% *
50.4 ?(20.4, 30)
44 ?(17, 27)
13%
46.4 ?(16.4, 30)
8%
42 ?(18, 24)
17%
41.2 ?(15.6, 25.6)
18%
Response Time Black / White *
33.6 ?(13.2, 20.4)
24 ?(5.2, 18.8)
29%
26.4 ?(6.8, 19.6)
21%
28 ?(7, 21)
17%
30.4 ?(6.8, 23.6)
10%
PWM Frequency
220 ?(90)
217 ?(40)
Screen
15%
10%
3%
23%
Brightness middle
261
272
4%
327
25%
300
15%
387
48%
Brightness
241
268
11%
316
31%
280
16%
358
49%
Brightness Distribution
85
95
12%
87
2%
87
2%
88
4%
Black Level *
0.26
0.32
-23%
0.35
-35%
0.31
-19%
0.47
-81%
Contrast
1004
850
-15%
934
-7%
968
-4%
823
-18%
Colorchecker dE 2000 *
4.3
2.61
39%
4.39
-2%
4.9
-14%
1.6
63%
Colorchecker dE 2000 max. *
8.66
6.43
26%
7.27
16%
8.91
-3%
4
54%
Greyscale dE 2000 *
5.82
3.31
43%
4.69
19%
6.69
-15%
1
83%
Gamma
2.44 90%
2.35 94%
2.15 102%
2.33 94%
2.26 97%
CCT
6771 96%
6360 102%
7101 92%
6487 100%
6680 97%
Color Space (Percent of AdobeRGB 1998)
49.18
63
28%
62.52
27%
63
28%
61.6
25%
Color Space (Percent of sRGB)
77.84
95
22%
96.71
24%
98
26%
82.2
6%
Totaal Gemiddelde (Programma / Instellingen)
20% / 18%
18% / 14%
16% / 10%
21% / 22%

* ... kleiner is beter

Responstijd Scherm

De responstijden van het scherm tonen hoe snel het scherm in staat is om van één kleur naar de andere te veranderen. Trage responstijden kunnen aanleiding geven tot 'nabeelden' rond bewegende objecten of het scherm wazig maken (blur). Vooral spelers van snelle 3D-games hebben baat bij een scherm met snelle responstijden.
       Responstijd Zwart naar Wit
33.6 ms ... stijging ↗ en daling ↘ gecombineerd↗ 13.2 ms stijging
↘ 20.4 ms daling
Het scherm vertoonde trage responstijden in onze tests en is misschien te traag voor games.
Ter vergelijking: alle testtoestellen variëren van 0.1 (minimum) tot 240 (maximum) ms. » 89 % van alle toestellen zijn beter.
Dit betekent dat de gemeten responstijd slechter is dan het gemiddelde (21.6 ms) van alle geteste toestellen.
       Responstijd 50% Grijs naar 80% Grijs
50.4 ms ... stijging ↗ en daling ↘ gecombineerd↗ 20.4 ms stijging
↘ 30 ms daling
Het scherm vertoonde trage responstijden in onze tests en is misschien te traag voor games.
Ter vergelijking: alle testtoestellen variëren van 0.2 (minimum) tot 636 (maximum) ms. » 85 % van alle toestellen zijn beter.
Dit betekent dat de gemeten responstijd slechter is dan het gemiddelde (33.9 ms) van alle geteste toestellen.
Cinebench R15
CPU Single 64Bit
Lenovo ThinkPad X1 Carbon 20FB003RGE
Intel Core i7-6500U
128 Points +27%
HP EliteBook Folio 1040 G3
Intel Core i5-6300U
124 Points +23%
Lenovo ThinkPad X260-20F60041GE
Intel Core i5-6200U
112 Points +11%
Dell Latitude 13 7370
Intel Core m5-6Y57
101 Points
Apple MacBook 12 (Early 2015) 1.1 GHz
Intel Core M-5Y31
98 Points -3%
Apple MacBook 12 (Early 2015) 1.1 GHz
Intel Core M-5Y31
98 Points -3%
Apple MacBook 12 (Early 2016) 1.1 GHz
Intel Core m3-6Y30
91 Points -10%
Apple MacBook 12 (Early 2016) 1.1 GHz
Intel Core m3-6Y30
90 Points -11%
Microsoft Surface Pro 4, Core m3
Intel Core m3-6Y30
88 Points -13%
Toshiba Portege Z30-C-138
Intel Core i7-6500U
84 Points -17%
CPU Multi 64Bit
Lenovo ThinkPad X1 Carbon 20FB003RGE
Intel Core i7-6500U
310 Points +72%
HP EliteBook Folio 1040 G3
Intel Core i5-6300U
303 Points +68%
Lenovo ThinkPad X260-20F60041GE
Intel Core i5-6200U
289 Points +61%
Toshiba Portege Z30-C-138
Intel Core i7-6500U
288 Points +60%
Apple MacBook 12 (Early 2016) 1.1 GHz
Intel Core m3-6Y30
218 Points +21%
Apple MacBook 12 (Early 2015) 1.1 GHz
Intel Core M-5Y31
211 Points +17%
Apple MacBook 12 (Early 2015) 1.1 GHz
Intel Core M-5Y31
205 Points +14%
Microsoft Surface Pro 4, Core m3
Intel Core m3-6Y30
206 Points +14%
Dell Latitude 13 7370
Intel Core m5-6Y57
180 Points
Cinebench R11.5
CPU Single 64Bit
Lenovo ThinkPad X1 Carbon 20FB003RGE
Intel Core i7-6500U
1.47 Points +27%
Lenovo ThinkPad X260-20F60041GE
Intel Core i5-6200U
1.32 Points +14%
Dell Latitude 13 7370
Intel Core m5-6Y57
1.16 Points
Apple MacBook 12 (Early 2015) 1.1 GHz
Intel Core M-5Y31
1.15 Points -1%
Apple MacBook 12 (Early 2015) 1.1 GHz
Intel Core M-5Y31
1.02 Points -12%
Apple MacBook 12 (Early 2016) 1.1 GHz
Intel Core m3-6Y30
1 Points -14%
Apple MacBook 12 (Early 2016) 1.1 GHz
Intel Core m3-6Y30
0.95 Points -18%
Microsoft Surface Pro 4, Core m3
Intel Core m3-6Y30
0.98 Points -16%
CPU Multi 64Bit
Lenovo ThinkPad X1 Carbon 20FB003RGE
Intel Core i7-6500U
3.46 Points +70%
Lenovo ThinkPad X260-20F60041GE
Intel Core i5-6200U
3.19 Points +57%
Apple MacBook 12 (Early 2016) 1.1 GHz
Intel Core m3-6Y30
2.35 Points +16%
Apple MacBook 12 (Early 2016) 1.1 GHz
Intel Core m3-6Y30
2.29 Points +13%
Apple MacBook 12 (Early 2015) 1.1 GHz
Intel Core M-5Y31
2.3 Points +13%
Apple MacBook 12 (Early 2015) 1.1 GHz
Intel Core M-5Y31
2.09 Points +3%
Microsoft Surface Pro 4, Core m3
Intel Core m3-6Y30
2.27 Points +12%
Dell Latitude 13 7370
Intel Core m5-6Y57
2.03 Points
X264 HD Benchmark 4.0
Pass 1
Lenovo ThinkPad X1 Carbon 20FB003RGE
Intel Core i7-6500U
108.6 fps +17%
Dell Latitude 13 7370
Intel Core m5-6Y57
92.6 fps
Microsoft Surface Pro 4, Core m3
Intel Core m3-6Y30
76.8 fps -17%
Apple MacBook 12 (Early 2015) 1.1 GHz
Intel Core M-5Y31
72 fps -22%
Apple MacBook 12 (Early 2016) 1.1 GHz
Intel Core m3-6Y30
69 (61.3min - 76.8max) fps -25%
Pass 2
Lenovo ThinkPad X1 Carbon 20FB003RGE
Intel Core i7-6500U
20.31 fps +73%
Microsoft Surface Pro 4, Core m3
Intel Core m3-6Y30
14.15 fps +21%
Apple MacBook 12 (Early 2016) 1.1 GHz
Intel Core m3-6Y30
13 (11.7min - 14.2max) fps +11%
Dell Latitude 13 7370
Intel Core m5-6Y57
11.72 fps
Apple MacBook 12 (Early 2015) 1.1 GHz
Intel Core M-5Y31
9.52 fps -19%
Cinebench R10 Shading 32Bit
5591
Cinebench R10 Rendering Multiple CPUs 32Bit
6652
Cinebench R10 Rendering Single 32Bit
3889
Cinebench R11.5 CPU Multi 64Bit
2.03 Points
Cinebench R11.5 OpenGL 64Bit
22.14 fps
Cinebench R11.5 CPU Single 64Bit
1.16 Points
Cinebench R15 CPU Multi 64Bit
180 Points
Cinebench R15 CPU Single 64Bit
101 Points
Cinebench R15 Ref. Match 64Bit
97.8 %
Cinebench R15 OpenGL 64Bit
26.81 fps
Help
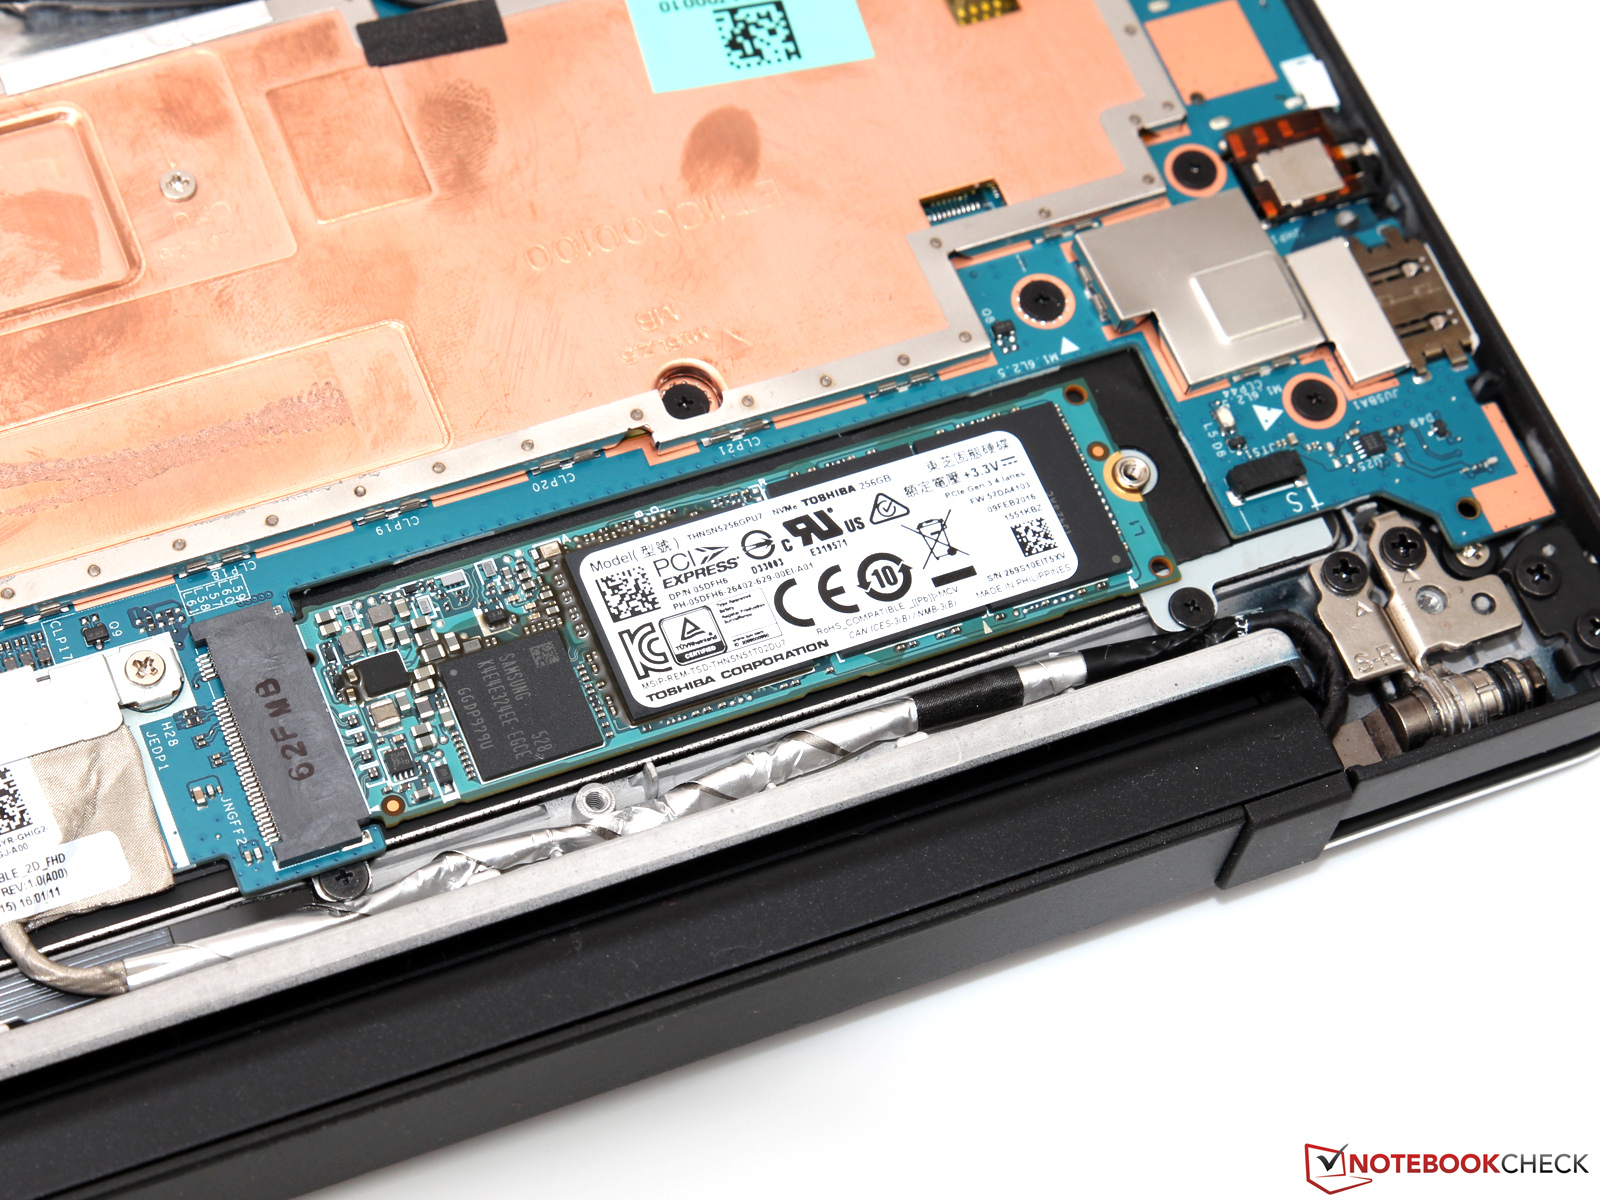
Dell Latitude 13 7370
Toshiba NVMe THNSN5256GPU7
Lenovo ThinkPad X1 Carbon 20FB003RGE
Samsung SSD PM871 MZNLN256HCHP
HP EliteBook Folio 1040 G3
Samsung SM951 MZVPV256HDGL m.2 PCI-e
Toshiba Portege Z30-C-138
Toshiba HG6 THNSNJ512G8NY
Apple MacBook 12 (Early 2016) 1.1 GHz
Apple SSD AP0256
AS SSD
-40%
75%
-52%
-30%
Seq Read
1425
499.1
-65%
1839
29%
494.9
-65%
1056
-26%
Seq Write
889
294
-67%
1190
34%
431.9
-51%
651
-27%
4K Read
35.72
30.43
-15%
47.72
34%
16.97
-52%
16.4
-54%
4K Write
97.9
74.6
-24%
126.6
29%
65.6
-33%
22.1
-77%
4K-64 Read
450.6
370.4
-18%
1858
312%
217.9
-52%
509
13%
4K-64 Write
347.2
253.4
-27%
344.3
-1%
147.9
-57%
283
-18%
Copy ISO MB/s
704
236.2
-66%
1313
87%
545
-23%
Toshiba NVMe THNSN5256GPU7
Overdrachtssnelheid Minimum: 386.9 MB/s
Overdrachtssnelheid Maximum: 879 MB/s
Overdrachtssnelheid Gemiddeld: 754 MB/s
Toegangstijd: 0.1 ms
Pieksnelheid: 275.2 MB/s
CPU-gebruik: 4.8 %
PCMark 8
Home Score Accelerated v2
Lenovo ThinkPad X1 Carbon 20FB003RGE
HD Graphics 520, 6500U, Samsung SSD PM871 MZNLN256HCHP
3385 Points +11%
HP EliteBook Folio 1040 G3
HD Graphics 520, 6300U, Samsung SM951 MZVPV256HDGL m.2 PCI-e
3305 Points +8%
Toshiba Portege Z30-C-138
HD Graphics 520, 6500U, Toshiba HG6 THNSNJ512G8NY
3271 Points +7%
Dell Latitude 13 7370
HD Graphics 515, 6Y57, Toshiba NVMe THNSN5256GPU7
3048 Points
Apple MacBook 12 (Early 2015) 1.1 GHz
HD Graphics 5300, 5Y31, Apple SSD AP0256
2671 Points -12%
Apple MacBook 12 (Early 2016) 1.1 GHz
HD Graphics 515, 6Y30, Apple SSD AP0256
2550 Points -16%
Microsoft Surface Pro 4, Core m3
HD Graphics 515, 6Y30, Samsung MZFLV128 NVMe
2426 Points -20%
Creative Score Accelerated v2
Lenovo ThinkPad X1 Carbon 20FB003RGE
HD Graphics 520, 6500U, Samsung SSD PM871 MZNLN256HCHP
4150 Points +18%
HP EliteBook Folio 1040 G3
HD Graphics 520, 6300U, Samsung SM951 MZVPV256HDGL m.2 PCI-e
4058 Points +15%
Dell Latitude 13 7370
HD Graphics 515, 6Y57, Toshiba NVMe THNSN5256GPU7
3528 Points
Apple MacBook 12 (Early 2015) 1.1 GHz
HD Graphics 5300, 5Y31, Apple SSD AP0256
3276 Points -7%
Microsoft Surface Pro 4, Core m3
HD Graphics 515, 6Y30, Samsung MZFLV128 NVMe
2968 Points -16%
Work Score Accelerated v2
Lenovo ThinkPad X1 Carbon 20FB003RGE
HD Graphics 520, 6500U, Samsung SSD PM871 MZNLN256HCHP
4342 Points +2%
HP EliteBook Folio 1040 G3
HD Graphics 520, 6300U, Samsung SM951 MZVPV256HDGL m.2 PCI-e
4241 Points 0%
Dell Latitude 13 7370
HD Graphics 515, 6Y57, Toshiba NVMe THNSN5256GPU7
4238 Points
Apple MacBook 12 (Early 2016) 1.1 GHz
HD Graphics 515, 6Y30, Apple SSD AP0256
3550 Points -16%
Apple MacBook 12 (Early 2015) 1.1 GHz
HD Graphics 5300, 5Y31, Apple SSD AP0256
3488 Points -18%
Microsoft Surface Pro 4, Core m3
HD Graphics 515, 6Y30, Samsung MZFLV128 NVMe
3186 Points -25%
PCMark 7 - Score
Lenovo ThinkPad X1 Carbon 20FB003RGE
HD Graphics 520, 6500U, Samsung SSD PM871 MZNLN256HCHP
5350 Points +28%
Microsoft Surface Pro 4, Core m3
HD Graphics 515, 6Y30, Samsung MZFLV128 NVMe
4274 Points +3%
Dell Latitude 13 7370
HD Graphics 515, 6Y57, Toshiba NVMe THNSN5256GPU7
4165 Points
PCMark 7 Score
4165 punten
PCMark 8 Home Score Accelerated v2
3048 punten
PCMark 8 Creative Score Accelerated v2
3528 punten
PCMark 8 Work Score Accelerated v2
4238 punten
Help
3DMark 11 - 1280x720 Performance GPU
Lenovo ThinkPad X1 Carbon 20FB003RGE
Intel Core i7-6500U, Intel HD Graphics 520
1386 Points +40%
HP EliteBook Folio 1040 G3
Intel Core i5-6300U, Intel HD Graphics 520
1377 Points +39%
Toshiba Portege Z30-C-138
Intel Core i7-6500U, Intel HD Graphics 520
1377 Points +39%
Microsoft Surface Pro 4, Core m3
Intel Core m3-6Y30, Intel HD Graphics 515
1206 Points +22%
Apple MacBook 12 (Early 2016) 1.1 GHz
Intel Core m3-6Y30, Intel HD Graphics 515
1186 Points +20%
Dell Latitude 13 7370
Intel Core m5-6Y57, Intel HD Graphics 515
992 Points
Apple MacBook 12 (Early 2015) 1.1 GHz
Intel Core M-5Y31, Intel HD Graphics 5300
859 Points -13%
3DMark
1280x720 Cloud Gate Standard Graphics
Lenovo ThinkPad X1 Carbon 20FB003RGE
Intel Core i7-6500U, Intel HD Graphics 520
7516 Points +61%
HP EliteBook Folio 1040 G3
Intel Core i5-6300U, Intel HD Graphics 520
6708 Points +44%
Microsoft Surface Pro 4, Core m3
Intel Core m3-6Y30, Intel HD Graphics 515
6597 Points +42%
Apple MacBook 12 (Early 2016) 1.1 GHz
Intel Core m3-6Y30, Intel HD Graphics 515
6078 Points +30%
Apple MacBook 12 (Early 2015) 1.1 GHz
Intel Core M-5Y31, Intel HD Graphics 5300
5512 Points +18%
Dell Latitude 13 7370
Intel Core m5-6Y57, Intel HD Graphics 515
4658 Points
1920x1080 Fire Strike Graphics
Lenovo ThinkPad X1 Carbon 20FB003RGE
Intel Core i7-6500U, Intel HD Graphics 520
959 Points +70%
HP EliteBook Folio 1040 G3
Intel Core i5-6300U, Intel HD Graphics 520
900 Points +59%
Microsoft Surface Pro 4, Core m3
Intel Core m3-6Y30, Intel HD Graphics 515
810 Points +43%
Apple MacBook 12 (Early 2016) 1.1 GHz
Intel Core m3-6Y30, Intel HD Graphics 515
735 Points +30%
Apple MacBook 12 (Early 2015) 1.1 GHz
Intel Core M-5Y31, Intel HD Graphics 5300
671 Points +19%
Dell Latitude 13 7370
Intel Core m5-6Y57, Intel HD Graphics 515
565 Points
3DMark 06 Standard Score
6244 punten
3DMark 11 Performance
1094 punten
3DMark Ice Storm Standard Score
38931 punten
3DMark Cloud Gate Standard Score
3481 punten
3DMark Fire Strike Score
509 punten
Help
lage gem. hoge ultra
BioShock Infinite (2013) 38 20.3 17.6 5.3
Metro: Last Light (2013) 16.4 13.5 8.7
Battlefield 4 (2013) 24.6 18.2 12.8
 29 °C30.5 °C29.6 °C 
 27.8 °C30 °C28.6 °C 
 26.4 °C26.3 °C26.5 °C 
Maximum: 30.5 °C
Gemiddelde: 28.3 °C
29.3 °C30.1 °C28.3 °C
30.5 °C31.2 °C29.6 °C
27.1 °C26.9 °C26.1 °C
Maximum: 31.2 °C
Gemiddelde: 28.8 °C
Stroomadapter (max.)  30.5 °C | Kamertemperatuur 21.4 °C | Fluke 62 Max
(±) De gemiddelde temperatuur voor de bovenzijde bij maximale belasting bedraagt 35.7 °C / 96 F, vergeleken met het gemiddelde van 30.7 °C / ###class_avg_f## F voor de apparaten van de klasse Subnotebook.
(±) De maximumtemperatuur aan de bovenzijde bedraagt 43.2 °C / 110 F, vergeleken met het gemiddelde van 35.9 °C / 97 F, variërend van 21.4 tot 59 °C voor de klasse Subnotebook.
(-) De bodem warmt op tot een maximum van 50.8 °C / 123 F, vergeleken met een gemiddelde van 39.4 °C / 103 F
(+) Bij onbelast gebruik bedraagt de gemiddelde temperatuur voor de bovenzijde 28.3 °C / 83 F, vergeleken met het apparaatgemiddelde van 30.7 °C / 87 F.
(+) De palmsteunen en het touchpad zijn met een maximum van ###max## °C / 85.6 F koeler dan de huidtemperatuur en voelen daarom koel aan.
(±) De gemiddelde temperatuur van de handpalmsteun van soortgelijke toestellen bedroeg 28.3 °C / 82.9 F (-1.5 °C / -2.7 F).
Stroomgebruik
Uit / Standbydarklight 0.35 / 0.5 Watt
Inactiefdarkmidlight 5 / 7.5 / 8 Watt
Belasting midlight 15.3 / 26.8 Watt
 color bar
Key: min: dark, med: mid, max: light        Metrahit Energy
Currently we use the Metrahit Energy, a professional single phase power quality and energy measurement digital multimeter, for our measurements. Find out more about it here. All of our test methods can be found here.
Dell Latitude 13 7370
34 Wh
Lenovo ThinkPad X1 Carbon 20FB003RGE
52 Wh
HP EliteBook Folio 1040 G3
45.6 Wh
Toshiba Portege Z30-C-138
52 Wh
Apple MacBook 12 (Early 2016) 1.1 GHz
41.4 Wh
Batterijduur
18%
-16%
-6%
33%
Reader / Idle
588
942
60%
530
-10%
H.264
391
510
30%
339
-13%
512
31%
WiFi v1.3
367
429
17%
309
-16%
345
-6%
501
37%
Load
176
115
-35%
131
-26%
231
31%
Batterijduur
Inactief (zonder WLAN, minimale helderheid)
9h 48min
WiFi Websurfing
6h 07min
Big Buck Bunny H.264 1080p
6h 31min
Belast (maximale helderheid)
2h 56min

Pro

+ hoogwaardige en stevige behuizing
+ toekomstbestendige aansluitingen
+ snelle draadloze verbindingen
+ precieze invoerapparaten
+ solide applicatie prestaties
+ lage temperatuurontwikkeling
+ fanloos
+ 3 jaar garantie

Contra

- slechts 1x USB Type-A
- automatische helderheid en contrast controle
- gelimiteerde uitbreidingsmogelijkheden
- erg hoge prijs
Dell Latitude 13 7370, courtesy of Dell Germany

Voor het volledige, Engelse testrapport, klik hier.

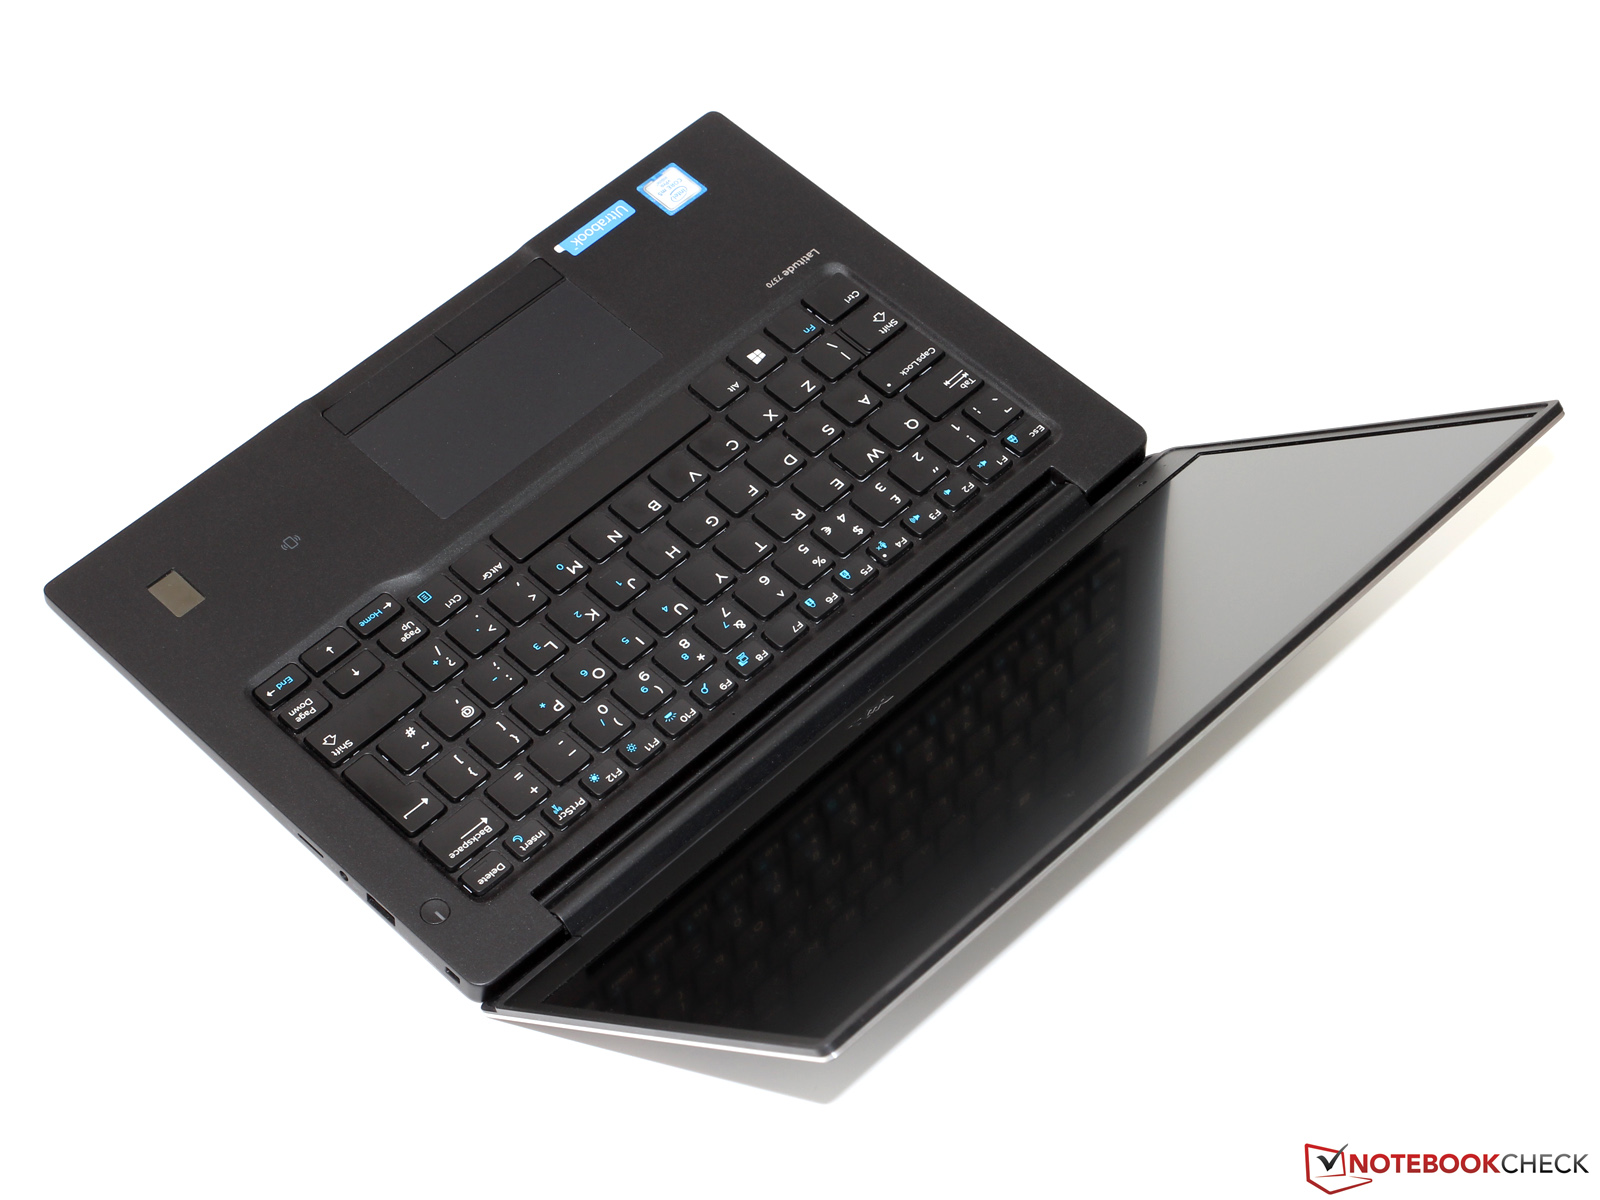
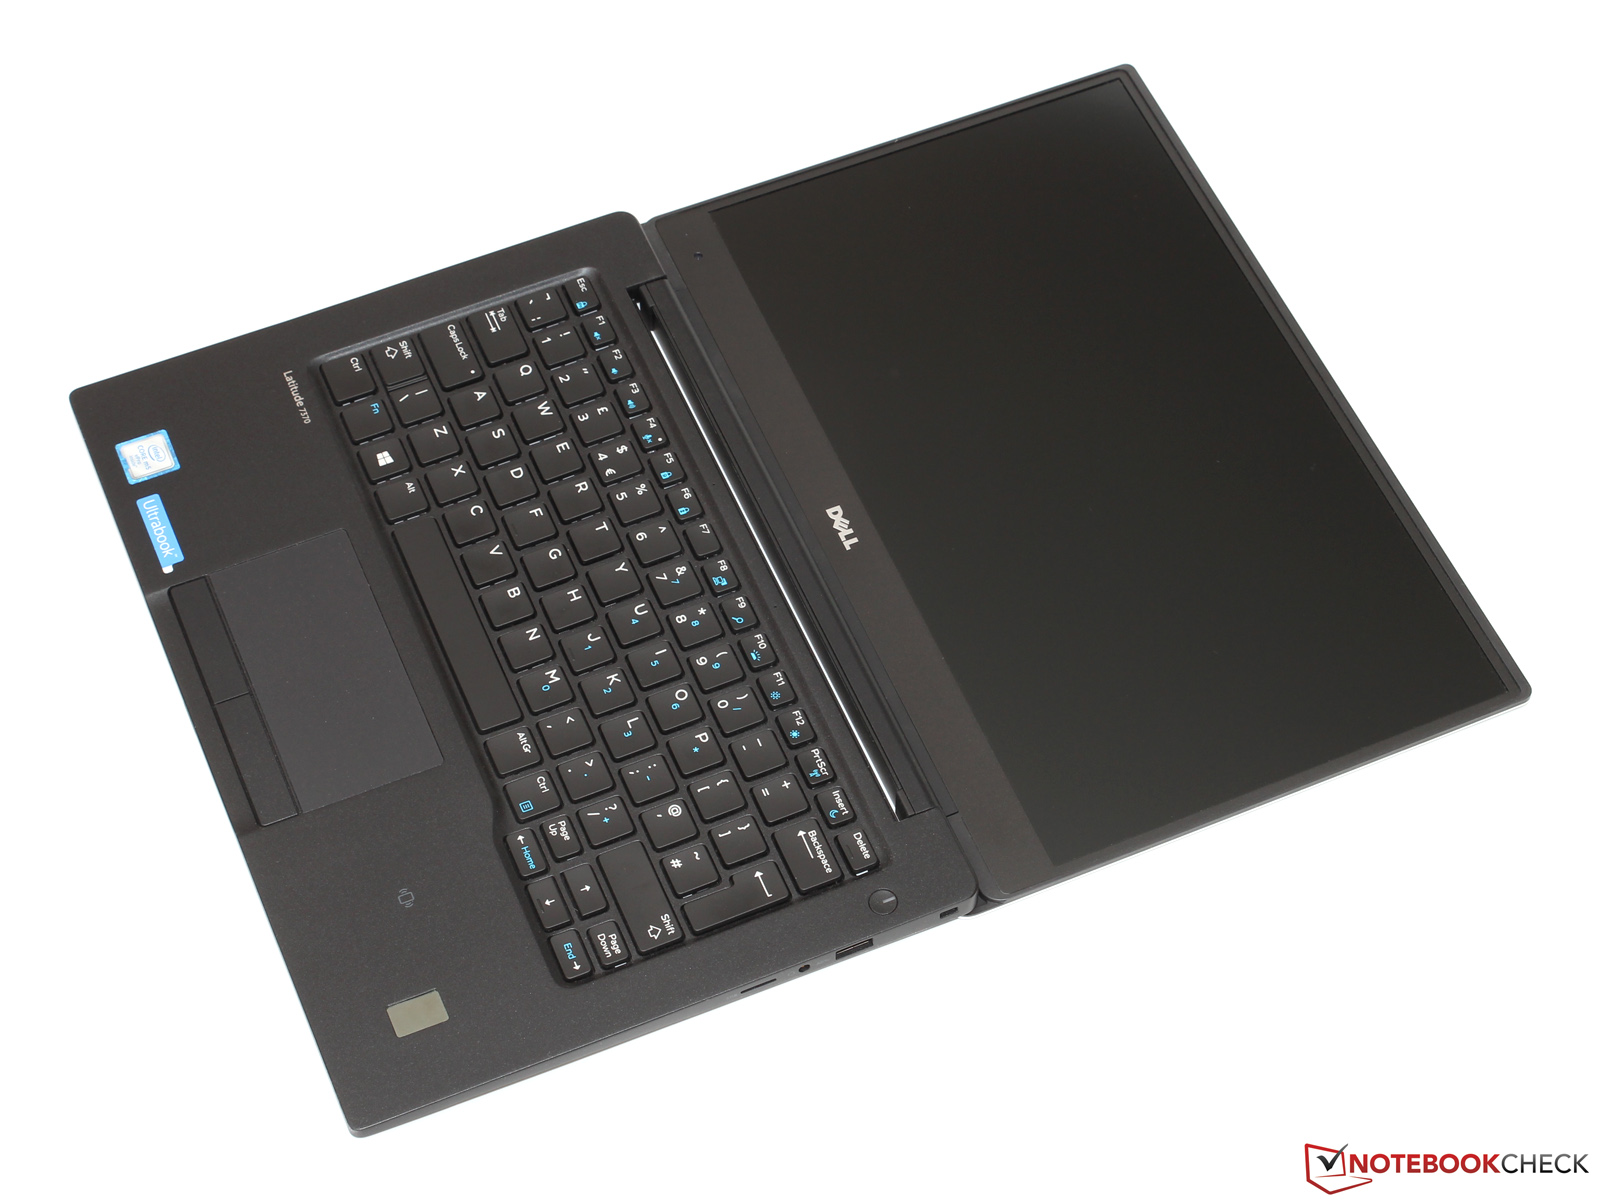
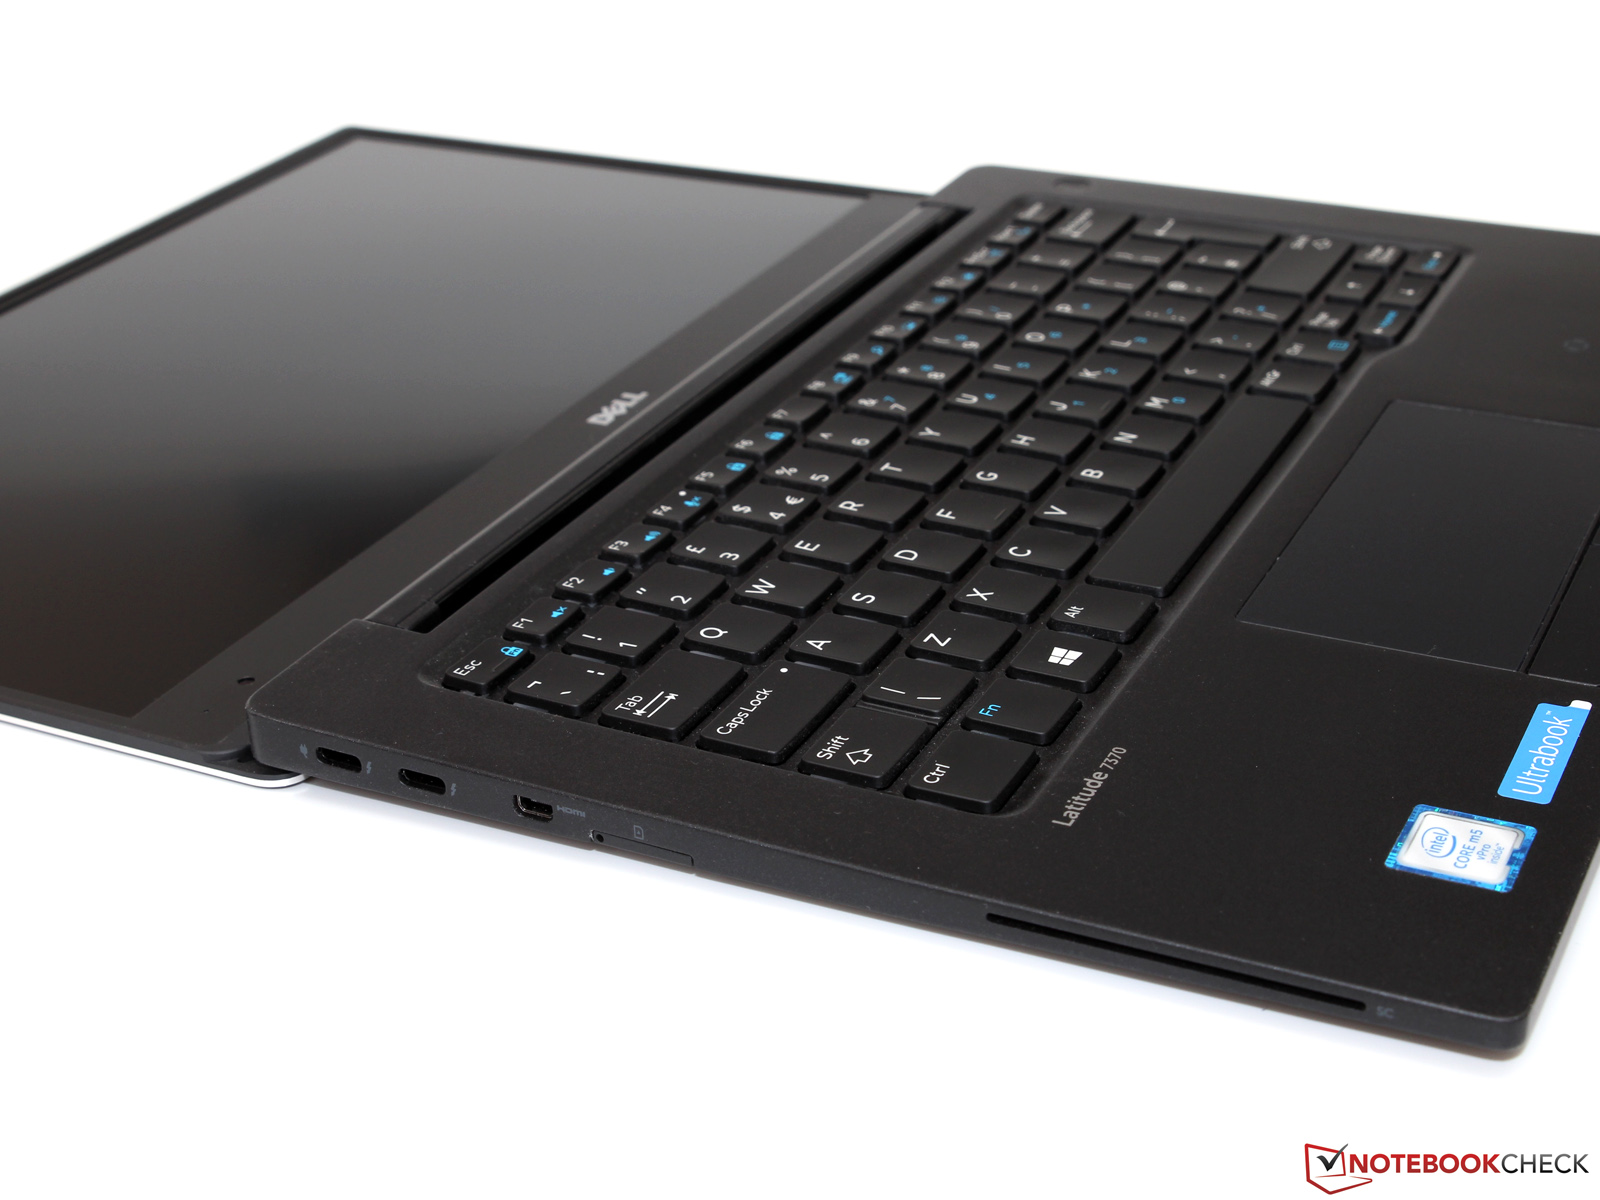
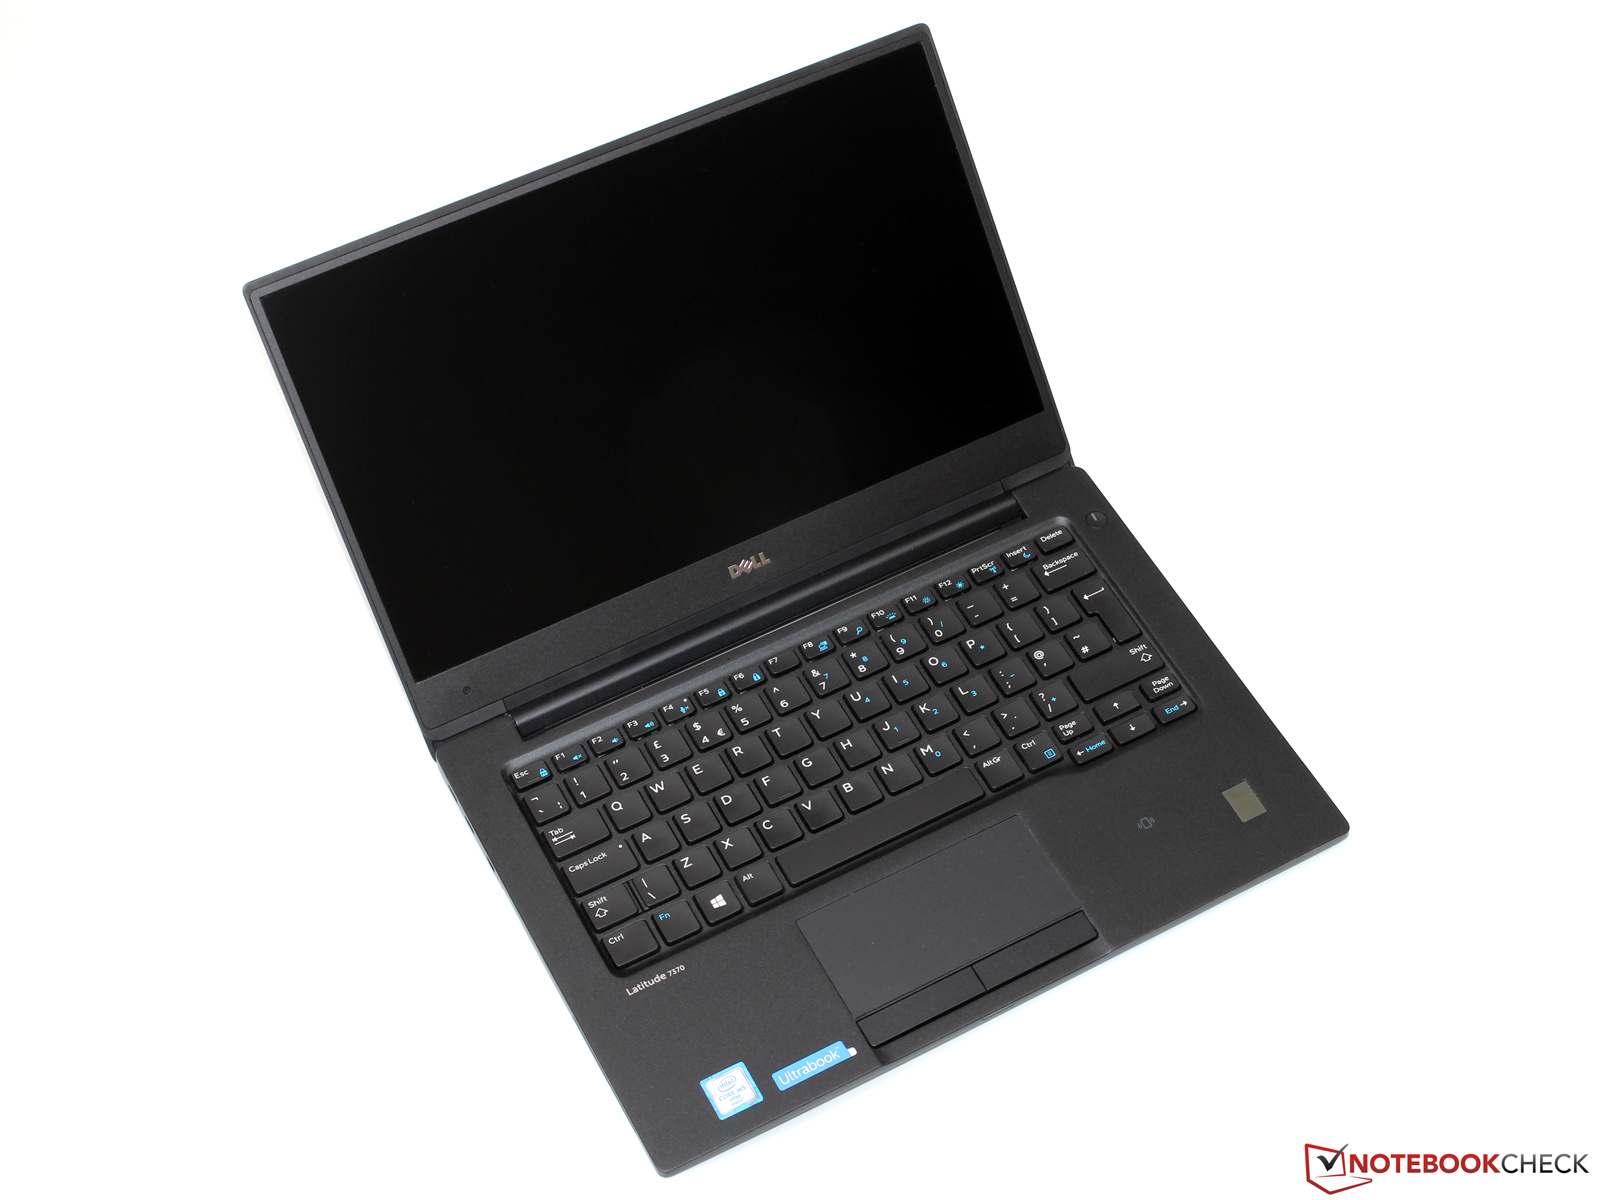
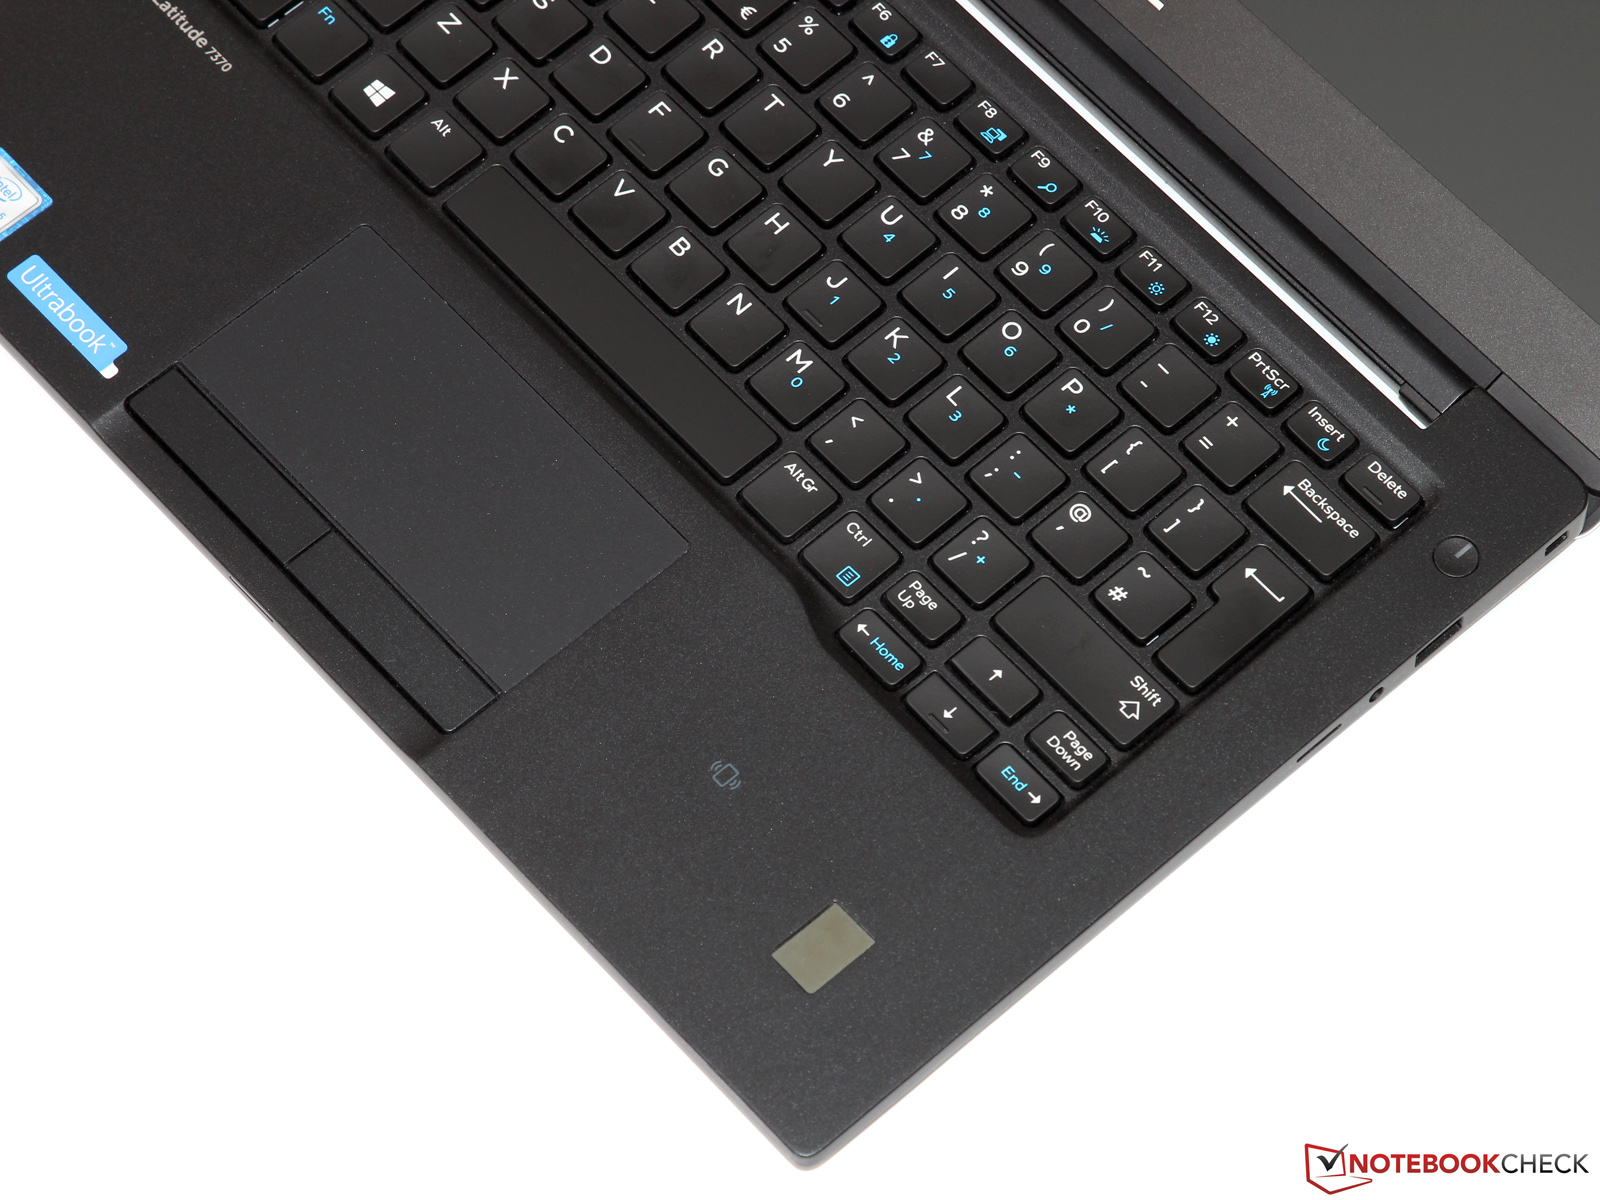
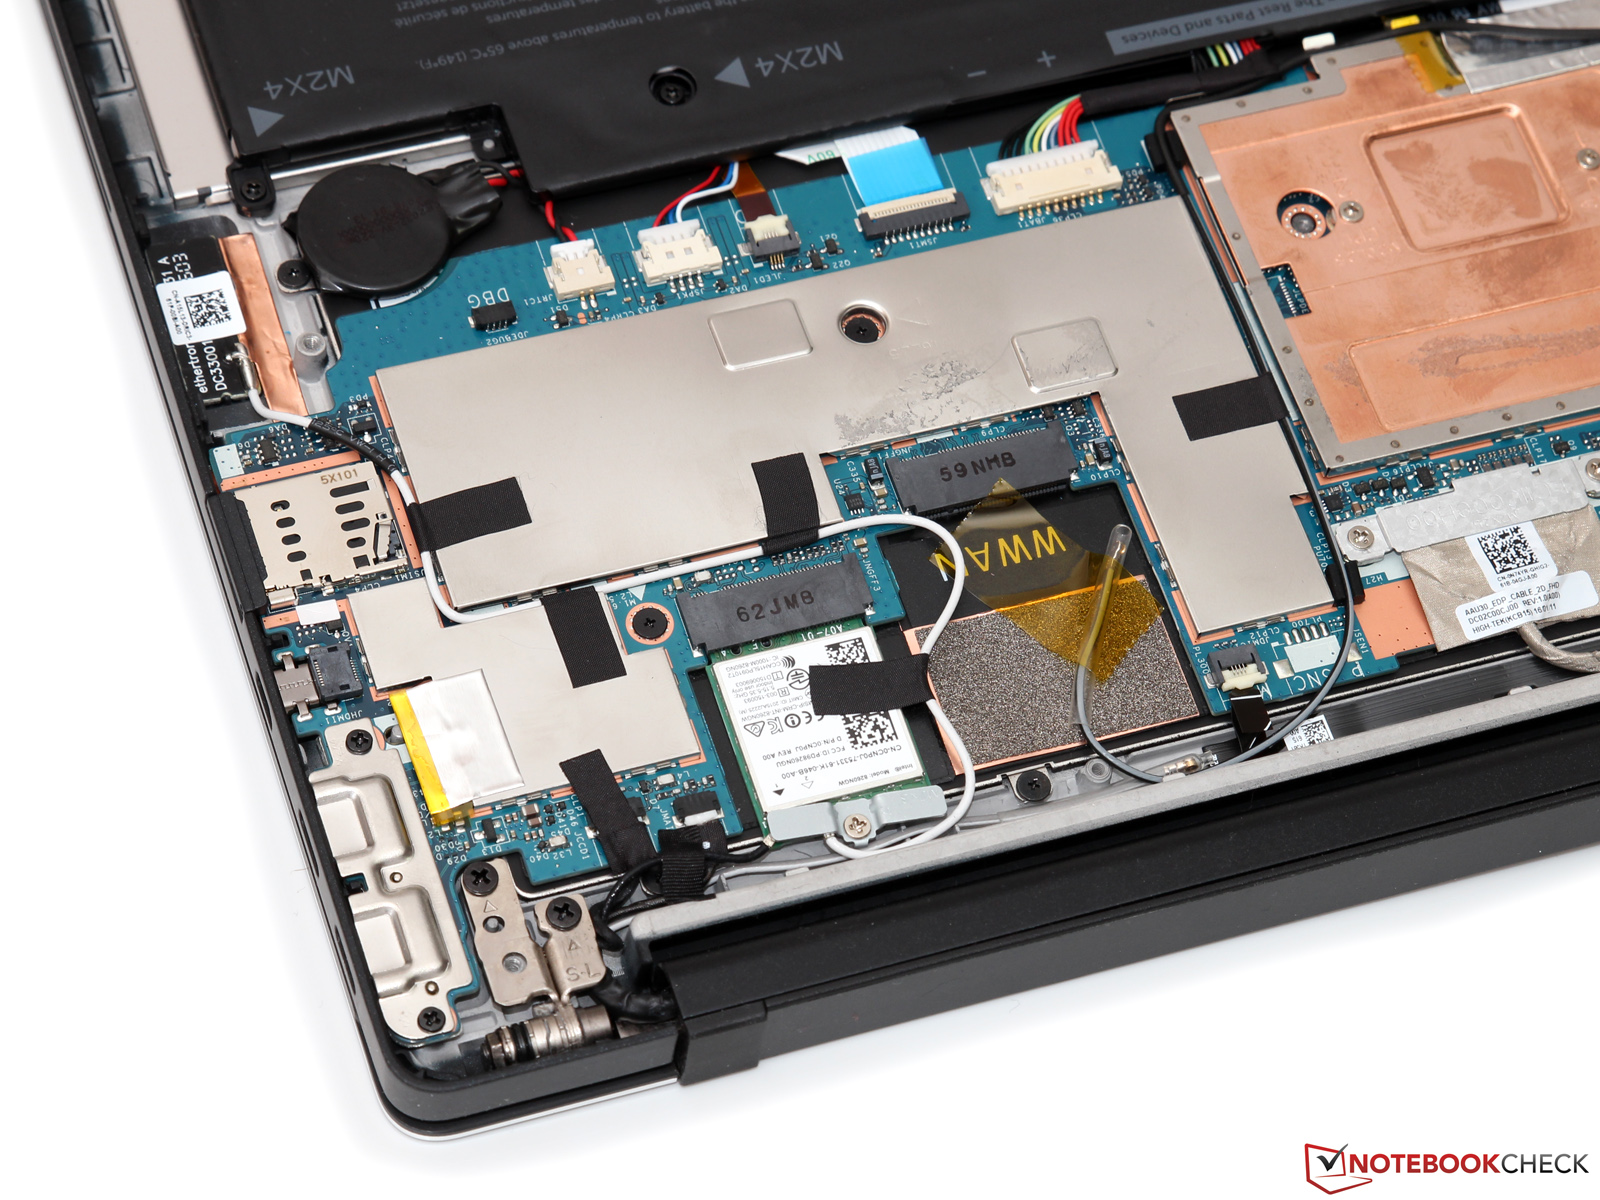
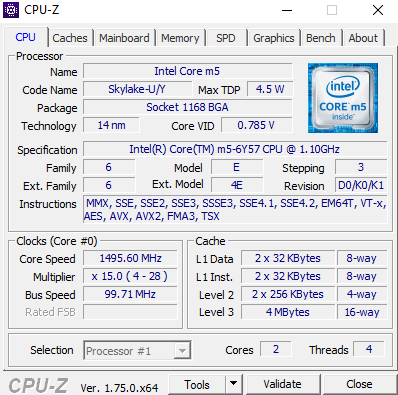
Een bijna randloos beeldscherm, passieve koeling en Thunderbolt 3-poorten - de Dell Latitude 13 7370 valt zeker op naast het gros aan saaie mainstream zakelijke notebooks. De Ultrabook heeft weinig competitie te vrezen op het gebied van mobiliteit en kwaliteit. De Ultrabook overtuigd met zijn foutloze bouwkwaliteit, uitstekende stabiliteit en stevige invoerapparaten. De prestaties van het Core-m platform zijn ook best goed: korte piekbelastingen worden - in elk geval na de BIOS update - bijna net zo goed opgevangen als actief gekoelde concurrenten. De kloksnelheden en prestaties moeten enkel zichtbaar inleveren wanneer er sprake is van langduriger belasting, maar voor de meeste office taken zou dat niet het geval moeten zijn.

Dat de 7370 toch net naast een uitmuntend-beoordeling grijpt komt bijna geheel op het conto van het beeldscherm. Dell heeft een erg fatsoenlijk paneel met krachtige verlichting gebruikt, maar die kun je door de automatische helderheid en contrast controle niet altijd benutten. Een ergerlijk issue, maar we hopen nog steeds dat dit met een volgende BIOS update opgelost wordt. Wanneer dit gebeurd staat enkel de hoge prijs nog een onvoorwaardelijk aankoopadvies in de weg: met de huidige prijs van ongeveer 2200 EUR (~$2468) is de Latitude 13 zeker geen koopje - zelfs een (alhoewel meer voor consumenten) Apple MacBook 12 kost een paar honderd euro minder.

Dell Latitude 13 7370 - 12-05-2016 v5.1(old)
Till Schönborn

Behuizing
90 /  98 → 91%
Toetsenbord
90%
Aanwijsapparaat
93%
Aansluitmogelijkheden
67 / 80 → 84%
Gewicht
72 / 35-78 → 86%
Batterij
88%
Beeldscherm
80%
Gaming-performance
52 / 68 → 77%
Applicatie-performance
77 / 87 → 89%
Temperatuur
88 / 91 → 97%
Luidheid
100%
Audio
70 / 91 → 77%
Camera
45 / 85 → 53%
Gemiddelde
78%
87%
Subnotebook - Gewogen Gemiddelde

Pricecompare

Please share our article, every link counts!
> Overzichten en testrapporten over laptops en mobieltjes > Testrapporten > Kort testrapport Dell Latitude 13 7370 Ultrabook
Till Schönborn, 2016-05-27 (Update: 2016-07-23)