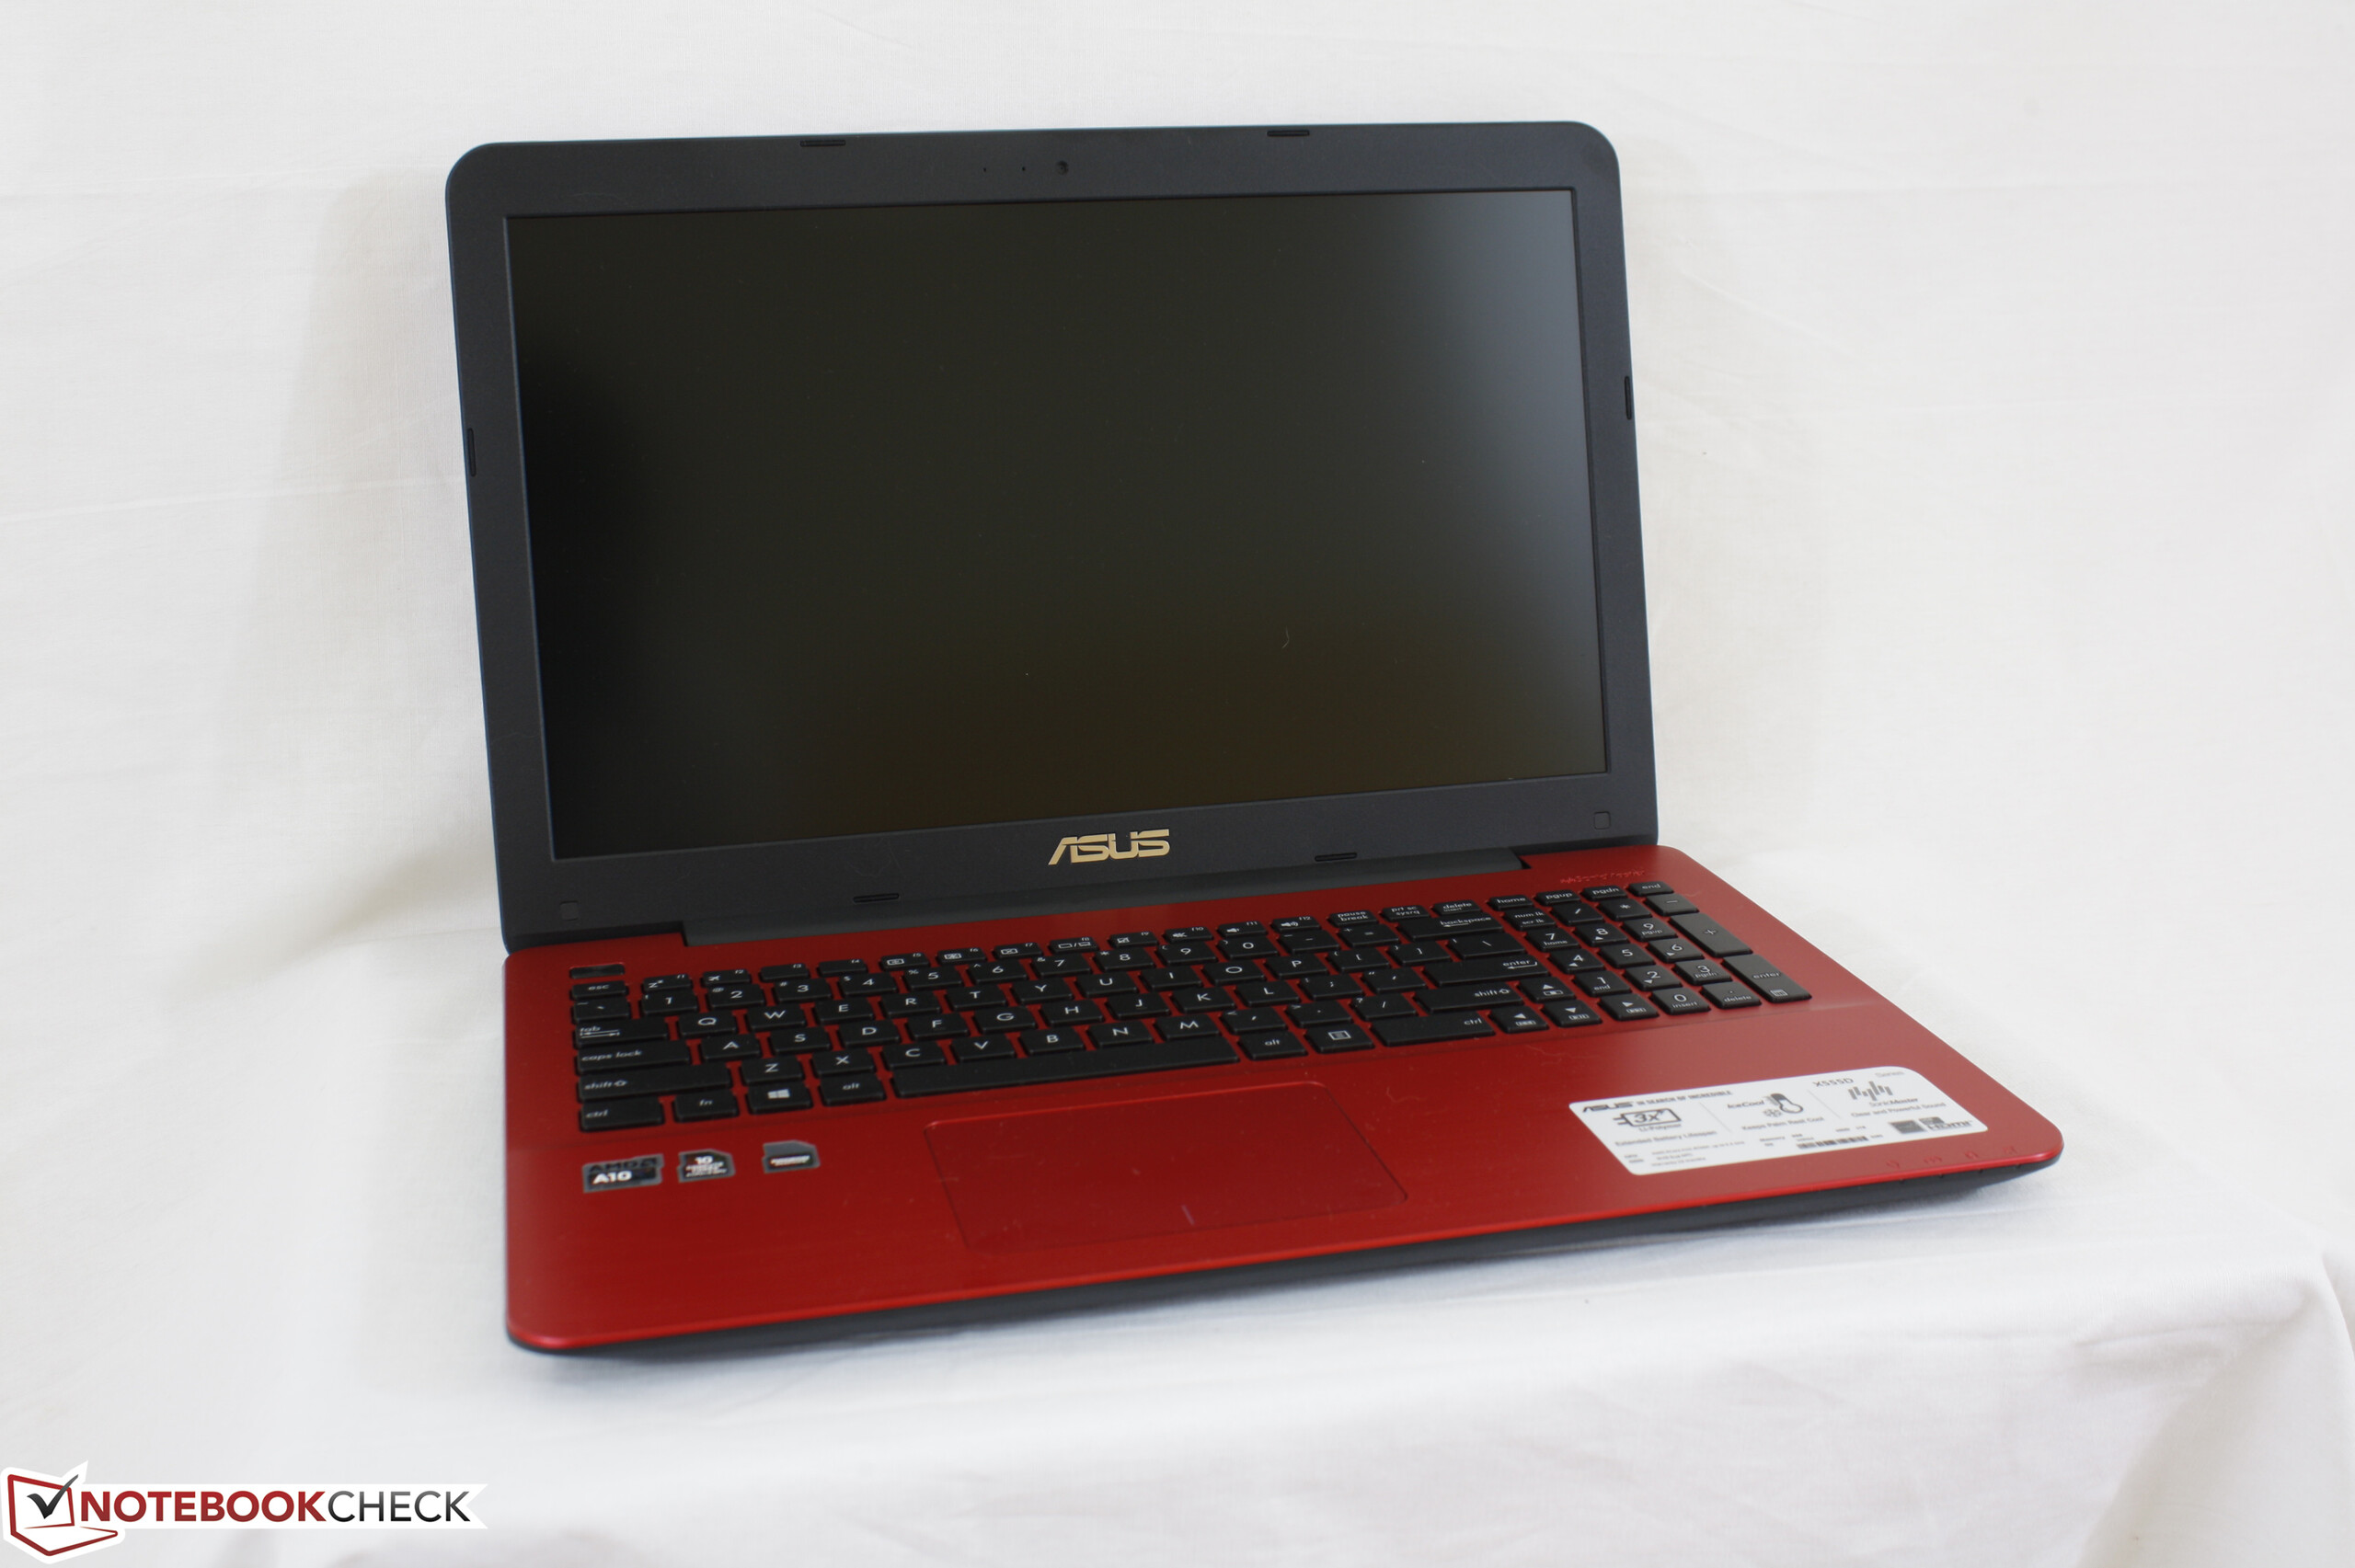
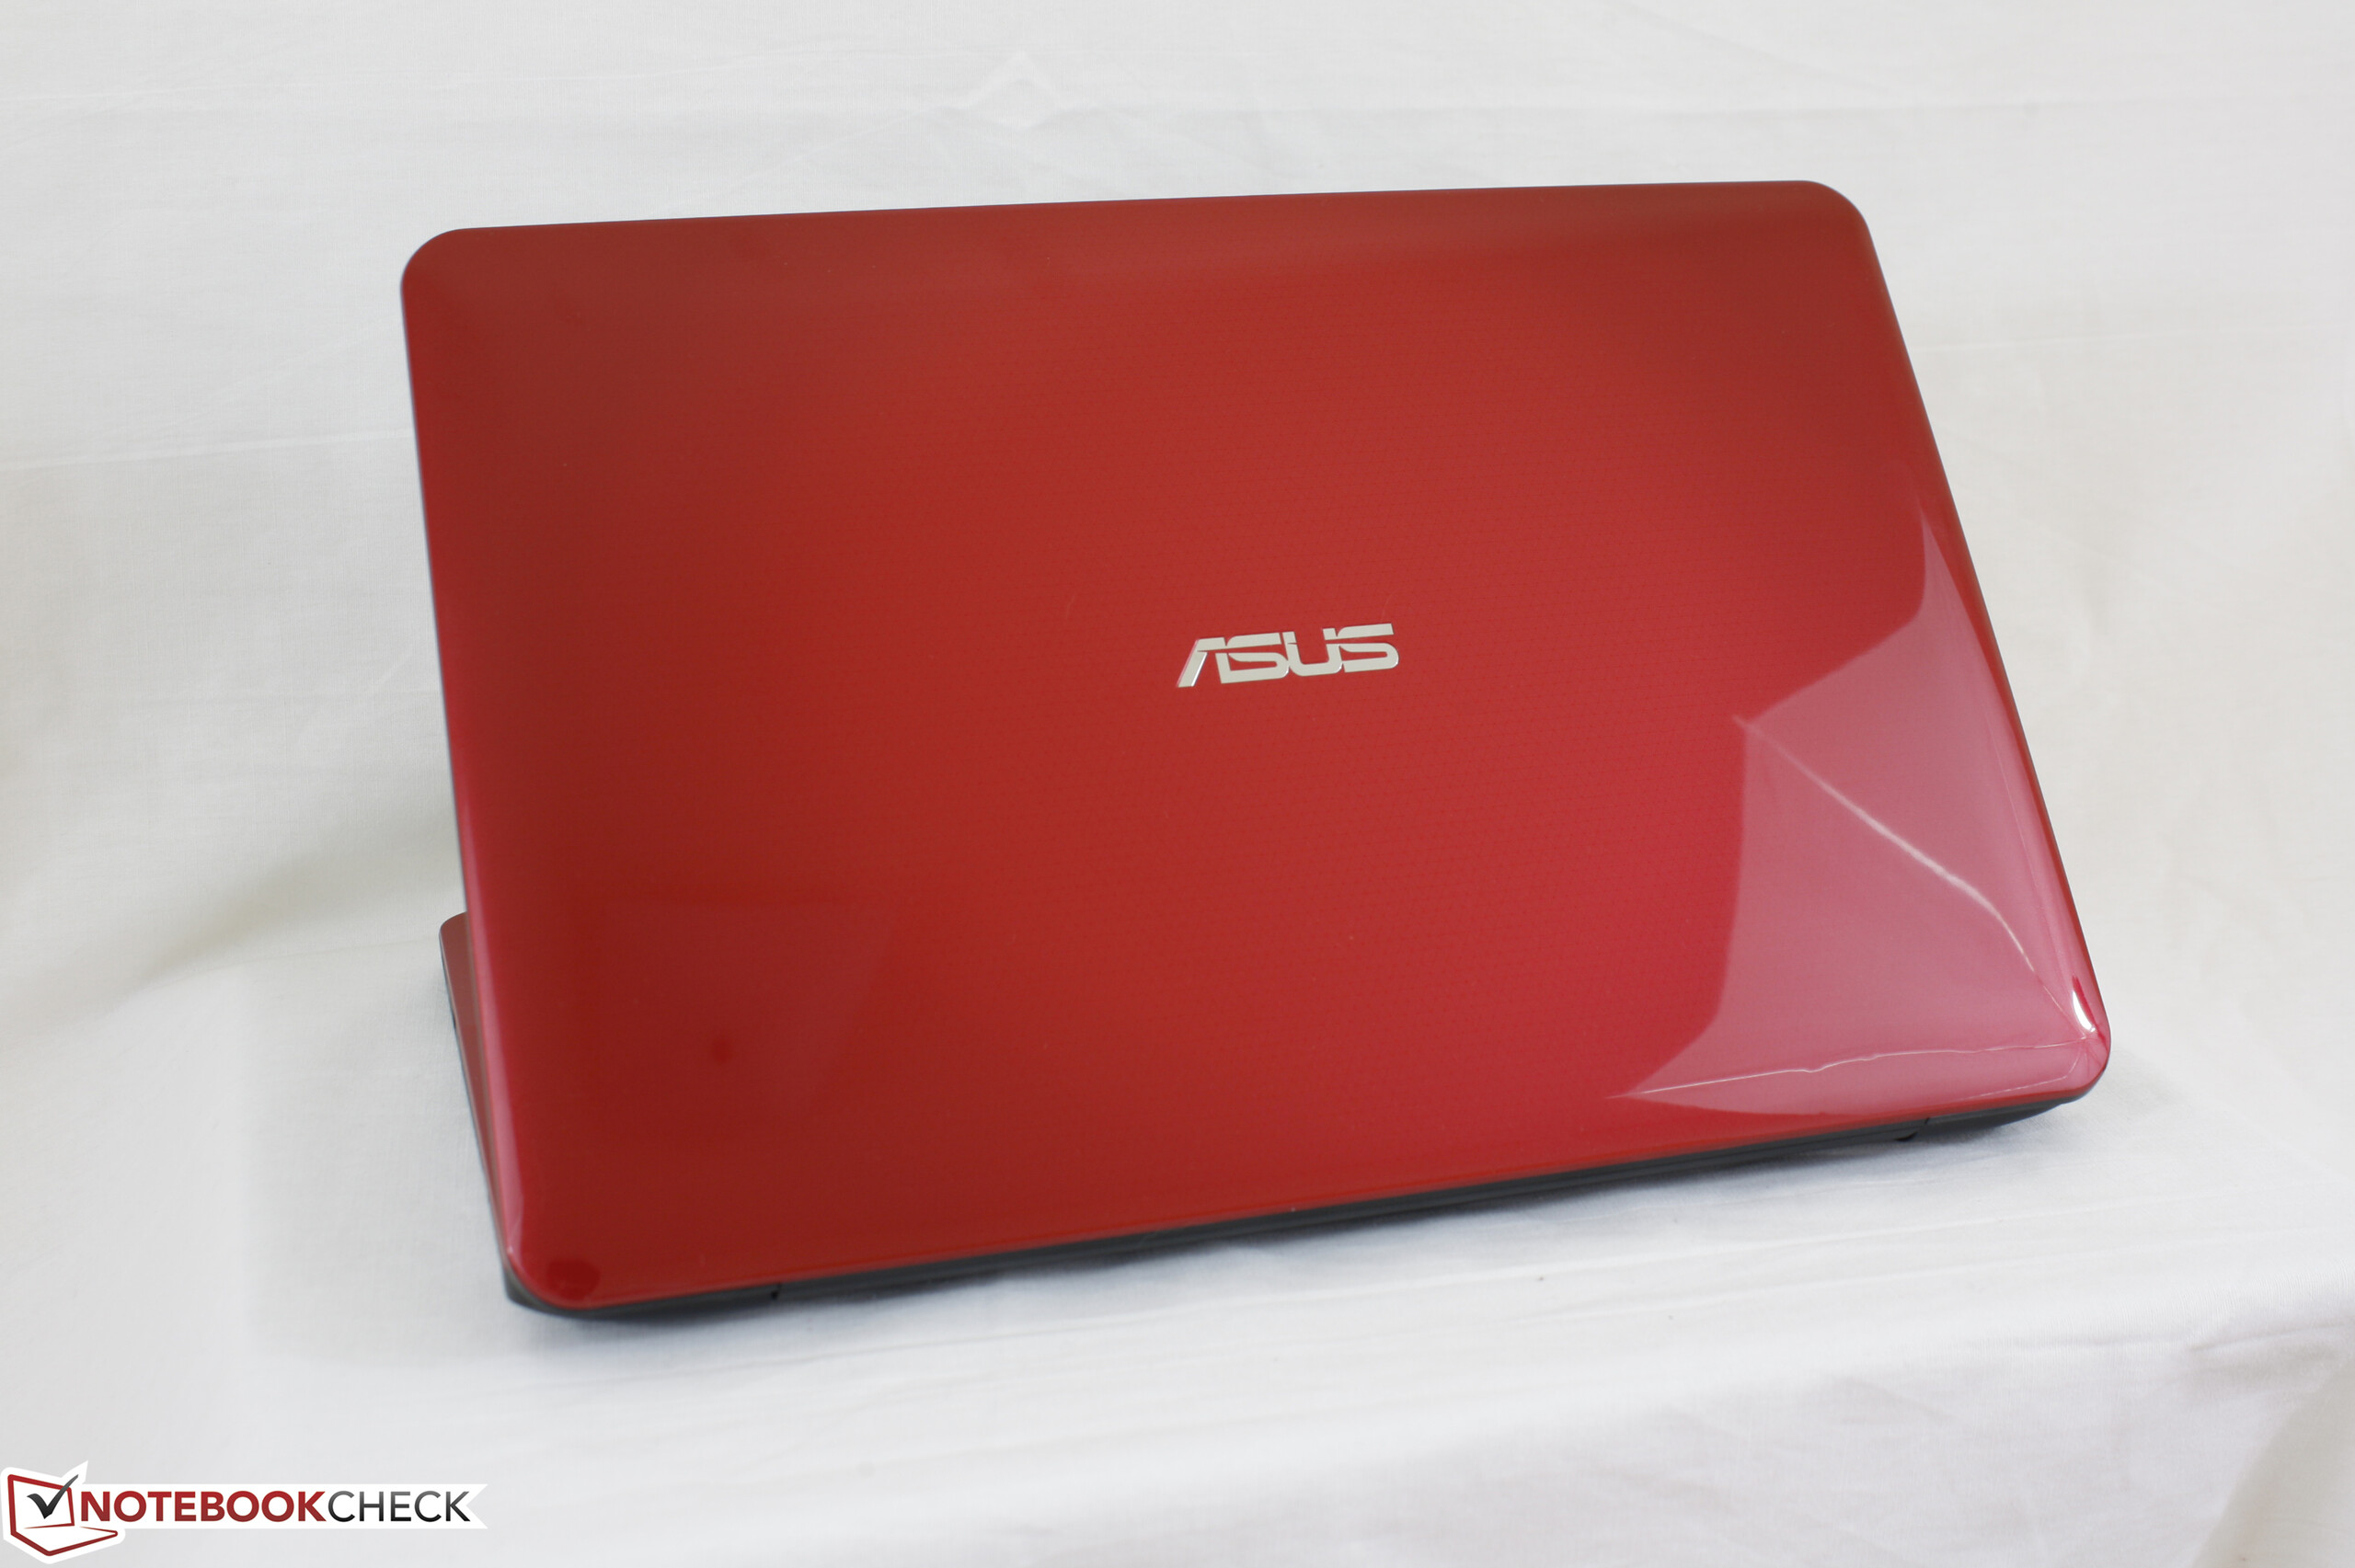
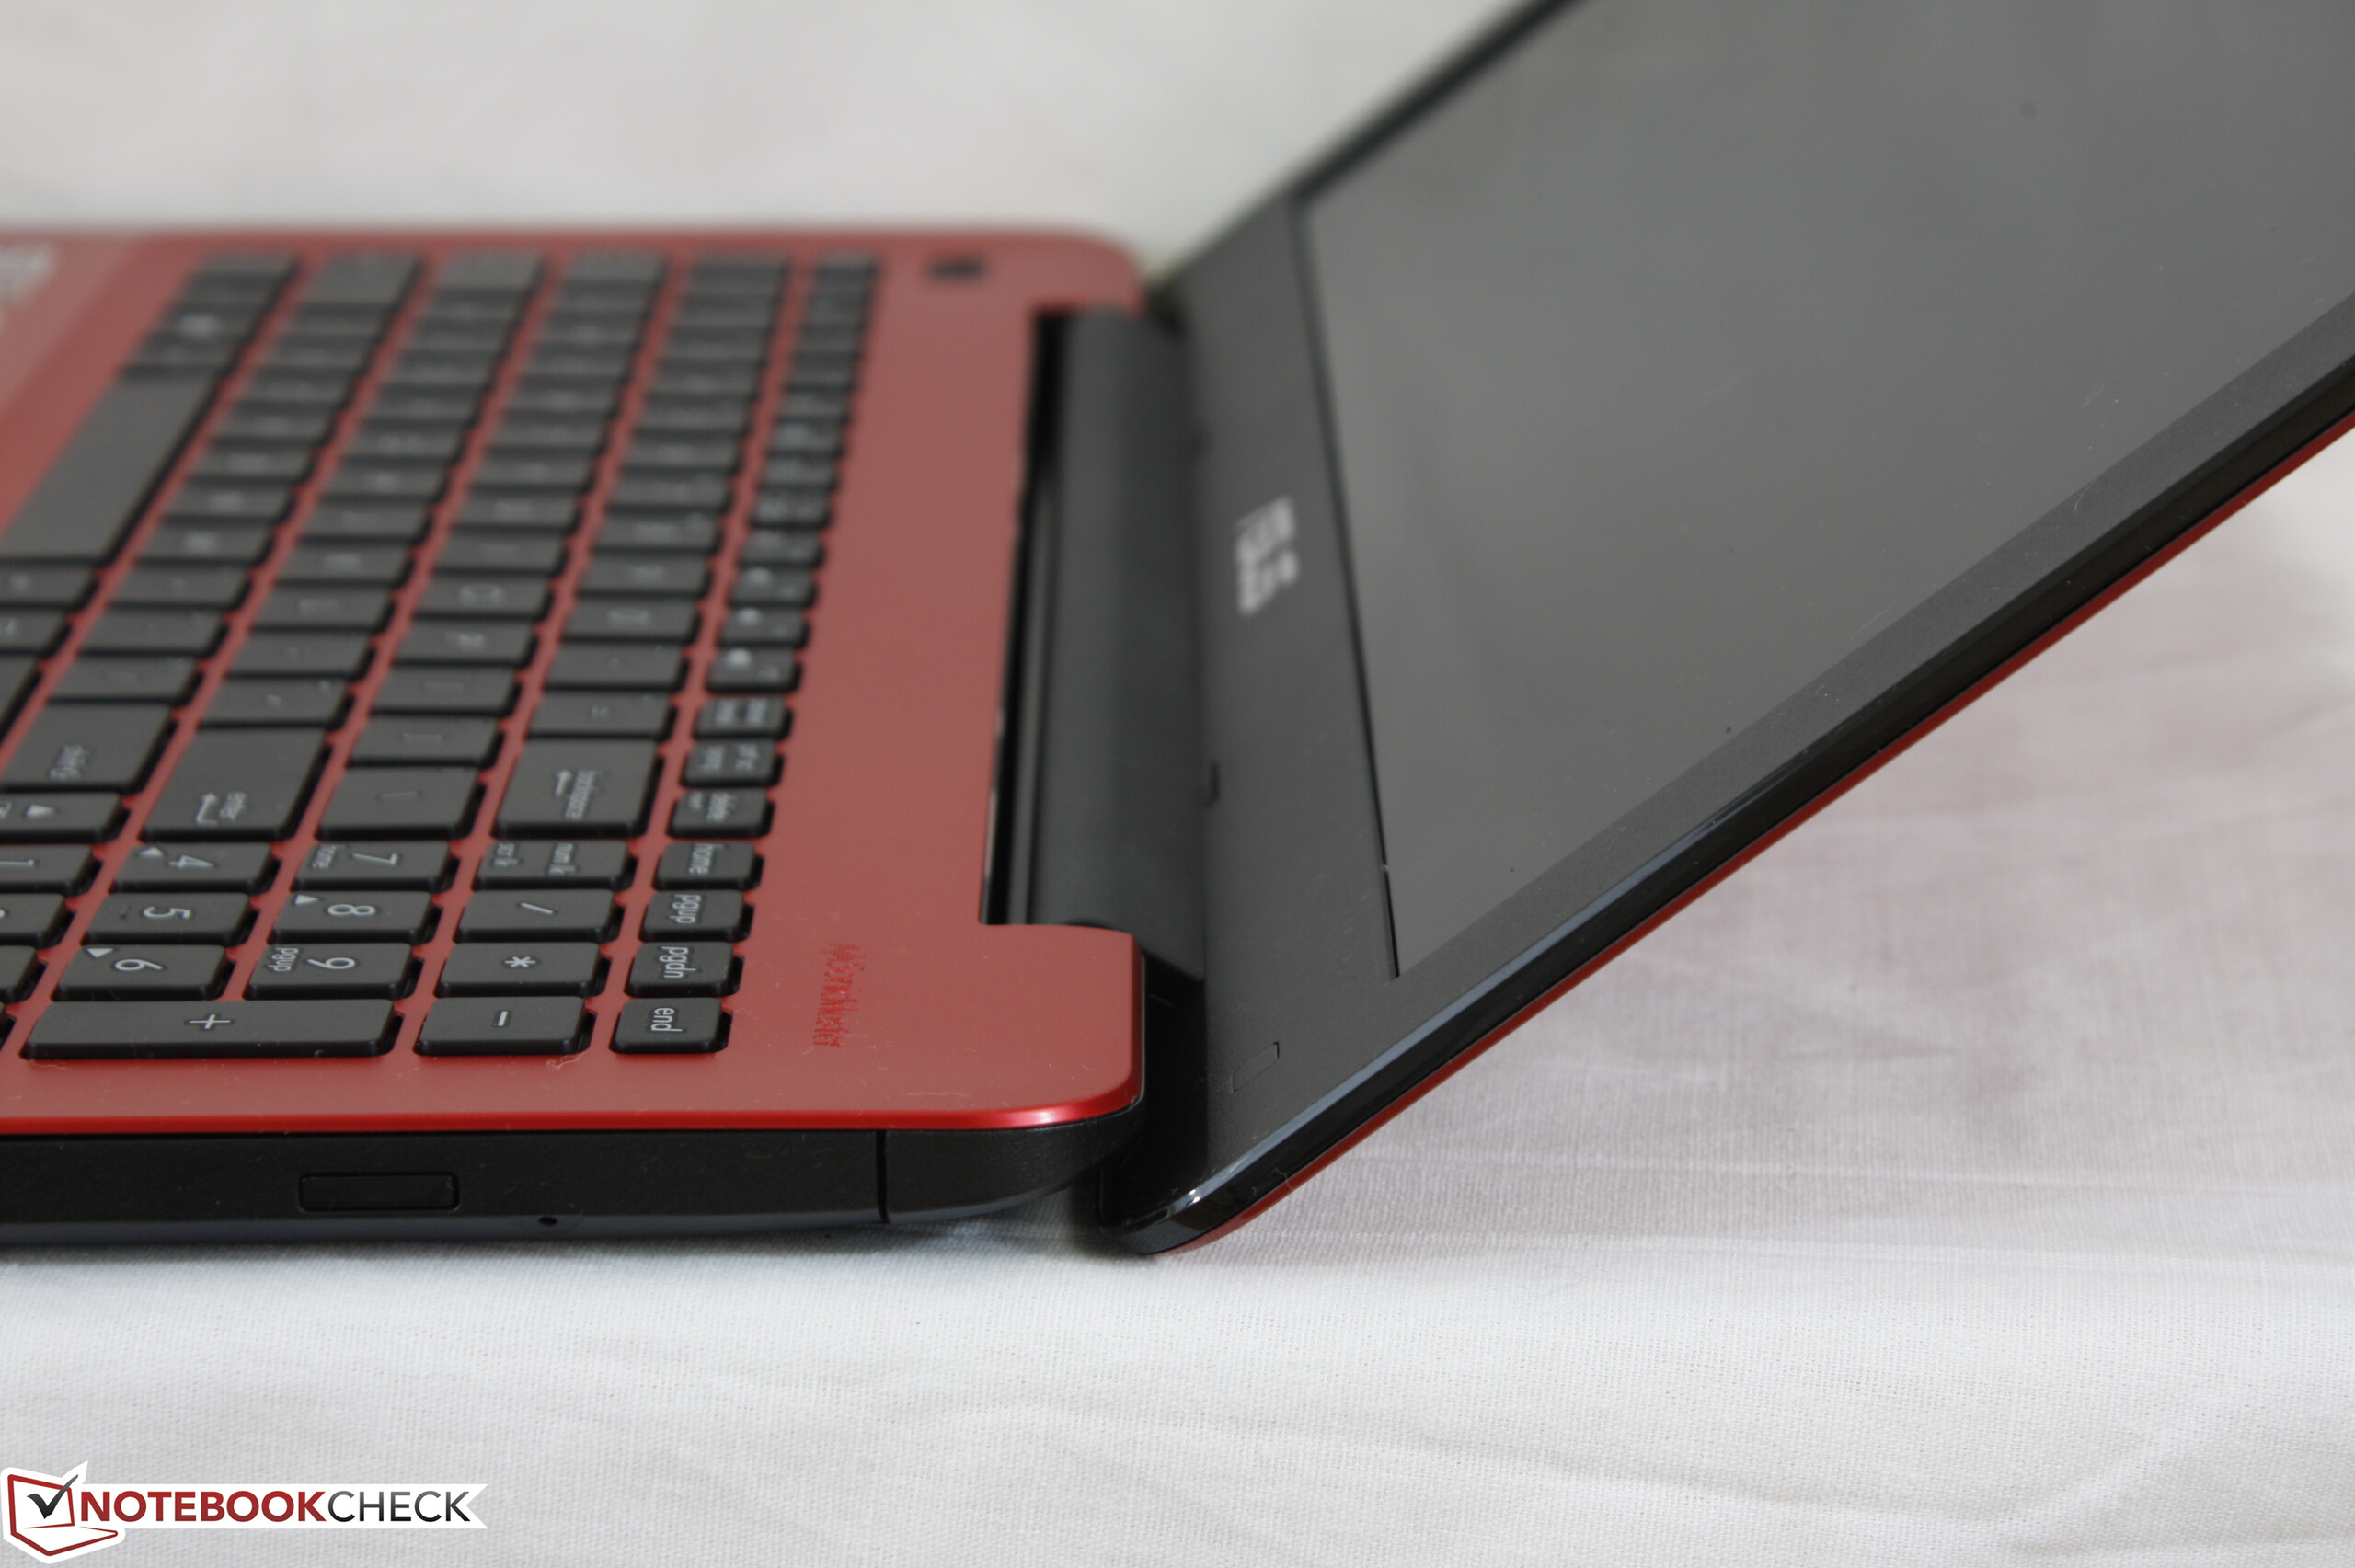
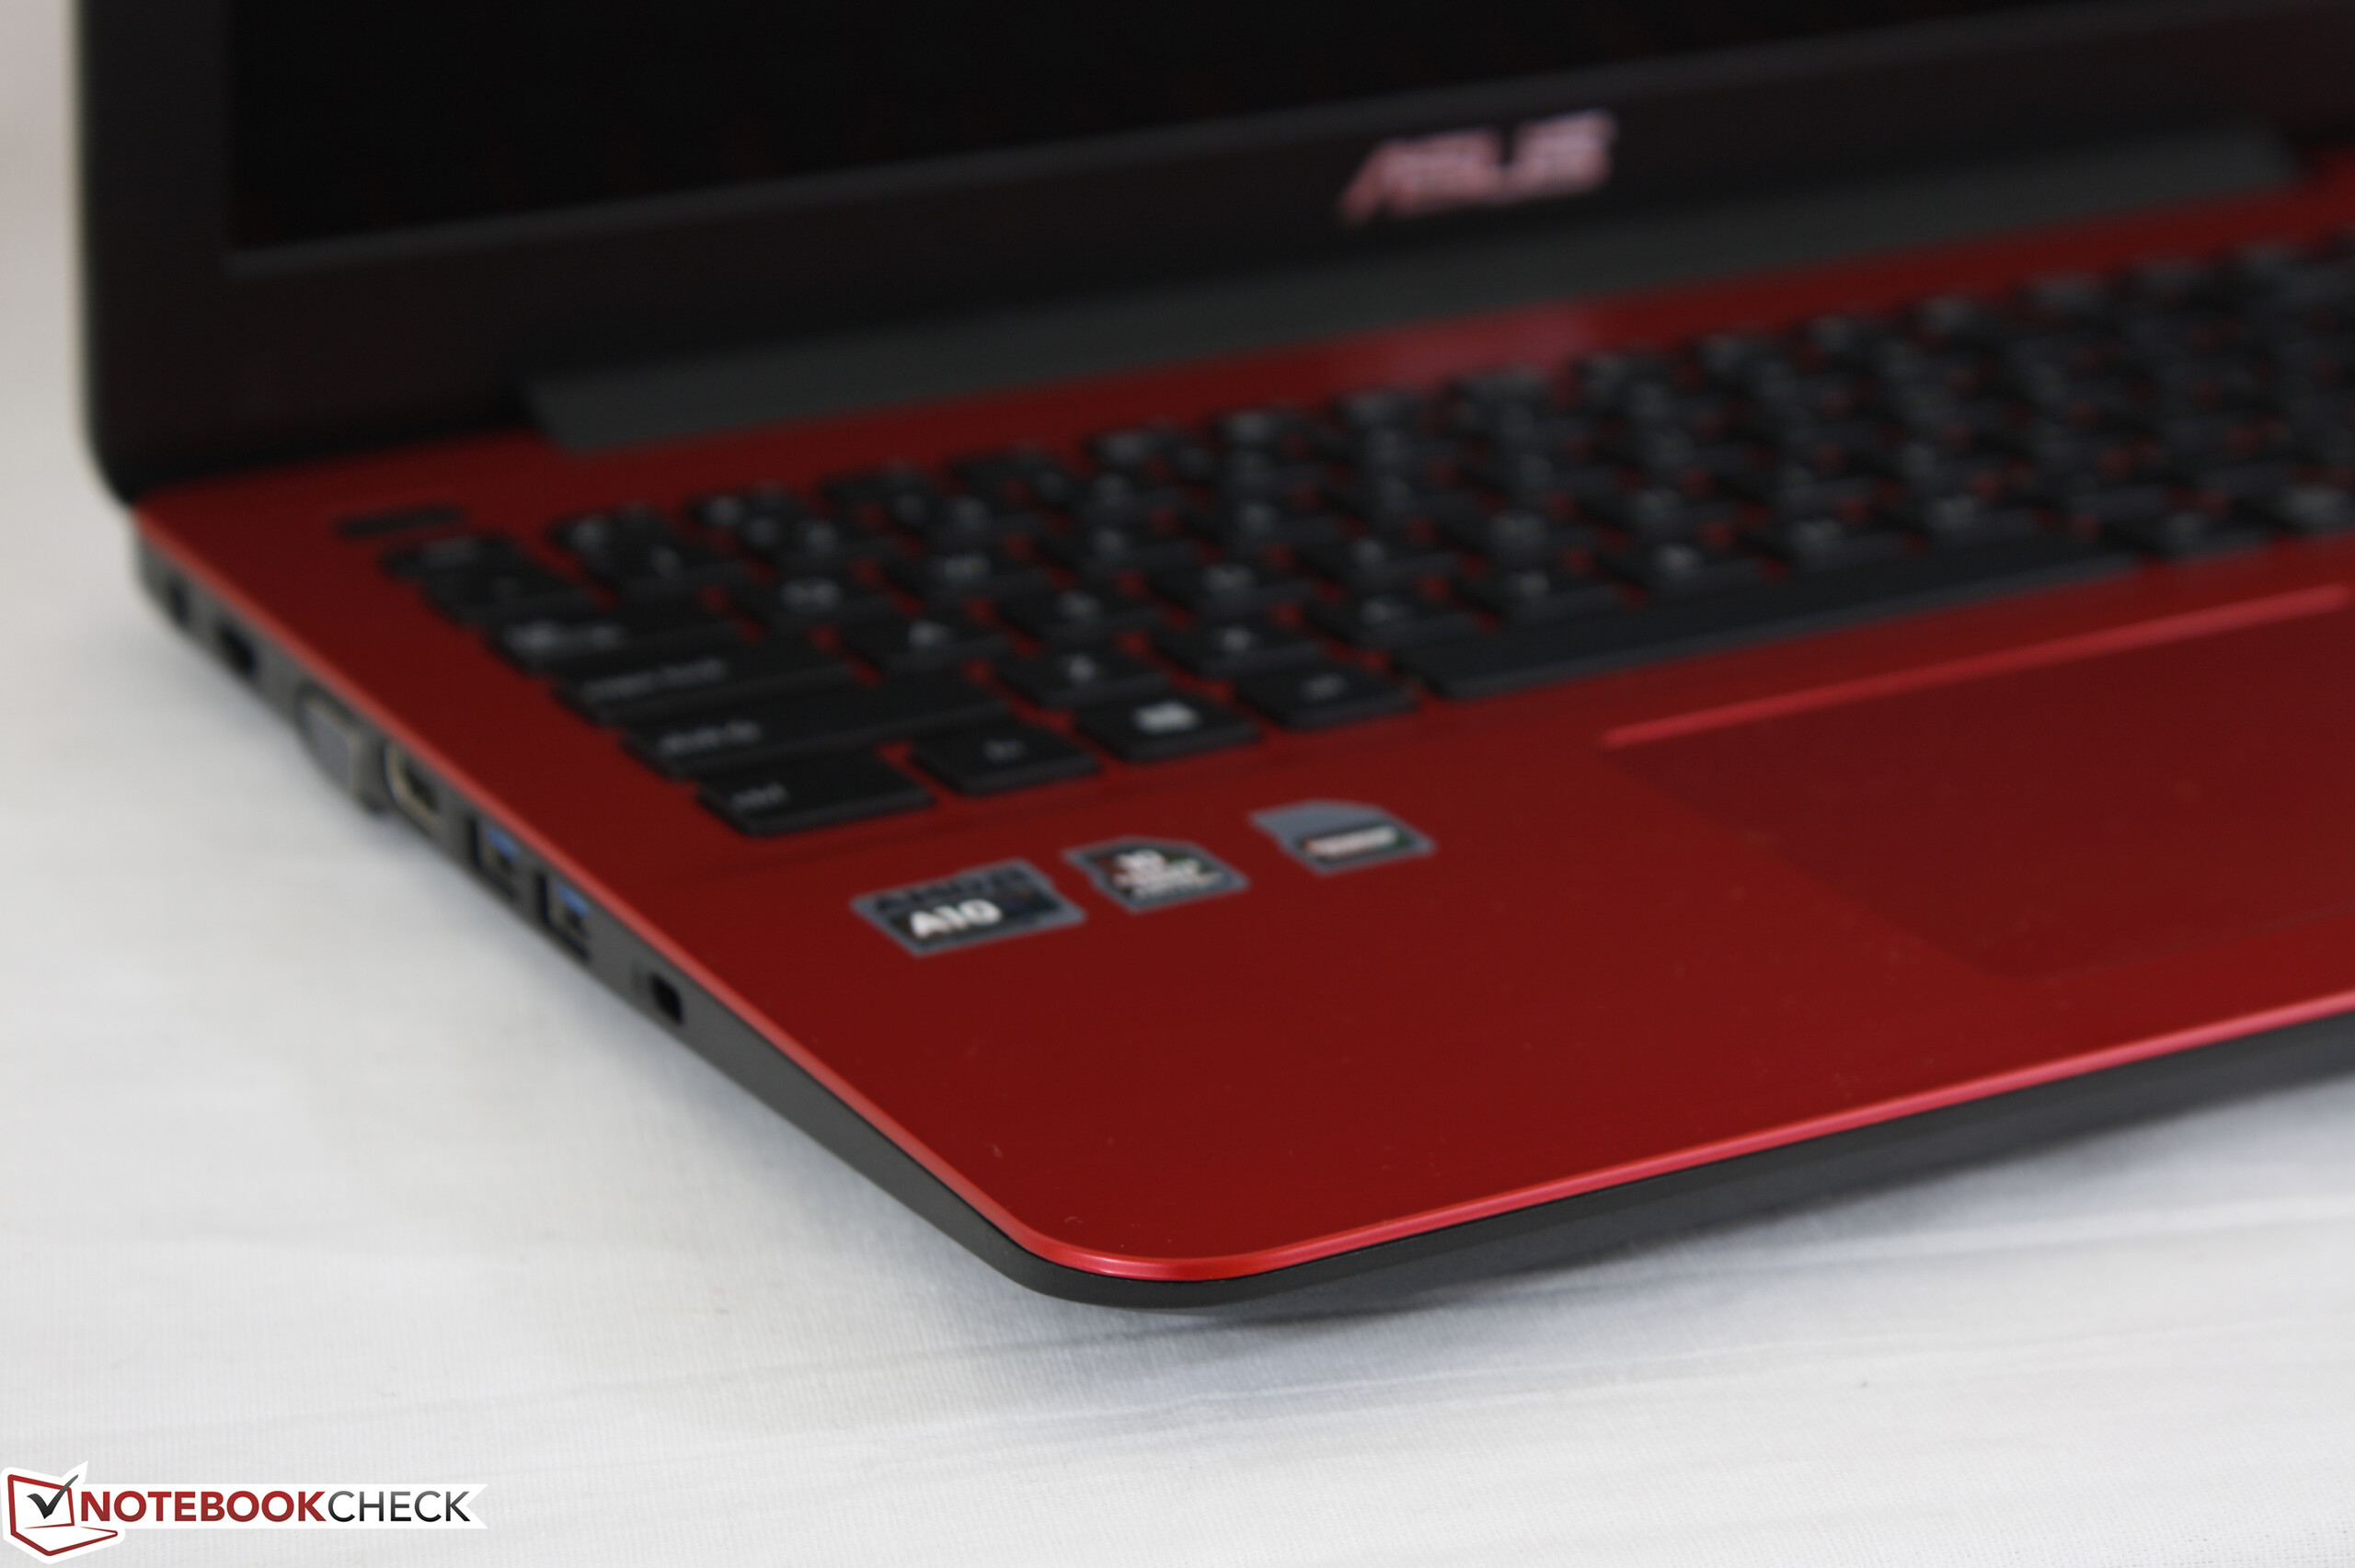
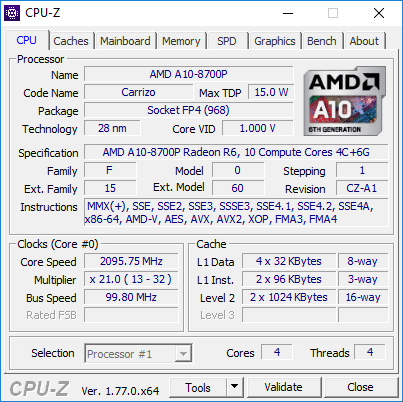
Kort testrapport Asus X555DA (A10-8700P, FHD) Laptop
| SD Card Reader | |
| average JPG Copy Test (av. of 3 runs) | |
| HP Pavilion 15t-X7P42AV | |
| Asus X555DA-BB11 | |
| Toshiba Satellite Pro R50-C-16V | |
| maximum AS SSD Seq Read Test (1GB) | |
| HP Pavilion 15t-X7P42AV | |
| Asus X555DA-BB11 | |
| Toshiba Satellite Pro R50-C-16V | |
| Networking | |
| iperf3 transmit AX12 | |
| HP Pavilion 15t-X7P42AV | |
| Toshiba Satellite Pro R50-C-16V | |
| Asus X555DA-BB11 | |
| iperf3 receive AX12 | |
| HP Pavilion 15t-X7P42AV | |
| Asus X555DA-BB11 | |
| Toshiba Satellite Pro R50-C-16V | |
| |||||||||||||||||||||||||
Helderheidsverdeling: 88 %
Helderheid in Batterij-modus: 242.7 cd/m²
Contrast: 467:1 (Zwart: 0.52 cd/m²)
ΔE ColorChecker Calman: 4.9 | ∀{0.5-29.43 Ø4.71}
ΔE Greyscale Calman: 2.7 | ∀{0.09-98 Ø4.96}
52.5% sRGB (Argyll 1.6.3 3D)
33.5% AdobeRGB 1998 (Argyll 1.6.3 3D)
36.29% AdobeRGB 1998 (Argyll 3D)
52.7% sRGB (Argyll 3D)
35.12% Display P3 (Argyll 3D)
Gamma: 2.34
CCT: 6876 K
| Asus X555DA-BB11 TN LED, 15.6", 1920x1080 | Toshiba Satellite Pro R50-C-16V Toshiba, TN LED, 15.6", 1366x768 | Lenovo Ideapad 110-15ACL 80TJ00H0GE BOE NT156WHM-N32, TN LED, 15.6", 1366x768 | HP Pavilion 15t-X7P42AV AU Optronics AUO41ED, IPS, 15.6", 1920x1080 | Asus X555LN-XO112H AU Optronics B156XW04 V6, TN LED, 15.6", 1366x768 | |
|---|---|---|---|---|---|
| Display | 16% | 6% | 8% | 41% | |
| Display P3 Coverage (%) | 35.12 | 40.6 16% | 37.39 6% | 38.03 8% | 49.95 42% |
| sRGB Coverage (%) | 52.7 | 61.2 16% | 56.2 7% | 56.5 7% | 73.9 40% |
| AdobeRGB 1998 Coverage (%) | 36.29 | 41.95 16% | 38.63 6% | 39.29 8% | 51.7 42% |
| Response Times | -39% | -21% | -14% | ||
| Response Time Grey 50% / Grey 80% * (ms) | 42 ? | 68 ? -62% | 58 -38% | 44.4 ? -6% | |
| Response Time Black / White * (ms) | 22.4 ? | 26 ? -16% | 23 -3% | 27.2 ? -21% | |
| PWM Frequency (Hz) | 217 ? | 200 ? | |||
| Screen | -40% | -32% | -7% | -86% | |
| Brightness middle (cd/m²) | 242.7 | 226 -7% | 253 4% | 209.7 -14% | 189 -22% |
| Brightness (cd/m²) | 232 | 217 -6% | 246 6% | 193 -17% | 184 -21% |
| Brightness Distribution (%) | 88 | 91 3% | 86 -2% | 75 -15% | 92 5% |
| Black Level * (cd/m²) | 0.52 | 0.58 -12% | 0.44 15% | 0.19 63% | 2.2 -323% |
| Contrast (:1) | 467 | 390 -16% | 575 23% | 1104 136% | 86 -82% |
| Colorchecker dE 2000 * | 4.9 | 9.84 -101% | 9.2 -88% | 7.8 -59% | 7.77 -59% |
| Colorchecker dE 2000 max. * | 20.3 | 16.77 17% | 17.68 13% | 24.1 -19% | |
| Greyscale dE 2000 * | 2.7 | 11.1 -311% | 11.05 -309% | 7.3 -170% | 8.82 -227% |
| Gamma | 2.34 94% | 2.35 94% | 2.55 86% | 2.39 92% | 2.43 91% |
| CCT | 6876 95% | 11979 54% | 11451 57% | 5771 113% | 9275 70% |
| Color Space (Percent of AdobeRGB 1998) (%) | 33.5 | 39 16% | 36 7% | 39.3 17% | 48 43% |
| Color Space (Percent of sRGB) (%) | 52.5 | 61 16% | 56 7% | 56.5 8% | |
| Totaal Gemiddelde (Programma / Instellingen) | -21% /
-29% | -16% /
-23% | -4% /
-5% | -23% /
-51% |
* ... kleiner is beter
Responstijd Scherm
| ↔ Responstijd Zwart naar Wit | ||
|---|---|---|
| 22.4 ms ... stijging ↗ en daling ↘ gecombineerd | ↗ 14.4 ms stijging | 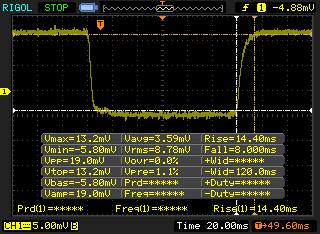 |
| ↘ 8 ms daling | ||
| Het scherm vertoonde prima responstijden in onze tests maar is misschien wat te traag voor competitieve games. Ter vergelijking: alle testtoestellen variëren van 0.1 (minimum) tot 240 (maximum) ms. » 51 % van alle toestellen zijn beter. Dit betekent dat de gemeten responstijd slechter is dan het gemiddelde (19.8 ms) van alle geteste toestellen. | ||
| ↔ Responstijd 50% Grijs naar 80% Grijs | ||
| 42 ms ... stijging ↗ en daling ↘ gecombineerd | ↗ 23.6 ms stijging | 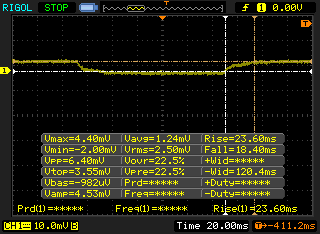 |
| ↘ 18.4 ms daling | ||
| Het scherm vertoonde trage responstijden in onze tests en is misschien te traag voor games. Ter vergelijking: alle testtoestellen variëren van 0.165 (minimum) tot 636 (maximum) ms. » 67 % van alle toestellen zijn beter. Dit betekent dat de gemeten responstijd slechter is dan het gemiddelde (31 ms) van alle geteste toestellen. | ||
Screen Flickering / PWM (Pulse-Width Modulation)
| Screen flickering / PWM niet waargenomen |  | ||
Ter vergelijking: 52 % van alle geteste toestellen maakten geen gebruik van PWM om de schermhelderheid te verlagen. Als het wel werd gebruikt, werd een gemiddelde van 7751 (minimum: 5 - maximum: 343500) Hz waargenomen. | |||
| Cinebench R15 | |
| CPU Single 64Bit | |
| Lenovo ThinkPad X1 Tablet | |
| HP ProBook 640 G2-T9X60ET | |
| HP 250 G4 T6P08ES | |
| Lenovo IdeaPad Z40-59422614 | |
| Microsoft Surface Pro 4, Core m3 | |
| Asus X555DA-BB11 | |
| Dell Venue 10 Pro 5056 | |
| Toshiba Satellite Click 10 LX0W-C-104 | |
| CPU Multi 64Bit | |
| HP ProBook 640 G2-T9X60ET | |
| HP 250 G4 T6P08ES | |
| Lenovo ThinkPad X1 Tablet | |
| Lenovo IdeaPad Z40-59422614 | |
| Microsoft Surface Pro 4, Core m3 | |
| Asus X555DA-BB11 | |
| Dell Venue 10 Pro 5056 | |
| Toshiba Satellite Click 10 LX0W-C-104 | |
| Cinebench R11.5 | |
| CPU Single 64Bit | |
| HP ProBook 640 G2-T9X60ET | |
| HP 250 G4 T6P08ES | |
| Lenovo IdeaPad Z40-59422614 | |
| Lenovo ThinkPad X1 Tablet | |
| Microsoft Surface Pro 4, Core m3 | |
| Asus X555DA-BB11 | |
| Dell Venue 10 Pro 5056 | |
| Toshiba Satellite Click 10 LX0W-C-104 | |
| CPU Multi 64Bit | |
| HP ProBook 640 G2-T9X60ET | |
| HP 250 G4 T6P08ES | |
| Lenovo ThinkPad X1 Tablet | |
| Lenovo IdeaPad Z40-59422614 | |
| Asus X555DA-BB11 | |
| Microsoft Surface Pro 4, Core m3 | |
| Dell Venue 10 Pro 5056 | |
| Toshiba Satellite Click 10 LX0W-C-104 | |
| Cinebench R10 | |
| Rendering Multiple CPUs 32Bit | |
| HP ProBook 640 G2-T9X60ET | |
| HP 250 G4 T6P08ES | |
| Lenovo IdeaPad Z40-59422614 | |
| Microsoft Surface Pro 4, Core m3 | |
| Asus X555DA-BB11 | |
| Dell Venue 10 Pro 5056 | |
| Toshiba Satellite Click 10 LX0W-C-104 | |
| Rendering Single 32Bit | |
| HP ProBook 640 G2-T9X60ET | |
| HP 250 G4 T6P08ES | |
| Lenovo IdeaPad Z40-59422614 | |
| Microsoft Surface Pro 4, Core m3 | |
| Asus X555DA-BB11 | |
| Dell Venue 10 Pro 5056 | |
| Toshiba Satellite Click 10 LX0W-C-104 | |
| wPrime 2.10 - 1024m | |
| Lenovo IdeaPad Z40-59422614 | |
| Microsoft Surface Pro 4, Core m3 | |
| Lenovo ThinkPad X1 Tablet | |
| Asus X555DA-BB11 | |
* ... kleiner is beter
| PCMark 8 | |
| Home Score Accelerated v2 | |
| HP Pavilion 15t-X7P42AV | |
| Asus Vivobook F556UQ-XO626D | |
| Toshiba Satellite Pro R50-C-16V | |
| Asus X555DA-BB11 | |
| Lenovo Ideapad 110-15ACL 80TJ00H0GE | |
| Work Score Accelerated v2 | |
| Asus Vivobook F556UQ-XO626D | |
| Toshiba Satellite Pro R50-C-16V | |
| Asus X555DA-BB11 | |
| HP Pavilion 15t-X7P42AV | |
| Creative Score Accelerated v2 | |
| HP Pavilion 15t-X7P42AV | |
| Asus Vivobook F556UQ-XO626D | |
| Toshiba Satellite Pro R50-C-16V | |
| Asus X555DA-BB11 | |
| PCMark 8 Home Score Accelerated v2 | 2335 punten | |
| PCMark 8 Creative Score Accelerated v2 | 2856 punten | |
| PCMark 8 Work Score Accelerated v2 | 3246 punten | |
Help | ||
| Asus X555DA-BB11 Seagate Momentus SpinPoint M8 ST1000LM024 HN-M101MBB | Toshiba Satellite Pro R50-C-16V TOSHIBA MQ01ABD075 | Lenovo Ideapad 110-15ACL 80TJ00H0GE Seagate Mobile HDD 1TB ST1000LM035 | HP Pavilion 15t-X7P42AV Samsung CM871a MZNTY128HDHP | Asus X555LN-XO112H Toshiba MQ01ABF050 | |
|---|---|---|---|---|---|
| CrystalDiskMark 3.0 | -12% | -13% | 12908% | 28% | |
| Read Seq (MB/s) | 106.9 | 96.5 -10% | 92.1 -14% | 522 388% | 105.8 -1% |
| Write Seq (MB/s) | 97.5 | 77.9 -20% | 88.5 -9% | 476.6 389% | 104 7% |
| Read 512 (MB/s) | 32.28 | 20.82 -36% | 32.94 2% | 399.7 1138% | 35.72 11% |
| Write 512 (MB/s) | 35.39 | 19.83 -44% | 26.71 -25% | 185.4 424% | 44.85 27% |
| Read 4k (MB/s) | 0.373 | 0.342 -8% | 0.372 0% | 33.12 8779% | 0.47 26% |
| Write 4k (MB/s) | 0.636 | 0.836 31% | 0.283 -56% | 89.8 14019% | 1.044 64% |
| Read 4k QD32 (MB/s) | 0.694 | 0.595 -14% | 0.921 33% | 400.9 57667% | 0.894 29% |
| Write 4k QD32 (MB/s) | 0.682 | 0.706 4% | 0.473 -31% | 140.2 20457% | 1.099 61% |

| 3DMark 11 | |
| 1280x720 Performance GPU | |
| HP Pavilion 15t-X7P42AV | |
| Asus X555LN-XO112H | |
| HP 250 G4 T6P08ES | |
| HP ProBook 640 G2-T9X60ET | |
| Asus X555DA-BB11 | |
| Lenovo IdeaPad Z40-59422614 | |
| Microsoft Surface Pro 4, Core m3 | |
| Lenovo ThinkPad X1 Tablet | |
| Toshiba Satellite Pro R50-C-16V | |
| Lenovo Ideapad 110-15ACL 80TJ00H0GE | |
| Dell Venue 10 Pro 5056 | |
| Toshiba Satellite Click 10 LX0W-C-104 | |
| 1280x720 Performance Combined | |
| HP Pavilion 15t-X7P42AV | |
| Asus X555LN-XO112H | |
| HP 250 G4 T6P08ES | |
| Microsoft Surface Pro 4, Core m3 | |
| HP ProBook 640 G2-T9X60ET | |
| Lenovo IdeaPad Z40-59422614 | |
| Lenovo ThinkPad X1 Tablet | |
| Toshiba Satellite Pro R50-C-16V | |
| Asus X555DA-BB11 | |
| Lenovo Ideapad 110-15ACL 80TJ00H0GE | |
| Dell Venue 10 Pro 5056 | |
| Toshiba Satellite Click 10 LX0W-C-104 | |
| 3DMark | |
| 1280x720 Cloud Gate Standard Graphics | |
| HP Pavilion 15t-X7P42AV | |
| Asus X555LN-XO112H | |
| Microsoft Surface Pro 4, Core m3 | |
| HP ProBook 640 G2-T9X60ET | |
| Lenovo IdeaPad Z40-59422614 | |
| Lenovo ThinkPad X1 Tablet | |
| HP 250 G4 T6P08ES | |
| Asus X555DA-BB11 | |
| Dell Venue 10 Pro 5056 | |
| Toshiba Satellite Click 10 LX0W-C-104 | |
| 1920x1080 Fire Strike Graphics | |
| HP Pavilion 15t-X7P42AV | |
| Asus X555LN-XO112H | |
| HP 250 G4 T6P08ES | |
| Lenovo IdeaPad Z40-59422614 | |
| Microsoft Surface Pro 4, Core m3 | |
| HP ProBook 640 G2-T9X60ET | |
| Asus X555DA-BB11 | |
| Lenovo ThinkPad X1 Tablet | |
| Dell Venue 10 Pro 5056 | |
| Toshiba Satellite Click 10 LX0W-C-104 | |
| 1280x720 Ice Storm Standard Graphics | |
| HP Pavilion 15t-X7P42AV | |
| Asus X555LN-XO112H | |
| Lenovo IdeaPad Z40-59422614 | |
| HP 250 G4 T6P08ES | |
| Lenovo ThinkPad X1 Tablet | |
| Microsoft Surface Pro 4, Core m3 | |
| HP ProBook 640 G2-T9X60ET | |
| Asus X555DA-BB11 | |
| Dell Venue 10 Pro 5056 | |
| Toshiba Satellite Click 10 LX0W-C-104 | |
| 3DMark 11 Performance | 1297 punten | |
| 3DMark Ice Storm Standard Score | 31586 punten | |
| 3DMark Cloud Gate Standard Score | 3248 punten | |
| 3DMark Fire Strike Score | 666 punten | |
| 3DMark Fire Strike Extreme Score | 337 punten | |
Help | ||
| BioShock Infinite - 1280x720 Very Low Preset | |
| Asus X555LD-XX283H | |
| Microsoft Surface Pro 4, Core m3 | |
| Lenovo ThinkPad L470-20J5S00C00 | |
| Asus X555DA-BB11 | |
| Lenovo Ideapad 110-15ACL 80TJ00H0GE | |
| Toshiba Satellite Pro R50-C-16V | |
| HP Split x2 13-m210eg | |
| Dell Venue 10 Pro 5056 | |
| lage | gem. | hoge | ultra | |
|---|---|---|---|---|
| BioShock Infinite (2013) | 36.3 | |||
| Dota 2 Reborn (2015) | 28.2 | |||
| Rise of the Tomb Raider (2016) | 17 |
Geluidsniveau
| Onbelast |
| 31.6 / 32 / 32.4 dB (A) |
| Belasting |
| 33.3 / 35.5 dB (A) |
 | ||
30 dB stil 40 dB(A) hoorbaar 50 dB(A) luid |
||
min: | ||
| Asus X555DA-BB11 Radeon R6 (Carrizo), A10-8700P, Seagate Momentus SpinPoint M8 ST1000LM024 HN-M101MBB | Toshiba Satellite Pro R50-C-16V HD Graphics 520, 6006U, TOSHIBA MQ01ABD075 | Lenovo Ideapad 110-15ACL 80TJ00H0GE Radeon R5 (Beema/Carrizo-L), A8-7410, Seagate Mobile HDD 1TB ST1000LM035 | HP Pavilion 15t-X7P42AV GeForce GTX 1050 Mobile, i7-7700HQ, Samsung CM871a MZNTY128HDHP | Asus X555LN-XO112H GeForce 840M, 4210U, Toshiba MQ01ABF050 | Asus Vivobook F556UQ-XO626D GeForce 940MX, 6198DU, Toshiba MQ01ABF050 | |
|---|---|---|---|---|---|---|
| Noise | 2% | 3% | -13% | -8% | -6% | |
| uit / omgeving * (dB) | 28.9 | 30.4 -5% | 30.4 -5% | 29.3 -1% | 30.7 -6% | |
| Idle Minimum * (dB) | 31.6 | 31.8 -1% | 30.9 2% | 32.3 -2% | 31.7 -0% | 32 -1% |
| Idle Average * (dB) | 32 | 31.8 1% | 30.9 3% | 32.3 -1% | 31.7 1% | 32 -0% |
| Idle Maximum * (dB) | 32.4 | 31.8 2% | 31 4% | 32.4 -0% | 31.8 2% | 32.2 1% |
| Load Average * (dB) | 33.3 | 31.9 4% | 31.8 5% | 44.4 -33% | 40.8 -23% | 37.3 -12% |
| Load Maximum * (dB) | 35.5 | 31.8 10% | 31.9 10% | 49.2 -39% | 43.2 -22% | 42.6 -20% |
* ... kleiner is beter
(+) De maximumtemperatuur aan de bovenzijde bedraagt 36.8 °C / 98 F, vergeleken met het gemiddelde van 36.8 °C / 98 F, variërend van 21 tot 71 °C voor de klasse Multimedia.
(±) De bodem warmt op tot een maximum van 45 °C / 113 F, vergeleken met een gemiddelde van 39.1 °C / 102 F
(+) Bij onbelast gebruik bedraagt de gemiddelde temperatuur voor de bovenzijde 27 °C / 81 F, vergeleken met het apparaatgemiddelde van 31.3 °C / 88 F.
(+) De palmsteunen en het touchpad zijn met een maximum van ###max## °C / 86 F koeler dan de huidtemperatuur en voelen daarom koel aan.
(±) De gemiddelde temperatuur van de handpalmsteun van soortgelijke toestellen bedroeg 28.7 °C / 83.7 F (-1.3 °C / -2.3 F).
Asus X555DA-BB11 audioanalyse
(±) | luidspreker luidheid is gemiddeld maar goed (76.4 dB)
Bas 100 - 315 Hz
(-) | bijna geen lage tonen - gemiddeld 21.4% lager dan de mediaan
(±) | lineariteit van de lage tonen is gemiddeld (13.5% delta ten opzichte van de vorige frequentie)
Midden 400 - 2000 Hz
(±) | lagere middens - gemiddeld 5.1% lager dan de mediaan
(±) | lineariteit van de middentonen is gemiddeld (14.6% delta ten opzichte van de vorige frequentie)
Hoog 2 - 16 kHz
(±) | higher highs - on average 7.2% higher than median
(±) | lineariteit van de hoogtepunten is gemiddeld (14.6% delta ten opzichte van de vorige frequentie)
Algemeen 100 - 16.000 Hz
(±) | lineariteit van het totale geluid is gemiddeld (29% verschil met de mediaan)
Vergeleken met dezelfde klasse
» 95% van alle geteste apparaten in deze klasse waren beter, 1% vergelijkbaar, 4% slechter
» De beste had een delta van 5%, het gemiddelde was 17%, de slechtste was 45%
Vergeleken met alle geteste toestellen
» 87% van alle geteste apparaten waren beter, 2% gelijk, 11% slechter
» De beste had een delta van 4%, het gemiddelde was 23%, de slechtste was 134%
Apple MacBook 12 (Early 2016) 1.1 GHz audioanalyse
(+) | luidsprekers kunnen relatief luid spelen (83.6 dB)
Bas 100 - 315 Hz
(±) | verminderde zeebaars - gemiddeld 11.3% lager dan de mediaan
(±) | lineariteit van de lage tonen is gemiddeld (14.2% delta ten opzichte van de vorige frequentie)
Midden 400 - 2000 Hz
(+) | evenwichtige middens - slechts 2.4% verwijderd van de mediaan
(+) | de middentonen zijn lineair (5.5% delta ten opzichte van de vorige frequentie)
Hoog 2 - 16 kHz
(+) | evenwichtige hoogtepunten - slechts 2% verwijderd van de mediaan
(+) | de hoge tonen zijn lineair (4.5% delta naar de vorige frequentie)
Algemeen 100 - 16.000 Hz
(+) | het totale geluid is lineair (10.2% verschil met de mediaan)
Vergeleken met dezelfde klasse
» 7% van alle geteste apparaten in deze klasse waren beter, 2% vergelijkbaar, 90% slechter
» De beste had een delta van 5%, het gemiddelde was 18%, de slechtste was 53%
Vergeleken met alle geteste toestellen
» 5% van alle geteste apparaten waren beter, 1% gelijk, 94% slechter
» De beste had een delta van 4%, het gemiddelde was 23%, de slechtste was 134%
| Uit / Standby | |
| Inactief | |
| Belasting |
|
Key:
min: | |
| Asus X555DA-BB11 A10-8700P, Radeon R6 (Carrizo), Seagate Momentus SpinPoint M8 ST1000LM024 HN-M101MBB, TN LED, 1920x1080, 15.6" | Toshiba Satellite Pro R50-C-16V 6006U, HD Graphics 520, TOSHIBA MQ01ABD075, TN LED, 1366x768, 15.6" | Lenovo Ideapad 110-15ACL 80TJ00H0GE A8-7410, Radeon R5 (Beema/Carrizo-L), Seagate Mobile HDD 1TB ST1000LM035, TN LED, 1366x768, 15.6" | HP Pavilion 15t-X7P42AV i7-7700HQ, GeForce GTX 1050 Mobile, Samsung CM871a MZNTY128HDHP, IPS, 1920x1080, 15.6" | Asus X555LN-XO112H 4210U, GeForce 840M, Toshiba MQ01ABF050, TN LED, 1366x768, 15.6" | |
|---|---|---|---|---|---|
| Power Consumption | 29% | 35% | -68% | 19% | |
| Idle Minimum * (Watt) | 8.3 | 6 28% | 5.4 35% | 8.29 -0% | 4.2 49% |
| Idle Average * (Watt) | 8.6 | 8.7 -1% | 6.8 21% | 8.9 -3% | 6.3 27% |
| Idle Maximum * (Watt) | 13.1 | 9.2 30% | 7.3 44% | 10.2 22% | 7.1 46% |
| Load Average * (Watt) | 31.2 | 18.6 40% | 21.1 32% | 77.1 -147% | 35.2 -13% |
| Load Maximum * (Watt) | 43.9 | 23.8 46% | 25.5 42% | 136.6 -211% | 49.2 -12% |
* ... kleiner is beter
| Asus X555DA-BB11 A10-8700P, Radeon R6 (Carrizo), 37 Wh | Toshiba Satellite Pro R50-C-16V 6006U, HD Graphics 520, 44 Wh | Lenovo Ideapad 110-15ACL 80TJ00H0GE A8-7410, Radeon R5 (Beema/Carrizo-L), 24 Wh | HP Pavilion 15t-X7P42AV i7-7700HQ, GeForce GTX 1050 Mobile, 63.3 Wh | Asus X555LN-XO112H 4210U, GeForce 840M, 37 Wh | |
|---|---|---|---|---|---|
| Batterijduur | 103% | 17% | 100% | ||
| Reader / Idle (h) | 7.3 | 16 119% | |||
| WiFi v1.3 (h) | 2.9 | 5.9 103% | 3.4 17% | 6.5 124% | |
| Load (h) | 1.2 | 1.9 58% | |||
| WiFi (h) | 4.3 |
Pro
Contra
Dit is de verkorte versie van het originele artikel. Het volledige, Engelse testrapport vind je hier.
De X555DA is moeilijk aan te bevelen, zeker als we de vergelijking maken met de oudere Intel-gebaseerde X555LN of X555LD, die sneller zijn dan hun AMD-tegenhanger en een langere batterijduur bieden. Normaal kan de gebruiker langere batterijduur en lagere temperaturen verwachten ter compensatie van minder snelle hardware. De X555DA biedt het slechtste van twee werelden aangezien zowel performance als batterijduur ondermaats zijn.
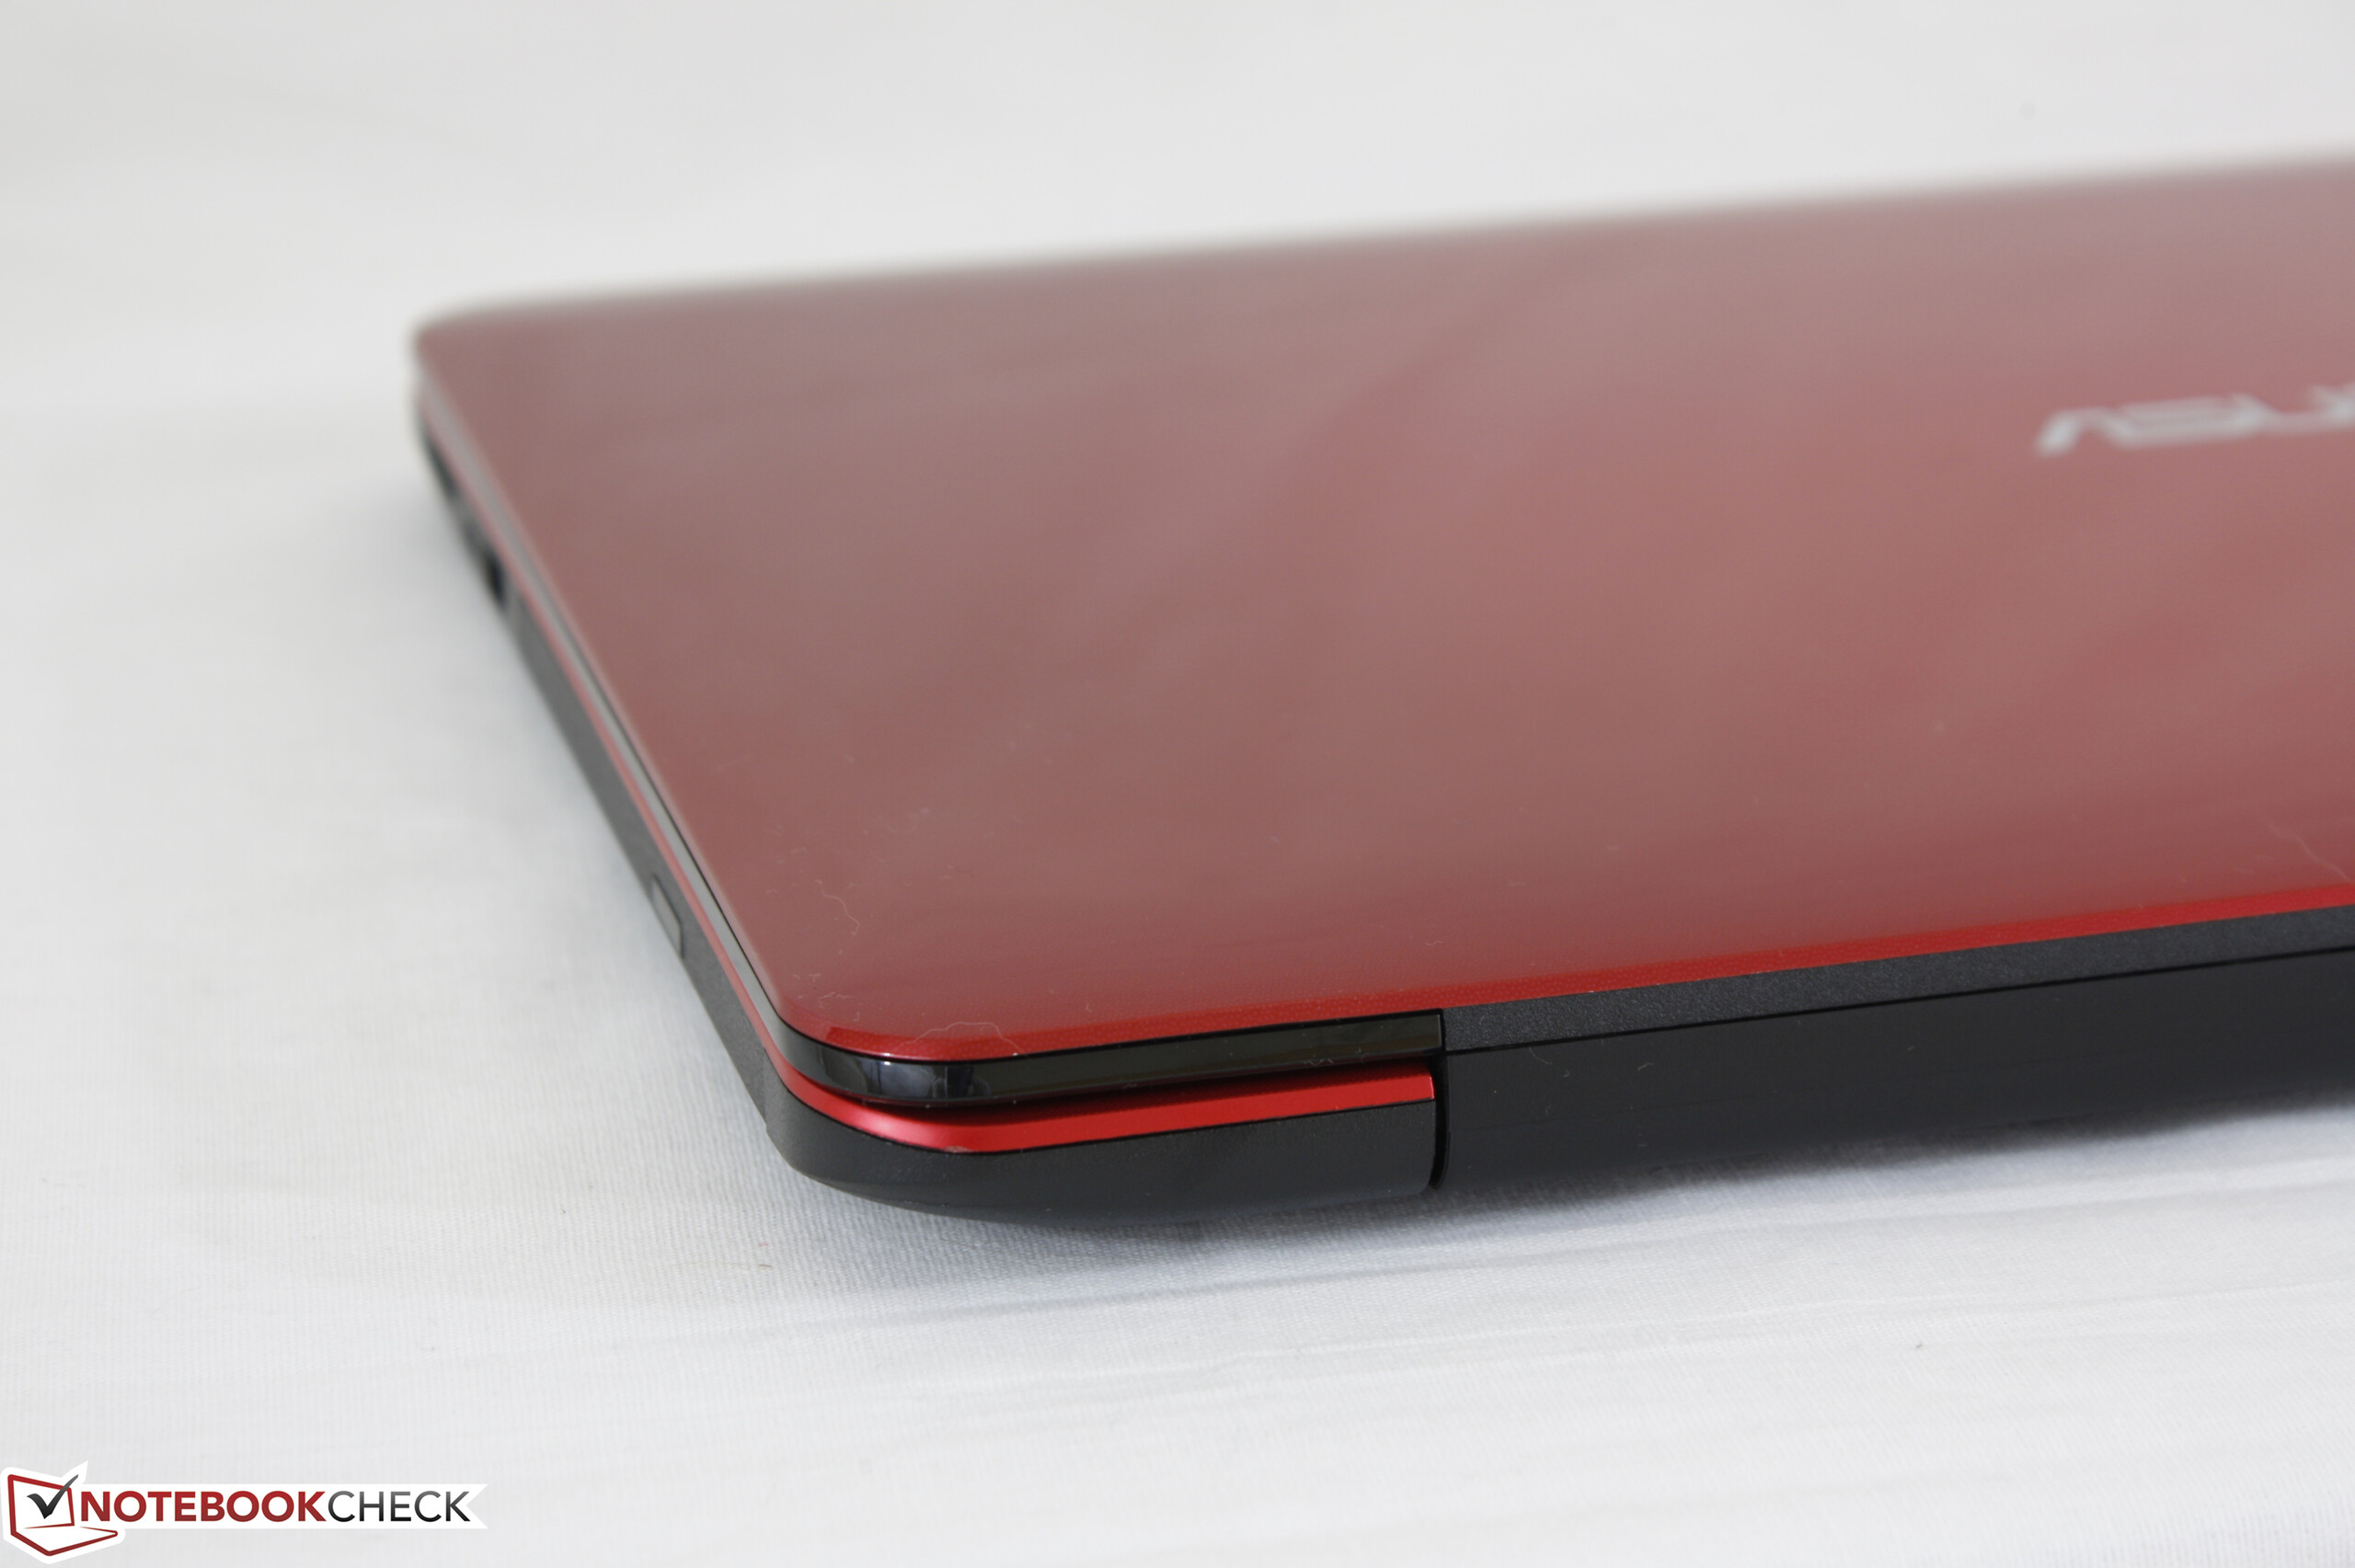
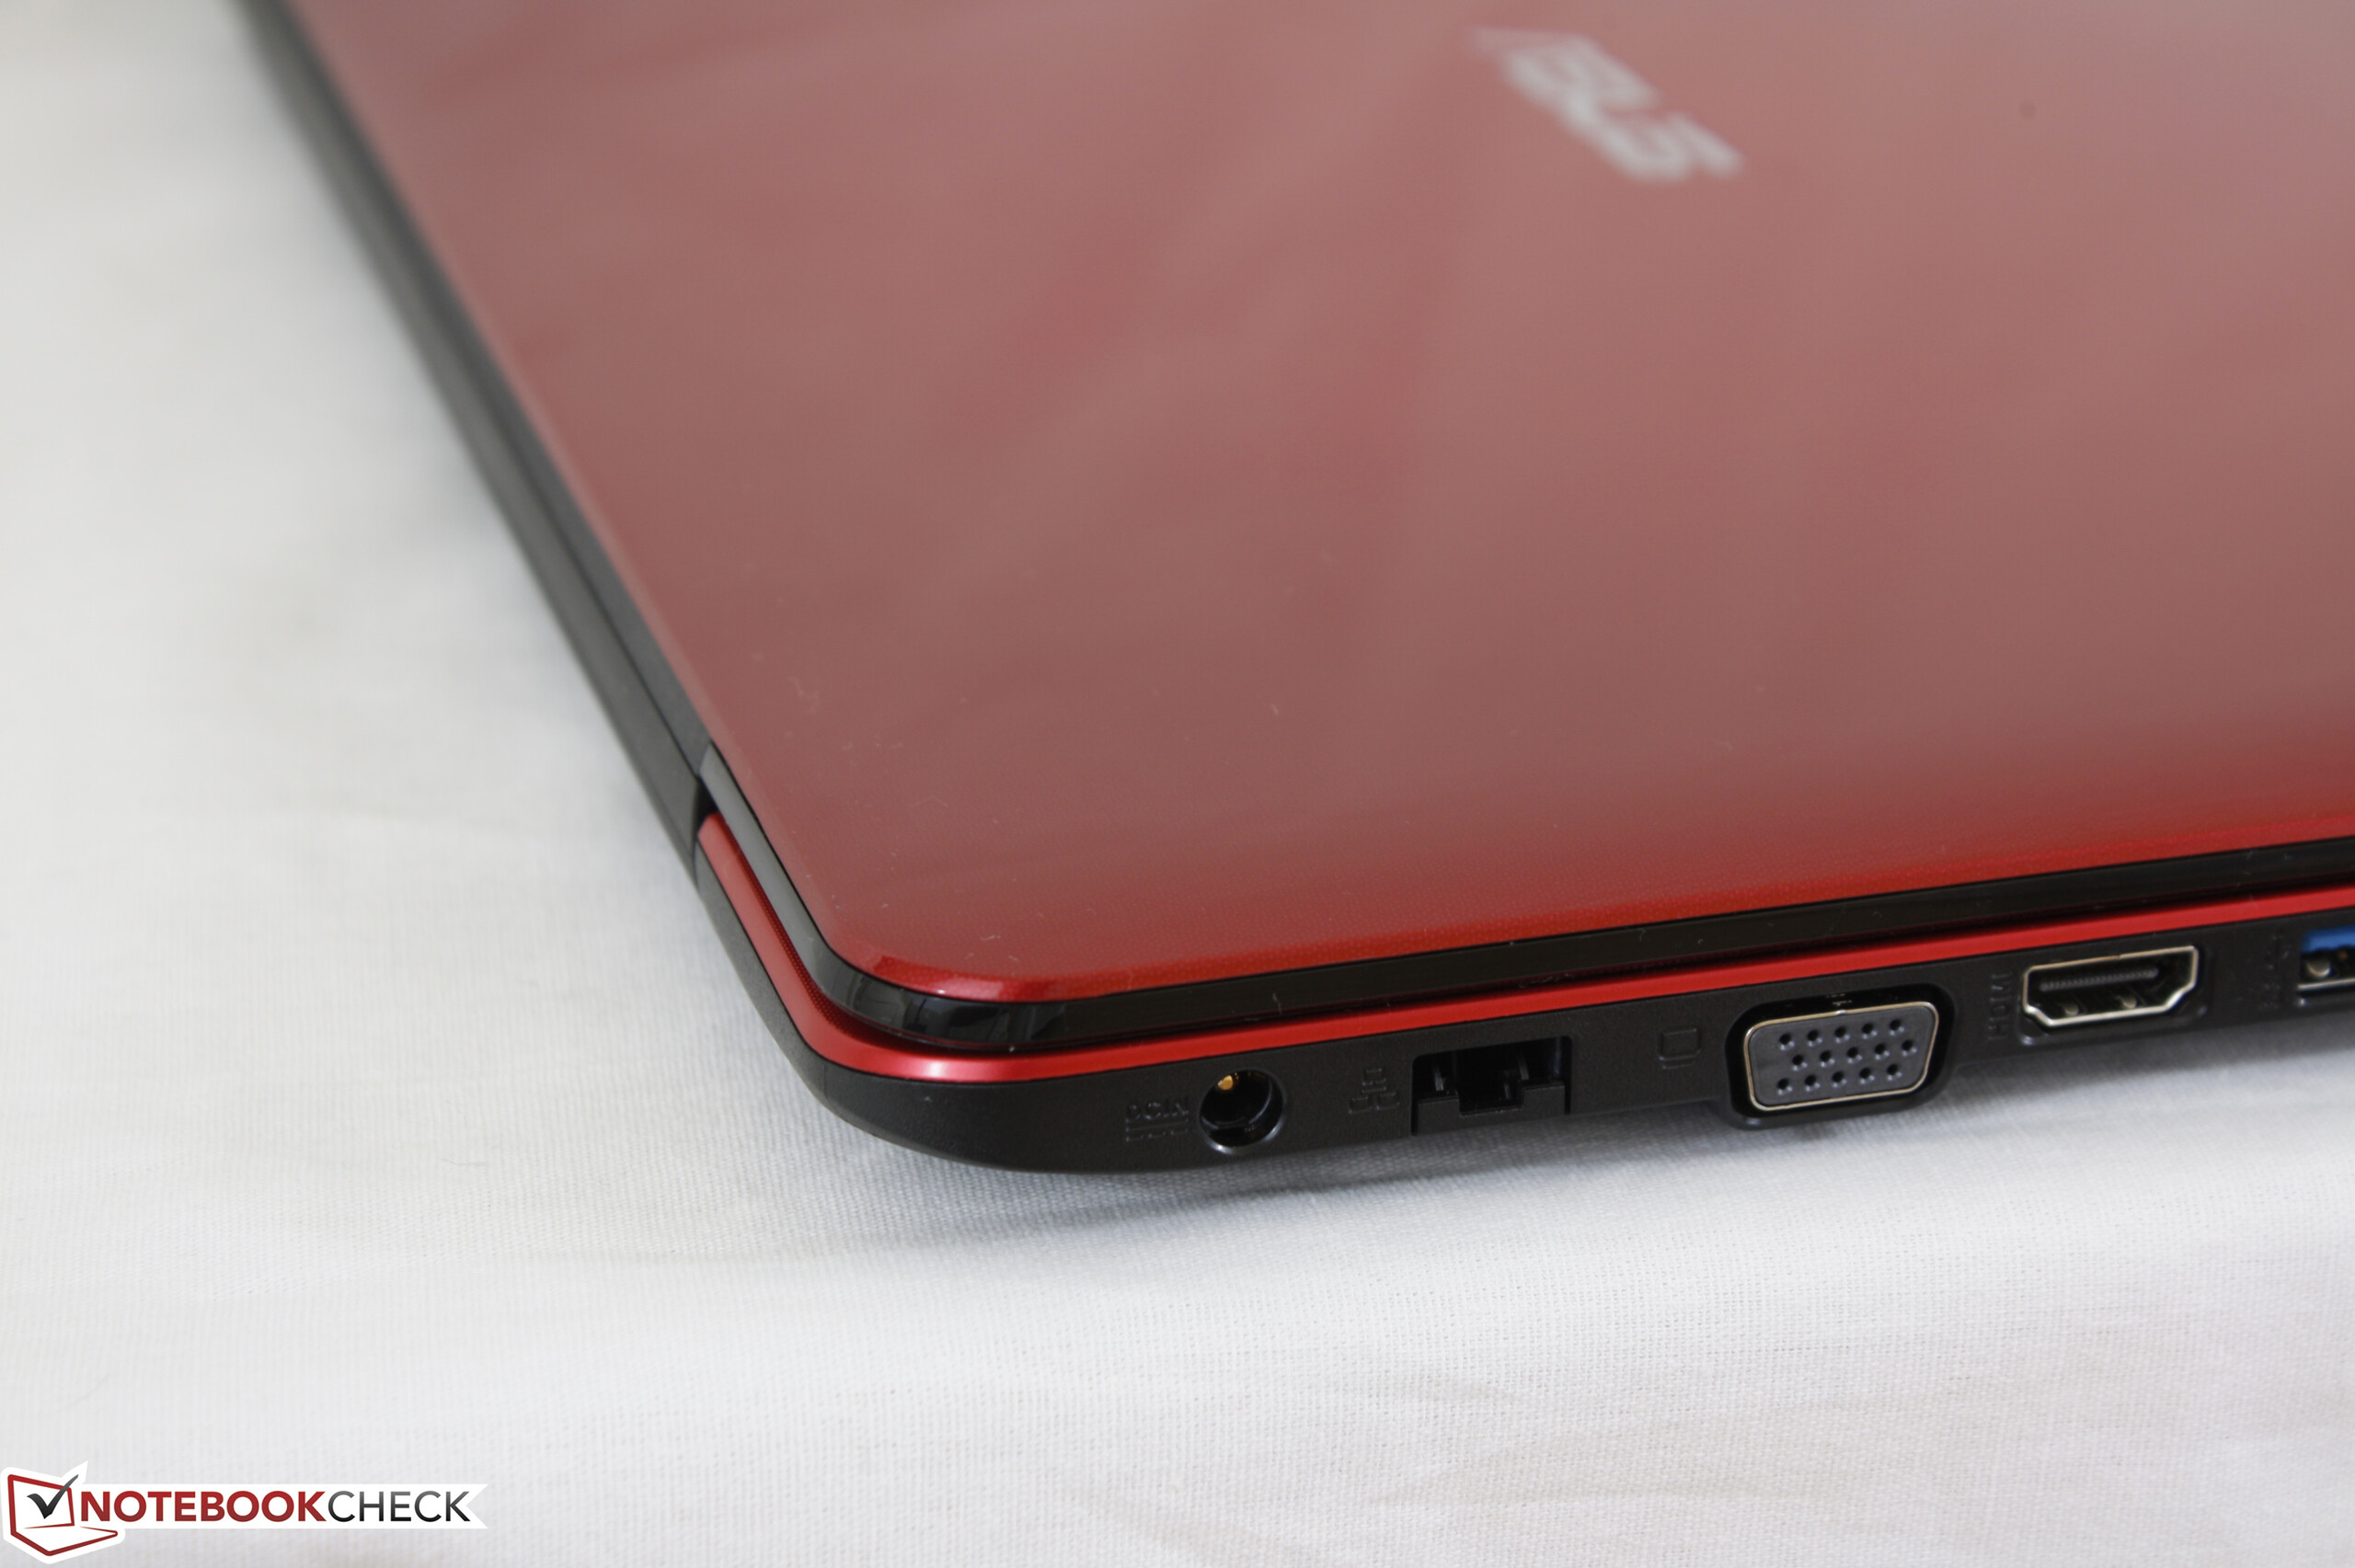
Afgezien van de trage APU van AMD, heeft Asus' eigen hardware ook heel wat problemen. De schermbehuizing en het toetsenbordgedeelte geven te snel mee onder druk en het 1080p TN-scherm geeft kleuren erg slecht weer. Geïnteresseerde gebruikers zijn beter af met de oudere ULV Boadwell- of zelfs Haswell-notebooks dan wat Asus hier te bieden heeft.
Deze notebook mislukt als goedkope PC voor consumenten door zijn korte batterijduur, zwakke scherm en trage prestaties. Alternatieven van Intel van zelfs drie tot vier jaar geleden bieden nog altijd meer waar voor hun geld op bijna alle vlakken.
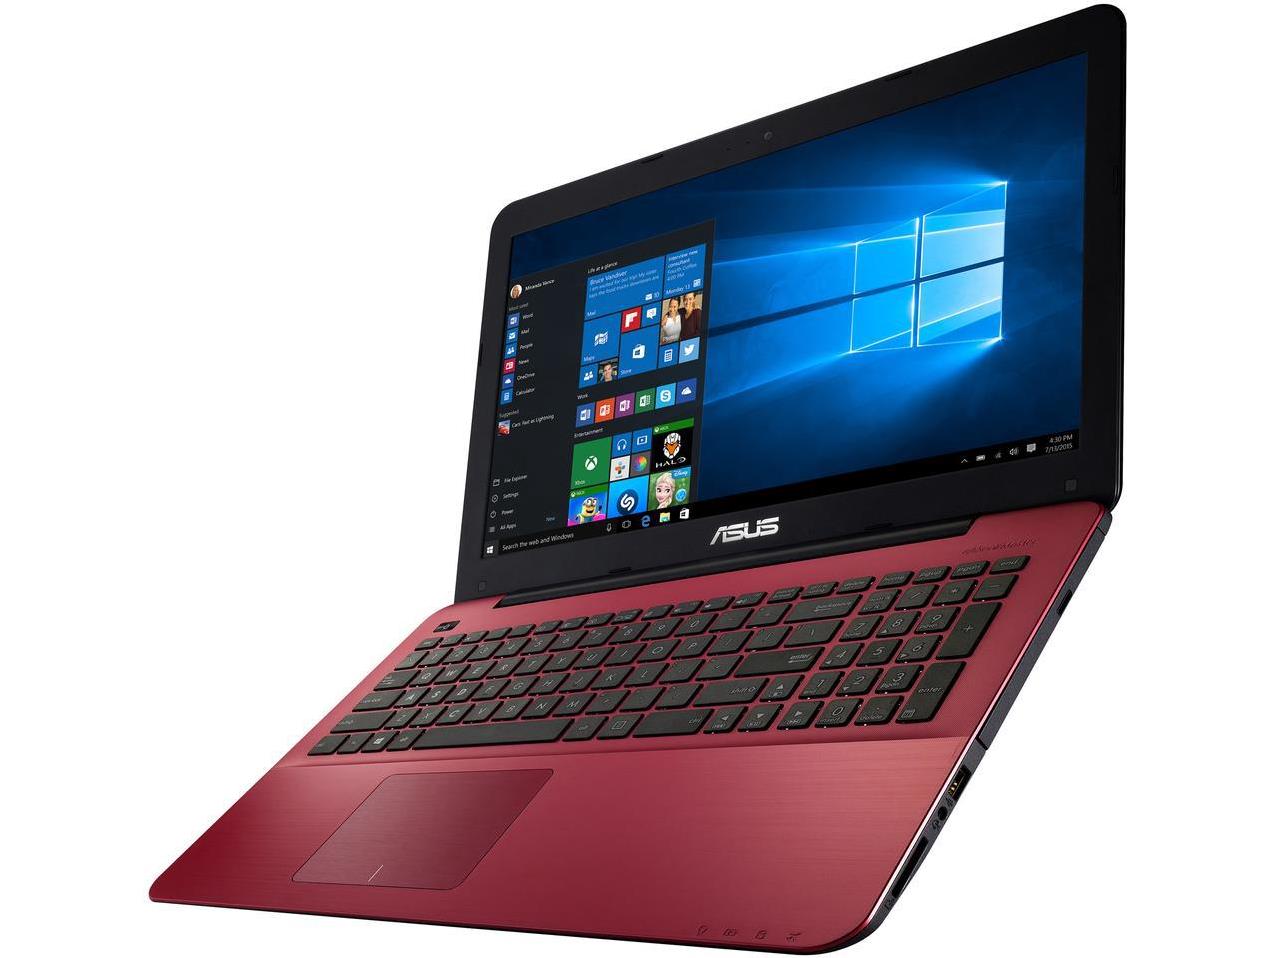
Asus X555DA-BB11
- 13-04-2017 v6 (old)
Allen Ngo
Price comparison
