Kort testrapport Dell Venue 10 Pro (5056) Tablet
Beeldvergelijking
Bekijk een scène en navigeer binnen het eerste beeld. Eén klik wijzigt het zoomniveau. Eén klik op het ingezoomde beeld opent het origineel in een nieuw venster. Het eerste beeld toont de verschaalde foto van het testtoestel.

| |||||||||||||||||||||||||
Helderheidsverdeling: 91 %
Helderheid in Batterij-modus: 365 cd/m²
Contrast: 1521:1 (Zwart: 0.24 cd/m²)
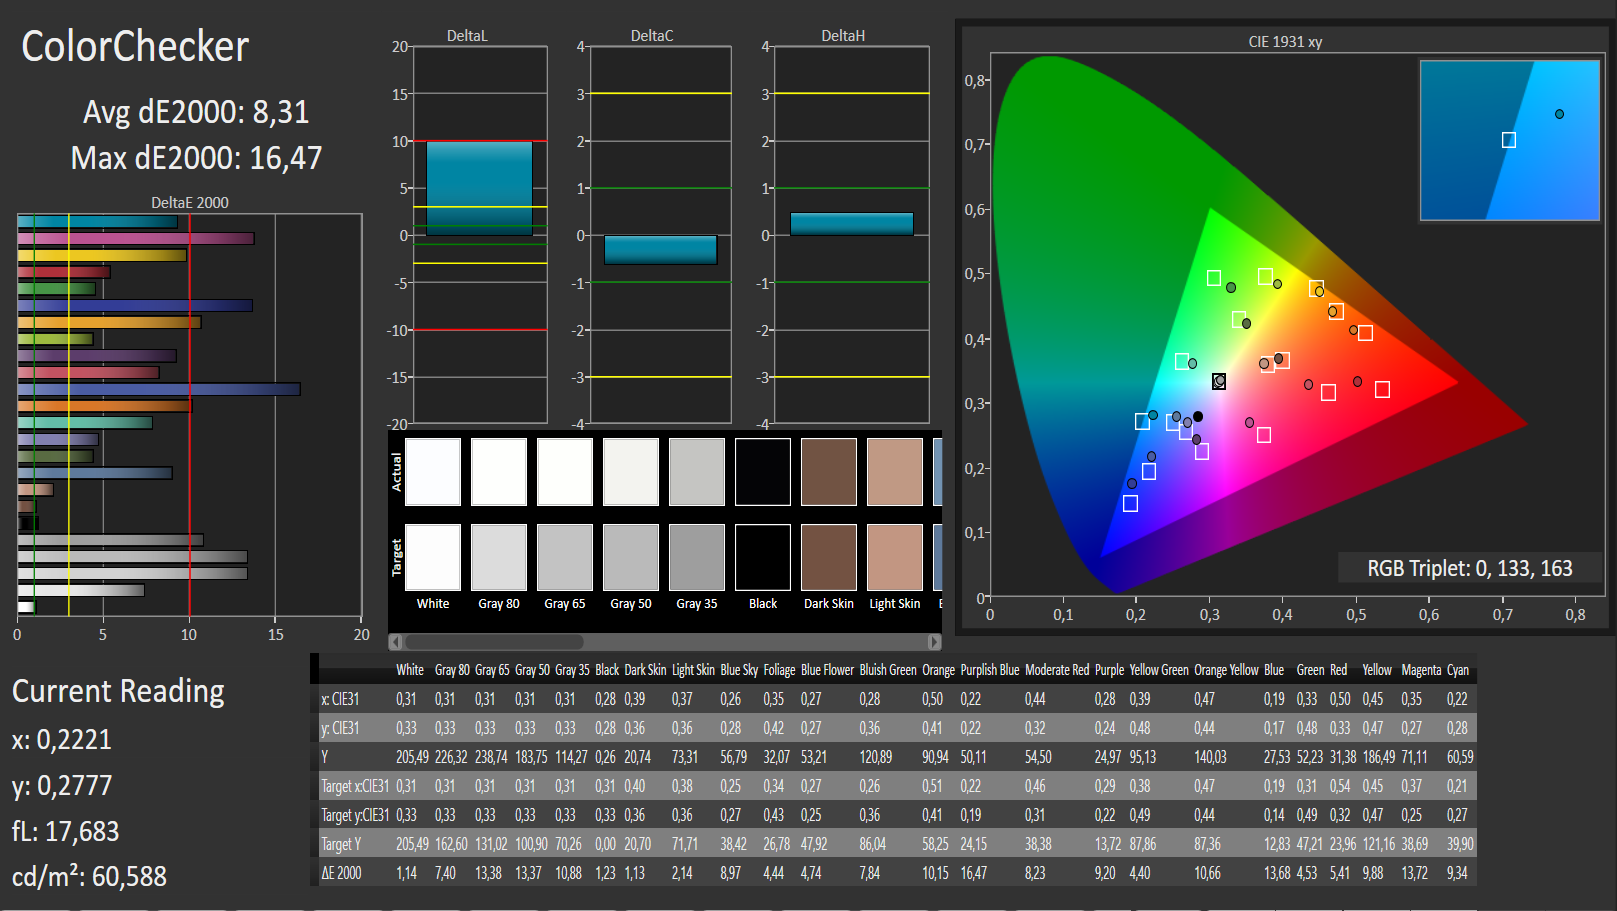
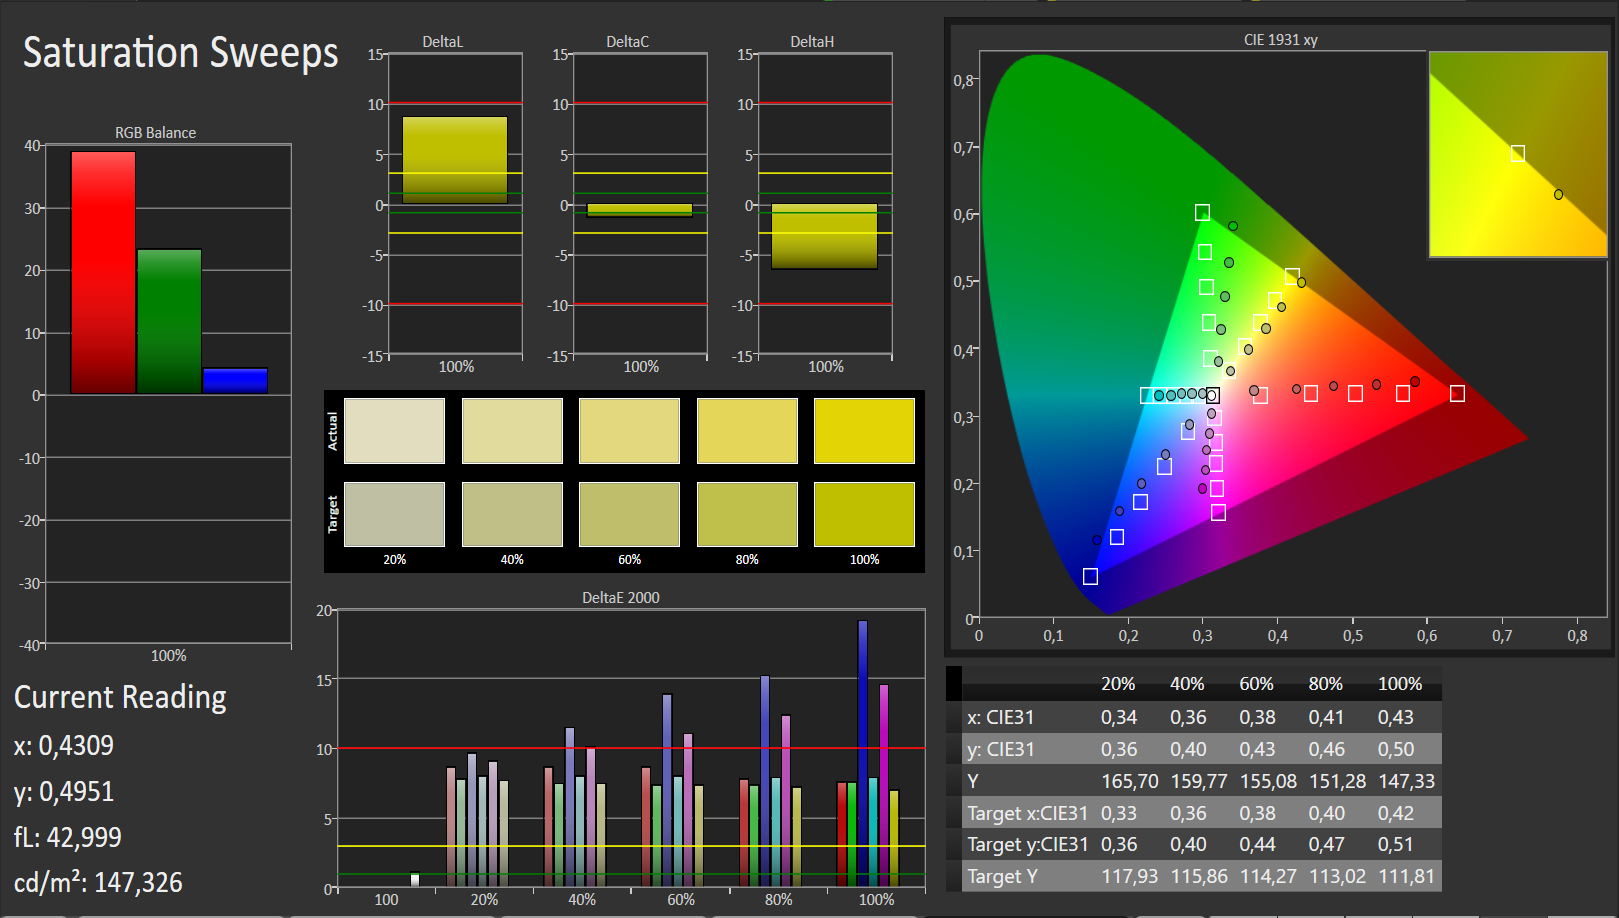
ΔE ColorChecker Calman: 8.31 | ∀{0.5-29.43 Ø4.73}
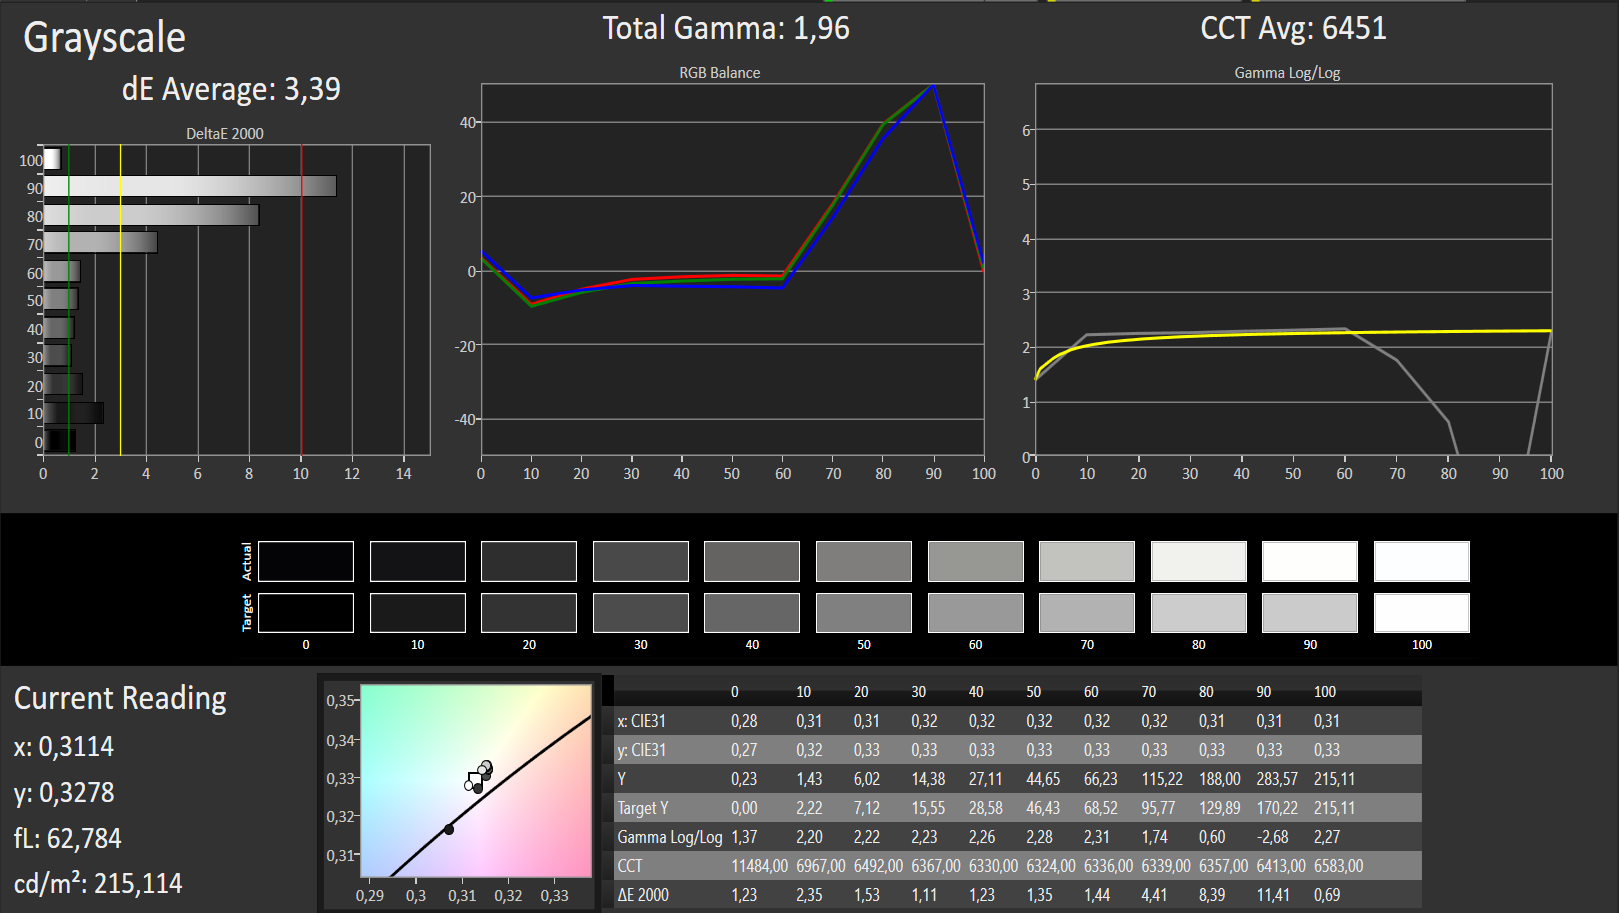
ΔE Greyscale Calman: 3.39 | ∀{0.09-98 Ø4.97}
60% sRGB (Argyll 1.6.3 3D)
38% AdobeRGB 1998 (Argyll 1.6.3 3D)
41.72% AdobeRGB 1998 (Argyll 3D)
60.7% sRGB (Argyll 3D)
40.38% Display P3 (Argyll 3D)
Gamma: 1.96
CCT: 6451 K
Screen Flickering / PWM (Pulse-Width Modulation)
| Screen flickering / PWM niet waargenomen | 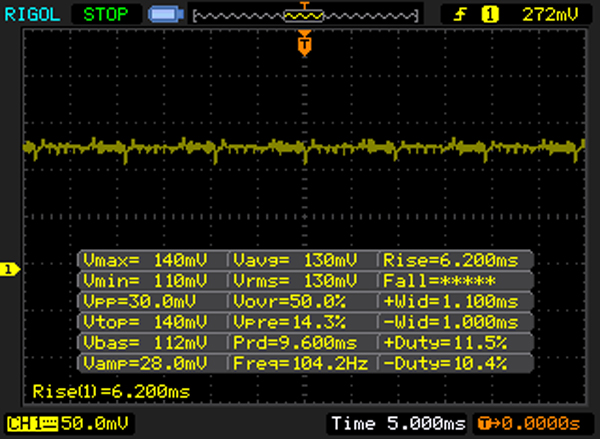 | ||
Ter vergelijking: 52 % van alle geteste toestellen maakten geen gebruik van PWM om de schermhelderheid te verlagen. Als het wel werd gebruikt, werd een gemiddelde van 7798 (minimum: 5 - maximum: 343500) Hz waargenomen. | |||
Responstijd Scherm
| ↔ Responstijd Zwart naar Wit | ||
|---|---|---|
| 26 ms ... stijging ↗ en daling ↘ gecombineerd | ↗ 7 ms stijging | 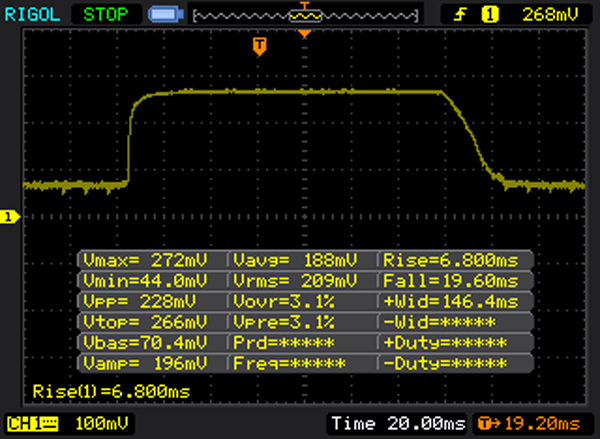 |
| ↘ 19 ms daling | ||
| Het scherm vertoonde relatief trage responstijden in onze tests en is misschien te traag voor games. Ter vergelijking: alle testtoestellen variëren van 0.1 (minimum) tot 240 (maximum) ms. » 62 % van alle toestellen zijn beter. Dit betekent dat de gemeten responstijd slechter is dan het gemiddelde (19.9 ms) van alle geteste toestellen. | ||
| ↔ Responstijd 50% Grijs naar 80% Grijs | ||
| 30 ms ... stijging ↗ en daling ↘ gecombineerd | ↗ 14 ms stijging | 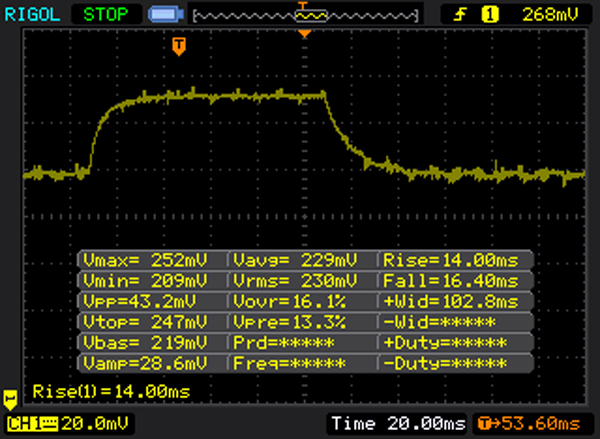 |
| ↘ 16 ms daling | ||
| Het scherm vertoonde trage responstijden in onze tests en is misschien te traag voor games. Ter vergelijking: alle testtoestellen variëren van 0.165 (minimum) tot 636 (maximum) ms. » 40 % van alle toestellen zijn beter. Dit betekent dat de gemeten responstijd vergelijkbaar is met het gemiddelde (31.1 ms) van alle geteste toestellen. | ||
| Dell Venue 10 Pro 5056 IPS, 1920x1200 | Dell Venue 10 Pro 5055 IPS, 1920x1200 | Apple iPad Air 2 2014 IPS, 2048x1536 | Google Pixel C LTPS, 2560x1800 | Lenovo Thinkpad Tablet 10 2nd Gen IPS, 1920x1200 | Amazon Fire HD 10 inch 2015 IPS, 1280x800 | Asus Transformer Book T100HA-C4-GR IPS, 1280x800 | Samsung Galaxy Tab S2 9.7 LTE Super AMOLED, 2048x1536 | Samsung Galaxy Tab A 9.7 SM-T555 TFT, 1024x768 | |
|---|---|---|---|---|---|---|---|---|---|
| Display | 18% | 26% | |||||||
| Display P3 Coverage (%) | 40.38 | 48.01 19% | 52.8 31% | ||||||
| sRGB Coverage (%) | 60.7 | 70.6 16% | 73 20% | ||||||
| AdobeRGB 1998 Coverage (%) | 41.72 | 49.79 19% | 53.3 28% | ||||||
| Response Times | -39% | ||||||||
| Response Time Grey 50% / Grey 80% * (ms) | 30 ? | 42 ? -40% | |||||||
| Response Time Black / White * (ms) | 26 ? | 36 ? -38% | |||||||
| PWM Frequency (Hz) | |||||||||
| Screen | -22% | 8% | -14% | -15% | -7% | 18% | 27% | -17% | |
| Brightness middle (cd/m²) | 365 | 436 19% | 423 16% | 487 33% | 345 -5% | 458 25% | 480.2 32% | 358 -2% | 394 8% |
| Brightness (cd/m²) | 348 | 418 20% | 427 23% | 510 47% | 337 -3% | 434 25% | 455 31% | 357 3% | 392 13% |
| Brightness Distribution (%) | 91 | 92 1% | 92 1% | 91 0% | 94 3% | 86 -5% | 85 -7% | 86 -5% | 80 -12% |
| Black Level * (cd/m²) | 0.24 | 0.58 -142% | 0.61 -154% | 0.39 -63% | 0.43 -79% | 0.43 -79% | 0.324 -35% | 0.51 -113% | |
| Contrast (:1) | 1521 | 752 -51% | 693 -54% | 1249 -18% | 802 -47% | 1065 -30% | 1482 -3% | 773 -49% | |
| Colorchecker dE 2000 * | 8.31 | 5.17 38% | 2.86 66% | 5.24 37% | 5.86 29% | 4.18 50% | 3.45 58% | 1.78 79% | 3.59 57% |
| Colorchecker dE 2000 max. * | 16.47 | ||||||||
| Greyscale dE 2000 * | 3.39 | 4.68 -38% | 2.37 30% | 7.95 -135% | 5.63 -66% | 4.54 -34% | 2.67 21% | 1.38 59% | 4.25 -25% |
| Gamma | 1.96 112% | 2.31 95% | 2.43 91% | 2.16 102% | 2.33 94% | 2.15 102% | 2.34 94% | 2.24 98% | 2.56 86% |
| CCT | 6451 101% | 6652 98% | 6941 94% | 6565 99% | 6533 99% | 7083 92% | 6164 105% | 6366 102% | 7148 91% |
| Color Space (Percent of AdobeRGB 1998) (%) | 38 | 88 132% | 45.7 20% | 47.28 24% | |||||
| Color Space (Percent of sRGB) (%) | 60 | 70.1 17% | 84.38 41% | ||||||
| Totaal Gemiddelde (Programma / Instellingen) | -22% /
-22% | 8% /
8% | -27% /
-20% | 2% /
-6% | -7% /
-7% | 22% /
20% | 27% /
27% | -17% /
-17% |
* ... kleiner is beter
| Cinebench R10 | |
| Rendering Multiple CPUs 32Bit (sorteer op waarde) | |
| Dell Venue 10 Pro 5056 | |
| Dell Venue 10 Pro 5055 | |
| HP Pro Tablet 10 EE G1 | |
| Lenovo Thinkpad Tablet 10 2nd Gen | |
| Asus Transformer Book T100HA-C4-GR | |
| Rendering Single 32Bit (sorteer op waarde) | |
| Dell Venue 10 Pro 5056 | |
| Dell Venue 10 Pro 5055 | |
| HP Pro Tablet 10 EE G1 | |
| Lenovo Thinkpad Tablet 10 2nd Gen | |
| Asus Transformer Book T100HA-C4-GR | |
| Geekbench 3 | |
| 32 Bit Single-Core Score (sorteer op waarde) | |
| Dell Venue 10 Pro 5056 | |
| HP Pro Tablet 10 EE G1 | |
| LG G Pad II 10.1 | |
| Amazon Fire HD 10 inch 2015 | |
| Samsung Galaxy Tab A 9.7 SM-T555 | |
| 32 Bit Multi-Core Score (sorteer op waarde) | |
| Dell Venue 10 Pro 5056 | |
| HP Pro Tablet 10 EE G1 | |
| LG G Pad II 10.1 | |
| Amazon Fire HD 10 inch 2015 | |
| Samsung Galaxy Tab A 9.7 SM-T555 | |
| JetStream 1.1 - 1.1 Total (sorteer op waarde) | |
| Dell Venue 10 Pro 5056 | |
| HP Pro Tablet 10 EE G1 | |
| Google Pixel C | |
| Lenovo Yoga Tab 3 Pro 10 YT3-X90L | |
| Samsung Galaxy Tab S2 9.7 LTE | |
| Peacekeeper - --- (sorteer op waarde) | |
| Dell Venue 10 Pro 5056 | |
| Dell Venue 10 Pro 5055 | |
| HP Pro Tablet 10 EE G1 | |
| Apple iPad Air 2 2014 | |
| Browsermark - 2.1 (sorteer op waarde) | |
| Dell Venue 10 Pro 5056 | |
| Apple iPad Air 2 2014 | |
| Google Pixel C | |
* ... kleiner is beter
| 3DMark 11 - 1280x720 Performance (sorteer op waarde) | |
| Dell Venue 10 Pro 5056 | |
| Dell Venue 10 Pro 5055 | |
| HP Pro Tablet 10 EE G1 | |
| Lenovo Thinkpad Tablet 10 2nd Gen | |
| Asus Transformer Book T100HA-C4-GR | |
| 3DMark - 1280x720 Ice Storm Standard Score (sorteer op waarde) | |
| Dell Venue 10 Pro 5056 | |
| HP Pro Tablet 10 EE G1 | |
| Google Pixel C | |
| Lenovo Thinkpad Tablet 10 2nd Gen | |
| Asus Transformer Book T100HA-C4-GR | |
| 3DMark 06 - 1280x1024 Standard Score AA:0x AF:0x (sorteer op waarde) | |
| Dell Venue 10 Pro 5056 | |
| Asus Transformer Book T100HA-C4-GR | |
| GFXBench | |
| on screen Car Chase Onscreen (sorteer op waarde) | |
| Dell Venue 10 Pro 5056 | |
| Google Pixel C | |
| Lenovo Yoga Tab 3 Pro 10 YT3-X90L | |
| 1920x1080 Car Chase Offscreen (sorteer op waarde) | |
| Dell Venue 10 Pro 5056 | |
| Google Pixel C | |
| Lenovo Yoga Tab 3 Pro 10 YT3-X90L | |
| GFXBench 3.1 | |
| on screen Manhattan ES 3.1 Onscreen (sorteer op waarde) | |
| Dell Venue 10 Pro 5056 | |
| Apple iPad Air 2 2014 | |
| Google Pixel C | |
| Amazon Fire HD 10 inch 2015 | |
| Lenovo Yoga Tab 3 Pro 10 YT3-X90L | |
| 1920x1080 Manhattan ES 3.1 Offscreen (sorteer op waarde) | |
| Dell Venue 10 Pro 5056 | |
| Apple iPad Air 2 2014 | |
| Google Pixel C | |
| Amazon Fire HD 10 inch 2015 | |
| Lenovo Yoga Tab 3 Pro 10 YT3-X90L | |
| GFXBench 3.0 | |
| on screen Manhattan Onscreen OGL (sorteer op waarde) | |
| Dell Venue 10 Pro 5056 | |
| Apple iPad Air 2 2014 | |
| Google Pixel C | |
| LG G Pad II 10.1 | |
| Amazon Fire HD 10 inch 2015 | |
| Lenovo Yoga Tab 3 Pro 10 YT3-X90L | |
| 1920x1080 1080p Manhattan Offscreen (sorteer op waarde) | |
| Dell Venue 10 Pro 5056 | |
| Apple iPad Air 2 2014 | |
| Google Pixel C | |
| LG G Pad II 10.1 | |
| Amazon Fire HD 10 inch 2015 | |
| Lenovo Yoga Tab 3 Pro 10 YT3-X90L | |
| lage | gem. | hoge | ultra | |
|---|---|---|---|---|
| Trackmania Nations Forever (2008) | 128 | 29.2 | 16.8 | |
| Tomb Raider (2013) | 25.7 | 12 | 8.3 | 3.7 |
| BioShock Infinite (2013) | 20.1 | 9.3 | 7.6 | 2.4 |
| Dragon Age: Inquisition (2014) | 9.5 | 5.7 | ||
| Dirt Rally (2015) | 20.1 | 12.5 | ||
| Metal Gear Solid V (2015) | 15.1 | 9.8 | ||
| Anno 2205 (2015) | 8.1 | 3.9 | ||
| Star Wars Battlefront (2015) | 8.8 | 4.8 | ||
| Rainbow Six Siege (2015) | 11.5 | 7 |
(±) De maximumtemperatuur aan de bovenzijde bedraagt 42.2 °C / 108 F, vergeleken met het gemiddelde van 33.6 °C / 92 F, variërend van 20.7 tot 53.2 °C voor de klasse Tablet.
(-) De bodem warmt op tot een maximum van 50.2 °C / 122 F, vergeleken met een gemiddelde van 33.2 °C / 92 F
(+) Bij onbelast gebruik bedraagt de gemiddelde temperatuur voor de bovenzijde 28.6 °C / 83 F, vergeleken met het apparaatgemiddelde van 30 °C / 86 F.
| Dell Venue 10 Pro 5056 Z8500, HD Graphics (Cherry Trail) | Dell Venue 10 Pro 5055 Z3735F, HD Graphics (Bay Trail) | HP Pro Tablet 10 EE G1 Z3735F, HD Graphics (Bay Trail) | Apple iPad Air 2 2014 A8X, PowerVR GXA6850 | Google Pixel C X1, Tegra X1 Maxwell GPU | Lenovo Thinkpad Tablet 10 2nd Gen Z8700, HD Graphics (Cherry Trail) | Amazon Fire HD 10 inch 2015 MT8135, PowerVR G6200 | Asus Transformer Book T100HA-C4-GR Z8500, HD Graphics (Cherry Trail) | Samsung Galaxy Tab S2 9.7 LTE Exynos 5433, Mali-T760 MP6 | Samsung Galaxy Tab A 9.7 SM-T555 410 APQ8016, Adreno 306 | |
|---|---|---|---|---|---|---|---|---|---|---|
| Heat | -8% | 6% | 9% | 11% | -1% | 23% | 22% | 12% | 11% | |
| Maximum Upper Side * (°C) | 42.2 | 43.6 -3% | 39 8% | 36.2 14% | 42.3 -0% | 51 -21% | 30.4 28% | 35.2 17% | 40.8 3% | 37 12% |
| Maximum Bottom * (°C) | 50.2 | 47.6 5% | 44.9 11% | 42.8 15% | 36 28% | 55 -10% | 30.2 40% | 33.4 33% | 35.7 29% | 36.9 26% |
| Idle Upper Side * (°C) | 34.1 | 38 -11% | 31.1 9% | 31 9% | 31.8 7% | 27.1 21% | 29.8 13% | 27.6 19% | 31.2 9% | 33.7 1% |
| Idle Bottom * (°C) | 31.2 | 37.8 -21% | 33 -6% | 32 -3% | 28 10% | 29 7% | 28 10% | 25.8 17% | 29.1 7% | 29.8 4% |
* ... kleiner is beter
| Uit / Standby | |
| Inactief | |
| Belasting |
|
Key:
min: | |
| Dell Venue 10 Pro 5056 Z8500, HD Graphics (Cherry Trail) | Dell Venue 10 Pro 5055 Z3735F, HD Graphics (Bay Trail) | HP Pro Tablet 10 EE G1 Z3735F, HD Graphics (Bay Trail) | Apple iPad Air 2 2014 A8X, PowerVR GXA6850 | Google Pixel C X1, Tegra X1 Maxwell GPU | Lenovo Thinkpad Tablet 10 2nd Gen Z8700, HD Graphics (Cherry Trail) | Amazon Fire HD 10 inch 2015 MT8135, PowerVR G6200 | Samsung Galaxy Tab S2 9.7 LTE Exynos 5433, Mali-T760 MP6 | Samsung Galaxy Tab A 9.7 SM-T555 410 APQ8016, Adreno 306 | |
|---|---|---|---|---|---|---|---|---|---|
| Power Consumption | 12% | 5% | 28% | 22% | 11% | 48% | 23% | 44% | |
| Idle Minimum * (Watt) | 3.2 | 2.8 13% | 3.5 -9% | 1.2 63% | 1.82 43% | 2.4 25% | 1.24 61% | 2.3 28% | 1.1 66% |
| Idle Average * (Watt) | 6 | 5.4 10% | 5.5 8% | 5.1 15% | 4.26 29% | 5.1 15% | 3.81 36% | 4.5 25% | 3.6 40% |
| Idle Maximum * (Watt) | 6.2 | 5.5 11% | 5.7 8% | 5.4 13% | 4.33 30% | 6 3% | 3.92 37% | 5 19% | 3.9 37% |
| Load Average * (Watt) | 14.5 | 10.9 25% | 10.7 26% | 7.9 46% | 9.82 32% | 14.7 -1% | 5.94 59% | 9.4 35% | 6.8 53% |
| Load Maximum * (Watt) | 11.2 | 11.1 1% | 12.2 -9% | 11.1 1% | 13.99 -25% | 5.94 47% | 10.4 7% | 8.4 25% |
* ... kleiner is beter
| Dell Venue 10 Pro 5056 32 Wh | Dell Venue 10 Pro 5055 32 Wh | Apple iPad Air 2 2014 28 Wh | Google Pixel C 34 Wh | Lenovo Thinkpad Tablet 10 2nd Gen 32 Wh | Amazon Fire HD 10 inch 2015 Wh | Lenovo Yoga Tab 3 Pro 10 YT3-X90L 23 Wh | Asus Transformer Book T100HA-C4-GR 30 Wh | Samsung Galaxy Tab S2 9.7 LTE 22 Wh | Samsung Galaxy Tab A 9.7 SM-T555 Wh | |
|---|---|---|---|---|---|---|---|---|---|---|
| Batterijduur | -24% | 29% | 73% | 17% | 16% | 43% | 36% | 21% | 126% | |
| Reader / Idle (h) | 14.5 | 11.3 -22% | 22.7 57% | 34.8 140% | 14.4 -1% | 19 31% | 21 45% | 24.3 68% | 15.3 6% | 49.2 239% |
| H.264 (h) | 7.4 | 9.4 27% | 12.3 66% | 9.1 23% | 10.4 41% | 10.7 45% | 10.9 47% | |||
| WiFi v1.3 (h) | 7.5 | 10.6 41% | 7.5 0% | 7.5 0% | 9.3 24% | 9 20% | 6.6 -12% | 14.4 92% | ||
| Load (h) | 3.4 | 2.5 -26% | 3.5 3% | 4.9 44% | 5 47% | 3.1 -9% | 5.4 59% | 4.1 21% | 4.9 44% | 5 47% |
| WiFi (h) | 4.2 | 10.5 |
Pro
Contra
Dit is een verkorte versie van het originele artikel. Het volledige Engelse testrapport vind je hier.
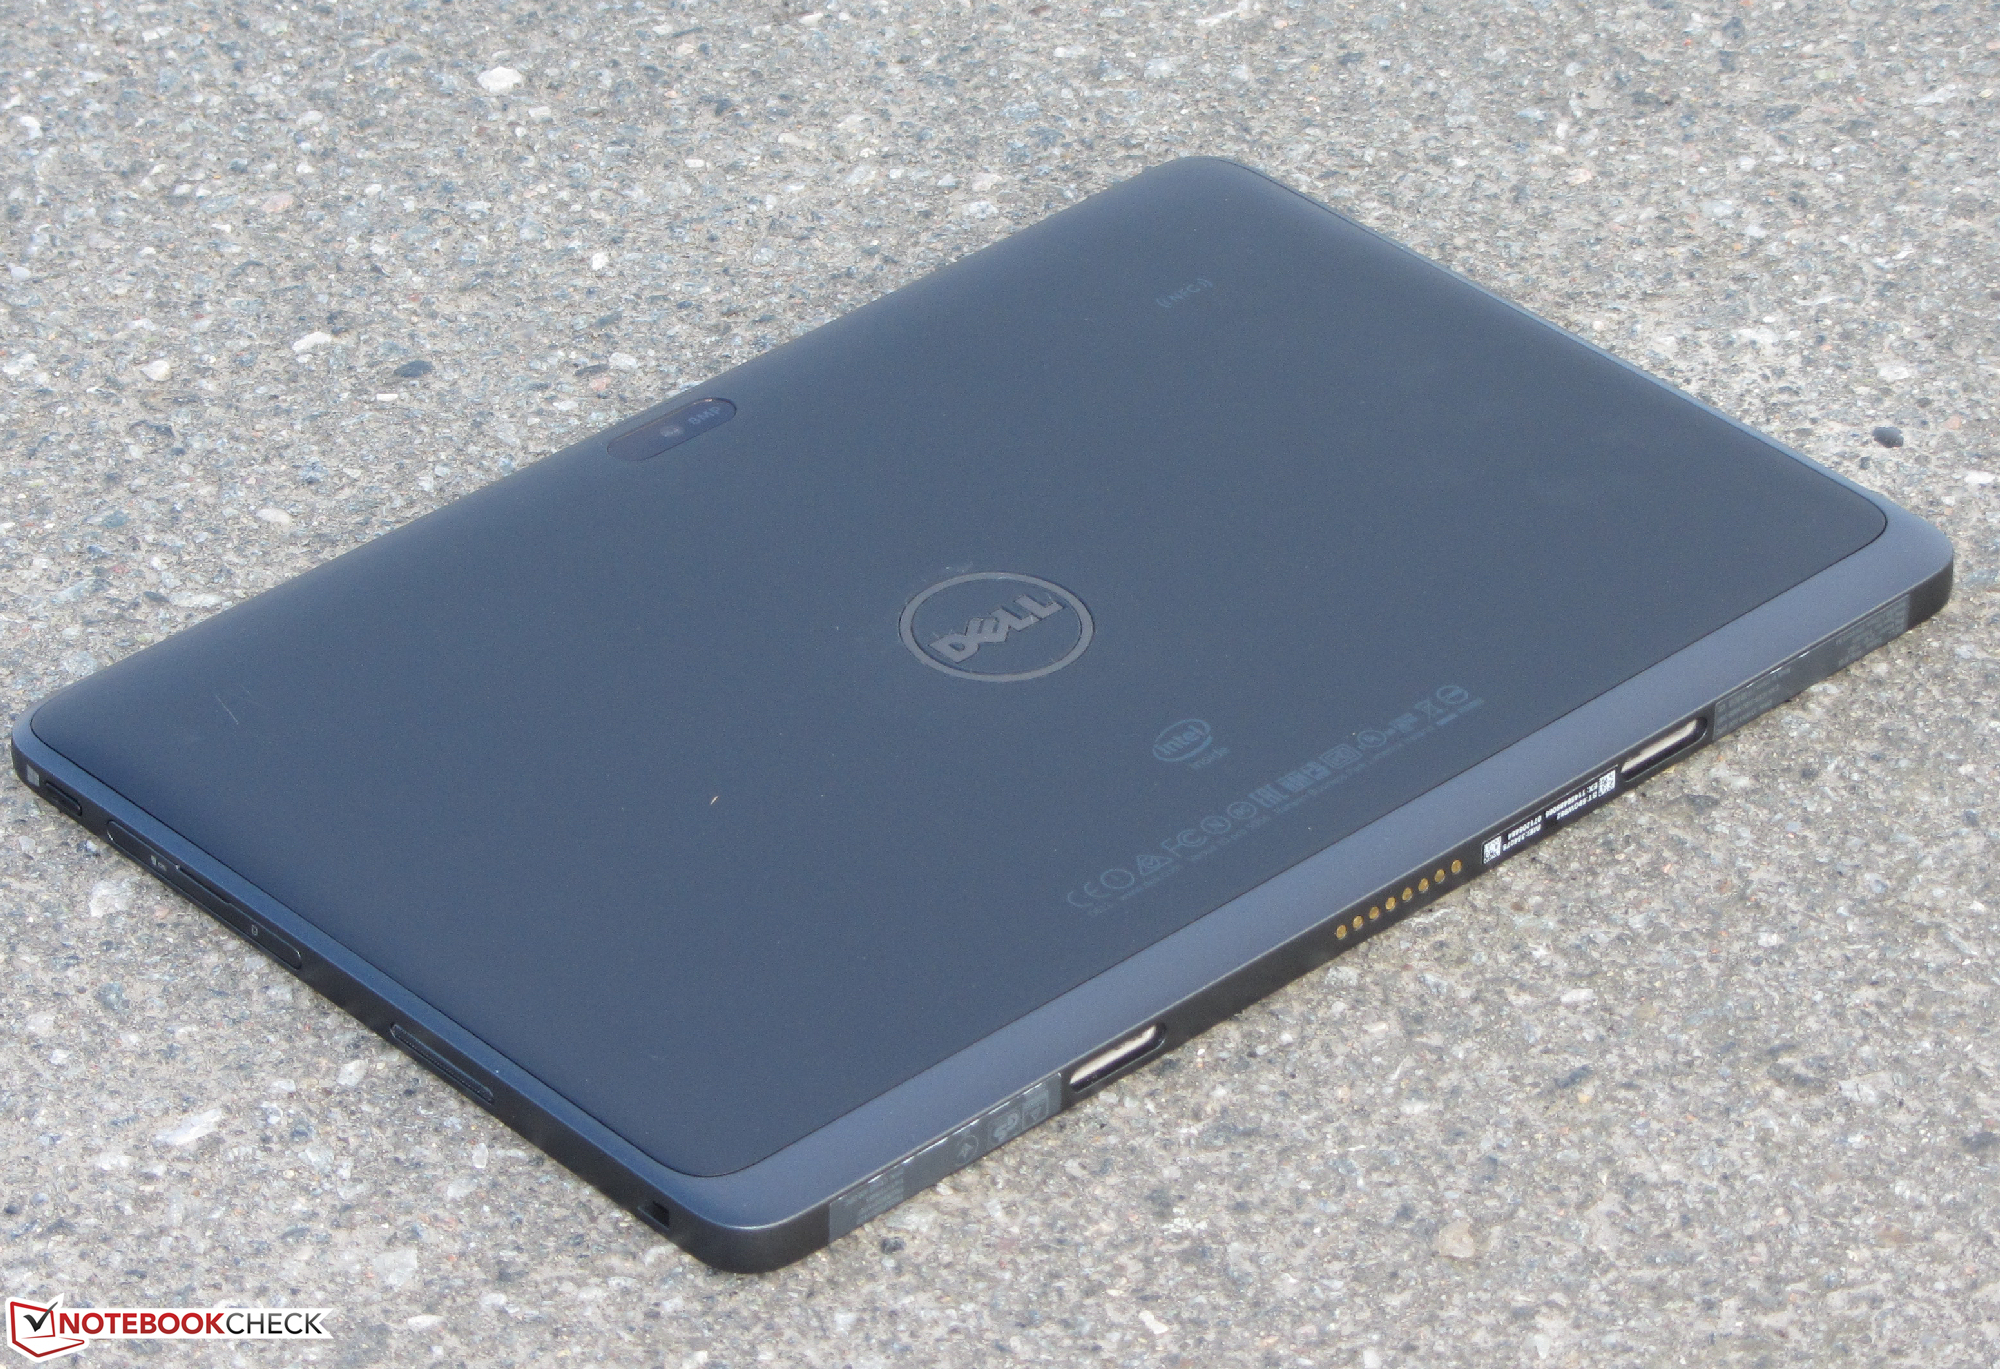
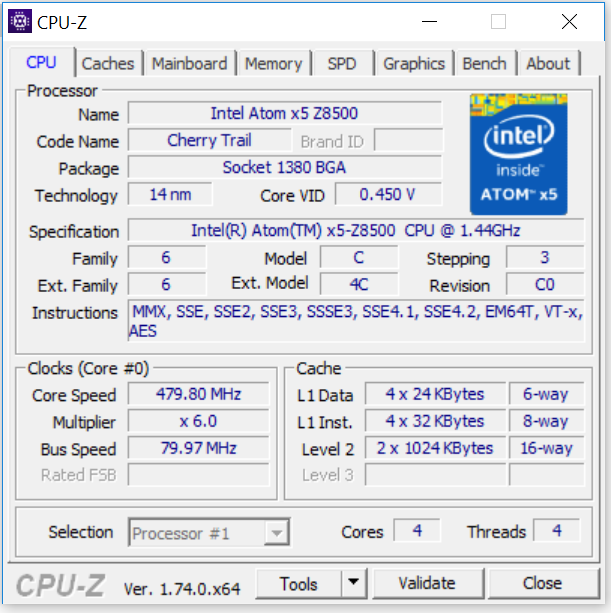
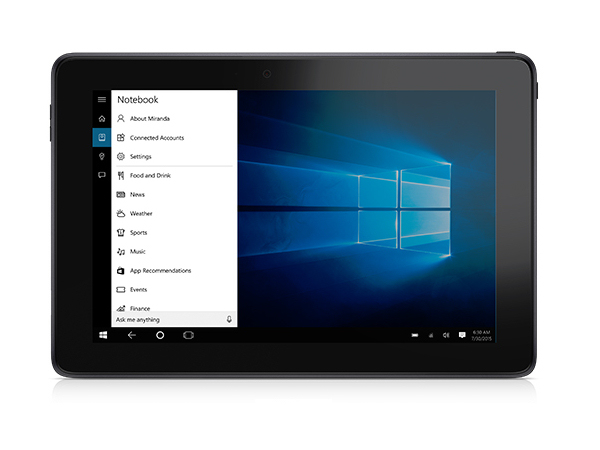
Dell's Venue 10 Pro is een solide 10.1-inch Windows tablet. Net als alle Windows tablets maakt de Venue het mogelijk voor de gebruiker om normale desktop applicaties te installeren en te gebruiken. De CPU kan slechts simpele taken zoals tekstverwerken en webbrowsen aan. De 128 GB eMMC flash drive biedt voldoende opslag. We waarderen ook het heldere IPS-beeldscherm met hoog contrast - hoewel het beeldscherm van de Venue Pro 5055 een stuk helderder was. De batterijlevensduur ruim voldoende.
Het karige design maakt geen twijfel mogelijk; dit is primair een zakelijk apparaat. Het gewicht van 662g is verhoudingsgewijs zwaar. Met het optionele toetsenbord dock, weegt de Venue bijna 1300g - hetzelfde als sommige vergelijkbare netbooks en subnotebooks.
Met een prijs van 800 EUR is de Venue 10 Pro niet echt een koopje.
Voor de gemiddelde consument is de Venue niet echt een interessante keuze. Dat geldt zelfs voor het instapmodel van 530 EUR (~$600). Netbooks of consumenten tablets zijn een kosteneffectiever alternatief.
Dell Venue 10 Pro 5056
- 18-04-2016 v5.1 (old)
Sascha Mölck
Price comparison
