Kort testrapport Apple iPad Air (2019) Tablet


| |||||||||||||||||||||||||
Helderheidsverdeling: 90 %
Helderheid in Batterij-modus: 515 cd/m²
Contrast: 1256:1 (Zwart: 0.41 cd/m²)
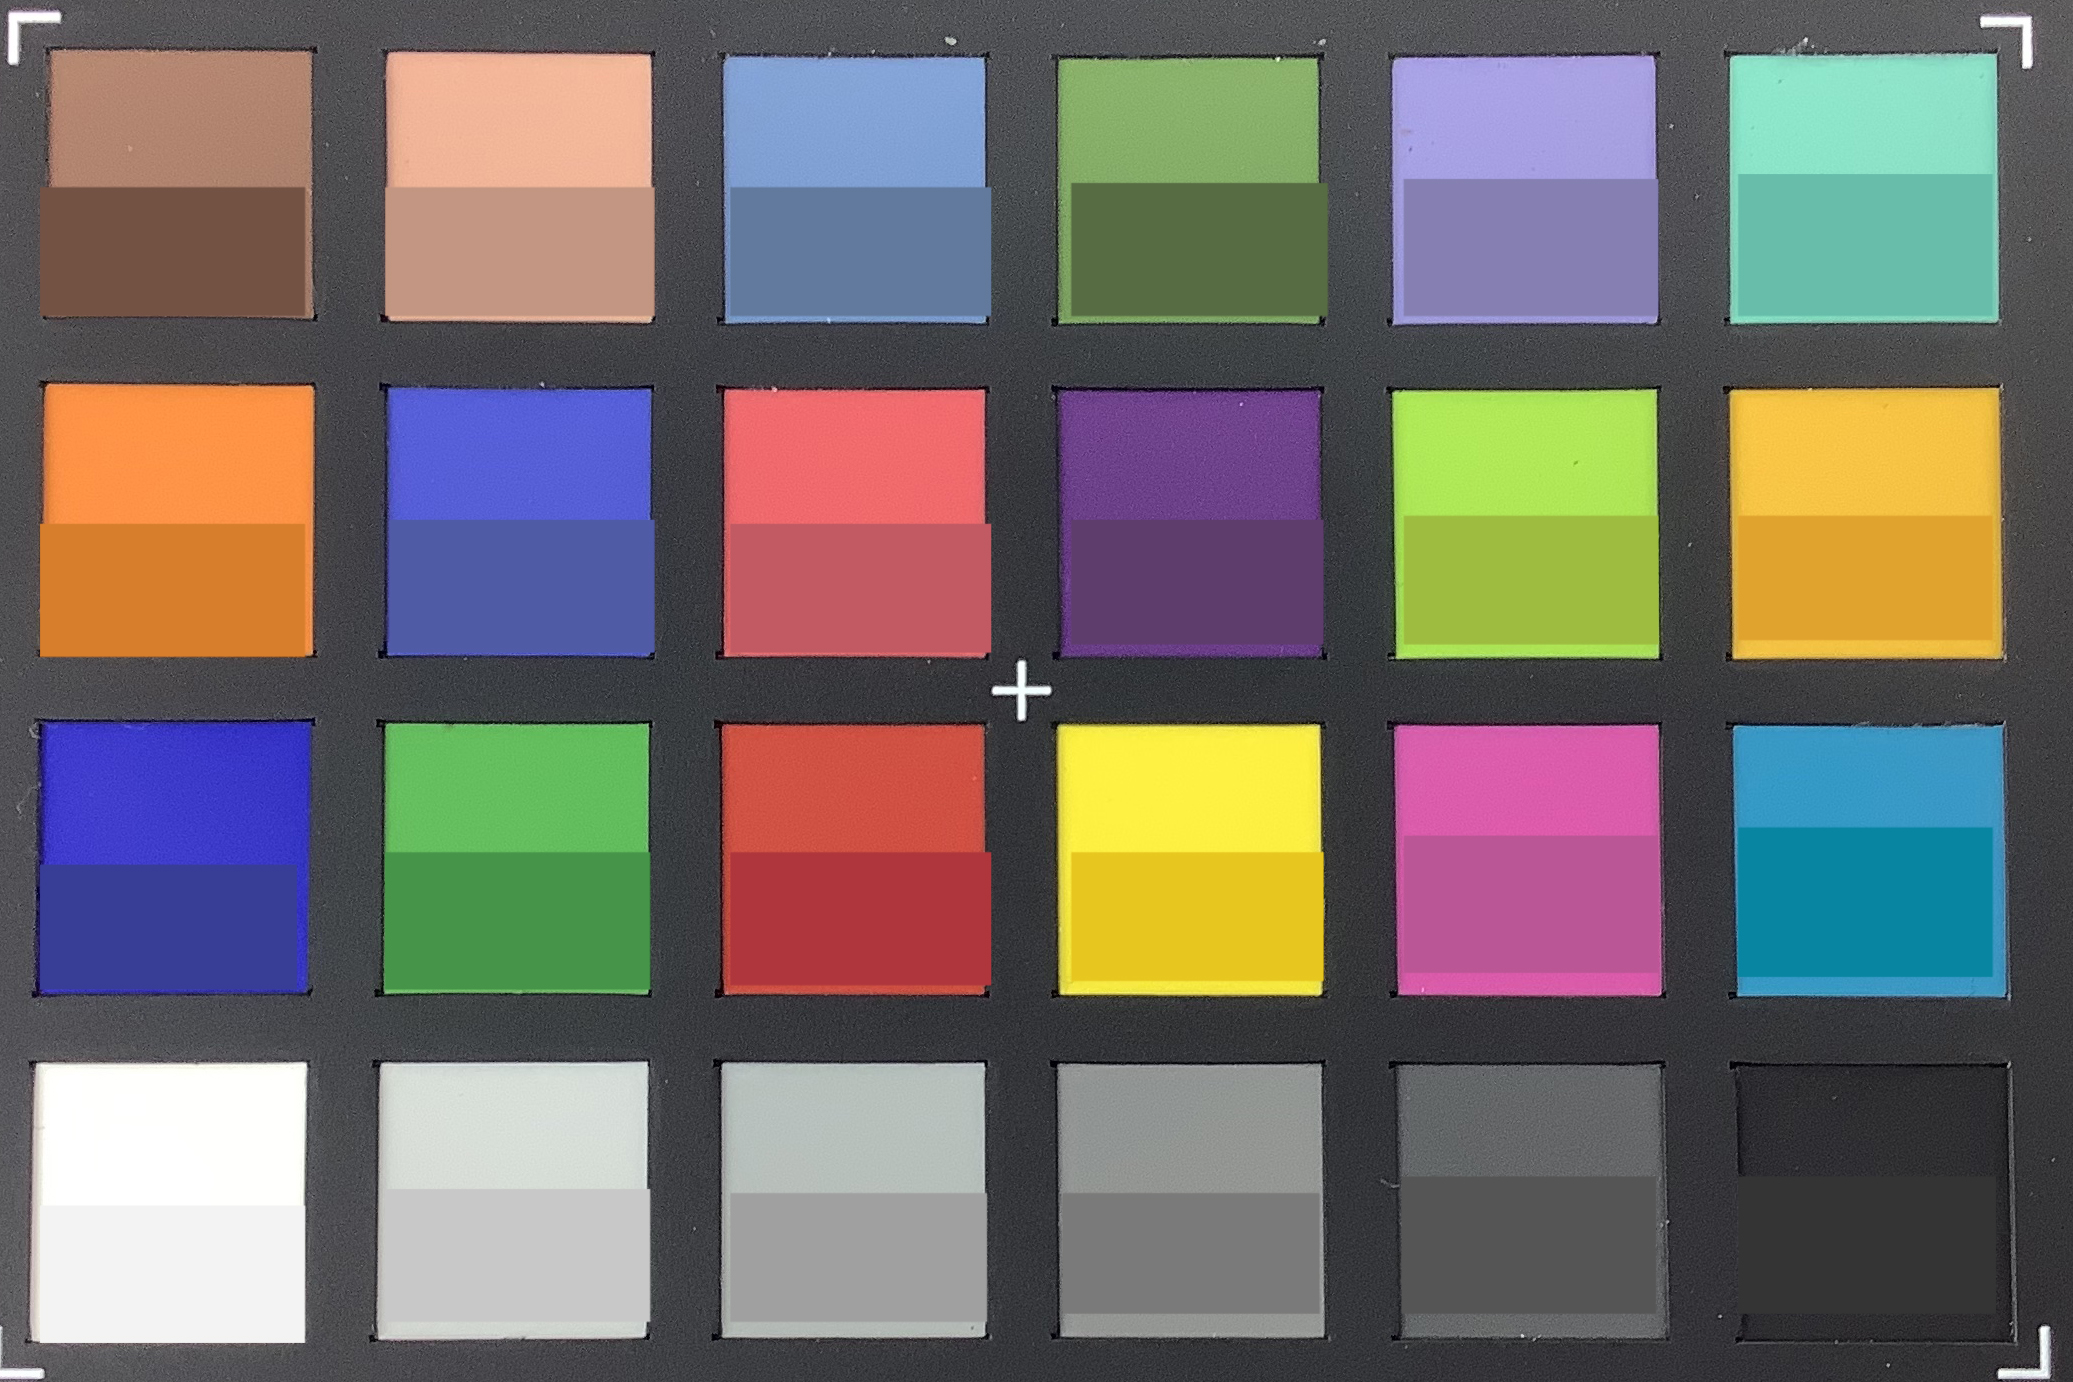
ΔE ColorChecker Calman: 1.6 | ∀{0.5-29.43 Ø4.71}
ΔE Greyscale Calman: 2.8 | ∀{0.09-98 Ø4.96}
99.7% sRGB (Calman 2D)
Gamma: 2.21
CCT: 6944 K
| Apple iPad Air 3 2019 IPS, 2224x1668, 10.5" | Apple iPad Air 2 2014 IPS, 2048x1536, 9.7" | Apple iPad 6 2018 IPS, 2048x1536, 9.7" | Apple iPad Pro 10.5 2017 IPS, 2224x1668, 10.5" | Huawei MediaPad M5 10.8 Pro IPS, 2560x1600, 10.8" | Samsung Galaxy Tab S4 Super AMOLED, 2560x1600, 10.5" | |
|---|---|---|---|---|---|---|
| Screen | -27% | 6% | 9% | -112% | -12% | |
| Brightness middle (cd/m²) | 515 | 423 -18% | 530 3% | 634 23% | 384 -25% | 474 -8% |
| Brightness (cd/m²) | 483 | 427 -12% | 513 6% | 625 29% | 360 -25% | 477 -1% |
| Brightness Distribution (%) | 90 | 92 2% | 92 2% | 87 -3% | 84 -7% | 91 1% |
| Black Level * (cd/m²) | 0.41 | 0.61 -49% | 0.61 -49% | 0.39 5% | 0.8 -95% | |
| Contrast (:1) | 1256 | 693 -45% | 869 -31% | 1626 29% | 480 -62% | |
| Colorchecker dE 2000 * | 1.6 | 2.86 -79% | 1.2 25% | 1.9 -19% | 6.83 -327% | 2.5 -56% |
| Colorchecker dE 2000 max. * | 4.4 | 3.2 27% | 3.9 11% | 12.7 -189% | 5.8 -32% | |
| Greyscale dE 2000 * | 2.8 | 2.37 15% | 1 64% | 2.8 -0% | 7.5 -168% | 2.1 25% |
| Gamma | 2.21 100% | 2.43 91% | 2.28 96% | 2.26 97% | 2.199 100% | 2.08 106% |
| CCT | 6944 94% | 6941 94% | 6588 99% | 7027 93% | 8544 76% | 6281 103% |
| Color Space (Percent of AdobeRGB 1998) (%) | 88 |
* ... kleiner is beter
Screen Flickering / PWM (Pulse-Width Modulation)
| Screen flickering / PWM niet waargenomen | 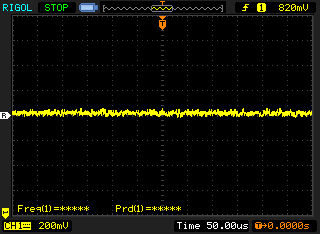 | ||
Ter vergelijking: 52 % van alle geteste toestellen maakten geen gebruik van PWM om de schermhelderheid te verlagen. Als het wel werd gebruikt, werd een gemiddelde van 7757 (minimum: 5 - maximum: 343500) Hz waargenomen. | |||
Responstijd Scherm
| ↔ Responstijd Zwart naar Wit | ||
|---|---|---|
| 28 ms ... stijging ↗ en daling ↘ gecombineerd | ↗ 10.4 ms stijging | 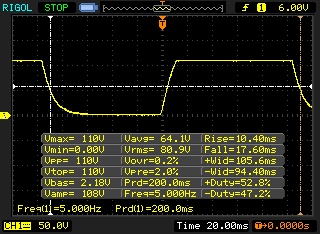 |
| ↘ 17.6 ms daling | ||
| Het scherm vertoonde relatief trage responstijden in onze tests en is misschien te traag voor games. Ter vergelijking: alle testtoestellen variëren van 0.1 (minimum) tot 240 (maximum) ms. » 71 % van alle toestellen zijn beter. Dit betekent dat de gemeten responstijd slechter is dan het gemiddelde (19.8 ms) van alle geteste toestellen. | ||
| ↔ Responstijd 50% Grijs naar 80% Grijs | ||
| 58 ms ... stijging ↗ en daling ↘ gecombineerd | ↗ 27.6 ms stijging | 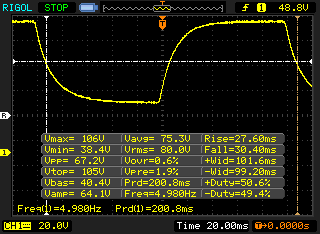 |
| ↘ 30.4 ms daling | ||
| Het scherm vertoonde trage responstijden in onze tests en is misschien te traag voor games. Ter vergelijking: alle testtoestellen variëren van 0.165 (minimum) tot 636 (maximum) ms. » 94 % van alle toestellen zijn beter. Dit betekent dat de gemeten responstijd slechter is dan het gemiddelde (31 ms) van alle geteste toestellen. | ||
| AnTuTu v7 - Total Score | |
| Apple iPad Air 3 2019 | |
| Gemiddeld Apple A12 Bionic (302955 - 370545, n=4) | |
| Samsung Galaxy Tab S4 | |
| Huawei MediaPad M5 10.8 Pro | |
| Apple iPad 6 2018 | |
| Basemark ES 3.1 / Metal - offscreen Overall Score | |
| Gemiddelde van klas Tablet (255 - 5784, n=6, laatste 2 jaar) | |
| Apple iPad Air 3 2019 | |
| Gemiddeld Apple A12 Bionic (2407 - 2873, n=6) | |
| Apple iPad 6 2018 | |
| Apple iPad Air 2 2014 | |
| Jetstream 2 - 2.0 Total | |
| Gemiddelde van klas Tablet (35.8 - 420, n=55, laatste 2 jaar) | |
| Gemiddeld Apple A12 Bionic (108.4 - 123.8, n=4) | |
| Apple iPad Air 3 2019 (Safari Mobile 12) | |
| WebXPRT 3 - Overall | |
| Gemiddelde van klas Tablet (168 - 520, n=10, laatste 2 jaar) | |
| Gemiddeld Apple A12 Bionic (155 - 166, n=6) | |
| Apple iPad Air 3 2019 (Safari Mobile 12) | |
| Apple iPad 6 2018 (Safari Mobile 10) | |
| Samsung Galaxy Tab S4 (Samsung Browser 8.0) | |
| Huawei MediaPad M5 10.8 Pro (Chrome 68.0.3440.91) | |
| Speedometer 2.0 - Result 2.0 | |
| Gemiddelde van klas Tablet (6.8 - 790, n=33, laatste 2 jaar) | |
| Gemiddeld Apple A12 Bionic (123 - 139, n=4) | |
| Apple iPad Air 3 2019 (Safari Mobile 12) | |
| Apple iPad 6 2018 (IOS 12.1.1) | |
| Octane V2 - Total Score | |
| Gemiddelde van klas Tablet (1633 - 138481, n=71, laatste 2 jaar) | |
| Gemiddeld Apple A12 Bionic (41367 - 43280, n=6) | |
| Apple iPad Air 3 2019 (Safari Mobile 12) | |
| Apple iPad Pro 10.5 2017 (Safari Mobile 10) | |
| Apple iPad 6 2018 (Safari Mobile 11.3) | |
| Samsung Galaxy Tab S4 (Samsung Browser 8.0) | |
| Huawei MediaPad M5 10.8 Pro (Chrome 68.0.3440.91) | |
| Apple iPad Air 2 2014 (Safari 9.0 Mobile) | |
| Mozilla Kraken 1.1 - Total | |
| Huawei MediaPad M5 10.8 Pro (Chrome 68.0.3440.91) | |
| Samsung Galaxy Tab S4 (Samsung Browser 8.0) | |
| Apple iPad Air 2 2014 (Safari 9.0 Mobile) | |
| Gemiddelde van klas Tablet (243 - 16233, n=65, laatste 2 jaar) | |
| Apple iPad 6 2018 (Safari Mobile 11.3) | |
| Apple iPad Pro 10.5 2017 (Safari Mobile 10) | |
| Apple iPad Air 3 2019 (Safari Mobile 12) | |
| Gemiddeld Apple A12 Bionic (603 - 653, n=6) | |
* ... kleiner is beter
PUBG Mobile
Dead Trigger 2
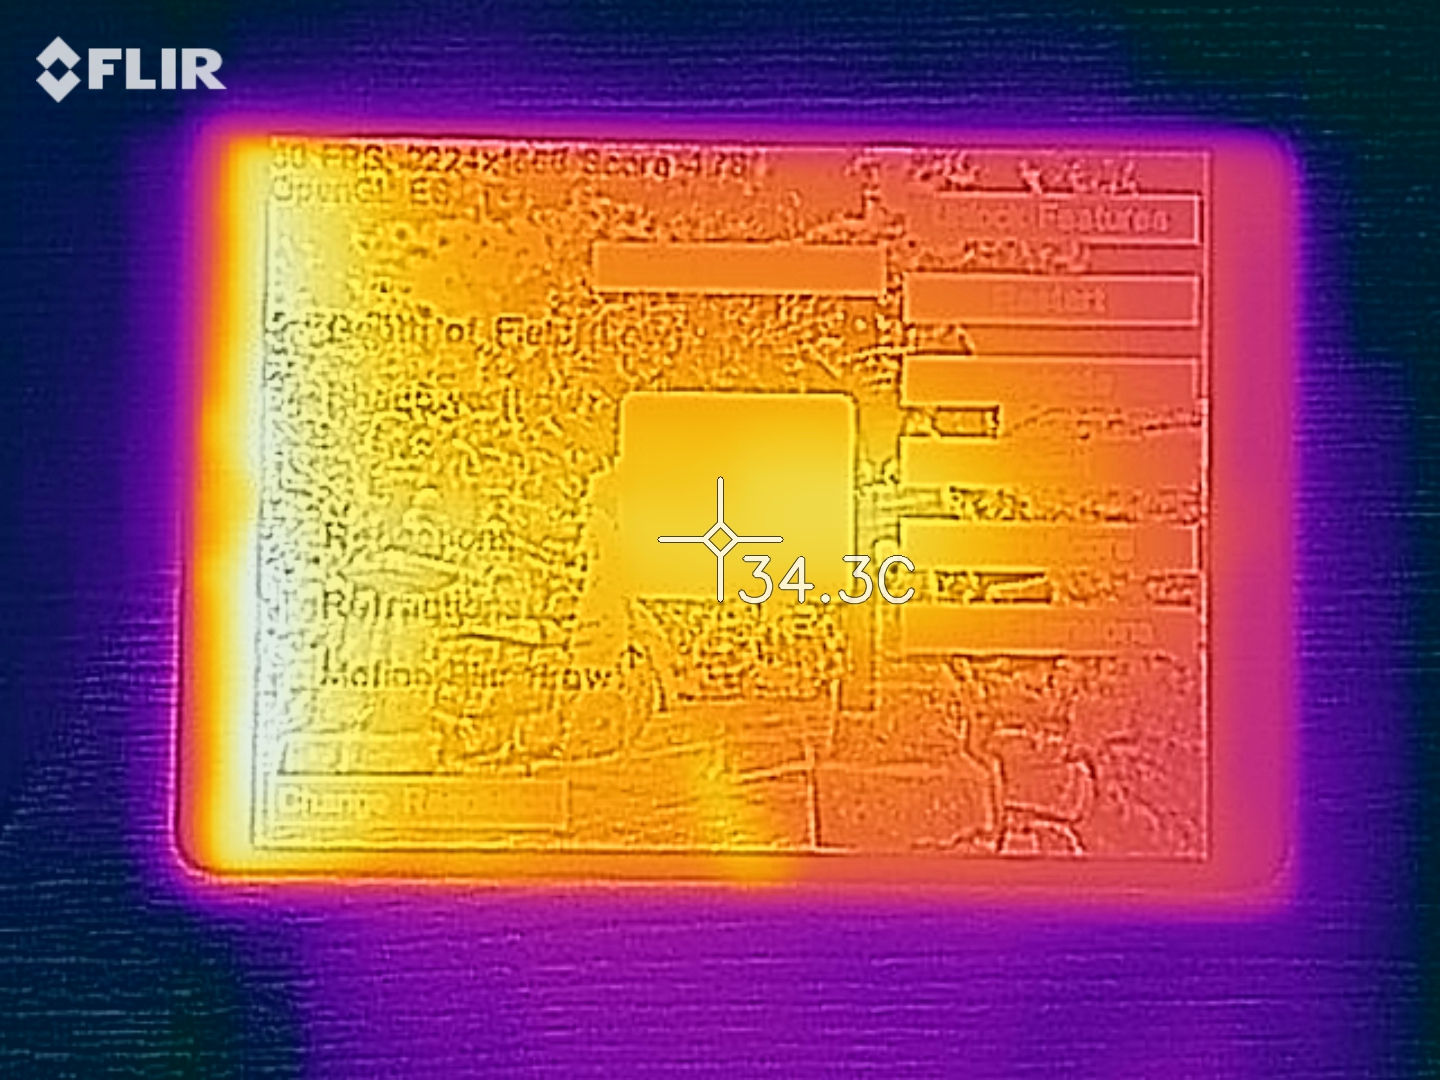
(+) De maximumtemperatuur aan de bovenzijde bedraagt 36.1 °C / 97 F, vergeleken met het gemiddelde van 33.7 °C / 93 F, variërend van 20.7 tot 53.2 °C voor de klasse Tablet.
(+) De bodem warmt op tot een maximum van 34.7 °C / 94 F, vergeleken met een gemiddelde van 33.2 °C / 92 F
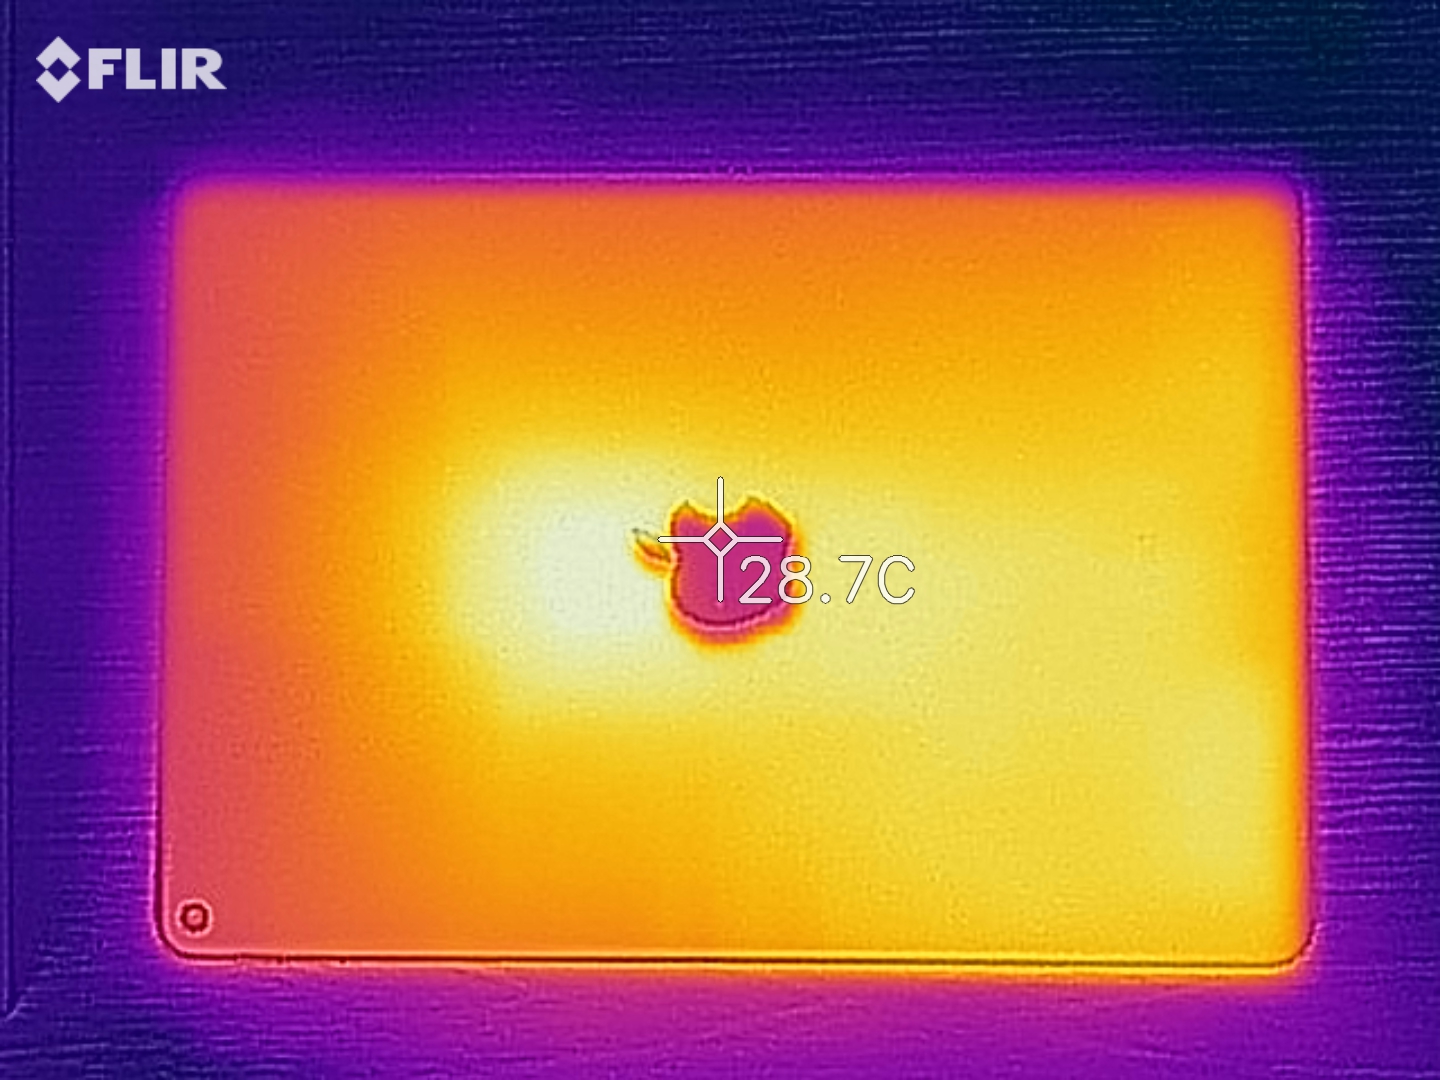
(+) Bij onbelast gebruik bedraagt de gemiddelde temperatuur voor de bovenzijde 30.5 °C / 87 F, vergeleken met het apparaatgemiddelde van 30 °C / 86 F.
Apple iPad Air 3 2019 audioanalyse
(+) | luidsprekers kunnen relatief luid spelen (92.5 dB)
Bas 100 - 315 Hz
(-) | bijna geen lage tonen - gemiddeld 15.9% lager dan de mediaan
(±) | lineariteit van de lage tonen is gemiddeld (8.5% delta ten opzichte van de vorige frequentie)
Midden 400 - 2000 Hz
(+) | evenwichtige middens - slechts 3% verwijderd van de mediaan
(+) | de middentonen zijn lineair (3% delta ten opzichte van de vorige frequentie)
Hoog 2 - 16 kHz
(±) | higher highs - on average 8.2% higher than median
(+) | de hoge tonen zijn lineair (4.3% delta naar de vorige frequentie)
Algemeen 100 - 16.000 Hz
(+) | het totale geluid is lineair (14.8% verschil met de mediaan)
Vergeleken met dezelfde klasse
» 32% van alle geteste apparaten in deze klasse waren beter, 3% vergelijkbaar, 64% slechter
» De beste had een delta van 7%, het gemiddelde was 20%, de slechtste was 129%
Vergeleken met alle geteste toestellen
» 20% van alle geteste apparaten waren beter, 4% gelijk, 76% slechter
» De beste had een delta van 4%, het gemiddelde was 23%, de slechtste was 134%
Apple iPad Pro 10.5 2017 audioanalyse
(+) | luidsprekers kunnen relatief luid spelen (84.6 dB)
Bas 100 - 315 Hz
(±) | verminderde zeebaars - gemiddeld 10.4% lager dan de mediaan
(±) | lineariteit van de lage tonen is gemiddeld (12.3% delta ten opzichte van de vorige frequentie)
Midden 400 - 2000 Hz
(±) | hogere middens - gemiddeld 5.8% hoger dan de mediaan
(+) | de middentonen zijn lineair (4.3% delta ten opzichte van de vorige frequentie)
Hoog 2 - 16 kHz
(±) | higher highs - on average 6.6% higher than median
(±) | lineariteit van de hoogtepunten is gemiddeld (7% delta ten opzichte van de vorige frequentie)
Algemeen 100 - 16.000 Hz
(±) | lineariteit van het totale geluid is gemiddeld (16.1% verschil met de mediaan)
Vergeleken met dezelfde klasse
» 37% van alle geteste apparaten in deze klasse waren beter, 6% vergelijkbaar, 57% slechter
» De beste had een delta van 7%, het gemiddelde was 20%, de slechtste was 129%
Vergeleken met alle geteste toestellen
» 26% van alle geteste apparaten waren beter, 5% gelijk, 69% slechter
» De beste had een delta van 4%, het gemiddelde was 23%, de slechtste was 134%
| Uit / Standby | |
| Inactief | |
| Belasting |
|
Key:
min: | |
| Apple iPad Air 3 2019 8134 mAh | Apple iPad Pro 10.5 2017 8134 mAh | Apple iPad 6 2018 mAh | Samsung Galaxy Tab S4 7300 mAh | Huawei MediaPad M5 10.8 Pro 7500 mAh | Apple iPad Air 2 2014 mAh | |
|---|---|---|---|---|---|---|
| Power Consumption | 6% | -27% | 32% | -19% | 14% | |
| Idle Minimum * (Watt) | 2.18 | 1.44 34% | 2.2 -1% | 1.76 19% | 3.3 -51% | 1.2 45% |
| Idle Average * (Watt) | 6.4 | 6.12 4% | 7.8 -22% | 4.22 34% | 4.2 34% | 5.1 20% |
| Idle Maximum * (Watt) | 6.43 | 6.14 5% | 7.9 -23% | 4.25 34% | 7 -9% | 5.4 16% |
| Load Average * (Watt) | 7.48 | 8.55 -14% | 12.6 -68% | 4.52 40% | 10.4 -39% | 7.9 -6% |
| Load Maximum * (Watt) | 10.65 | 10.62 -0% | 12.8 -20% | 7.35 31% | 13.8 -30% | 11.1 -4% |
* ... kleiner is beter
| Apple iPad Air 3 2019 8134 mAh | Apple iPad Pro 10.5 2017 8134 mAh | Apple iPad 6 2018 mAh | Samsung Galaxy Tab S4 7300 mAh | Huawei MediaPad M5 10.8 Pro 7500 mAh | Apple iPad Air 2 2014 mAh | |
|---|---|---|---|---|---|---|
| Batterijduur | 4% | -9% | -7% | -8% | -10% | |
| Reader / Idle (h) | 25 | 33.9 36% | 20.5 -18% | 20.9 -16% | 22.7 -9% | |
| H.264 (h) | 11.4 | 10.5 -8% | 12.3 8% | 10.5 -8% | 9.4 -18% | |
| WiFi v1.3 (h) | 12.3 | 11.6 -6% | 11.9 -3% | 8.3 -33% | 11.2 -9% | |
| Load (h) | 3.6 | 3.3 -8% | 3.1 -14% | 4.1 14% | 3.7 3% | 3.5 -3% |
| WiFi (h) | 10.5 |
Pro
Contra
Samenvatting
Voor het volledige, Engelse testrapport, klik hier.
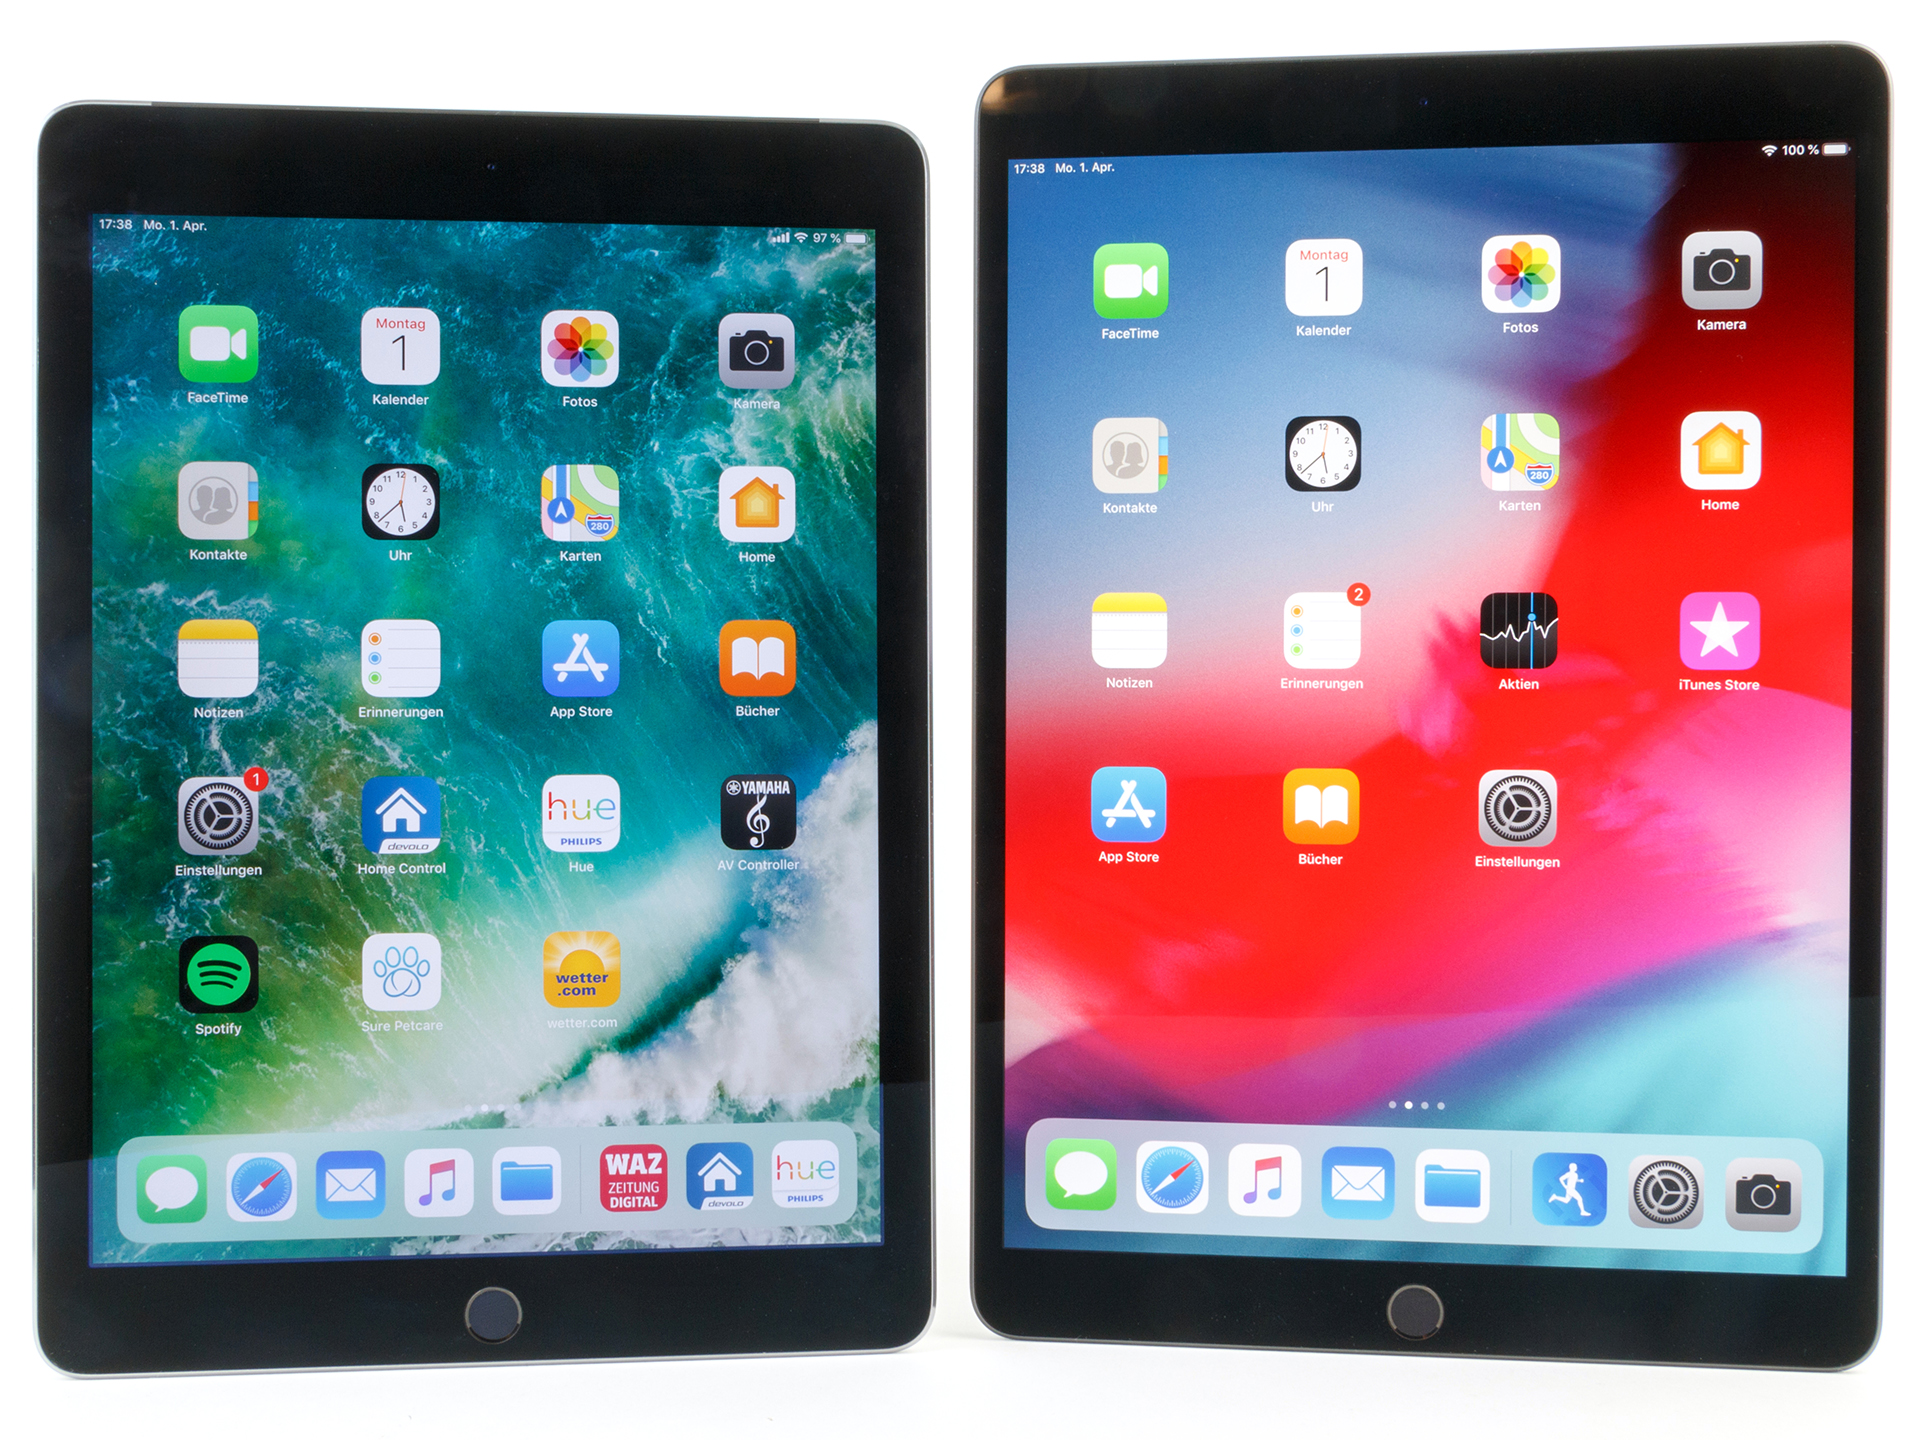
Terwijl de Apple iPad Air (2019) zich positioneert tussen de iPad Pro 11 en de iPad (2018), concurreert het apparaat direct met de huidige high-end Android-tablets wat betreft de prijs. In tegenstelling tot de instapmodel iPad, biedt het een groter, volledig gelamineerd beeldscherm, meer opslagruimte en heeft het een krachtigere SoC voor een meerprijs van €200.
Op het gebied van technologie heeft Apple opnieuw een geweldige tablet geleverd die geen echte fouten bevat en technologie gebruikt die in eerdere jaren is bewezen. Voor gebruikers wordt het modellenportfolio van Apple echter moeilijker te bevatten, wat nog moeilijker wordt doordat er meerdere Pencil-generaties tegelijkertijd in omloop zijn.
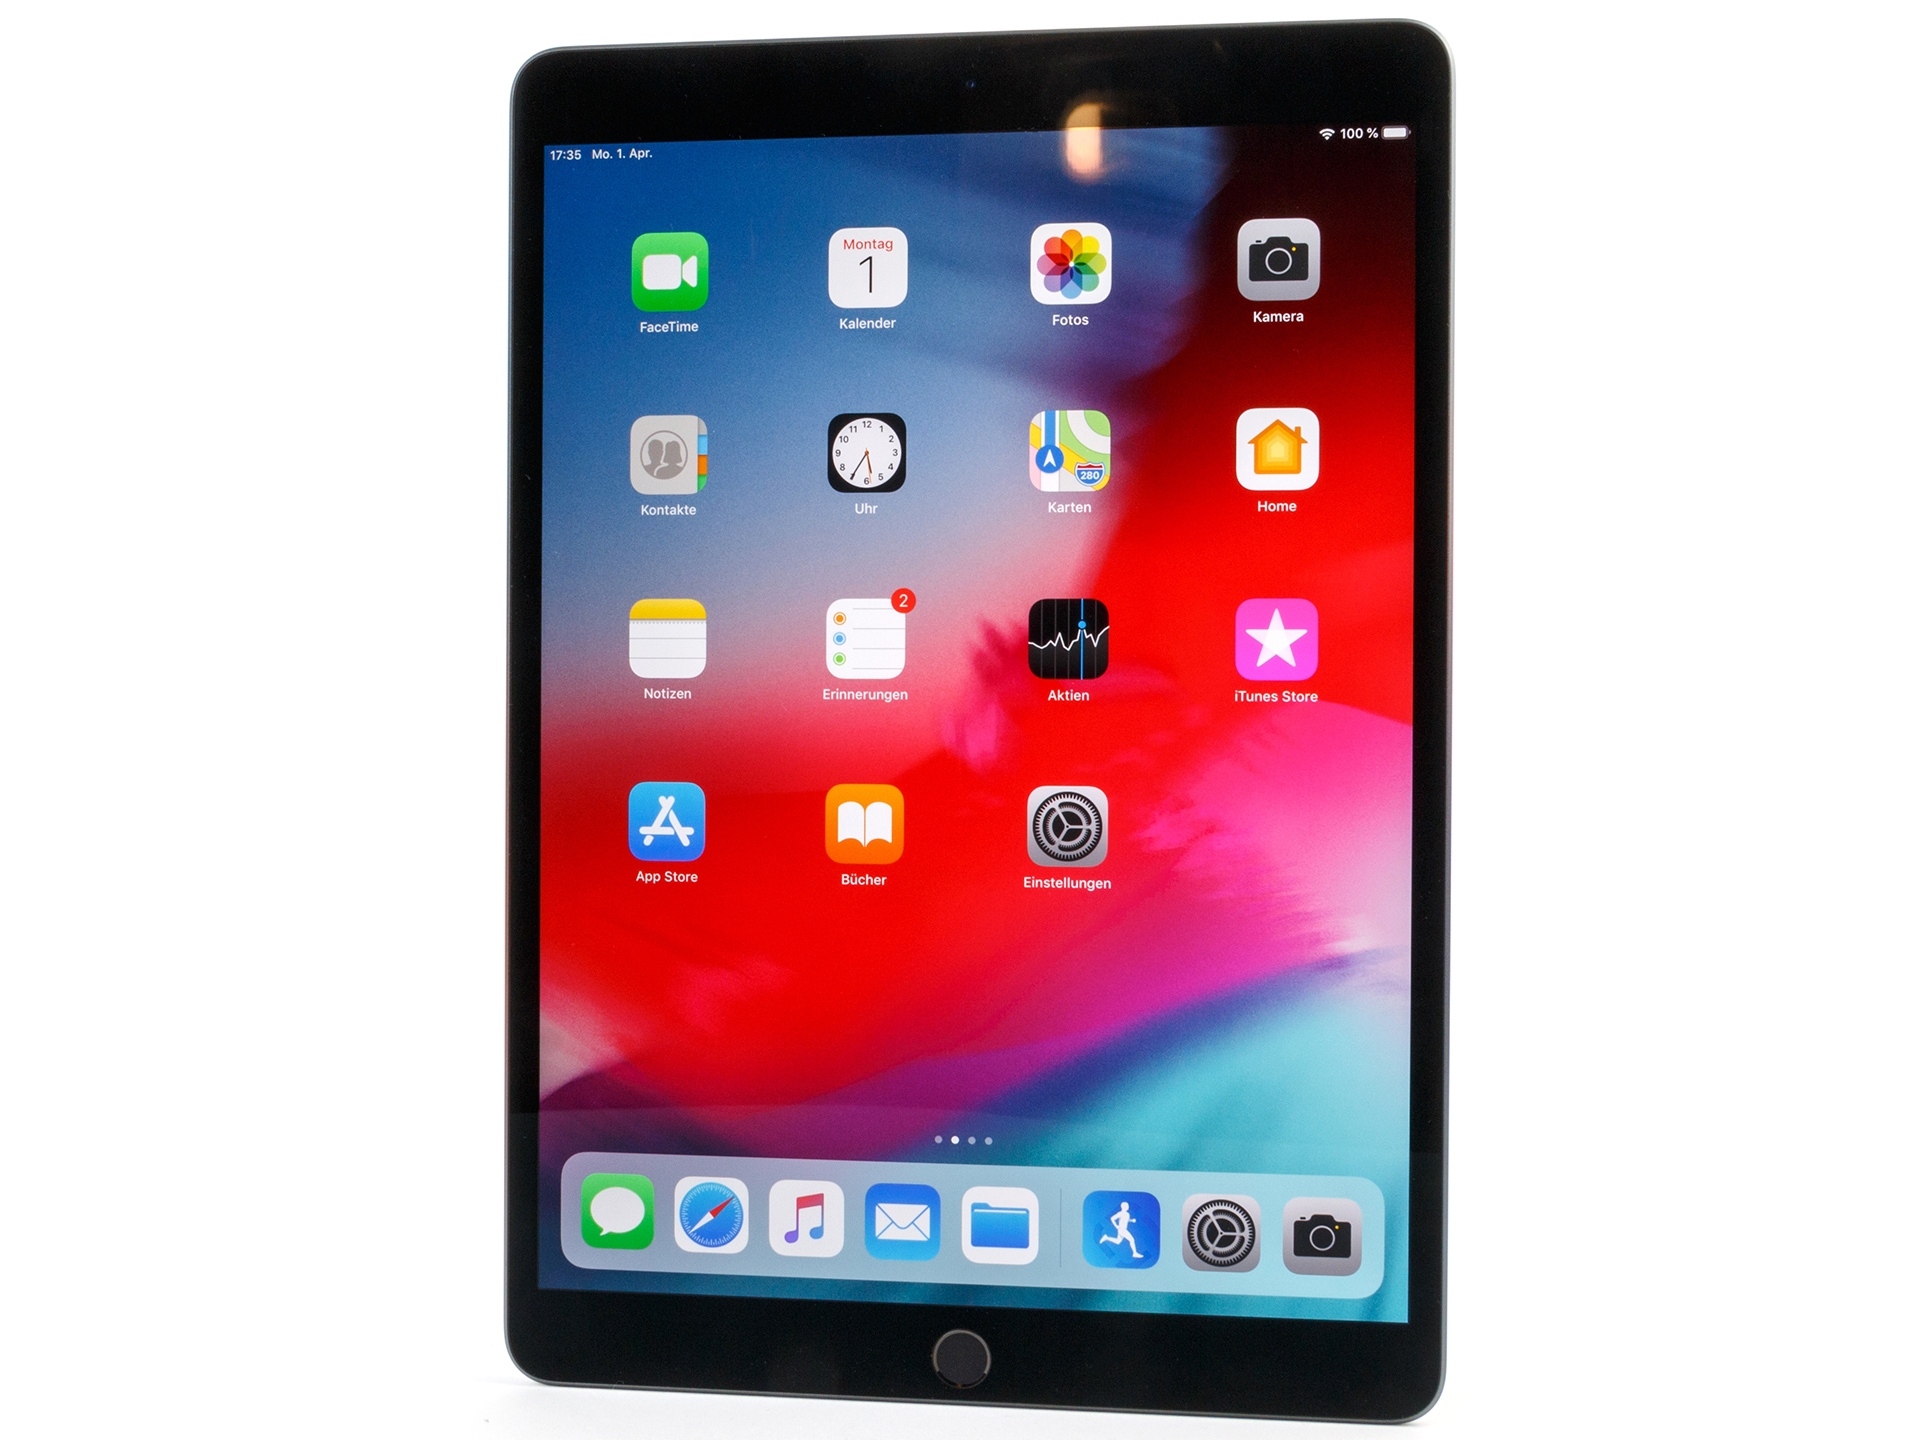
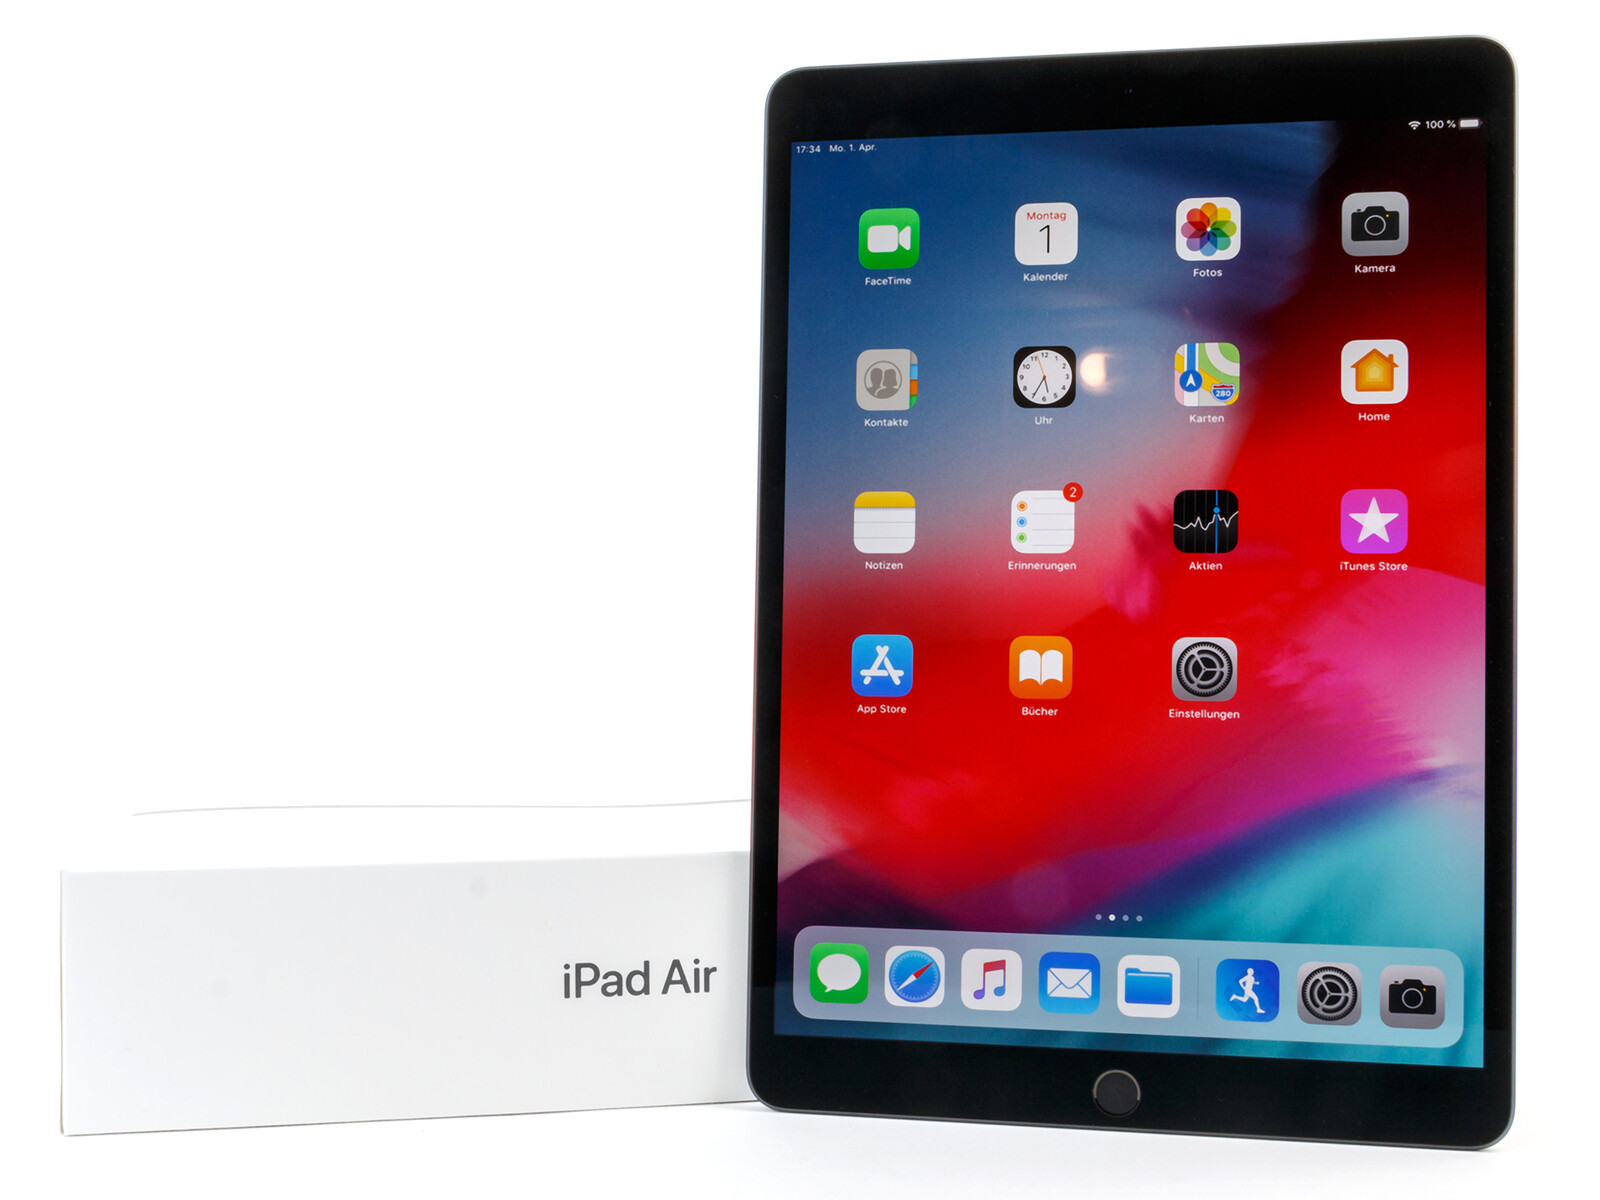
De Apple iPad Air (2019) combineert een moderne SoC met bewezen technologie.
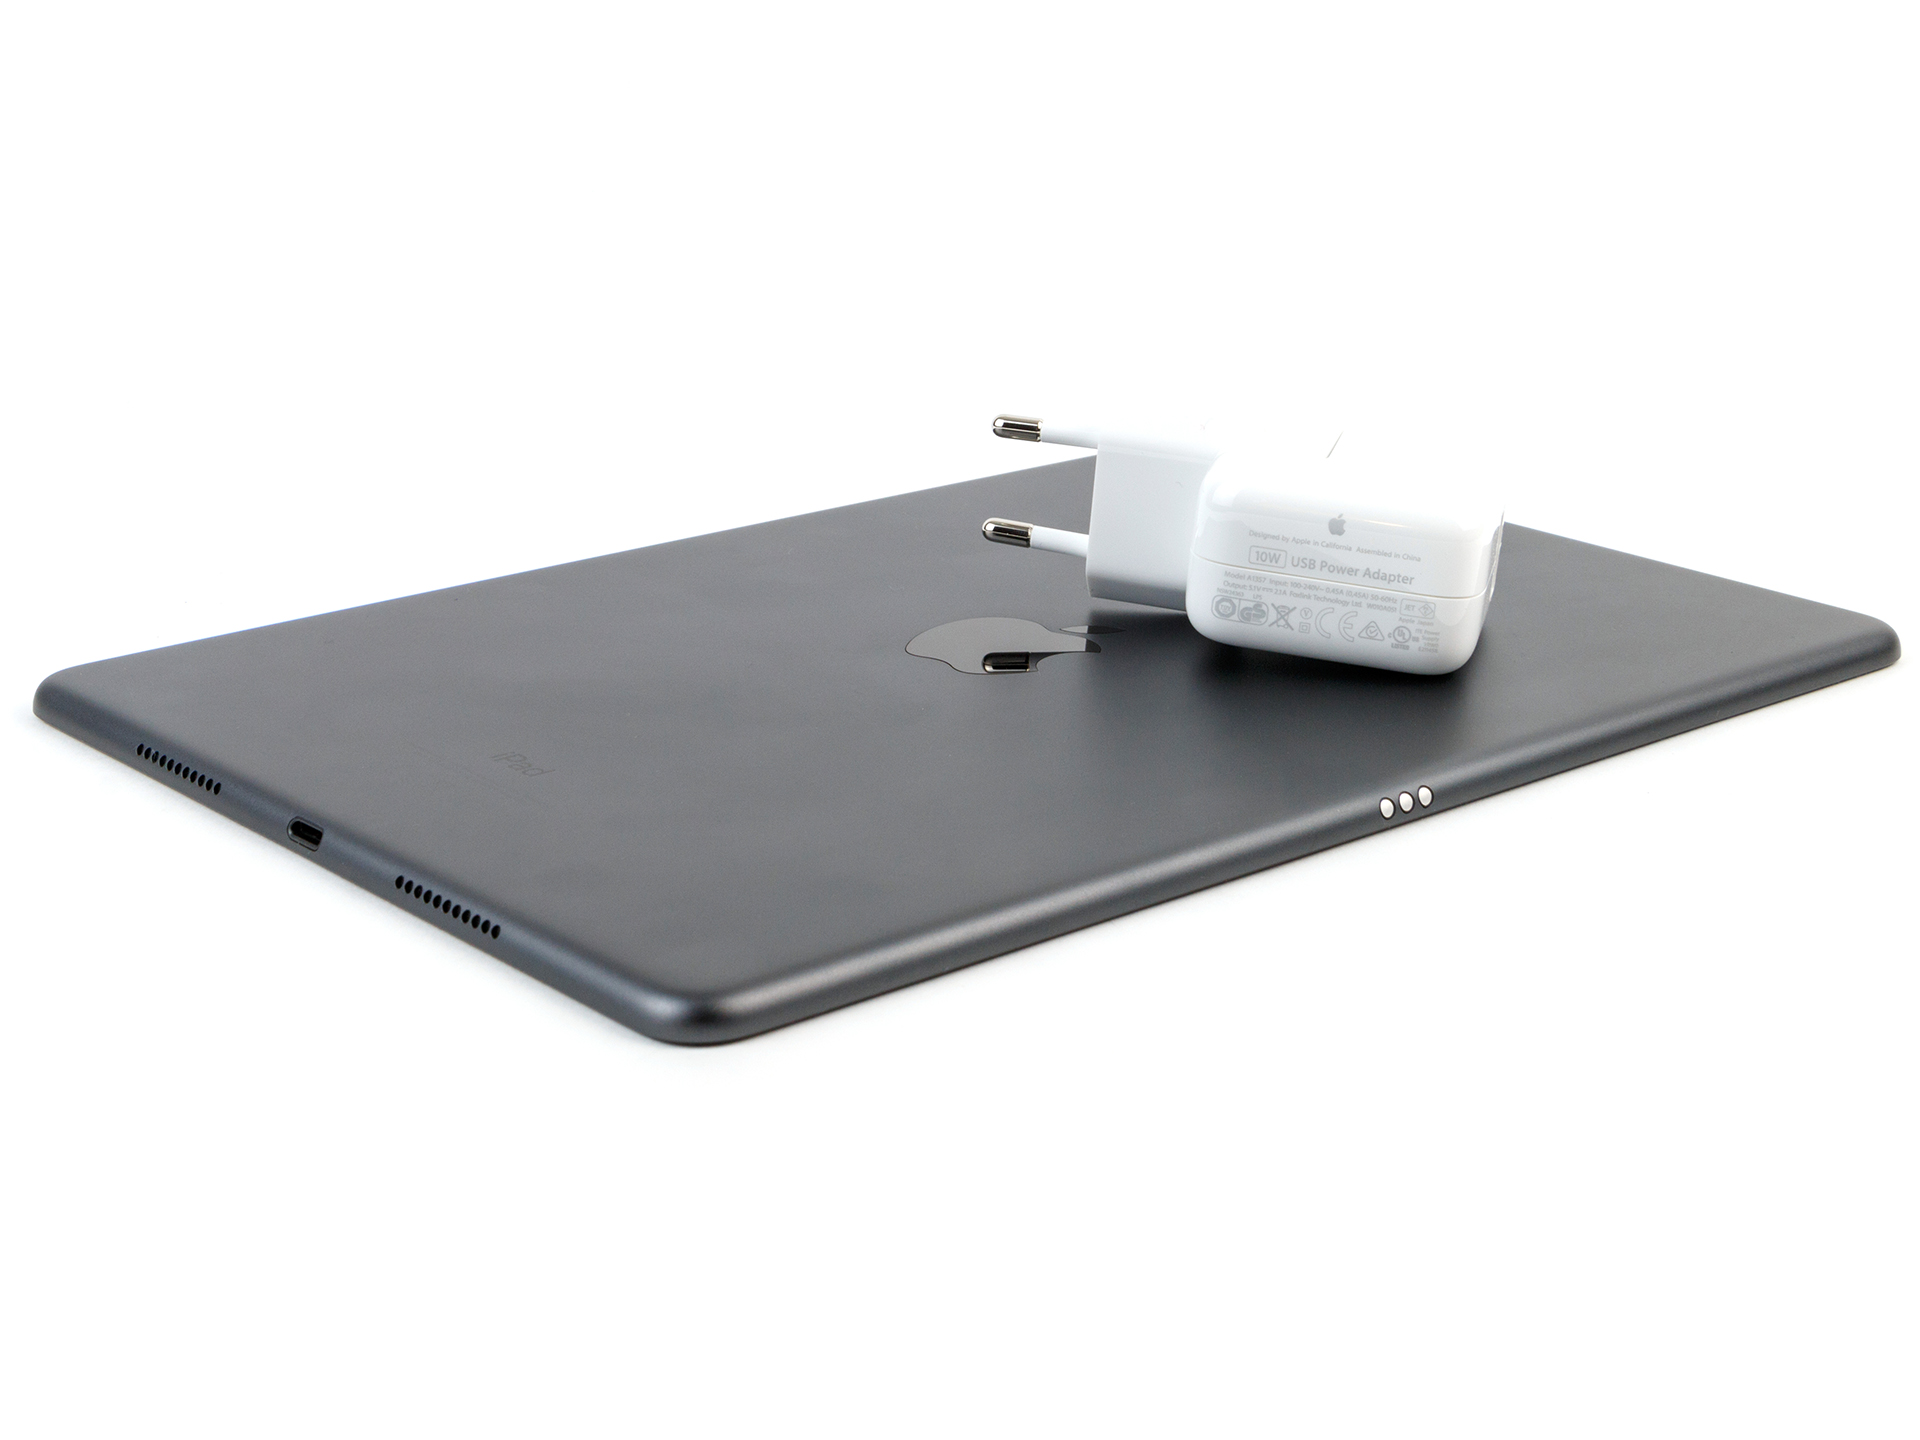
De belangrijkste klachten over de tablet zijn waarschijnlijk de schaarse meegeleverde accessoires (en hoge meerprijs voor extra accessoires) en de lange oplaadtijd. Dit is echter niet van belang in het dagelijks gebruik. Met de lage instapprijs, Touch ID en de audiopoort is de iPad Air nog steeds een aantrekkelijk product.
Apple iPad Air 3 2019
- 16-09-2019 v7 (old)
Daniel Schmidt
Price comparison
