Kort testrapport Aorus X5 v8 (i7-8850H, GTX 1070, Full HD) Laptop
| SD Card Reader | |
| average JPG Copy Test (av. of 3 runs) | |
| Aorus X5 v8 (Toshiba Exceria Pro SDXC 64 GB UHS-II) | |
| Gigabyte Aero 15X v8 (Toshiba Exceria Pro SDXC 64 GB UHS-II) | |
| Gemiddelde van klas Gaming (20.9 - 210, n=54, laatste 2 jaar) | |
| maximum AS SSD Seq Read Test (1GB) | |
| Gigabyte Aero 15X v8 (Toshiba Exceria Pro SDXC 64 GB UHS-II) | |
| Aorus X5 v8 (Toshiba Exceria Pro SDXC 64 GB UHS-II) | |
| Gemiddelde van klas Gaming (25.5 - 261, n=51, laatste 2 jaar) | |
| |||||||||||||||||||||||||
Helderheidsverdeling: 87 %
Helderheid in Batterij-modus: 271 cd/m²
Contrast: 1004:1 (Zwart: 0.27 cd/m²)
ΔE ColorChecker Calman: 1.81 | ∀{0.5-29.43 Ø4.71}
ΔE Greyscale Calman: 1.09 | ∀{0.09-98 Ø4.96}
93% sRGB (Argyll 1.6.3 3D)
61% AdobeRGB 1998 (Argyll 1.6.3 3D)
68.1% AdobeRGB 1998 (Argyll 3D)
93.4% sRGB (Argyll 3D)
67.1% Display P3 (Argyll 3D)
Gamma: 2.45
CCT: 6435 K
| Aorus X5 v8 AU Optronics B156HAN07.0 (AUO70ED), IPS, 1920x1080 | Gigabyte Aero 15X v8 LGD05C0, IPS, 1920x1080 | MSI GS65 8RF-019DE Stealth Thin AU Optronics B156HAN08.0 (AUO80ED), IPS, 1920x1080 | Asus Zephyrus M GM501 AUO B156HAN07.1 (AUO71ED), IPS, 1920x1080 | Acer Predator Triton 700 AUO B156HAN04.2 (AUO42ED), IPS, 1920x1080 | |
|---|---|---|---|---|---|
| Display | -3% | -1% | -1% | -6% | |
| Display P3 Coverage (%) | 67.1 | 63.6 -5% | 66.2 -1% | 66.1 -1% | 62.5 -7% |
| sRGB Coverage (%) | 93.4 | 93.8 0% | 92.1 -1% | 92.7 -1% | 88.7 -5% |
| AdobeRGB 1998 Coverage (%) | 68.1 | 64.9 -5% | 67.2 -1% | 67.2 -1% | 63.5 -7% |
| Response Times | 9% | -1% | 39% | -143% | |
| Response Time Grey 50% / Grey 80% * (ms) | 18.8 ? | 16.8 ? 11% | 17.6 ? 6% | 6.6 ? 65% | 44.8 ? -138% |
| Response Time Black / White * (ms) | 12 ? | 11.2 ? 7% | 12.8 ? -7% | 10.4 ? 13% | 29.6 ? -147% |
| PWM Frequency (Hz) | |||||
| Screen | 10% | -9% | -89% | -88% | |
| Brightness middle (cd/m²) | 271 | 313 15% | 254 -6% | 307 13% | 291 7% |
| Brightness (cd/m²) | 259 | 300 16% | 262 1% | 296 14% | 277 7% |
| Brightness Distribution (%) | 87 | 78 -10% | 89 2% | 89 2% | 84 -3% |
| Black Level * (cd/m²) | 0.27 | 0.33 -22% | 0.22 19% | 0.25 7% | 0.22 19% |
| Contrast (:1) | 1004 | 948 -6% | 1155 15% | 1228 22% | 1323 32% |
| Colorchecker dE 2000 * | 1.81 | 1.29 29% | 2.37 -31% | 5.74 -217% | 5.52 -205% |
| Colorchecker dE 2000 max. * | 3.33 | 2.04 39% | 4.71 -41% | 11.32 -240% | 10.72 -222% |
| Greyscale dE 2000 * | 1.09 | 0.69 37% | 1.58 -45% | 6.44 -491% | 6.59 -505% |
| Gamma | 2.45 90% | 2.43 91% | 2.48 89% | 2.48 89% | 2.44 90% |
| CCT | 6435 101% | 6550 99% | 6785 96% | 8395 77% | 7816 83% |
| Color Space (Percent of AdobeRGB 1998) (%) | 61 | 60 -2% | 60 -2% | 60 -2% | 58 -5% |
| Color Space (Percent of sRGB) (%) | 93 | 94 1% | 92 -1% | 93 0% | 89 -4% |
| Colorchecker dE 2000 calibrated * | 1.84 | 1.94 | |||
| Totaal Gemiddelde (Programma / Instellingen) | 5% /
7% | -4% /
-6% | -17% /
-54% | -79% /
-79% |
* ... kleiner is beter
Responstijd Scherm
| ↔ Responstijd Zwart naar Wit | ||
|---|---|---|
| 12 ms ... stijging ↗ en daling ↘ gecombineerd | ↗ 7.6 ms stijging | 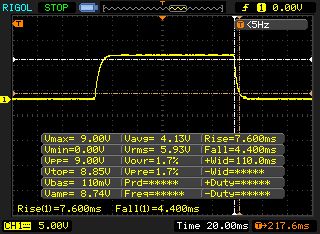 |
| ↘ 4.4 ms daling | ||
| Het scherm vertoonde prima responstijden in onze tests maar is misschien wat te traag voor competitieve games. Ter vergelijking: alle testtoestellen variëren van 0.1 (minimum) tot 240 (maximum) ms. » 32 % van alle toestellen zijn beter. Dit betekent dat de gemeten responstijd beter is dan het gemiddelde (19.8 ms) van alle geteste toestellen. | ||
| ↔ Responstijd 50% Grijs naar 80% Grijs | ||
| 18.8 ms ... stijging ↗ en daling ↘ gecombineerd | ↗ 10 ms stijging | 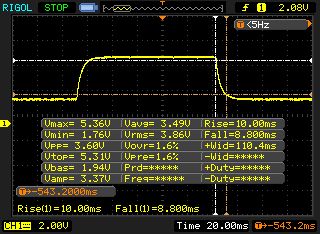 |
| ↘ 8.8 ms daling | ||
| Het scherm vertoonde prima responstijden in onze tests maar is misschien wat te traag voor competitieve games. Ter vergelijking: alle testtoestellen variëren van 0.165 (minimum) tot 636 (maximum) ms. » 32 % van alle toestellen zijn beter. Dit betekent dat de gemeten responstijd beter is dan het gemiddelde (31 ms) van alle geteste toestellen. | ||
Screen Flickering / PWM (Pulse-Width Modulation)
| Screen flickering / PWM niet waargenomen |  | ||
Ter vergelijking: 52 % van alle geteste toestellen maakten geen gebruik van PWM om de schermhelderheid te verlagen. Als het wel werd gebruikt, werd een gemiddelde van 7754 (minimum: 5 - maximum: 343500) Hz waargenomen. | |||
| PCMark 10 - Score | |
| Gemiddelde van klas Gaming (5828 - 12414, n=93, laatste 2 jaar) | |
| Aorus X5 v8 | |
| Acer Predator Triton 700 | |
| Asus Zephyrus M GM501 | |
| MSI GS65 8RF-019DE Stealth Thin | |
| Gigabyte Aero 15X v8 | |
| PCMark 8 Home Score Accelerated v2 | 5773 punten | |
| PCMark 8 Work Score Accelerated v2 | 5953 punten | |
| PCMark 10 Score | 6154 punten | |
Help | ||
| Aorus X5 v8 Toshiba NVMe THNSN5512GPU7 | Gigabyte Aero 15X v8 Toshiba NVMe THNSN5512GPU7 | MSI GS65 8RF-019DE Stealth Thin Samsung SSD PM981 MZVLB512HAJQ | Asus Zephyrus M GM501 Samsung SM961 MZVKW512HMJP m.2 PCI-e | Acer Predator Triton 700 2x SK Hynix Canvas SC300 512GB M.2 (HFS512G39MND) (RAID 0) | |
|---|---|---|---|---|---|
| AS SSD | 6% | 58% | 44% | 52% | |
| Seq Read (MB/s) | 1813 | 2213 22% | 1266 -30% | 2091 15% | 2517 39% |
| Seq Write (MB/s) | 966 | 1163 20% | 1834 90% | 1580 64% | 2372 146% |
| 4K Read (MB/s) | 23.21 | 23.36 1% | 48.94 111% | 43.42 87% | 41.47 79% |
| 4K Write (MB/s) | 84.5 | 80.4 -5% | 107.2 27% | 90.2 7% | 93 10% |
| Score Read (Points) | 1061 | 1092 3% | 1346 27% | 1471 39% | 1350 27% |
| Score Write (Points) | 954 | 939 -2% | 2051 115% | 1446 52% | 1243 30% |
| Score Total (Points) | 2515 | 2536 1% | 4122 64% | 3649 45% | 3282 30% |

| 3DMark - 1920x1080 Fire Strike Graphics | |
| Gemiddelde van klas Gaming (12242 - 62849, n=115, laatste 2 jaar) | |
| Acer Predator Triton 700 | |
| Aorus X5 v8 | |
| Asus Zephyrus M GM501 | |
| Gigabyte Aero 15X v8 | |
| MSI GS65 8RF-019DE Stealth Thin | |
| 3DMark 06 Standard Score | 38437 punten | |
| 3DMark 11 Performance | 18621 punten | |
| 3DMark Ice Storm Standard Score | 172098 punten | |
| 3DMark Cloud Gate Standard Score | 37234 punten | |
| 3DMark Fire Strike Score | 15226 punten | |
Help | ||
| lage | gem. | hoge | ultra | |
|---|---|---|---|---|
| The Witcher 3 (2015) | 113 | 60 | ||
| Fortnite (2018) | 166 | 127 | ||
| Final Fantasy XV Benchmark (2018) | 53.3 | |||
| Kingdom Come: Deliverance (2018) | 87.8 | 65.2 | ||
| Far Cry 5 (2018) | 94 | 90 |
| The Witcher 3 - 1920x1080 Ultra Graphics & Postprocessing (HBAO+) | |
| Gemiddelde van klas Gaming (104.7 - 240, n=7, laatste 2 jaar) | |
| Acer Predator Triton 700 | |
| Aorus X5 v8 | |
| Asus Zephyrus M GM501 | |
| MSI GS65 8RF-019DE Stealth Thin | |
| Gigabyte Aero 15X v8 | |
Geluidsniveau
| Onbelast |
| 33 / 35 / 40 dB (A) |
| HDD |
| 33 dB (A) |
| Belasting |
| 45 / 55 dB (A) |
 | ||
30 dB stil 40 dB(A) hoorbaar 50 dB(A) luid |
||
min: | ||
| Aorus X5 v8 GeForce GTX 1070 Mobile, i7-8850H | Gigabyte Aero 15X v8 GeForce GTX 1070 Max-Q, i7-8750H | MSI GS65 8RF-019DE Stealth Thin GeForce GTX 1070 Max-Q, i7-8750H | Asus Zephyrus M GM501 GeForce GTX 1070 Mobile, i7-8750H | Acer Predator Triton 700 GeForce GTX 1080 Max-Q, i7-7700HQ | Gemiddelde van klas Gaming | |
|---|---|---|---|---|---|---|
| Noise | 4% | 11% | 5% | 5% | 15% | |
| uit / omgeving * (dB) | 30 | 29 3% | 30 -0% | 29 3% | 31 -3% | 24.1 ? 20% |
| Idle Minimum * (dB) | 33 | 30 9% | 30 9% | 30 9% | 33 -0% | 26 ? 21% |
| Idle Average * (dB) | 35 | 31 11% | 31 11% | 31 11% | 34 3% | 27.4 ? 22% |
| Idle Maximum * (dB) | 40 | 35 12% | 34 15% | 33 17% | 40 -0% | 30.1 ? 25% |
| Load Average * (dB) | 45 | 49 -9% | 43 4% | 49 -9% | 41 9% | 43.6 ? 3% |
| Witcher 3 ultra * (dB) | 50 | 51 -2% | 42 16% | 50 -0% | 43 14% | |
| Load Maximum * (dB) | 55 | 54 2% | 44 20% | 52 5% | 48 13% | 54.2 ? 1% |
* ... kleiner is beter
(-) De maximumtemperatuur aan de bovenzijde bedraagt 50 °C / 122 F, vergeleken met het gemiddelde van 40.4 °C / 105 F, variërend van 21.2 tot 68.8 °C voor de klasse Gaming.
(-) De bodem warmt op tot een maximum van 62 °C / 144 F, vergeleken met een gemiddelde van 43.2 °C / 110 F
(+) Bij onbelast gebruik bedraagt de gemiddelde temperatuur voor de bovenzijde 25.2 °C / 77 F, vergeleken met het apparaatgemiddelde van 33.9 °C / 93 F.
(-) Bij het spelen van The Witcher 3 is de gemiddelde temperatuur voor de bovenzijde 41.6 °C / 107 F, vergeleken met het apparaatgemiddelde van 33.9 °C / 93 F.
(-) De palmsteunen en het touchpad kunnen zeer heet aanvoelen met een maximum van ###max## °C / 107.6 F.
(-) De gemiddelde temperatuur van de handpalmsteun van soortgelijke toestellen bedroeg 28.8 °C / 83.8 F (-13.2 °C / -23.8 F).
| Aorus X5 v8 GeForce GTX 1070 Mobile, i7-8850H | Gigabyte Aero 15X v8 GeForce GTX 1070 Max-Q, i7-8750H | MSI GS65 8RF-019DE Stealth Thin GeForce GTX 1070 Max-Q, i7-8750H | Asus Zephyrus M GM501 GeForce GTX 1070 Mobile, i7-8750H | Acer Predator Triton 700 GeForce GTX 1080 Max-Q, i7-7700HQ | Gemiddelde van klas Gaming | |
|---|---|---|---|---|---|---|
| Heat | -3% | 6% | -1% | -13% | -0% | |
| Maximum Upper Side * (°C) | 50 | 53 -6% | 49 2% | 52 -4% | 61 -22% | 45.2 ? 10% |
| Maximum Bottom * (°C) | 62 | 65 -5% | 63 -2% | 49 21% | 69 -11% | 48.1 ? 22% |
| Idle Upper Side * (°C) | 27 | 26 4% | 24 11% | 31 -15% | 29 -7% | 31 ? -15% |
| Idle Bottom * (°C) | 29 | 30 -3% | 25 14% | 31 -7% | 32 -10% | 34.2 ? -18% |
* ... kleiner is beter
Aorus X5 v8 audioanalyse
(±) | luidspreker luidheid is gemiddeld maar goed (75 dB)
Bas 100 - 315 Hz
(±) | verminderde zeebaars - gemiddeld 12.8% lager dan de mediaan
(±) | lineariteit van de lage tonen is gemiddeld (10.6% delta ten opzichte van de vorige frequentie)
Midden 400 - 2000 Hz
(+) | evenwichtige middens - slechts 2% verwijderd van de mediaan
(+) | de middentonen zijn lineair (4.7% delta ten opzichte van de vorige frequentie)
Hoog 2 - 16 kHz
(+) | evenwichtige hoogtepunten - slechts 1.4% verwijderd van de mediaan
(+) | de hoge tonen zijn lineair (4.1% delta naar de vorige frequentie)
Algemeen 100 - 16.000 Hz
(+) | het totale geluid is lineair (13.8% verschil met de mediaan)
Vergeleken met dezelfde klasse
» 21% van alle geteste apparaten in deze klasse waren beter, 7% vergelijkbaar, 71% slechter
» De beste had een delta van 6%, het gemiddelde was 18%, de slechtste was 132%
Vergeleken met alle geteste toestellen
» 15% van alle geteste apparaten waren beter, 4% gelijk, 81% slechter
» De beste had een delta van 4%, het gemiddelde was 23%, de slechtste was 134%
Asus Zephyrus M GM501 audioanalyse
(+) | luidsprekers kunnen relatief luid spelen (86 dB)
Bas 100 - 315 Hz
(+) | goede baars - slechts 4.8% verwijderd van de mediaan
(±) | lineariteit van de lage tonen is gemiddeld (8.3% delta ten opzichte van de vorige frequentie)
Midden 400 - 2000 Hz
(+) | evenwichtige middens - slechts 3.2% verwijderd van de mediaan
(+) | de middentonen zijn lineair (3.6% delta ten opzichte van de vorige frequentie)
Hoog 2 - 16 kHz
(±) | higher highs - on average 5.8% higher than median
(+) | de hoge tonen zijn lineair (6.5% delta naar de vorige frequentie)
Algemeen 100 - 16.000 Hz
(+) | het totale geluid is lineair (11.5% verschil met de mediaan)
Vergeleken met dezelfde klasse
» 10% van alle geteste apparaten in deze klasse waren beter, 3% vergelijkbaar, 87% slechter
» De beste had een delta van 6%, het gemiddelde was 18%, de slechtste was 132%
Vergeleken met alle geteste toestellen
» 8% van alle geteste apparaten waren beter, 2% gelijk, 90% slechter
» De beste had een delta van 4%, het gemiddelde was 23%, de slechtste was 134%
| Uit / Standby | |
| Inactief | |
| Belasting |
|
Key:
min: | |
| Aorus X5 v8 GeForce GTX 1070 Mobile, i7-8850H | Gigabyte Aero 15X v8 GeForce GTX 1070 Max-Q, i7-8750H | MSI GS65 8RF-019DE Stealth Thin GeForce GTX 1070 Max-Q, i7-8750H | Asus Zephyrus M GM501 GeForce GTX 1070 Mobile, i7-8750H | Acer Predator Triton 700 GeForce GTX 1080 Max-Q, i7-7700HQ | Gemiddelde van klas Gaming | |
|---|---|---|---|---|---|---|
| Power Consumption | 31% | 39% | 20% | -2% | 19% | |
| Idle Minimum * (Watt) | 25 | 14 44% | 7 72% | 16 36% | 28 -12% | 13 ? 48% |
| Idle Average * (Watt) | 31 | 18 42% | 11 65% | 19 39% | 33 -6% | 19 ? 39% |
| Idle Maximum * (Watt) | 33 | 22 33% | 20 39% | 26 21% | 41 -24% | 24.6 ? 25% |
| Load Average * (Watt) | 102 | 91 11% | 98 4% | 103 -1% | 94 8% | 110.7 ? -9% |
| Witcher 3 ultra * (Watt) | 194 | 142 27% | 132 32% | 164 15% | 160 18% | |
| Load Maximum * (Watt) | 239 | 173 28% | 182 24% | 223 7% | 222 7% | 259 ? -8% |
* ... kleiner is beter
| Aorus X5 v8 GeForce GTX 1070 Mobile, i7-8850H, 92.24 Wh | Gigabyte Aero 15X v8 GeForce GTX 1070 Max-Q, i7-8750H, 94.24 Wh | MSI GS65 8RF-019DE Stealth Thin GeForce GTX 1070 Max-Q, i7-8750H, 82 Wh | Asus Zephyrus M GM501 GeForce GTX 1070 Mobile, i7-8750H, 55 Wh | Acer Predator Triton 700 GeForce GTX 1080 Max-Q, i7-7700HQ, 54 Wh | Gemiddelde van klas Gaming | |
|---|---|---|---|---|---|---|
| Batterijduur | 122% | 43% | -21% | -40% | 67% | |
| Reader / Idle (h) | 4.9 | 12.7 159% | 8.5 73% | 4 -18% | 2.5 -49% | 8.27 ? 69% |
| H.264 (h) | 3.6 | 8.4 133% | 5.9 64% | 2.7 -25% | 1.8 -50% | 8.32 ? 131% |
| Load (h) | 1.5 | 2.6 73% | 1.4 -7% | 1.2 -20% | 1.2 -20% | 1.502 ? 0% |
| WiFi v1.3 (h) | 8.6 | 6 | 2.7 | 2.4 | 7.11 ? |
Pro
Contra
Dit is de verkorte versie van het originele artikel. Het volledige, Engelse testrapport vind je hier.
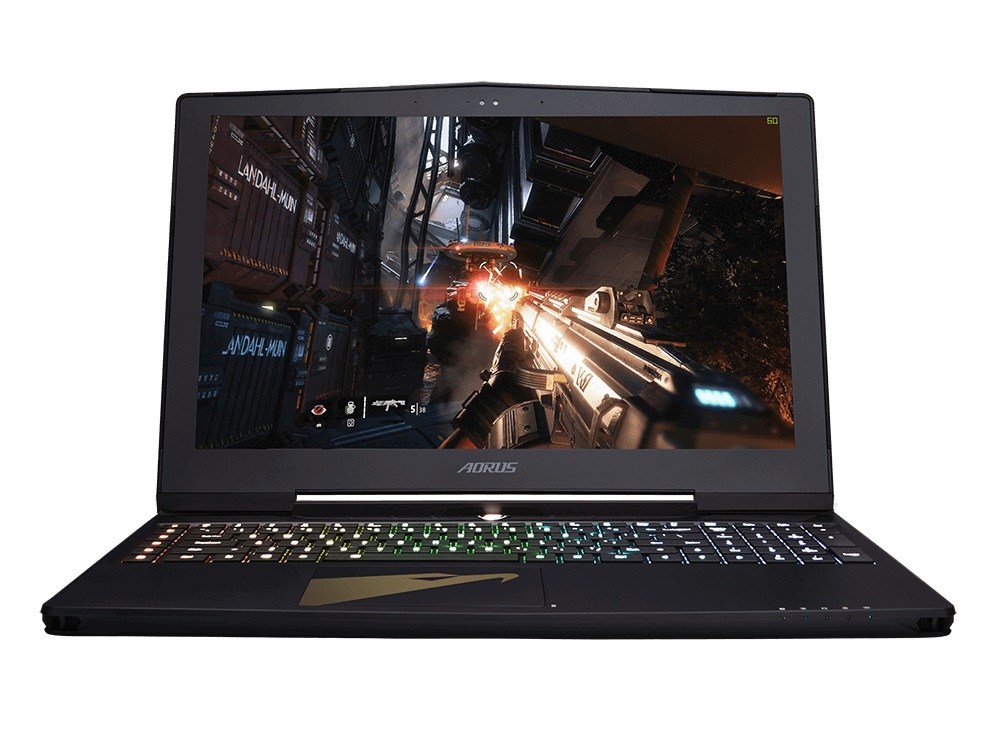
De 2018 versie van de Aorus X5 v8 kan de strijd met de concurrentie op de meeste vlakken aan. Niet alleen de behoorlijk robuuste metalen behuizing, maar ook qua aansluitingen, invoerapparaten en het beeldscherm kunnen overtuigen. Het 144 Hz IPS paneel biedt het perfecte compromis tussen snelheid en beeldkwaliteit (steekwoord X-Rite Pantone).
Een paar van de grootste minpunten zijn de hoge temperatuur- en geluidsontwikkeling, maar dat is iets dat vaak het geval is bij dunne game notebooks. Al met al plaatsen we de X5 v8 op hetzelfde niveau als de Asus GM501, die vergelijkbare prestaties heeft.
De krachtigste rivaal komt echter van dezelfde fabrikant als de X5 v8. Diegenen die zonder G-Sync kunnen en een paar FPS minder niet een groot probleem vinden, kunnen de Aero 15X overwegen. Dit 15-inch broertje beschikt over een compactere en lichtere behuizing en heeft een veel betere batterijduur, en ook de prijs is lager (€2500 vs. €2700).
Aorus X5 v8
- 15-05-2018 v6 (old)
Florian Glaser
Price comparison