HP Pavilion Plus 16 Review: Premium multimedia laptop die had kunnen profiteren van een RTX 4050
 in review")
HP heeft onlangs twee nieuwe Pavilion Plus modellen geïntroduceerd als een betaalbaarder alternatief voor de Envy serie. We hebben eerder de Pavilion Plus 14 in zowel Intel Raptor Lake en AMD Zen 4 varianten. Nu bekijken we de grotere Pavilion Plus 16.
De Pavilion Plus 16 ziet af van het "IMAX Enhanced" OLED-paneel van de Pavilion Plus 14, maar biedt in plaats daarvan een H-serie processor en optionele Nvidia graphics.
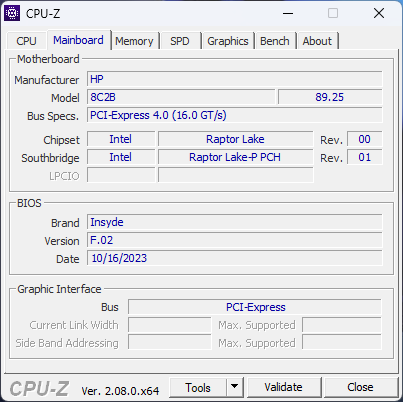
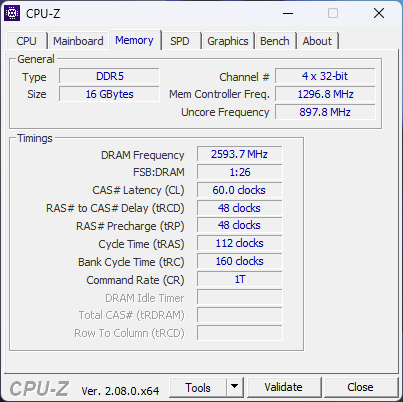
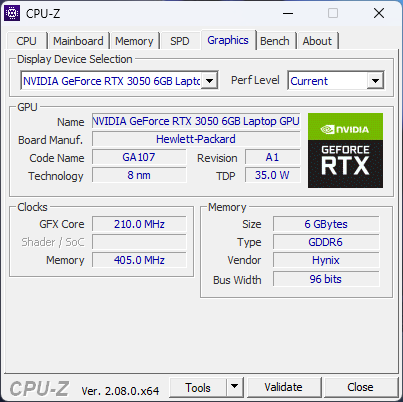
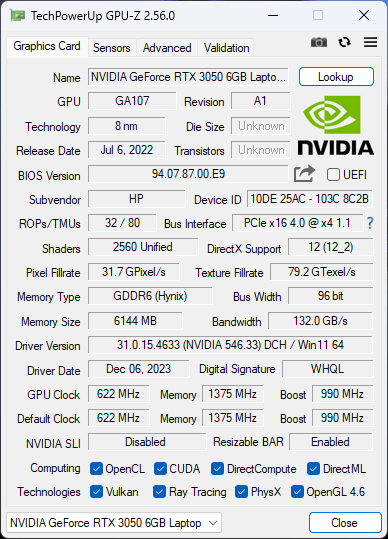
Onze Pavilion Plus 16 is uitgerust met een Intel Core i7-13700H processor samen met 16 GB RAM, 1 TB SSD en een 16-inch 2560 x 1600 120 Hz IPS-scherm. De Pavilion Plus 16 is een van de weinige laptops met de Nvidia GeForce RTX 3050 6 GB laptop GPU. Voor deze configuratie betaalt u ₹1,24,999 (US$1,350) in de officiële HP India winkel.
Potentiële concurrenten in vergelijking
Evaluatie | Datum | Model | Gewicht | Hoogte | Formaat | Resolutie | Beste prijs |
|---|---|---|---|---|---|---|---|
| 88.7 % v7 (old) | 02-2024 | HP Pavilion Plus 16-ab0456tx i7-13700H, GeForce RTX 3050 6GB Laptop GPU | 1.9 kg | 19.9 mm | 16.00" | 2560x1600 | |
| 88.2 % v7 (old) | 01-2024 | Schenker Vision 14 M23 RTX 3050 i7-13700H, GeForce RTX 3050 6GB Laptop GPU | 1.3 kg | 16.6 mm | 14.00" | 2880x1800 | |
| 87.1 % v7 (old) | 08-2023 | Dell Inspiron 16 Plus 7630 i7-13700H, GeForce RTX 4060 Laptop GPU | 2.2 kg | 19.95 mm | 16.00" | 2560x1600 | |
| 85.6 % v7 (old) | 08-2023 | Asus VivoBook 14X K3405 i5-13500H, GeForce RTX 3050 4GB Laptop GPU | 1.4 kg | 18.9 mm | 14.00" | 2880x1800 | |
| 89.2 % v7 (old) | 04-2023 | Lenovo Slim Pro 7 14ARP8 R7 7735HS, GeForce RTX 3050 6GB Laptop GPU | 1.6 kg | 15.6 mm | 14.50" | 2560x1600 | |
| 87.6 % v7 (old) | 11-2023 | Asus VivoBook Pro 16 K6602VU i9-13900H, GeForce RTX 4050 Laptop GPU | 1.9 kg | 19 mm | 16.00" | 3200x2000 | |
| 89.4 % v7 (old) | 04-2023 | Samsung Galaxy Book3 Ultra 16 i7-13700H, GeForce RTX 4050 Laptop GPU | 1.8 kg | 16.5 mm | 16.00" | 2880x1800 |
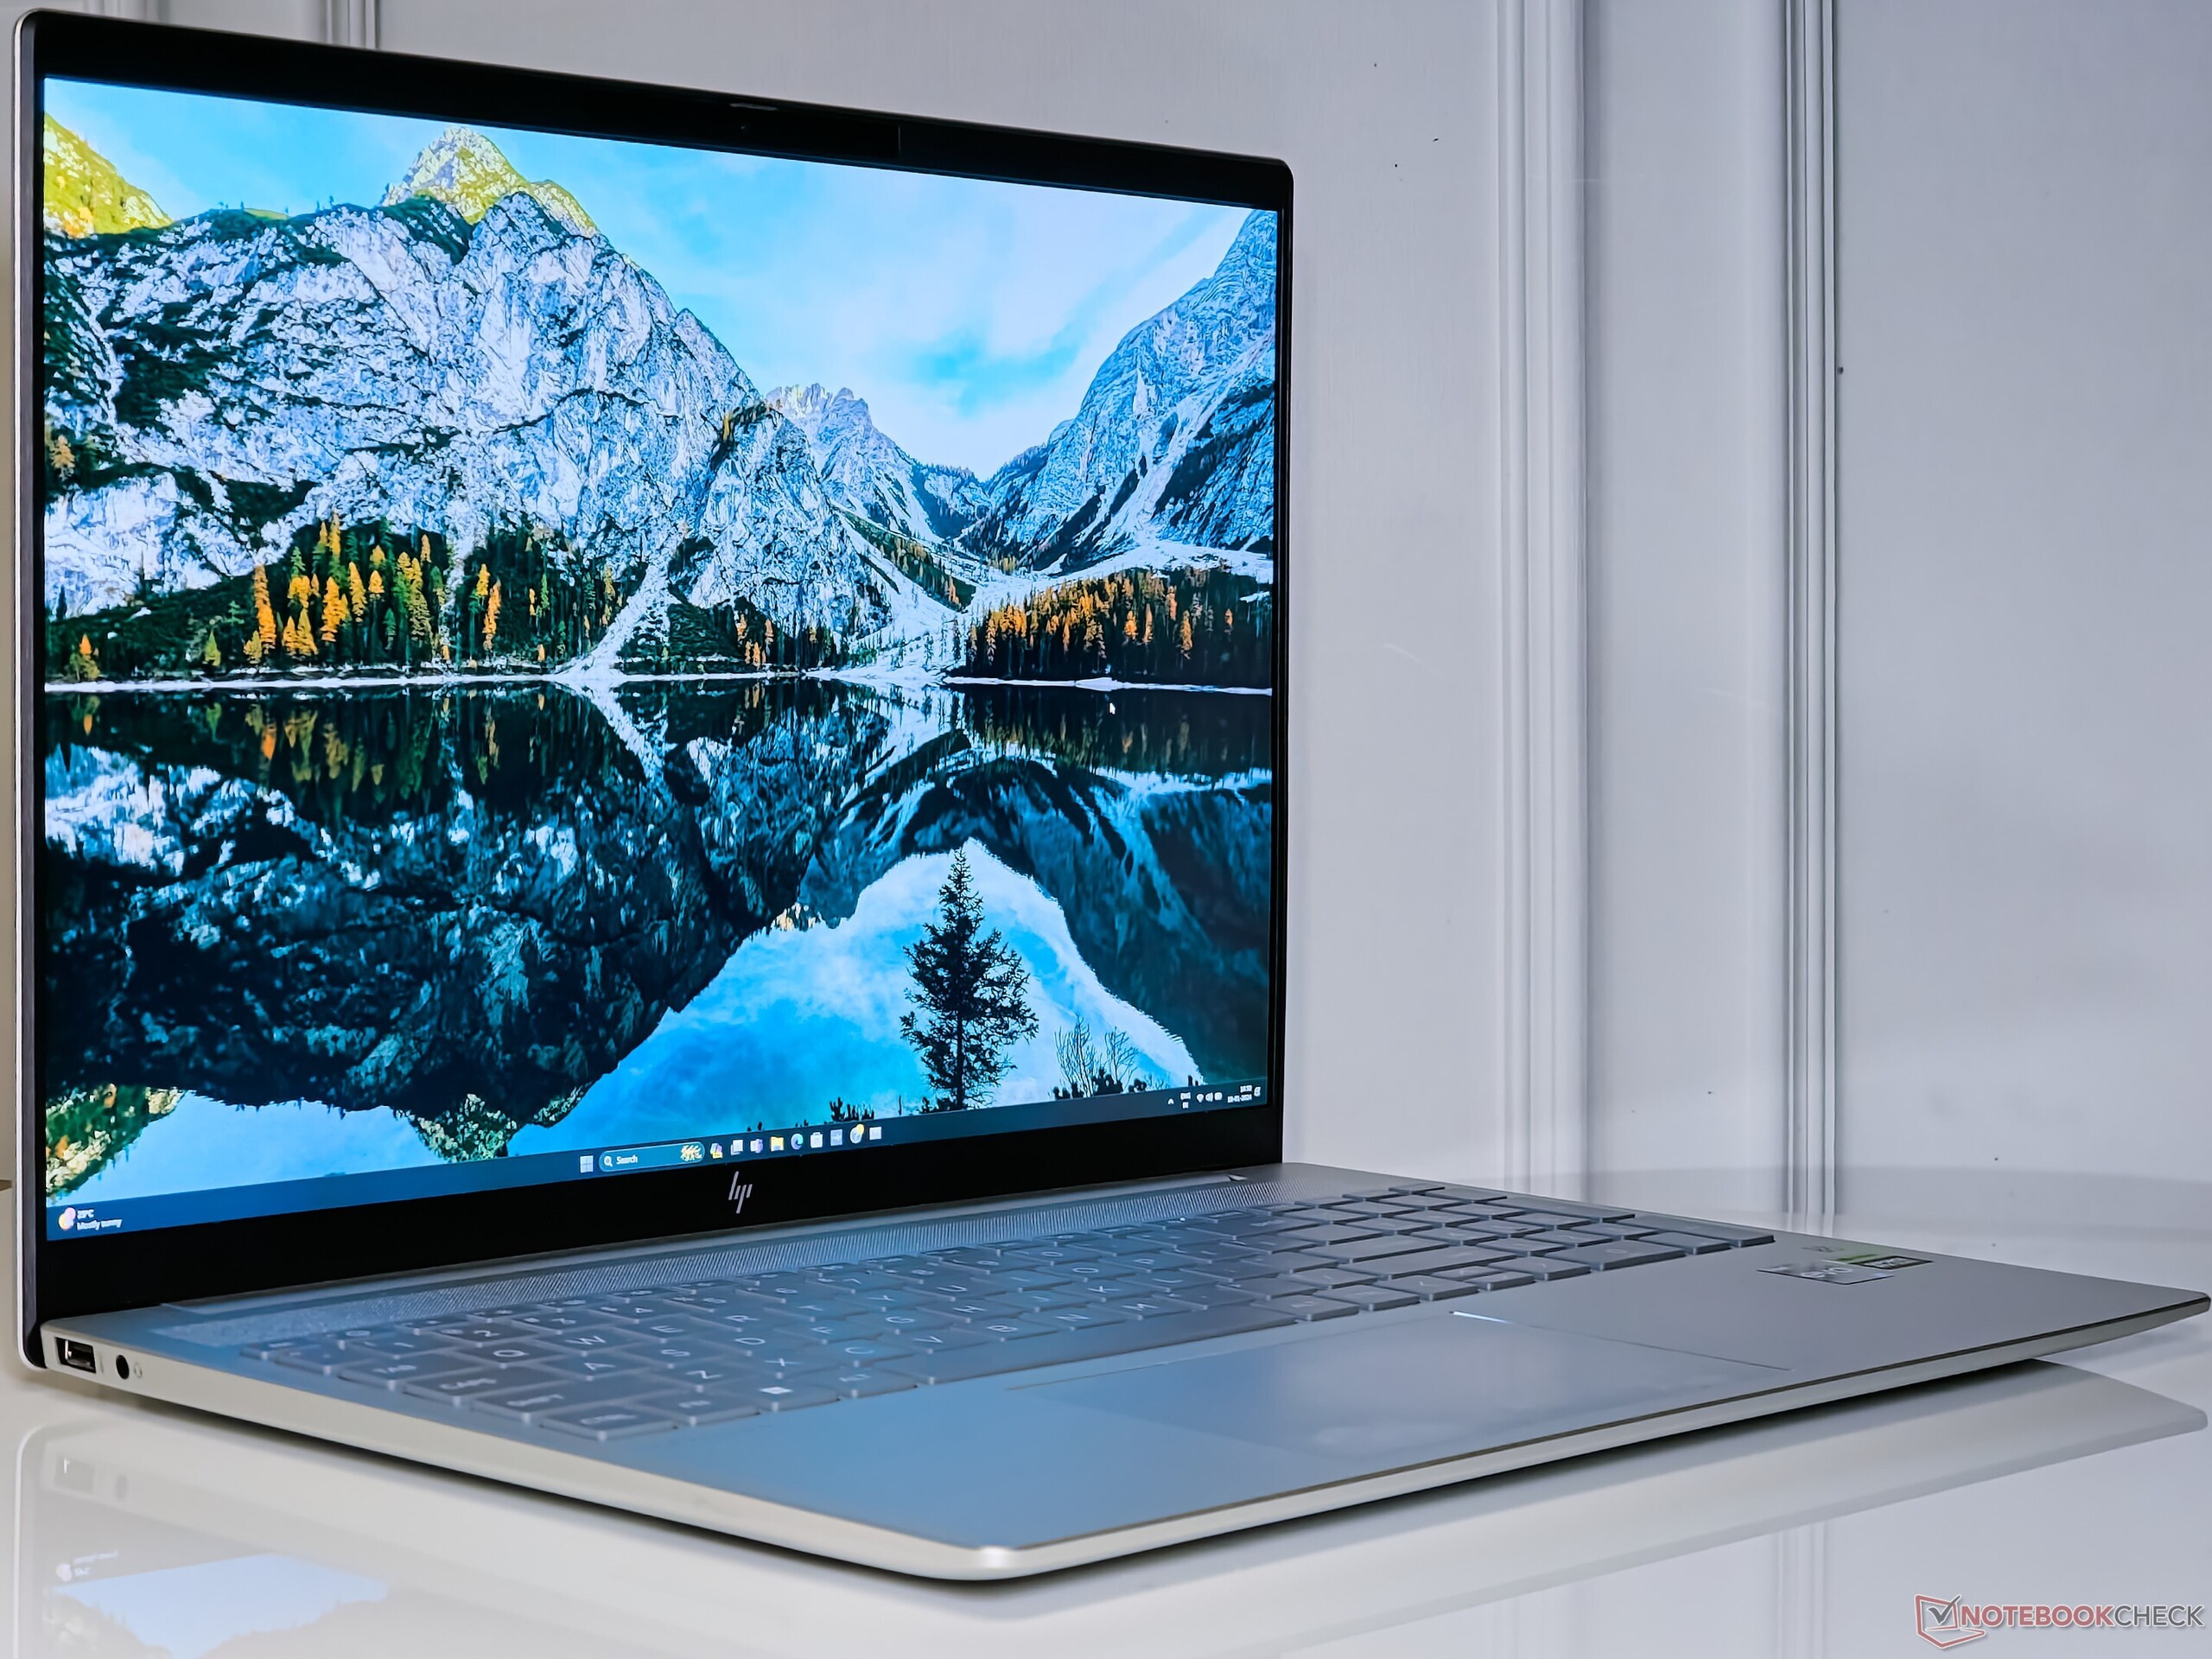
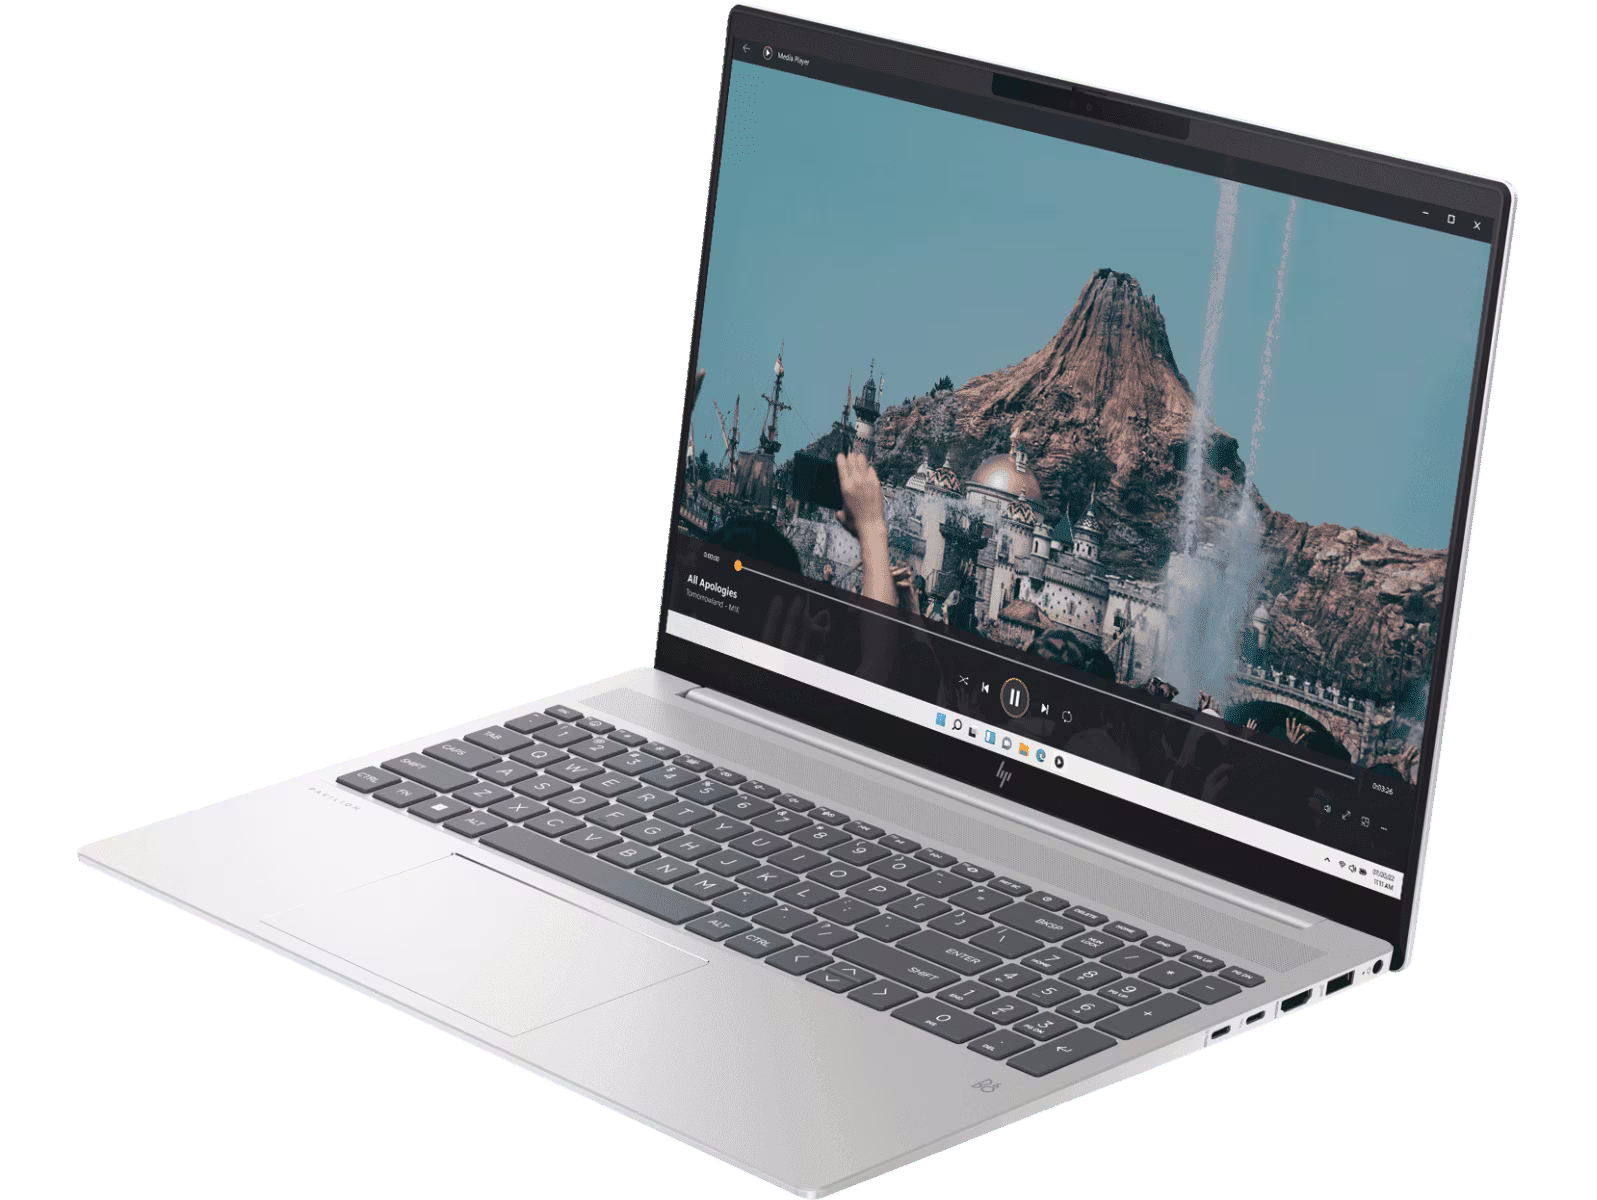
Chassis: Stevige, volledig metalen constructie
Net als de Pavilion Plus 14 heeft de Pavilion Plus 16 een Natural Silver metallic constructie voor de A-, C- en D-covers, terwijl het deksel van aluminium is gemaakt.
De algehele bouwkwaliteit laat weinig ruimte voor klachten. We hebben geen bijzondere buigingen in het deksel of het toetsenbord opgemerkt.
HP adverteert met een screen-to-body ratio van 89,74%, maar de gemeten waarde komt uit op 83%. Met 1,9 kg weegt de laptop vergelijkbaar met andere 16-inch multimedia laptops in de mode.
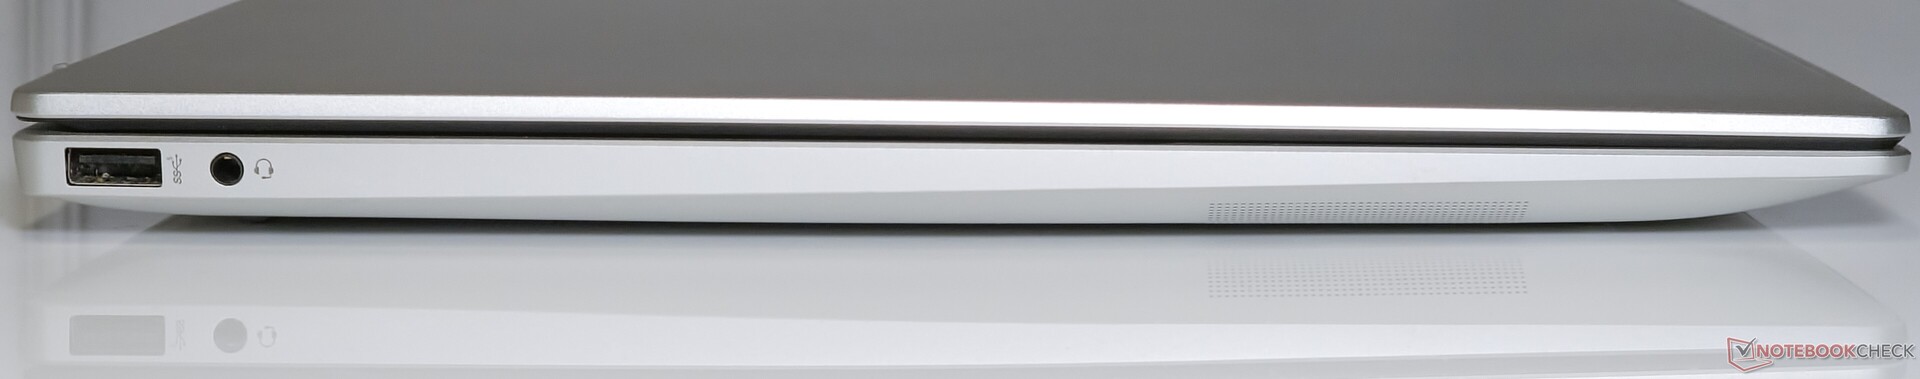
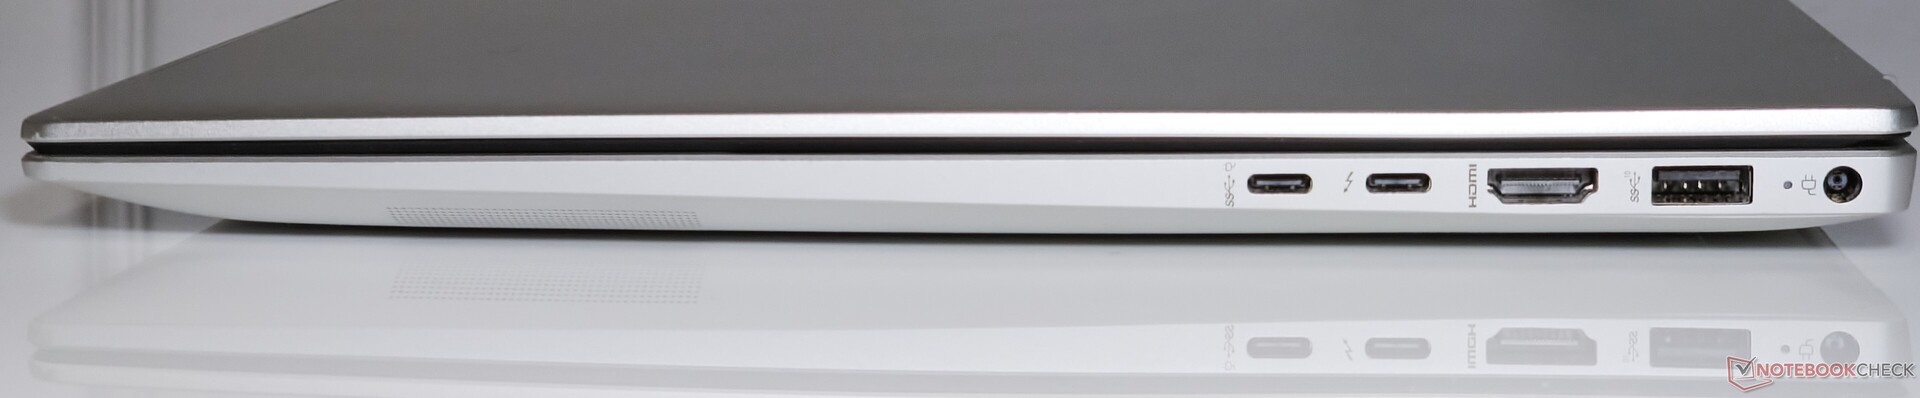
Connectiviteit: Consistente WLAN-doorvoer
De Pavilion Plus 16 biedt een behoorlijke selectie poorten, waaronder een USB Type-A en USB Type-C poorten, inclusief Thunderbolt 4.
De plaatsing van de poorten is prima en belemmert de aansluitmogelijkheden van aangrenzende randapparatuur niet, maar een van de Type-C poorten had aan de linkerkant kunnen zitten voor een gelijkmatigere verdeling.
Communicatie
De iPerf3-prestaties van de Pavilion Plus 16 in de 5 GHz-band zijn een beetje langzamer dan wat we zien bij de Asus VivoBook Pro 16 met dezelfde Intel Wi-Fi 6E AX211 WLAN-kaart.
De Pavilion maakt deze tekortkoming ten opzichte van de VivoBook Pro 16 in 6 GHz ontvangstprestaties goed, maar niet met veel.
de iPerf3-prestaties in zowel de 5 GHz als de 6 GHz band zijn redelijk consistent zonder haperingen, in tegenstelling tot wat we zien bij de Lenovo Slim Pro 7 met een MediaTek Wi-Fi 6E MT7922 chip.
| Networking / iperf3 transmit AXE11000 | |
| Asus VivoBook 14X K3405 | |
| HP Pavilion Plus 16-ab0456tx | |
| Asus VivoBook Pro 16 K6602VU | |
| Samsung Galaxy Book3 Ultra 16 | |
| Gemiddelde van klas Multimedia (606 - 1978, n=56, laatste 2 jaar) | |
| Lenovo Slim Pro 7 14ARP8 | |
| Dell Inspiron 16 Plus 7630 | |
| Gemiddeld Intel Wi-Fi 6E AX211 (64 - 1921, n=276) | |
| Networking / iperf3 receive AXE11000 | |
| Asus VivoBook 14X K3405 | |
| Asus VivoBook Pro 16 K6602VU | |
| HP Pavilion Plus 16-ab0456tx | |
| Samsung Galaxy Book3 Ultra 16 | |
| Lenovo Slim Pro 7 14ARP8 | |
| Gemiddeld Intel Wi-Fi 6E AX211 (582 - 1890, n=276) | |
| Gemiddelde van klas Multimedia (682 - 1818, n=56, laatste 2 jaar) | |
| Dell Inspiron 16 Plus 7630 | |
| Networking / iperf3 transmit AXE11000 6GHz | |
| HP Pavilion Plus 16-ab0456tx | |
| Dell Inspiron 16 Plus 7630 | |
| Gemiddelde van klas Multimedia (869 - 2373, n=23, laatste 2 jaar) | |
| Asus VivoBook 14X K3405 | |
| Asus VivoBook Pro 16 K6602VU | |
| Gemiddeld Intel Wi-Fi 6E AX211 (385 - 1851, n=226) | |
| Networking / iperf3 receive AXE11000 6GHz | |
| HP Pavilion Plus 16-ab0456tx | |
| Gemiddelde van klas Multimedia (1212 - 2361, n=23, laatste 2 jaar) | |
| Asus VivoBook Pro 16 K6602VU | |
| Asus VivoBook 14X K3405 | |
| Gemiddeld Intel Wi-Fi 6E AX211 (700 - 1857, n=226) | |
| Dell Inspiron 16 Plus 7630 | |
Webcam
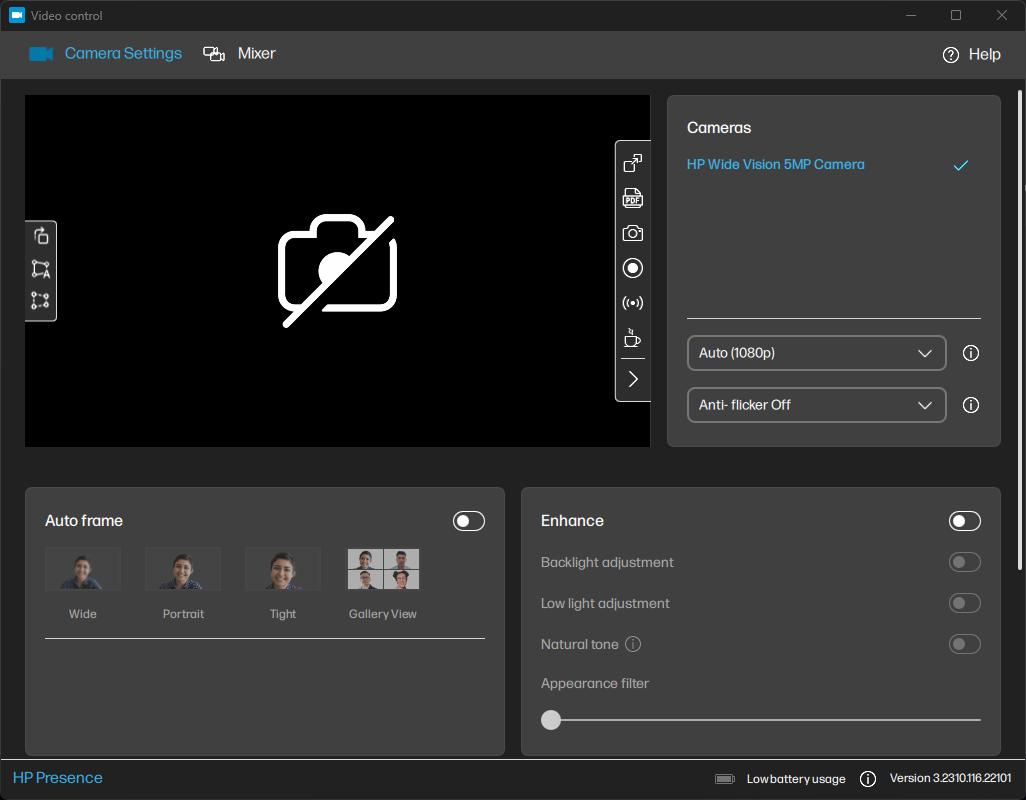
De 5 MP webcam produceert fatsoenlijke beelden die goed bruikbaar zijn voor videoconferenties. Details blijven redelijk goed behouden voor een laptop webcam, maar de camera kan moeite hebben bij weinig licht.
HP biedt een aantal handige hulpprogramma's zoals HP Enhanced Lighting dat het scherm rond het onderwerp helderder maakt en een Video Control app die extra opties biedt voor kadrering en beeldaanpassing.


Beveiliging
HP levert een IR-camera die compatibel is met Windows Hello voor de Pavilion Plus 16, samen met een privacy shutter voor de webcam. De IR-camera presteerde redelijk snel toen we het apparaat gebruikten.
Daarnaast is er een TPM 2.0 module aanwezig om te voldoen aan de beveiligingsvereisten van Windows 11.
Accessoires en garantie
Er zitten geen extra accessoires in de doos, afgezien van de 135 W voedingsadapter en het gebruikelijke papierwerk.
HP biedt één jaar garantie voor de Pavilion Plus 16 in India. Kopers kunnen deze garantie met maximaal drie jaar verlengen door in aanmerking komende HP Care Packs aan te schaffen.
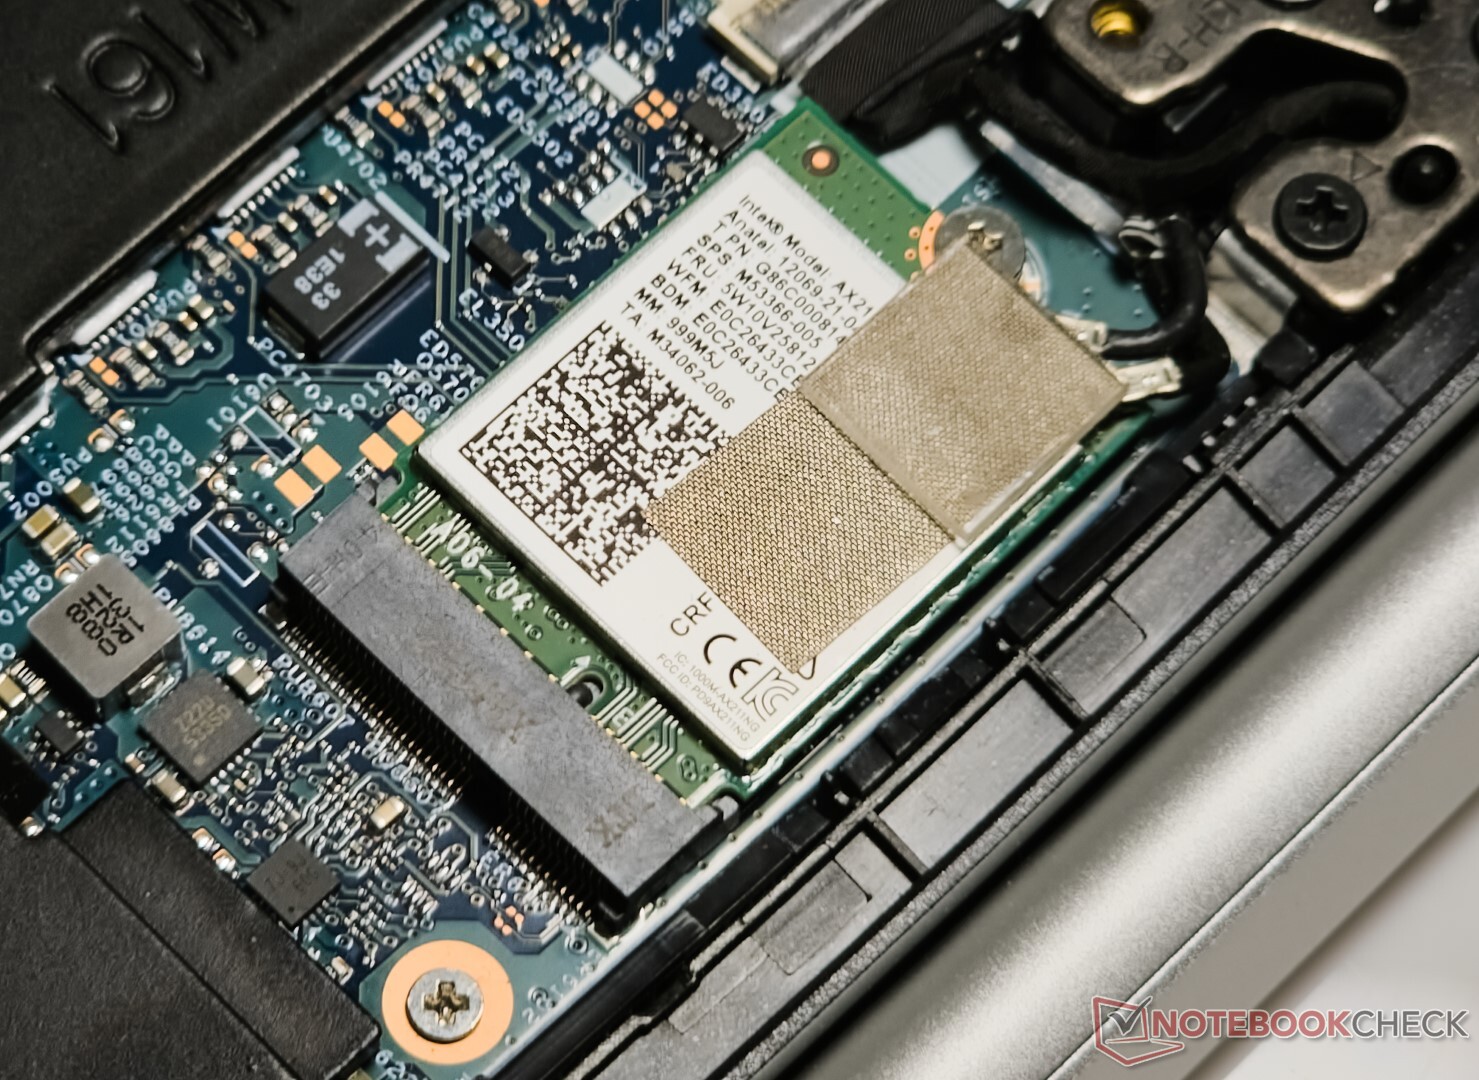
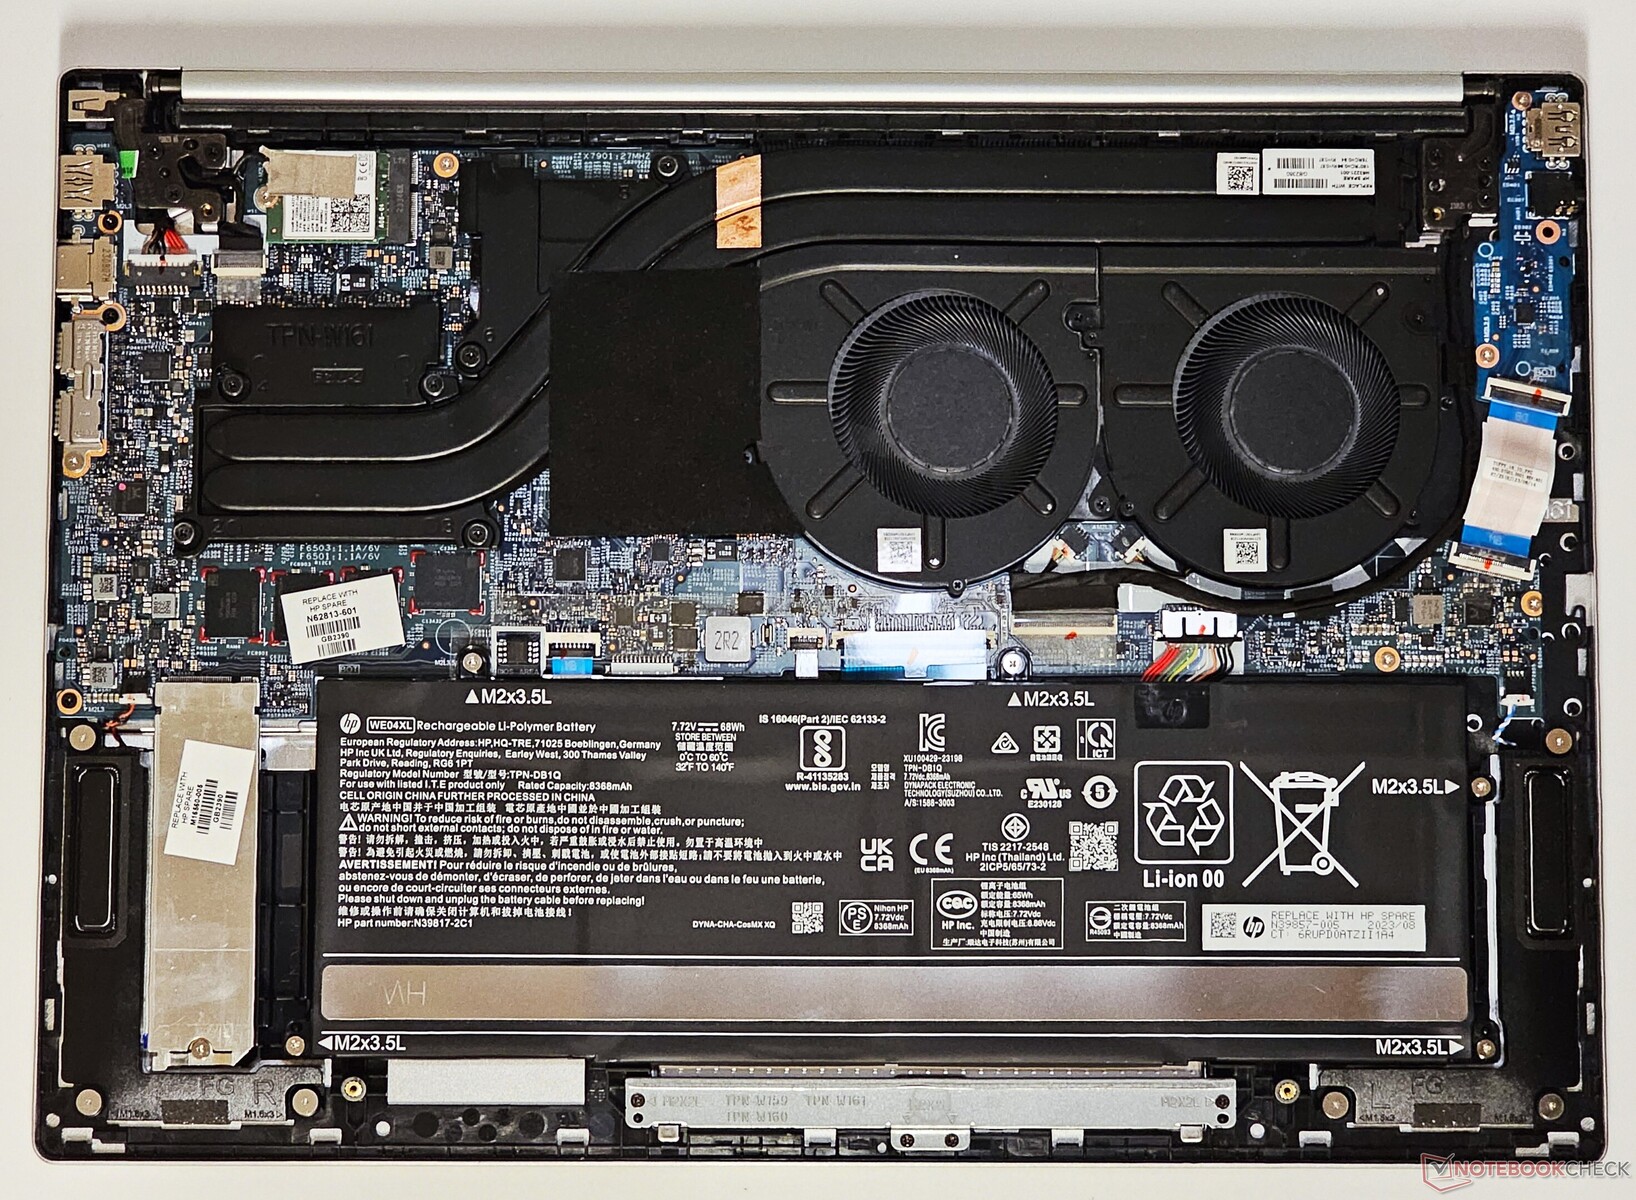
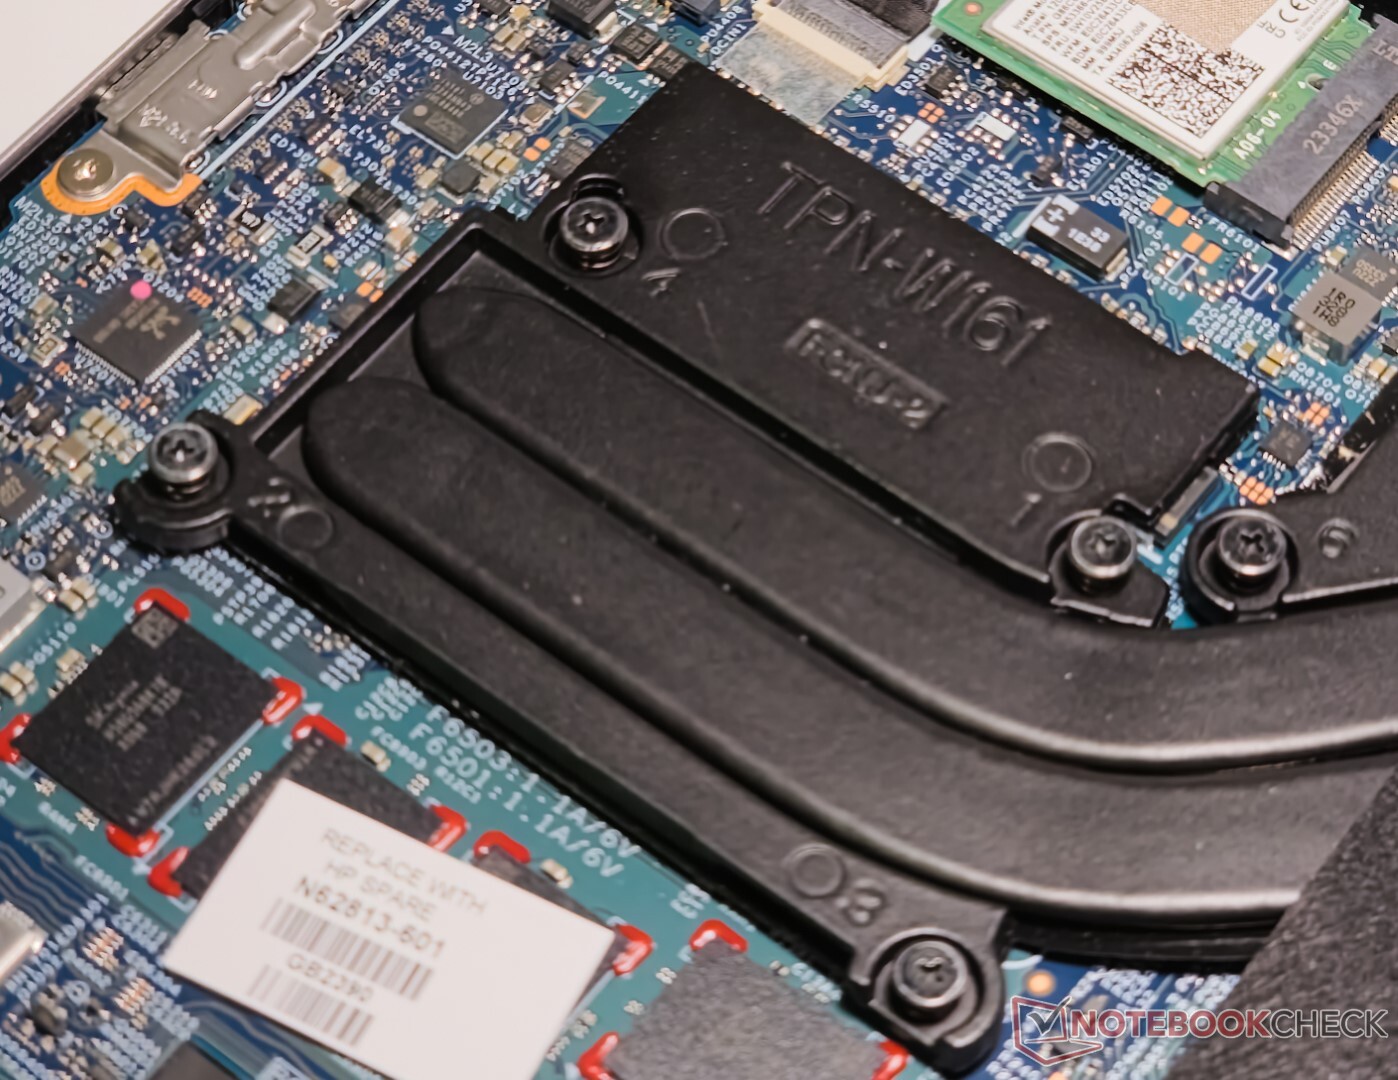
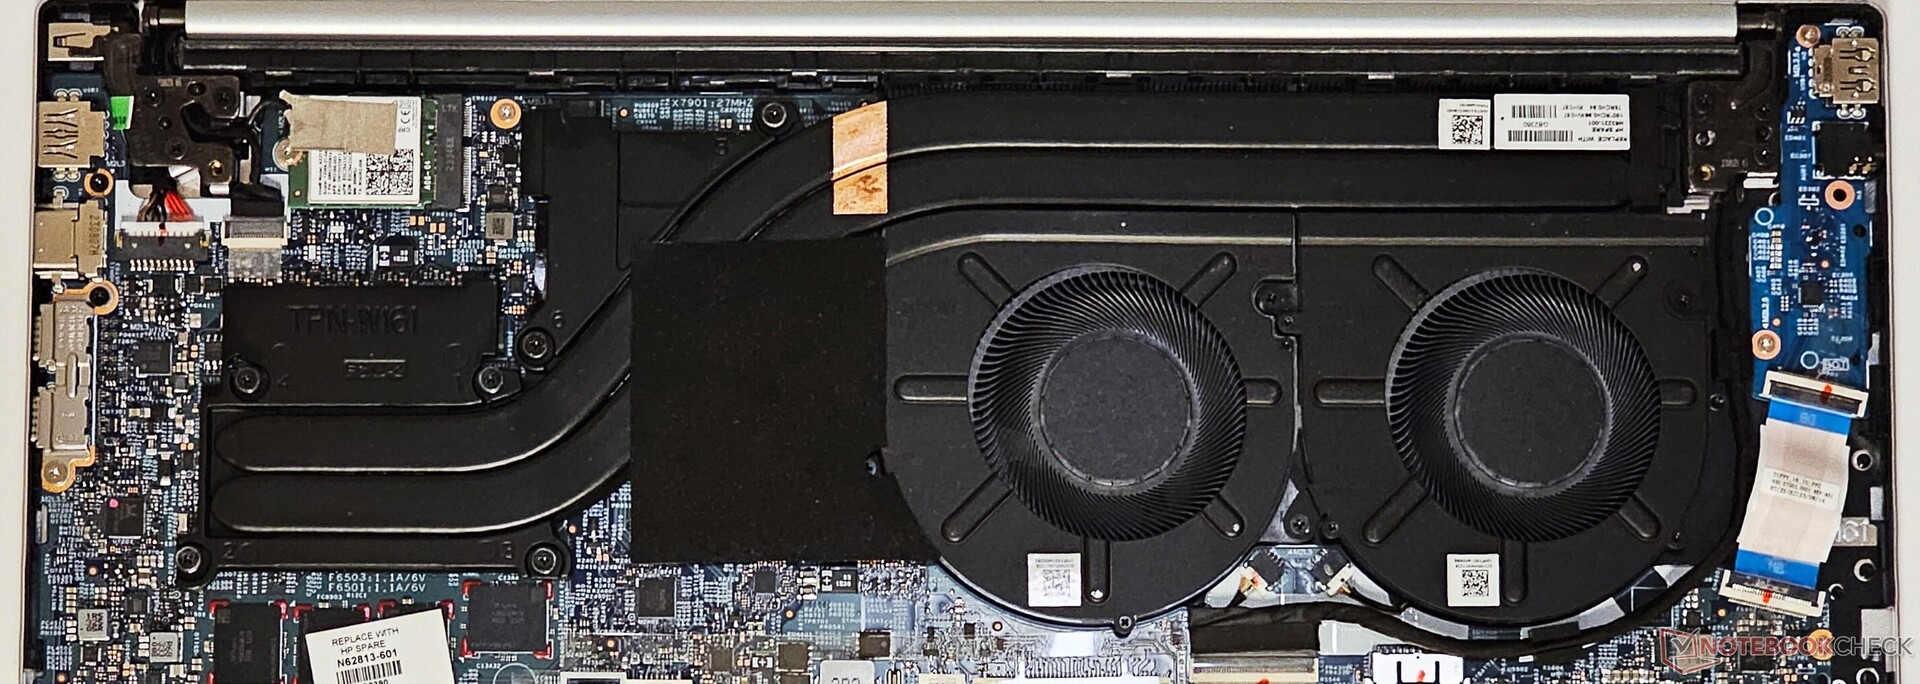
Onderhoud
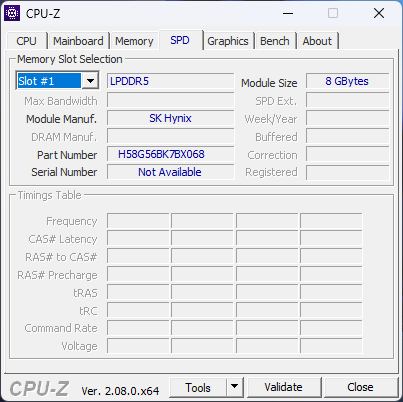
Het bodempaneel kan worden opengehaald na het verwijderen van de vier PH0-schroeven. Het geheugen is gesoldeerd, maar de WLAN-kaart, NVMe SSD en de batterij kunnen indien nodig worden vervangen.
Invoerapparaten: Groot numeriek toetsenblok met fatsoenlijke tactiliteit
Toetsenbord
Het toetsenbord van de Pavilion Plus 16 biedt een fatsoenlijke type-ervaring. De grijze toetsen bieden een goed contrast met de Natural Silver kleur van het chassis. Het numpad is ruim en komt goed van pas bij het kraken van getallen in Excel. Er ontbreekt echter een Num Lock-indicator.
De aan/uit-knop bevindt zich net naast de Delete-toets, wat verwarrend kan zijn voor nieuwe gebruikers. De bovenste en onderste pijltjestoetsen voelen ook krap aan. Een drietraps witte achtergrondverlichting helpt bij de leesbaarheid bij weinig licht.
Touchpad
Het 12,5 cm x 8 cm touchpad voelt ruim aan en biedt een soepele glijervaring met goede feedback. De travel is echter niet zo diep.
Het hele touchpad fungeert als linkermuisknop. Klikken in het midden en aan de onderkant van het touchpad reageert beter dan klikken aan de bovenkant.
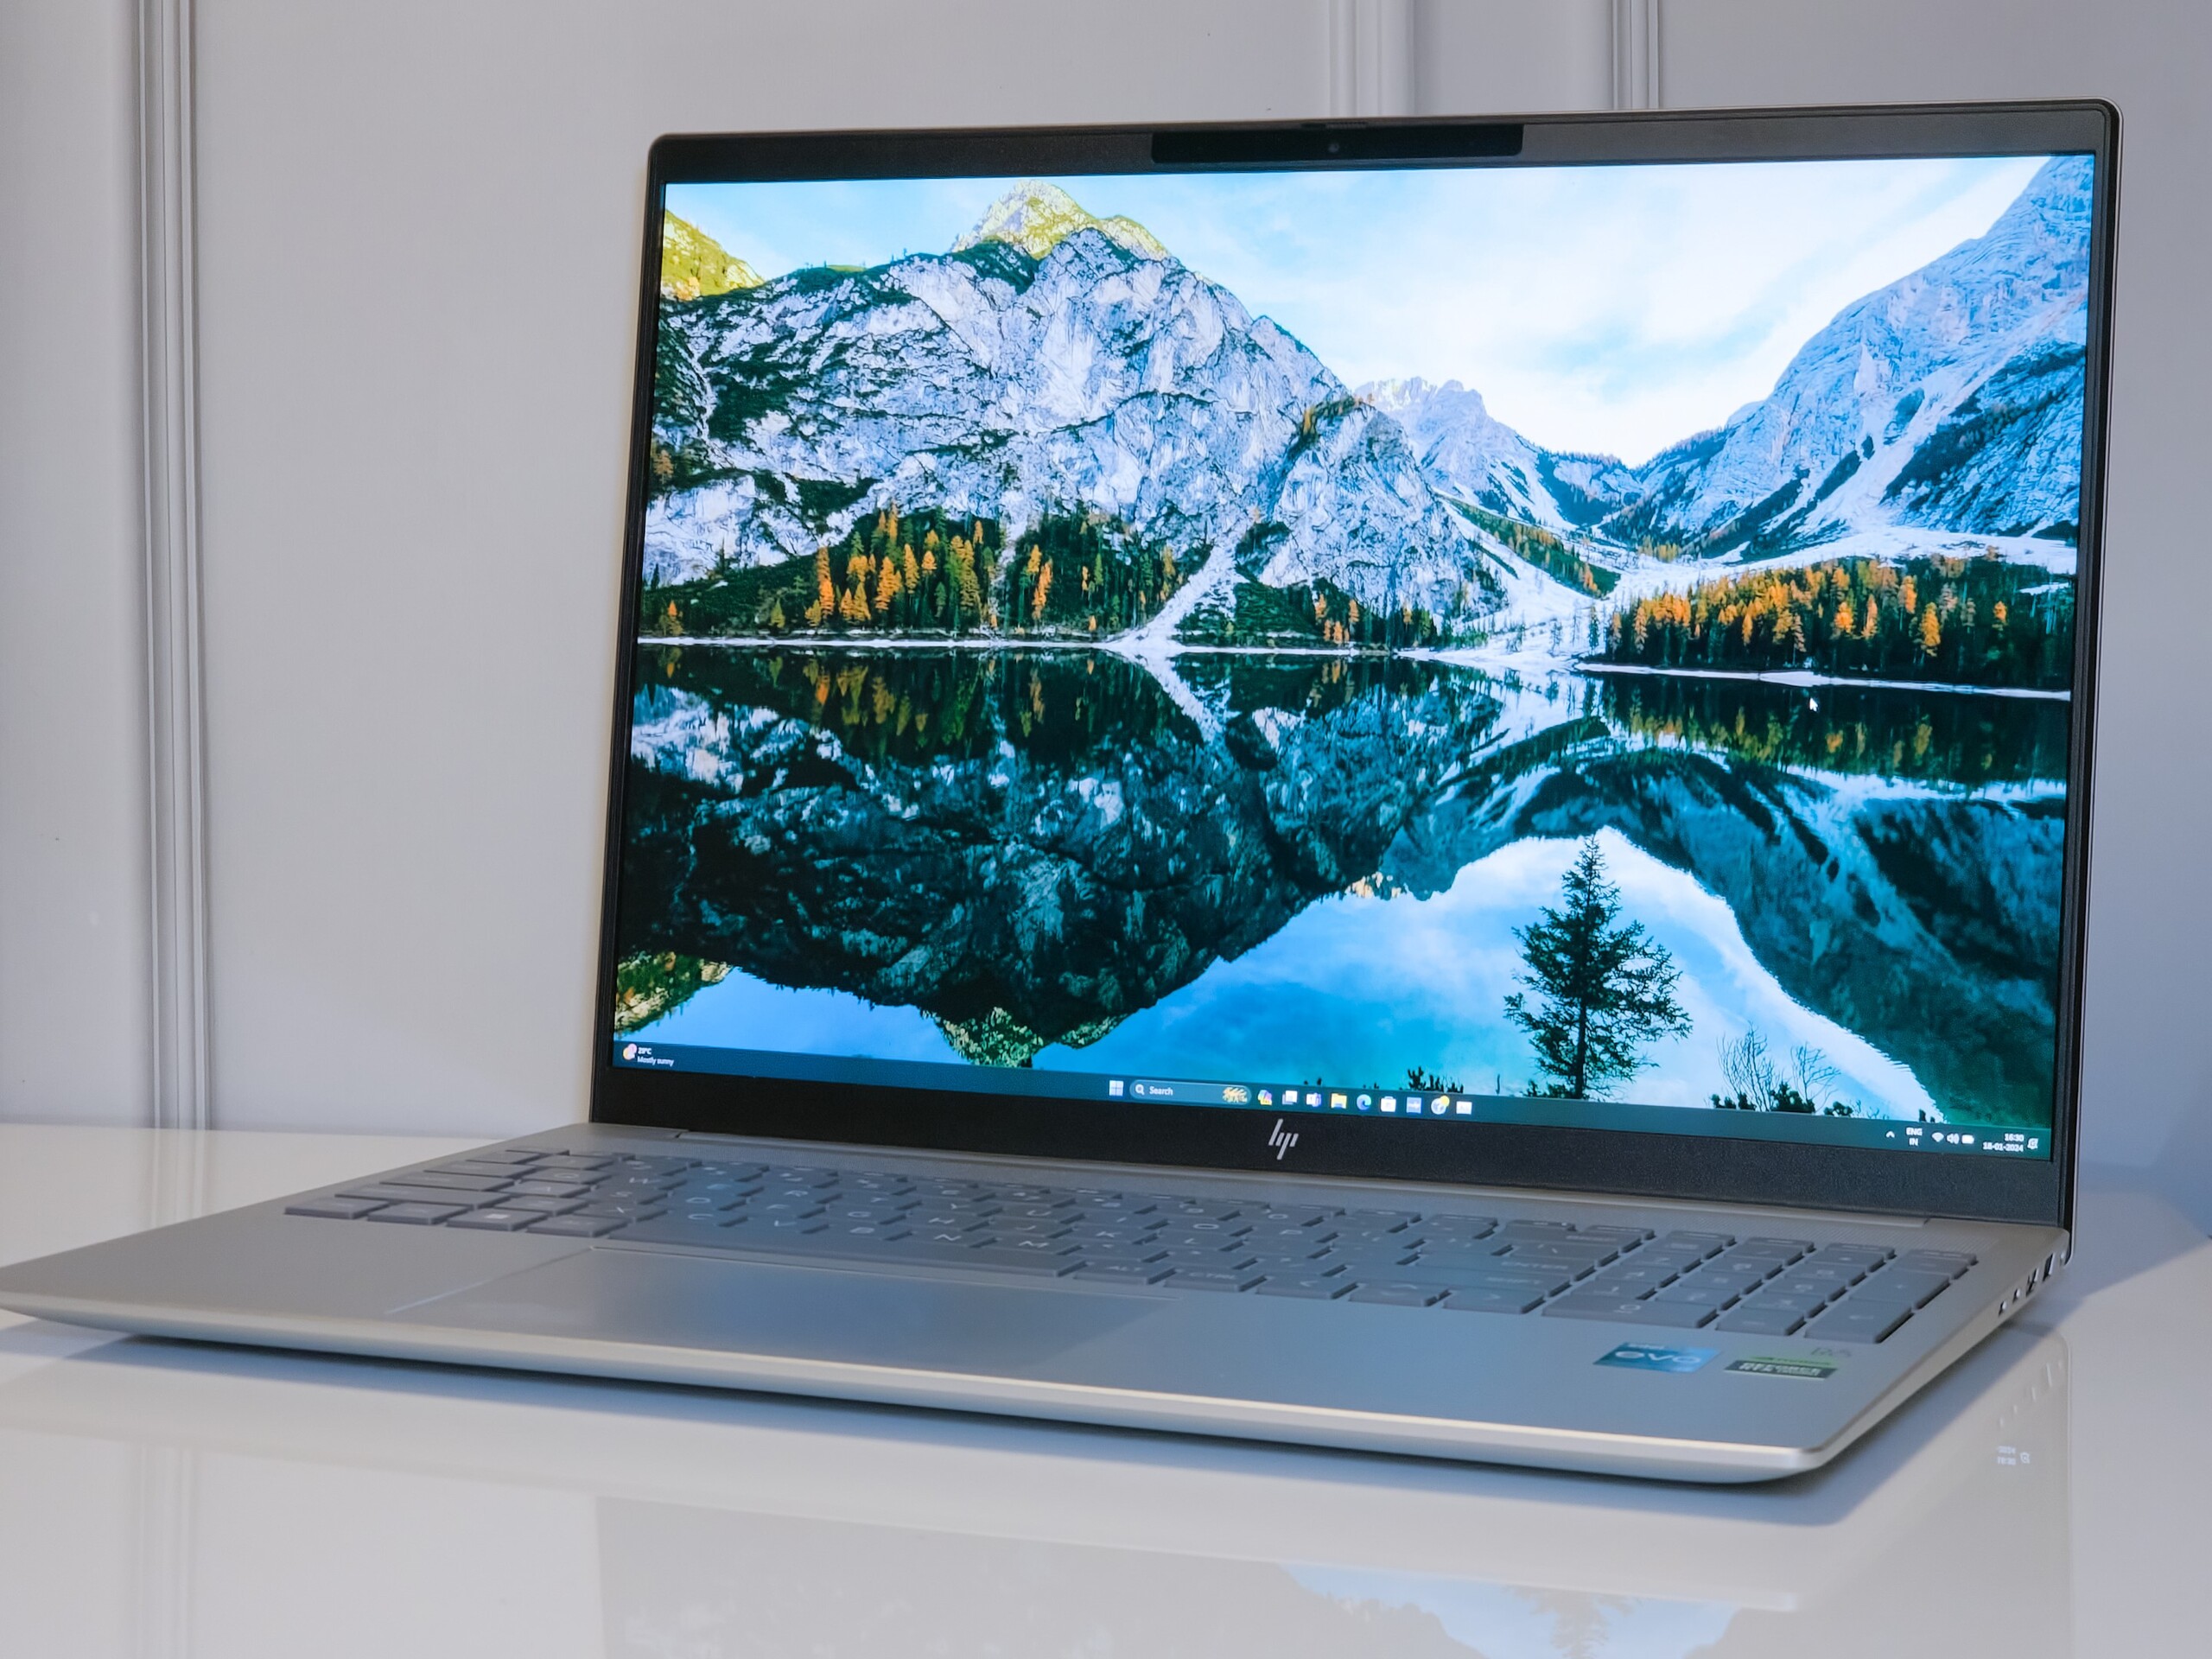
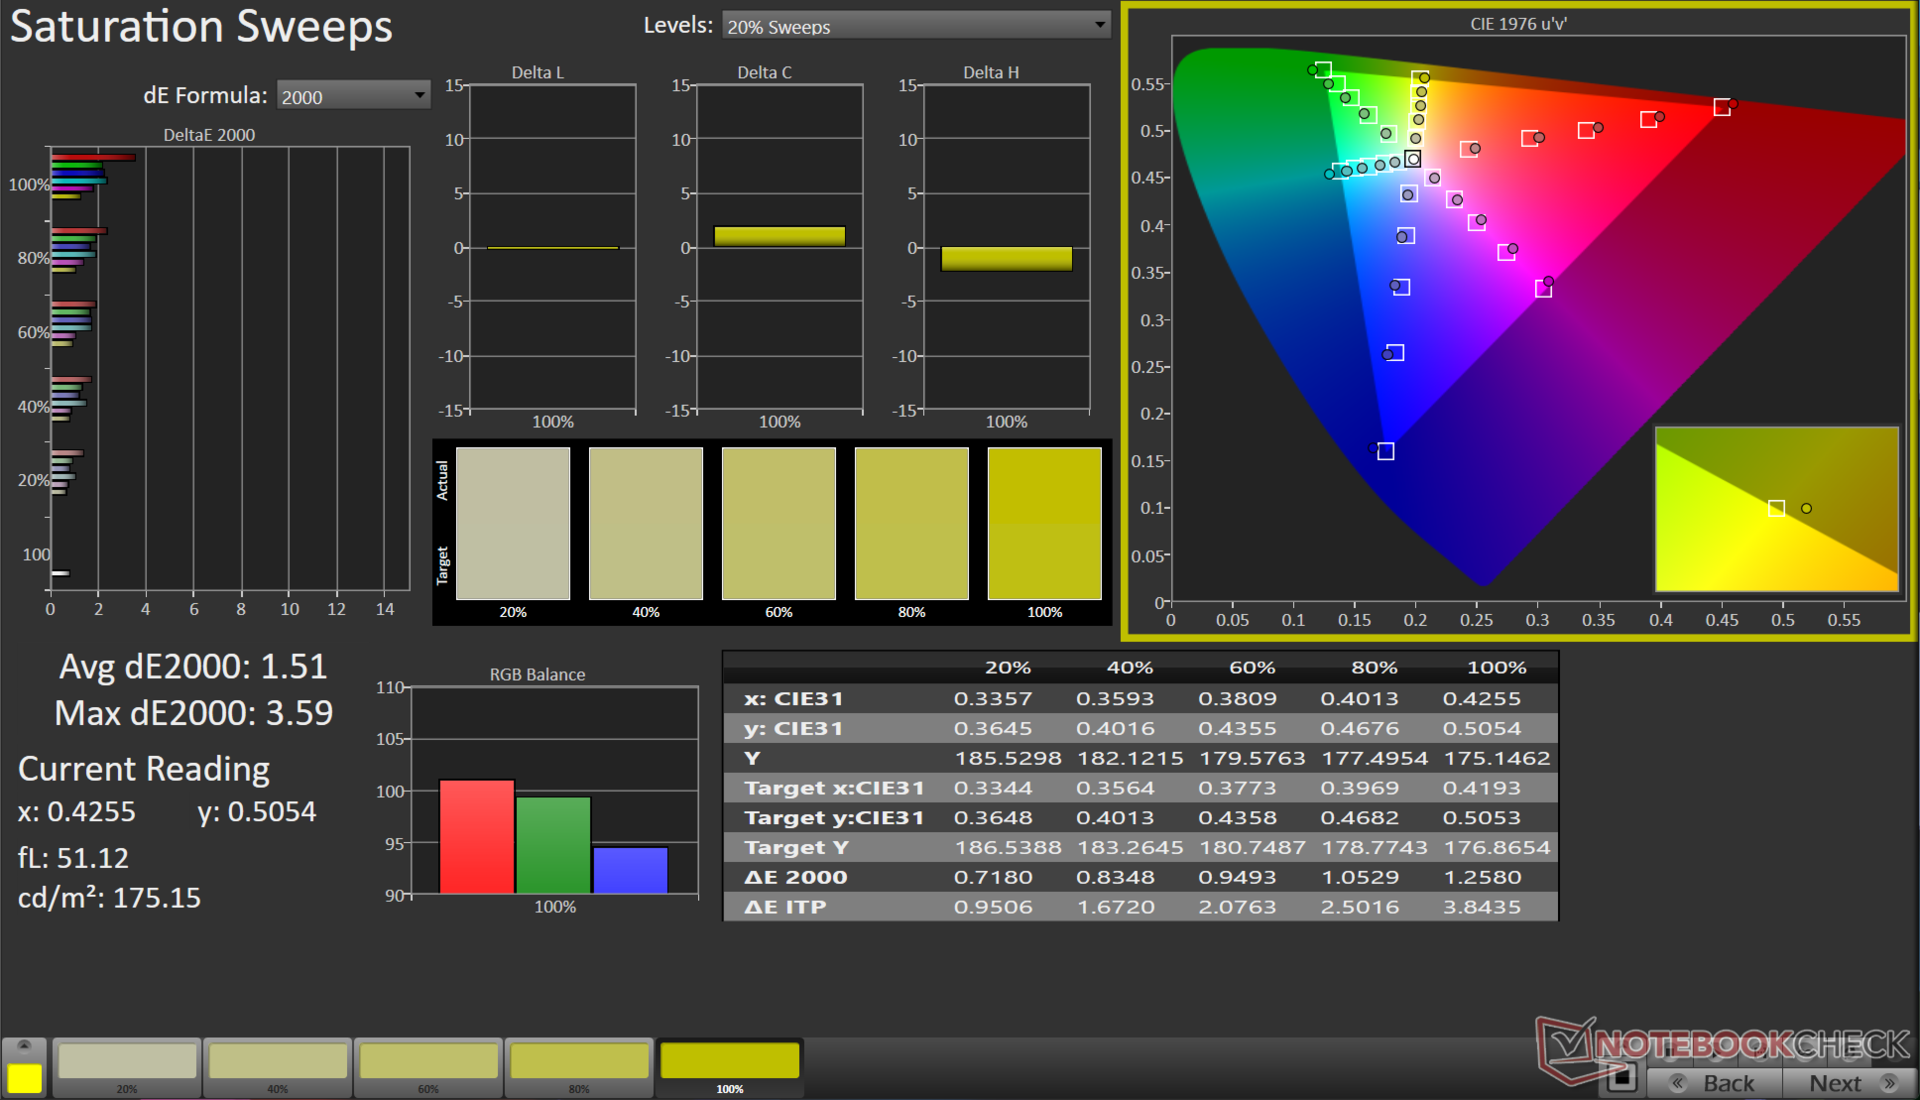
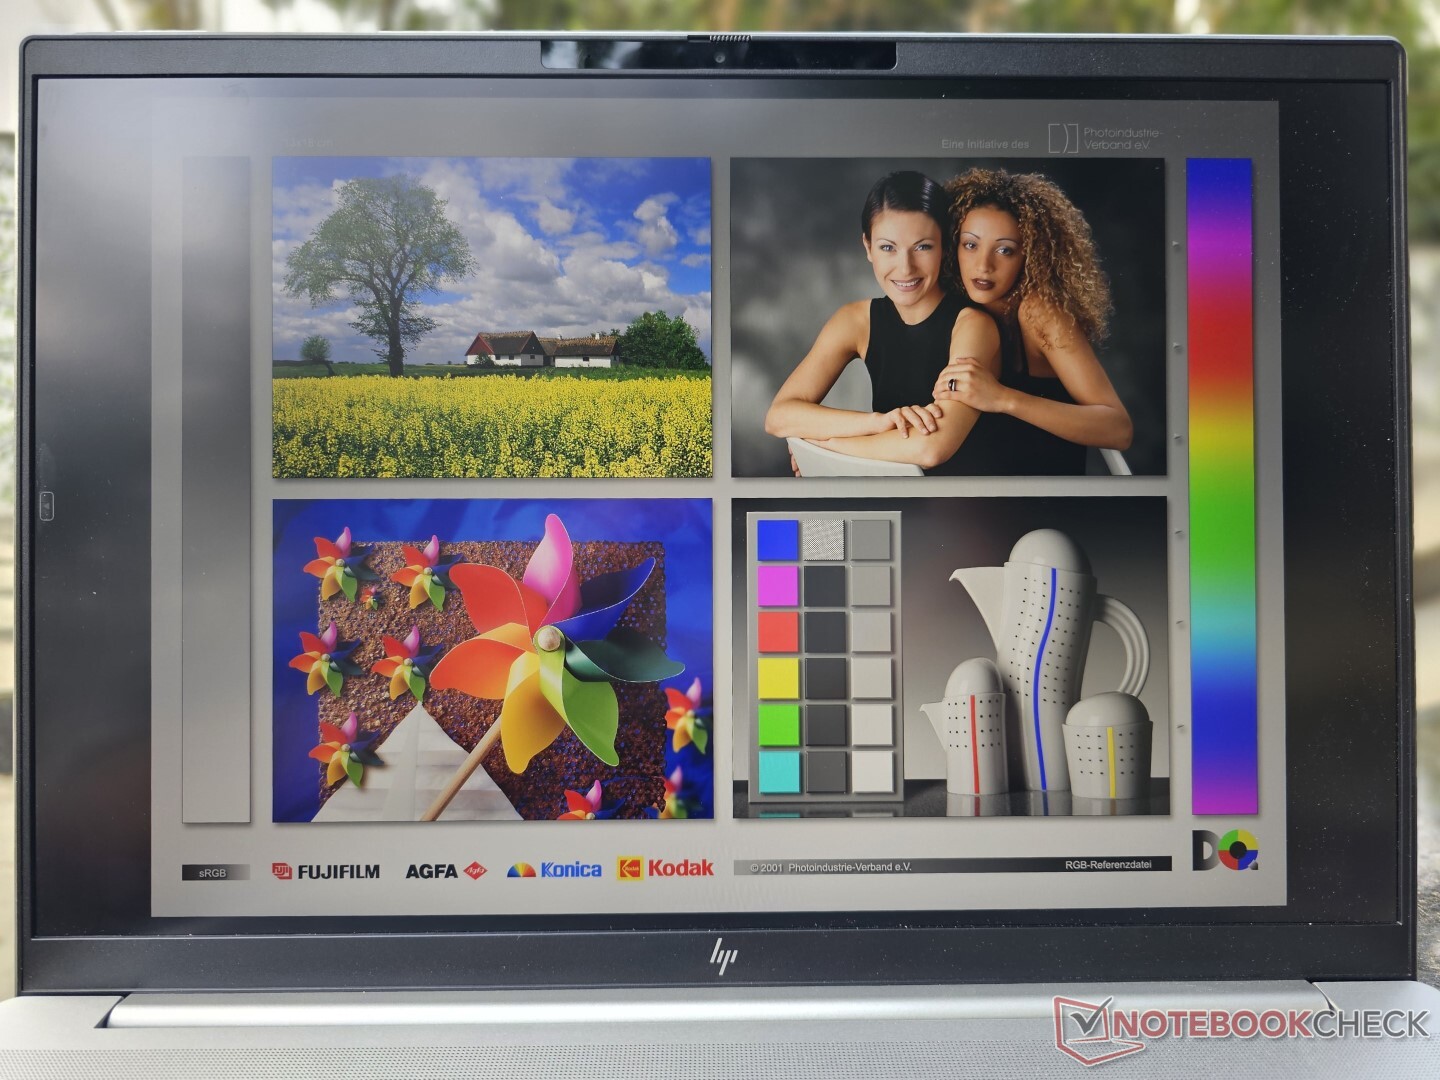
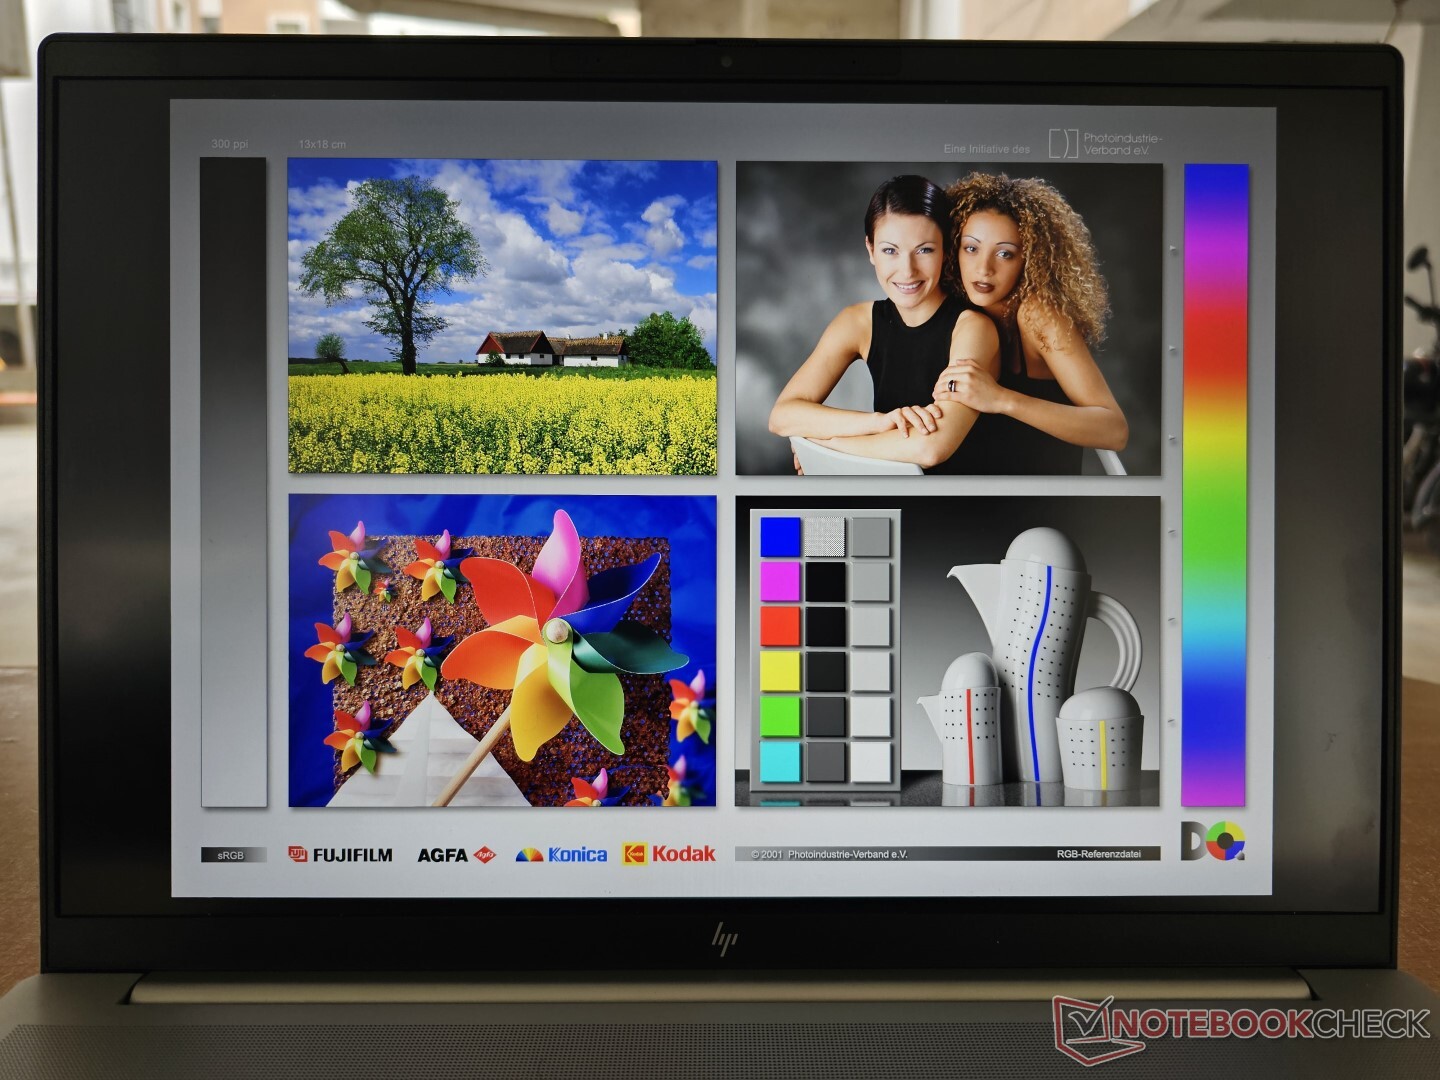
Beeldscherm: 120 Hz WQXGA-paneel met een fatsoenlijk kleurprofiel en geen PWM
De Pavilion Plus 16 wordt geleverd met een 16-inch 16:10 2560 x 1600 WQXGA IPS-paneel met een verversingssnelheid van 120 Hz en een nominale helderheid van 400 nits.
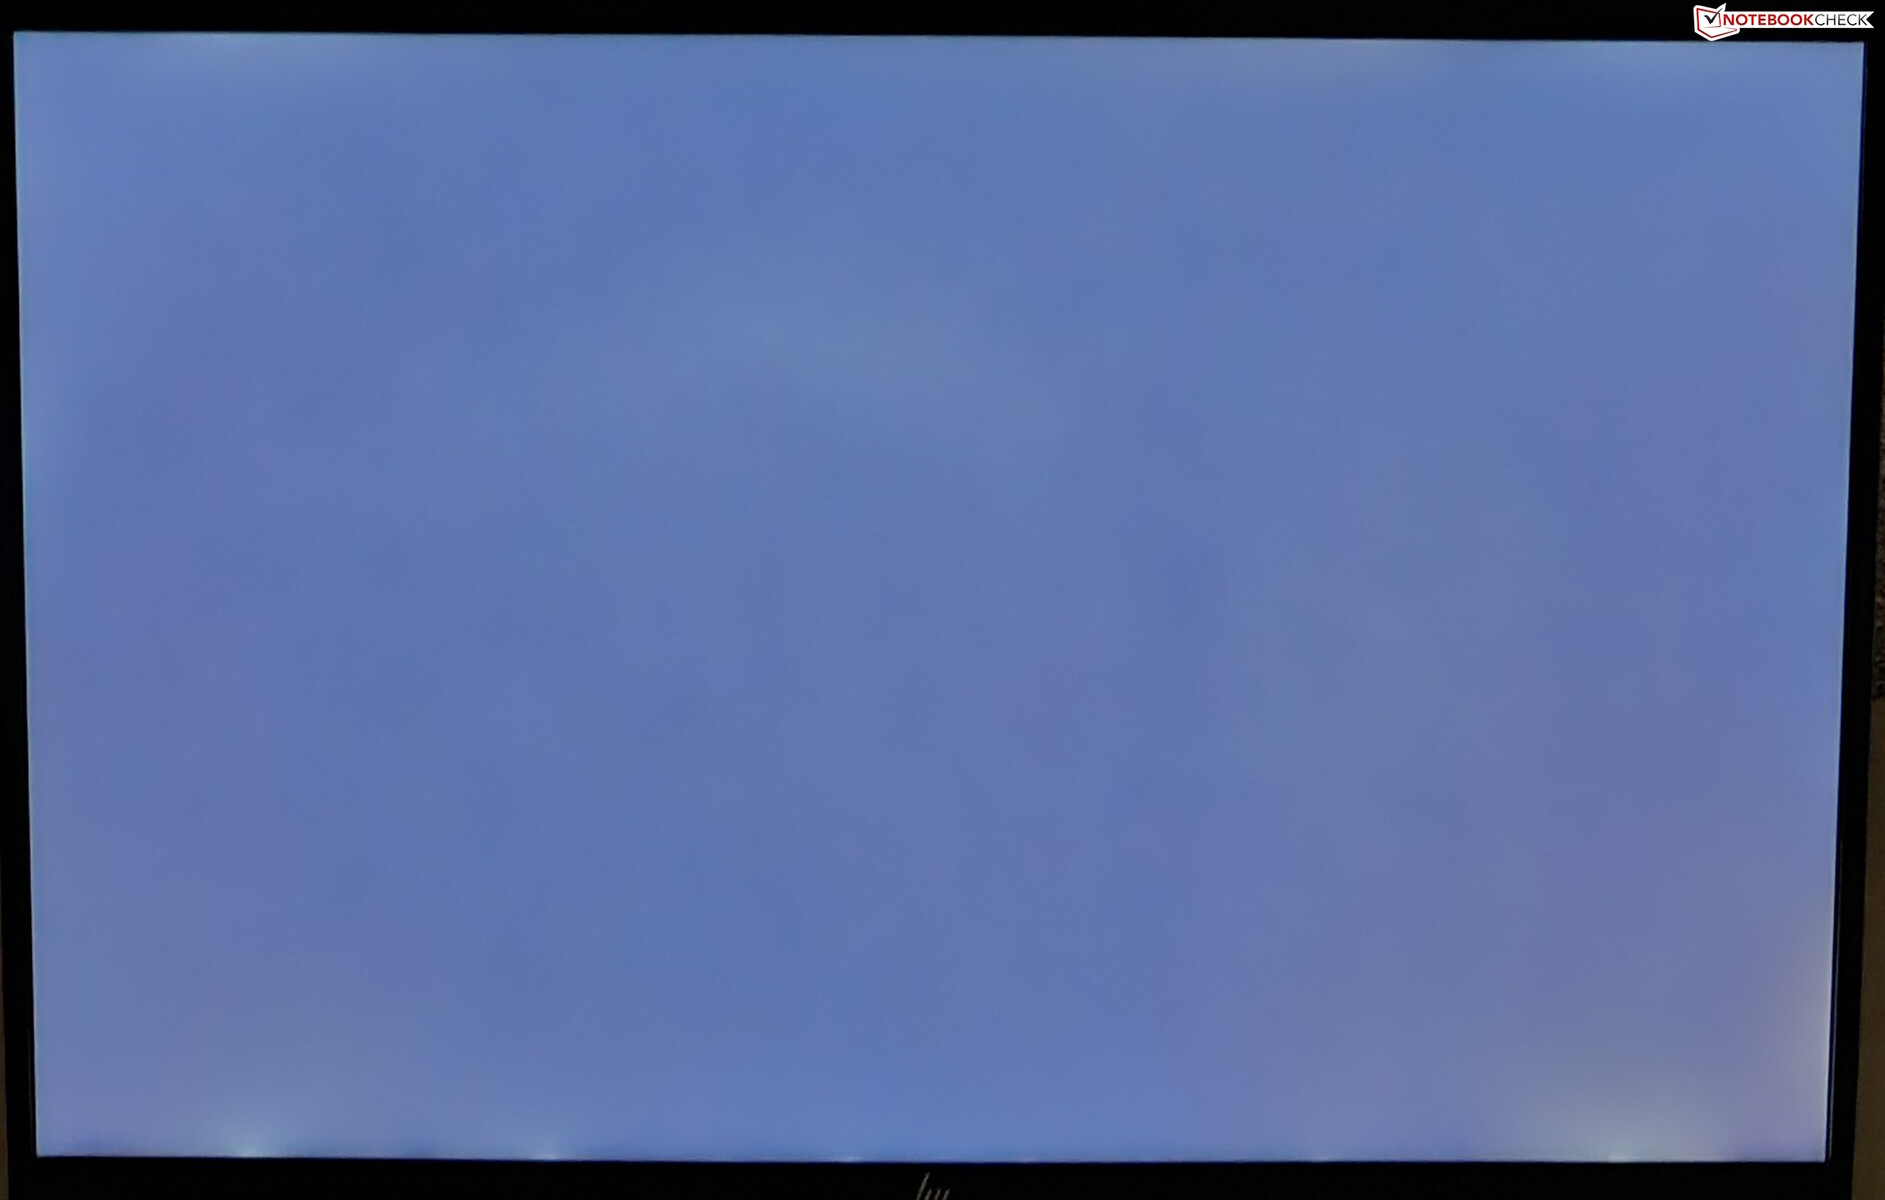
Wij hebben tot 415 nits maximale helderheid gemeten met een gemiddelde van 394 nits en een goede 90% verdeling. Omdat het een IPS-paneel is, is het scherm niet immuun voor backlight bleed - dit kan worden opgemerkt in de lagere hoeken bij lange belichting.
Subjectief gezien biedt de Pavilion Plus 16 een goede kijkervaring die geschikt zou moeten zijn voor zowel werk als entertainment.
| |||||||||||||||||||||||||
Helderheidsverdeling: 90 %
Helderheid in Batterij-modus: 401 cd/m²
Contrast: 1185:1 (Zwart: 0.34 cd/m²)
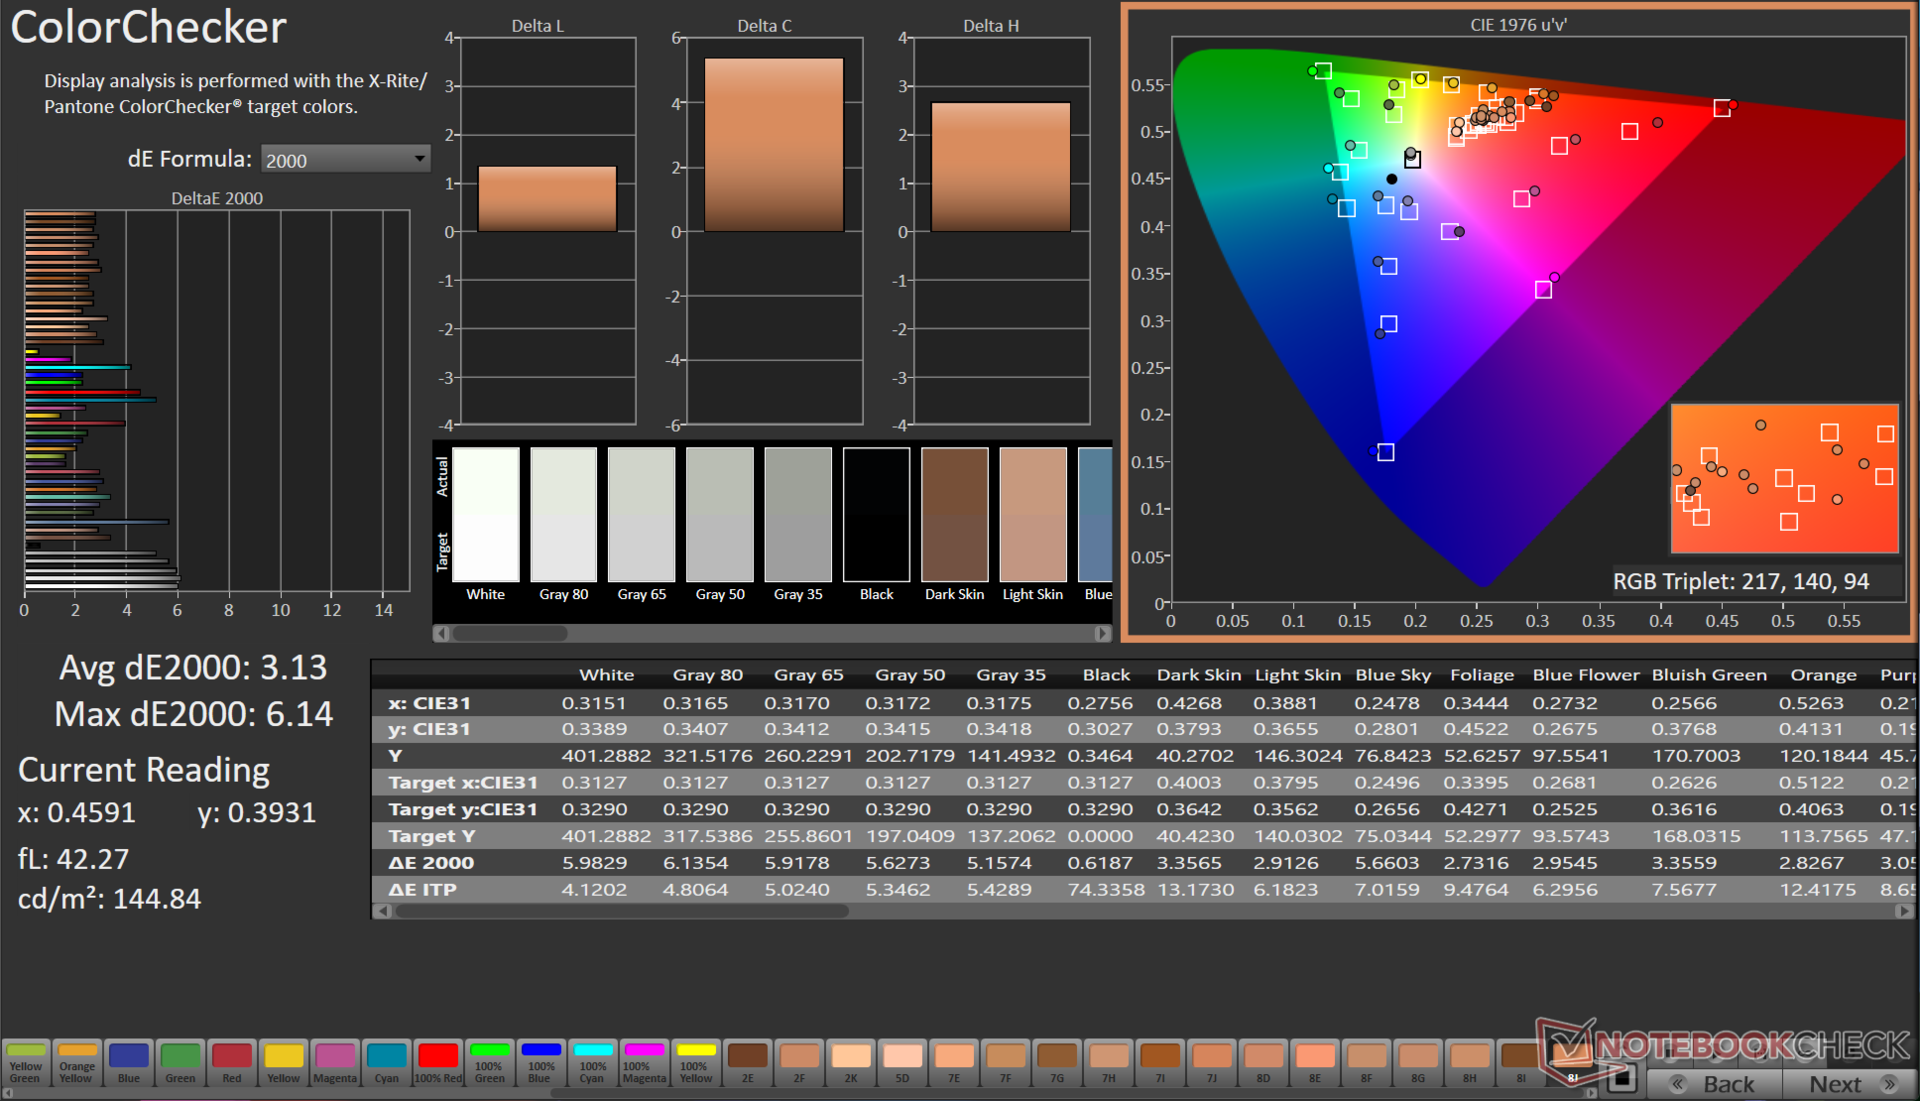
ΔE ColorChecker Calman: 3.13 | ∀{0.5-29.43 Ø4.71}
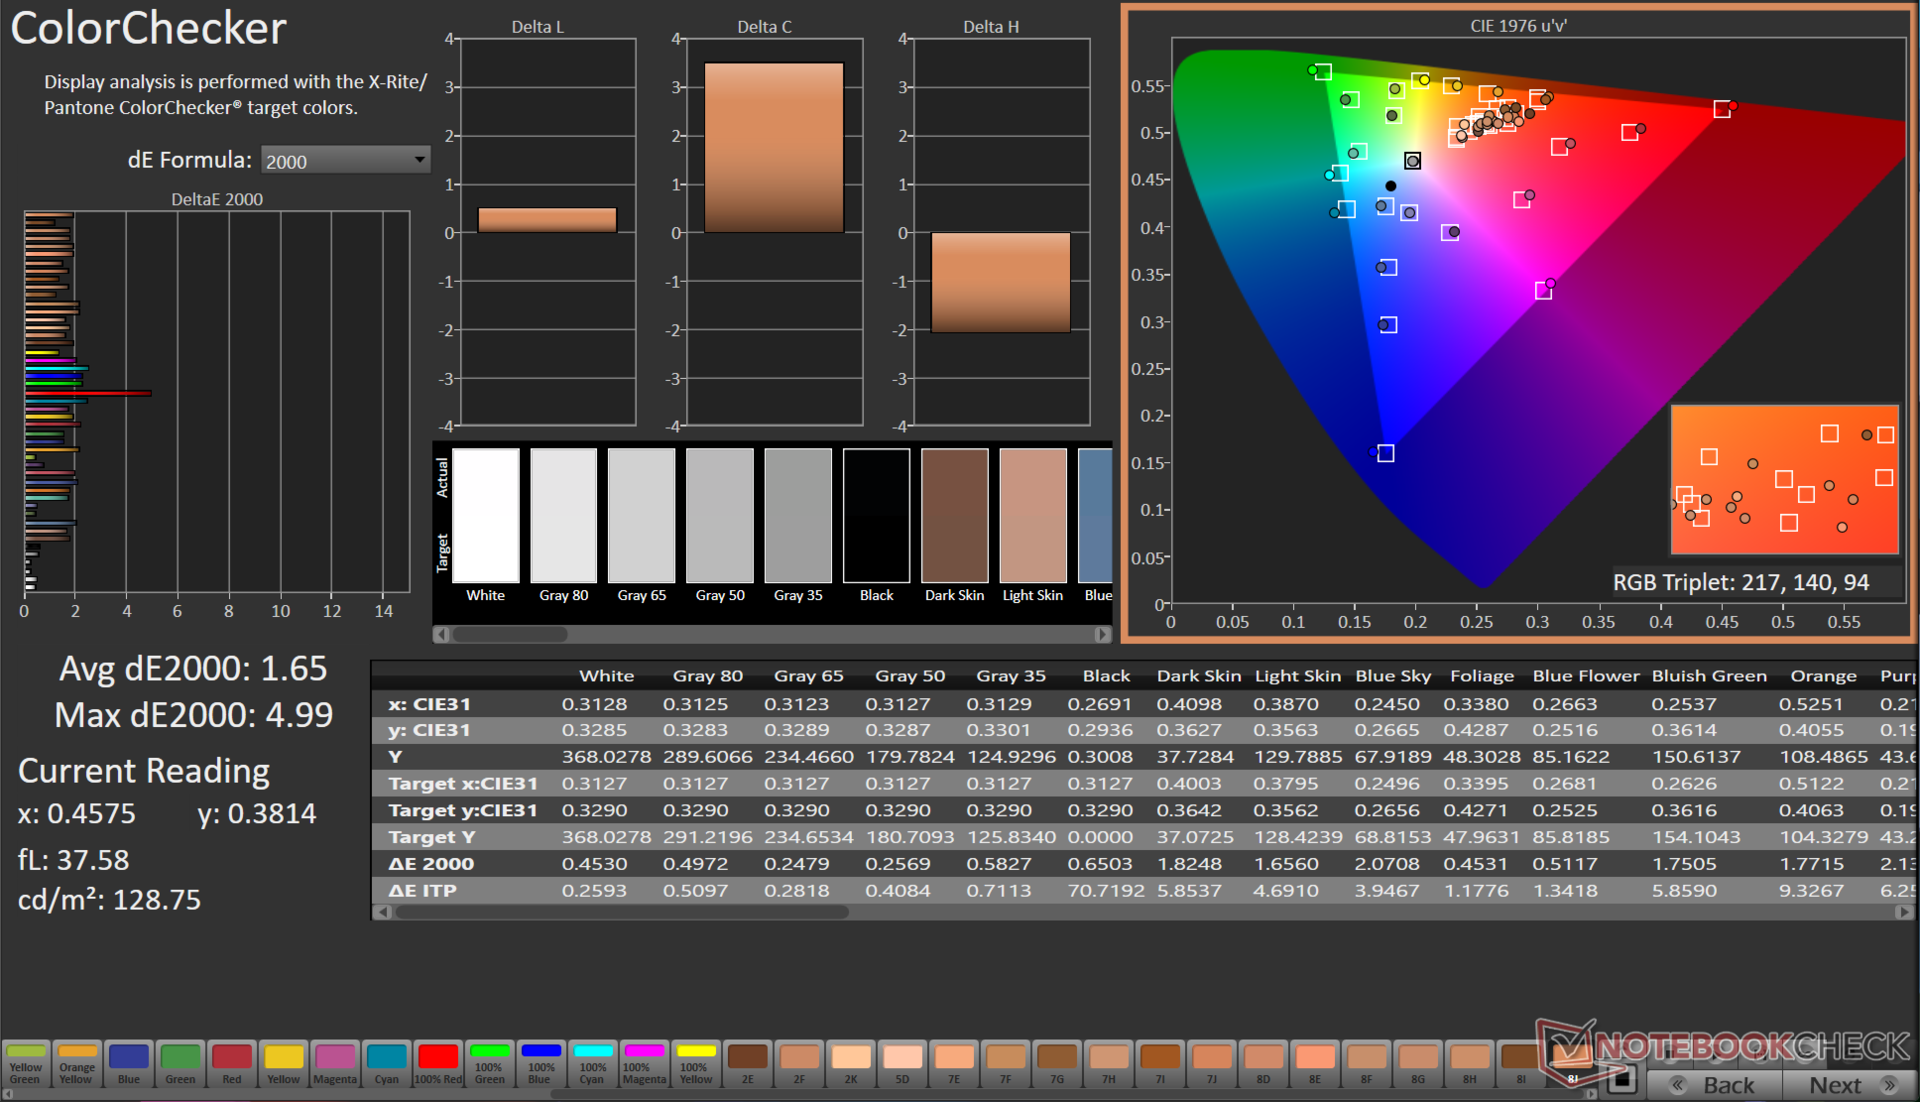
calibrated: 1.65
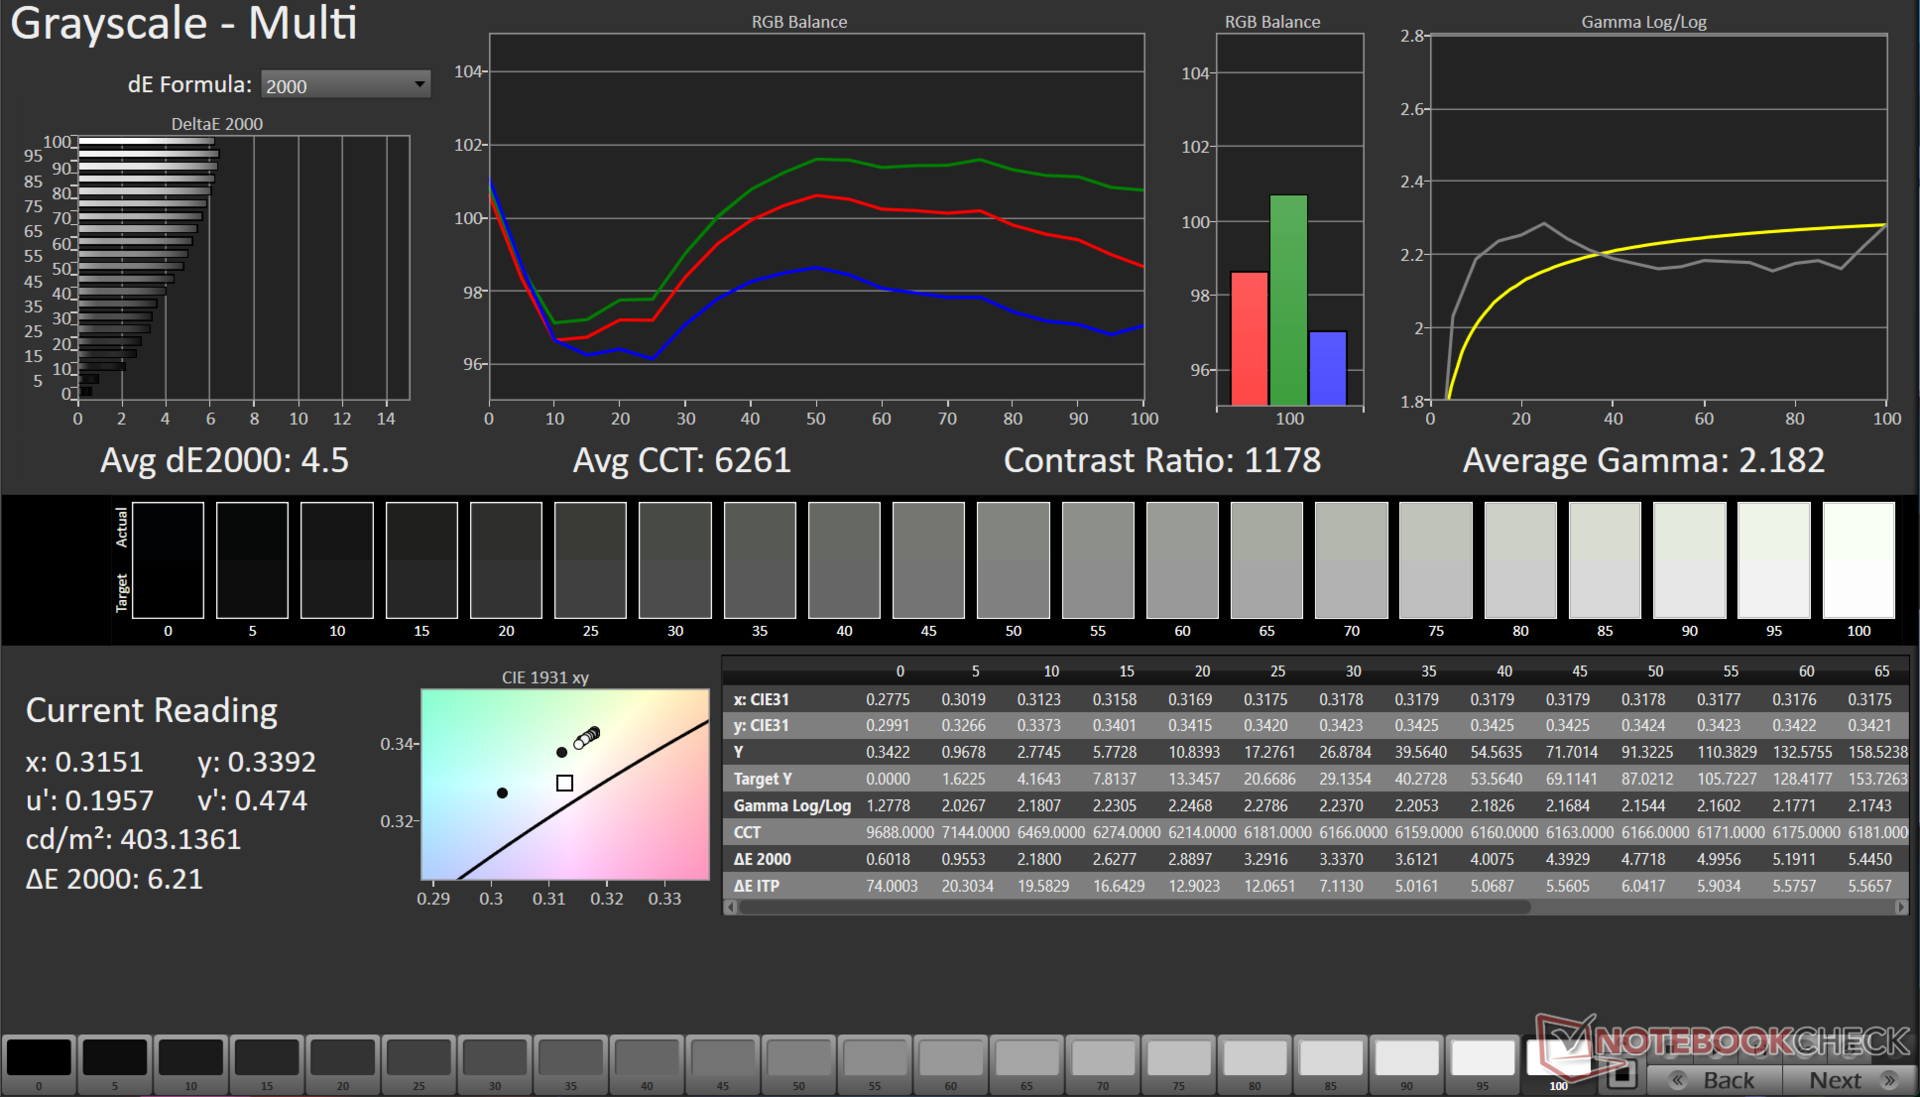
ΔE Greyscale Calman: 4.5 | ∀{0.09-98 Ø4.96}
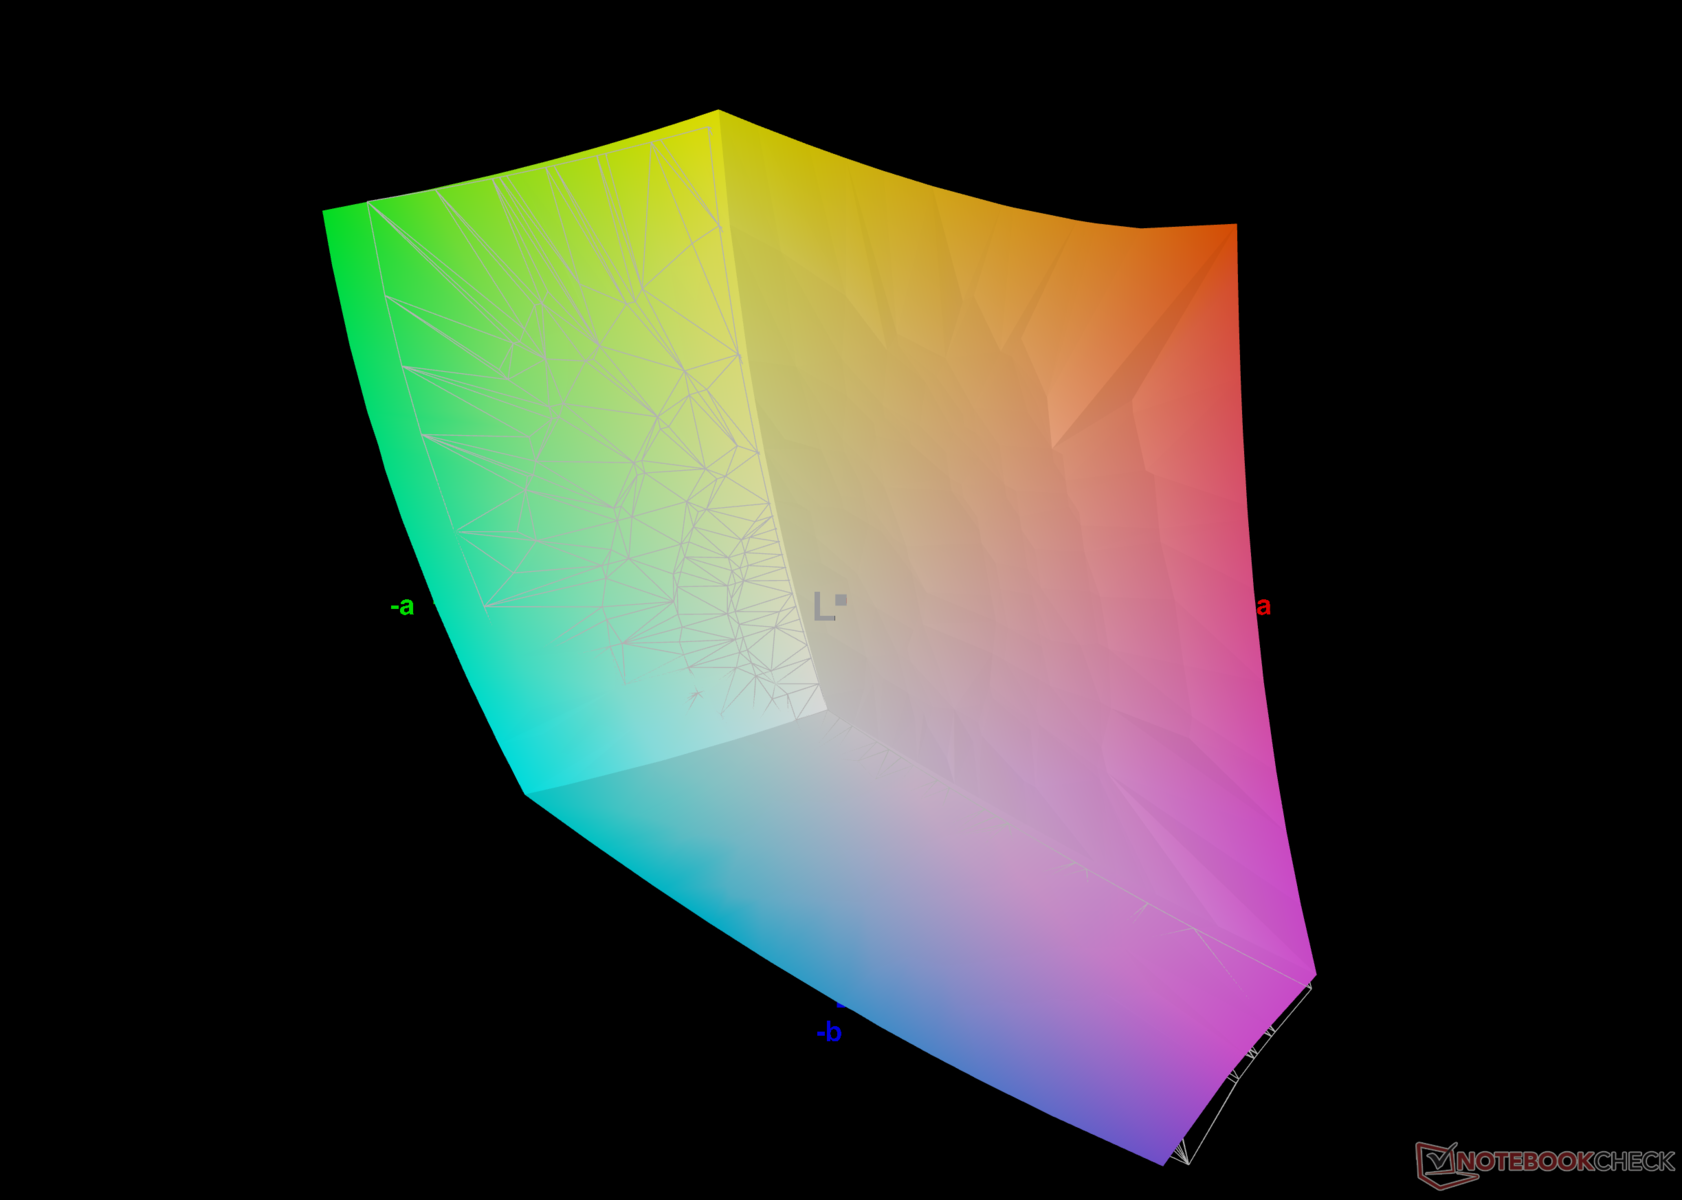
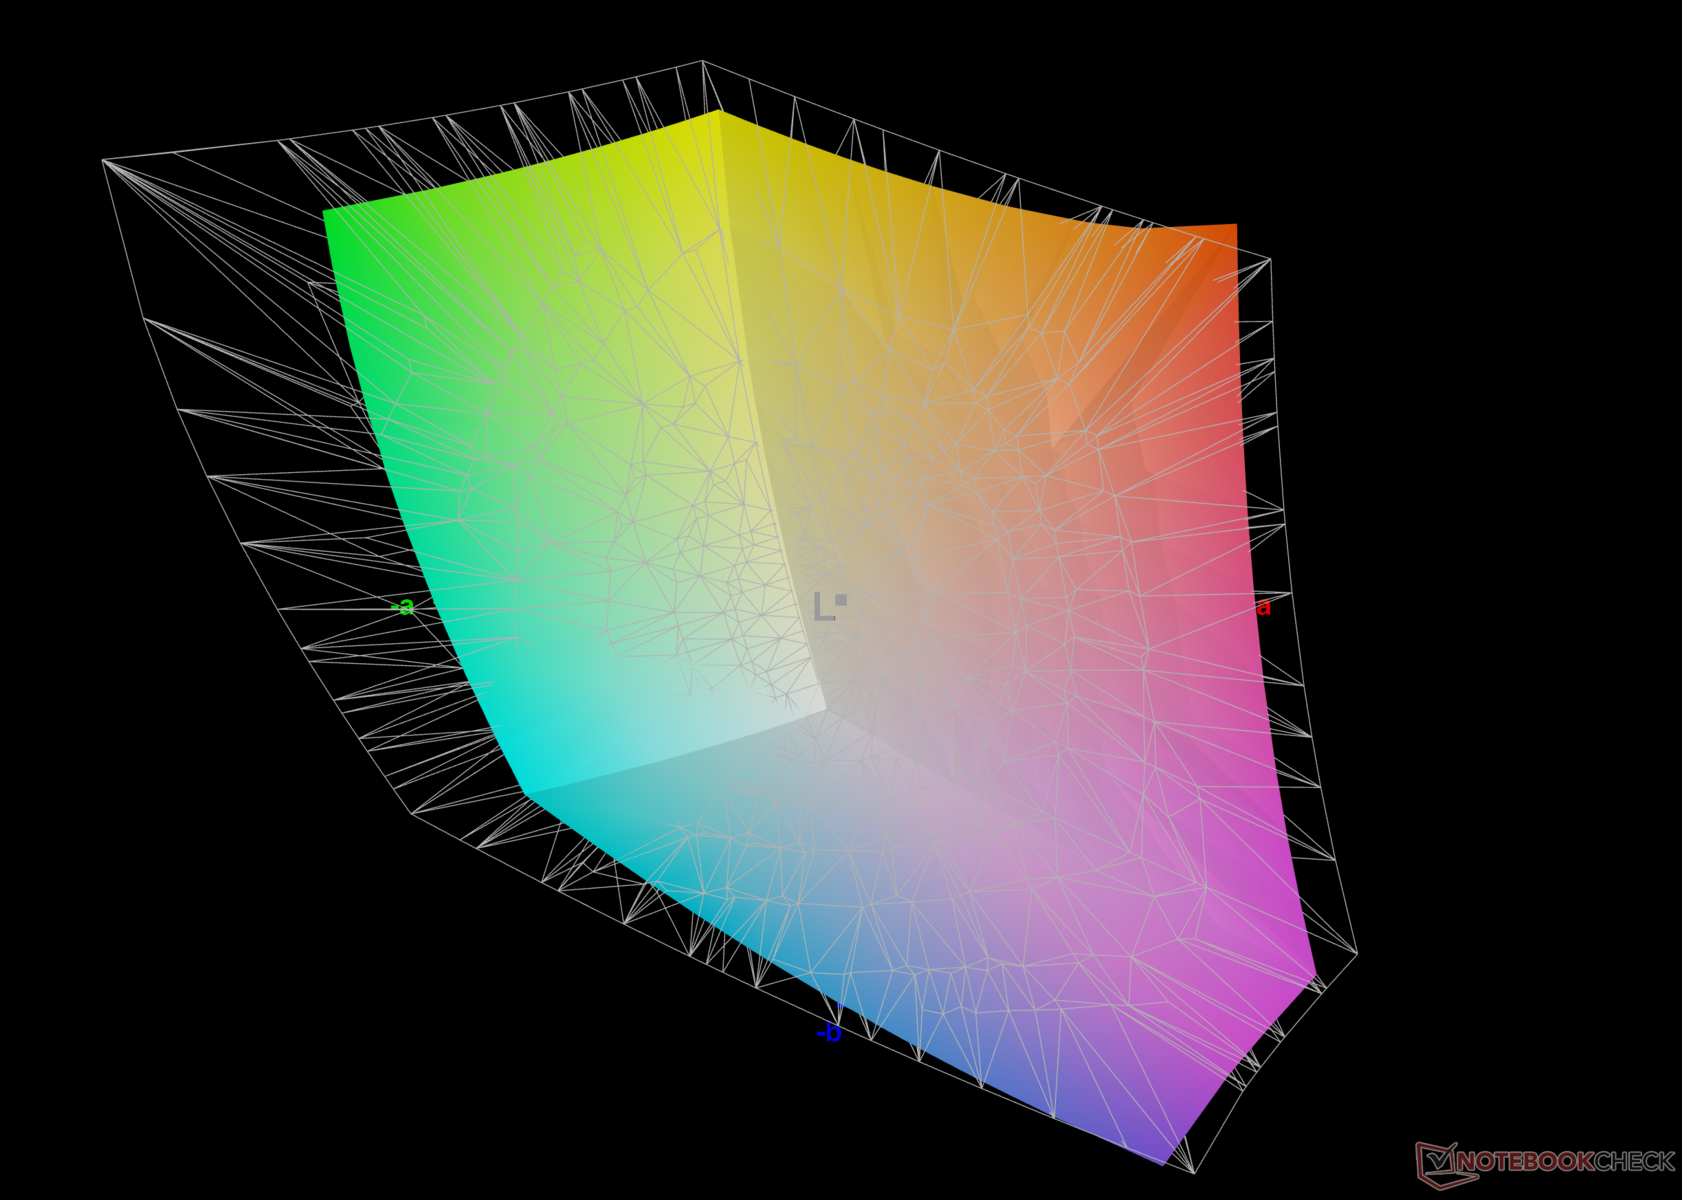
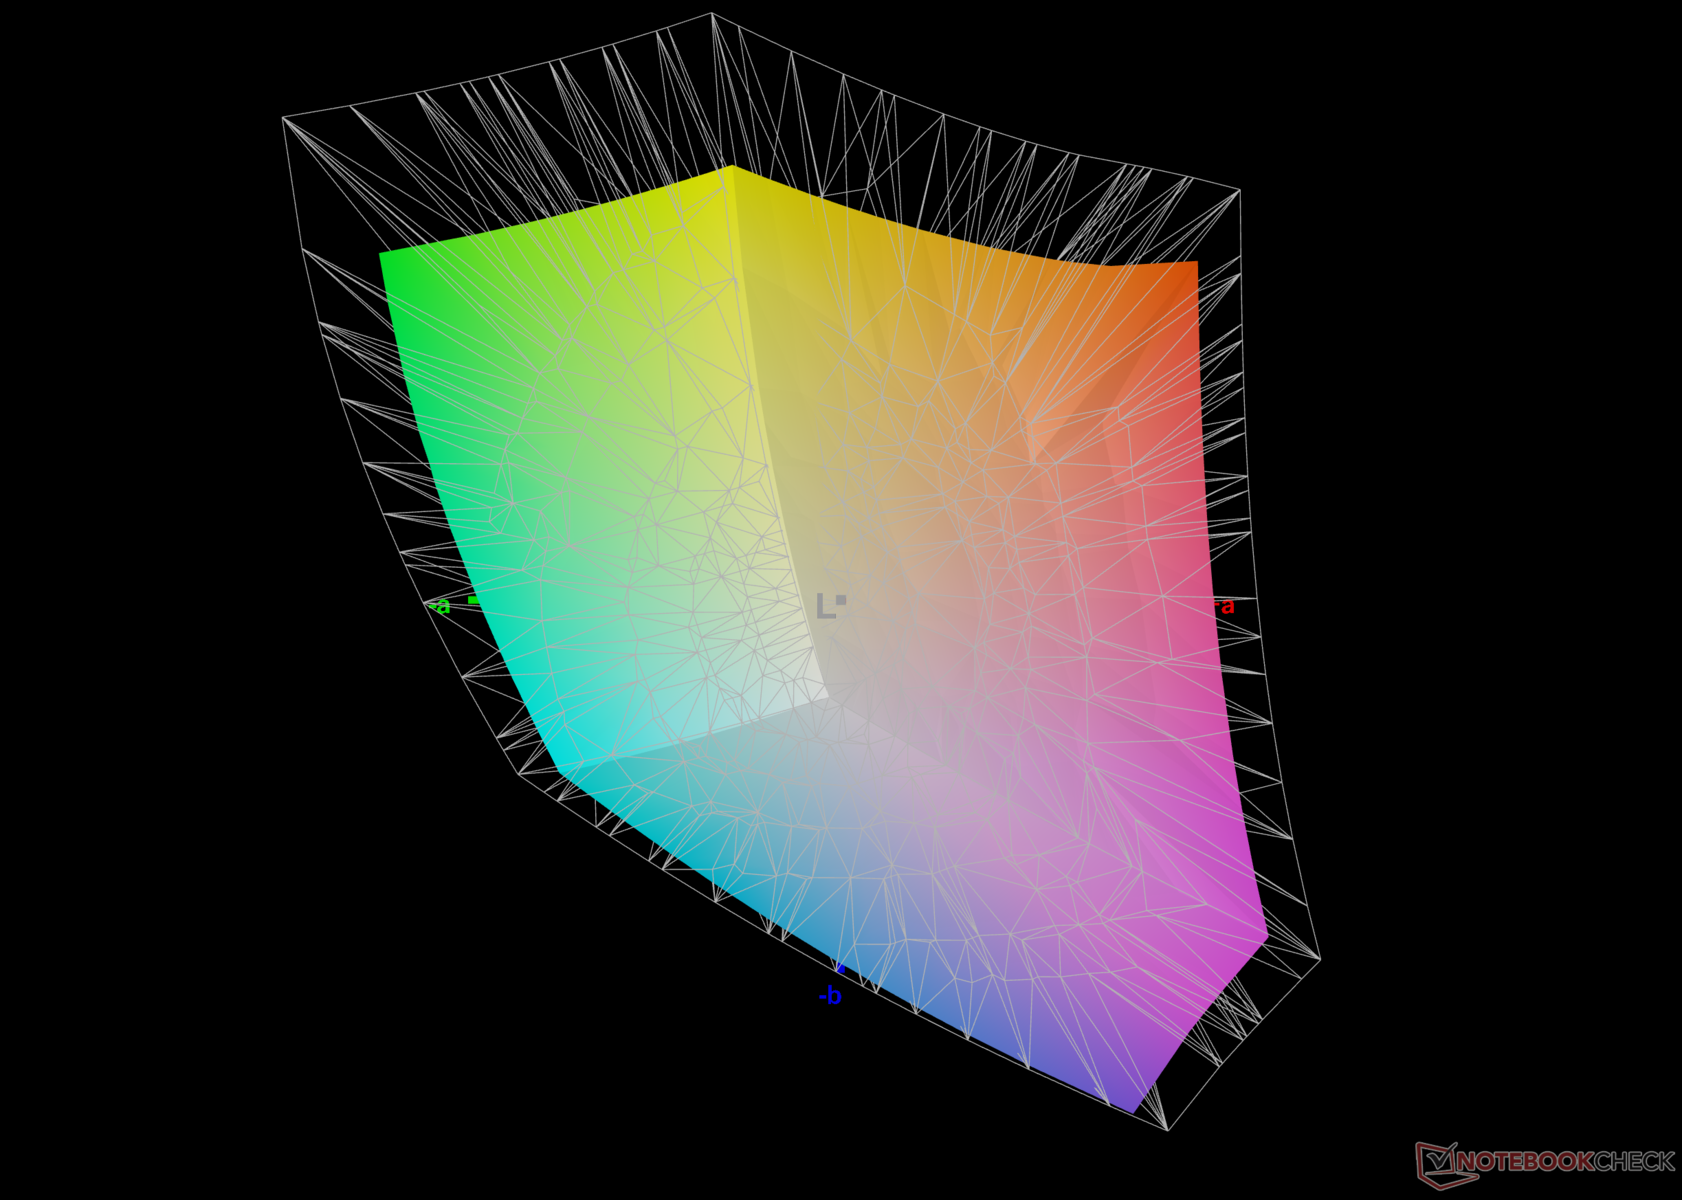
76.5% AdobeRGB 1998 (Argyll 3D)
99% sRGB (Argyll 3D)
74.6% Display P3 (Argyll 3D)
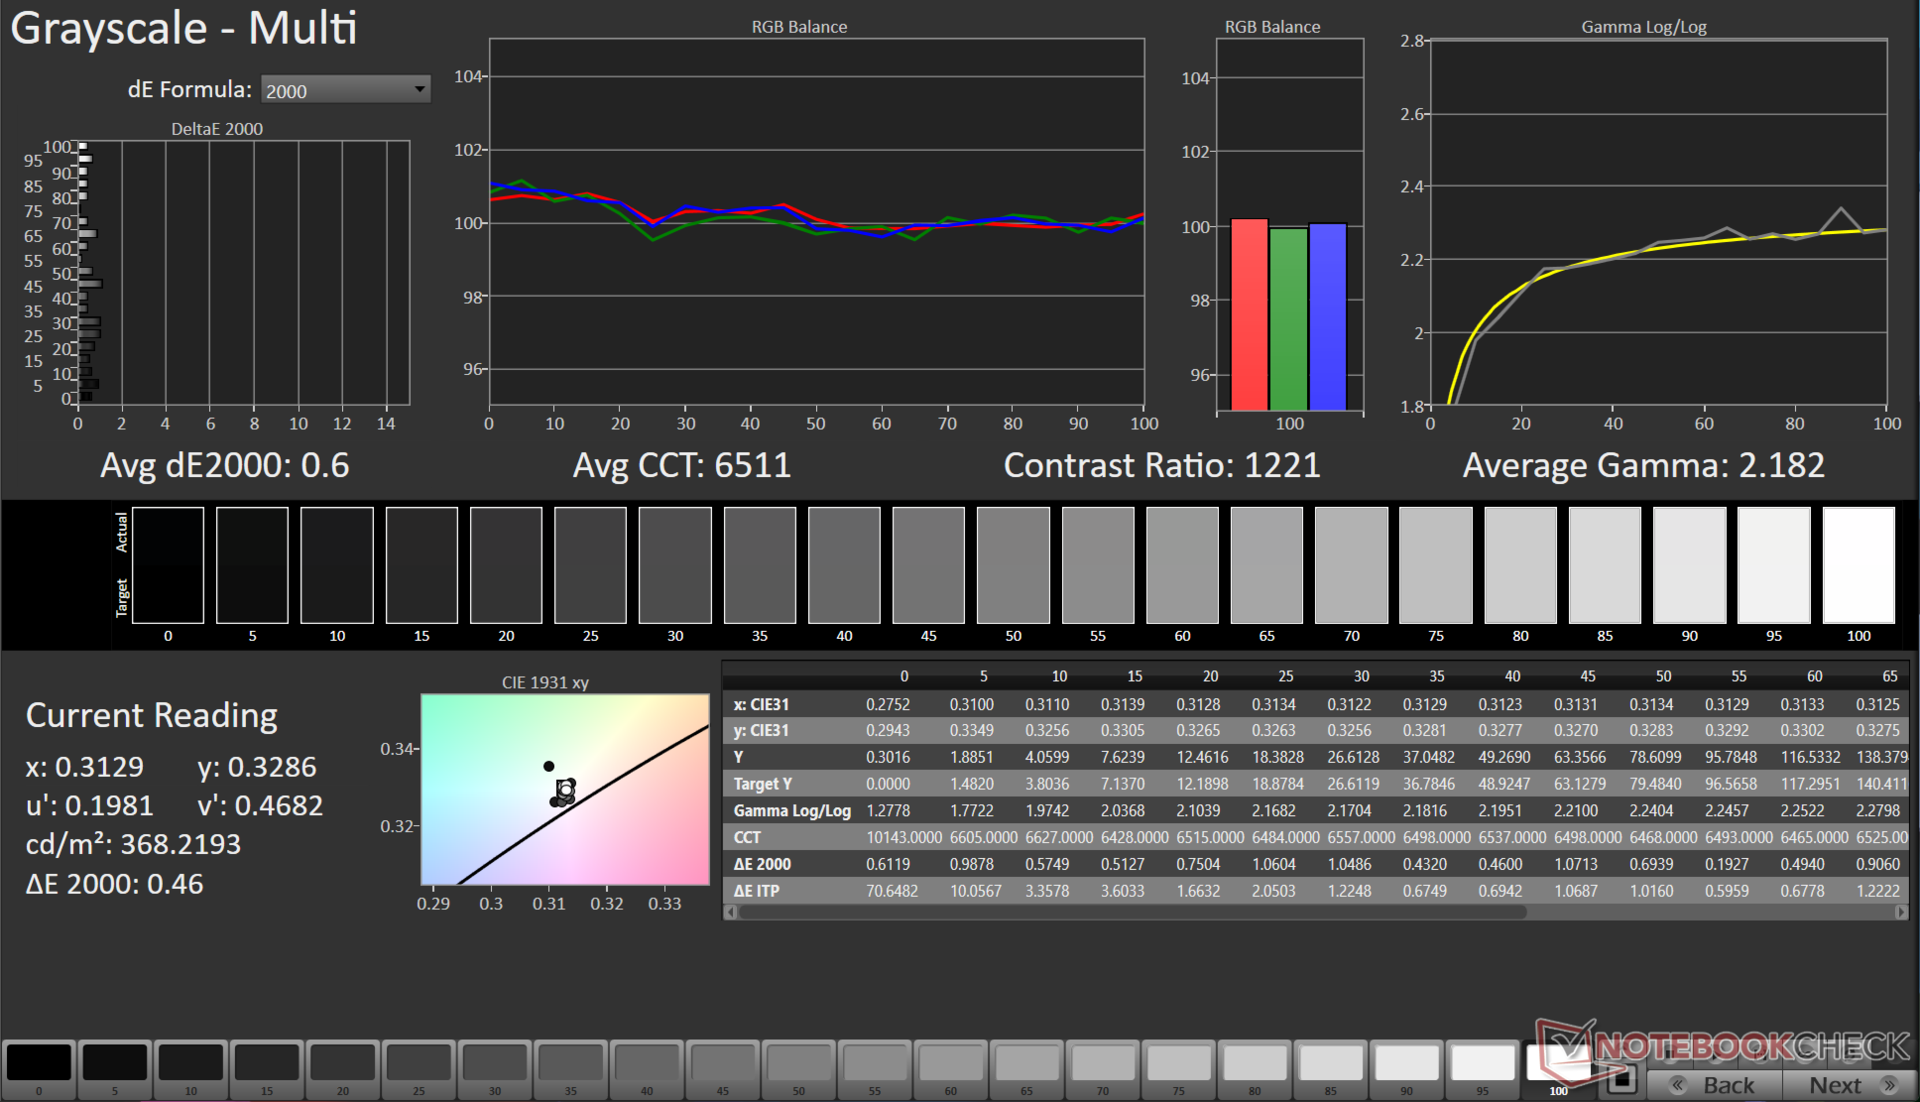
Gamma: 2.18
CCT: 6261 K
| HP Pavilion Plus 16-ab0456tx AU Optronics AUOFDA4, IPS, 2560x1600, 16" | Schenker Vision 14 2023 CSOT T3 MNE007ZA1-3, IPS, 2880x1800, 14" | Dell Inspiron 16 Plus 7630 LG Philips 160WQ2, IPS, 2560x1600, 16" | Asus VivoBook 14X K3405 Samsung ATNA40YK07-1, , 2880x1800, 14" | Lenovo Slim Pro 7 14ARP8 LEN89C1, IPS, 2560x1600, 14.5" | Asus VivoBook Pro 16 K6602VU Samsung ATNA60BX01-1, OLED, 3200x2000, 16" | Samsung Galaxy Book3 Ultra 16 Samsung ATNA60CL03-0, AMOLED, 2880x1800, 16" | |
|---|---|---|---|---|---|---|---|
| Display | 0% | -3% | 20% | -2% | 20% | 20% | |
| Display P3 Coverage (%) | 74.6 | 74.7 0% | 70.1 -6% | 99.9 34% | 72.9 -2% | 98.7 32% | 99.9 34% |
| sRGB Coverage (%) | 99 | 99.6 1% | 99.6 1% | 100 1% | 98.2 -1% | 99.7 1% | 100 1% |
| AdobeRGB 1998 Coverage (%) | 76.5 | 75.8 -1% | 72.3 -5% | 96.5 26% | 74.6 -2% | 96.5 26% | 96.3 26% |
| Response Times | -193% | -274% | -14% | -220% | -3% | 93% | |
| Response Time Grey 50% / Grey 80% * (ms) | 9.06 ? | 32.2 ? -255% | 35 ? -286% | 1.15 ? 87% | 31.8 ? -251% | 0.68 ? 92% | 0.49 ? 95% |
| Response Time Black / White * (ms) | 6.7 ? | 15.4 ? -130% | 24.2 ? -261% | 14.4 ? -115% | 19.3 ? -188% | 13.2 ? -97% | 0.65 ? 90% |
| PWM Frequency (Hz) | 90.02 ? | 240 ? | 240 ? | ||||
| Screen | 21% | 1% | 5% | 3% | -10% | 135% | |
| Brightness middle (cd/m²) | 403 | 402 0% | 299.4 -26% | 369 -8% | 344.7 -14% | 353 -12% | 400 -1% |
| Brightness (cd/m²) | 394 | 371 -6% | 290 -26% | 364 -8% | 334 -15% | 354 -10% | 399 1% |
| Brightness Distribution (%) | 90 | 86 -4% | 92 2% | 85 -6% | 92 2% | 98 9% | 93 3% |
| Black Level * (cd/m²) | 0.34 | 0.27 21% | 0.21 38% | 0.31 9% | 0.03 91% | ||
| Contrast (:1) | 1185 | 1489 26% | 1426 20% | 1112 -6% | 13333 1025% | ||
| Colorchecker dE 2000 * | 3.13 | 1.8 42% | 4.25 -36% | 2.85 9% | 3.01 4% | 4.23 -35% | 2.3 27% |
| Colorchecker dE 2000 max. * | 6.14 | 3.6 41% | 6.71 -9% | 4.22 31% | 6.3 -3% | 7.13 -16% | 4.15 32% |
| Colorchecker dE 2000 calibrated * | 1.65 | 1.5 9% | 0.52 68% | 2.18 -32% | 0.83 50% | 2.42 -47% | 1.66 -1% |
| Greyscale dE 2000 * | 4.5 | 1.8 60% | 5.5 -22% | 2.2 51% | 4.6 -2% | 2.5 44% | 2.7 40% |
| Gamma | 2.18 101% | 2.27 97% | 2.35 94% | 2.15 102% | 2.28 96% | 2.4 92% | 2.266 97% |
| CCT | 6261 104% | 6695 97% | 6368 102% | 6518 100% | 6420 101% | 6642 98% | 7047 92% |
| Totaal Gemiddelde (Programma / Instellingen) | -57% /
-14% | -92% /
-39% | 4% /
6% | -73% /
-30% | 2% /
-1% | 83% /
105% |
* ... kleiner is beter
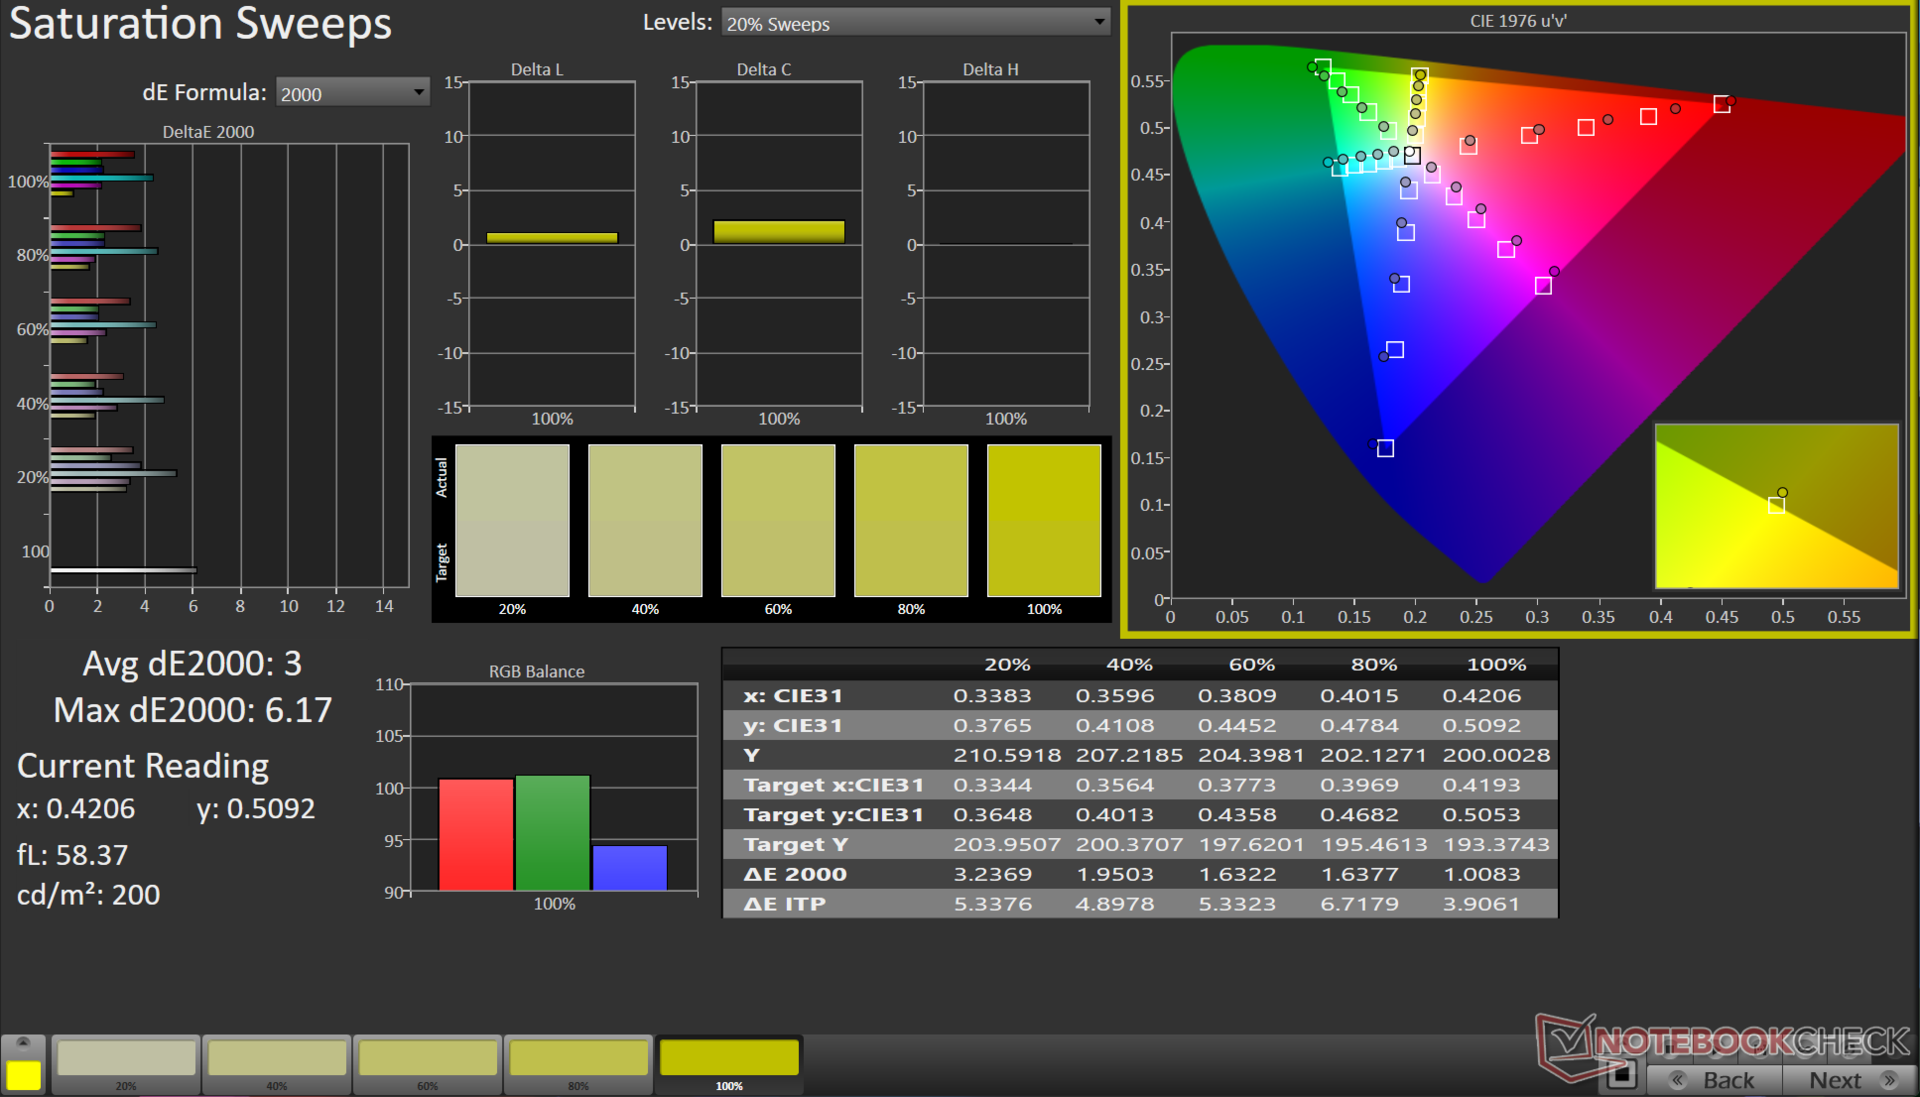
Het paneel dekt 99% van de sRGB-kleurruimte en biedt een fatsoenlijke Adobe RGB- en Display P3-weergave. Dit maakt de Pavilion Plus 16 geschikt voor algemene multimediaconsumptie en ook voor basisbewerkingsworkflows, met name voor webcontent.
Met behulp van de X-Rite i1Basic Pro 3 spectrofotometer en Calman Ultimate software van Portrait Displays, konden we de gemiddelde grijswaarden en ColorChecker Delta E 2000 waarden verbeteren van respectievelijk 4,5 tot 0,6 en 3,13 tot 1,65.
Ons gekalibreerde bestand kunt u downloaden via de bovenstaande link.
Responstijd Scherm
| ↔ Responstijd Zwart naar Wit | ||
|---|---|---|
| 6.7 ms ... stijging ↗ en daling ↘ gecombineerd | ↗ 3.6 ms stijging | 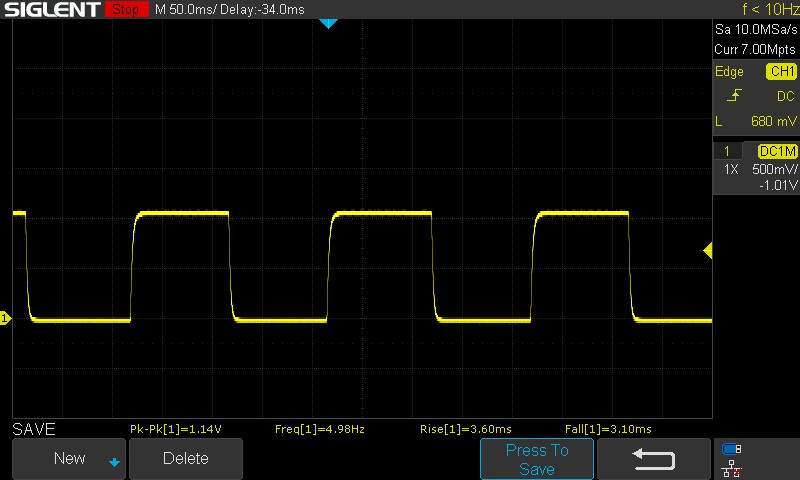 |
| ↘ 3.1 ms daling | ||
| Het scherm vertoonde erg snelle responstijden in onze tests en zou zeer geschikt moeten zijn voor snelle games. Ter vergelijking: alle testtoestellen variëren van 0.1 (minimum) tot 240 (maximum) ms. » 21 % van alle toestellen zijn beter. Dit betekent dat de gemeten responstijd beter is dan het gemiddelde (19.8 ms) van alle geteste toestellen. | ||
| ↔ Responstijd 50% Grijs naar 80% Grijs | ||
| 9.06 ms ... stijging ↗ en daling ↘ gecombineerd | ↗ 4.27 ms stijging | 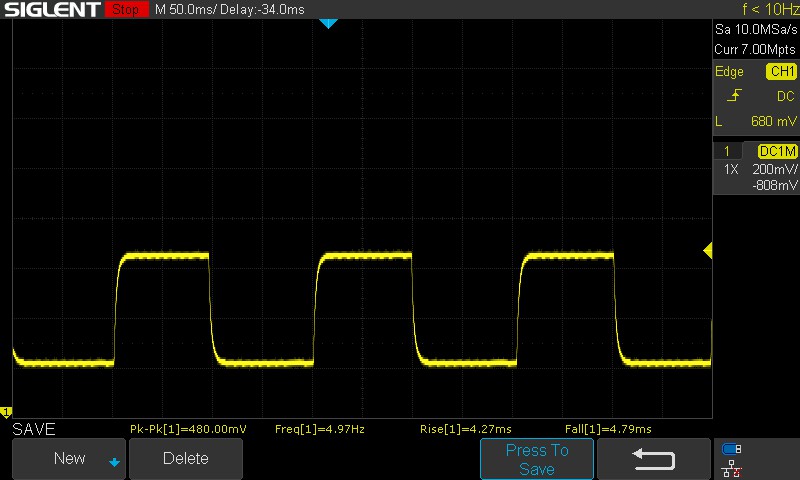 |
| ↘ 4.79 ms daling | ||
| Het scherm vertoonde snelle responstijden in onze tests en zou geschikt moeten zijn voor games. Ter vergelijking: alle testtoestellen variëren van 0.165 (minimum) tot 636 (maximum) ms. » 23 % van alle toestellen zijn beter. Dit betekent dat de gemeten responstijd beter is dan het gemiddelde (31 ms) van alle geteste toestellen. | ||
Screen Flickering / PWM (Pulse-Width Modulation)
| Screen flickering / PWM niet waargenomen | ≤ 100 % helderheid instelling | 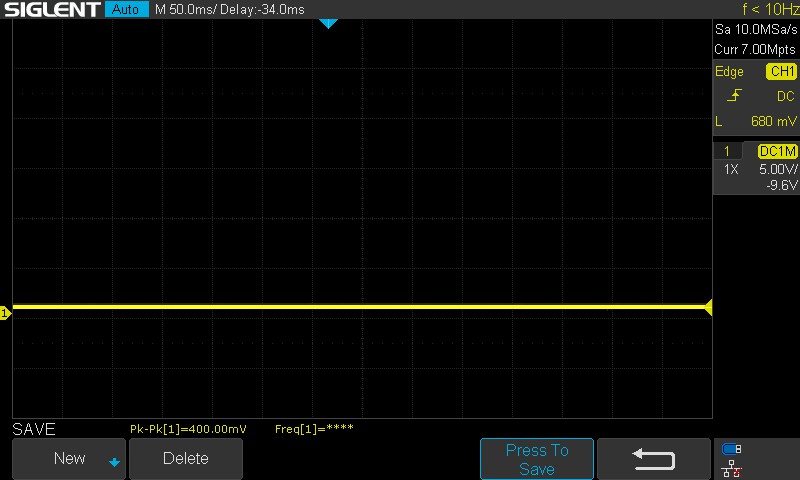 | |
Ter vergelijking: 52 % van alle geteste toestellen maakten geen gebruik van PWM om de schermhelderheid te verlagen. Als het wel werd gebruikt, werd een gemiddelde van 7757 (minimum: 5 - maximum: 343500) Hz waargenomen. | |||
De responstijden zijn behoorlijk, gezien het feit dat de Pavilion Plus 16 niet gericht is op gaming. We hebben bij alle geteste helderheidsniveaus geen PWM waargenomen, wat een goede zaak is.
Lees voor meer informatie ons artikel "Waarom PWM zo'n hoofdpijn is". Onze tabel PWM Ranking geeft een overzicht van de gemeten PWM bij alle geteste apparaten.
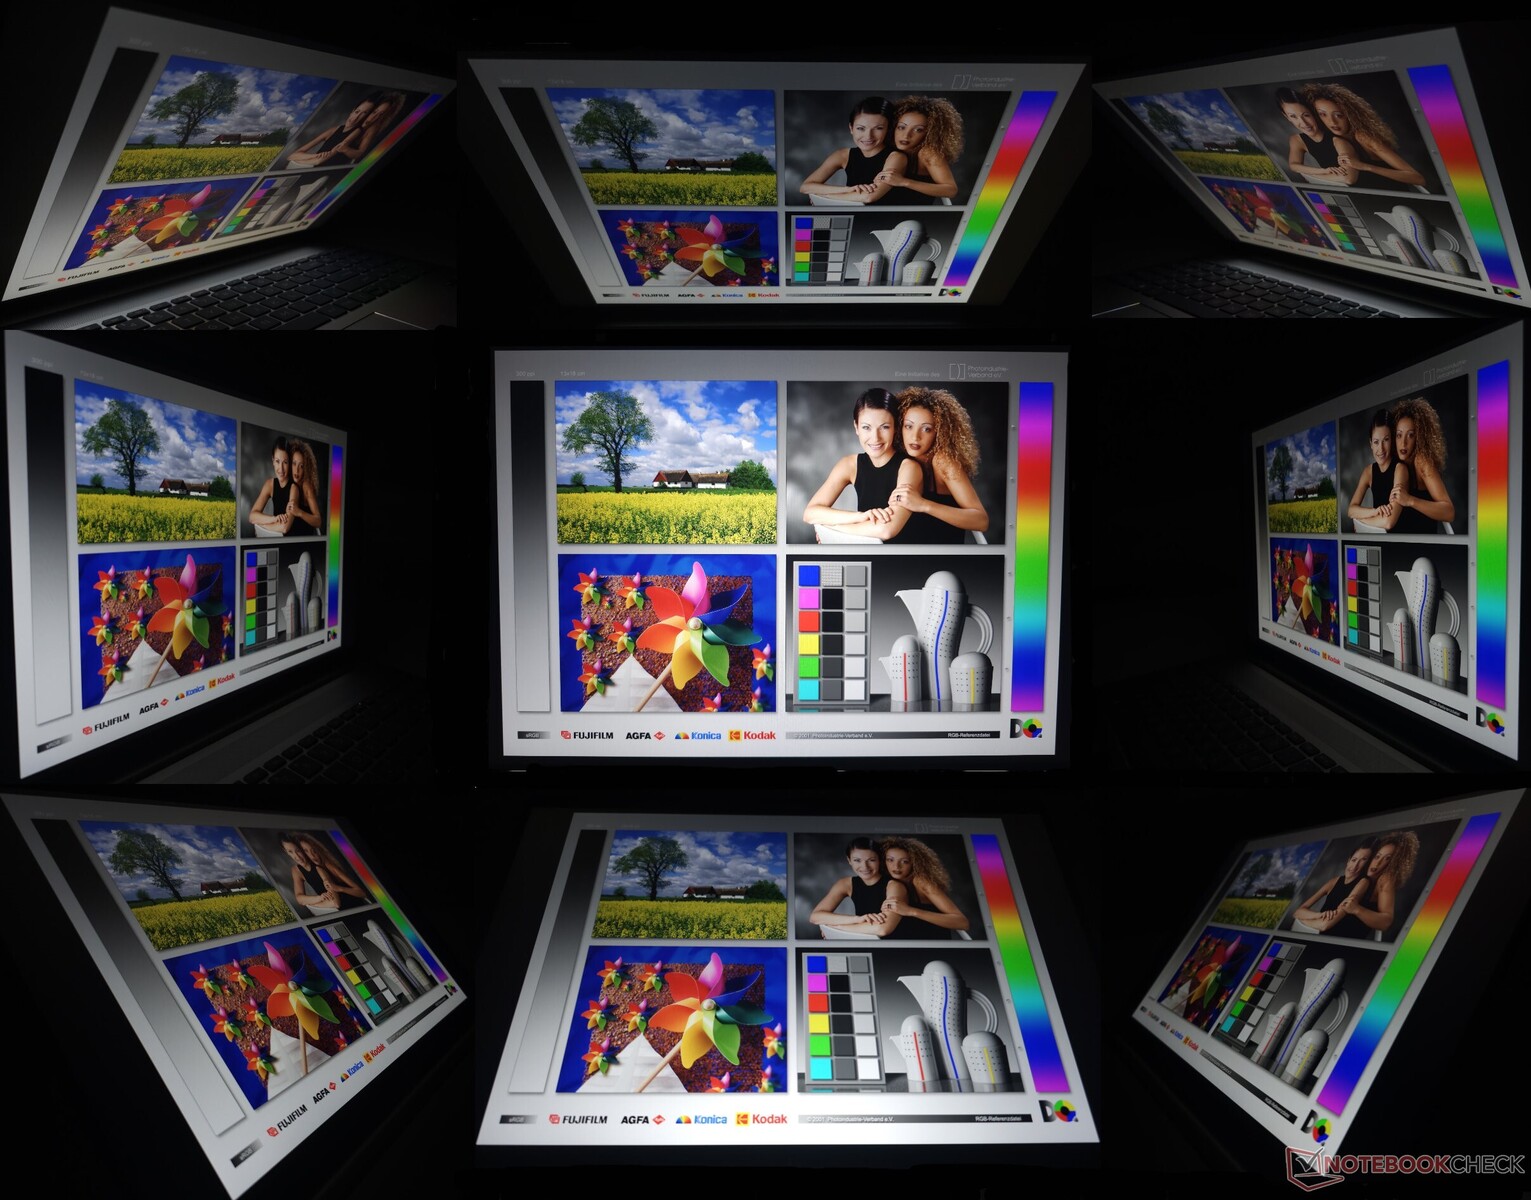
Buiten kijken gaat over het algemeen goed bij maximale helderheid, zolang er geen direct zonlicht op het scherm valt. De kijkhoeken zijn stabiel, maar we hebben verlies van helderheid en kleurinformatie waargenomen bij de extremen.
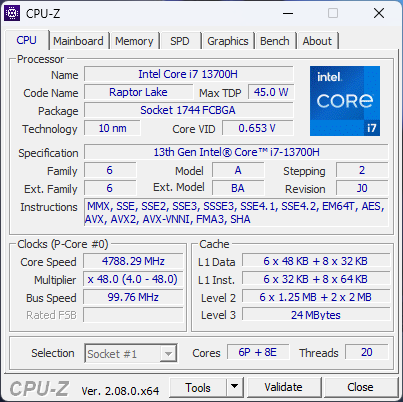
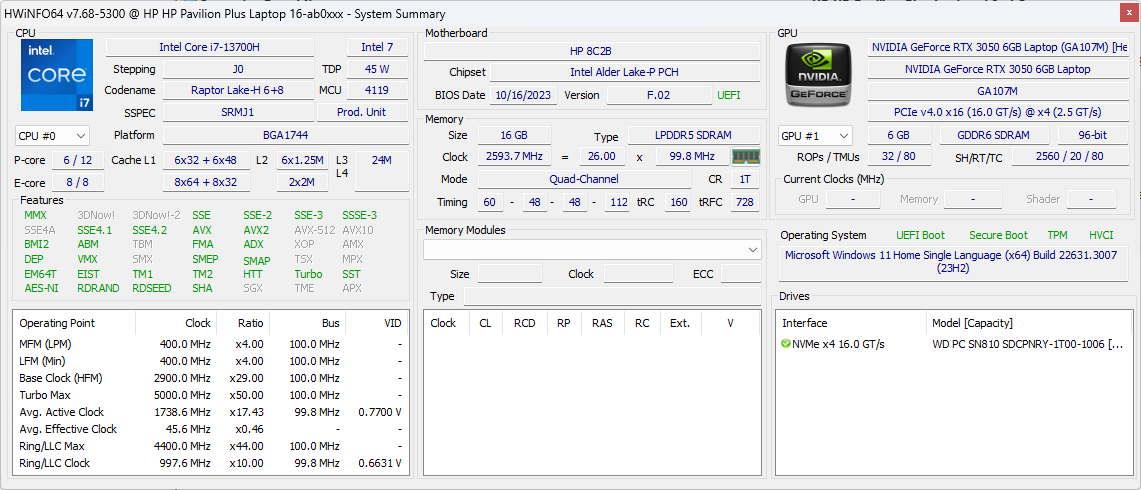
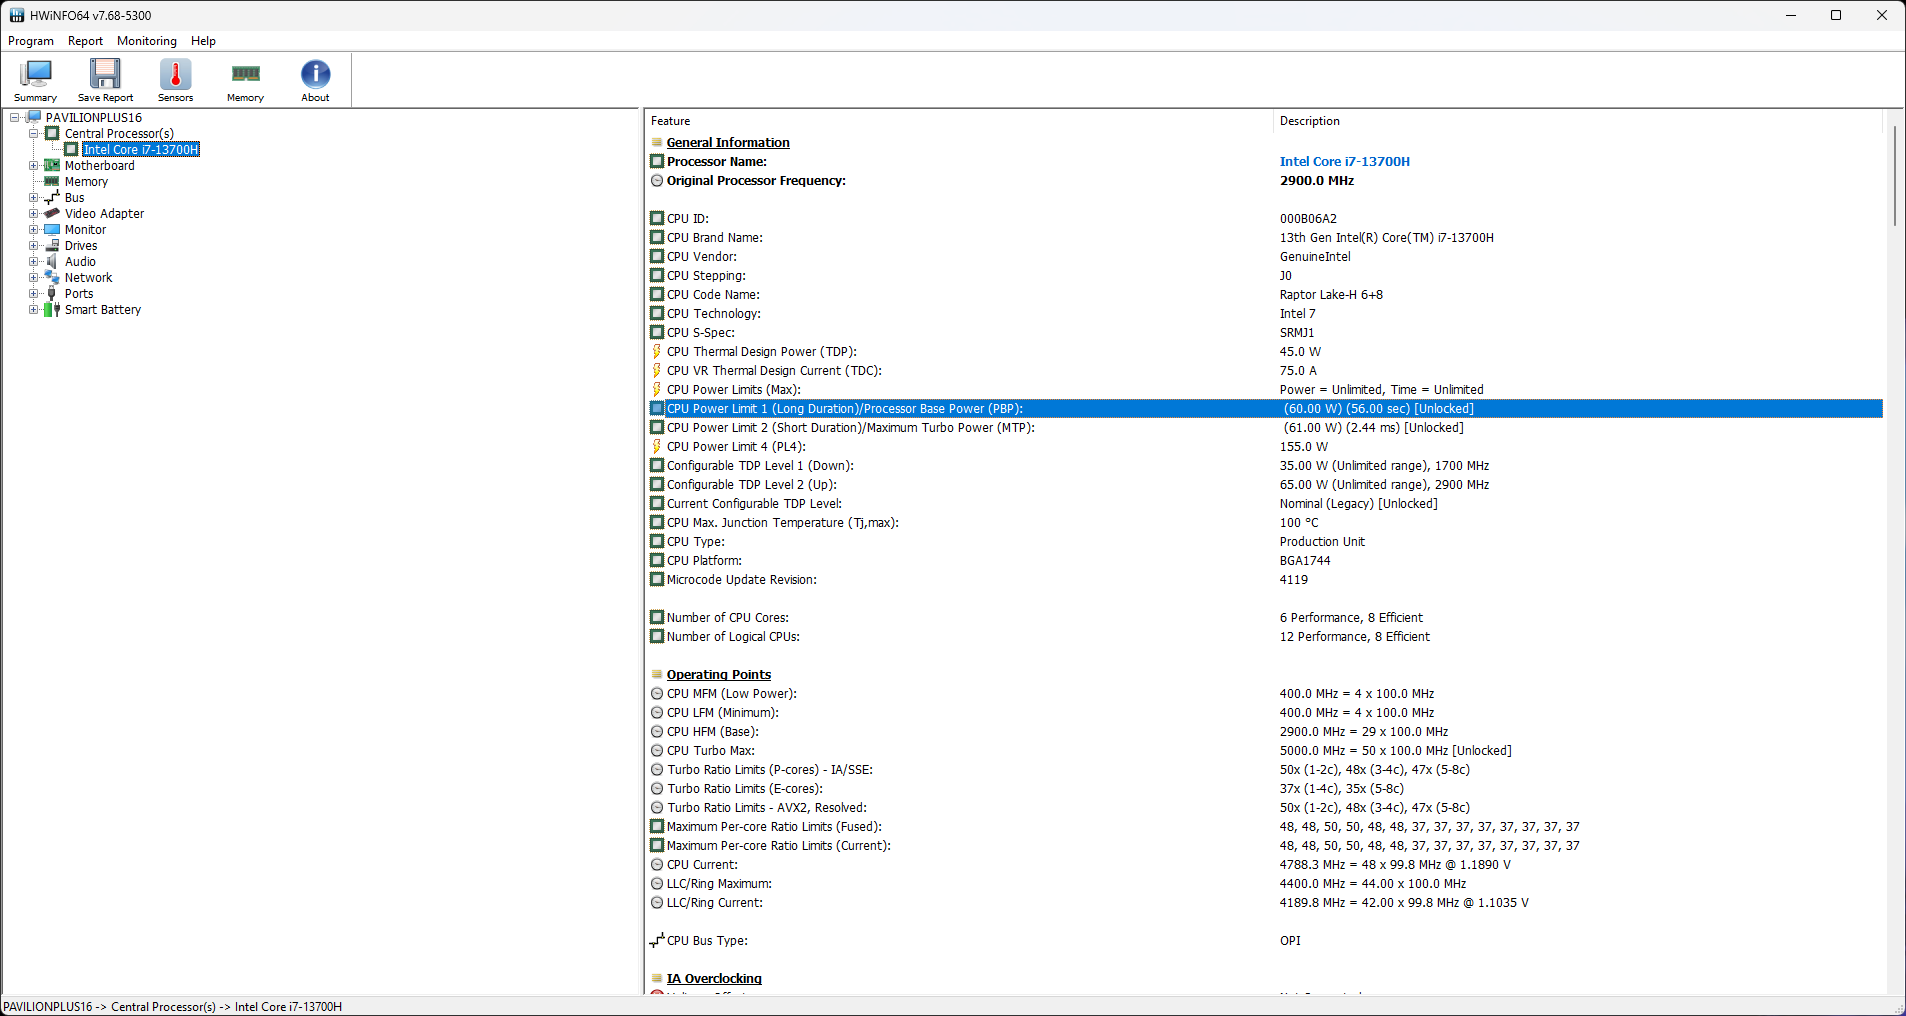
Prestaties: Core i7-13700H beperkt door lage PL2
Afhankelijk van de regio biedt HP de Pavilion Plus 16 in Core i5-13500H en Core i7-13700H smaken, samen met optionele RTX 3050 6 GB grafische kaarten.
Testomstandigheden
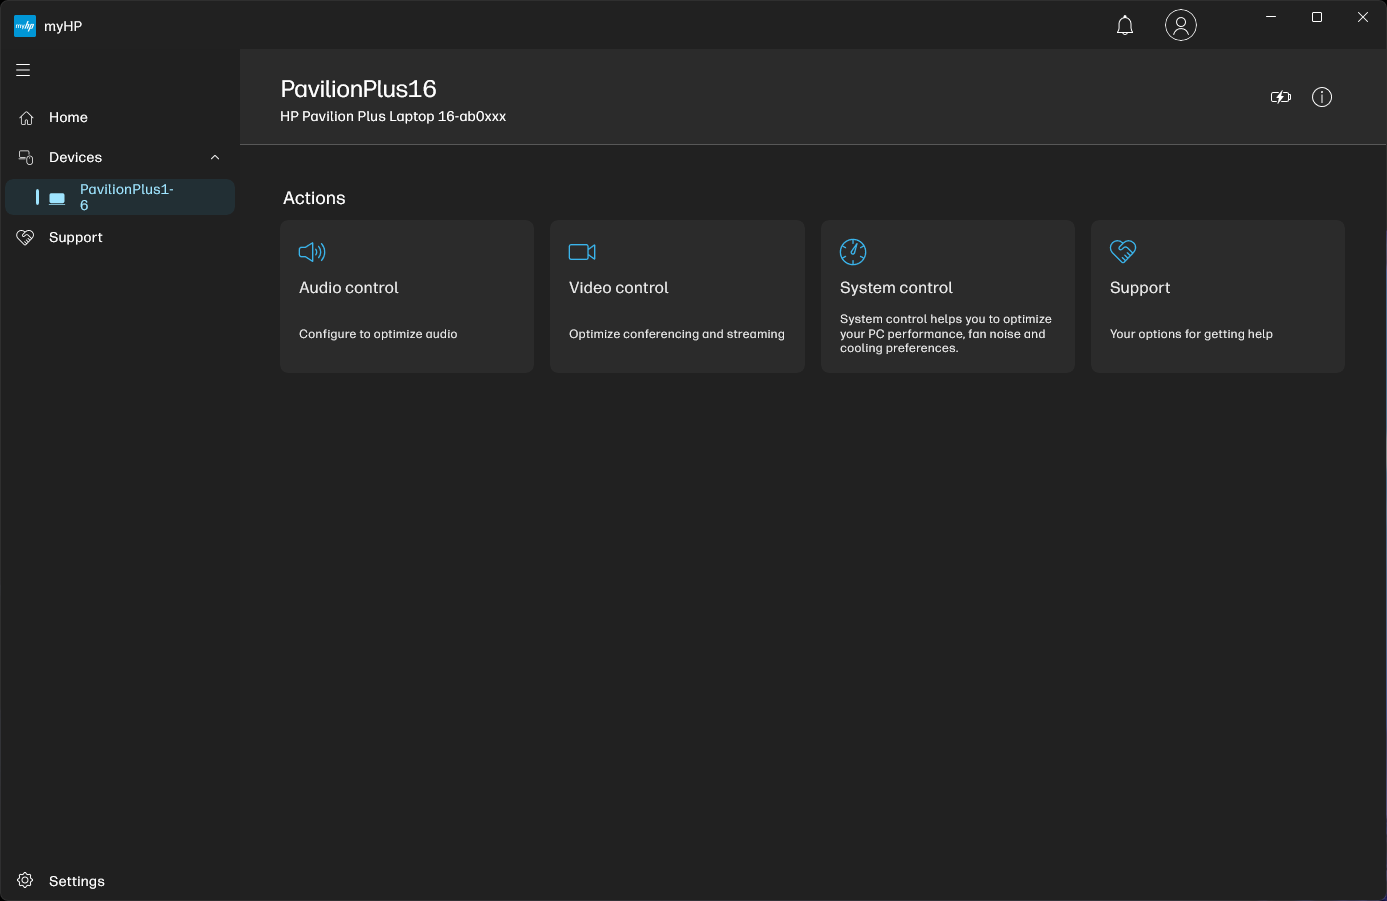
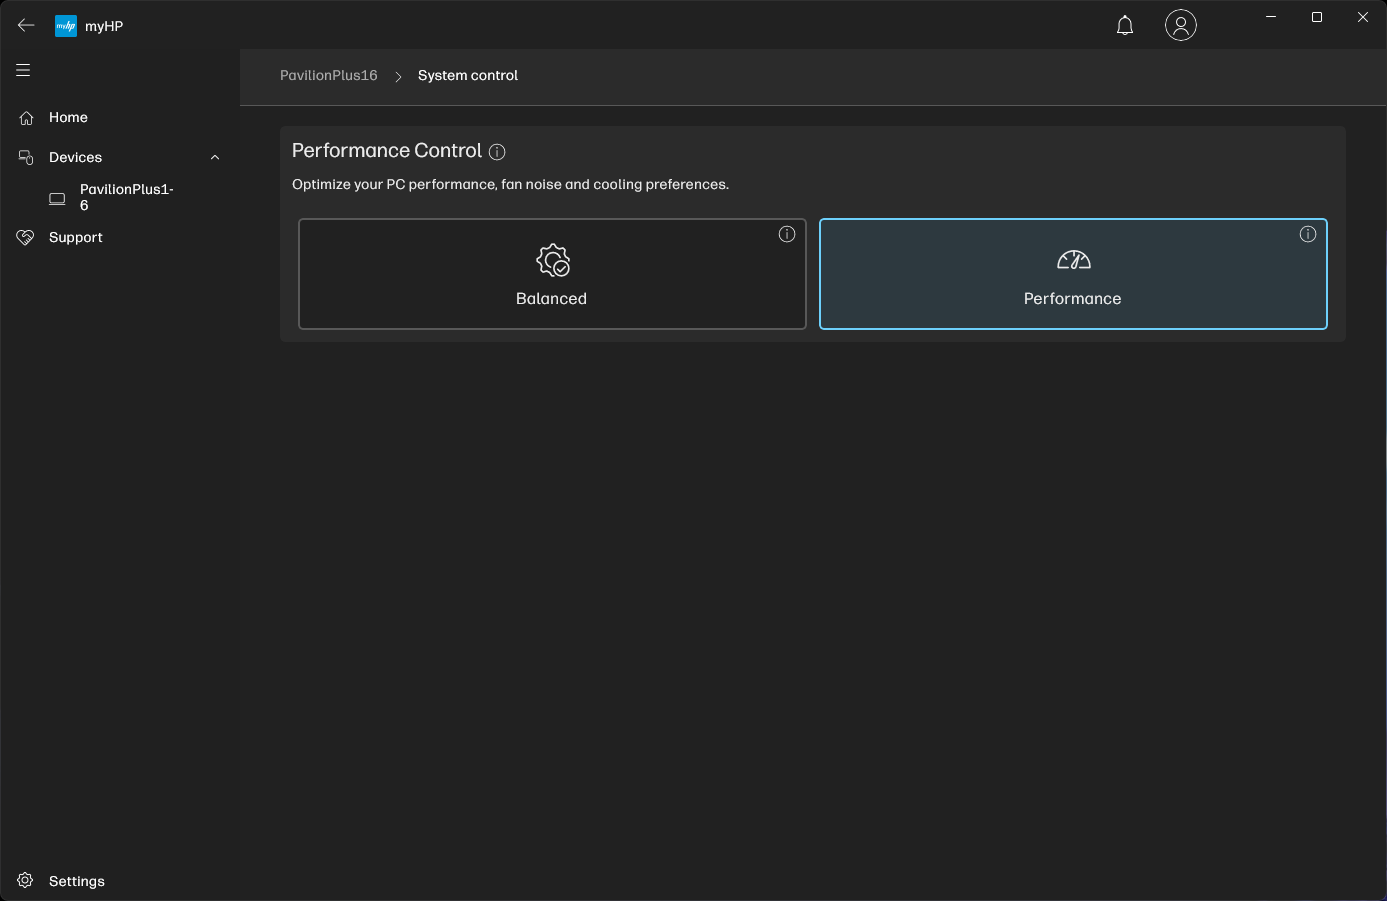
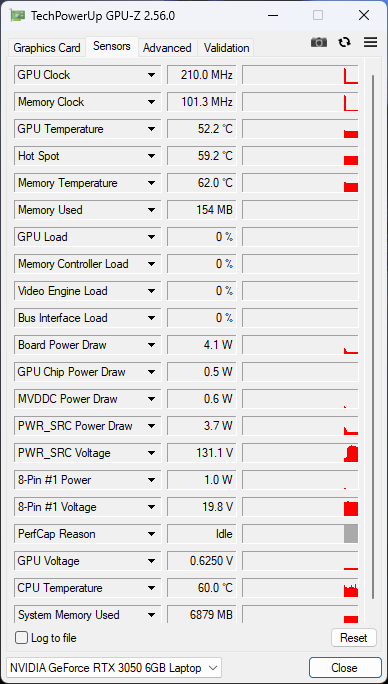
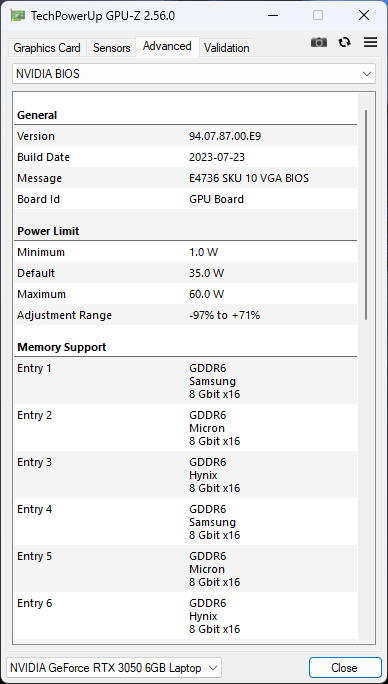
Met de myHP app kunnen gebruikers kiezen tussen twee bedrijfsmodi: Balanced en Performance. De gebalanceerde modus gebruikt een PL1 van 50 W, die in de prestatiemodus kan oplopen tot 60 W. De PL2 in beide modi is afgetopt op 61 W.
De RTX 3050 6 GB GPU werkt standaard in MSHybrid / Optimus-modus zonder MUX-switching.
We gebruikten de Performance-modus voor alle benchmarks. De PL1/PL2 daalt tot 35 W / 35 W op batterijstroom.
Processor
De Core i7-13700H van de Pavilion Plus 16 wordt belemmerd door een lage PL2-waarde. Dit wordt vooral duidelijk bij multi-core benchmarks, waar hij aanzienlijk achterblijft bij bijvoorbeeld de Dell Inspiron 16 Plus 7630 met een 89 W PL2 Core i7-13700H.
Dit gezegd hebbende, lijkt de koeling van de Pavilion Plus 16 zeer effectief te zijn in het verzekeren van goed volgehouden prestaties tijdens onze Cinebench R15 multi-core loop test.
De Pavilion Plus 16 voert de meeste CPU single-core grafieken aan, maar de Schenker Vision 14 M23 zit hem vlak op de hielen in deze tests.
Cinebench R15 Multi Loop
Cinebench R23: Multi Core | Single Core
Cinebench R20: CPU (Multi Core) | CPU (Single Core)
Cinebench R15: CPU Multi 64Bit | CPU Single 64Bit
Blender: v2.79 BMW27 CPU
7-Zip 18.03: 7z b 4 | 7z b 4 -mmt1
Geekbench 6.7: Multi-Core | Single-Core
Geekbench 5.5: Multi-Core | Single-Core
HWBOT x265 Benchmark v2.2: 4k Preset
LibreOffice : 20 Documents To PDF
R Benchmark 2.5: Overall mean
| CPU Performance rating | |
| Gemiddelde van klas Multimedia | |
| Dell Inspiron 16 Plus 7630 | |
| Gemiddeld Intel Core i7-13700H | |
| HP Pavilion Plus 16-ab0456tx | |
| Asus VivoBook Pro 16 K6602VU | |
| Samsung Galaxy Book3 Ultra 16 -2! | |
| Schenker Vision 14 M23 RTX 3050 | |
| Asus VivoBook 14X K3405 -2! | |
| Lenovo Slim Pro 7 14ARP8 -2! | |
| Cinebench R23 / Multi Core | |
| Gemiddelde van klas Multimedia (4861 - 33362, n=76, laatste 2 jaar) | |
| Dell Inspiron 16 Plus 7630 | |
| Samsung Galaxy Book3 Ultra 16 | |
| Gemiddeld Intel Core i7-13700H (5890 - 20034, n=29) | |
| Asus VivoBook Pro 16 K6602VU | |
| Asus VivoBook 14X K3405 | |
| Schenker Vision 14 M23 RTX 3050 | |
| Lenovo Slim Pro 7 14ARP8 | |
| HP Pavilion Plus 16-ab0456tx | |
| Cinebench R23 / Single Core | |
| Gemiddelde van klas Multimedia (1128 - 2459, n=68, laatste 2 jaar) | |
| HP Pavilion Plus 16-ab0456tx | |
| Schenker Vision 14 M23 RTX 3050 | |
| Dell Inspiron 16 Plus 7630 | |
| Gemiddeld Intel Core i7-13700H (1323 - 1914, n=29) | |
| Asus VivoBook Pro 16 K6602VU | |
| Asus VivoBook 14X K3405 | |
| Samsung Galaxy Book3 Ultra 16 | |
| Lenovo Slim Pro 7 14ARP8 | |
| Cinebench R20 / CPU (Multi Core) | |
| Gemiddelde van klas Multimedia (1887 - 12912, n=59, laatste 2 jaar) | |
| Dell Inspiron 16 Plus 7630 | |
| Samsung Galaxy Book3 Ultra 16 | |
| Gemiddeld Intel Core i7-13700H (2322 - 7674, n=29) | |
| HP Pavilion Plus 16-ab0456tx | |
| Asus VivoBook Pro 16 K6602VU | |
| Asus VivoBook 14X K3405 | |
| Schenker Vision 14 M23 RTX 3050 | |
| Lenovo Slim Pro 7 14ARP8 | |
| Cinebench R20 / CPU (Single Core) | |
| HP Pavilion Plus 16-ab0456tx | |
| Schenker Vision 14 M23 RTX 3050 | |
| Gemiddelde van klas Multimedia (425 - 853, n=59, laatste 2 jaar) | |
| Dell Inspiron 16 Plus 7630 | |
| Gemiddeld Intel Core i7-13700H (508 - 741, n=29) | |
| Asus VivoBook Pro 16 K6602VU | |
| Asus VivoBook 14X K3405 | |
| Samsung Galaxy Book3 Ultra 16 | |
| Lenovo Slim Pro 7 14ARP8 | |
| Cinebench R15 / CPU Multi 64Bit | |
| Gemiddelde van klas Multimedia (856 - 5224, n=63, laatste 2 jaar) | |
| Samsung Galaxy Book3 Ultra 16 | |
| Asus VivoBook Pro 16 K6602VU | |
| Dell Inspiron 16 Plus 7630 | |
| Gemiddeld Intel Core i7-13700H (905 - 2982, n=29) | |
| Asus VivoBook 14X K3405 | |
| HP Pavilion Plus 16-ab0456tx | |
| Lenovo Slim Pro 7 14ARP8 | |
| Schenker Vision 14 M23 RTX 3050 | |
| Cinebench R15 / CPU Single 64Bit | |
| Gemiddelde van klas Multimedia (184.8 - 326, n=61, laatste 2 jaar) | |
| HP Pavilion Plus 16-ab0456tx | |
| Schenker Vision 14 M23 RTX 3050 | |
| Dell Inspiron 16 Plus 7630 | |
| Gemiddeld Intel Core i7-13700H (213 - 278, n=29) | |
| Asus VivoBook Pro 16 K6602VU | |
| Asus VivoBook 14X K3405 | |
| Samsung Galaxy Book3 Ultra 16 | |
| Lenovo Slim Pro 7 14ARP8 | |
| Blender / v2.79 BMW27 CPU | |
| Schenker Vision 14 M23 RTX 3050 | |
| Gemiddelde van klas Multimedia (100 - 557, n=60, laatste 2 jaar) | |
| Lenovo Slim Pro 7 14ARP8 | |
| Asus VivoBook 14X K3405 | |
| Gemiddeld Intel Core i7-13700H (169 - 555, n=29) | |
| Samsung Galaxy Book3 Ultra 16 | |
| Dell Inspiron 16 Plus 7630 | |
| HP Pavilion Plus 16-ab0456tx | |
| Asus VivoBook Pro 16 K6602VU | |
| 7-Zip 18.03 / 7z b 4 | |
| Asus VivoBook Pro 16 K6602VU | |
| HP Pavilion Plus 16-ab0456tx | |
| Samsung Galaxy Book3 Ultra 16 | |
| Gemiddeld Intel Core i7-13700H (27322 - 76344, n=29) | |
| Dell Inspiron 16 Plus 7630 | |
| Gemiddelde van klas Multimedia (26062 - 130368, n=57, laatste 2 jaar) | |
| Lenovo Slim Pro 7 14ARP8 | |
| Schenker Vision 14 M23 RTX 3050 | |
| Asus VivoBook 14X K3405 | |
| 7-Zip 18.03 / 7z b 4 -mmt1 | |
| Schenker Vision 14 M23 RTX 3050 | |
| HP Pavilion Plus 16-ab0456tx | |
| Gemiddelde van klas Multimedia (3666 - 7545, n=58, laatste 2 jaar) | |
| Gemiddeld Intel Core i7-13700H (4825 - 6238, n=29) | |
| Asus VivoBook Pro 16 K6602VU | |
| Dell Inspiron 16 Plus 7630 | |
| Asus VivoBook 14X K3405 | |
| Samsung Galaxy Book3 Ultra 16 | |
| Lenovo Slim Pro 7 14ARP8 | |
| Geekbench 6.7 / Multi-Core | |
| Gemiddelde van klas Multimedia (4983 - 29415, n=71, laatste 2 jaar) | |
| Dell Inspiron 16 Plus 7630 | |
| HP Pavilion Plus 16-ab0456tx | |
| Schenker Vision 14 M23 RTX 3050 | |
| Gemiddeld Intel Core i7-13700H (8415 - 13832, n=13) | |
| Asus VivoBook Pro 16 K6602VU | |
| Geekbench 6.7 / Single-Core | |
| Gemiddelde van klas Multimedia (1534 - 4335, n=70, laatste 2 jaar) | |
| Schenker Vision 14 M23 RTX 3050 | |
| Dell Inspiron 16 Plus 7630 | |
| HP Pavilion Plus 16-ab0456tx | |
| Gemiddeld Intel Core i7-13700H (2316 - 2639, n=13) | |
| Asus VivoBook Pro 16 K6602VU | |
| Geekbench 5.5 / Multi-Core | |
| Gemiddelde van klas Multimedia (4652 - 20422, n=58, laatste 2 jaar) | |
| Dell Inspiron 16 Plus 7630 | |
| Gemiddeld Intel Core i7-13700H (6165 - 14215, n=29) | |
| Samsung Galaxy Book3 Ultra 16 | |
| HP Pavilion Plus 16-ab0456tx | |
| Schenker Vision 14 M23 RTX 3050 | |
| Asus VivoBook Pro 16 K6602VU | |
| Asus VivoBook 14X K3405 | |
| Lenovo Slim Pro 7 14ARP8 | |
| Geekbench 5.5 / Single-Core | |
| Gemiddelde van klas Multimedia (805 - 2974, n=58, laatste 2 jaar) | |
| Dell Inspiron 16 Plus 7630 | |
| Schenker Vision 14 M23 RTX 3050 | |
| HP Pavilion Plus 16-ab0456tx | |
| Gemiddeld Intel Core i7-13700H (1362 - 1919, n=29) | |
| Asus VivoBook Pro 16 K6602VU | |
| Samsung Galaxy Book3 Ultra 16 | |
| Asus VivoBook 14X K3405 | |
| Lenovo Slim Pro 7 14ARP8 | |
| HWBOT x265 Benchmark v2.2 / 4k Preset | |
| Gemiddelde van klas Multimedia (5.26 - 36.1, n=58, laatste 2 jaar) | |
| Samsung Galaxy Book3 Ultra 16 | |
| Asus VivoBook Pro 16 K6602VU | |
| Gemiddeld Intel Core i7-13700H (6.72 - 21.2, n=29) | |
| HP Pavilion Plus 16-ab0456tx | |
| Lenovo Slim Pro 7 14ARP8 | |
| Dell Inspiron 16 Plus 7630 | |
| Asus VivoBook 14X K3405 | |
| Schenker Vision 14 M23 RTX 3050 | |
| LibreOffice / 20 Documents To PDF | |
| HP Pavilion Plus 16-ab0456tx | |
| Lenovo Slim Pro 7 14ARP8 | |
| Schenker Vision 14 M23 RTX 3050 | |
| Asus VivoBook Pro 16 K6602VU | |
| Gemiddelde van klas Multimedia (23.9 - 146.7, n=59, laatste 2 jaar) | |
| Samsung Galaxy Book3 Ultra 16 | |
| Gemiddeld Intel Core i7-13700H (31.3 - 62.4, n=29) | |
| Asus VivoBook 14X K3405 | |
| Dell Inspiron 16 Plus 7630 | |
| R Benchmark 2.5 / Overall mean | |
| Lenovo Slim Pro 7 14ARP8 | |
| Asus VivoBook 14X K3405 | |
| Samsung Galaxy Book3 Ultra 16 | |
| Asus VivoBook Pro 16 K6602VU | |
| Gemiddeld Intel Core i7-13700H (0.4308 - 0.607, n=29) | |
| Gemiddelde van klas Multimedia (0.3604 - 0.947, n=58, laatste 2 jaar) | |
| Schenker Vision 14 M23 RTX 3050 | |
| HP Pavilion Plus 16-ab0456tx | |
| Dell Inspiron 16 Plus 7630 | |
* ... kleiner is beter
AIDA64: FP32 Ray-Trace | FPU Julia | CPU SHA3 | CPU Queen | FPU SinJulia | FPU Mandel | CPU AES | CPU ZLib | FP64 Ray-Trace | CPU PhotoWorxx
| Performance rating | |
| Gemiddelde van klas Multimedia | |
| Asus VivoBook Pro 16 K6602VU | |
| Lenovo Slim Pro 7 14ARP8 | |
| HP Pavilion Plus 16-ab0456tx | |
| Samsung Galaxy Book3 Ultra 16 | |
| Gemiddeld Intel Core i7-13700H | |
| Dell Inspiron 16 Plus 7630 | |
| Asus VivoBook 14X K3405 | |
| Schenker Vision 14 M23 RTX 3050 | |
| AIDA64 / FP32 Ray-Trace | |
| Gemiddelde van klas Multimedia (2214 - 50388, n=55, laatste 2 jaar) | |
| Lenovo Slim Pro 7 14ARP8 | |
| HP Pavilion Plus 16-ab0456tx | |
| Samsung Galaxy Book3 Ultra 16 | |
| Gemiddeld Intel Core i7-13700H (4986 - 18908, n=29) | |
| Dell Inspiron 16 Plus 7630 | |
| Asus VivoBook Pro 16 K6602VU | |
| Asus VivoBook 14X K3405 | |
| Schenker Vision 14 M23 RTX 3050 | |
| AIDA64 / FPU Julia | |
| Lenovo Slim Pro 7 14ARP8 | |
| Gemiddelde van klas Multimedia (12867 - 201874, n=56, laatste 2 jaar) | |
| HP Pavilion Plus 16-ab0456tx | |
| Asus VivoBook Pro 16 K6602VU | |
| Gemiddeld Intel Core i7-13700H (25360 - 92359, n=29) | |
| Samsung Galaxy Book3 Ultra 16 | |
| Dell Inspiron 16 Plus 7630 | |
| Asus VivoBook 14X K3405 | |
| Schenker Vision 14 M23 RTX 3050 | |
| AIDA64 / CPU SHA3 | |
| Gemiddelde van klas Multimedia (626 - 8623, n=56, laatste 2 jaar) | |
| Asus VivoBook 14X K3405 | |
| HP Pavilion Plus 16-ab0456tx | |
| Asus VivoBook Pro 16 K6602VU | |
| Samsung Galaxy Book3 Ultra 16 | |
| Gemiddeld Intel Core i7-13700H (1339 - 4224, n=29) | |
| Lenovo Slim Pro 7 14ARP8 | |
| Dell Inspiron 16 Plus 7630 | |
| Schenker Vision 14 M23 RTX 3050 | |
| AIDA64 / CPU Queen | |
| Dell Inspiron 16 Plus 7630 | |
| Samsung Galaxy Book3 Ultra 16 | |
| HP Pavilion Plus 16-ab0456tx | |
| Gemiddeld Intel Core i7-13700H (59324 - 107159, n=29) | |
| Asus VivoBook Pro 16 K6602VU | |
| Lenovo Slim Pro 7 14ARP8 | |
| Schenker Vision 14 M23 RTX 3050 | |
| Asus VivoBook 14X K3405 | |
| Gemiddelde van klas Multimedia (13483 - 181505, n=43, laatste 2 jaar) | |
| AIDA64 / FPU SinJulia | |
| Lenovo Slim Pro 7 14ARP8 | |
| HP Pavilion Plus 16-ab0456tx | |
| Samsung Galaxy Book3 Ultra 16 | |
| Gemiddelde van klas Multimedia (886 - 28794, n=56, laatste 2 jaar) | |
| Dell Inspiron 16 Plus 7630 | |
| Asus VivoBook Pro 16 K6602VU | |
| Gemiddeld Intel Core i7-13700H (4800 - 11050, n=29) | |
| Schenker Vision 14 M23 RTX 3050 | |
| Asus VivoBook 14X K3405 | |
| AIDA64 / FPU Mandel | |
| Lenovo Slim Pro 7 14ARP8 | |
| Gemiddelde van klas Multimedia (6395 - 105740, n=55, laatste 2 jaar) | |
| HP Pavilion Plus 16-ab0456tx | |
| Samsung Galaxy Book3 Ultra 16 | |
| Gemiddeld Intel Core i7-13700H (12321 - 45118, n=29) | |
| Asus VivoBook Pro 16 K6602VU | |
| Dell Inspiron 16 Plus 7630 | |
| Asus VivoBook 14X K3405 | |
| Schenker Vision 14 M23 RTX 3050 | |
| AIDA64 / CPU AES | |
| Asus VivoBook Pro 16 K6602VU | |
| Asus VivoBook 14X K3405 | |
| Gemiddeld Intel Core i7-13700H (28769 - 151254, n=29) | |
| HP Pavilion Plus 16-ab0456tx | |
| Samsung Galaxy Book3 Ultra 16 | |
| Gemiddelde van klas Multimedia (8171 - 126790, n=56, laatste 2 jaar) | |
| Dell Inspiron 16 Plus 7630 | |
| Schenker Vision 14 M23 RTX 3050 | |
| Lenovo Slim Pro 7 14ARP8 | |
| AIDA64 / CPU ZLib | |
| Samsung Galaxy Book3 Ultra 16 | |
| Gemiddelde van klas Multimedia (143.8 - 2022, n=56, laatste 2 jaar) | |
| HP Pavilion Plus 16-ab0456tx | |
| Asus VivoBook Pro 16 K6602VU | |
| Gemiddeld Intel Core i7-13700H (389 - 1215, n=29) | |
| Asus VivoBook 14X K3405 | |
| Dell Inspiron 16 Plus 7630 | |
| Schenker Vision 14 M23 RTX 3050 | |
| Lenovo Slim Pro 7 14ARP8 | |
| AIDA64 / FP64 Ray-Trace | |
| Gemiddelde van klas Multimedia (1014 - 26875, n=56, laatste 2 jaar) | |
| HP Pavilion Plus 16-ab0456tx | |
| Lenovo Slim Pro 7 14ARP8 | |
| Samsung Galaxy Book3 Ultra 16 | |
| Asus VivoBook Pro 16 K6602VU | |
| Gemiddeld Intel Core i7-13700H (2540 - 10135, n=29) | |
| Dell Inspiron 16 Plus 7630 | |
| Asus VivoBook 14X K3405 | |
| Schenker Vision 14 M23 RTX 3050 | |
| AIDA64 / CPU PhotoWorxx | |
| Gemiddelde van klas Multimedia (8187 - 88154, n=56, laatste 2 jaar) | |
| Samsung Galaxy Book3 Ultra 16 | |
| Schenker Vision 14 M23 RTX 3050 | |
| HP Pavilion Plus 16-ab0456tx | |
| Gemiddeld Intel Core i7-13700H (12872 - 52727, n=29) | |
| Asus VivoBook Pro 16 K6602VU | |
| Dell Inspiron 16 Plus 7630 | |
| Lenovo Slim Pro 7 14ARP8 | |
| Asus VivoBook 14X K3405 | |
Bekijk onze speciale Intel Core i7-13700H pagina voor meer prestatievergelijkingen.
Systeemprestaties
De Pavilion Plus 16 slaagt er op de een of andere manier in om voorbij de VivoBook Pro 16 te komen met een Core i9-13900H en RTX 4050 combo in algemene CrossMark-tests, maar verliest het van de laatste in PCMark 10 met 6%.
Voor de rest voelt het systeem behoorlijk responsief aan voor dagelijkse productiviteit en surftaken op het web.
CrossMark: Overall | Productivity | Creativity | Responsiveness
AIDA64: Memory Copy | Memory Read | Memory Write | Memory Latency
WebXPRT 3: Overall
WebXPRT 4: Overall
Mozilla Kraken 1.1: Total
| PCMark 10 / Score | |
| Gemiddelde van klas Multimedia (4325 - 10386, n=54, laatste 2 jaar) | |
| Dell Inspiron 16 Plus 7630 | |
| Asus VivoBook Pro 16 K6602VU | |
| Samsung Galaxy Book3 Ultra 16 | |
| Asus VivoBook 14X K3405 | |
| HP Pavilion Plus 16-ab0456tx | |
| Gemiddeld Intel Core i7-13700H, NVIDIA GeForce RTX 3050 6GB Laptop GPU (6290 - 6597, n=2) | |
| Lenovo Slim Pro 7 14ARP8 | |
| Schenker Vision 14 M23 RTX 3050 | |
| PCMark 10 / Essentials | |
| Dell Inspiron 16 Plus 7630 | |
| Samsung Galaxy Book3 Ultra 16 | |
| Gemiddelde van klas Multimedia (8025 - 11664, n=53, laatste 2 jaar) | |
| Asus VivoBook Pro 16 K6602VU | |
| Asus VivoBook 14X K3405 | |
| HP Pavilion Plus 16-ab0456tx | |
| Gemiddeld Intel Core i7-13700H, NVIDIA GeForce RTX 3050 6GB Laptop GPU (9943 - 10112, n=2) | |
| Lenovo Slim Pro 7 14ARP8 | |
| Schenker Vision 14 M23 RTX 3050 | |
| PCMark 10 / Productivity | |
| Gemiddelde van klas Multimedia (7323 - 18233, n=53, laatste 2 jaar) | |
| Dell Inspiron 16 Plus 7630 | |
| Asus VivoBook 14X K3405 | |
| Schenker Vision 14 M23 RTX 3050 | |
| Gemiddeld Intel Core i7-13700H, NVIDIA GeForce RTX 3050 6GB Laptop GPU (8803 - 8950, n=2) | |
| HP Pavilion Plus 16-ab0456tx | |
| Asus VivoBook Pro 16 K6602VU | |
| Samsung Galaxy Book3 Ultra 16 | |
| Lenovo Slim Pro 7 14ARP8 | |
| PCMark 10 / Digital Content Creation | |
| Dell Inspiron 16 Plus 7630 | |
| Asus VivoBook Pro 16 K6602VU | |
| Gemiddelde van klas Multimedia (3651 - 16240, n=53, laatste 2 jaar) | |
| Samsung Galaxy Book3 Ultra 16 | |
| Lenovo Slim Pro 7 14ARP8 | |
| HP Pavilion Plus 16-ab0456tx | |
| Asus VivoBook 14X K3405 | |
| Gemiddeld Intel Core i7-13700H, NVIDIA GeForce RTX 3050 6GB Laptop GPU (7590 - 8752, n=2) | |
| Schenker Vision 14 M23 RTX 3050 | |
| CrossMark / Overall | |
| Gemiddelde van klas Multimedia (866 - 2728, n=62, laatste 2 jaar) | |
| Dell Inspiron 16 Plus 7630 | |
| HP Pavilion Plus 16-ab0456tx | |
| Asus VivoBook Pro 16 K6602VU | |
| Asus VivoBook 14X K3405 | |
| Gemiddeld Intel Core i7-13700H, NVIDIA GeForce RTX 3050 6GB Laptop GPU (1504 - 1752, n=2) | |
| Samsung Galaxy Book3 Ultra 16 | |
| Schenker Vision 14 M23 RTX 3050 | |
| Lenovo Slim Pro 7 14ARP8 | |
| CrossMark / Productivity | |
| Gemiddelde van klas Multimedia (931 - 2489, n=62, laatste 2 jaar) | |
| Dell Inspiron 16 Plus 7630 | |
| Asus VivoBook Pro 16 K6602VU | |
| HP Pavilion Plus 16-ab0456tx | |
| Asus VivoBook 14X K3405 | |
| Gemiddeld Intel Core i7-13700H, NVIDIA GeForce RTX 3050 6GB Laptop GPU (1417 - 1657, n=2) | |
| Samsung Galaxy Book3 Ultra 16 | |
| Schenker Vision 14 M23 RTX 3050 | |
| Lenovo Slim Pro 7 14ARP8 | |
| CrossMark / Creativity | |
| Gemiddelde van klas Multimedia (907 - 3465, n=62, laatste 2 jaar) | |
| Dell Inspiron 16 Plus 7630 | |
| HP Pavilion Plus 16-ab0456tx | |
| Asus VivoBook Pro 16 K6602VU | |
| Gemiddeld Intel Core i7-13700H, NVIDIA GeForce RTX 3050 6GB Laptop GPU (1711 - 1970, n=2) | |
| Schenker Vision 14 M23 RTX 3050 | |
| Asus VivoBook 14X K3405 | |
| Samsung Galaxy Book3 Ultra 16 | |
| Lenovo Slim Pro 7 14ARP8 | |
| CrossMark / Responsiveness | |
| Dell Inspiron 16 Plus 7630 | |
| Gemiddelde van klas Multimedia (605 - 2024, n=62, laatste 2 jaar) | |
| Asus VivoBook Pro 16 K6602VU | |
| Samsung Galaxy Book3 Ultra 16 | |
| Asus VivoBook 14X K3405 | |
| HP Pavilion Plus 16-ab0456tx | |
| Gemiddeld Intel Core i7-13700H, NVIDIA GeForce RTX 3050 6GB Laptop GPU (1220 - 1458, n=2) | |
| Schenker Vision 14 M23 RTX 3050 | |
| Lenovo Slim Pro 7 14ARP8 | |
| AIDA64 / Memory Copy | |
| Gemiddelde van klas Multimedia (11299 - 132135, n=56, laatste 2 jaar) | |
| Samsung Galaxy Book3 Ultra 16 | |
| Schenker Vision 14 M23 RTX 3050 | |
| Gemiddeld Intel Core i7-13700H, NVIDIA GeForce RTX 3050 6GB Laptop GPU (64356 - 65837, n=2) | |
| HP Pavilion Plus 16-ab0456tx | |
| Dell Inspiron 16 Plus 7630 | |
| Asus VivoBook Pro 16 K6602VU | |
| Lenovo Slim Pro 7 14ARP8 | |
| Asus VivoBook 14X K3405 | |
| AIDA64 / Memory Read | |
| Gemiddelde van klas Multimedia (11624 - 174586, n=56, laatste 2 jaar) | |
| Schenker Vision 14 M23 RTX 3050 | |
| Samsung Galaxy Book3 Ultra 16 | |
| Gemiddeld Intel Core i7-13700H, NVIDIA GeForce RTX 3050 6GB Laptop GPU (65825 - 70861, n=2) | |
| Dell Inspiron 16 Plus 7630 | |
| Asus VivoBook Pro 16 K6602VU | |
| HP Pavilion Plus 16-ab0456tx | |
| Lenovo Slim Pro 7 14ARP8 | |
| Asus VivoBook 14X K3405 | |
| AIDA64 / Memory Write | |
| Samsung Galaxy Book3 Ultra 16 | |
| Gemiddelde van klas Multimedia (11755 - 134998, n=56, laatste 2 jaar) | |
| HP Pavilion Plus 16-ab0456tx | |
| Gemiddeld Intel Core i7-13700H, NVIDIA GeForce RTX 3050 6GB Laptop GPU (68174 - 76930, n=2) | |
| Schenker Vision 14 M23 RTX 3050 | |
| Asus VivoBook Pro 16 K6602VU | |
| Dell Inspiron 16 Plus 7630 | |
| Lenovo Slim Pro 7 14ARP8 | |
| Asus VivoBook 14X K3405 | |
| AIDA64 / Memory Latency | |
| Gemiddelde van klas Multimedia (7 - 535, n=55, laatste 2 jaar) | |
| Lenovo Slim Pro 7 14ARP8 | |
| Samsung Galaxy Book3 Ultra 16 | |
| Dell Inspiron 16 Plus 7630 | |
| Asus VivoBook Pro 16 K6602VU | |
| HP Pavilion Plus 16-ab0456tx | |
| Asus VivoBook 14X K3405 | |
| Gemiddeld Intel Core i7-13700H, NVIDIA GeForce RTX 3050 6GB Laptop GPU (85.7 - 89.7, n=2) | |
| Schenker Vision 14 M23 RTX 3050 | |
| WebXPRT 3 / Overall | |
| Gemiddelde van klas Multimedia (136.4 - 596, n=65, laatste 2 jaar) | |
| Dell Inspiron 16 Plus 7630 | |
| Schenker Vision 14 M23 RTX 3050 | |
| Gemiddeld Intel Core i7-13700H, NVIDIA GeForce RTX 3050 6GB Laptop GPU (286 - 300, n=2) | |
| HP Pavilion Plus 16-ab0456tx | |
| Asus VivoBook 14X K3405 | |
| Lenovo Slim Pro 7 14ARP8 | |
| Samsung Galaxy Book3 Ultra 16 | |
| WebXPRT 4 / Overall | |
| Schenker Vision 14 M23 RTX 3050 | |
| Gemiddeld Intel Core i7-13700H, NVIDIA GeForce RTX 3050 6GB Laptop GPU (273 - 325, n=2) | |
| Gemiddelde van klas Multimedia (167.3 - 402, n=67, laatste 2 jaar) | |
| Dell Inspiron 16 Plus 7630 | |
| HP Pavilion Plus 16-ab0456tx | |
| Asus VivoBook 14X K3405 | |
| Asus VivoBook Pro 16 K6602VU | |
| Samsung Galaxy Book3 Ultra 16 | |
| Lenovo Slim Pro 7 14ARP8 | |
| Mozilla Kraken 1.1 / Total | |
| Lenovo Slim Pro 7 14ARP8 | |
| Samsung Galaxy Book3 Ultra 16 | |
| Asus VivoBook 14X K3405 | |
| Asus VivoBook Pro 16 K6602VU | |
| Dell Inspiron 16 Plus 7630 | |
| Schenker Vision 14 M23 RTX 3050 | |
| Gemiddeld Intel Core i7-13700H, NVIDIA GeForce RTX 3050 6GB Laptop GPU (490 - 496, n=2) | |
| HP Pavilion Plus 16-ab0456tx | |
| Gemiddelde van klas Multimedia (228 - 835, n=68, laatste 2 jaar) | |
* ... kleiner is beter
| PCMark 8 Home Score Accelerated v2 | 5525 punten | |
| PCMark 8 Work Score Accelerated v2 | 5653 punten | |
| PCMark 10 Score | 6597 punten | |
Help | ||
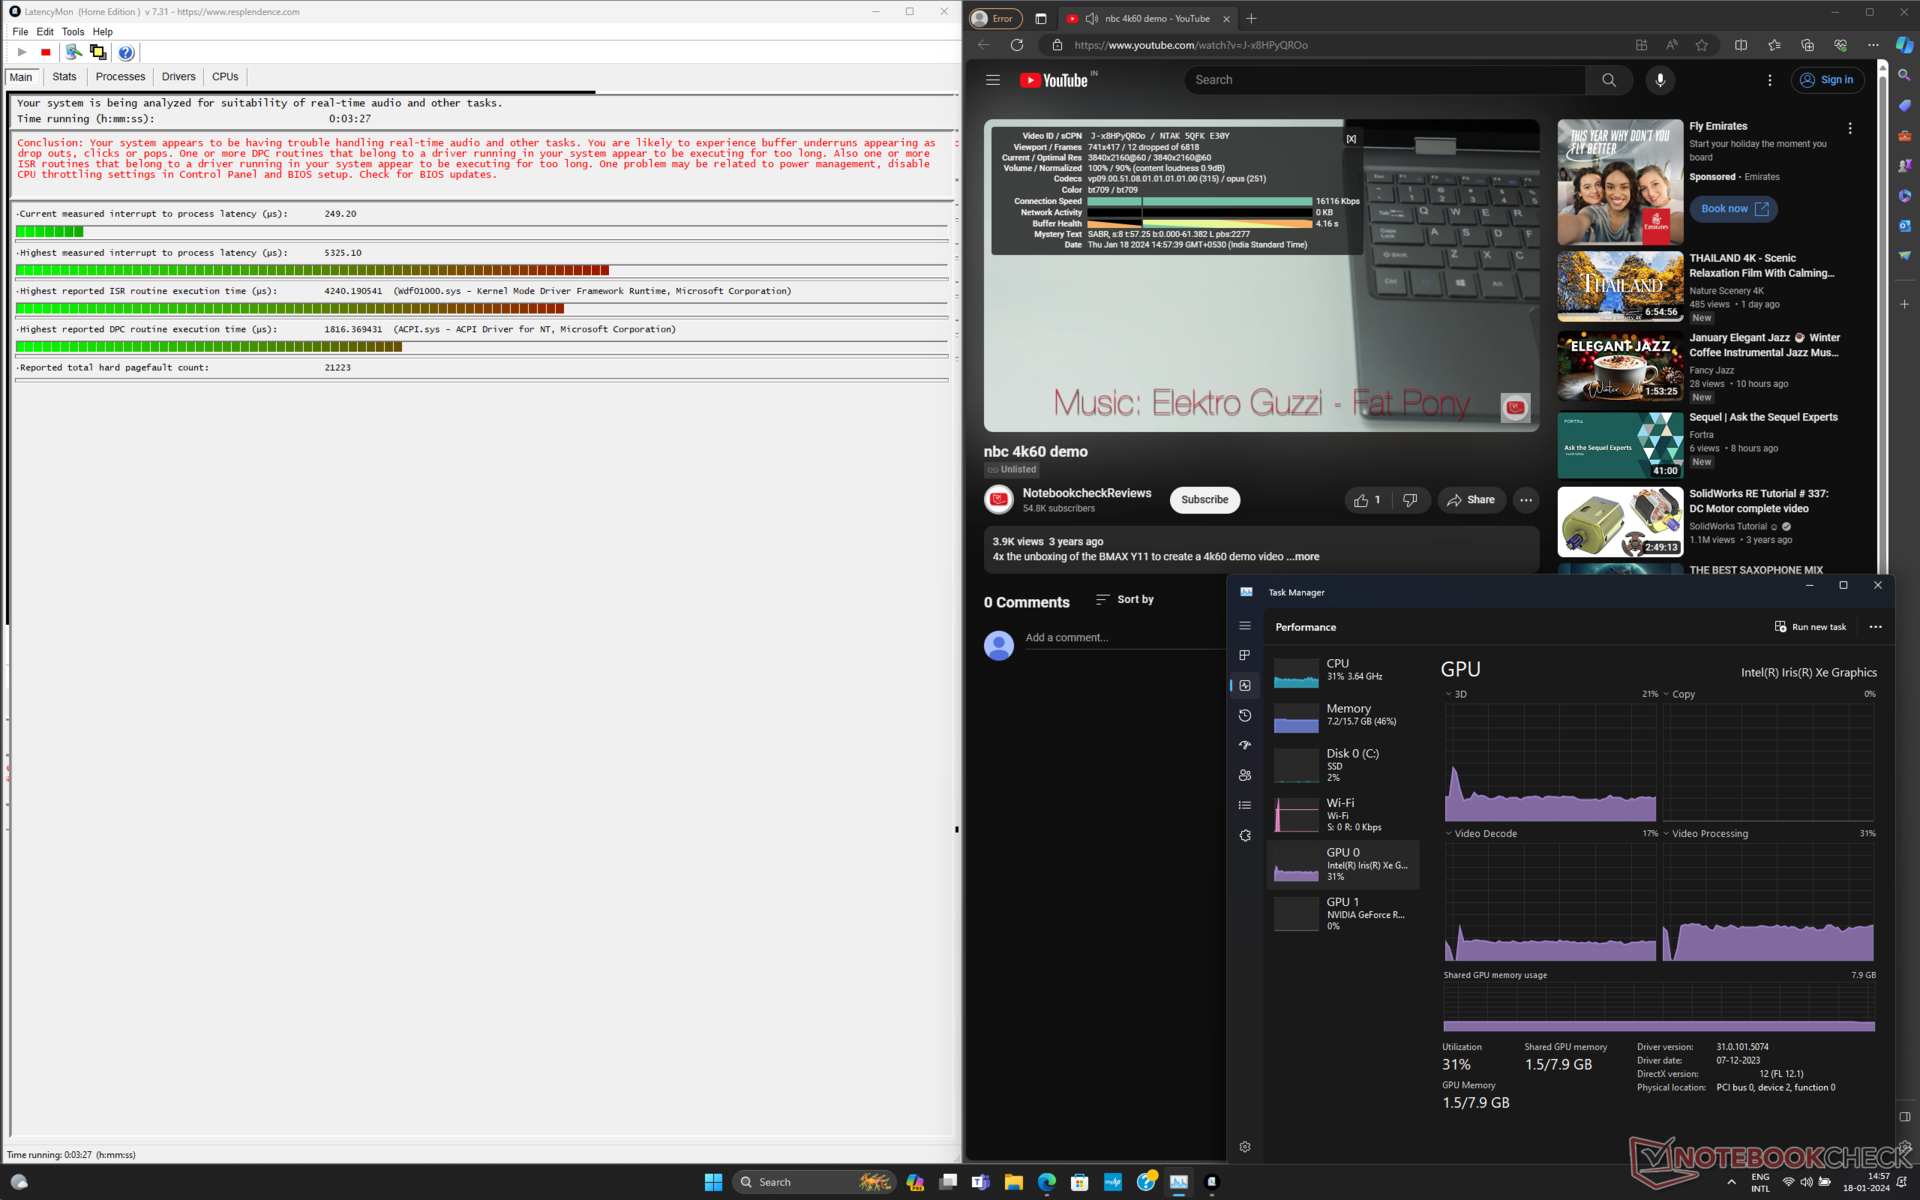
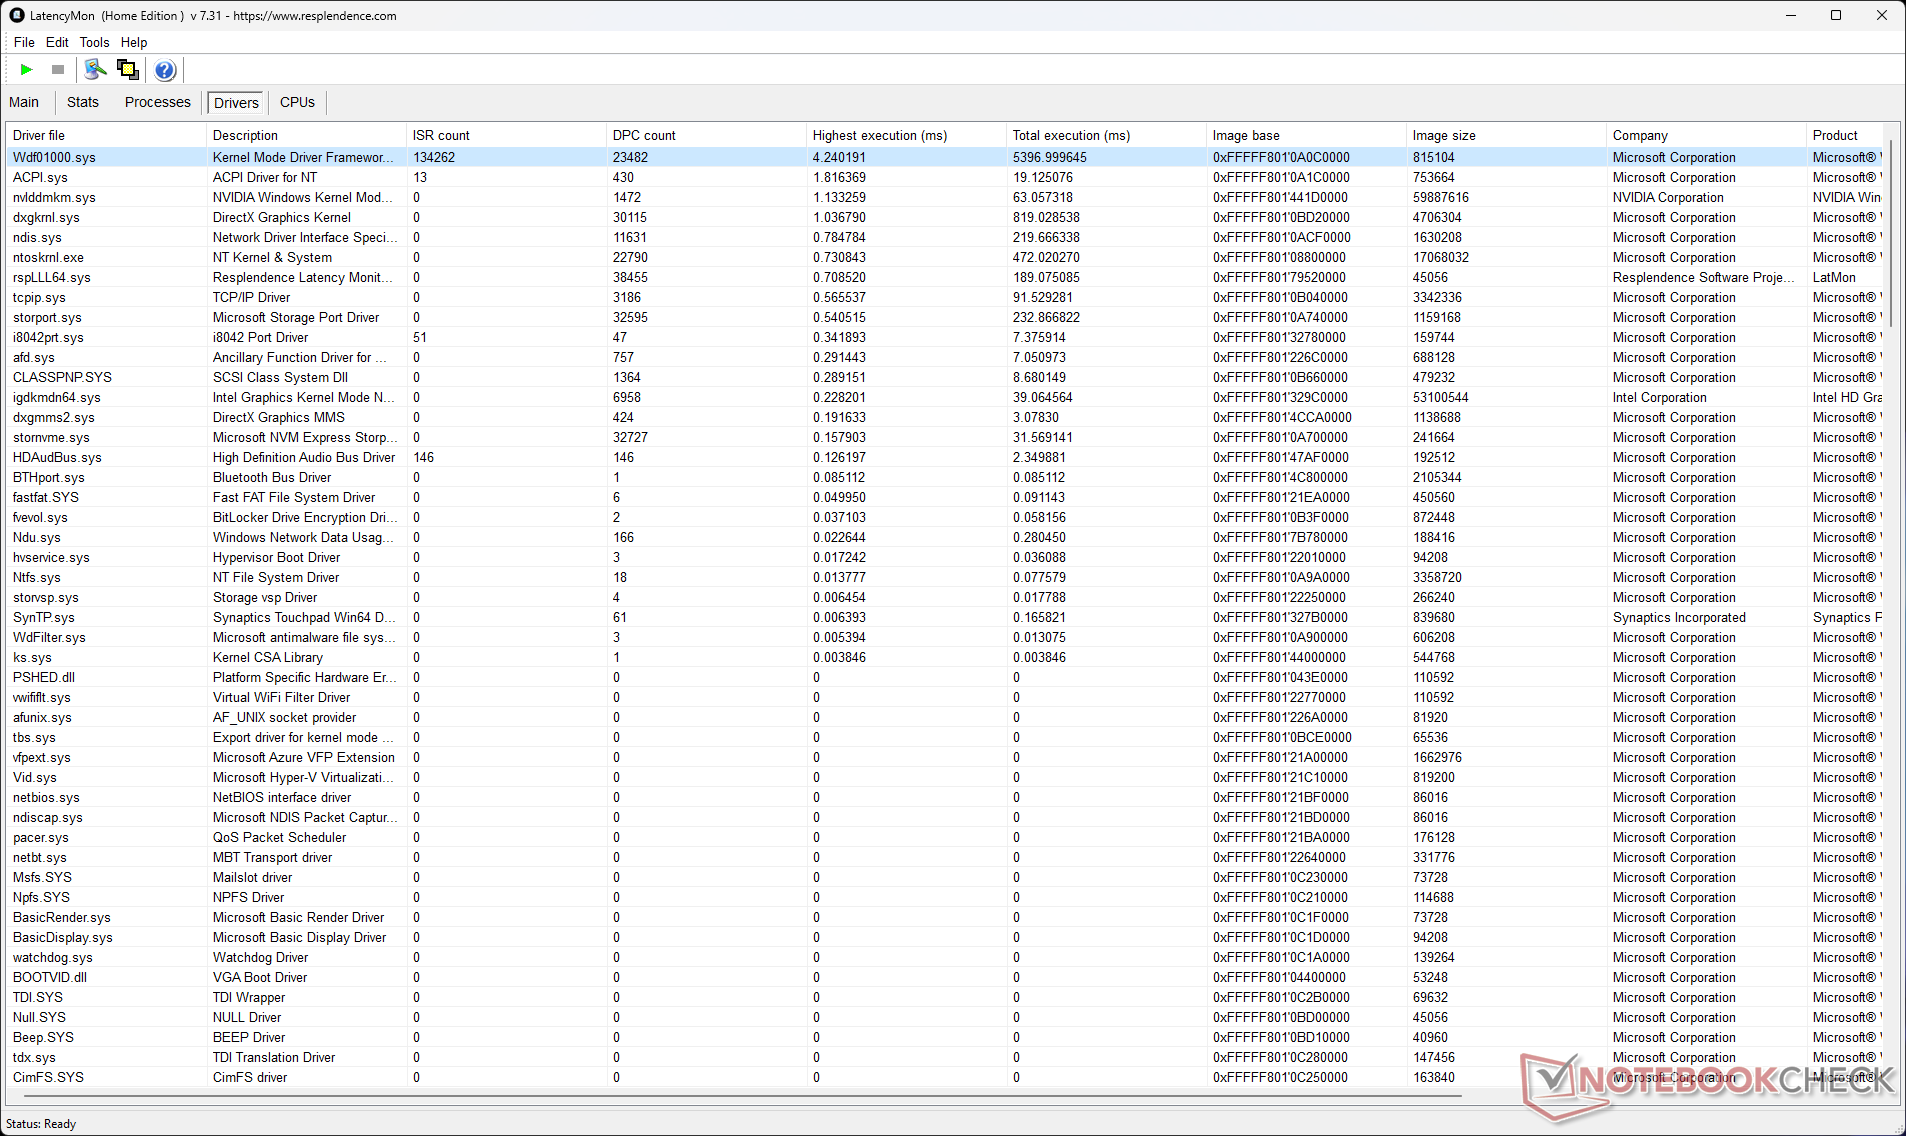
DPC latentie
De gemeten interrupt-tot-proces latentie van 5325,1 μs van de Pavilion Plus 16 is aan de hoge kant, wat een probleem kan zijn voor mensen die zich bezighouden met realtime audio- en videoworkflows.
| DPC Latencies / LatencyMon - interrupt to process latency (max), Web, Youtube, Prime95 | |
| HP Pavilion Plus 16-ab0456tx | |
| Samsung Galaxy Book3 Ultra 16 | |
| Asus VivoBook Pro 16 K6602VU | |
| Schenker Vision 14 M23 RTX 3050 | |
| Lenovo Slim Pro 7 14ARP8 | |
| Asus VivoBook 14X K3405 | |
| Dell Inspiron 16 Plus 7630 | |
* ... kleiner is beter
Onze DPC latentie ranglijst pagina biedt meer latentievergelijkingen tussen gereviewde apparaten.
Opslagapparaten
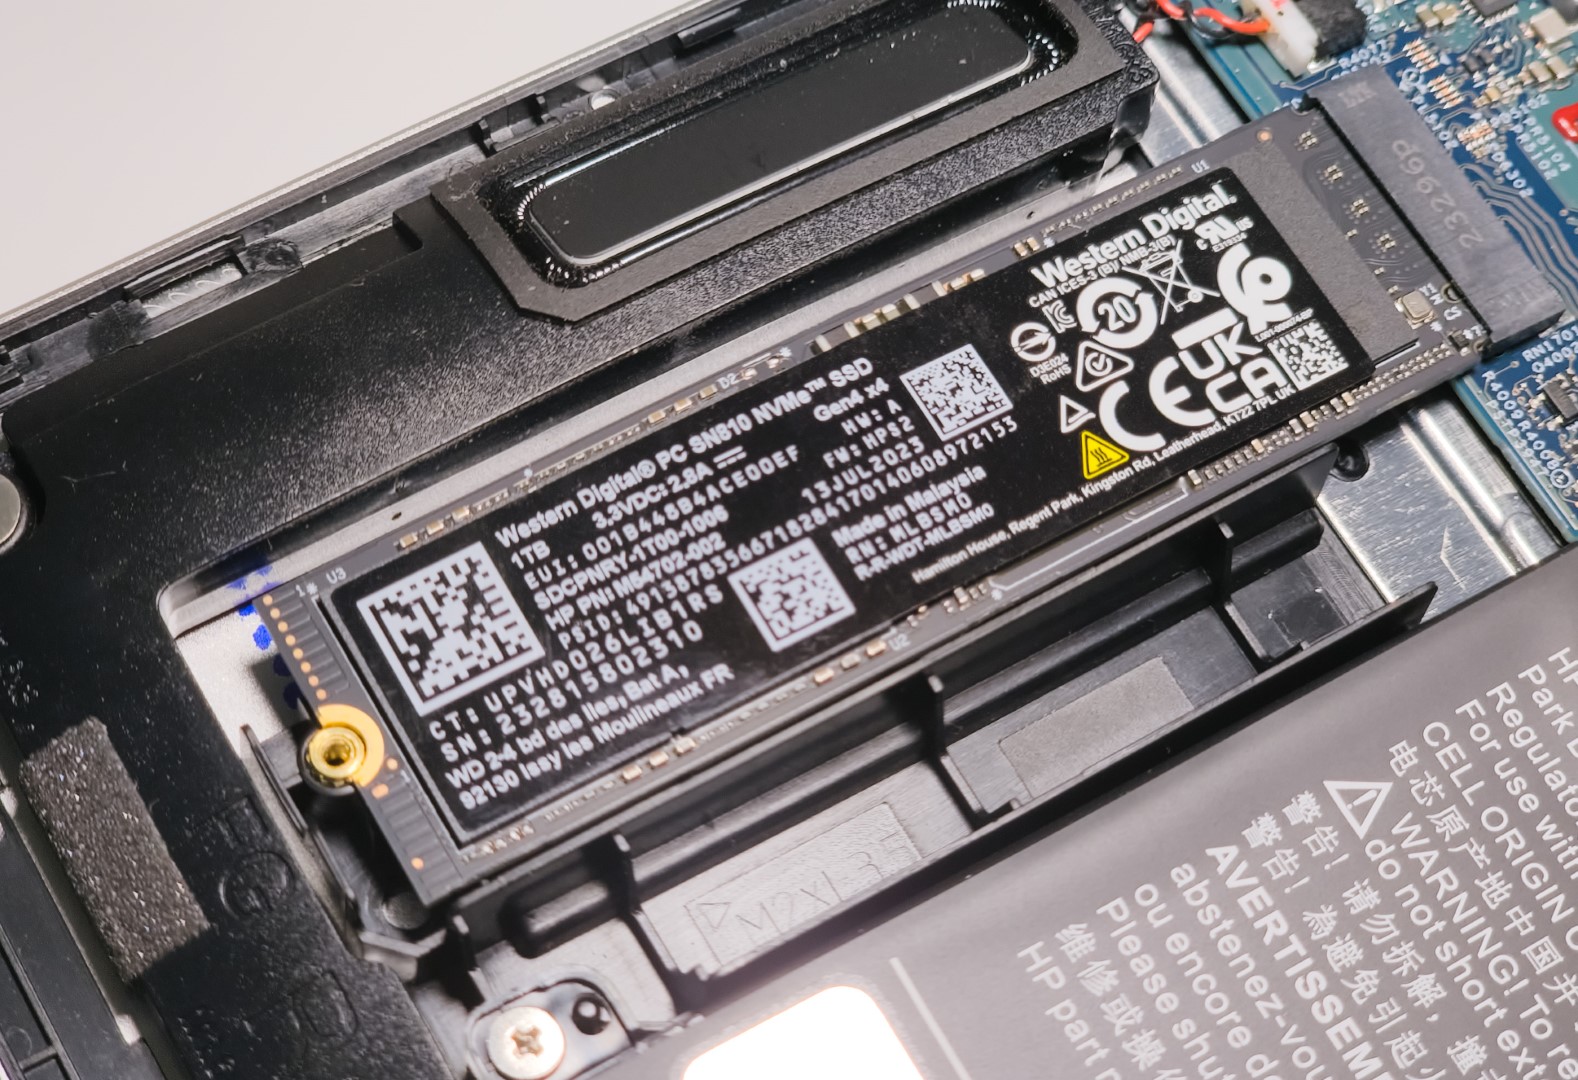
Een Western Digital PC SN810 1 TB NVMe-schijf is geïnstalleerd in onze Pavilion Plus 16-eenheid. De cumulatieve prestaties van de schijf zijn ongeveer 10% langzamer dan de Samsung 990 Pro in de Schenker Vision 14 M23 en ongeveer 16% langzamer dan de Samsung PM9A1 in de Samsung Galaxy Book3 Ultra 16.
De lagere 4K lees-/schrijfprestaties dragen voornamelijk bij aan dit prestatietekort.
Helaas kan er maar één SSD in het chassis worden geïnstalleerd. Er is ook geen ruimte om 2,5 inch schijven toe te voegen.

* ... kleiner is beter
Schijf onderdrukken: DiskSpd Leeslus, wachtrijdiepte 8
Hoewel HP een thermische hoes voor de SSD levert, is dit blijkbaar niet genoeg om te voorkomen dat de schijf na de 25e lus afslaat tijdens onze DiskSpd-leeslustest met een wachtrijdiepte van 8.
Meer opslagbenchmarks vindt u op onze SSD-vergelijkingspagina.
GPU-prestaties
De Pavilion Plus 16 is de enige andere laptop die we hebben getest met de nieuwere RTX 3050 6 GB laptop GPU, afgezien van de Lenovo Slim Pro 7 en de Schenker Vision 14 M23.
De RTX 3050 6 GB in de HP laptop is berekend op een TGP van 60 W, terwijl de Schenker en Lenovo respectievelijk een 50 W en 63 W implementatie hebben.
Dienovereenkomstig heeft de Slim 7 Pro een lichte voorsprong in cumulatieve 3DMark-prestaties ten opzichte van de Pavilion Plus 16, terwijl de Vision 14 M23 de HP met 5% achter zich laat.
| 3DMark 11 Performance | 17282 punten | |
| 3DMark Ice Storm Standard Score | 82182 punten | |
| 3DMark Cloud Gate Standard Score | 43015 punten | |
| 3DMark Fire Strike Score | 10890 punten | |
| 3DMark Fire Strike Extreme Score | 5641 punten | |
Help | ||
| Blender / v3.3 Classroom OPTIX/RTX | |
| Asus VivoBook 14X K3405 | |
| Schenker Vision 14 M23 RTX 3050 | |
| Gemiddeld NVIDIA GeForce RTX 3050 4GB Laptop GPU (53 - 99, n=12) | |
| Lenovo Slim Pro 7 14ARP8 | |
| HP Pavilion Plus 16-ab0456tx | |
| Gemiddelde van klas Multimedia (12 - 105, n=23, laatste 2 jaar) | |
| Samsung Galaxy Book3 Ultra 16 | |
| Asus VivoBook Pro 16 K6602VU | |
| Dell Inspiron 16 Plus 7630 | |
| Blender / v3.3 Classroom CUDA | |
| Asus VivoBook 14X K3405 | |
| Asus VivoBook 14X K3405 | |
| Gemiddeld NVIDIA GeForce RTX 3050 4GB Laptop GPU (97 - 152, n=13) | |
| Schenker Vision 14 M23 RTX 3050 | |
| Lenovo Slim Pro 7 14ARP8 | |
| HP Pavilion Plus 16-ab0456tx | |
| Samsung Galaxy Book3 Ultra 16 | |
| Gemiddelde van klas Multimedia (20 - 186, n=23, laatste 2 jaar) | |
| Asus VivoBook Pro 16 K6602VU | |
| Dell Inspiron 16 Plus 7630 | |
| Blender / v3.3 Classroom CPU | |
| Gemiddeld NVIDIA GeForce RTX 3050 4GB Laptop GPU (388 - 937, n=11) | |
| Schenker Vision 14 M23 RTX 3050 | |
| Asus VivoBook 14X K3405 | |
| Lenovo Slim Pro 7 14ARP8 | |
| Dell Inspiron 16 Plus 7630 | |
| Gemiddelde van klas Multimedia (134.5 - 1042, n=63, laatste 2 jaar) | |
| Samsung Galaxy Book3 Ultra 16 | |
| HP Pavilion Plus 16-ab0456tx | |
| Asus VivoBook Pro 16 K6602VU | |
* ... kleiner is beter
Gaming prestaties
We zien een cumulatief voordeel van ongeveer 10% in 1080p gaming met de RTX 3050 6 GB in vergelijking met de RTX 3050 4 GB gemiddeld.
De RTX 3050 van de Pavilion Plus 16 laat goede cumulatieve winsten zien in 1080p gamingprestaties ten opzichte van de Slim Pro 7 en de Vision 14 M23, maar blijft 25% achter bij de 65 W RTX 4050 Laptop GPU in de VivoBook Pro 16.
Interessant genoeg is de Pavilion Plus 16 ook in staat om de Galaxy Book3 Ultra 16 met een RTX 4050 voor te blijven in algemene gaming, maar dit komt door de slechte prestaties van de laatstgenoemde in Dota 2 Reborn en X-Plane 11.
De RTX 3050 6 GB kan oudere titels probleemloos spelen op 1080p Ultra, maar moderne AAA-games hebben moeite met alles boven 1080p Hoge instellingen.
De Witcher 3 FPS-tabel
We hebben geen merkbare throttling waargenomen tijdens een stresstest met The Witcher 3 op 1080p Ultra, wat duidt op efficiënte koeling.
| lage | gem. | hoge | ultra | QHD | |
|---|---|---|---|---|---|
| GTA V (2015) | 177.9 | 172 | 123.3 | 62.7 | 42.7 |
| The Witcher 3 (2015) | 244 | 159.1 | 91.4 | 50.1 | 37 |
| Dota 2 Reborn (2015) | 155.2 | 131 | 124.2 | 116.9 | |
| Final Fantasy XV Benchmark (2018) | 128.2 | 70.9 | 52 | 37.4 | |
| X-Plane 11.11 (2018) | 140.6 | 117 | 97.3 | ||
| Far Cry 5 (2018) | 89 | 82 | 76 | 52 | |
| Strange Brigade (2018) | 256 | 112.8 | 91.9 | 80.5 | 57.1 |
| F1 22 (2022) | 150.2 | 145.3 | 109.5 | 34 | 20.1 |
| F1 23 (2023) | 150.1 | 141.2 | 97.5 | 26 | 14.3 |
| Cyberpunk 2077 (2023) | 67.6 | 52.1 | 43.2 | 36.9 | 21.3 |
| Assassin's Creed Mirage (2023) | 70 | 63 | 55 | 41 | 31 |
| Avatar Frontiers of Pandora (2023) | 39.5 | 36.3 | 31.5 | 23.4 | 15.1 |
Raadpleeg onze speciale Nvidia GeForce RTX 3050 6 GB laptop GPU pagina voor meer informatie.
Uitstoot: Tolerabel ventilatorgeluid maar hoge oppervlaktetemperaturen onder belasting
Systeemgeluid
We hebben een geluidsdrukniveau (SPL) van 42,1 dB(A) gemeten in de modus Performance onder maximale belasting. Het lijkt erop dat HP limieten heeft ingesteld voor het ventilatorgeluid om onder de 35 db(A) te blijven in de gebalanceerde modus en onder de 45 dB(A) in de prestatiemodus.
Geluidsniveau
| Onbelast |
| 22.22 / 22.22 / 22.22 dB (A) |
| Belasting |
| 42.03 / 42.1 dB (A) |
 | ||
30 dB stil 40 dB(A) hoorbaar 50 dB(A) luid |
||
min: | ||
| Prestatiemodus | Stationair dB(A) | Belasting gemiddeld dB(A) | Belasting maximaal dB(A) | De Witcher 3 1080p Ultra dB(A) |
|---|---|---|---|---|
| Gebalanceerd | 22.22 | 33.81 | 34.08 | 34.41 / 48 fps |
| Prestaties | 22.22 | 42.03 | 42.1 | 42.1 / 50 fps |
| HP Pavilion Plus 16-ab0456tx i7-13700H, GeForce RTX 3050 6GB Laptop GPU | Schenker Vision 14 M23 RTX 3050 i7-13700H, GeForce RTX 3050 6GB Laptop GPU | Dell Inspiron 16 Plus 7630 i7-13700H, GeForce RTX 4060 Laptop GPU | Asus VivoBook 14X K3405 i5-13500H, GeForce RTX 3050 4GB Laptop GPU | Lenovo Slim Pro 7 14ARP8 R7 7735HS, GeForce RTX 3050 6GB Laptop GPU | Asus VivoBook Pro 16 K6602VU i9-13900H, GeForce RTX 4050 Laptop GPU | Samsung Galaxy Book3 Ultra 16 i7-13700H, GeForce RTX 4050 Laptop GPU | |
|---|---|---|---|---|---|---|---|
| Noise | -10% | -7% | -10% | -4% | -14% | -9% | |
| uit / omgeving * (dB) | 22.22 | 23.5 -6% | 23.2 -4% | 21.46 3% | 22.7 -2% | 20.96 6% | 25 -13% |
| Idle Minimum * (dB) | 22.22 | 23.5 -6% | 23.2 -4% | 22.08 1% | 22.8 -3% | 25.28 -14% | 26 -17% |
| Idle Average * (dB) | 22.22 | 23.5 -6% | 23.2 -4% | 22.08 1% | 22.8 -3% | 25.28 -14% | 27 -22% |
| Idle Maximum * (dB) | 22.22 | 26 -17% | 23.2 -4% | 22.08 1% | 22.8 -3% | 25.28 -14% | 28 -26% |
| Load Average * (dB) | 42.03 | 43.6 -4% | 35.1 16% | 52.98 -26% | 43.8 -4% | 51.88 -23% | 40 5% |
| Witcher 3 ultra * (dB) | 42.1 | 48.7 -16% | 52.5 -25% | 52.7 -25% | 43.8 -4% | 49 -16% | 39 7% |
| Load Maximum * (dB) | 42.1 | 49.1 -17% | 52.5 -25% | 52.67 -25% | 47.1 -12% | 51.8 -23% | 41 3% |
* ... kleiner is beter
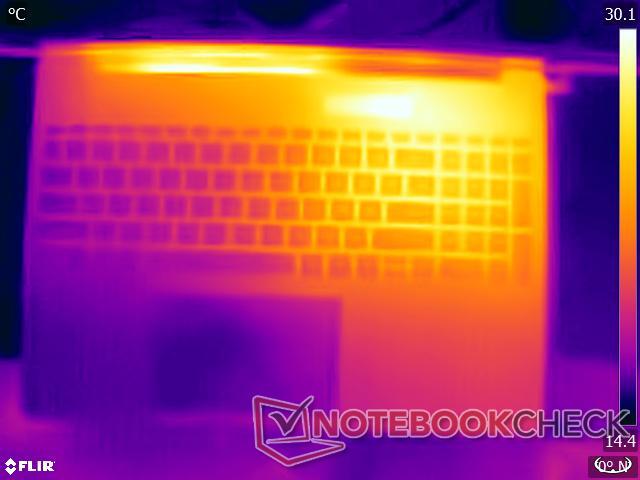
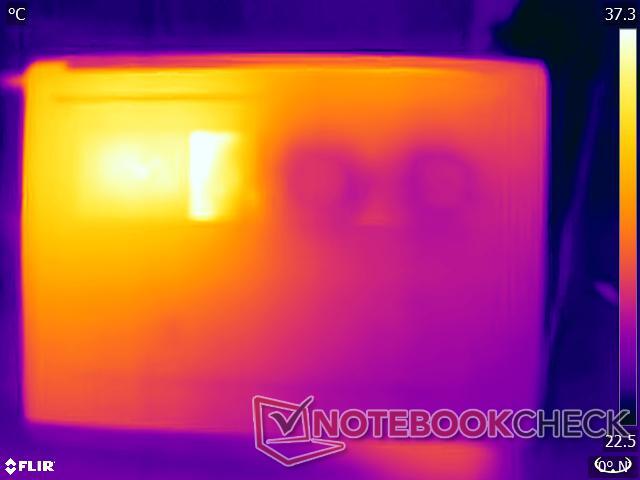
Temperatuur
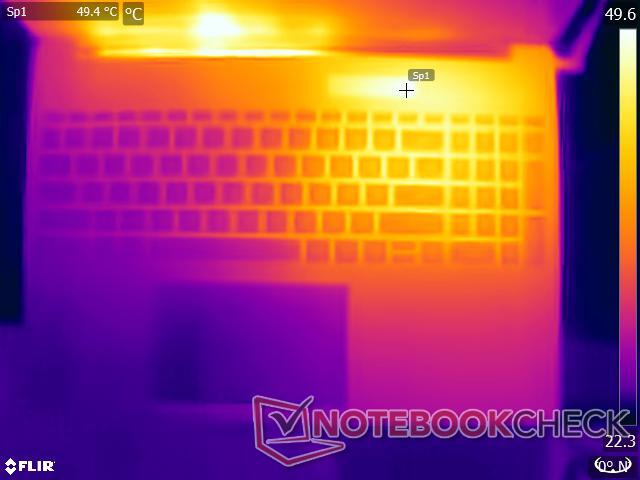
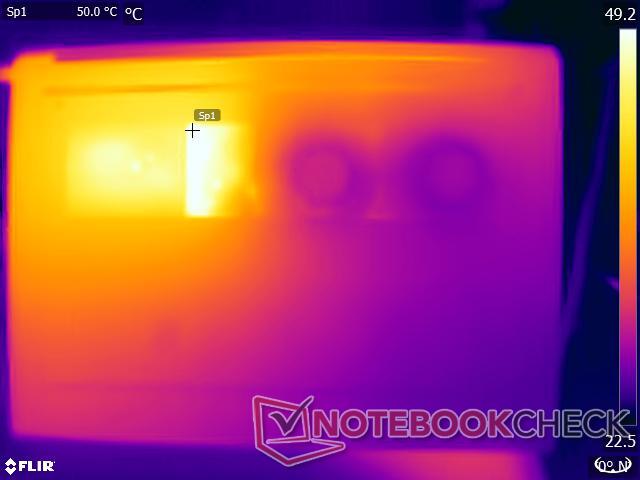
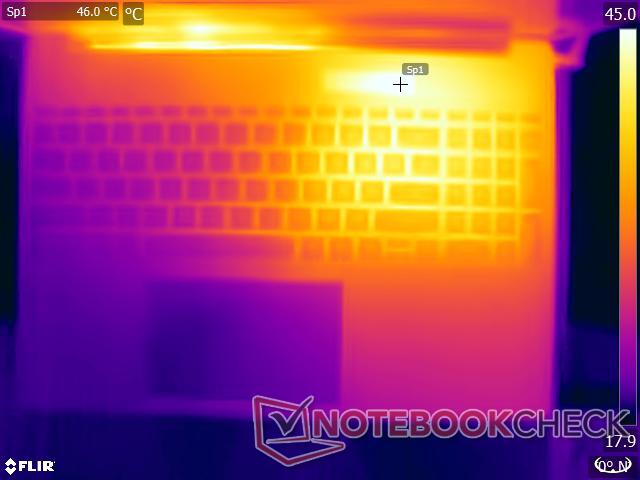
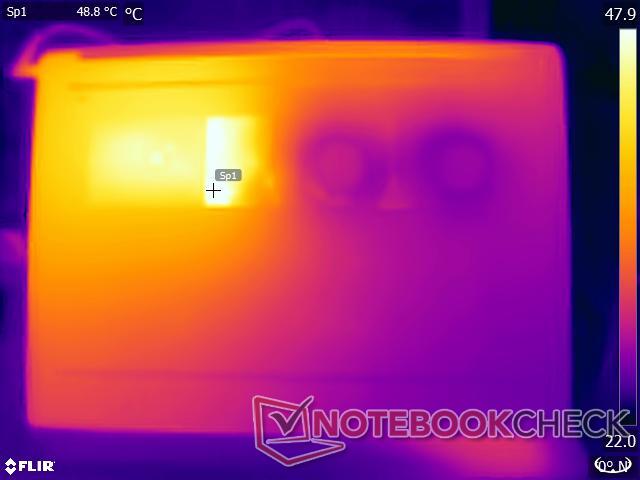
De Pavilion Plus 16 maakt gebruik van een dual-fan dual-heatpipe systeem om de CPU en GPU te koelen. Tijdens onze stresstests werd deze opstelling tot het uiterste gedreven met oppervlaktetemperaturen van 49,6°C aan de bovenkant en 45,8°C aan de onderkant.
Hoewel het apparaat comfortabel op schoot gebruikt kan worden voor lichte taken, kan het oncomfortabel worden bij zware belasting.
(-) De maximumtemperatuur aan de bovenzijde bedraagt 49.6 °C / 121 F, vergeleken met het gemiddelde van 36.8 °C / 98 F, variërend van 21 tot 71 °C voor de klasse Multimedia.
(-) De bodem warmt op tot een maximum van 45.8 °C / 114 F, vergeleken met een gemiddelde van 39.1 °C / 102 F
(±) Bij onbelast gebruik bedraagt de gemiddelde temperatuur voor de bovenzijde 32.3 °C / 90 F, vergeleken met het apparaatgemiddelde van 31.3 °C / 88 F.
(-) Bij het spelen van The Witcher 3 is de gemiddelde temperatuur voor de bovenzijde 39.7 °C / 103 F, vergeleken met het apparaatgemiddelde van 31.3 °C / 88 F.
(+) De handpalmsteunen en het touchpad bereiken maximaal de huidtemperatuur (35 °C / 95 F) en zijn dus niet heet.
(-) De gemiddelde temperatuur van de handpalmsteun van soortgelijke toestellen bedroeg 28.7 °C / 83.7 F (-6.3 °C / -11.3 F).
| HP Pavilion Plus 16-ab0456tx Intel Core i7-13700H, NVIDIA GeForce RTX 3050 6GB Laptop GPU | Schenker Vision 14 M23 RTX 3050 Intel Core i7-13700H, NVIDIA GeForce RTX 3050 6GB Laptop GPU | Dell Inspiron 16 Plus 7630 Intel Core i7-13700H, NVIDIA GeForce RTX 4060 Laptop GPU | Asus VivoBook 14X K3405 Intel Core i5-13500H, NVIDIA GeForce RTX 3050 4GB Laptop GPU | Lenovo Slim Pro 7 14ARP8 AMD Ryzen 7 7735HS, NVIDIA GeForce RTX 3050 6GB Laptop GPU | Asus VivoBook Pro 16 K6602VU Intel Core i9-13900H, NVIDIA GeForce RTX 4050 Laptop GPU | Samsung Galaxy Book3 Ultra 16 Intel Core i7-13700H, NVIDIA GeForce RTX 4050 Laptop GPU | |
|---|---|---|---|---|---|---|---|
| Heat | 10% | 6% | -2% | 19% | -1% | 22% | |
| Maximum Upper Side * (°C) | 49.6 | 48.5 2% | 47.8 4% | 49.2 1% | 42.2 15% | 42.6 14% | 41 17% |
| Maximum Bottom * (°C) | 45.8 | 52.8 -15% | 42.2 8% | 54 -18% | 49 -7% | 48.4 -6% | 44 4% |
| Idle Upper Side * (°C) | 39.2 | 27.6 30% | 35.2 10% | 33.6 14% | 24.4 38% | 39.4 -1% | 23 41% |
| Idle Bottom * (°C) | 35.4 | 27 24% | 35 1% | 37.6 -6% | 25.2 29% | 39.8 -12% | 26 27% |
* ... kleiner is beter
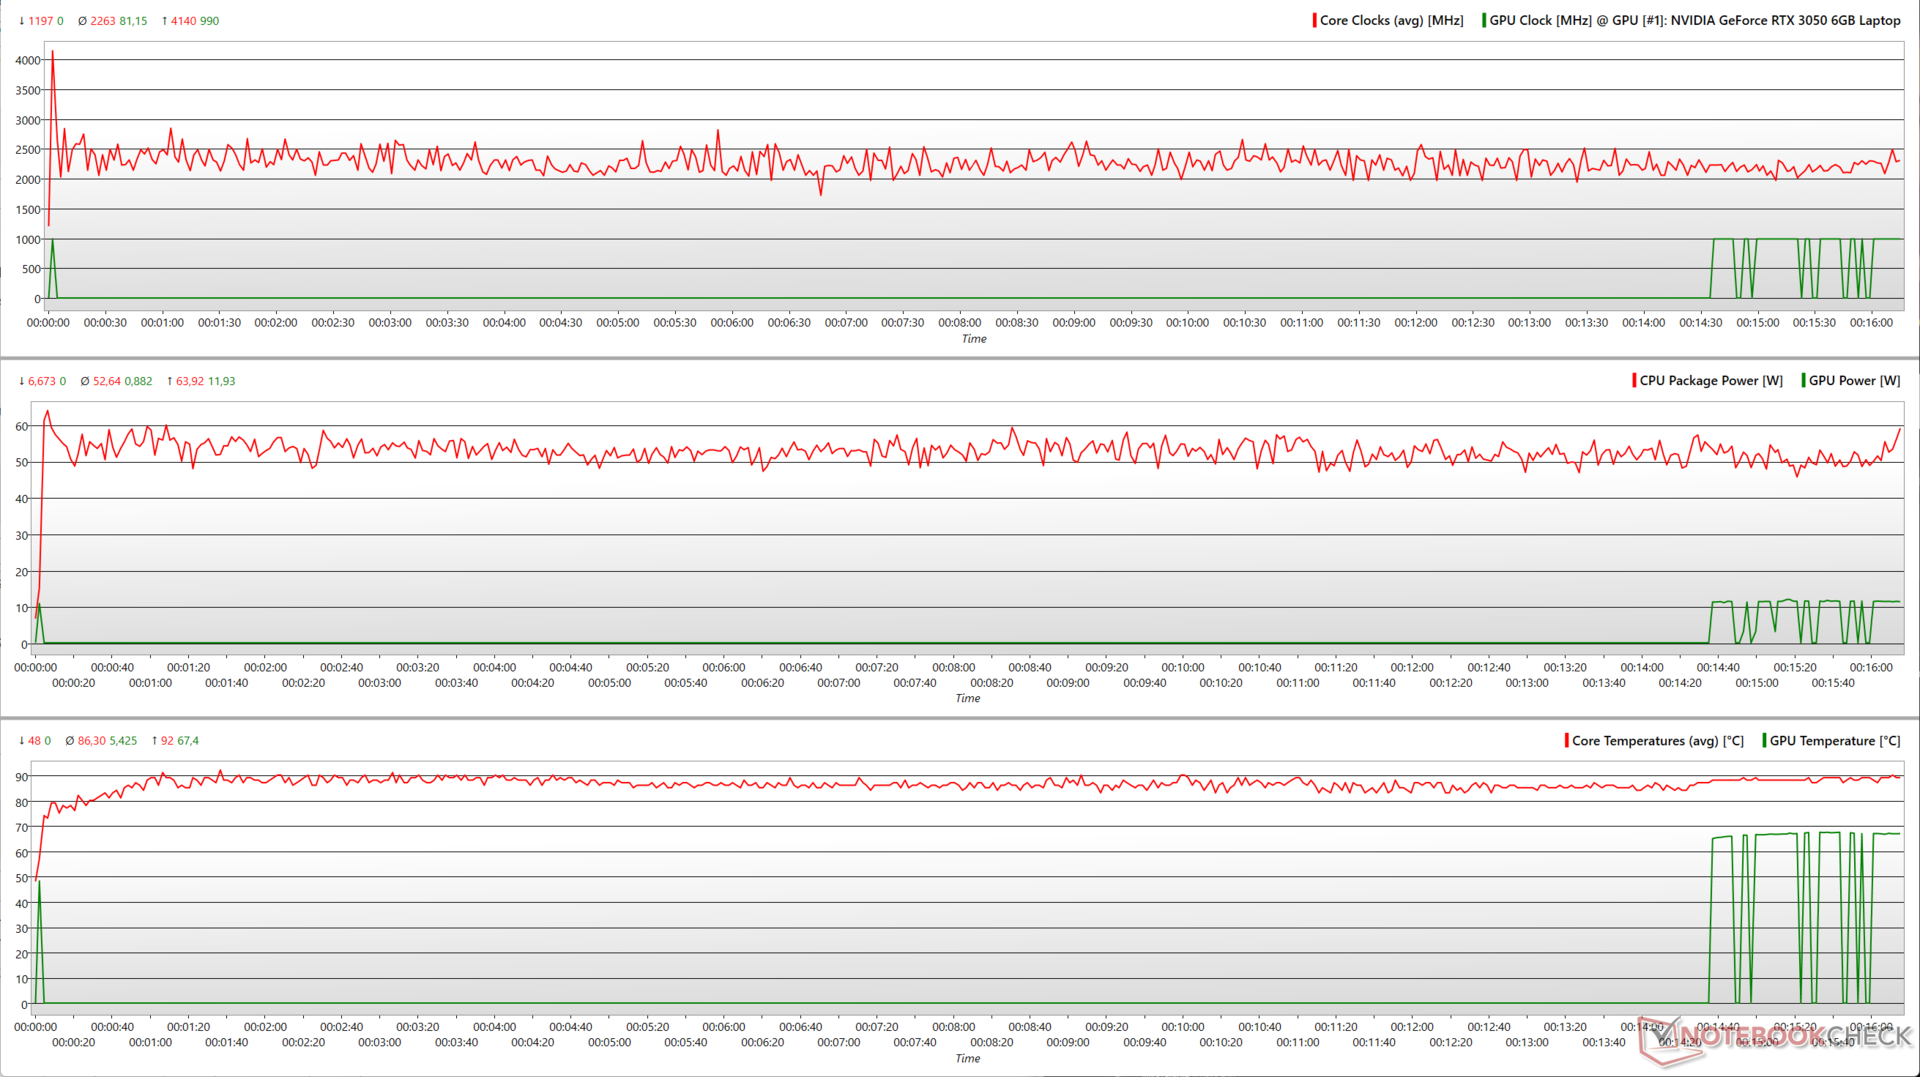
Stresstest
Tijdens een Prime95 in-place grote FFT-stress klokt de Core i7-13700H van de Pavilion Plus 16 gemiddeld 2,2 GHz, terwijl hij gemiddeld 53 W pakketvermogen verbruikt.
Het toevoegen van FurMark zorgt ervoor dat de Core i7-13700H en de RTX 3050 met elkaar concurreren om vermogen, wat resulteert in intermitterende klokstijgingen en -dalingen voor zowel de CPU als de GPU.
Gemiddeld kan de Core i7-13700H slechts klokken tot 1,96 GHz, terwijl de RTX 3050 910 MHz haalt, terwijl hij gemiddeld respectievelijk 41 W en 39 W verbruikt.
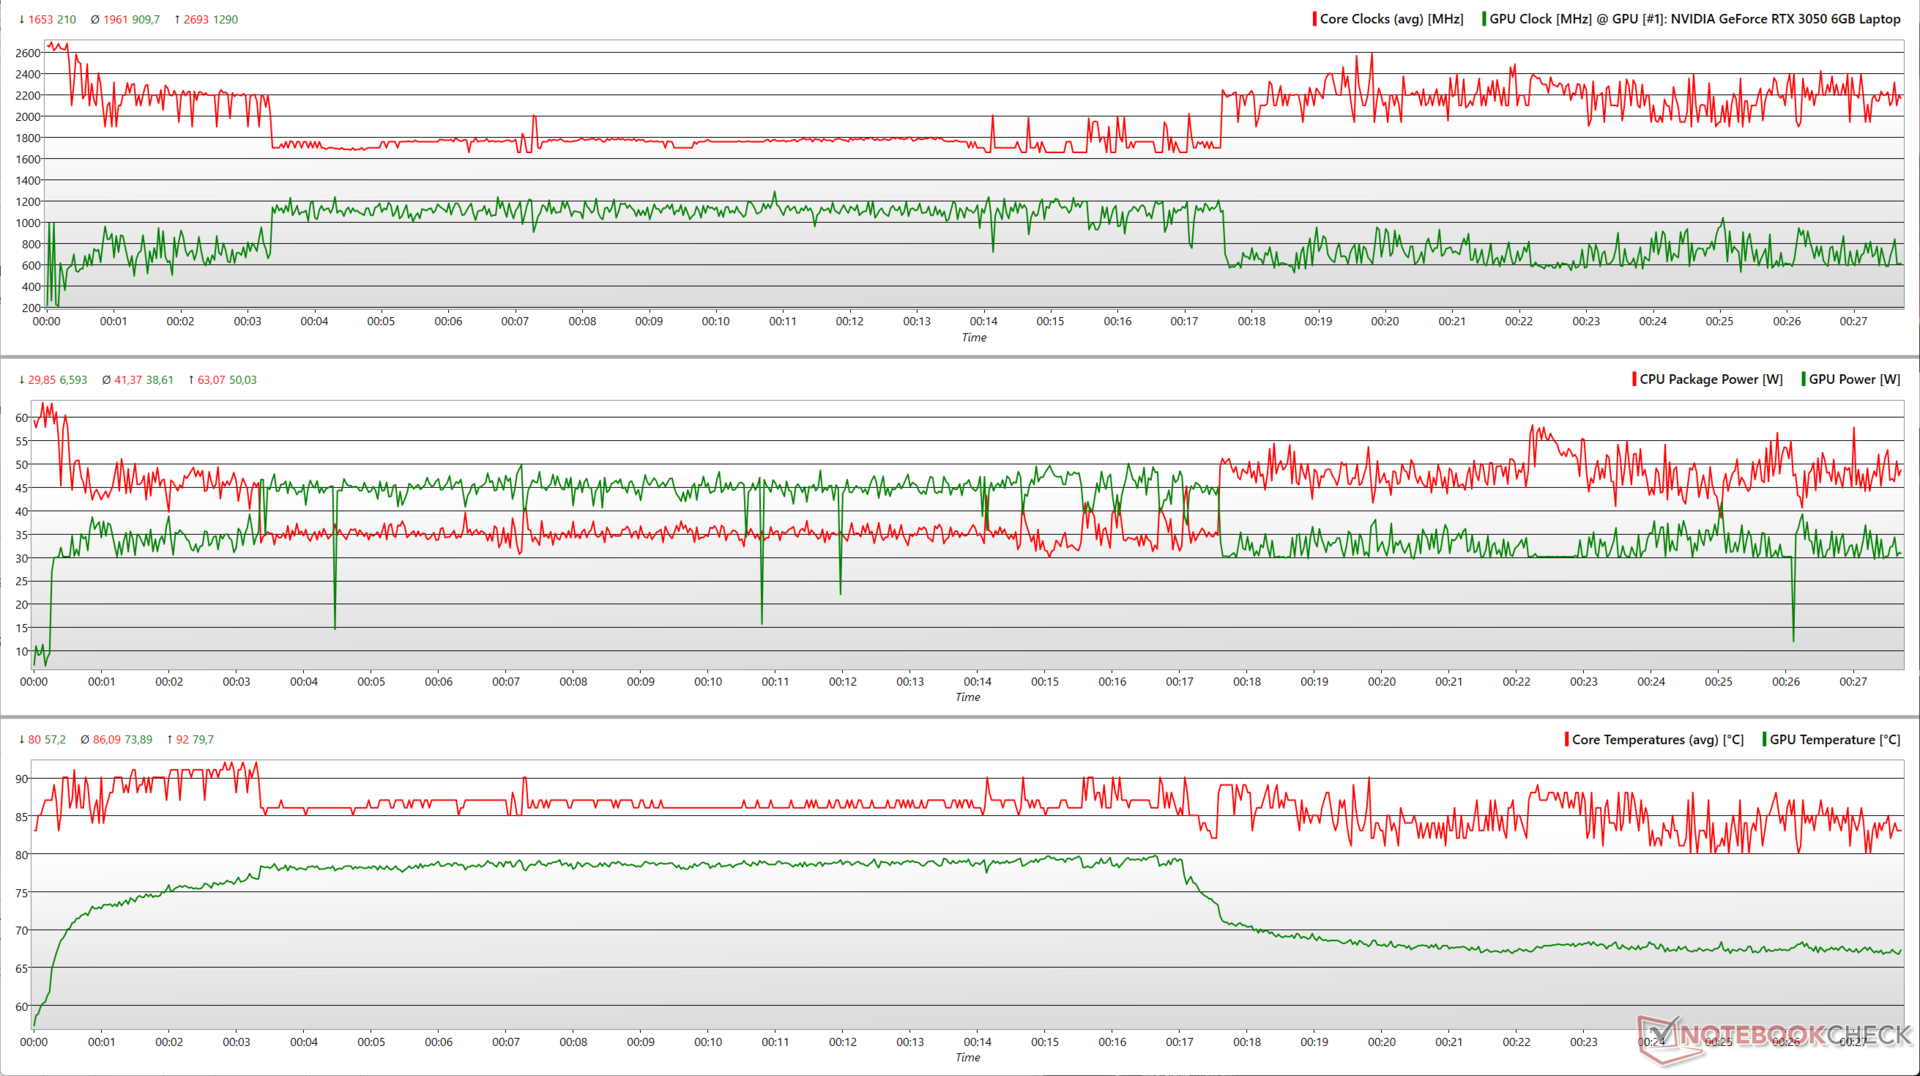
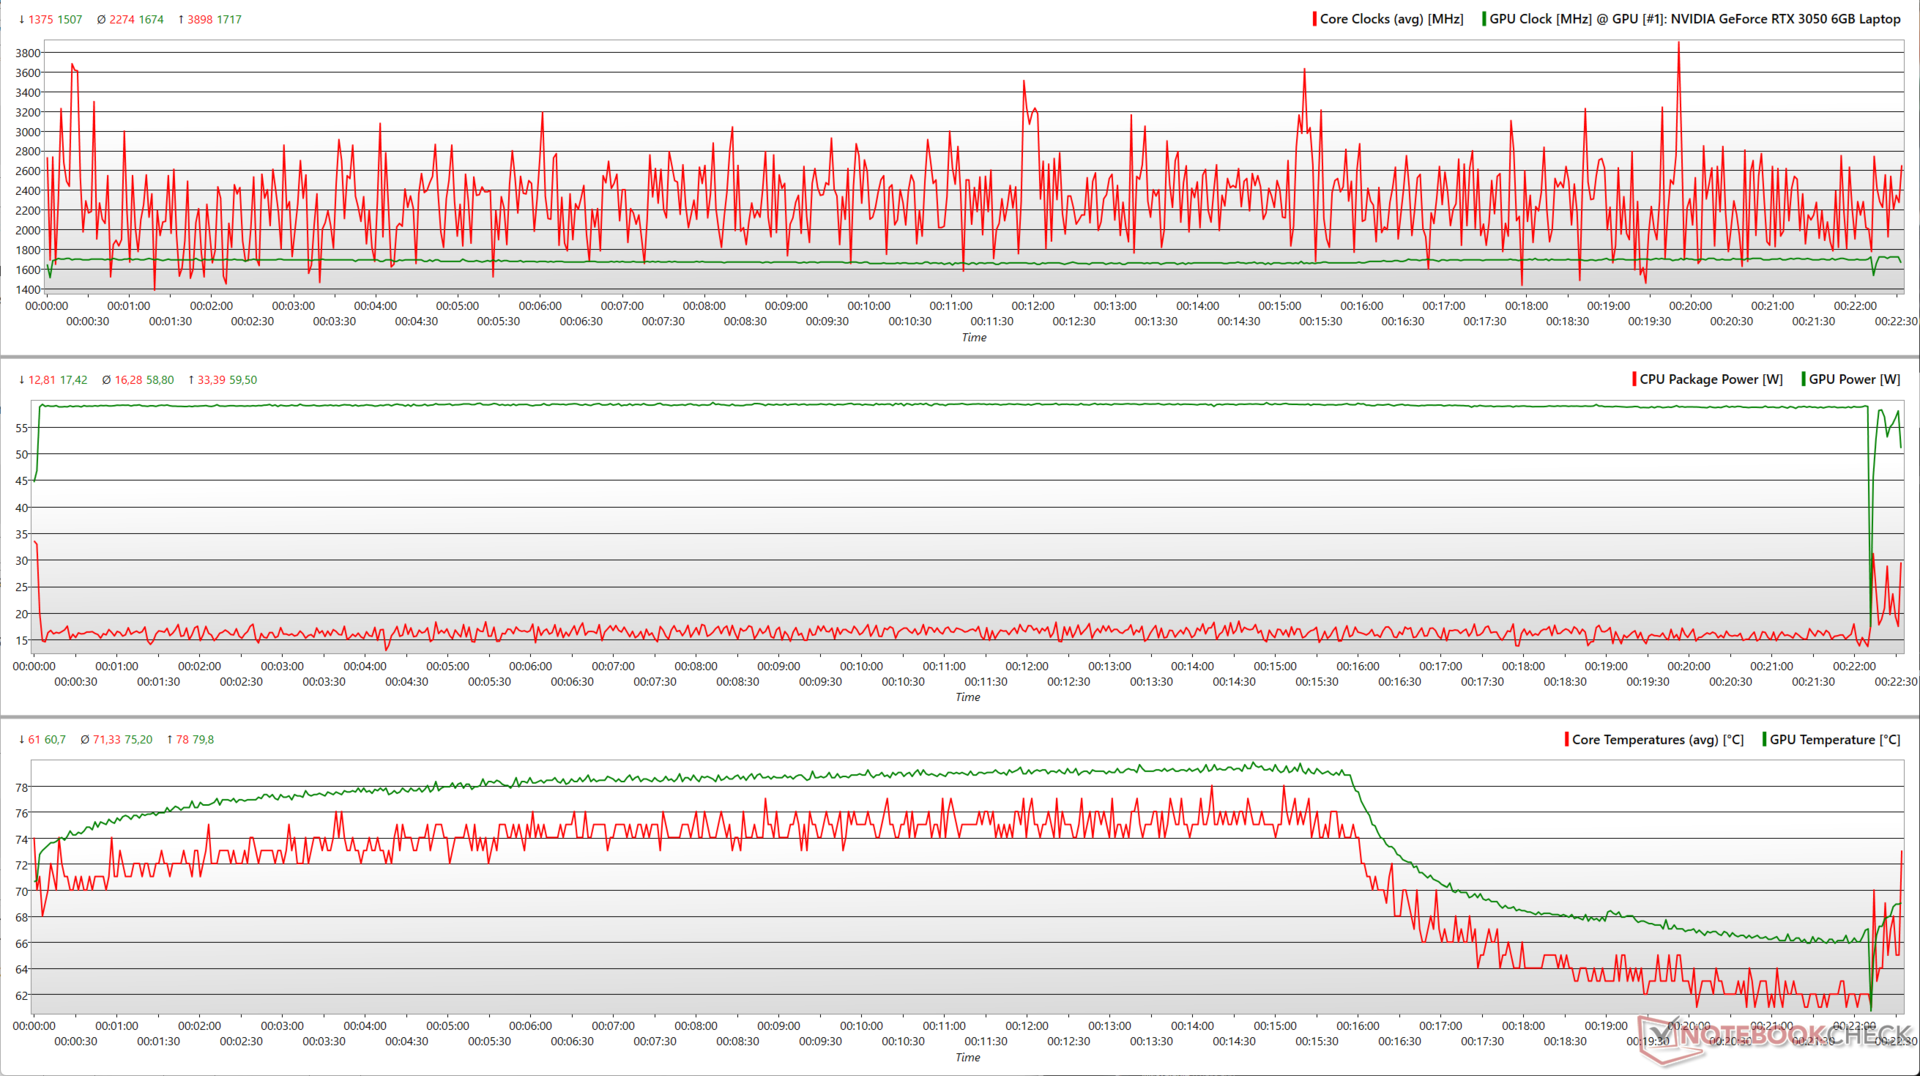
Dingen worden een stuk voorspelbaarder met The Witcher 3 op 1080p Ultra. De RTX 3050 is nu in staat om zijn maximale TGP van bijna 60 W consequent te benutten.
Interessant is dat de kerntemperaturen na een tijdje beginnen te dalen, zelfs als de CPU/GPU-kloks en het vermogen relatief ongewijzigd blijven.
| Stresstest | CPU-klok (GHz) | GPU-klok (MHz) | Gemiddelde CPU-temperatuur (°C) | Gemiddelde GPU-temperatuur (°C) |
| Systeem inactief | 3.74 | - | 52 | 31.1 |
| Prime95 | 2.1 | - | 86 | 67.4 |
| Prime95 + FurMark | 1.93 | 735 | 86 | 73.5 |
| De Witcher 3 1080p Ultra | 2.2 | 1.717 | 71 | 74.2 |
Luidsprekers
De Pavilion Plus 16 wordt geleverd met een paar stereoluidsprekers die een redelijk luide 74,2 dB(A) output hebben, wat in de meeste kamers van gemiddelde grootte voldoende zou moeten zijn. De lage tonen zijn waarneembaar, maar niet erg prominent. De midden- en hoge tonen zijn echter relatief goed gedefinieerd.
Gebruikers kunnen echter betere audio krijgen via externe luidsprekers of Bluetooth 5.3.
HP Pavilion Plus 16-ab0456tx audioanalyse
(±) | luidspreker luidheid is gemiddeld maar goed (74.2 dB)
Bas 100 - 315 Hz
(±) | verminderde zeebaars - gemiddeld 14.7% lager dan de mediaan
(±) | lineariteit van de lage tonen is gemiddeld (7.8% delta ten opzichte van de vorige frequentie)
Midden 400 - 2000 Hz
(+) | evenwichtige middens - slechts 3.4% verwijderd van de mediaan
(+) | de middentonen zijn lineair (4.2% delta ten opzichte van de vorige frequentie)
Hoog 2 - 16 kHz
(+) | evenwichtige hoogtepunten - slechts 4.6% verwijderd van de mediaan
(+) | de hoge tonen zijn lineair (4.8% delta naar de vorige frequentie)
Algemeen 100 - 16.000 Hz
(±) | lineariteit van het totale geluid is gemiddeld (16.7% verschil met de mediaan)
Vergeleken met dezelfde klasse
» 44% van alle geteste apparaten in deze klasse waren beter, 8% vergelijkbaar, 48% slechter
» De beste had een delta van 5%, het gemiddelde was 17%, de slechtste was 45%
Vergeleken met alle geteste toestellen
» 29% van alle geteste apparaten waren beter, 7% gelijk, 64% slechter
» De beste had een delta van 4%, het gemiddelde was 23%, de slechtste was 134%
Apple MacBook Pro 16 2021 M1 Pro audioanalyse
(+) | luidsprekers kunnen relatief luid spelen (84.7 dB)
Bas 100 - 315 Hz
(+) | goede baars - slechts 3.8% verwijderd van de mediaan
(+) | de lage tonen zijn lineair (5.2% delta naar de vorige frequentie)
Midden 400 - 2000 Hz
(+) | evenwichtige middens - slechts 1.3% verwijderd van de mediaan
(+) | de middentonen zijn lineair (2.1% delta ten opzichte van de vorige frequentie)
Hoog 2 - 16 kHz
(+) | evenwichtige hoogtepunten - slechts 1.9% verwijderd van de mediaan
(+) | de hoge tonen zijn lineair (2.7% delta naar de vorige frequentie)
Algemeen 100 - 16.000 Hz
(+) | het totale geluid is lineair (4.6% verschil met de mediaan)
Vergeleken met dezelfde klasse
» 0% van alle geteste apparaten in deze klasse waren beter, 0% vergelijkbaar, 100% slechter
» De beste had een delta van 5%, het gemiddelde was 17%, de slechtste was 45%
Vergeleken met alle geteste toestellen
» 0% van alle geteste apparaten waren beter, 0% gelijk, 100% slechter
» De beste had een delta van 4%, het gemiddelde was 23%, de slechtste was 134%
Energiebeheer: Zuinig energieverbruik en goede levensduur van de batterij
Stroomverbruik
De Pavilion Plus 16 verbruikt over het geheel genomen relatief minder stroom voor de gegeven hardware. Terwijl de Schenker Vision 14 M23 en de Lenovo Slim Pro 7 zuiniger zijn bij gemiddelde belasting en De Witcher 3, is de Pavilion Plus 16 zuiniger bij maximale belasting.
De meegeleverde 135 W voedingsadapter is meer dan voldoende om de laptop onder belasting van stroom te voorzien.
| Uit / Standby | |
| Inactief | |
| Belasting |
|
Key:
min: | |
| HP Pavilion Plus 16-ab0456tx i7-13700H, GeForce RTX 3050 6GB Laptop GPU, IPS, 2560x1600, 16" | Schenker Vision 14 M23 RTX 3050 i7-13700H, GeForce RTX 3050 6GB Laptop GPU, IPS, 2880x1800, 14" | Dell Inspiron 16 Plus 7630 i7-13700H, GeForce RTX 4060 Laptop GPU, IPS, 2560x1600, 16" | Asus VivoBook 14X K3405 i5-13500H, GeForce RTX 3050 4GB Laptop GPU, , 2880x1800, 14" | Lenovo Slim Pro 7 14ARP8 R7 7735HS, GeForce RTX 3050 6GB Laptop GPU, IPS, 2560x1600, 14.5" | Asus VivoBook Pro 16 K6602VU i9-13900H, GeForce RTX 4050 Laptop GPU, OLED, 3200x2000, 16" | Samsung Galaxy Book3 Ultra 16 i7-13700H, GeForce RTX 4050 Laptop GPU, AMOLED, 2880x1800, 16" | Gemiddeld NVIDIA GeForce RTX 3050 6GB Laptop GPU | Gemiddelde van klas Multimedia | |
|---|---|---|---|---|---|---|---|---|---|
| Power Consumption | -2% | -100% | 6% | -30% | -141% | 20% | -8% | -14% | |
| Idle Minimum * (Watt) | 3.3 | 5.2 -58% | 15.6 -373% | 4.96 -50% | 7.6 -130% | 21.06 -538% | 3 9% | 4.55 ? -38% | 5.72 ? -73% |
| Idle Average * (Watt) | 7.3 | 7.8 -7% | 17.7 -142% | 7.54 -3% | 12.2 -67% | 24.27 -232% | 5 32% | 8.63 ? -18% | 10.2 ? -40% |
| Idle Maximum * (Watt) | 14.24 | 9 37% | 20.6 -45% | 9.31 35% | 12.8 10% | 25.12 -76% | 11 23% | 11.7 ? 18% | 12.4 ? 13% |
| Load Average * (Watt) | 91.7 | 78.6 14% | 87.4 5% | 83.4 9% | 76.5 17% | 52.4 43% | 72 21% | 86.6 ? 6% | 65.5 ? 29% |
| Witcher 3 ultra * (Watt) | 96.2 | 86.8 10% | 121.7 -27% | 73.3 24% | 89.5 7% | 110.2 -15% | 69.7 28% | ||
| Load Maximum * (Watt) | 115.8 | 121.2 -5% | 138 -19% | 91.74 21% | 135.7 -17% | 146 -26% | 108 7% | 127.6 ? -10% | 114 ? 2% |
* ... kleiner is beter
Power Consumption: The Witcher 3 / Stress test
Power Consumption: External monitor
Levensduur batterij
De krachtige maar energiezuinige internals helpen bij een goede batterijlevensduur. Bij een helderheid van 150 nits kon de batterij van 68 WHr van de Pavilion Plus 16 bijna 10,5 uur surfen op het web en 12 uur 1080p video's afspelen, wat indrukwekkende looptijden zijn.
| HP Pavilion Plus 16-ab0456tx i7-13700H, GeForce RTX 3050 6GB Laptop GPU, 68 Wh | Schenker Vision 14 M23 RTX 3050 i7-13700H, GeForce RTX 3050 6GB Laptop GPU, 99 Wh | Dell Inspiron 16 Plus 7630 i7-13700H, GeForce RTX 4060 Laptop GPU, 86 Wh | Asus VivoBook 14X K3405 i5-13500H, GeForce RTX 3050 4GB Laptop GPU, 63 Wh | Lenovo Slim Pro 7 14ARP8 R7 7735HS, GeForce RTX 3050 6GB Laptop GPU, 73 Wh | Asus VivoBook Pro 16 K6602VU i9-13900H, GeForce RTX 4050 Laptop GPU, 96 Wh | Samsung Galaxy Book3 Ultra 16 i7-13700H, GeForce RTX 4050 Laptop GPU, 76 Wh | Gemiddelde van klas Multimedia | |
|---|---|---|---|---|---|---|---|---|
| Batterijduur | 16% | -10% | -18% | 1% | -11% | 2% | 27% | |
| H.264 (h) | 12 | 10.4 -13% | 9.8 -18% | 13.4 12% | 16.4 ? 37% | |||
| WiFi v1.3 (h) | 10.4 | 12.1 16% | 9.4 -10% | 8.1 -22% | 10.5 1% | 10.1 -3% | 9.6 -8% | 12.2 ? 17% |
| Reader / Idle (h) | 17.6 | 18.2 | 24.9 ? | |||||
| Load (h) | 1.4 | 1.1 | 1.8 | 1.668 ? | ||||
| Witcher 3 ultra (h) | 1.3 |
Pro
Contra
Verdict: Groot potentieel afgeremd door compromissen
De HP Pavilion Plus 16 voldoet aan de meeste verwachtingen van een moderne multimedia-laptop voor werk en entertainment. De Pavilion Plus 16 heeft een volledig metalen constructie die premium aanvoelt zonder onnodige buigingen, en een poortenselectie die het essentiële omvat.
Het 2560 x 1600 120 Hz paneel biedt geen HDR of uitgebreide Adobe RGB en Display P3 dekking zoals de Pavilion Plus 142.8K OLED paneel. De basis is echter in orde met fatsoenlijke responstijden en geen PWM-flikkering.
De HP Pavilion Plus 16 is een capabele all-round multimedia- en productiviteitslaptop, maar de vraagprijs had op zijn minst een RTX 4050 kunnen zijn
De prestatiebeperkingen worden duidelijk zodra u hem met de concurrentie gaat vergelijken. De 60 W PL2 blijkt vooral nadelig te zijn voor de Pavilion Plus 16 in multi-core in vergelijking met de Dell Inspiron 16 Plus 7630 en zelfs de Samsung Galaxy Book3 Ultra 16met een Core i7-13700H met een hoger wattage.
HP had gemakkelijk 80 W PL2 of meer kunnen gebruiken in een extra energieprofiel om het potentieel van de chip te maximaliseren. Het koelsubsysteem lijkt echter al overbelast met de huidige configuratie onder belasting.
De Nvidia GeForce RTX 3050 6 GB doet qua prestaties en energie-efficiëntie onder voor de Ada-generatie. Hoewel 1080p gaming een merkbare verbetering laat zien ten opzichte van de RTX 3050 4 GB, laten synthetische tests niet veel verbetering zien.
Voor een vraagprijs van US$1,350 op de site van HP is de Pavilion Plus 16 US$100 duurder dan de Inspiron 16 Plus 7630 die een 60 W RTX 4060 en een beter presterende Core i7-13700H biedt. Dat gezegd hebbende, is de Pavilion Plus 16 op de Indiase markt goedkoper geprijsd dan de Inspiron 16 Plus 7630.
De Asus VivoBook Pro 16 met een 3.2K OLED-scherm, Core i9-13900H en tot een RTX 4060 is een uitstekend alternatief voor beginnende ontwerpers, zolang het plastic en de extra toeslag van US$300 u niet tegenhouden.
Prijs en beschikbaarheid
De geteste HP Pavilion Plus 16-ab0456tx is verkrijgbaar via de officiële website HP India voor ₹1,24,999 website voor ₹1,24,999. De laptop kan ook geconfigureerd worden op de HP US site voor US$1,350.
Amazon India biedt de Pavilion Plus 16 zonder de RTX 3050 dGPU aan voor ₹1,25,900.
HP Pavilion Plus 16-ab0456tx
- 07-02-2024 v7 (old)
Vaidyanathan Subramaniam
Transparantie
De selectie van te beoordelen apparaten wordt gemaakt door onze redactie. Het testexemplaar werd ten behoeve van deze beoordeling door de fabrikant of detailhandelaar in bruikleen aan de auteur verstrekt. De kredietverstrekker had geen invloed op deze recensie, noch ontving de fabrikant vóór publicatie een exemplaar van deze recensie. Er bestond geen verplichting om deze recensie te publiceren. Als onafhankelijk mediabedrijf is Notebookcheck niet onderworpen aan het gezag van fabrikanten, detailhandelaren of uitgevers.
[transparency_disclaimer]Dit is hoe Notebookcheck test
Elk jaar beoordeelt Notebookcheck onafhankelijk honderden laptops en smartphones met behulp van gestandaardiseerde procedures om ervoor te zorgen dat alle resultaten vergelijkbaar zijn. We hebben onze testmethoden al zo'n 20 jaar voortdurend ontwikkeld en daarbij de industriestandaard bepaald. In onze testlaboratoria wordt gebruik gemaakt van hoogwaardige meetapparatuur door ervaren technici en redacteuren. Deze tests omvatten een validatieproces in meerdere fasen. Ons complexe beoordelingssysteem is gebaseerd op honderden goed onderbouwde metingen en benchmarks, waardoor de objectiviteit behouden blijft. Meer informatie over onze testmethoden kunt u hier vinden.
Price comparison

