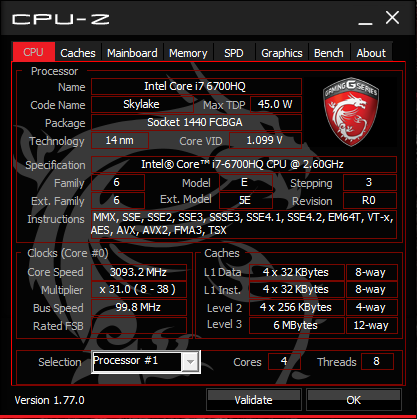
Kort testrapport MSI GS43VR 6RE Phantom Pro Notebook
| SD Card Reader | |
| average JPG Copy Test (av. of 3 runs) | |
| Alienware 17 R3 (A17-9935) | |
| MSI GS73VR 6RF | |
| MSI GS43VR 6RE-006US | |
| maximum AS SSD Seq Read Test (1GB) | |
| Alienware 17 R3 (A17-9935) | |
| MSI GS73VR 6RF | |
| MSI GS43VR 6RE-006US | |
| Networking | |
| iperf Server (receive) TCP 1 m 512KB | |
| MSI GS43VR 6RE-006US | |
| iperf Client (transmit) TCP 1 m 512KB | |
| MSI GS43VR 6RE-006US | |
| |||||||||||||||||||||||||
Helderheidsverdeling: 83 %
Helderheid in Batterij-modus: 288.4 cd/m²
Contrast: 824:1 (Zwart: 0.35 cd/m²)
ΔE ColorChecker Calman: 2.61 | ∀{0.5-29.43 Ø4.71}
ΔE Greyscale Calman: 1.18 | ∀{0.09-98 Ø4.96}
86.4% sRGB (Argyll 1.6.3 3D)
56.4% AdobeRGB 1998 (Argyll 1.6.3 3D)
63.1% AdobeRGB 1998 (Argyll 3D)
86.4% sRGB (Argyll 3D)
65.5% Display P3 (Argyll 3D)
Gamma: 2.24
CCT: 6506 K
| MSI GS43VR 6RE-006US Name: LG Philips LP140WF3-SPD1, ID: LGD046D, IPS, 14", 1920x1080 | Gigabyte P34W v5 IPS, 14", 2560x1440 | MSI GS40-6QE16H11 LG Philips LP140WF3-SPD1 (LGD046D), IPS, 14", 1920x1080 | Aorus X3 Plus v5 IPS, 13.9", 3200x1800 | Razer Blade 14 2015 IPS, 14", 3200x1800 | |
|---|---|---|---|---|---|
| Display | -16% | -0% | 9% | 11% | |
| Display P3 Coverage (%) | 65.5 | 51.4 -22% | 66.2 1% | 67.9 4% | 70.3 7% |
| sRGB Coverage (%) | 86.4 | 76.6 -11% | 85.7 -1% | 98.2 14% | 97.1 12% |
| AdobeRGB 1998 Coverage (%) | 63.1 | 52.8 -16% | 62.6 -1% | 69.2 10% | 71.1 13% |
| Response Times | -17% | 4% | -80% | ||
| Response Time Grey 50% / Grey 80% * (ms) | 31.6 ? | 41.2 ? -30% | 31 ? 2% | 52.4 ? -66% | |
| Response Time Black / White * (ms) | 24.4 ? | 25.4 ? -4% | 23 ? 6% | 47.2 ? -93% | |
| PWM Frequency (Hz) | 198 ? | ||||
| Screen | -11% | -70% | -27% | -50% | |
| Brightness middle (cd/m²) | 288.4 | 277.8 -4% | 304 5% | 394.8 37% | 318.4 10% |
| Brightness (cd/m²) | 282 | 270 -4% | 282 0% | 370 31% | 311 10% |
| Brightness Distribution (%) | 83 | 83 0% | 88 6% | 79 -5% | 78 -6% |
| Black Level * (cd/m²) | 0.35 | 0.38 -9% | 0.37 -6% | 0.293 16% | 0.416 -19% |
| Contrast (:1) | 824 | 731 -11% | 822 0% | 1347 63% | 765 -7% |
| Colorchecker dE 2000 * | 2.61 | 2.71 -4% | 7.47 -186% | 4.8 -84% | 3.67 -41% |
| Colorchecker dE 2000 max. * | 7.34 | 5.47 25% | |||
| Greyscale dE 2000 * | 1.18 | 2.11 -79% | 6.51 -452% | 5.04 -327% | 5.41 -358% |
| Gamma | 2.24 98% | 2.19 100% | 3.71 59% | 2.26 97% | 2.26 97% |
| CCT | 6506 100% | 6314 103% | 7840 83% | 7343 89% | 7118 91% |
| Color Space (Percent of AdobeRGB 1998) (%) | 56.4 | 48.5 -14% | 56 -1% | 63.4 12% | 64.64 15% |
| Color Space (Percent of sRGB) (%) | 86.4 | 76.9 -11% | 86 0% | 98.1 14% | |
| Totaal Gemiddelde (Programma / Instellingen) | -15% /
-13% | -22% /
-45% | -33% /
-27% | -20% /
-33% |
* ... kleiner is beter
Responstijd Scherm
| ↔ Responstijd Zwart naar Wit | ||
|---|---|---|
| 24.4 ms ... stijging ↗ en daling ↘ gecombineerd | ↗ 5.2 ms stijging | 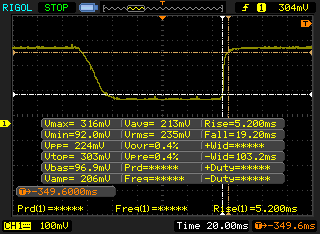 |
| ↘ 19.2 ms daling | ||
| Het scherm vertoonde prima responstijden in onze tests maar is misschien wat te traag voor competitieve games. Ter vergelijking: alle testtoestellen variëren van 0.1 (minimum) tot 240 (maximum) ms. » 58 % van alle toestellen zijn beter. Dit betekent dat de gemeten responstijd slechter is dan het gemiddelde (19.8 ms) van alle geteste toestellen. | ||
| ↔ Responstijd 50% Grijs naar 80% Grijs | ||
| 31.6 ms ... stijging ↗ en daling ↘ gecombineerd | ↗ 10.4 ms stijging | 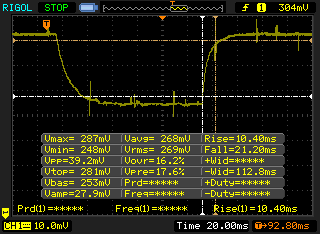 |
| ↘ 21.2 ms daling | ||
| Het scherm vertoonde trage responstijden in onze tests en is misschien te traag voor games. Ter vergelijking: alle testtoestellen variëren van 0.165 (minimum) tot 636 (maximum) ms. » 43 % van alle toestellen zijn beter. Dit betekent dat de gemeten responstijd vergelijkbaar is met het gemiddelde (31 ms) van alle geteste toestellen. | ||
Screen Flickering / PWM (Pulse-Width Modulation)
| Screen flickering / PWM niet waargenomen | 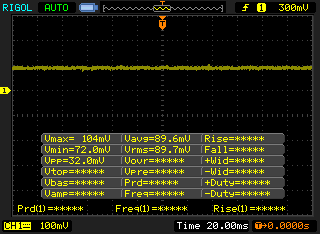 | ||
Ter vergelijking: 52 % van alle geteste toestellen maakten geen gebruik van PWM om de schermhelderheid te verlagen. Als het wel werd gebruikt, werd een gemiddelde van 7754 (minimum: 5 - maximum: 343500) Hz waargenomen. | |||
| Cinebench R10 | |
| Rendering Multiple CPUs 32Bit | |
| DogHouse Systems Mobius SS | |
| Gigabyte P55 V4 | |
| MSI GS43VR 6RE-006US | |
| Lenovo IdeaPad Y50 | |
| Rendering Single 32Bit | |
| DogHouse Systems Mobius SS | |
| Gigabyte P55 V4 | |
| Lenovo IdeaPad Y50 | |
| MSI GS43VR 6RE-006US | |
| wPrime 2.10 - 1024m | |
| Lenovo IdeaPad Y50 | |
| MSI GS43VR 6RE-006US | |
| Gigabyte P55 V4 | |
| DogHouse Systems Mobius SS | |
| Super Pi Mod 1.5 XS 32M - 32M | |
| MSI GS43VR 6RE-006US | |
| Gigabyte P55 V4 | |
| Lenovo IdeaPad Y50 | |
| DogHouse Systems Mobius SS | |
* ... kleiner is beter
| PCMark 8 | |
| Home Score Accelerated v2 | |
| Eurocom Sky DLX7 | |
| MSI GS43VR 6RE-006US | |
| Gigabyte P34W v5 | |
| Razer Blade 14 2015 | |
| Work Score Accelerated v2 | |
| MSI GS43VR 6RE-006US | |
| Gigabyte P34W v5 | |
| Eurocom Sky DLX7 | |
| Razer Blade 14 2015 | |
| Creative Score Accelerated v2 | |
| Eurocom Sky DLX7 | |
| MSI GS43VR 6RE-006US | |
| Gigabyte P34W v5 | |
| Razer Blade 14 2015 | |
| PCMark 8 Home Score Accelerated v2 | 4016 punten | |
| PCMark 8 Creative Score Accelerated v2 | 4954 punten | |
| PCMark 8 Work Score Accelerated v2 | 4796 punten | |
Help | ||
| MSI GS43VR 6RE-006US SanDisk SD8SN8U1T001122 | Gigabyte P34W v5 Samsung SSD 950 Pro 512GB m.2 NVMe | MSI GS40-6QE16H11 Samsung MZFLV128 NVMe | Aorus X3 Plus v5 Samsung SM951 MZVPV512HDGL m.2 PCI-e | Razer Blade 14 2015 Lite-On IT L8T-256L9G | |
|---|---|---|---|---|---|
| CrystalDiskMark 3.0 | 338% | 196% | 307% | 66% | |
| Read Seq (MB/s) | 335.3 | 2269 577% | 1332 297% | 1529 356% | 496.6 48% |
| Write Seq (MB/s) | 299 | 1524 410% | 687 130% | 1565 423% | 418.6 40% |
| Read 512 (MB/s) | 223 | 937 320% | 936 320% | 929 317% | 371 66% |
| Write 512 (MB/s) | 246.7 | 1483 501% | 650 163% | 1536 523% | 392.6 59% |
| Read 4k (MB/s) | 17.68 | 53.8 204% | 49.57 180% | 51.7 192% | 31.25 77% |
| Write 4k (MB/s) | 35.31 | 167.3 374% | 138.8 293% | 147.2 317% | 64.4 82% |
| Read 4k QD32 (MB/s) | 247.4 | 622 151% | 559 126% | 636 157% | 357.6 45% |
| Write 4k QD32 (MB/s) | 156.3 | 418.9 168% | 247.3 58% | 421.4 170% | 323.2 107% |

| 3DMark | |
| 1920x1080 Fire Strike Graphics | |
| MSI GT73VR-6RE16SR451 | |
| Asus G701VO-CS74K | |
| MSI GS43VR 6RE-006US | |
| Aorus X5S v5 | |
| Asus Strix GL502VT-DS74 | |
| HP Pavilion 15 UHD T9Y85AV | |
| Fire Strike Extreme Graphics | |
| Asus G701VO-CS74K | |
| MSI GS43VR 6RE-006US | |
| Aorus X5S v5 | |
| Asus Strix GL502VT-DS74 | |
| HP Pavilion 15 UHD T9Y85AV | |
| 3840x2160 Fire Strike Ultra Graphics | |
| MSI GT73VR-6RE16SR451 | |
| Asus G701VO-CS74K | |
| MSI GS43VR 6RE-006US | |
| Aorus X5S v5 | |
| HP Pavilion 15 UHD T9Y85AV | |
| 3DMark 11 | |
| 1280x720 Performance GPU | |
| MSI GT73VR-6RE16SR451 | |
| Asus G701VO-CS74K | |
| MSI GS43VR 6RE-006US | |
| Aorus X5S v5 | |
| Asus Strix GL502VT-DS74 | |
| HP Pavilion 15 UHD T9Y85AV | |
| 1280x720 Performance Combined | |
| MSI GT73VR-6RE16SR451 | |
| Asus G701VO-CS74K | |
| MSI GS43VR 6RE-006US | |
| Asus Strix GL502VT-DS74 | |
| Aorus X5S v5 | |
| HP Pavilion 15 UHD T9Y85AV | |
| 3DMark 11 Performance | 12462 punten | |
| 3DMark Ice Storm Standard Score | 83301 punten | |
| 3DMark Cloud Gate Standard Score | 23391 punten | |
| 3DMark Fire Strike Score | 9814 punten | |
| 3DMark Fire Strike Extreme Score | 5170 punten | |
Help | ||
| BioShock Infinite - 1920x1080 Ultra Preset, DX11 (DDOF) | |
| Asus G752VS-XB78K | |
| Asus G701VO-CS74K | |
| MSI GS43VR 6RE-006US | |
| Asus Strix GL502VY-DS71 | |
| Asus Strix GL502VT-DS74 | |
| HP Pavilion 15 UHD T9Y85AV | |
| Metro: Last Light - 1920x1080 Very High (DX11) AF:16x | |
| Asus G701VO-CS74K | |
| MSI GS43VR 6RE-006US | |
| Asus Strix GL502VT-DS74 | |
| HP Pavilion 15 UHD T9Y85AV | |
| Thief - 1920x1080 Very High Preset AA:FXAA & High SS AF:8x | |
| Asus G752VS-XB78K | |
| Asus G701VO-CS74K | |
| MSI GS43VR 6RE-006US | |
| Asus Strix GL502VY-DS71 | |
| Asus Strix GL502VT-DS74 | |
| HP Pavilion 15 UHD T9Y85AV | |
| Batman: Arkham Knight - 1920x1080 High / On AA:SM AF:16x | |
| Asus G752VS-XB78K | |
| Asus G701VO-CS74K | |
| MSI GS43VR 6RE-006US | |
| Asus Strix GL502VT-DS74 | |
| HP Pavilion 15 UHD T9Y85AV | |
| Fallout 4 - 1920x1080 Ultra Preset AA:T AF:16x | |
| Asus G701VO-CS74K | |
| MSI GS43VR 6RE-006US | |
| Asus Strix GL502VY-DS71 | |
| Asus Strix GL502VT-DS74 | |
| HP Pavilion 15 UHD T9Y85AV | |
| Rise of the Tomb Raider - 1920x1080 Very High Preset AA:FX AF:16x | |
| Asus G752VS-XB78K | |
| MSI GS43VR 6RE-006US | |
| Asus G701VO-CS74K | |
| Asus Strix GL502VY-DS71 | |
| Asus Strix GL502VT-DS74 | |
| HP Pavilion 15 UHD T9Y85AV | |
| Doom - 1920x1080 Ultra Preset AA:SM | |
| Asus G701VO-CS74K | |
| MSI GS43VR 6RE-006US | |
| Asus Strix GL502VY-DS71 | |
| Overwatch - 1920x1080 Epic (Render Scale 100 %) AA:SM AF:16x | |
| Asus G701VO-CS74K | |
| MSI GS43VR 6RE-006US | |
| Asus Strix GL502VY-DS71 | |
| HP Pavilion 15 UHD T9Y85AV | |
| lage | gem. | hoge | ultra | |
|---|---|---|---|---|
| Guild Wars 2 (2012) | 50.1 | |||
| BioShock Infinite (2013) | 102.1 | |||
| Metro: Last Light (2013) | 78.6 | |||
| Thief (2014) | 65.6 | |||
| Batman: Arkham Knight (2015) | 80 | 58 | ||
| Metal Gear Solid V (2015) | 60 | |||
| Fallout 4 (2015) | 68.5 | |||
| Rise of the Tomb Raider (2016) | 66.8 | |||
| Doom (2016) | 77.8 | |||
| Overwatch (2016) | 106.7 |
Geluidsniveau
| Onbelast |
| 32 / 32 / 33.5 dB (A) |
| Belasting |
| 50 / 51.5 dB (A) |
 | ||
30 dB stil 40 dB(A) hoorbaar 50 dB(A) luid |
||
min: | ||
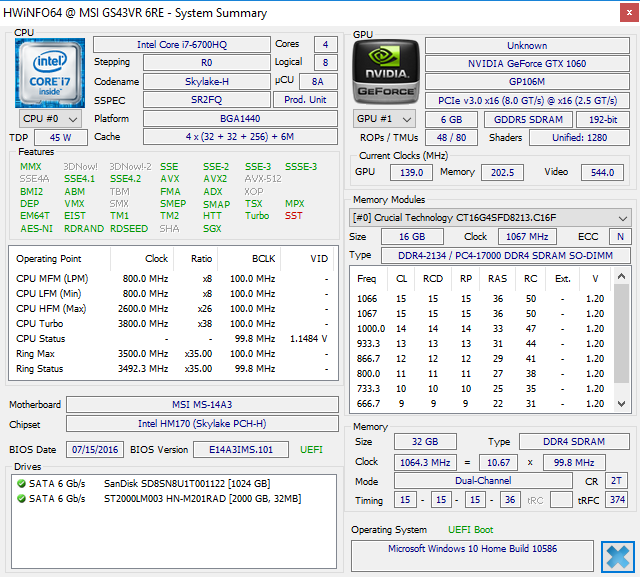
| MSI GS43VR 6RE-006US GeForce GTX 1060 Mobile, 6700HQ, SanDisk SD8SN8U1T001122 | Gigabyte P34W v5 GeForce GTX 970M, 6700HQ, Samsung SSD 950 Pro 512GB m.2 NVMe | MSI GS40-6QE16H11 GeForce GTX 970M, 6700HQ, Samsung MZFLV128 NVMe | Aorus X3 Plus v5 GeForce GTX 970M, 6700HQ, Samsung SM951 MZVPV512HDGL m.2 PCI-e | Razer Blade 14 2015 GeForce GTX 970M, 4720HQ, Lite-On IT L8T-256L9G | |
|---|---|---|---|---|---|
| Noise | 2% | -2% | 3% | 5% | |
| uit / omgeving * (dB) | 29.1 | ||||
| Idle Minimum * (dB) | 32 | 31.6 1% | 33 -3% | 32.1 -0% | 29.7 7% |
| Idle Average * (dB) | 32 | 31.6 1% | 34 -6% | 32.4 -1% | 29.9 7% |
| Idle Maximum * (dB) | 33.5 | 32.5 3% | 38 -13% | 32.5 3% | 30 10% |
| Load Average * (dB) | 50 | 46.5 7% | 44 12% | 40.1 20% | 42.1 16% |
| Load Maximum * (dB) | 51.5 | 52.5 -2% | 52 -1% | 54.6 -6% | 59 -15% |
* ... kleiner is beter
(-) De maximumtemperatuur aan de bovenzijde bedraagt 55.6 °C / 132 F, vergeleken met het gemiddelde van 40.4 °C / 105 F, variërend van 21.2 tot 68.8 °C voor de klasse Gaming.
(-) De bodem warmt op tot een maximum van 62.4 °C / 144 F, vergeleken met een gemiddelde van 43.2 °C / 110 F
(+) Bij onbelast gebruik bedraagt de gemiddelde temperatuur voor de bovenzijde 30.5 °C / 87 F, vergeleken met het apparaatgemiddelde van 33.9 °C / 93 F.
(+) De handpalmsteunen en het touchpad bereiken maximaal de huidtemperatuur (32.2 °C / 90 F) en zijn dus niet heet.
(-) De gemiddelde temperatuur van de handpalmsteun van soortgelijke toestellen bedroeg 28.8 °C / 83.8 F (-3.4 °C / -6.2 F).
MSI GS43VR 6RE-006US audioanalyse
(±) | luidspreker luidheid is gemiddeld maar goed (76.7 dB)
Bas 100 - 315 Hz
(-) | bijna geen lage tonen - gemiddeld 17.5% lager dan de mediaan
(±) | lineariteit van de lage tonen is gemiddeld (12% delta ten opzichte van de vorige frequentie)
Midden 400 - 2000 Hz
(+) | evenwichtige middens - slechts 3.9% verwijderd van de mediaan
(±) | lineariteit van de middentonen is gemiddeld (9.5% delta ten opzichte van de vorige frequentie)
Hoog 2 - 16 kHz
(±) | higher highs - on average 6.4% higher than median
(±) | lineariteit van de hoogtepunten is gemiddeld (8.5% delta ten opzichte van de vorige frequentie)
Algemeen 100 - 16.000 Hz
(±) | lineariteit van het totale geluid is gemiddeld (28.9% verschil met de mediaan)
Vergeleken met dezelfde klasse
» 95% van alle geteste apparaten in deze klasse waren beter, 2% vergelijkbaar, 4% slechter
» De beste had een delta van 6%, het gemiddelde was 18%, de slechtste was 132%
Vergeleken met alle geteste toestellen
» 87% van alle geteste apparaten waren beter, 2% gelijk, 11% slechter
» De beste had een delta van 4%, het gemiddelde was 23%, de slechtste was 134%
Apple MacBook 12 (Early 2016) 1.1 GHz audioanalyse
(+) | luidsprekers kunnen relatief luid spelen (83.6 dB)
Bas 100 - 315 Hz
(±) | verminderde zeebaars - gemiddeld 11.3% lager dan de mediaan
(±) | lineariteit van de lage tonen is gemiddeld (14.2% delta ten opzichte van de vorige frequentie)
Midden 400 - 2000 Hz
(+) | evenwichtige middens - slechts 2.4% verwijderd van de mediaan
(+) | de middentonen zijn lineair (5.5% delta ten opzichte van de vorige frequentie)
Hoog 2 - 16 kHz
(+) | evenwichtige hoogtepunten - slechts 2% verwijderd van de mediaan
(+) | de hoge tonen zijn lineair (4.5% delta naar de vorige frequentie)
Algemeen 100 - 16.000 Hz
(+) | het totale geluid is lineair (10.2% verschil met de mediaan)
Vergeleken met dezelfde klasse
» 7% van alle geteste apparaten in deze klasse waren beter, 2% vergelijkbaar, 90% slechter
» De beste had een delta van 5%, het gemiddelde was 18%, de slechtste was 53%
Vergeleken met alle geteste toestellen
» 5% van alle geteste apparaten waren beter, 1% gelijk, 94% slechter
» De beste had een delta van 4%, het gemiddelde was 23%, de slechtste was 134%
| Uit / Standby | |
| Inactief | |
| Belasting |
|
Key:
min: | |
| MSI GS43VR 6RE-006US 6700HQ, GeForce GTX 1060 Mobile, SanDisk SD8SN8U1T001122, IPS, 1920x1080, 14" | MSI GT72VR 6RE-015US 6700HQ, GeForce GTX 1070 Mobile, SanDisk SD8SNAT256G1122, IPS, 1920x1080, 17.3" | MSI GS40-6QE16H11 6700HQ, GeForce GTX 970M, Samsung MZFLV128 NVMe, IPS, 1920x1080, 14" | Acer Predator 17 G9-792-71EF 6700HQ, GeForce GTX 980M, Samsung SSD PM871 MZNLN512HCJH, IPS, 3840x2160, 17.3" | HP Pavilion 15 UHD T9Y85AV 6700HQ, GeForce GTX 960M, SanDisk Z400s SD8SNAT-128G, IPS, 3840x2160, 15.6" | |
|---|---|---|---|---|---|
| Power Consumption | -51% | 6% | -22% | 25% | |
| Idle Minimum * (Watt) | 12.1 | 22.3 -84% | 10 17% | 14 -16% | 8.3 31% |
| Idle Average * (Watt) | 19 | 27.3 -44% | 14 26% | 24 -26% | 14.8 22% |
| Idle Maximum * (Watt) | 19.5 | 30 -54% | 24 -23% | 32 -64% | 16.8 14% |
| Load Average * (Watt) | 106.7 | 152.2 -43% | 90 16% | 108 -1% | 71 33% |
| Load Maximum * (Watt) | 159 | 204.2 -28% | 172 -8% | 164 -3% | 119.2 25% |
* ... kleiner is beter
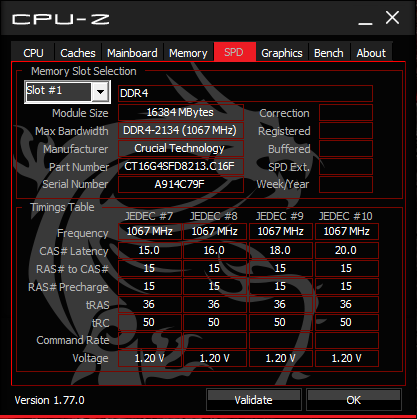
| MSI GS43VR 6RE-006US 6700HQ, GeForce GTX 1060 Mobile, 61 Wh | Gigabyte P34W v5 6700HQ, GeForce GTX 970M, 61 Wh | MSI GS40-6QE16H11 6700HQ, GeForce GTX 970M, 61 Wh | Aorus X3 Plus v5 6700HQ, GeForce GTX 970M, 73 Wh | Razer Blade 14 2015 4720HQ, GeForce GTX 970M, 71 Wh | |
|---|---|---|---|---|---|
| Batterijduur | -27% | -18% | -11% | -22% | |
| Reader / Idle (h) | 9.6 | 6.5 -32% | 5.2 -46% | 8 -17% | 6.3 -34% |
| WiFi v1.3 (h) | 4.4 | 3.9 -11% | 5 14% | 5.1 16% | 3.7 -16% |
| Load (h) | 1.3 | 0.8 -38% | 1 -23% | 0.9 -31% | 1.1 -15% |
Pro
Contra

Dit is de verkorte versie van het originele artikel. Het volledige, Engelse testrapport vind je hier.
We concludeerden dat de GS40 een "geslaagd evenwicht" was tussen performance en compacte dimensies, maar de introductie van Pascal betekent dat gebruikers lang niet zo veel performance meer moeten opofferen voor een compacter design. Het was zelfs vorig jaar nog waanzinnig om te denken dat het mogelijk zou zijn om te gamen met maximale instellingen aan 1080p60 op een 14-inch-laptop, maar hier zijn we dan met een notebook die bijna twee keer zo klein is als een gaming-notebook van de vorige Maxwell-generatie en met grafische prestaties die de GTX 980M overtreffen.
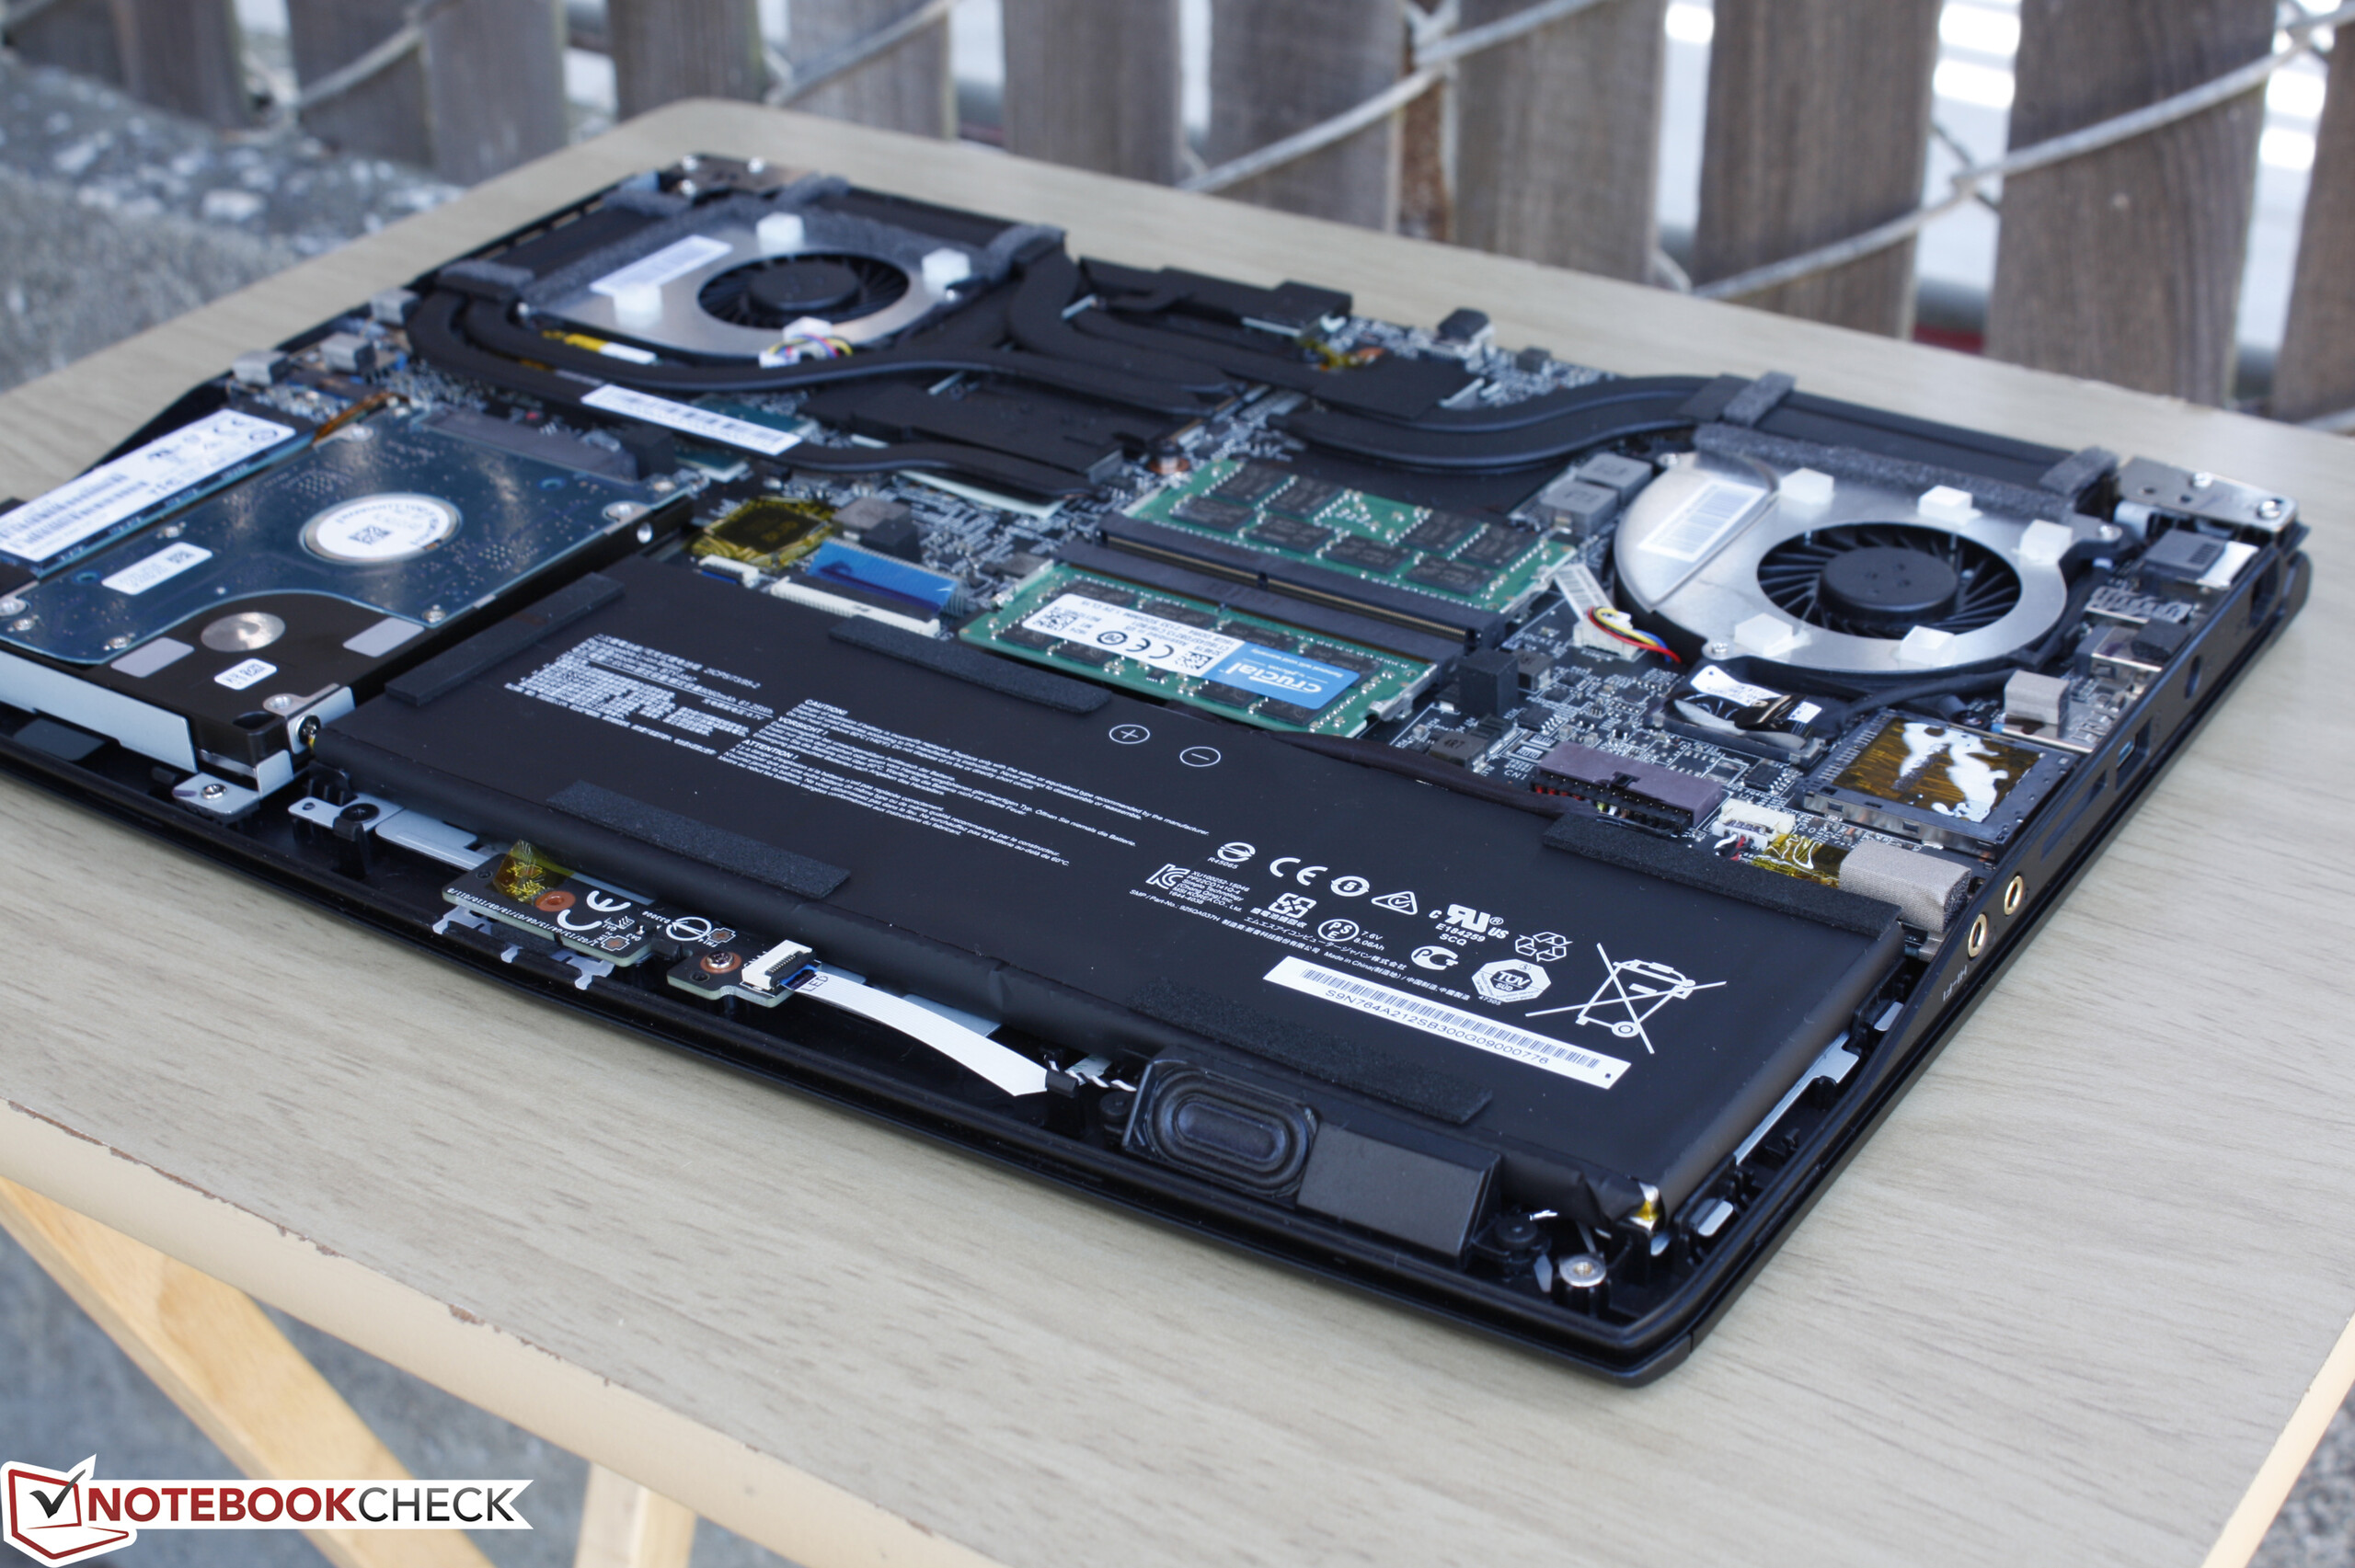
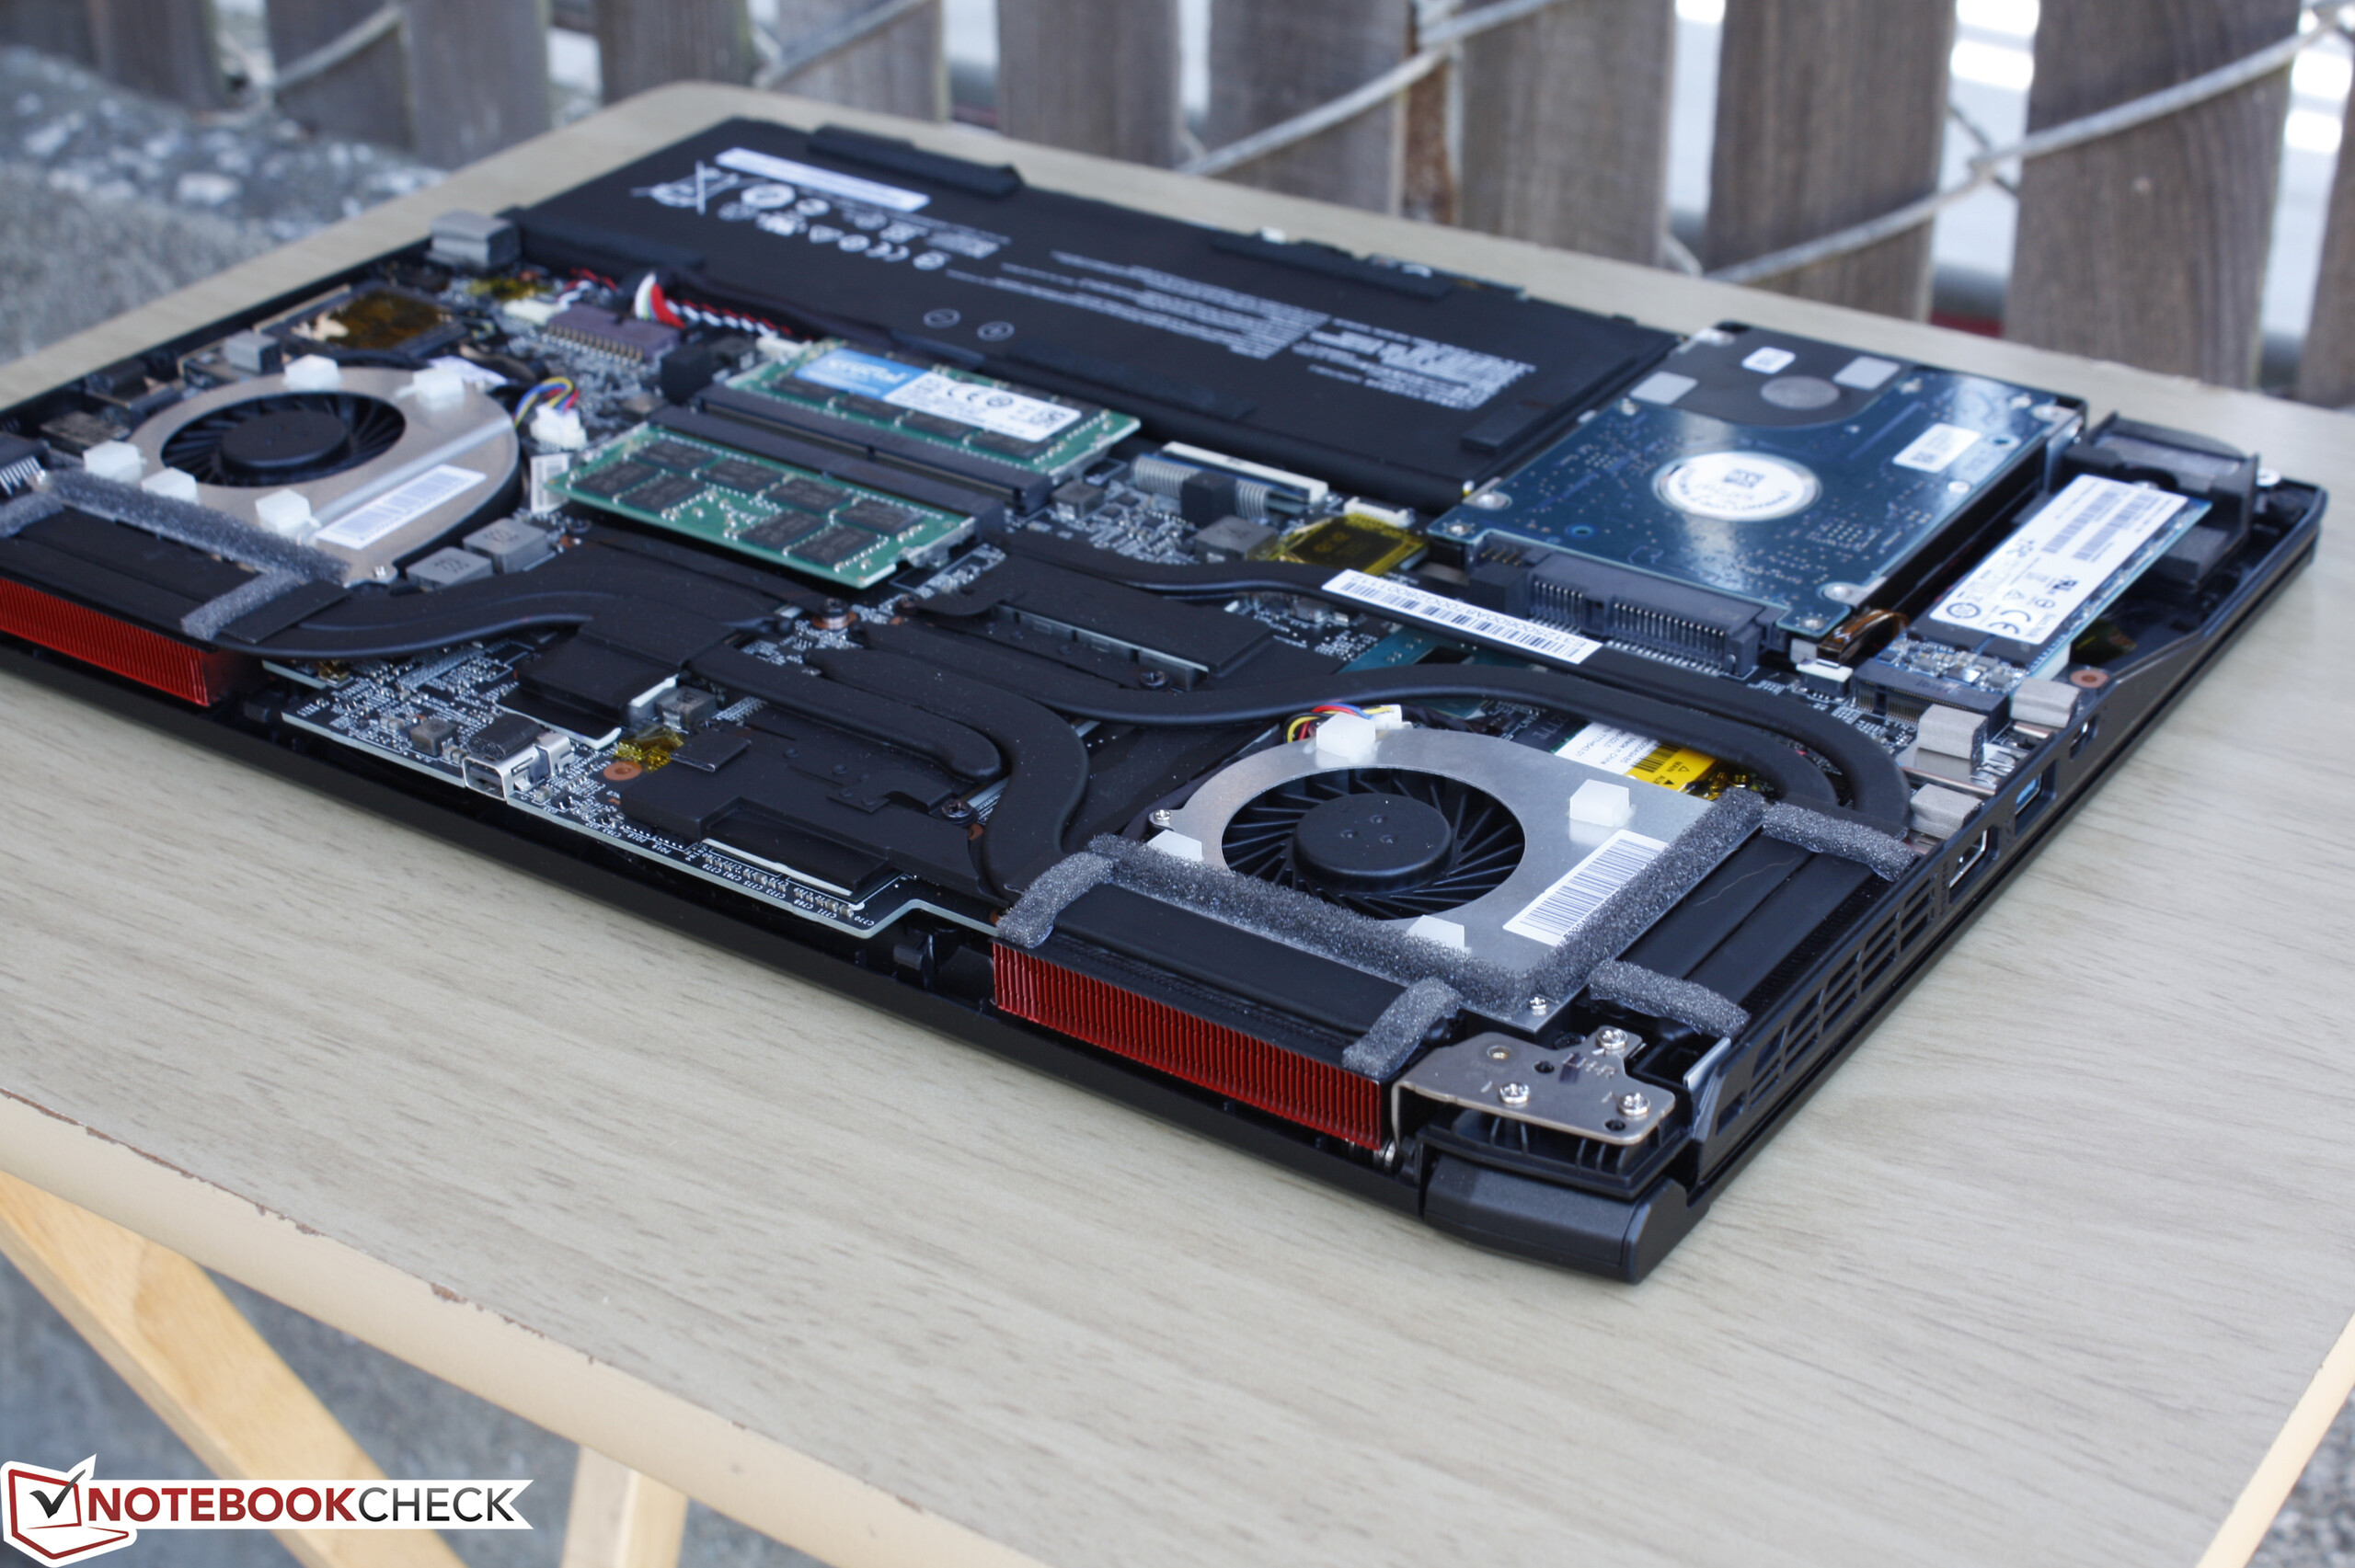
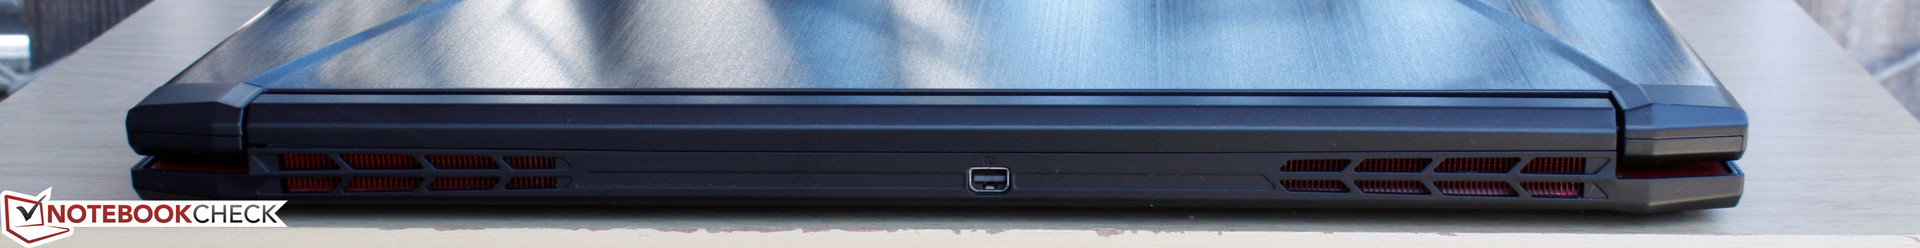
De gebruikelijke minpunten voor een kleine en dunne behuizing zijn gebleven: luide ventilator, minder features en hogere temperaturen. Op dit vlak is de GS43VR geen aanzienlijke upgrade ten opzichte van de GS40 aangezien het toestel niet koeler, stiller of zuiniger is dan zijn voorganger. Onze metingen tonen juist aan dat de GS43VR zeker zo luid, of zelfs luider is tijdens het gamen, met core GPU-temperaturen rond de 80°C.
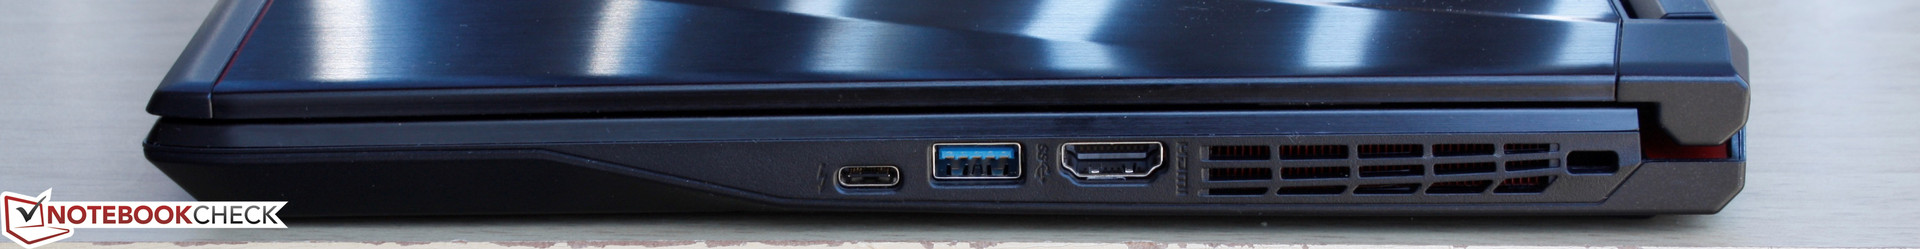
We zouden graag een herziening van het koelsysteem zien in een toekomstige revisie van de 14-inch GS-serie. Hoewel het toetsenbord prima is, zou een stevigere basis-unit bovendien welkom zijn. We realiseren ons dat G-Sync momenteel niet mogelijk is in combinatie met Optimus, maar de optie voor een scherm met hogere resolutie of ondersteuning voor externe G-Sync-schermen zou de veelzijdigheid van het systeem enorm verbeteren, zowel voor gebruik thuis als onderweg.
We kunnen de GS43VR alleen aanbevelen als draagbaarheid een topprioriteit is voor jou. Anders bestaan er in dezelfde prijsklasse grotere, stevigere systemen zoals de GT72VR of GE62VR met dezelfde GPU die koeler en stiller zijn en bovendien meer features hebben.
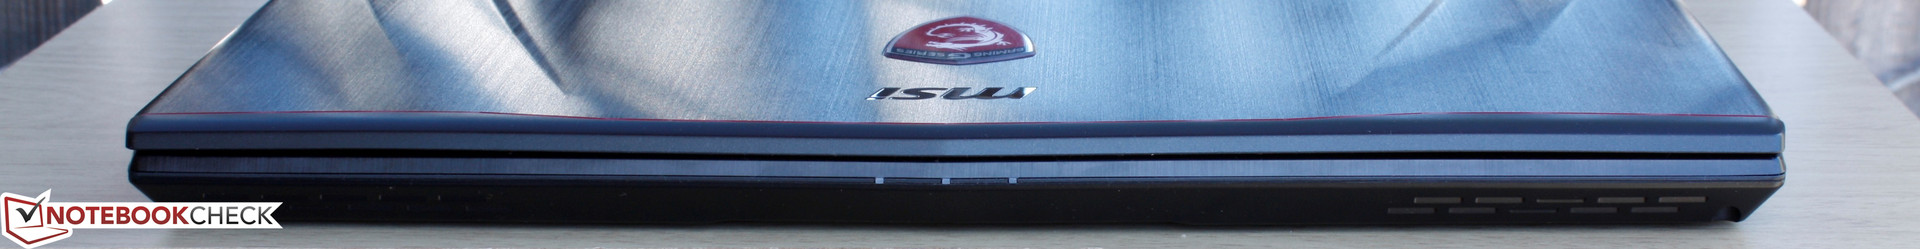
MSI GS43VR 6RE-006US
- 08-09-2016 v5.1 (old)
Allen Ngo
Price comparison
