Kort testrapport Lenovo ThinkPad T470p (Core i7, GeForce 940MX) Laptop

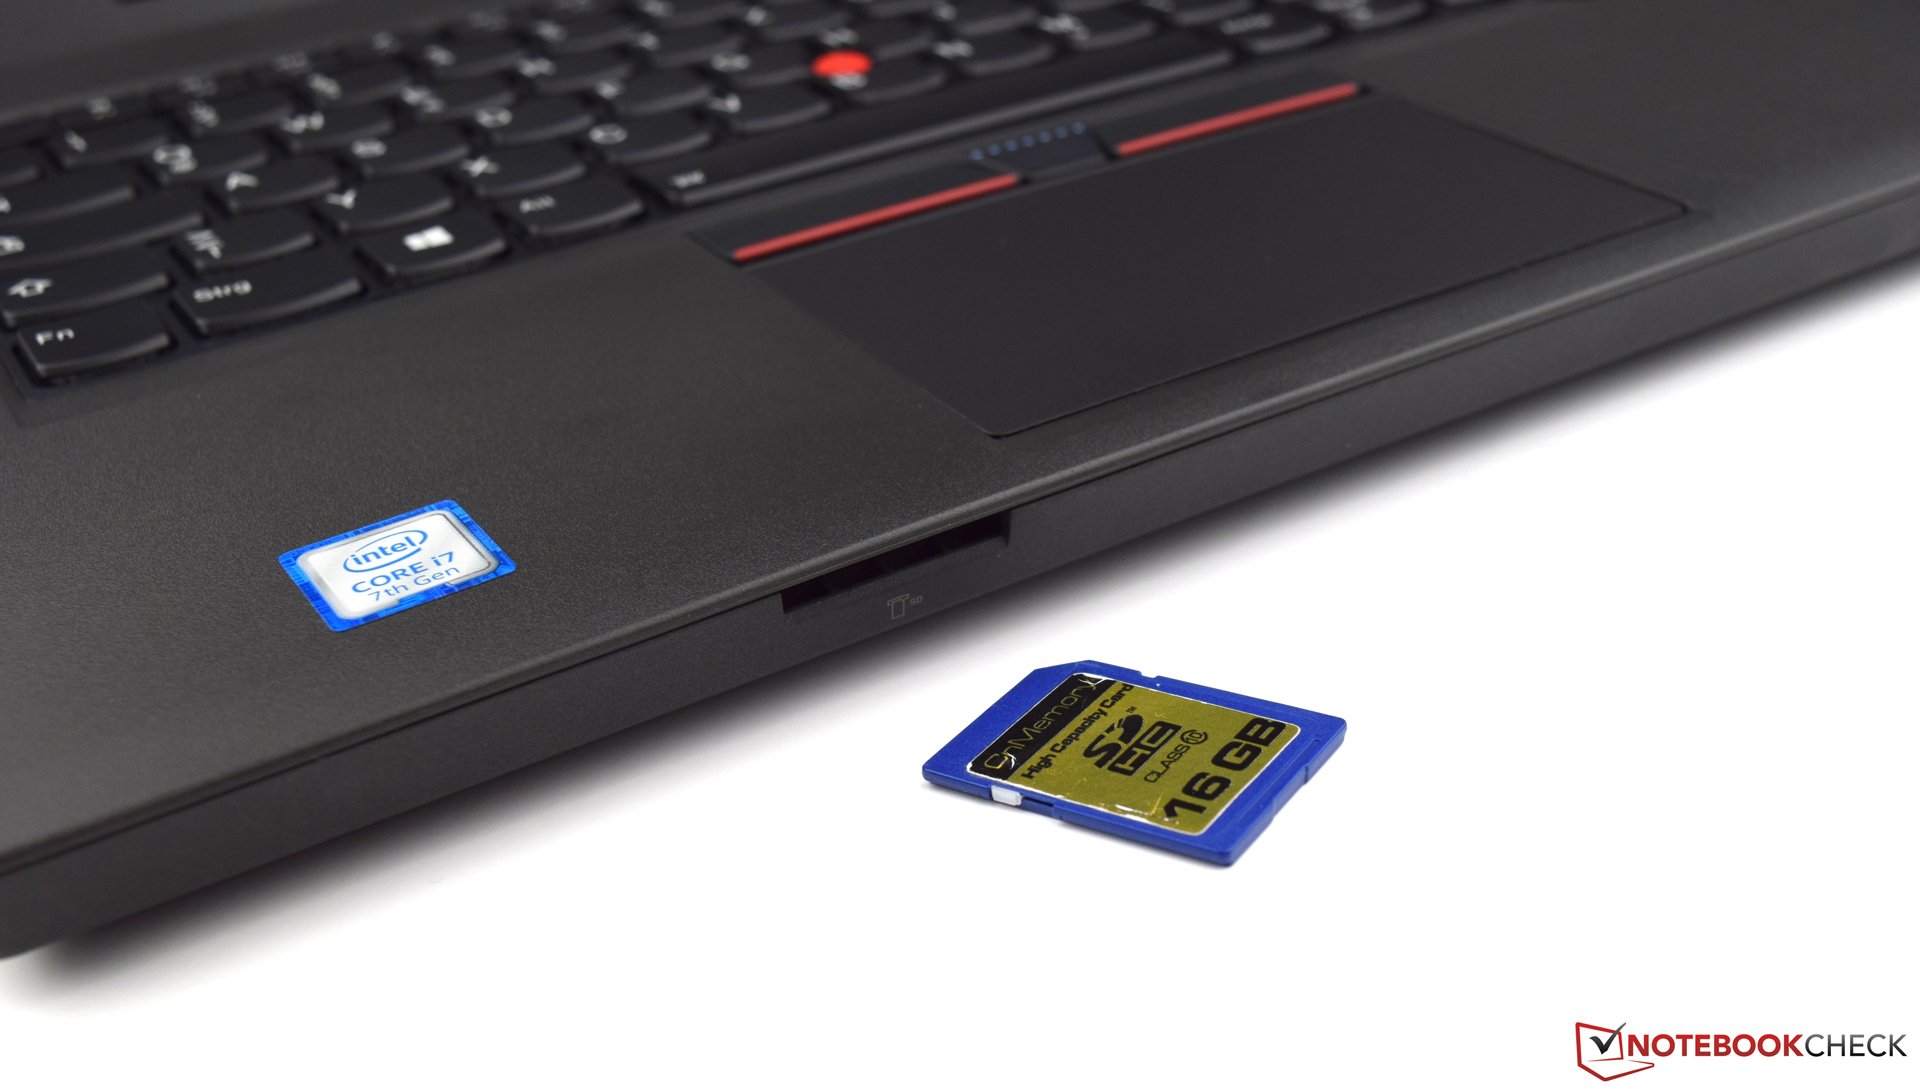
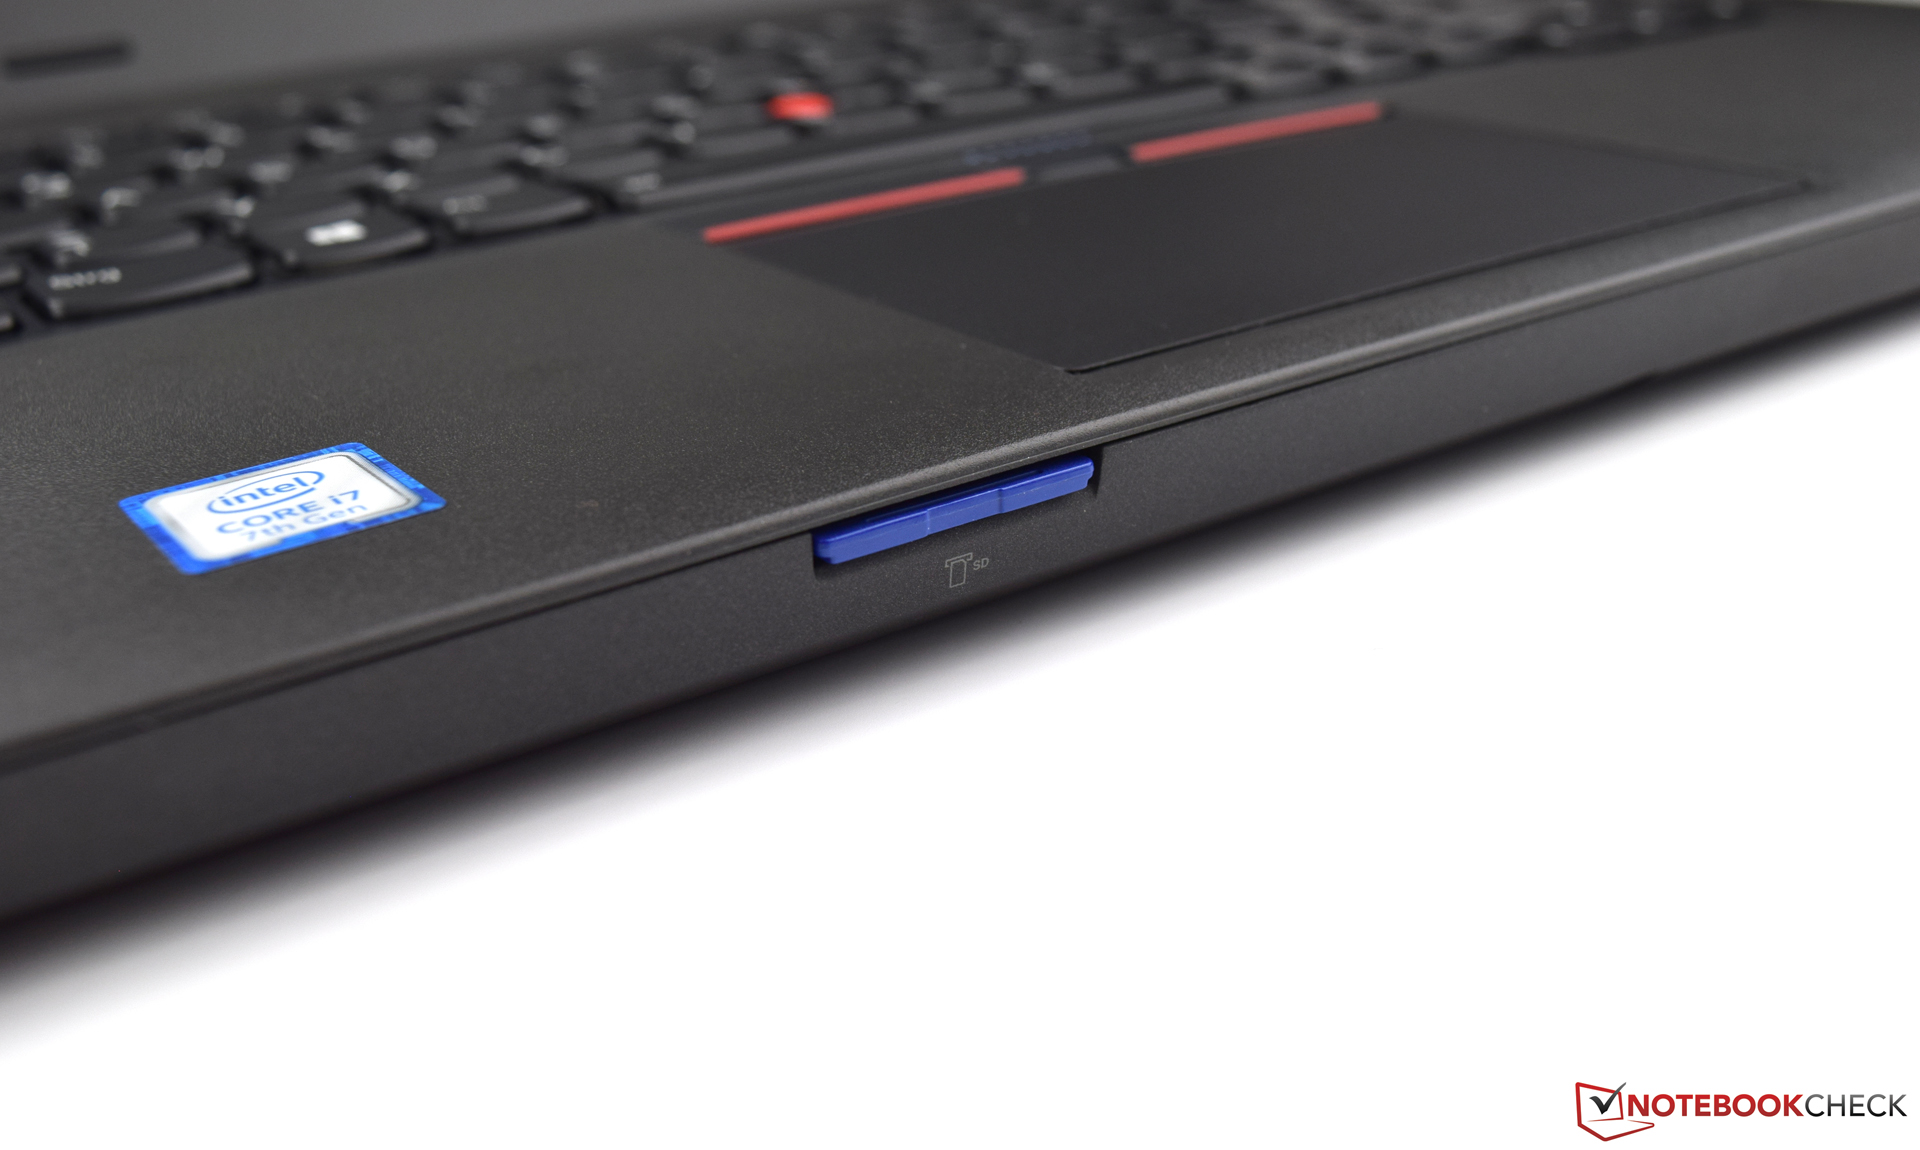
| SD Card Reader | |
| average JPG Copy Test (av. of 3 runs) | |
| Dell Latitude 14 E5470 | |
| Dell Latitude 5480 | |
| Lenovo ThinkPad T470-20HD002HGE | |
| HP EliteBook 840 G4-Z2V49ET ABD | |
| Lenovo ThinkPad T470p-20J7S00000 | |
| Lenovo ThinkPad T460p-20FXS05500 | |
| maximum AS SSD Seq Read Test (1GB) | |
| Dell Latitude 5480 | |
| Dell Latitude 14 E5470 | |
| Lenovo ThinkPad T470-20HD002HGE | |
| Lenovo ThinkPad T470p-20J7S00000 | |
| HP EliteBook 840 G4-Z2V49ET ABD | |
| Lenovo ThinkPad T460p-20FXS05500 | |
| Networking | |
| iperf3 transmit AX12 | |
| Lenovo ThinkPad T470-20HD002HGE | |
| HP EliteBook 840 G4-Z2V49ET ABD (jseb) | |
| Lenovo ThinkPad T470p-20J7S00000 | |
| Dell Latitude 5480 | |
| Dell Latitude 14 E5470 (jseb) | |
| iperf3 receive AX12 | |
| Lenovo ThinkPad T470-20HD002HGE | |
| Dell Latitude 5480 | |
| Dell Latitude 14 E5470 (jseb) | |
| HP EliteBook 840 G4-Z2V49ET ABD (jseb) | |
| Lenovo ThinkPad T470p-20J7S00000 | |
| |||||||||||||||||||||||||
Helderheidsverdeling: 87 %
Helderheid in Batterij-modus: 267 cd/m²
Contrast: 1084:1 (Zwart: 0.25 cd/m²)
ΔE ColorChecker Calman: 6.68 | ∀{0.5-29.43 Ø4.72}
ΔE Greyscale Calman: 9.21 | ∀{0.09-98 Ø4.97}
94.72% sRGB (Argyll 1.6.3 3D)
61.49% AdobeRGB 1998 (Argyll 1.6.3 3D)
69.5% AdobeRGB 1998 (Argyll 3D)
94.9% sRGB (Argyll 3D)
69.3% Display P3 (Argyll 3D)
Gamma: 2.42
CCT: 6018 K
| Lenovo ThinkPad T470p-20J7S00000 IPS, 2560x1440, 14" | Lenovo ThinkPad T460p-20FXS05500 IPS-Panel, 2560x1440, 14" | Dell Latitude 14 E5470 AH-IPS, WLED, 1920x1080, 14" | Dell Latitude 5480 IPS, 1920x1080, 14" | HP EliteBook 840 G4-Z2V49ET ABD TN, 1920x1080, 14" | Lenovo ThinkPad T470-20HD002HGE IPS, 1920x1080, 14" | |
|---|---|---|---|---|---|---|
| Display | -1% | -9% | -39% | -17% | -38% | |
| Display P3 Coverage (%) | 69.3 | 66.9 -3% | 64.8 -6% | 40.62 -41% | 55.8 -19% | 41.6 -40% |
| sRGB Coverage (%) | 94.9 | 96.5 2% | 84.8 -11% | 61.2 -36% | 80.7 -15% | 61.9 -35% |
| AdobeRGB 1998 Coverage (%) | 69.5 | 68.8 -1% | 62 -11% | 41.96 -40% | 57.7 -17% | 43.06 -38% |
| Response Times | 17% | 15% | 20% | 20% | -3% | |
| Response Time Grey 50% / Grey 80% * (ms) | 52.8 ? | 38.4 ? 27% | 39 ? 26% | 32.8 ? 38% | 39 ? 26% | 41.6 ? 21% |
| Response Time Black / White * (ms) | 26.8 ? | 24.8 ? 7% | 26 ? 3% | 26.4 ? 1% | 23 ? 14% | 34 ? -27% |
| PWM Frequency (Hz) | 220 | |||||
| Screen | 11% | -2% | -4% | -35% | -4% | |
| Brightness middle (cd/m²) | 271 | 290 7% | 323 19% | 215.9 -20% | 346 28% | 306 13% |
| Brightness (cd/m²) | 266 | 280 5% | 316 19% | 205 -23% | 317 19% | 287 8% |
| Brightness Distribution (%) | 87 | 93 7% | 79 -9% | 90 3% | 86 -1% | 88 1% |
| Black Level * (cd/m²) | 0.25 | 0.31 -24% | 0.57 -128% | 0.22 12% | 0.86 -244% | 0.3 -20% |
| Contrast (:1) | 1084 | 935 -14% | 567 -48% | 981 -10% | 402 -63% | 1020 -6% |
| Colorchecker dE 2000 * | 6.68 | 3.88 42% | 3.68 45% | 5.1 24% | 8.64 -29% | 6.2 7% |
| Colorchecker dE 2000 max. * | 12.96 | 8.19 37% | 8.33 36% | 15.6 -20% | 13.58 -5% | 13.6 -5% |
| Greyscale dE 2000 * | 9.21 | 5.47 41% | 2.99 68% | 4 57% | 11.24 -22% | 5.8 37% |
| Gamma | 2.42 91% | 2.33 94% | 2.49 88% | 2.41 91% | 2.62 84% | 2.04 108% |
| CCT | 6018 108% | 6469 100% | 6572 99% | 6856 95% | 12530 52% | 6277 104% |
| Color Space (Percent of AdobeRGB 1998) (%) | 61.49 | 63.3 3% | 55 -11% | 41.96 -32% | 52 -15% | 39.62 -36% |
| Color Space (Percent of sRGB) (%) | 94.72 | 96.64 2% | 85 -10% | 61.15 -35% | 80 -16% | 61.44 -35% |
| Totaal Gemiddelde (Programma / Instellingen) | 9% /
9% | 1% /
-1% | -8% /
-8% | -11% /
-24% | -15% /
-10% |
* ... kleiner is beter
Responstijd Scherm
| ↔ Responstijd Zwart naar Wit | ||
|---|---|---|
| 26.8 ms ... stijging ↗ en daling ↘ gecombineerd | ↗ 6.4 ms stijging | 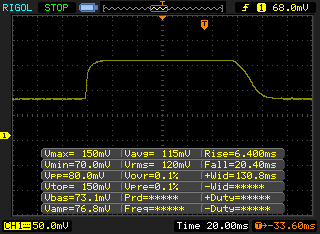 |
| ↘ 20.4 ms daling | ||
| Het scherm vertoonde relatief trage responstijden in onze tests en is misschien te traag voor games. Ter vergelijking: alle testtoestellen variëren van 0.1 (minimum) tot 240 (maximum) ms. » 67 % van alle toestellen zijn beter. Dit betekent dat de gemeten responstijd slechter is dan het gemiddelde (19.9 ms) van alle geteste toestellen. | ||
| ↔ Responstijd 50% Grijs naar 80% Grijs | ||
| 52.8 ms ... stijging ↗ en daling ↘ gecombineerd | ↗ 19.6 ms stijging | 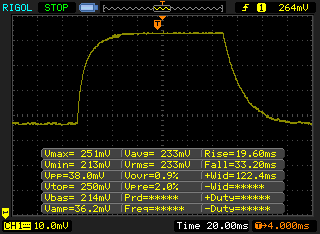 |
| ↘ 33.2 ms daling | ||
| Het scherm vertoonde trage responstijden in onze tests en is misschien te traag voor games. Ter vergelijking: alle testtoestellen variëren van 0.165 (minimum) tot 636 (maximum) ms. » 89 % van alle toestellen zijn beter. Dit betekent dat de gemeten responstijd slechter is dan het gemiddelde (31.1 ms) van alle geteste toestellen. | ||
Screen Flickering / PWM (Pulse-Width Modulation)
| Screen flickering / PWM niet waargenomen | ||
Ter vergelijking: 52 % van alle geteste toestellen maakten geen gebruik van PWM om de schermhelderheid te verlagen. Als het wel werd gebruikt, werd een gemiddelde van 7784 (minimum: 5 - maximum: 343500) Hz waargenomen. | ||
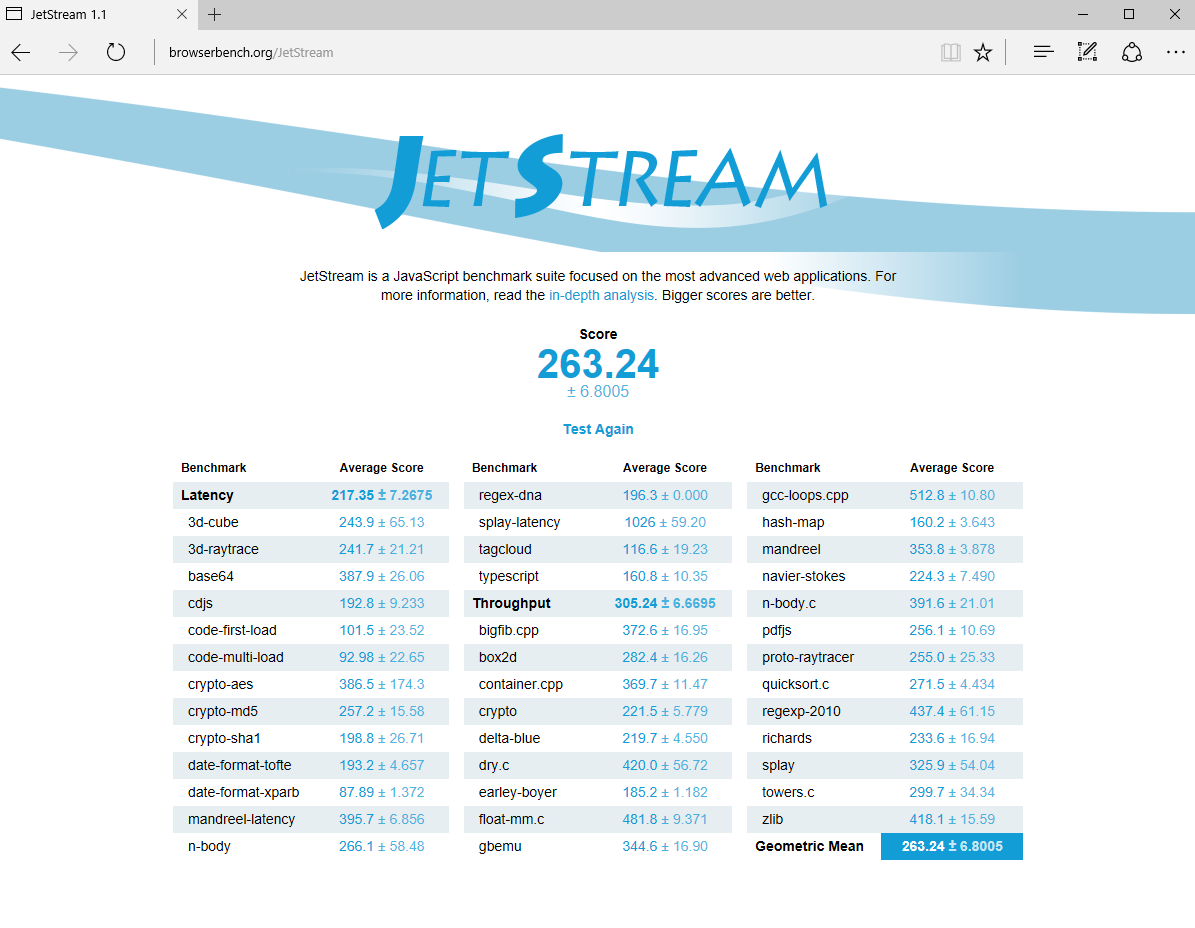
| JetStream 1.1 - 1.1 Total | |
| Lenovo ThinkPad T470p-20J7S00000 | |
| Lenovo ThinkPad T460p-20FXS05500 | |
| Dell Latitude 14 E5470 | |
| Lenovo ThinkPad T470-20HD002HGE | |
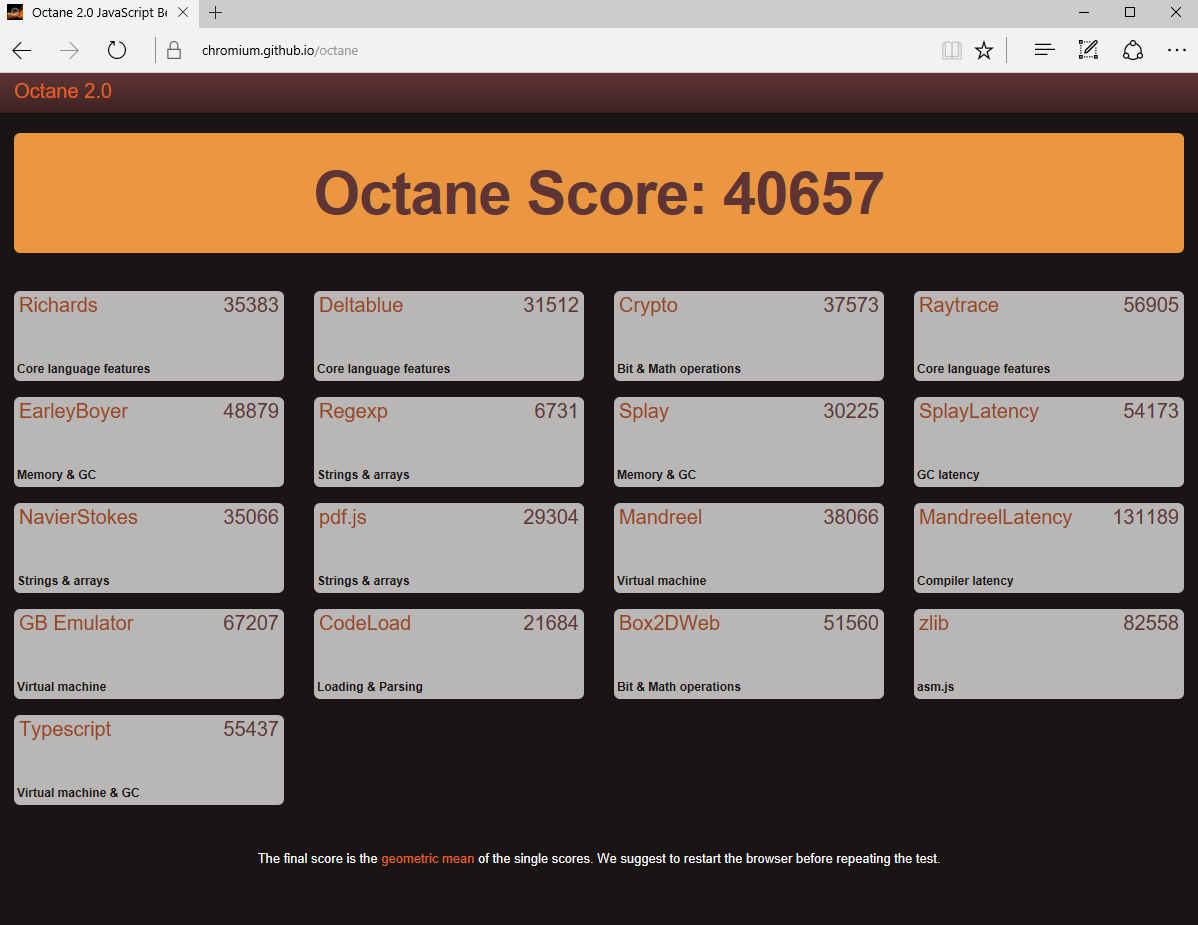
| Octane V2 - Total Score | |
| Lenovo ThinkPad T470p-20J7S00000 | |
| Lenovo ThinkPad T460p-20FXS05500 | |
| Dell Latitude 14 E5470 | |
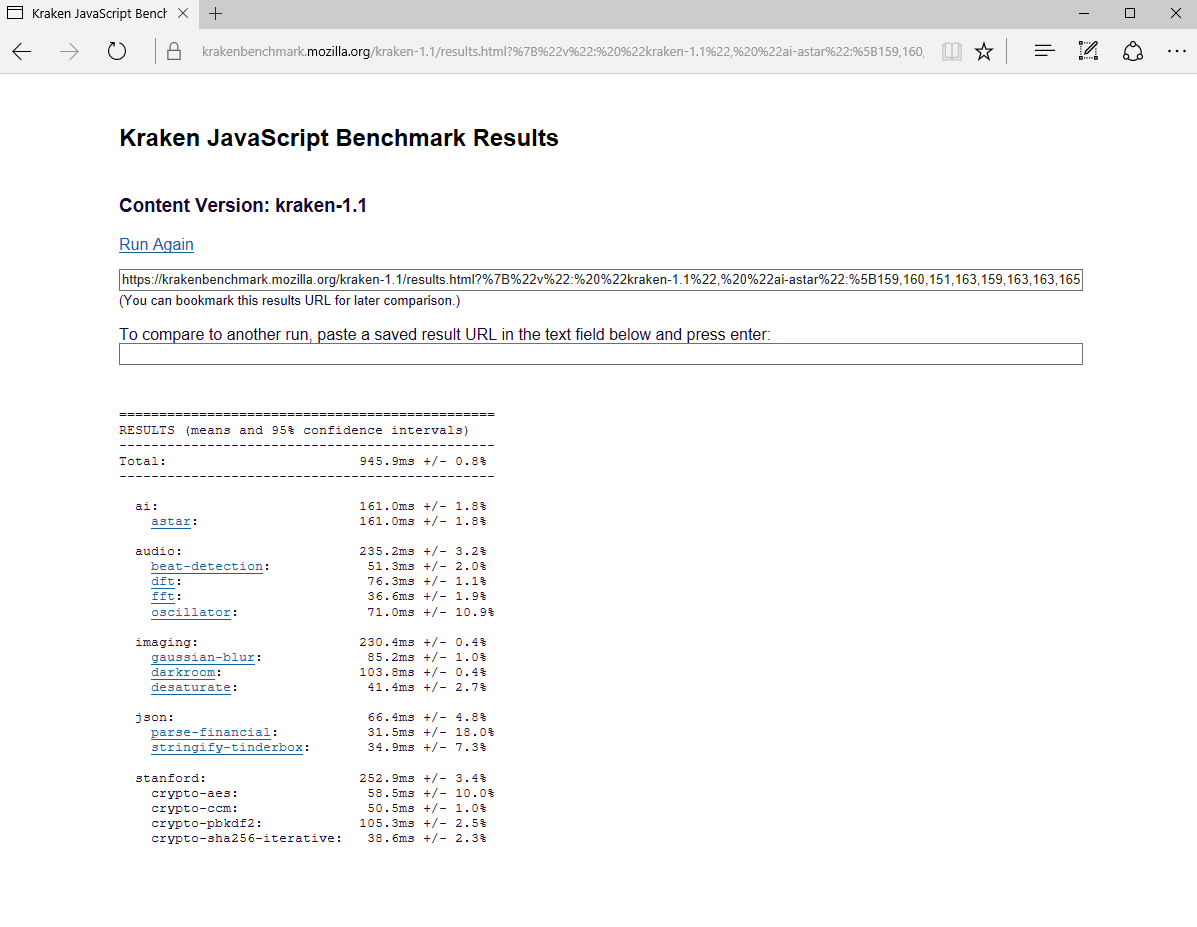
| Mozilla Kraken 1.1 - Total | |
| Lenovo ThinkPad T470-20HD002HGE | |
| Dell Latitude 14 E5470 | |
| Lenovo ThinkPad T460p-20FXS05500 | |
| Lenovo ThinkPad T470p-20J7S00000 | |
* ... kleiner is beter

| PCMark 7 Score | 5766 punten | |
| PCMark 8 Home Score Accelerated v2 | 3650 punten | |
| PCMark 8 Creative Score Accelerated v2 | 4883 punten | |
| PCMark 8 Work Score Accelerated v2 | 4654 punten | |
Help | ||
| Lenovo ThinkPad T470p-20J7S00000 Samsung PM961 NVMe MZVLW512HMJP | Lenovo ThinkPad T460p-20FXS05500 Samsung SSD PM871 MZ7LN512HCHP | Dell Latitude 14 E5470 Micron SSD 1100 (MTFDDAV256TBN) | Dell Latitude 5480 Toshiba SG5 256GB THNSNK256GVN8 | HP EliteBook 840 G4-Z2V49ET ABD Samsung PM961 MZVLW256HEHP | Lenovo ThinkPad T470-20HD002HGE Samsung PM961 NVMe MZVLW512HMJP | |
|---|---|---|---|---|---|---|
| CrystalDiskMark 3.0 | -49% | -60% | -55% | 8% | -6% | |
| Read Seq (MB/s) | 1088 | 502 -54% | 465.4 -57% | 469.4 -57% | 1819 67% | 1155 6% |
| Write Seq (MB/s) | 1023 | 442 -57% | 363.1 -65% | 264.8 -74% | 1263 23% | 1076 5% |
| Read 512 (MB/s) | 731 | 411.4 -44% | 338.4 -54% | 408.1 -44% | 922 26% | 811 11% |
| Write 512 (MB/s) | 798 | 414.3 -48% | 246.1 -69% | 265.5 -67% | 804 1% | 862 8% |
| Read 4k (MB/s) | 60.9 | 29.18 -52% | 25.83 -58% | 24.66 -60% | 61.4 1% | 55.5 -9% |
| Write 4k (MB/s) | 166.8 | 86.5 -48% | 80.3 -52% | 114.8 -31% | 157.1 -6% | 134.6 -19% |
| Read 4k QD32 (MB/s) | 652 | 358.1 -45% | 246.1 -62% | 380.3 -42% | 513 -21% | 496.2 -24% |
| Write 4k QD32 (MB/s) | 563 | 319.8 -43% | 197.7 -65% | 207.2 -63% | 410.2 -27% | 425.4 -24% |

| 3DMark 11 Performance | 3428 punten | |
| 3DMark Ice Storm Standard Score | 36216 punten | |
| 3DMark Cloud Gate Standard Score | 11802 punten | |
| 3DMark Fire Strike Score | 2253 punten | |
| 3DMark Fire Strike Extreme Score | 1089 punten | |
| 3DMark Time Spy Score | 737 punten | |
Help | ||
| lage | gem. | hoge | ultra | |
|---|---|---|---|---|
| BioShock Infinite (2013) | 129.4 | 79.3 | 68.3 | 25.5 |
| Battlefield 4 (2013) | 98.8 | 69.1 | 48.8 | 19.8 |
| The Witcher 3 (2015) | 49.2 | 28.4 | 14.6 | |
| Rise of the Tomb Raider (2016) | 51.8 | 30.6 | 17 |
Geluidsniveau
| Onbelast |
| 29 / 29 / 29 dB (A) |
| Belasting |
| 35.6 / 39.7 dB (A) |
 | ||
30 dB stil 40 dB(A) hoorbaar 50 dB(A) luid |
||
min: | ||
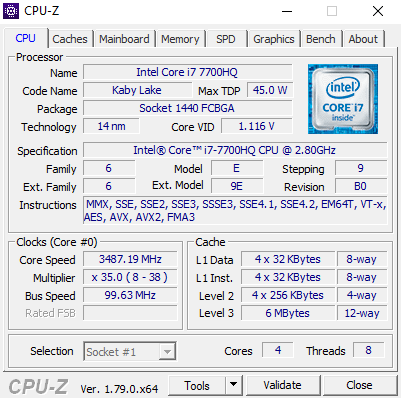
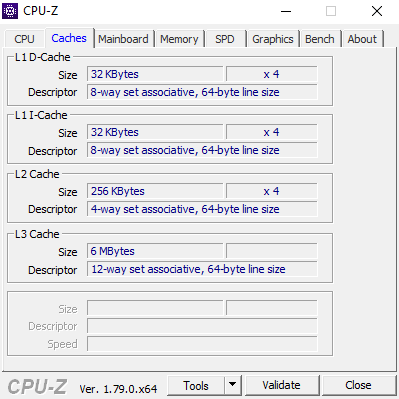
| Lenovo ThinkPad T470p-20J7S00000 i7-7700HQ, GeForce 940MX | Lenovo ThinkPad T460p-20FXS05500 6700HQ, GeForce 940MX | Dell Latitude 14 E5470 6440HQ, HD Graphics 530 | Dell Latitude 5480 i7-7600U, HD Graphics 620 | HP EliteBook 840 G4-Z2V49ET ABD i5-7200U, HD Graphics 620 | Lenovo ThinkPad T470-20HD002HGE i5-7200U, HD Graphics 620 | |
|---|---|---|---|---|---|---|
| Noise | 1% | 1% | -9% | -1% | 6% | |
| uit / omgeving * (dB) | 29 | 29.2 -1% | 30.3 -4% | 31 -7% | 28 3% | |
| Idle Minimum * (dB) | 29 | 29.2 -1% | 30.3 -4% | 29.6 -2% | 31 -7% | 28 3% |
| Idle Average * (dB) | 29 | 29.2 -1% | 30.3 -4% | 29.6 -2% | 31 -7% | 28 3% |
| Idle Maximum * (dB) | 29 | 29.2 -1% | 30.3 -4% | 29.6 -2% | 31 -7% | 29.4 -1% |
| Load Average * (dB) | 35.6 | 33.5 6% | 31.6 11% | 42 -18% | 33.5 6% | 31.4 12% |
| Load Maximum * (dB) | 39.7 | 38.8 2% | 35 12% | 47.1 -19% | 33.7 15% | 34.6 13% |
* ... kleiner is beter
(-) De maximumtemperatuur aan de bovenzijde bedraagt 50.2 °C / 122 F, vergeleken met het gemiddelde van 34.3 °C / 94 F, variërend van 21.2 tot 62.5 °C voor de klasse Office.
(-) De bodem warmt op tot een maximum van 51.3 °C / 124 F, vergeleken met een gemiddelde van 36.8 °C / 98 F
(+) Bij onbelast gebruik bedraagt de gemiddelde temperatuur voor de bovenzijde 25.4 °C / 78 F, vergeleken met het apparaatgemiddelde van 29.5 °C / 85 F.
(±) De palmsteunen en het touchpad kunnen zeer heet aanvoelen met een maximum van ###max## °C / 101.3 F.
(-) De gemiddelde temperatuur van de handpalmsteun van soortgelijke toestellen bedroeg 27.5 °C / 81.5 F (-11 °C / -19.8 F).
| Lenovo ThinkPad T470p-20J7S00000 i7-7700HQ, GeForce 940MX | Lenovo ThinkPad T460p-20FXS05500 6700HQ, GeForce 940MX | Dell Latitude 14 E5470 6440HQ, HD Graphics 530 | Dell Latitude 5480 i7-7600U, HD Graphics 620 | HP EliteBook 840 G4-Z2V49ET ABD i5-7200U, HD Graphics 620 | Lenovo ThinkPad T470-20HD002HGE i5-7200U, HD Graphics 620 | |
|---|---|---|---|---|---|---|
| Heat | -11% | -1% | 11% | 15% | 14% | |
| Maximum Upper Side * (°C) | 50.2 | 51.6 -3% | 43 14% | 36.4 27% | 37 26% | 37.2 26% |
| Maximum Bottom * (°C) | 51.3 | 55.2 -8% | 43 16% | 45 12% | 39.4 23% | 45.1 12% |
| Idle Upper Side * (°C) | 26.3 | 30.7 -17% | 31.2 -19% | 26.4 -0% | 25.9 2% | 24.4 7% |
| Idle Bottom * (°C) | 27.5 | 31.5 -15% | 31.3 -14% | 26.8 3% | 25.6 7% | 25 9% |
* ... kleiner is beter
Lenovo ThinkPad T470p-20J7S00000 audioanalyse
(+) | luidsprekers kunnen relatief luid spelen (83.1 dB)
Bas 100 - 315 Hz
(-) | bijna geen lage tonen - gemiddeld 18.1% lager dan de mediaan
(±) | lineariteit van de lage tonen is gemiddeld (14.6% delta ten opzichte van de vorige frequentie)
Midden 400 - 2000 Hz
(+) | evenwichtige middens - slechts 4.2% verwijderd van de mediaan
(+) | de middentonen zijn lineair (5.9% delta ten opzichte van de vorige frequentie)
Hoog 2 - 16 kHz
(+) | evenwichtige hoogtepunten - slechts 3.3% verwijderd van de mediaan
(+) | de hoge tonen zijn lineair (6.5% delta naar de vorige frequentie)
Algemeen 100 - 16.000 Hz
(±) | lineariteit van het totale geluid is gemiddeld (19.6% verschil met de mediaan)
Vergeleken met dezelfde klasse
» 40% van alle geteste apparaten in deze klasse waren beter, 8% vergelijkbaar, 52% slechter
» De beste had een delta van 7%, het gemiddelde was 21%, de slechtste was 53%
Vergeleken met alle geteste toestellen
» 49% van alle geteste apparaten waren beter, 7% gelijk, 44% slechter
» De beste had een delta van 4%, het gemiddelde was 24%, de slechtste was 134%
Apple MacBook 12 (Early 2016) 1.1 GHz audioanalyse
(+) | luidsprekers kunnen relatief luid spelen (83.6 dB)
Bas 100 - 315 Hz
(±) | verminderde zeebaars - gemiddeld 11.3% lager dan de mediaan
(±) | lineariteit van de lage tonen is gemiddeld (14.2% delta ten opzichte van de vorige frequentie)
Midden 400 - 2000 Hz
(+) | evenwichtige middens - slechts 2.4% verwijderd van de mediaan
(+) | de middentonen zijn lineair (5.5% delta ten opzichte van de vorige frequentie)
Hoog 2 - 16 kHz
(+) | evenwichtige hoogtepunten - slechts 2% verwijderd van de mediaan
(+) | de hoge tonen zijn lineair (4.5% delta naar de vorige frequentie)
Algemeen 100 - 16.000 Hz
(+) | het totale geluid is lineair (10.2% verschil met de mediaan)
Vergeleken met dezelfde klasse
» 7% van alle geteste apparaten in deze klasse waren beter, 2% vergelijkbaar, 91% slechter
» De beste had een delta van 5%, het gemiddelde was 18%, de slechtste was 53%
Vergeleken met alle geteste toestellen
» 5% van alle geteste apparaten waren beter, 1% gelijk, 94% slechter
» De beste had een delta van 4%, het gemiddelde was 24%, de slechtste was 134%
| Uit / Standby | |
| Inactief | |
| Belasting |
|
Key:
min: | |
| Lenovo ThinkPad T470p-20J7S00000 i7-7700HQ, GeForce 940MX, Samsung PM961 NVMe MZVLW512HMJP, IPS, 2560x1440, 14" | Lenovo ThinkPad T460p-20FXS05500 6700HQ, GeForce 940MX, Samsung SSD PM871 MZ7LN512HCHP, IPS-Panel, 2560x1440, 14" | Dell Latitude 14 E5470 6440HQ, HD Graphics 530, Micron SSD 1100 (MTFDDAV256TBN), AH-IPS, WLED, 1920x1080, 14" | Dell Latitude 5480 i7-7600U, HD Graphics 620, Toshiba SG5 256GB THNSNK256GVN8, IPS, 1920x1080, 14" | HP EliteBook 840 G4-Z2V49ET ABD i5-7200U, HD Graphics 620, Samsung PM961 MZVLW256HEHP, TN, 1920x1080, 14" | Lenovo ThinkPad T470-20HD002HGE i5-7200U, HD Graphics 620, Samsung PM961 NVMe MZVLW512HMJP, IPS, 1920x1080, 14" | |
|---|---|---|---|---|---|---|
| Power Consumption | -22% | 1% | 7% | 29% | 29% | |
| Idle Minimum * (Watt) | 3.8 | 5 -32% | 4.1 -8% | 6.64 -75% | 2.9 24% | 3.21 16% |
| Idle Average * (Watt) | 6.5 | 9.9 -52% | 8.1 -25% | 6.67 -3% | 5.6 14% | 6.15 5% |
| Idle Maximum * (Watt) | 7.2 | 10.8 -50% | 11.4 -58% | 7.78 -8% | 8.15 -13% | 6.82 5% |
| Load Average * (Watt) | 62.5 | 52.4 16% | 33.5 46% | 30.83 51% | 30.6 51% | 28.5 54% |
| Load Maximum * (Watt) | 99.6 | 89.8 10% | 49 51% | 31.7 68% | 31 69% | 34.5 65% |
* ... kleiner is beter
| Lenovo ThinkPad T470p-20J7S00000 i7-7700HQ, GeForce 940MX, 72 Wh | Lenovo ThinkPad T460p-20FXS05500 6700HQ, GeForce 940MX, 48 Wh | Dell Latitude 14 E5470 6440HQ, HD Graphics 530, 62 Wh | Dell Latitude 5480 i7-7600U, HD Graphics 620, 68 Wh | HP EliteBook 840 G4-Z2V49ET ABD i5-7200U, HD Graphics 620, 51 Wh | Lenovo ThinkPad T470-20HD002HGE i5-7200U, HD Graphics 620, 48 Wh | |
|---|---|---|---|---|---|---|
| Batterijduur | -35% | -13% | 63% | 39% | 13% | |
| Reader / Idle (h) | 17.7 | 11 -38% | 15.2 -14% | 24.1 36% | 19.3 9% | |
| H.264 (h) | 7.6 | 6 -21% | 6.9 -9% | 9.9 30% | 10.4 37% | |
| WiFi v1.3 (h) | 10 | 5 -50% | 7.2 -28% | 16.1 61% | 9.5 -5% | 7.3 -27% |
| Load (h) | 1.4 | 1 -29% | 1.4 0% | 2.7 93% | 3.1 121% | 1.8 29% |
Pro
Contra
Dit is de verkorte versie van het originele artikel. Het volledige, Engelse testrapport vind je hier.
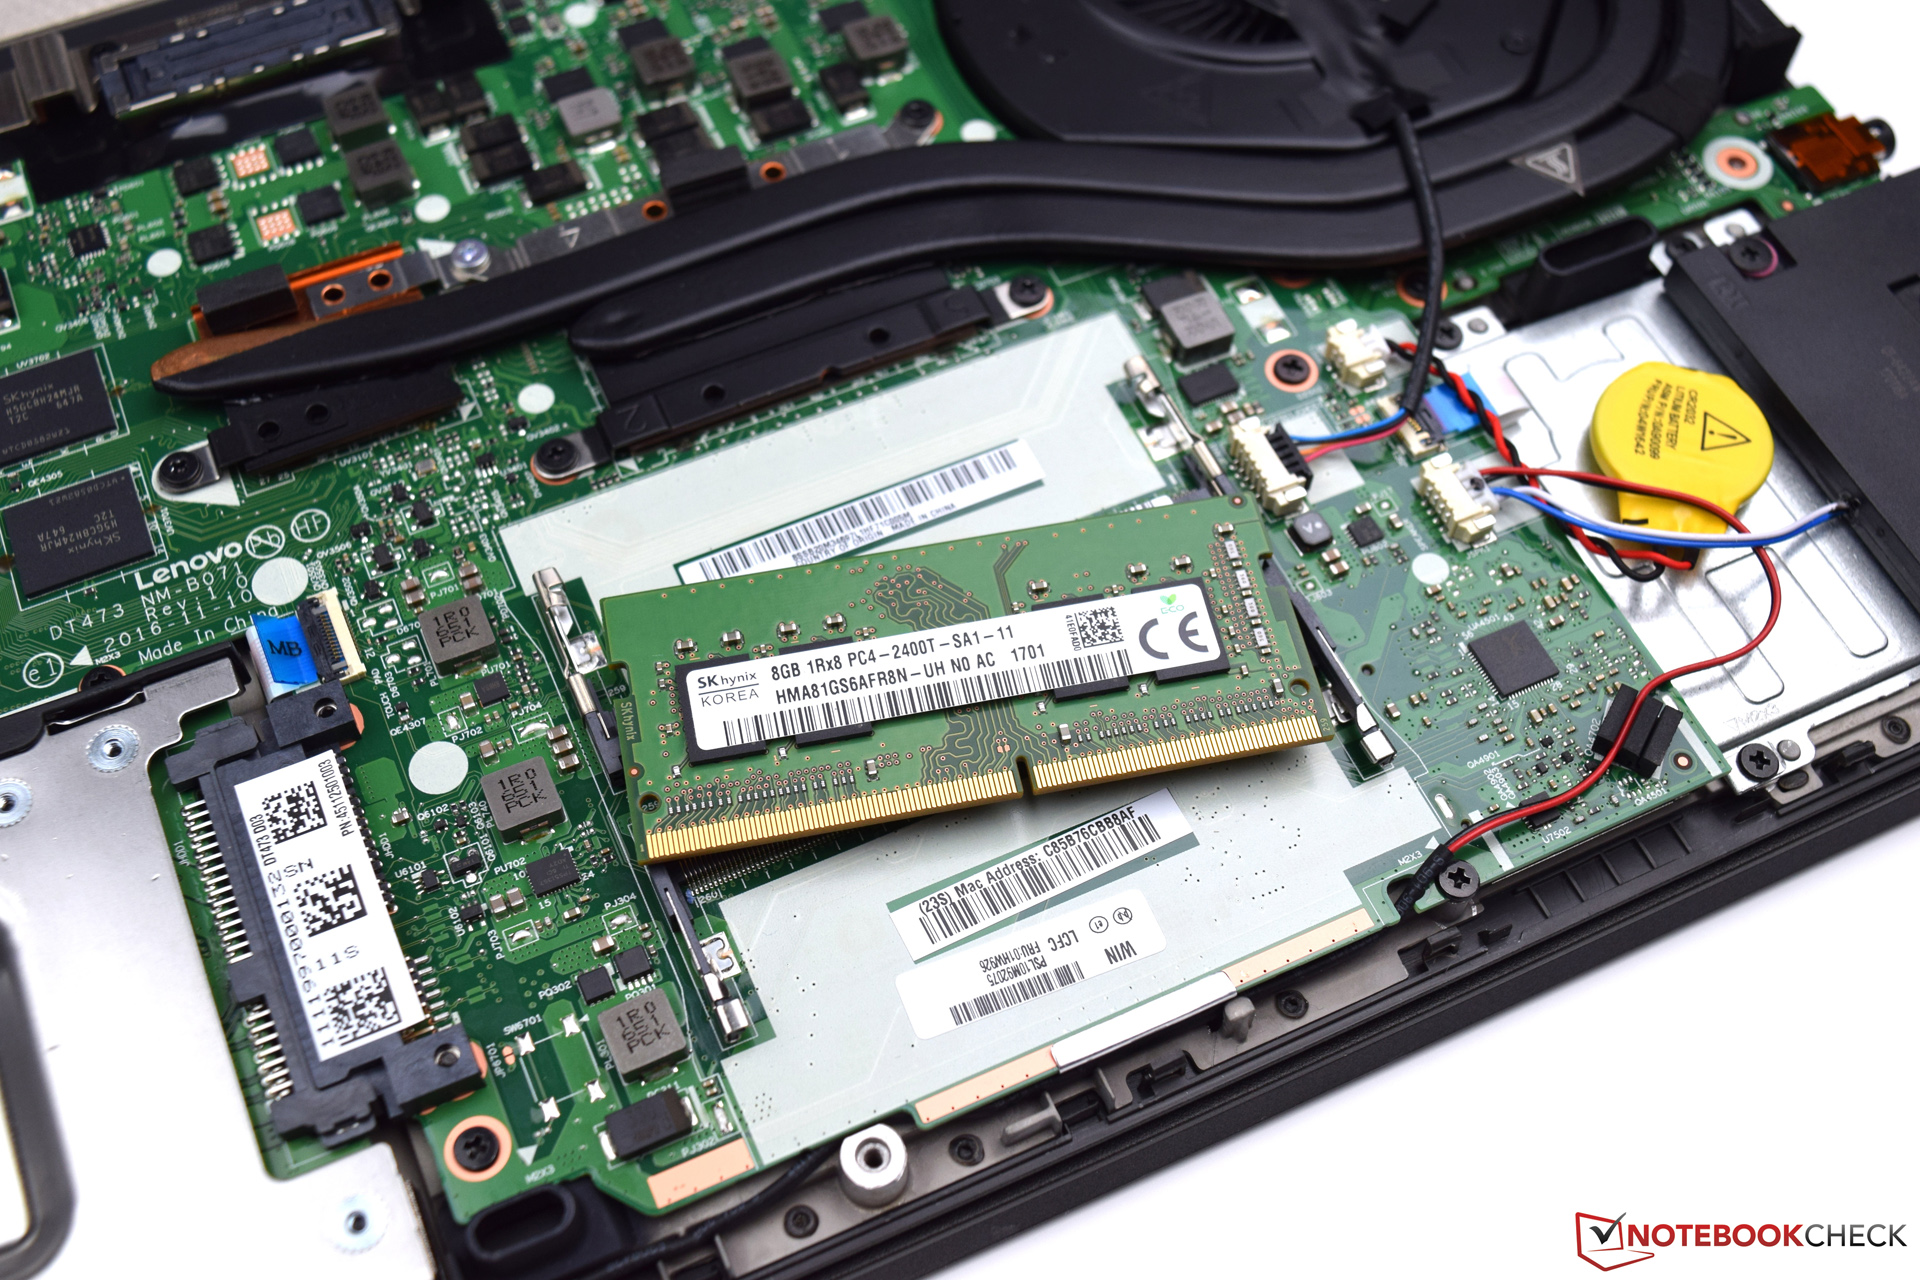
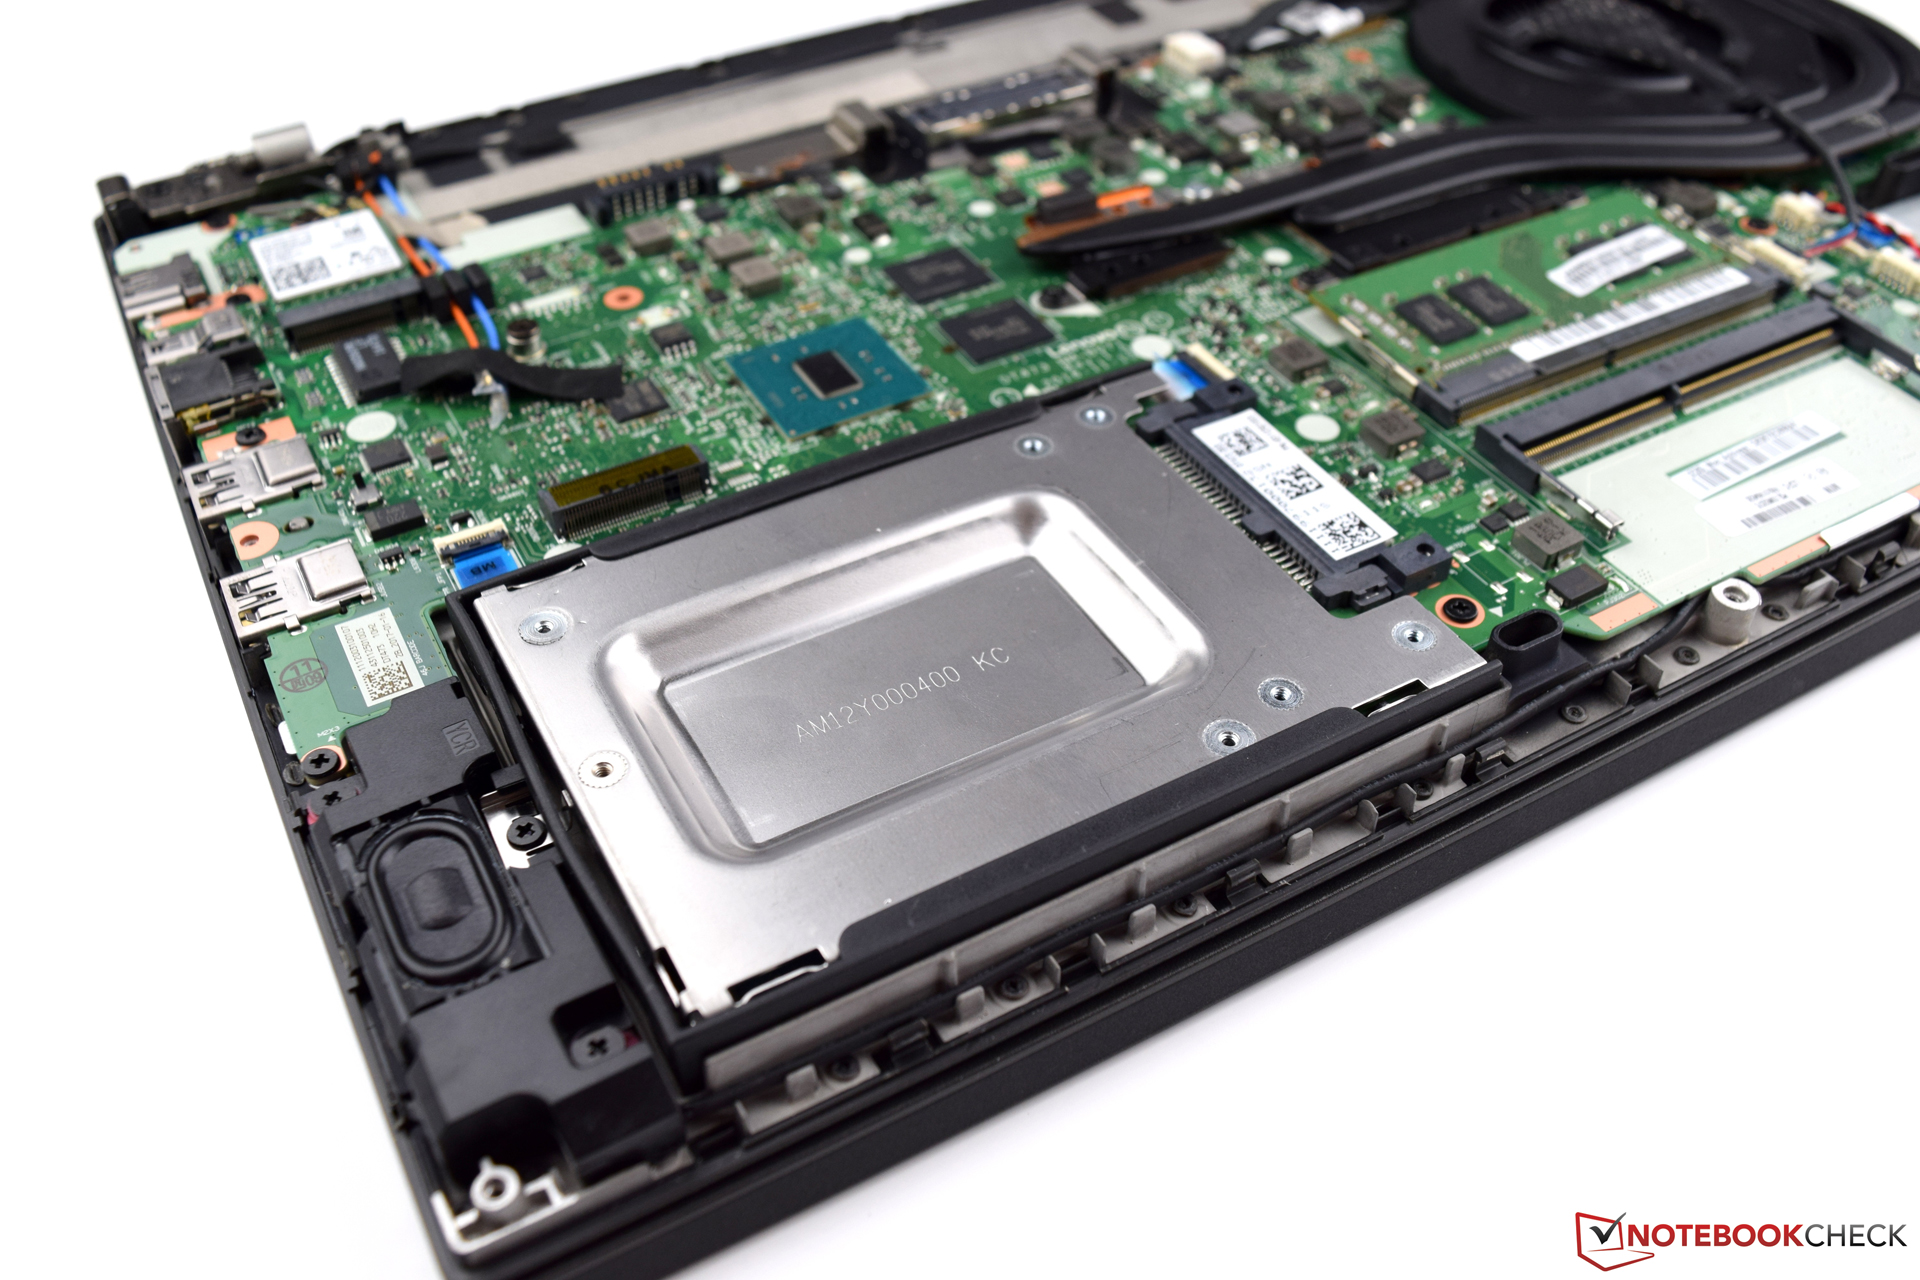
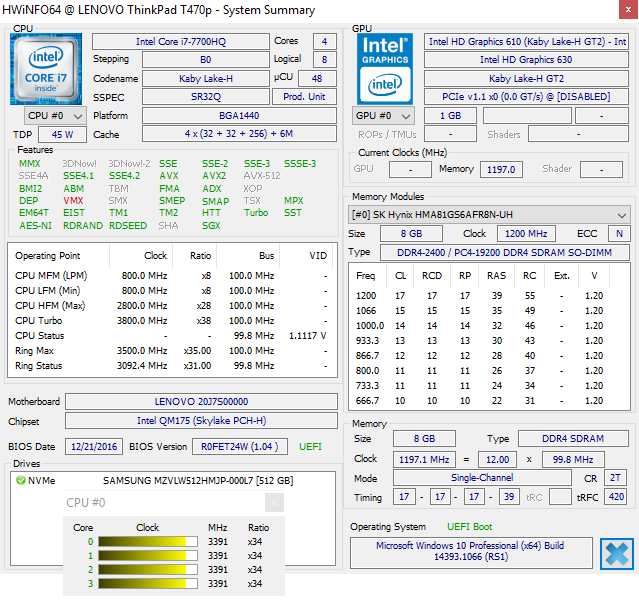
Lenovo heeft zijn modellen geüpdatet en voorziet de ThinkPad T470p van een erg krachtige Kaby Lake-CPU, waarvan de prestaties meer dan toereikend zijn voor het bedoelde gebruiksscenario. Het geheugen van 8 GB (DDR4) is niet zo groot, maar voldoende, en is gelukkig eenvoudig uitbreidbaar. We zijn erg tevreden met het grote aantal beveiligingsfeatures, die van de Lenovo ThinkPad T470p ook daadwerkelijk een business-toestel maken. De fabrikant heeft het werkpaard niettemin uitgerust met een discrete GPU, die in staat is tot om een aantal games aanvaardbare frame rates af te spelen. Het opslagapparaat presteert naar behoren en draagt aanzienlijk bij tot een vlotte systeemwerking. Al bij al komt het echter vaak neer op de prijs, die in dit geval best stevig is: 2099 euro (~$2351). Voor dit bedrag krijg je wel een performante 14-inch business-notebook die eveneens over uitstekende invoerapparatuur beschikt.
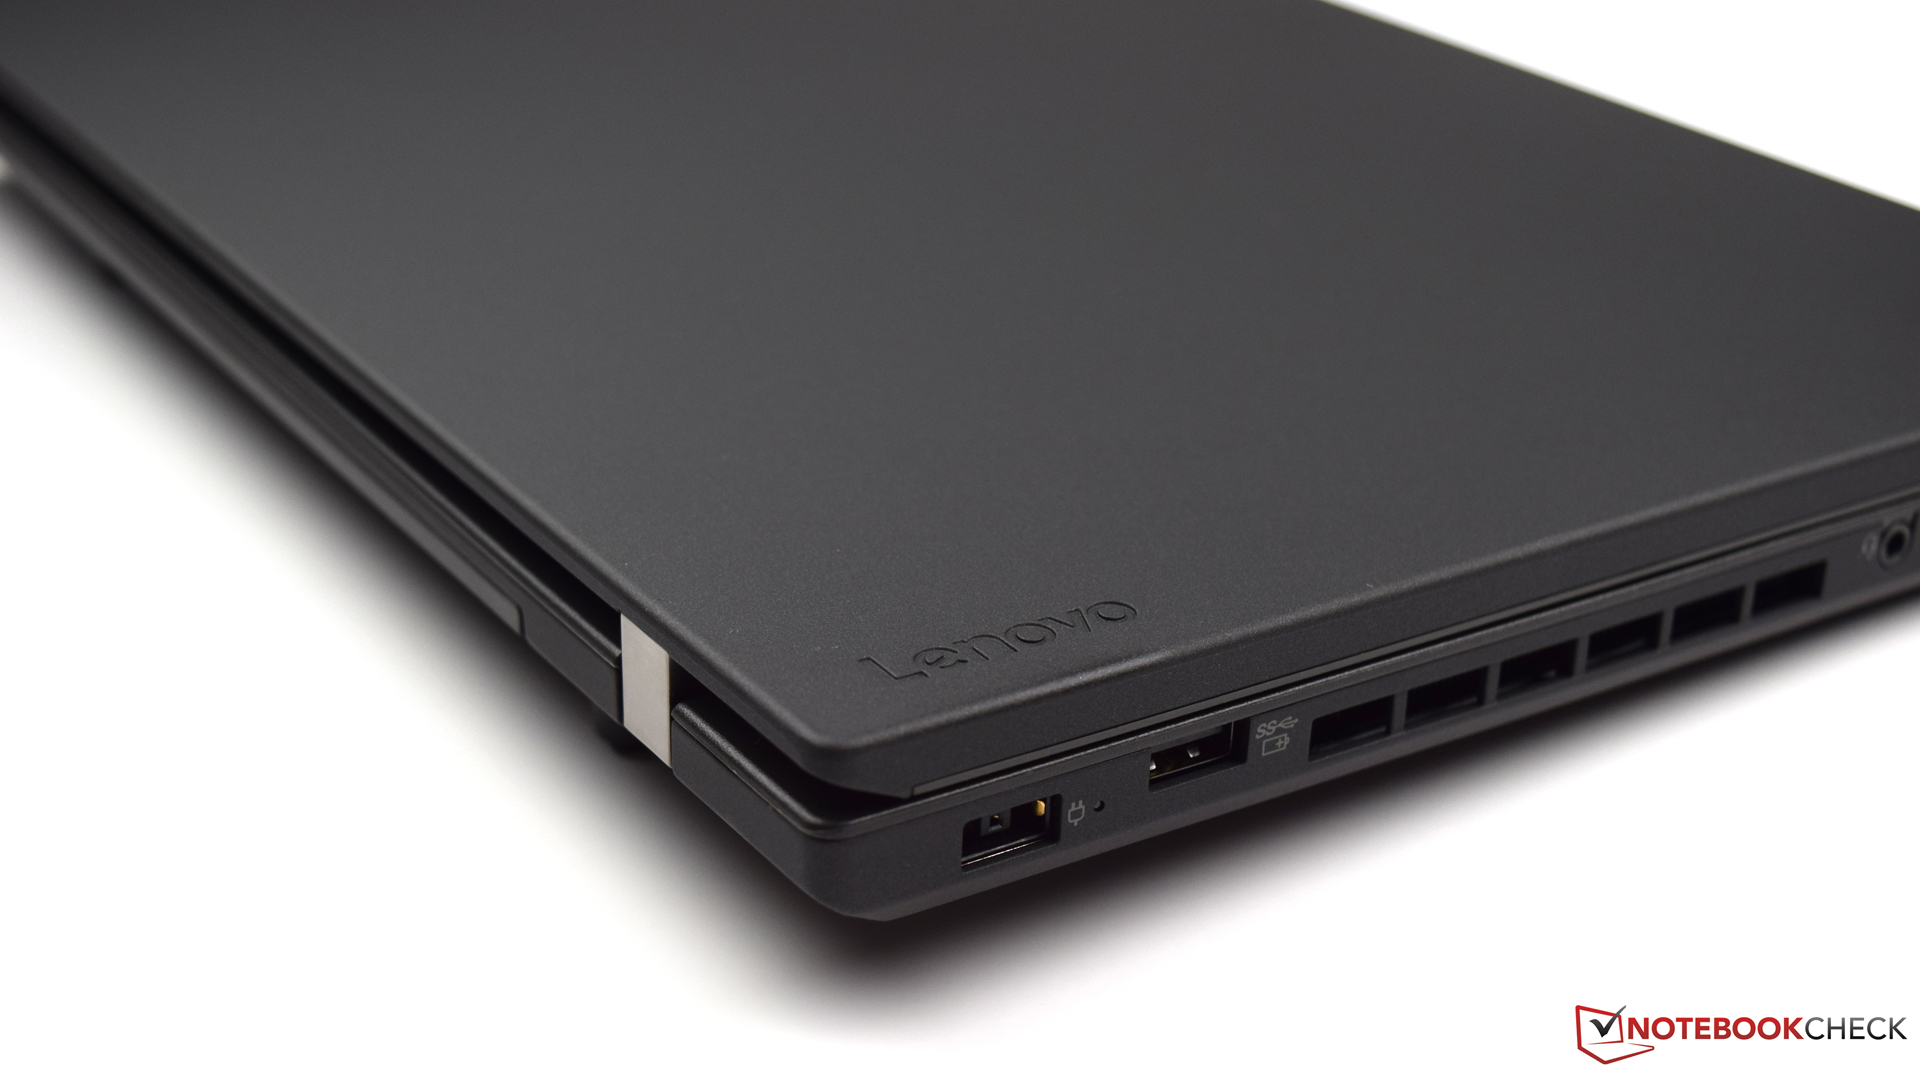
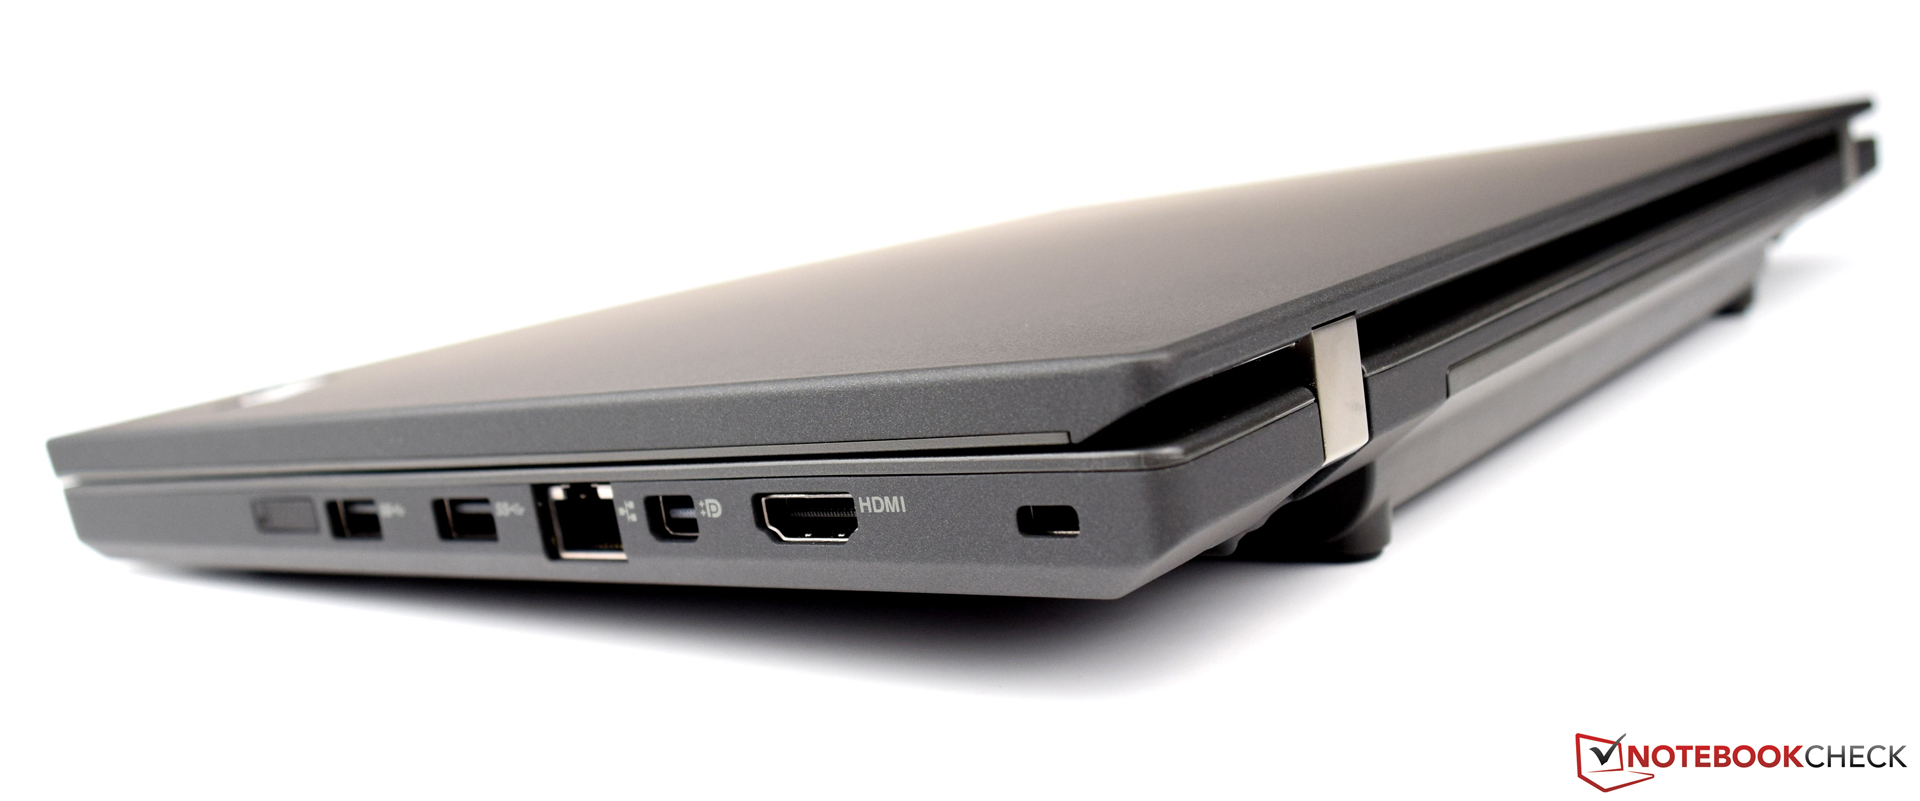
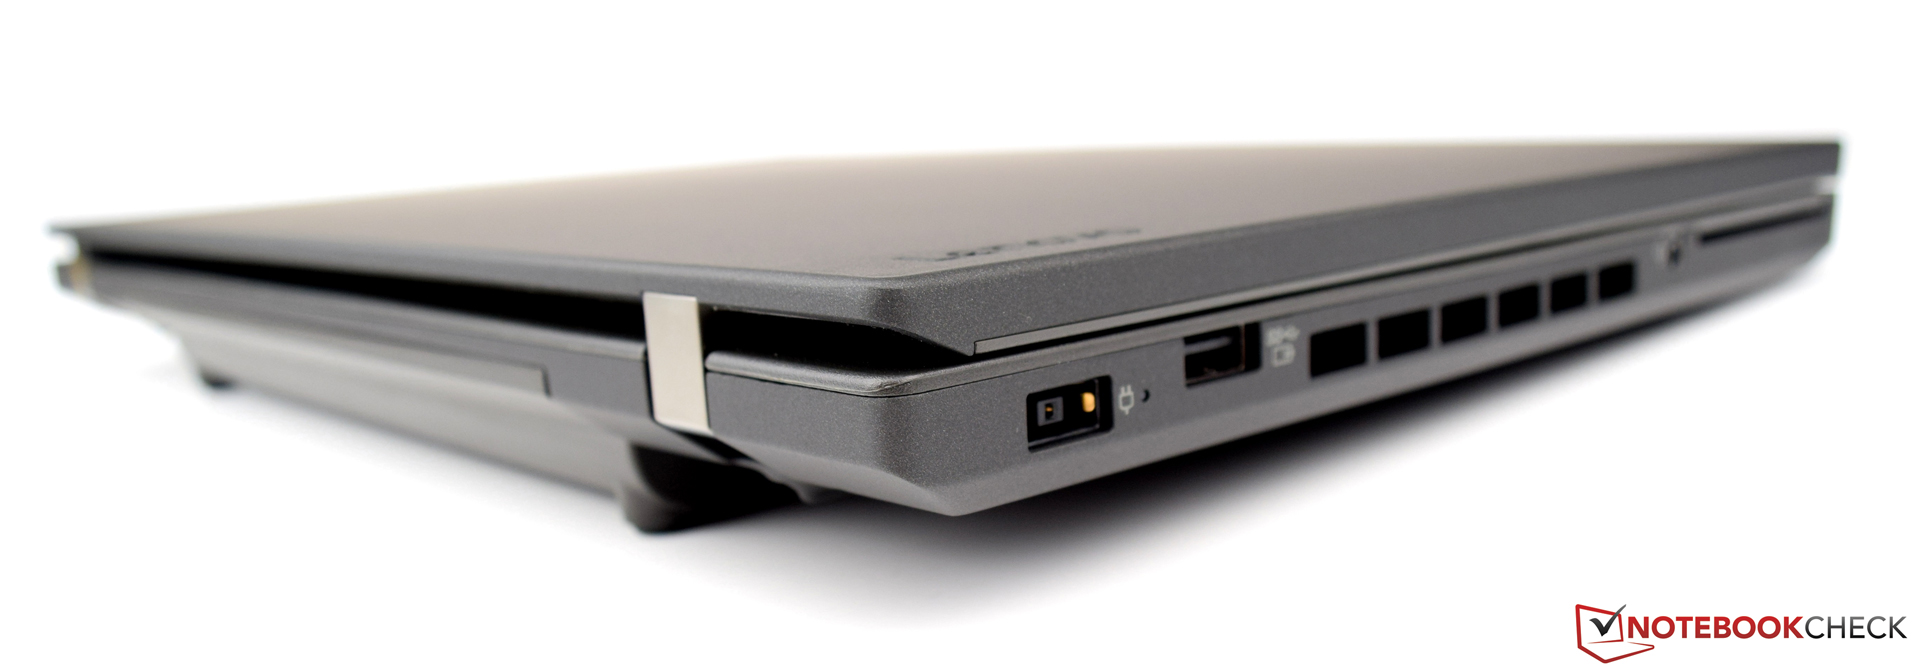
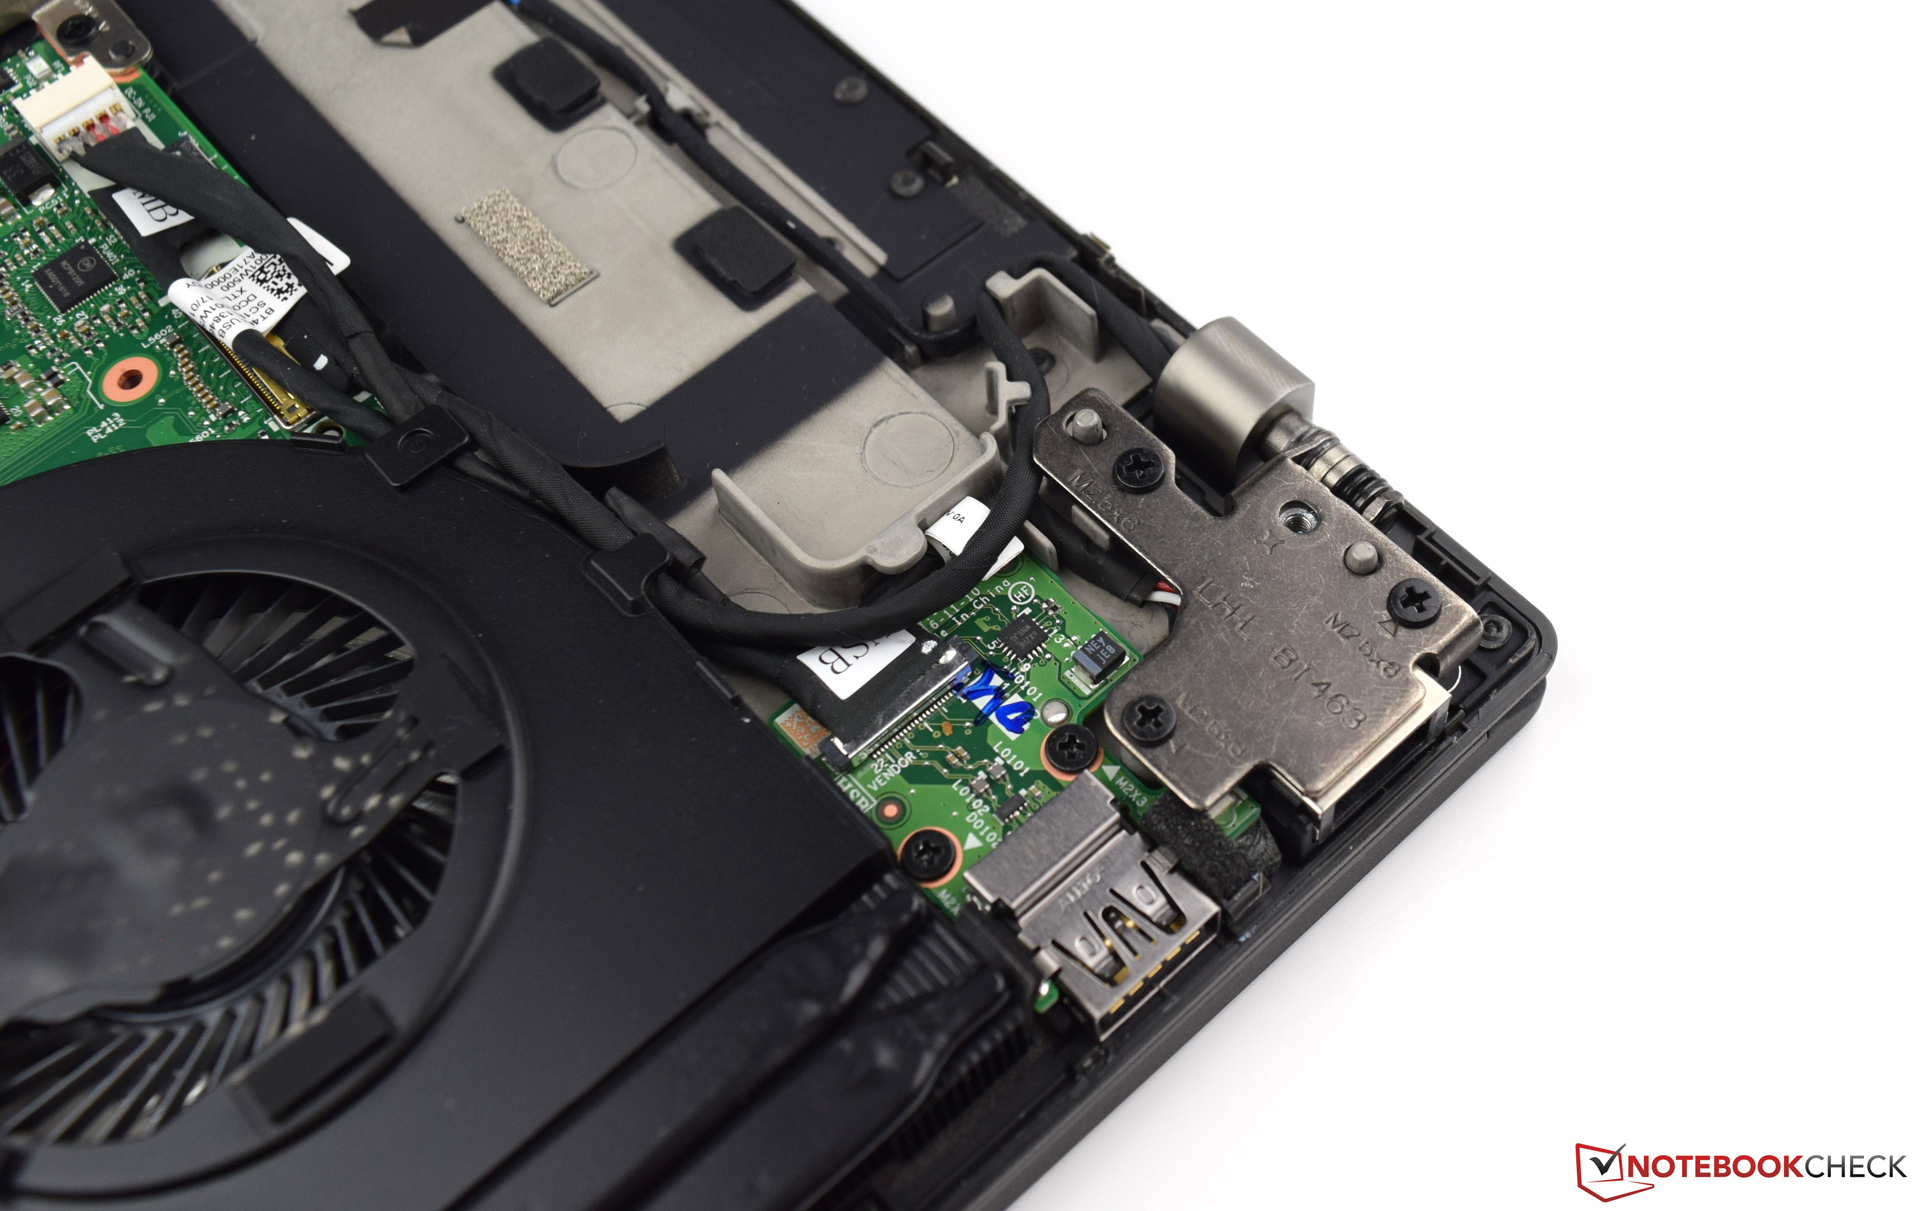
De Lenovo ThinkPad T470p verdient echter ook wat kritiek: hoewel het scherm degelijk presteert, stelt de helderheid ietwat teleur. We zijn evenmin tevreden met Lenovo's beslissing om een nieuw toestel, dat geacht is voor een aantal jaren dienst te doen, niet met moderne connectoren uit te rusten. Voor deze prijs zou je op zijn minst een USB 3.1 Type-C-poort met ondersteuning voor Thunderbolt moeten krijgen. Daarnaast zou de koeling een upgrade mogen krijgen in de opvolger.
Voor een performante quad-core-krachtpatser in de 14-inch-categorie, biedt de T470p momenteel een erg unieke feature.
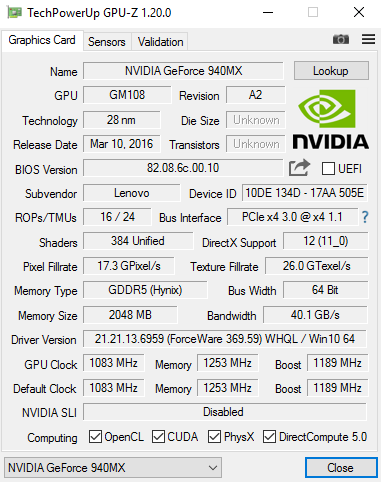
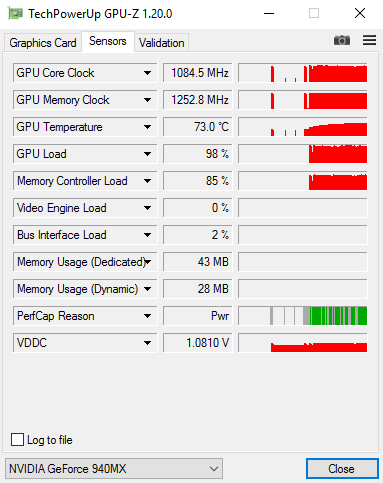
De Lenovo ThinkPad T470p maakt een goede indruk. De uitstekende systeemprestaties en discrete GPU zijn belangrijke pluspunten die een grote variëteit aan gebruiksscenario's mogelijk maken. Naast kantoorwerk, is de Lenovo ThinkPad T470p ook prima geschikt voor multimedia-taken; zelfs games zijn soms probleemloos speelbaar op het toestel.
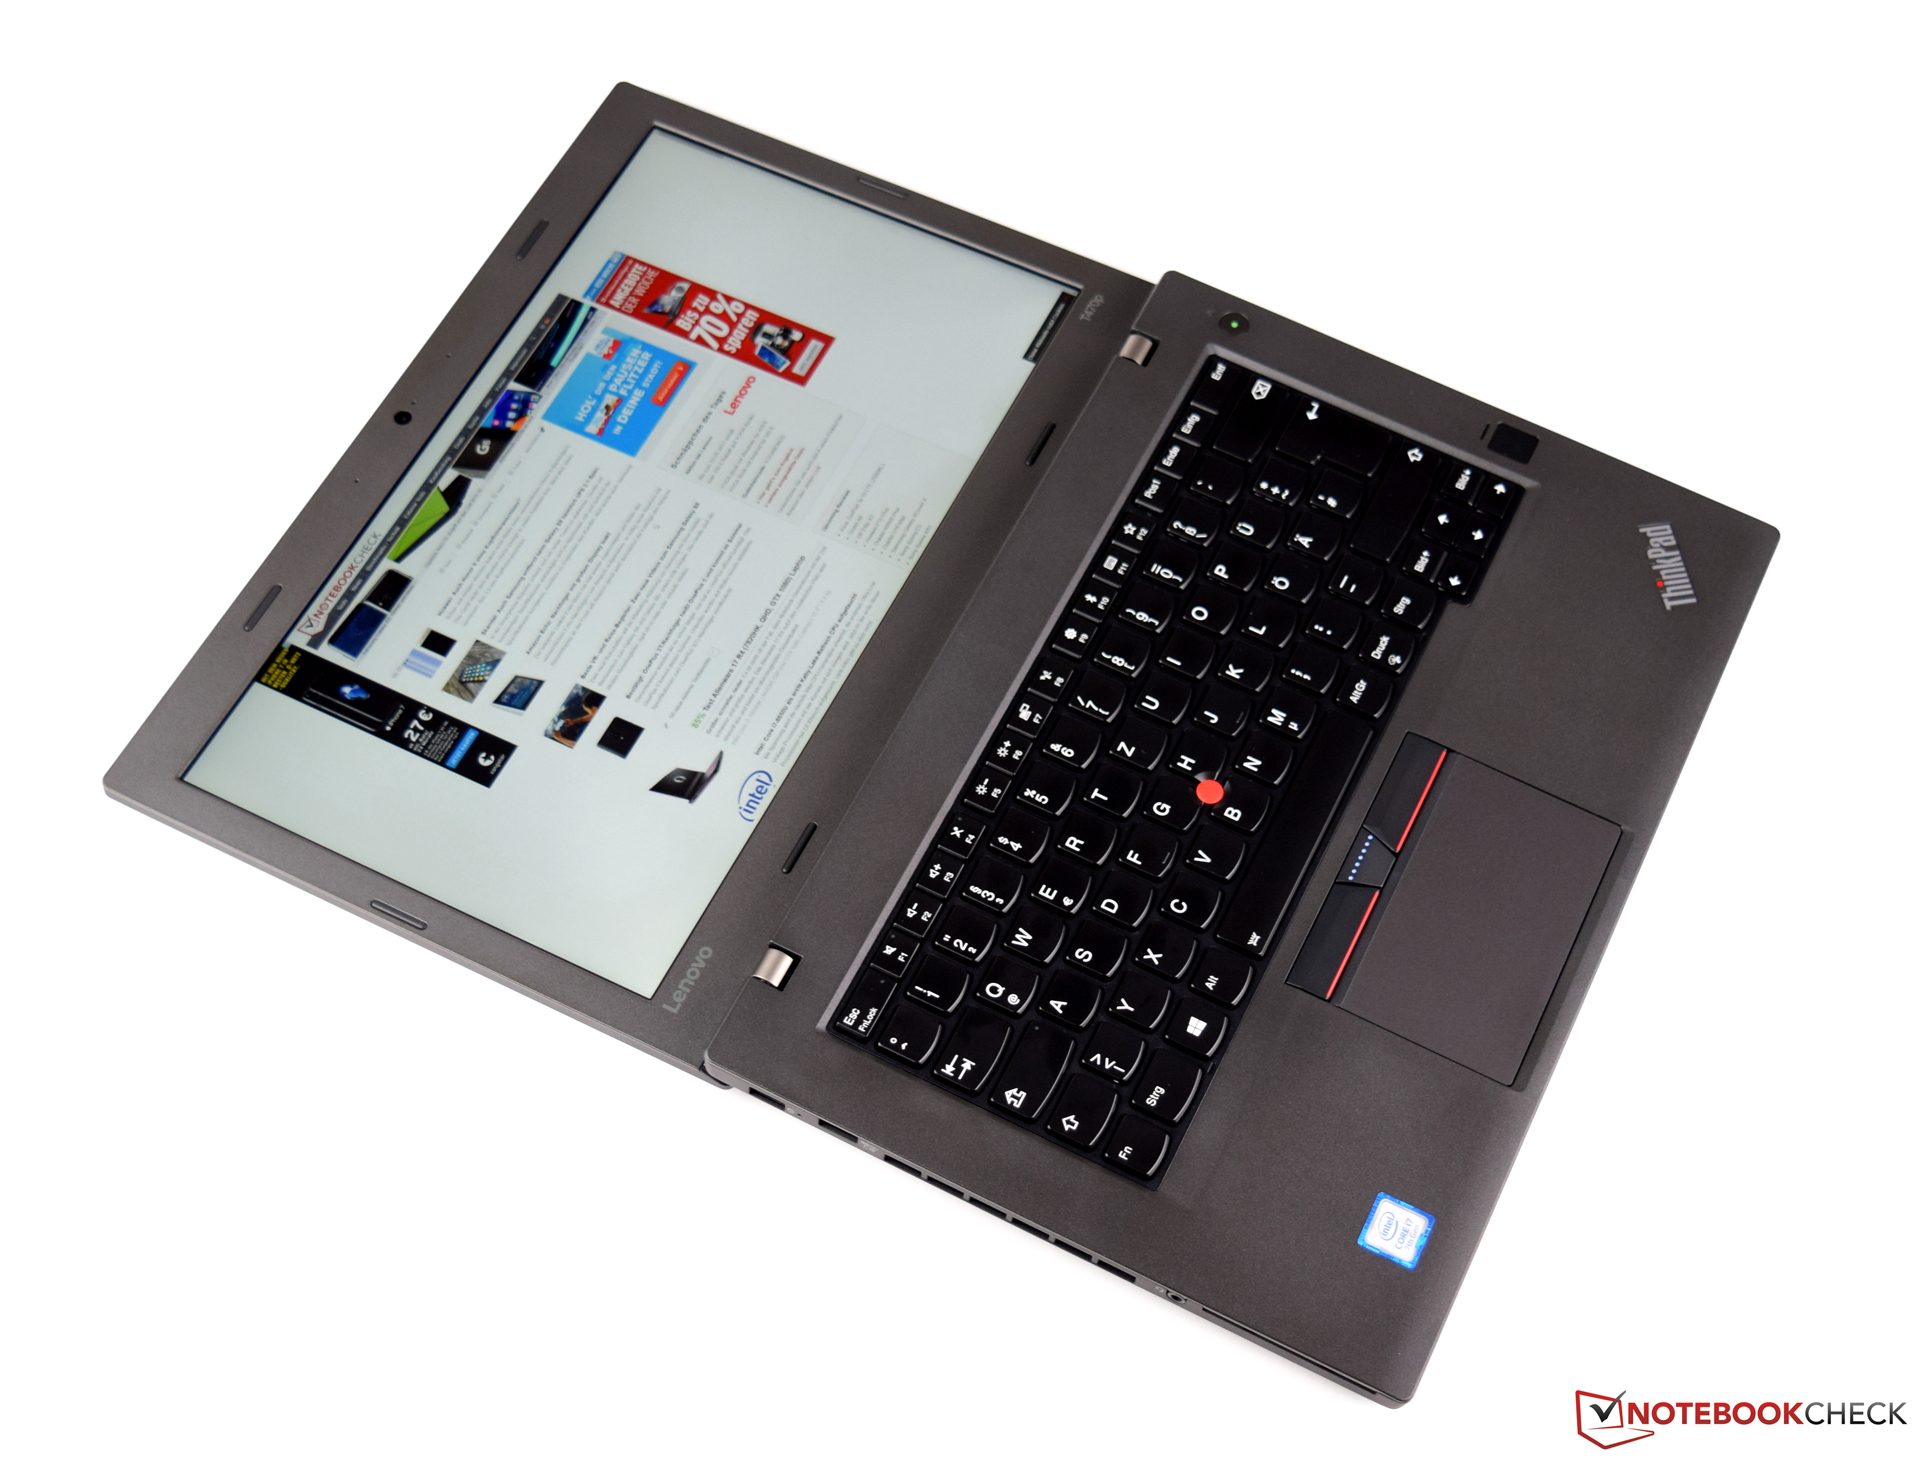
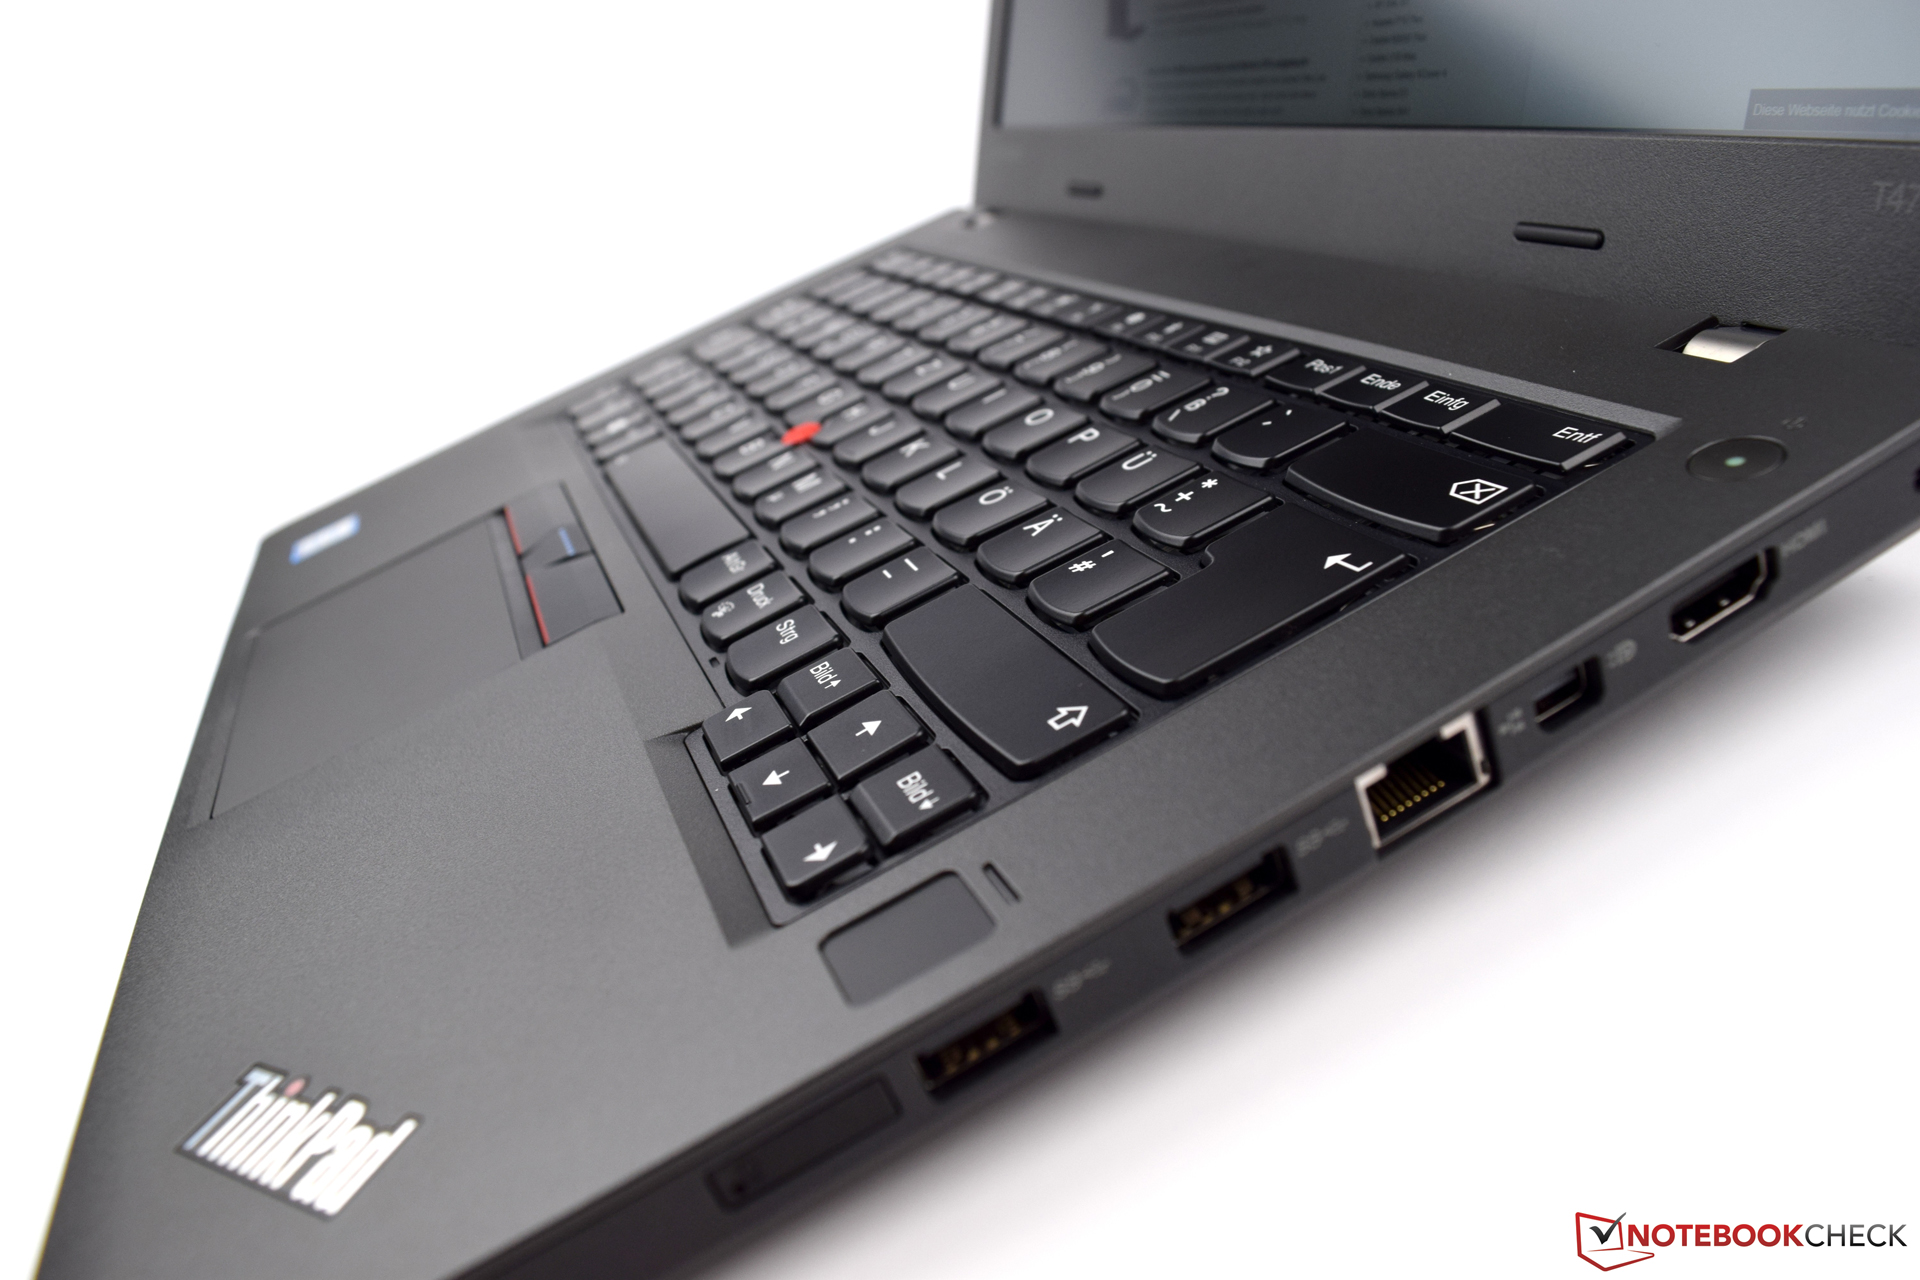
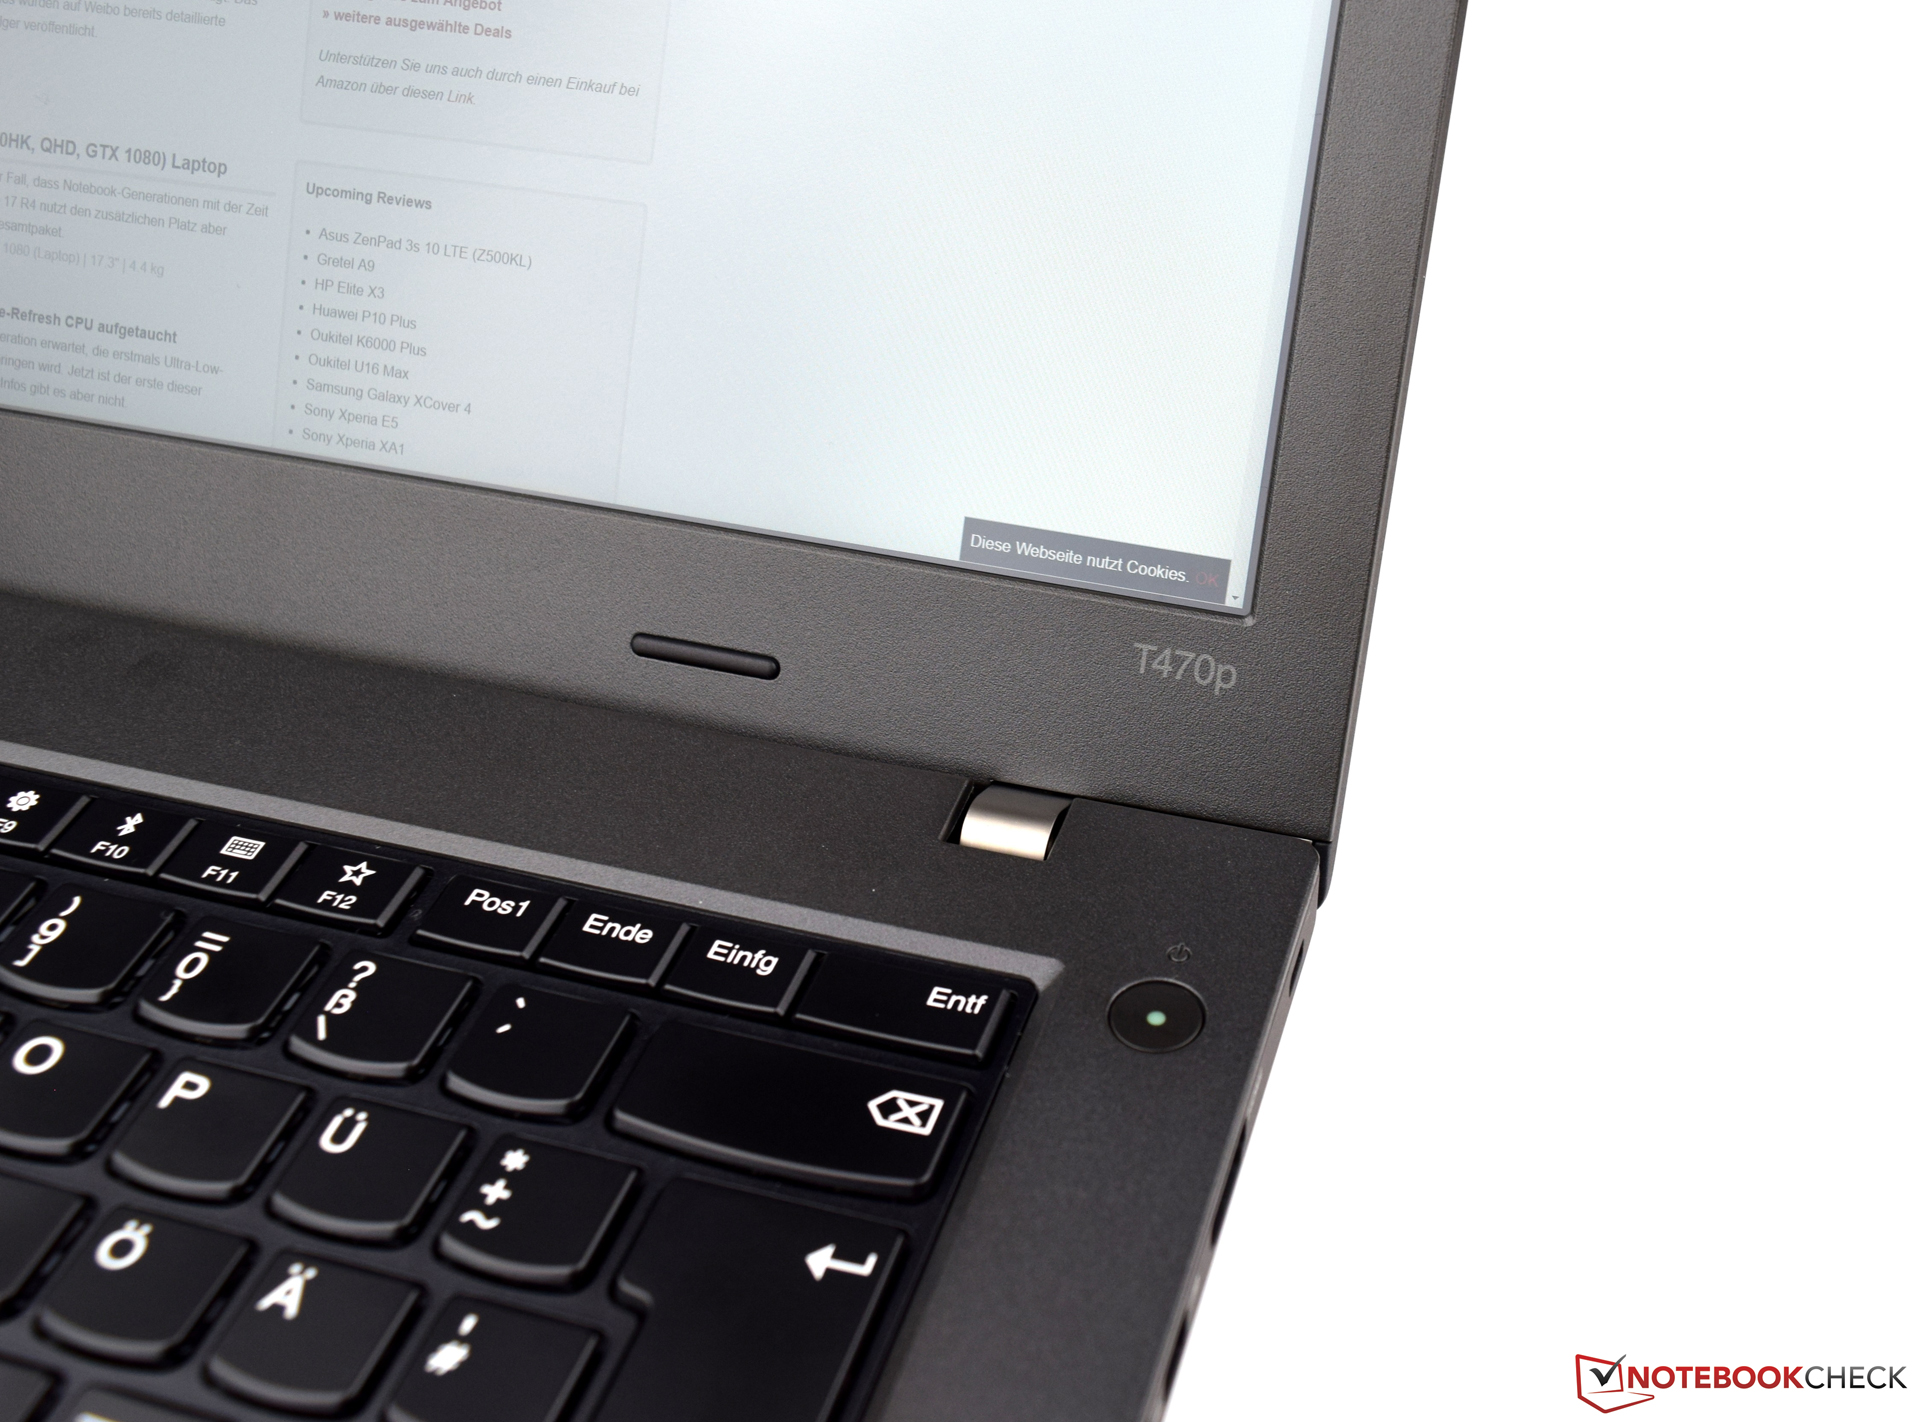
Lenovo ThinkPad T470p-20J7S00000
- 14-05-2017 v6 (old)
Sebastian Bade