Kort testrapport Lenovo ThinkPad E580 (i5-8250U, UHD 620, SSD) Laptop

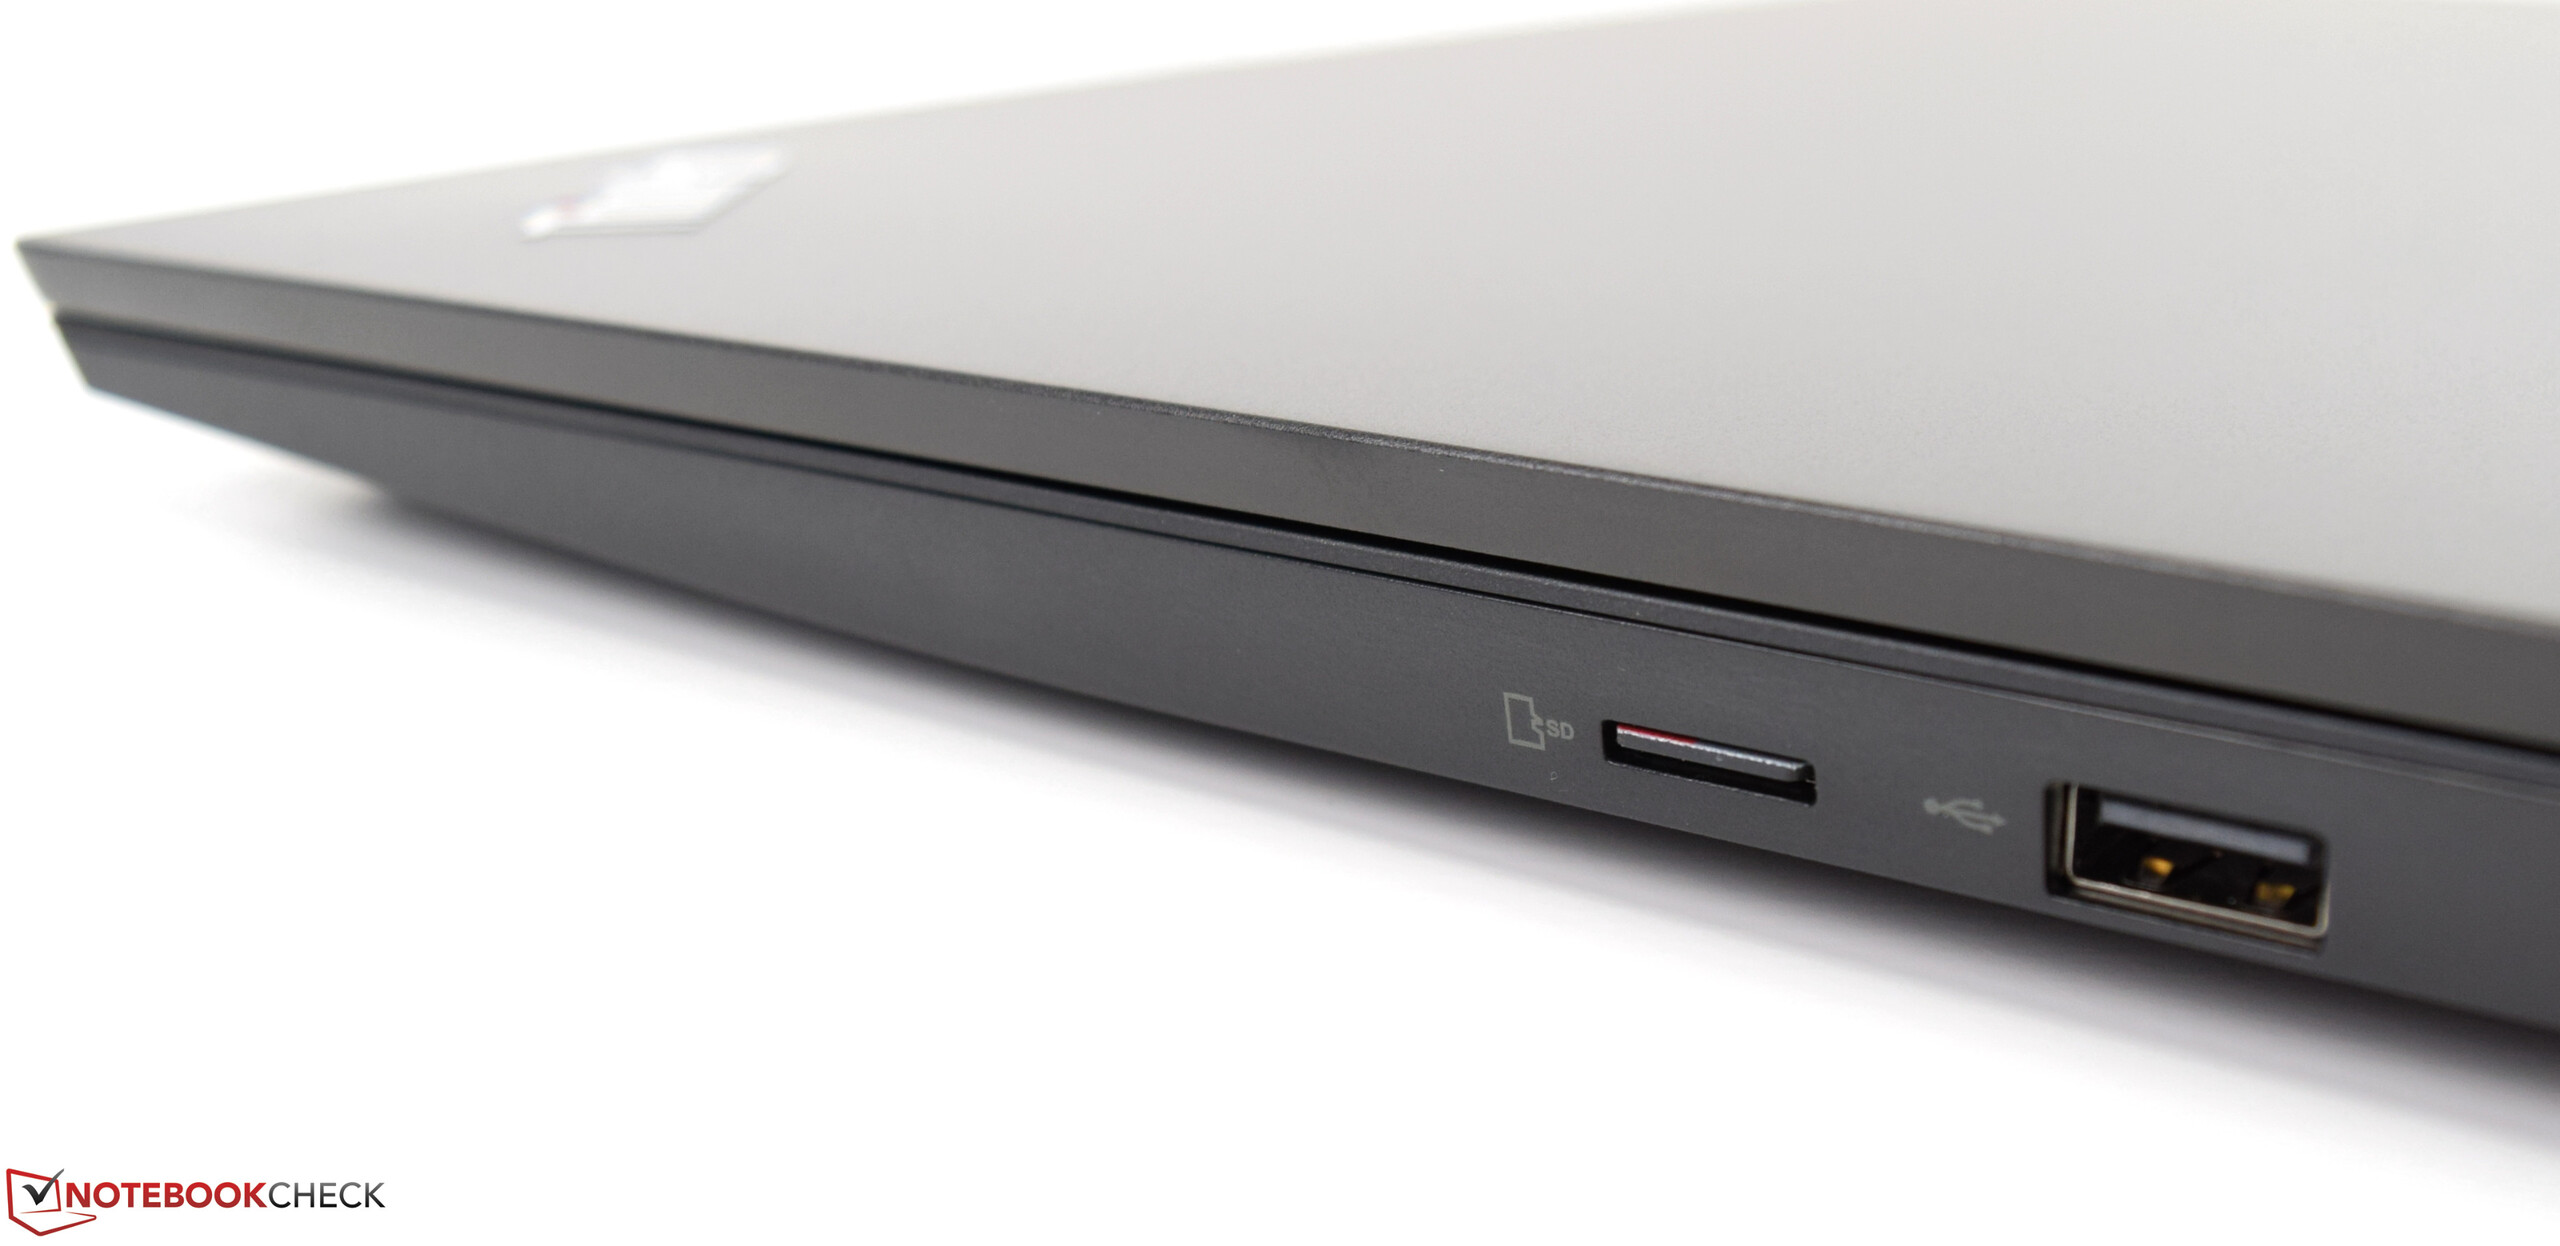
| SD Card Reader | |
| average JPG Copy Test (av. of 3 runs) | |
| Schenker Slim 15 L17 (Toshiba Exceria Pro SDXC 64 GB UHS-II) | |
| HP ProBook 450 G5-2UB53EA (Toshiba Exceria Pro SDXC 64 GB UHS-II) | |
| Lenovo ThinkPad E580-20KSCTO1WW (Toshiba Exceria Pro M501) | |
| Lenovo ThinkPad E580-20KS001RGE (Toshiba Exceria Pro SDXC 64 GB UHS-II) | |
| Gemiddelde van klas Office (19.8 - 198.5, n=22, laatste 2 jaar) | |
| Acer TravelMate P2510-M-51ZQ (Toshiba Exceria Pro SDXC 64 GB UHS-II) | |
| Dell Vostro 15 3568 (Toshiba Exceria Pro SDXC 64 GB UHS-II) | |
| maximum AS SSD Seq Read Test (1GB) | |
| HP ProBook 450 G5-2UB53EA (Toshiba Exceria Pro SDXC 64 GB UHS-II) | |
| Lenovo ThinkPad E580-20KSCTO1WW (Toshiba Exceria Pro M501) | |
| Schenker Slim 15 L17 (Toshiba Exceria Pro SDXC 64 GB UHS-II) | |
| Lenovo ThinkPad E580-20KS001RGE (Toshiba Exceria Pro SDXC 64 GB UHS-II) | |
| Gemiddelde van klas Office (27.4 - 249, n=21, laatste 2 jaar) | |
| Acer TravelMate P2510-M-51ZQ (Toshiba Exceria Pro SDXC 64 GB UHS-II) | |
| Dell Vostro 15 3568 (Toshiba Exceria Pro SDXC 64 GB UHS-II) | |
| Networking | |
| iperf3 transmit AX12 | |
| Acer TravelMate P2510-M-51ZQ | |
| Lenovo ThinkPad E570-20H6S02M00 | |
| Schenker Slim 15 L17 | |
| HP ProBook 450 G5-2UB53EA | |
| Lenovo ThinkPad E580-20KS001RGE | |
| Dell Vostro 15 3568 | |
| Lenovo ThinkPad E580-20KSCTO1WW | |
| iperf3 receive AX12 | |
| HP ProBook 450 G5-2UB53EA | |
| Schenker Slim 15 L17 | |
| Acer TravelMate P2510-M-51ZQ | |
| Lenovo ThinkPad E570-20H6S02M00 | |
| Dell Vostro 15 3568 | |
| Lenovo ThinkPad E580-20KSCTO1WW | |
| Lenovo ThinkPad E580-20KS001RGE | |
| |||||||||||||||||||||||||
Helderheidsverdeling: 84 %
Helderheid in Batterij-modus: 291 cd/m²
Contrast: 973:1 (Zwart: 0.3 cd/m²)
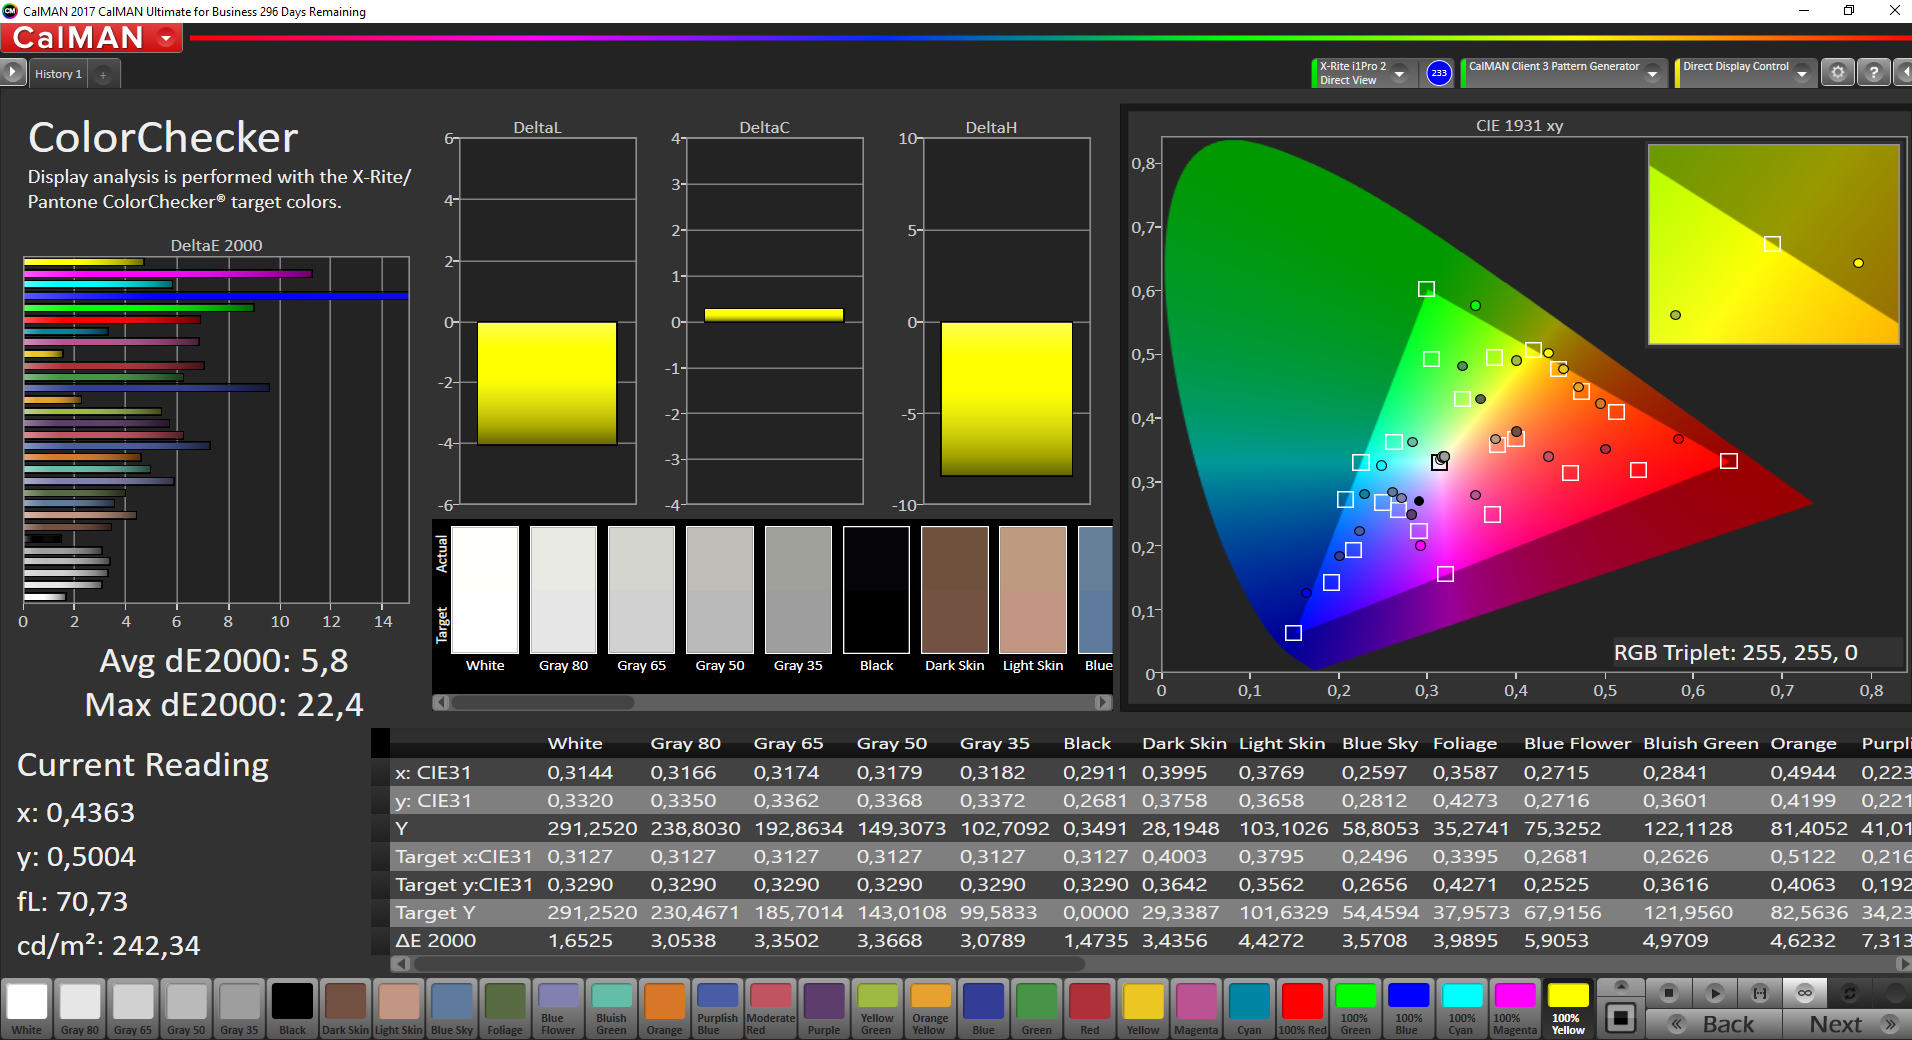
ΔE ColorChecker Calman: 5.8 | ∀{0.5-29.43 Ø4.71}
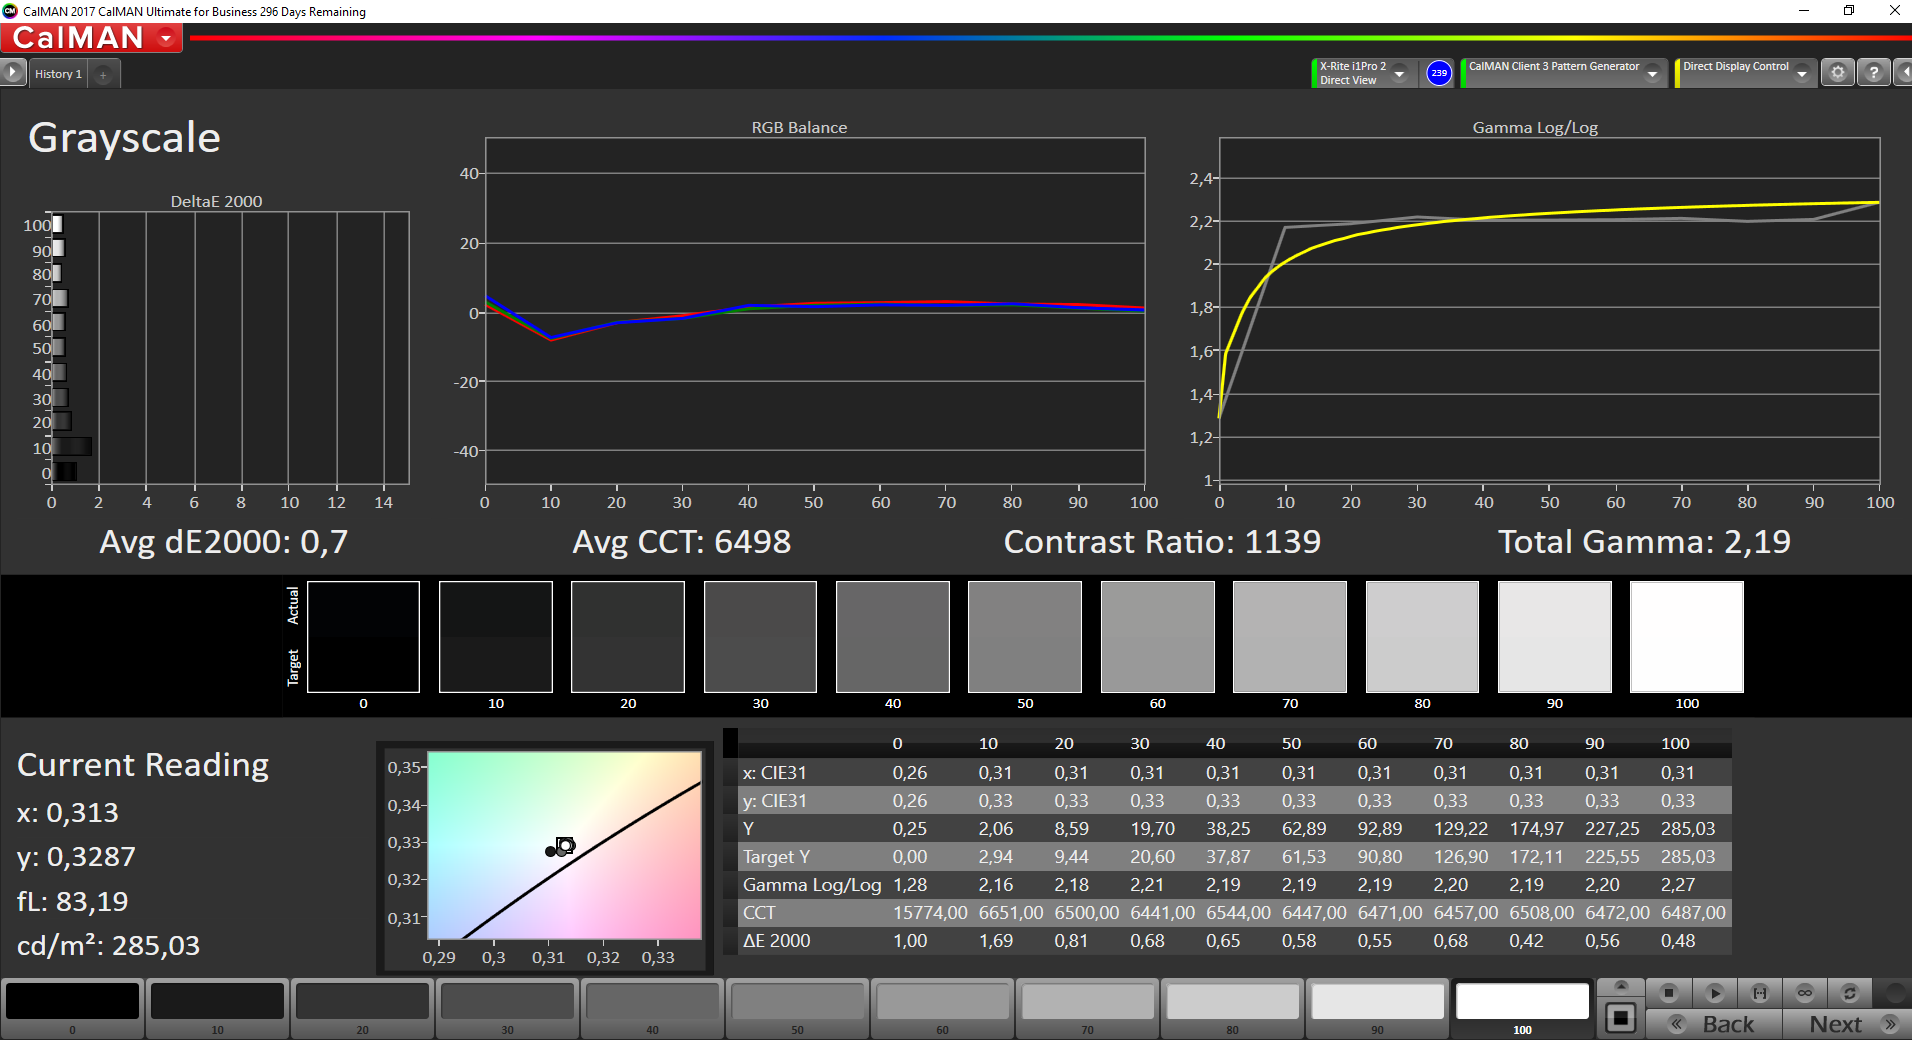
ΔE Greyscale Calman: 2.3 | ∀{0.09-98 Ø4.96}
58% sRGB (Argyll 1.6.3 3D)
37.6% AdobeRGB 1998 (Argyll 1.6.3 3D)
41.15% AdobeRGB 1998 (Argyll 3D)
58.5% sRGB (Argyll 3D)
39.83% Display P3 (Argyll 3D)
Gamma: 2.12
CCT: 6223 K
| Lenovo ThinkPad E580-20KSCTO1WW BOE NV156FHM-N49, , 1920x1080, 15.6" | Lenovo ThinkPad E580-20KS001RGE BOE NV156FHM-N49, , 1920x1080, 15.6" | Lenovo ThinkPad E570-20H6S02M00 Lenovo NT156WHM-N42, , 1366x768, 15.6" | HP ProBook 450 G5-2UB53EA AUO41ED, , 1920x1080, 15.6" | Acer TravelMate P2510-M-51ZQ Chi Mei CMN15D3 / N156HCE-EAA, , 1920x1080, 15.6" | Schenker Slim 15 L17 LG LP156WF6, , 1920x1080, 15.6" | Dell Vostro 15 3568 BOE0690 / NT15N41 / Dell C1JFR, , 1920x1080, 15.6" | |
|---|---|---|---|---|---|---|---|
| Display | -0% | -7% | -3% | 7% | 50% | -0% | |
| Display P3 Coverage (%) | 39.83 | 40 0% | 36.79 -8% | 38.04 -4% | 42.44 7% | 63.9 60% | 39.39 -1% |
| sRGB Coverage (%) | 58.5 | 58.2 -1% | 55.4 -5% | 57.3 -2% | 63.2 8% | 82.8 42% | 59.3 1% |
| AdobeRGB 1998 Coverage (%) | 41.15 | 41.32 0% | 38.01 -8% | 39.31 -4% | 43.94 7% | 60.5 47% | 40.69 -1% |
| Response Times | 8% | 35% | -2% | 11% | 20% | 45% | |
| Response Time Grey 50% / Grey 80% * (ms) | 48.4 ? | 48 ? 1% | 46 ? 5% | 52.4 ? -8% | 45 ? 7% | 40 ? 17% | 39 ? 19% |
| Response Time Black / White * (ms) | 37.6 ? | 32 ? 15% | 13 ? 65% | 36 ? 4% | 32 ? 15% | 29.2 ? 22% | 11 ? 71% |
| PWM Frequency (Hz) | 22030 ? | 25000 ? | 200 ? | 25000 ? | 20660 ? | 28410 ? | |
| Screen | 13% | -76% | -18% | -11% | 17% | -74% | |
| Brightness middle (cd/m²) | 292 | 290 -1% | 242 -17% | 252 -14% | 215 -26% | 333 14% | 195 -33% |
| Brightness (cd/m²) | 272 | 267 -2% | 233 -14% | 249 -8% | 198 -27% | 336 24% | 195 -28% |
| Brightness Distribution (%) | 84 | 81 -4% | 73 -13% | 88 5% | 78 -7% | 93 11% | 89 6% |
| Black Level * (cd/m²) | 0.3 | 0.19 37% | 0.59 -97% | 0.22 27% | 0.32 -7% | 0.3 -0% | 0.44 -47% |
| Contrast (:1) | 973 | 1526 57% | 410 -58% | 1145 18% | 672 -31% | 1110 14% | 443 -54% |
| Colorchecker dE 2000 * | 5.8 | 4.9 16% | 10.9 -88% | 6.9 -19% | 5.15 11% | 4.7 19% | 12.23 -111% |
| Colorchecker dE 2000 max. * | 22.4 | 9.52 57% | 20.84 7% | 18.4 18% | 10.89 51% | 9.7 57% | 20.85 7% |
| Greyscale dE 2000 * | 2.3 | 2.92 -27% | 13.07 -468% | 6.9 -200% | 4.25 -85% | 3.5 -52% | 13.39 -482% |
| Gamma | 2.12 104% | 2.31 95% | 2.37 93% | 2.43 91% | 2.61 84% | 2.26 97% | 2.5 88% |
| CCT | 6223 104% | 6091 107% | 13123 50% | 7524 86% | 6603 98% | 6339 103% | 15759 41% |
| Color Space (Percent of AdobeRGB 1998) (%) | 37.6 | 37 -2% | 35 -7% | 36.3 -3% | 40 6% | 54.2 44% | 38 1% |
| Color Space (Percent of sRGB) (%) | 58 | 58 0% | 55 -5% | 57.2 -1% | 63 9% | 82.7 43% | 59 2% |
| Totaal Gemiddelde (Programma / Instellingen) | 7% /
10% | -16% /
-47% | -8% /
-13% | 2% /
-4% | 29% /
24% | -10% /
-43% |
* ... kleiner is beter


Responstijd Scherm
| ↔ Responstijd Zwart naar Wit | ||
|---|---|---|
| 37.6 ms ... stijging ↗ en daling ↘ gecombineerd | ↗ 21.2 ms stijging | 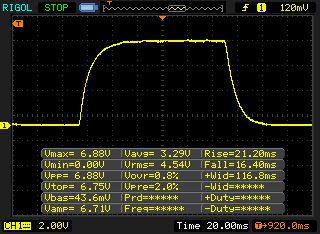 |
| ↘ 16.4 ms daling | ||
| Het scherm vertoonde trage responstijden in onze tests en is misschien te traag voor games. Ter vergelijking: alle testtoestellen variëren van 0.1 (minimum) tot 240 (maximum) ms. » 95 % van alle toestellen zijn beter. Dit betekent dat de gemeten responstijd slechter is dan het gemiddelde (19.8 ms) van alle geteste toestellen. | ||
| ↔ Responstijd 50% Grijs naar 80% Grijs | ||
| 48.4 ms ... stijging ↗ en daling ↘ gecombineerd | ↗ 25.6 ms stijging | 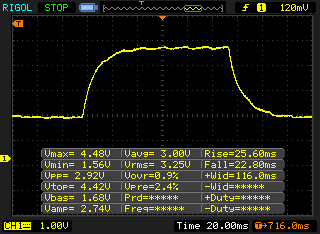 |
| ↘ 22.8 ms daling | ||
| Het scherm vertoonde trage responstijden in onze tests en is misschien te traag voor games. Ter vergelijking: alle testtoestellen variëren van 0.165 (minimum) tot 636 (maximum) ms. » 84 % van alle toestellen zijn beter. Dit betekent dat de gemeten responstijd slechter is dan het gemiddelde (31 ms) van alle geteste toestellen. | ||
Screen Flickering / PWM (Pulse-Width Modulation)
| Screen flickering / PWM waargenomen | 22030 Hz | ≤ 99 % helderheid instelling | 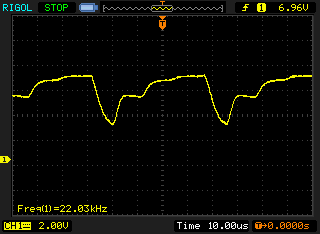 |
De achtergrondverlichting van het scherm flikkert op 22030 Hz (in het slechtste geval, bijvoorbeeld bij gebruik van PWM) aan een helderheid van 99 % en lager. Boven deze helderheid zou er geen flickering / PWM mogen optreden. De frequentie van 22030 Hz is redelijk hoog en de meeste mensen die gevoelig zijn aan flickering zouden dit dus niet mogen waarnemen of geïrriteerde ogen krijgen. Ter vergelijking: 52 % van alle geteste toestellen maakten geen gebruik van PWM om de schermhelderheid te verlagen. Als het wel werd gebruikt, werd een gemiddelde van 7754 (minimum: 5 - maximum: 343500) Hz waargenomen. | |||
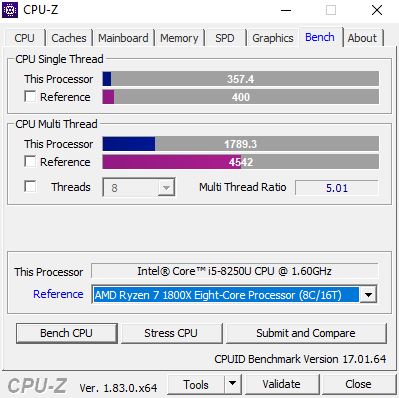
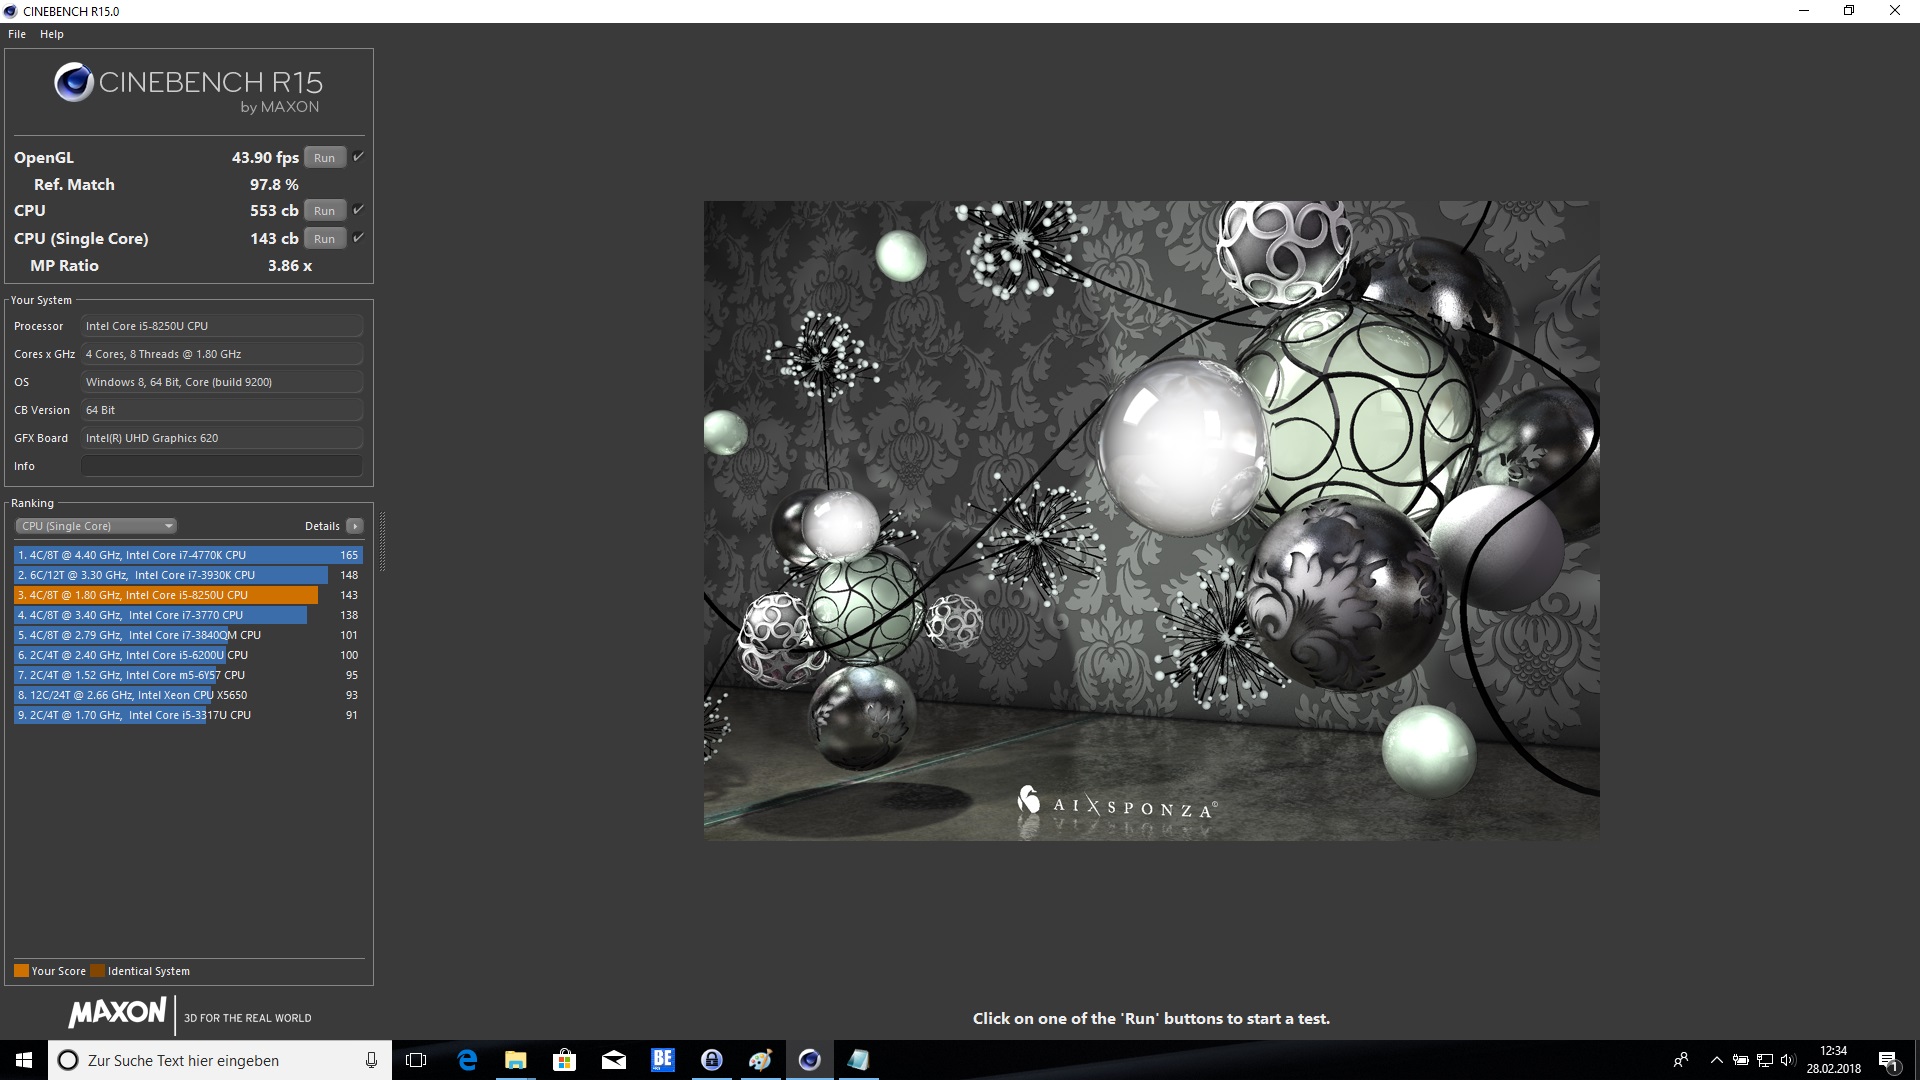
| Cinebench R11.5 | |
| CPU Single 64Bit | |
| Gemiddelde van klas Office (2 - 3.6, n=14, laatste 2 jaar) | |
| Schenker Slim 15 L17 | |
| Lenovo ThinkPad E580-20KSCTO1WW | |
| Gemiddeld Intel Core i5-8250U (0.91 - 1.79, n=35) | |
| Lenovo ThinkPad E570-20H6S02M00 | |
| CPU Multi 64Bit | |
| Gemiddelde van klas Office (9.76 - 31.5, n=14, laatste 2 jaar) | |
| Gemiddeld Intel Core i5-8250U (3.15 - 7.76, n=35) | |
| Lenovo ThinkPad E580-20KSCTO1WW | |
| Schenker Slim 15 L17 | |
| Lenovo ThinkPad E570-20H6S02M00 | |
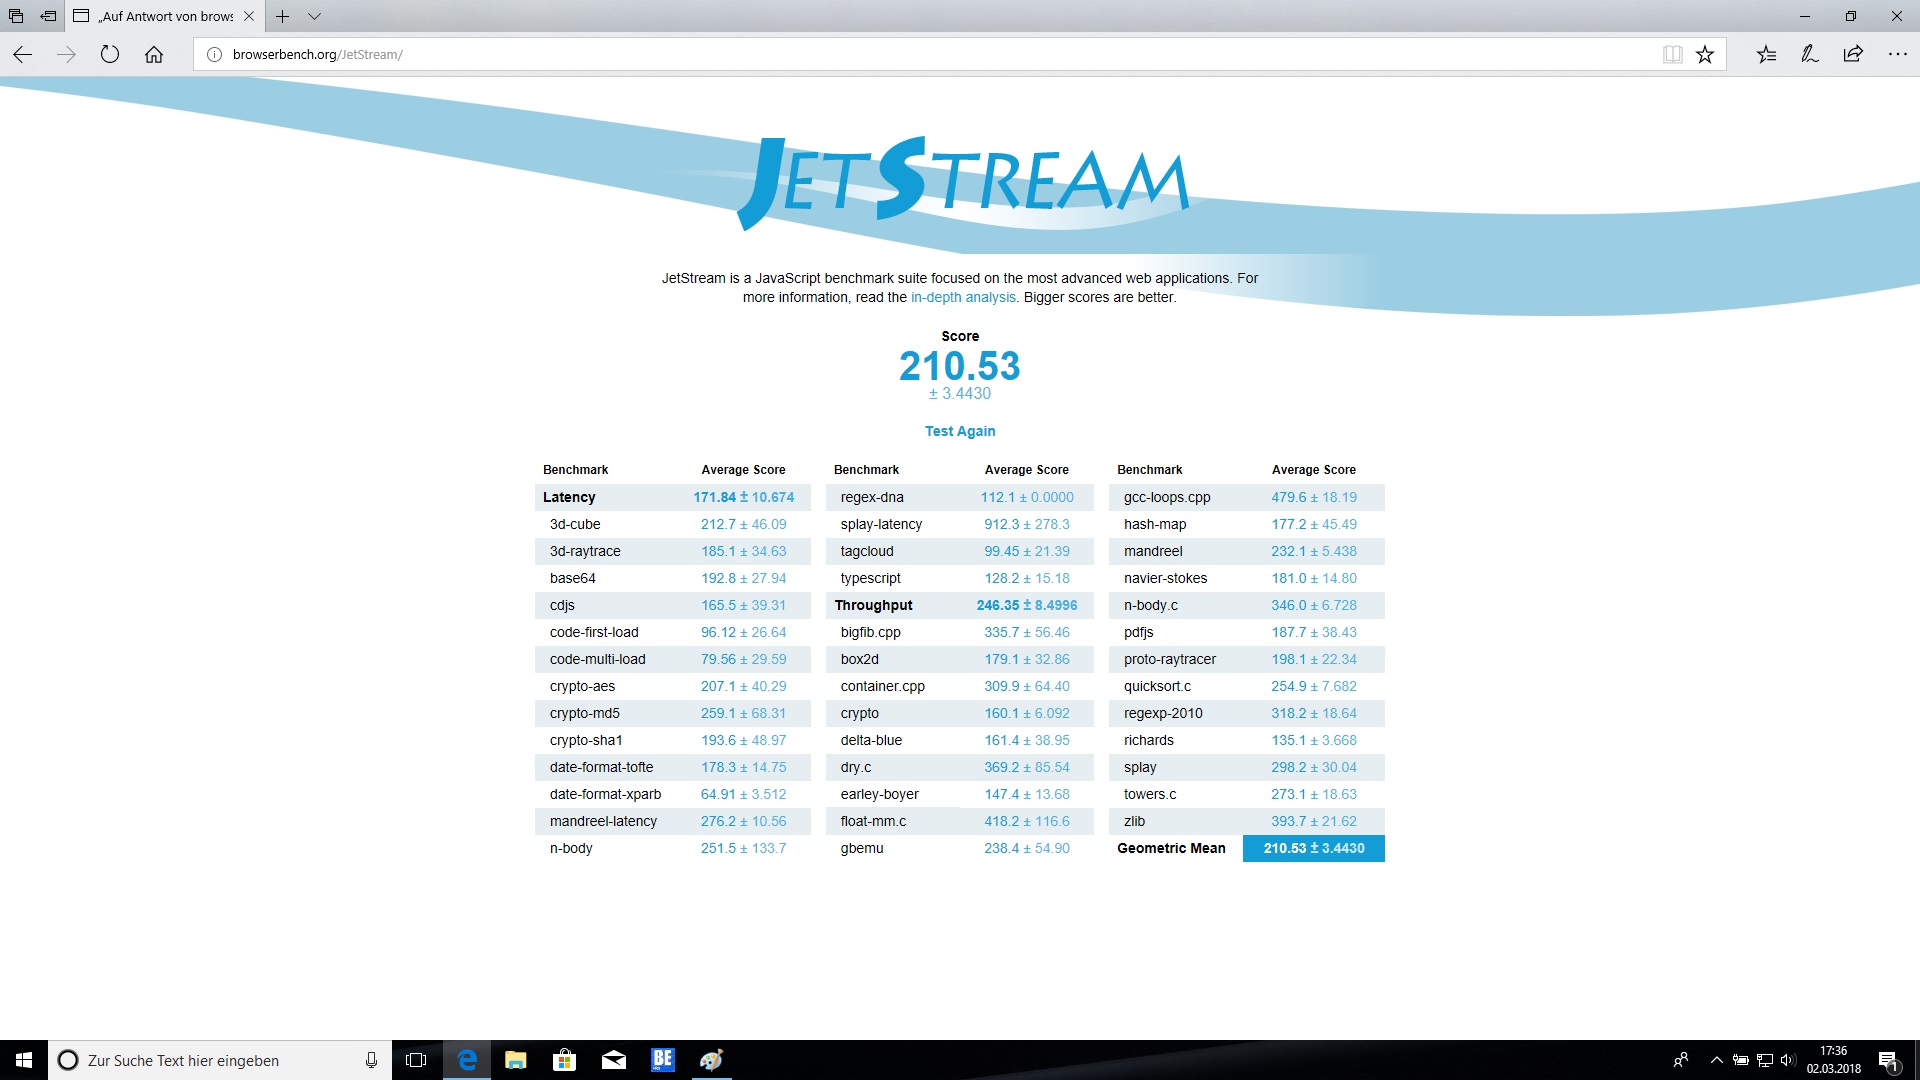
| JetStream 1.1 - 1.1 Total | |
| Lenovo ThinkPad E580-20KS001RGE | |
| Schenker Slim 15 L17 | |
| HP ProBook 450 G5-2UB53EA | |
| Gemiddeld Intel Core i5-8250U (151.5 - 256, n=78) | |
| Lenovo ThinkPad E570-20H6S02M00 | |
| Lenovo ThinkPad E580-20KSCTO1WW | |
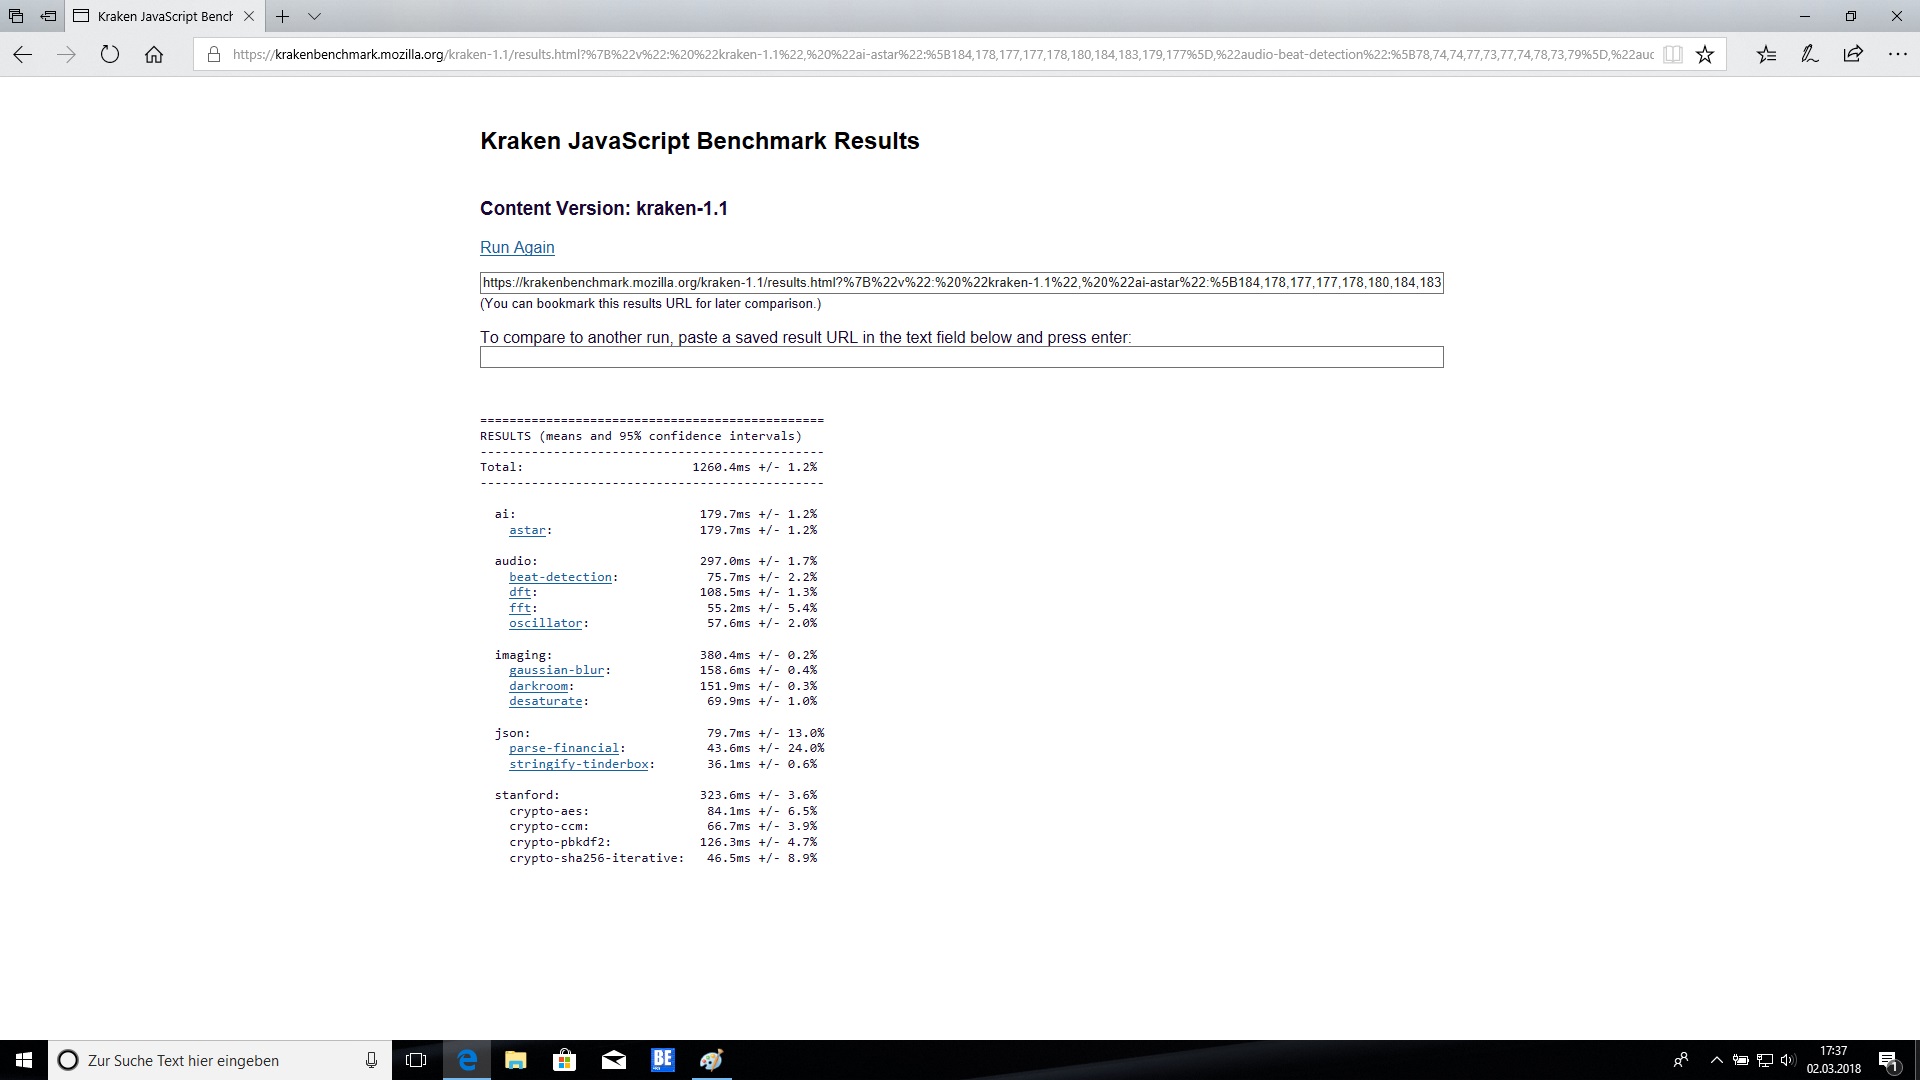
| Mozilla Kraken 1.1 - Total | |
| Lenovo ThinkPad E580-20KSCTO1WW | |
| Gemiddeld Intel Core i5-8250U (986 - 1532, n=59) | |
| Lenovo ThinkPad E570-20H6S02M00 | |
| Schenker Slim 15 L17 | |
| Lenovo ThinkPad E580-20KS001RGE | |
| Gemiddelde van klas Office (391 - 1297, n=78, laatste 2 jaar) | |
* ... kleiner is beter
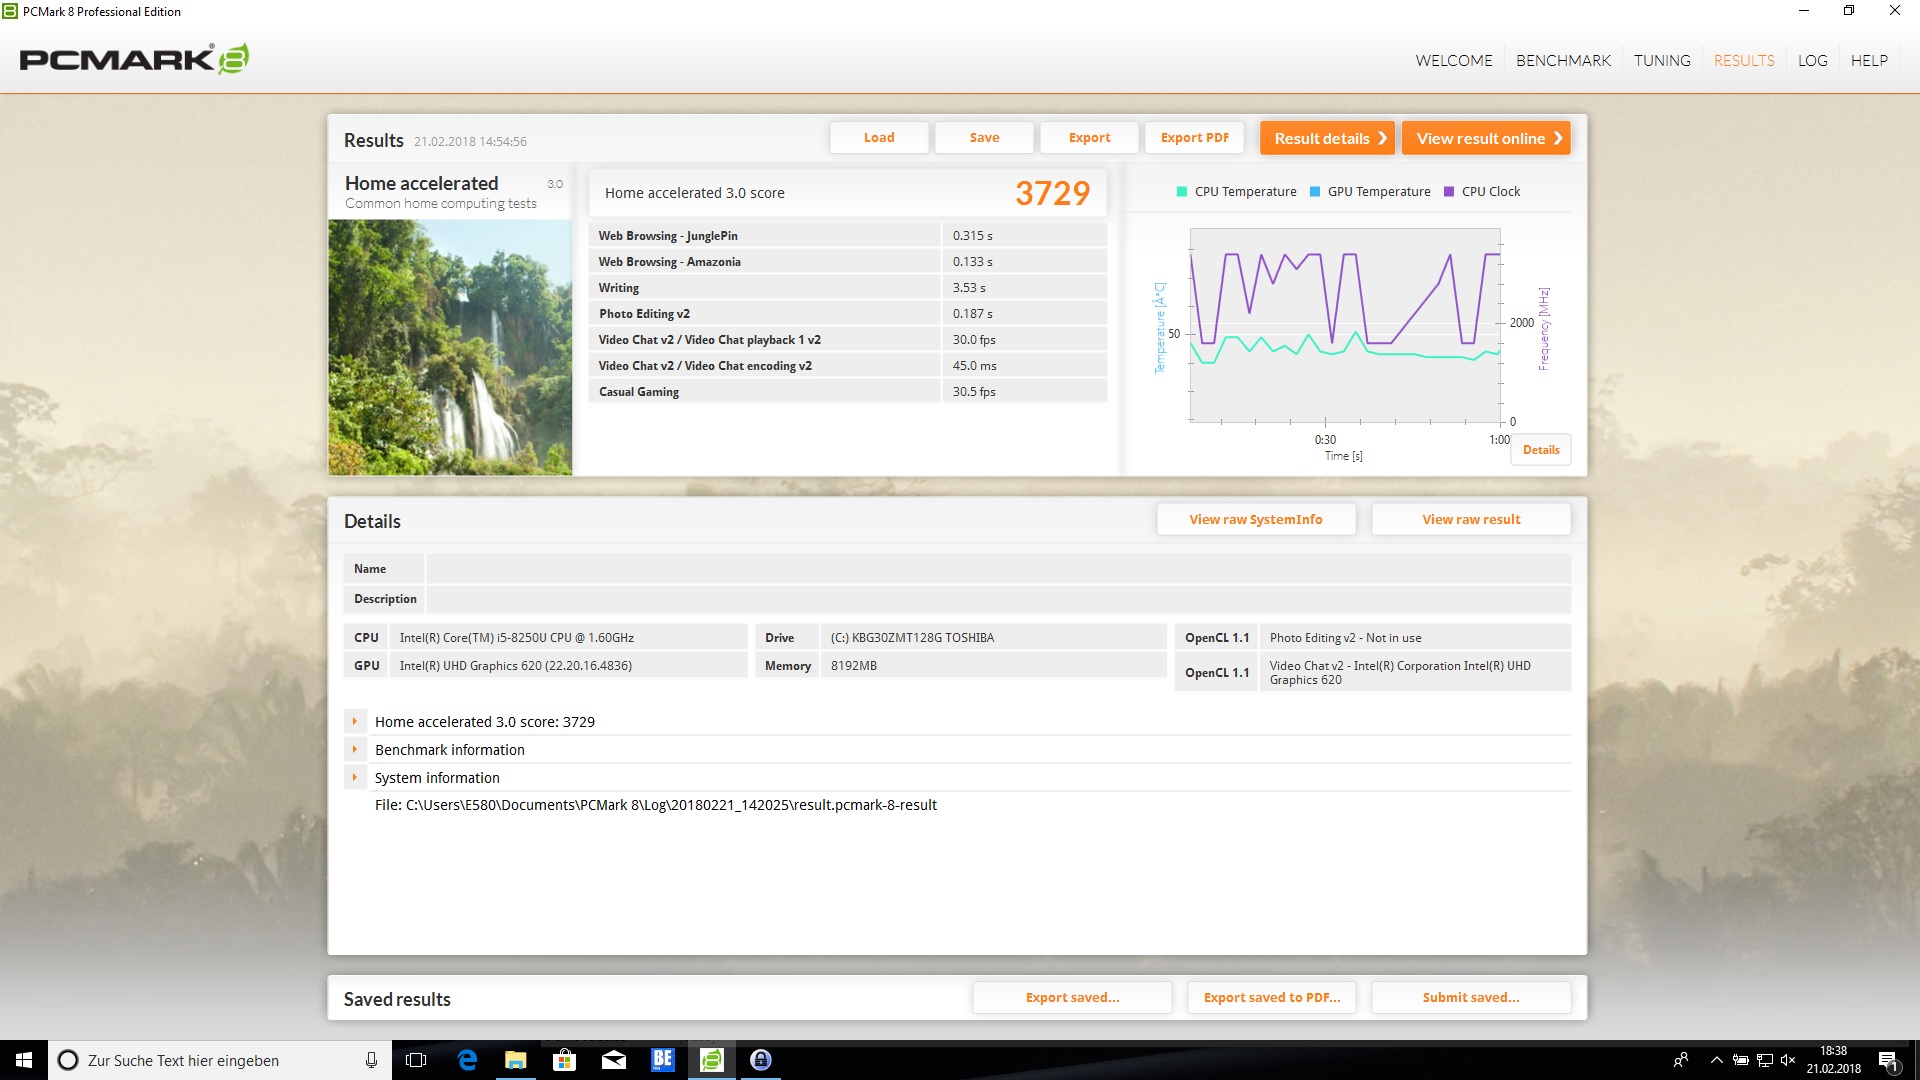
| PCMark 8 Home Score Accelerated v2 | 3729 punten | |
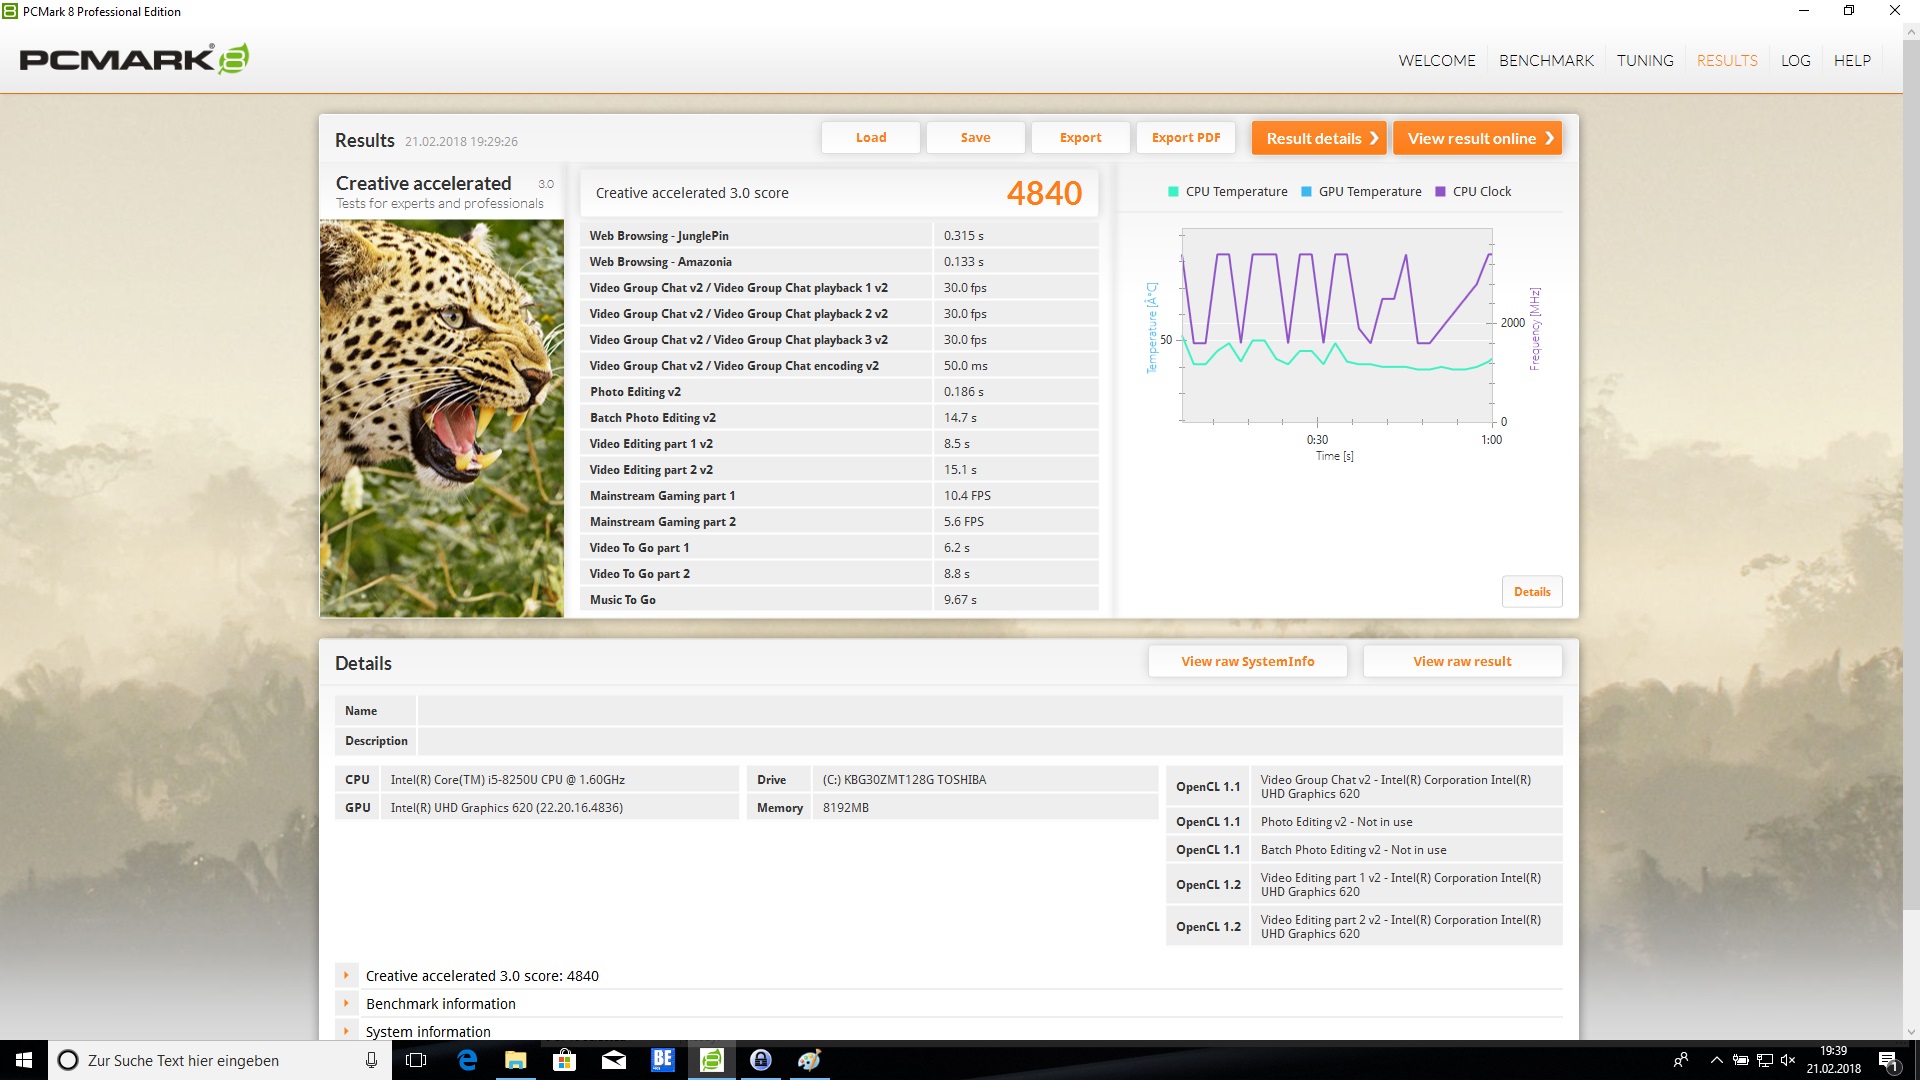
| PCMark 8 Creative Score Accelerated v2 | 4840 punten | |
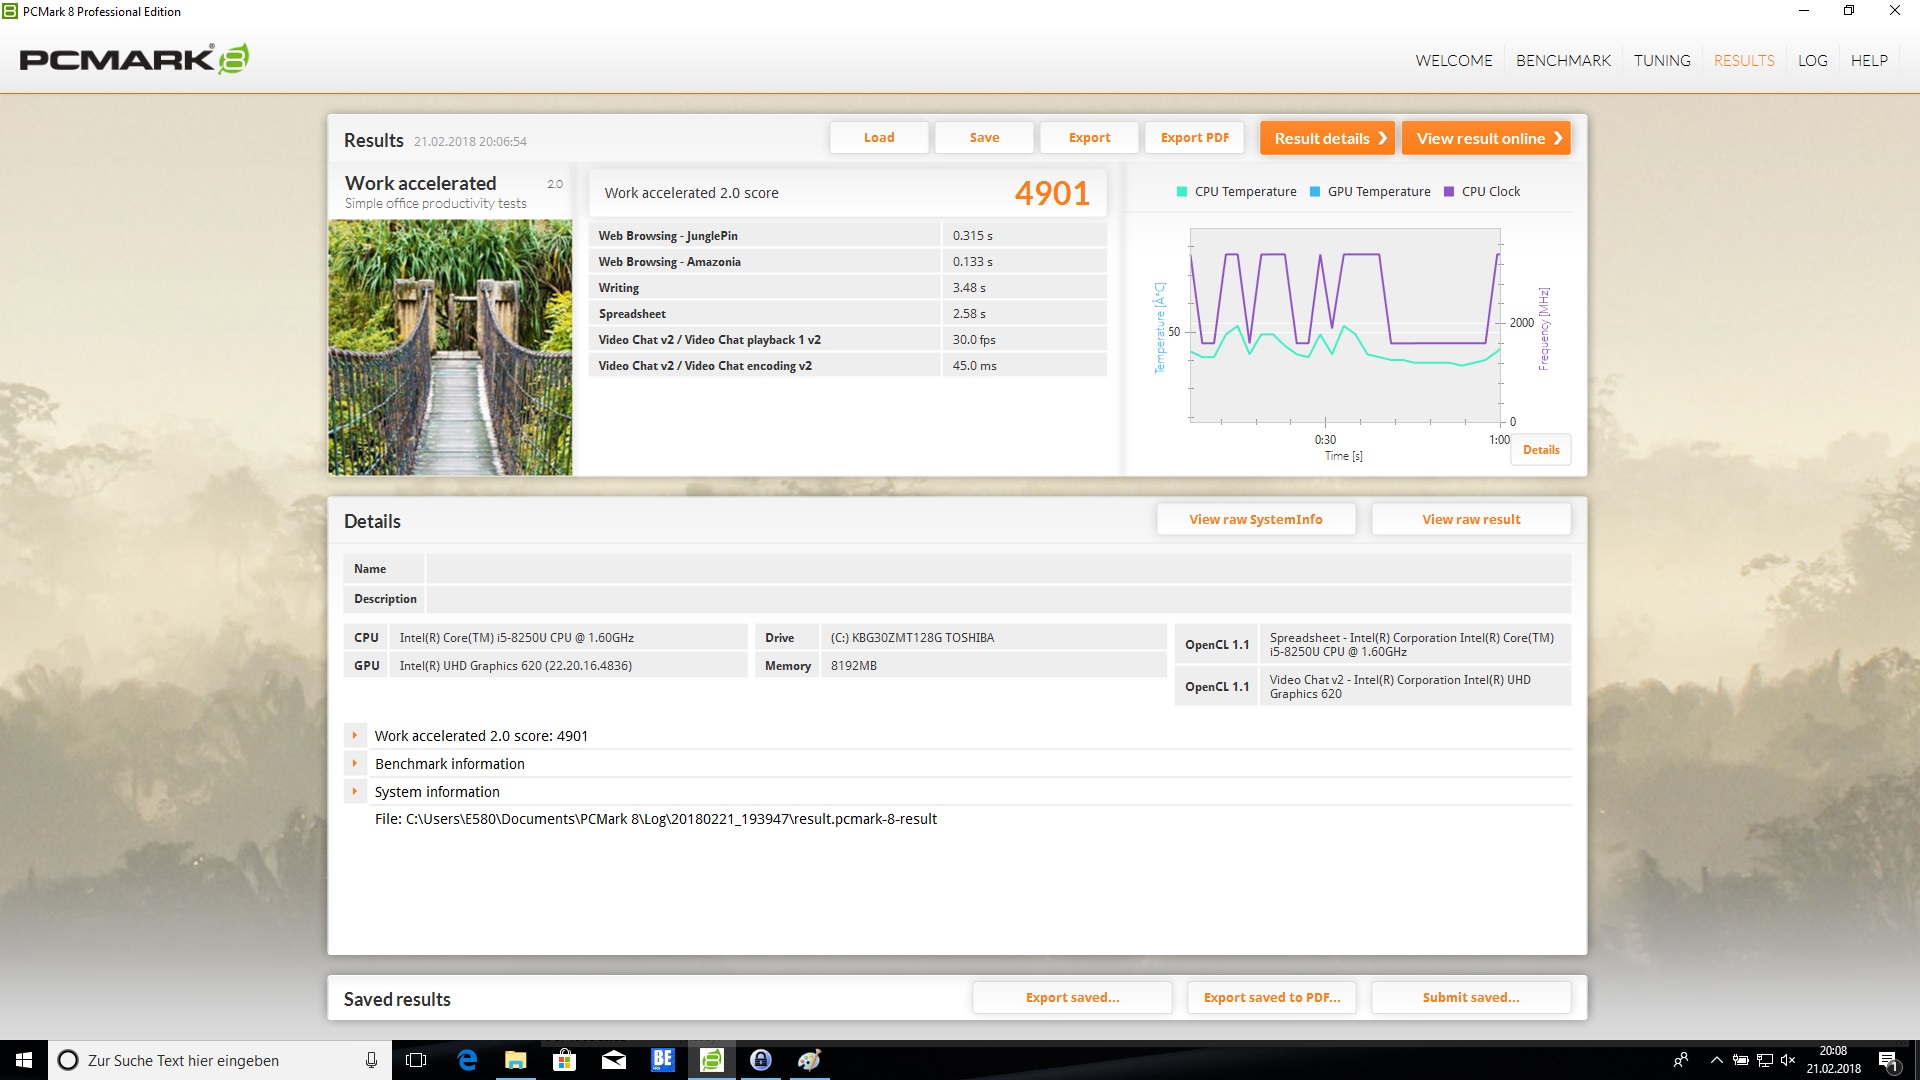
| PCMark 8 Work Score Accelerated v2 | 4901 punten | |
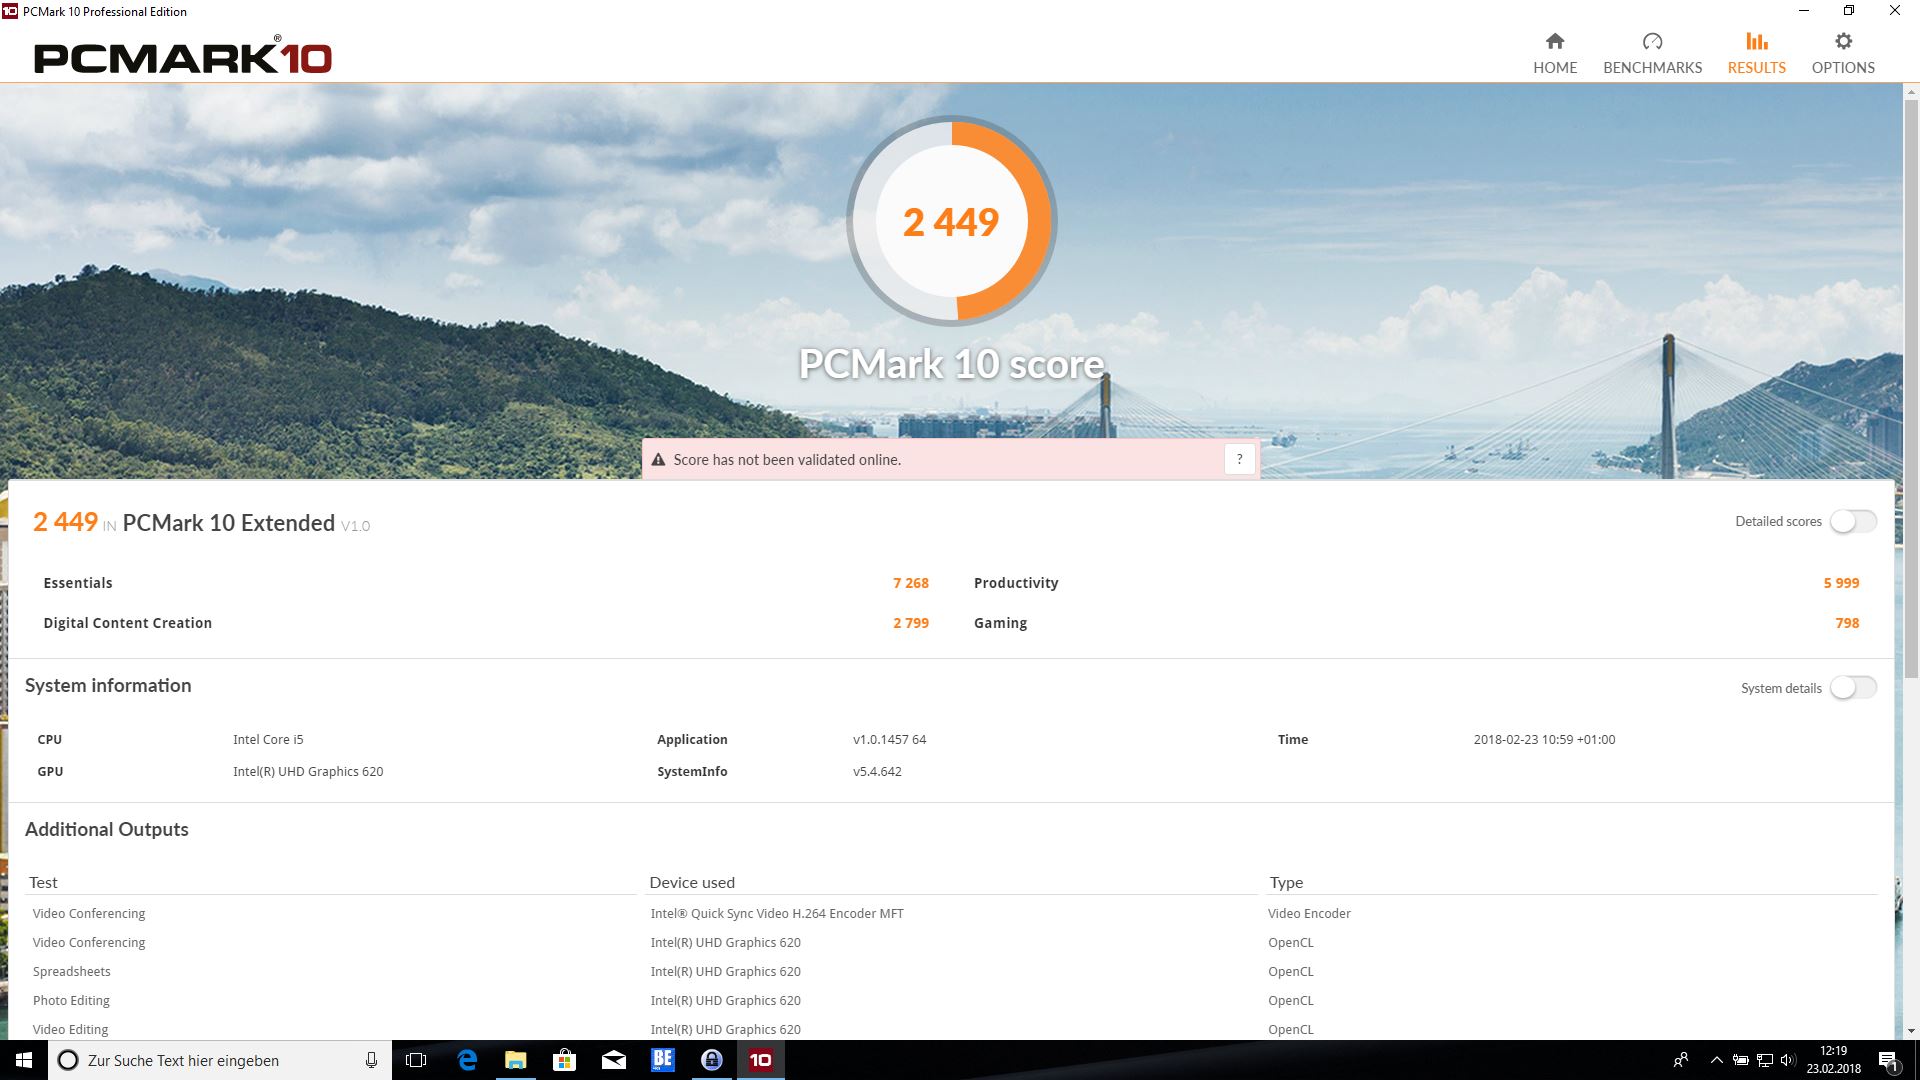
| PCMark 10 Score | 2449 punten | |
Help | ||
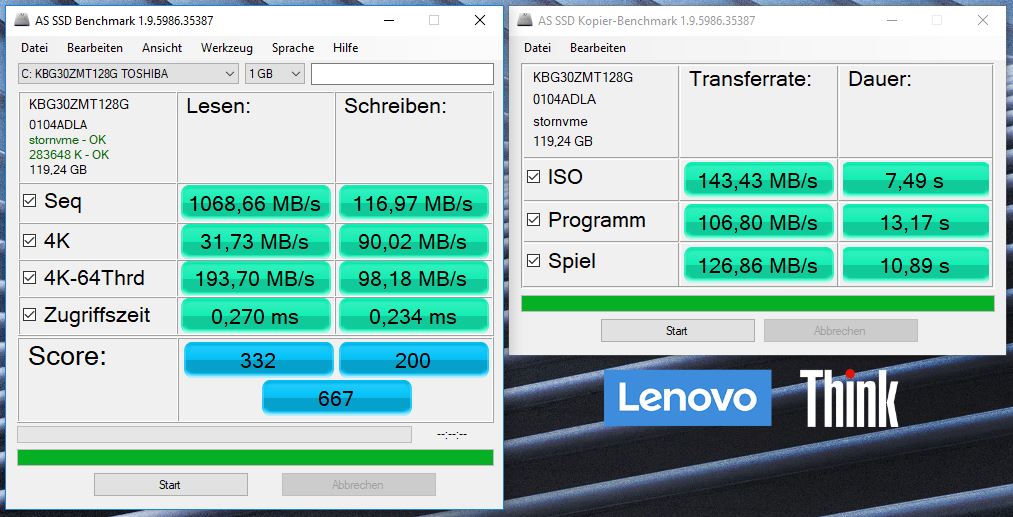
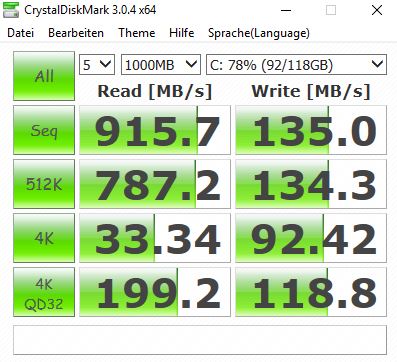
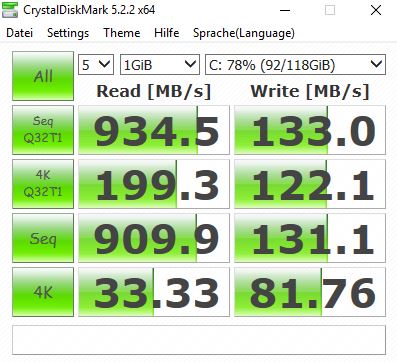
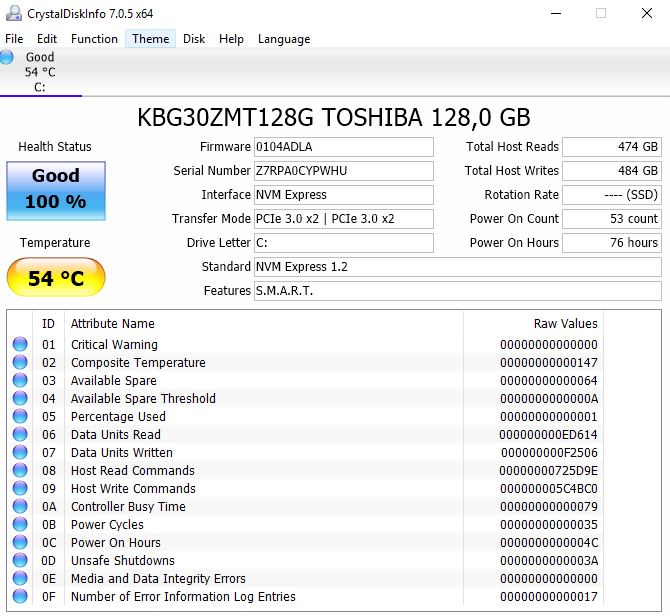
| Lenovo ThinkPad E580-20KSCTO1WW Toshiba KBG30ZMT128G | Lenovo ThinkPad E580-20KS001RGE Lenovo LENSE20256GMSP34MEAT2TA | Lenovo ThinkPad E570-20H6S02M00 Samsung PM961 MZVLW256HEHP | HP ProBook 450 G5-2UB53EA SanDisk SD8SN8U256G1006 | Acer TravelMate P2510-M-51ZQ SK Hynix HFS256G39TND-N210A | Schenker Slim 15 L17 Samsung SSD 960 Pro 512 GB m.2 | Dell Vostro 15 3568 Micron 1100 MTFDDAV256TBN | |
|---|---|---|---|---|---|---|---|
| CrystalDiskMark 3.0 | 53% | 243% | 32% | 34% | 345% | -4% | |
| Read Seq (MB/s) | 916 | 1280 40% | 1589 73% | 502 -45% | 498.1 -46% | 1958 114% | 469.3 -49% |
| Write Seq (MB/s) | 135 | 639 373% | 1217 801% | 451.6 235% | 260.1 93% | 1776 1216% | 179.7 33% |
| Read 512 (MB/s) | 787 | 1011 28% | 1155 47% | 372.5 -53% | 328.5 -58% | 819 4% | 359.6 -54% |
| Write 512 (MB/s) | 134.3 | 115.4 -14% | 783 483% | 269.7 101% | 260.9 94% | 1157 762% | 183.7 37% |
| Read 4k (MB/s) | 33.34 | 30.87 -7% | 59.7 79% | 27.76 -17% | 32.59 -2% | 54 62% | 26.01 -22% |
| Write 4k (MB/s) | 92.4 | 72.6 -21% | 148.8 61% | 52.4 -43% | 84.2 -9% | 157.7 71% | 68.7 -26% |
| Read 4k QD32 (MB/s) | 199.2 | 257.3 29% | 473.6 138% | 260.2 31% | 359.7 81% | 605 204% | 242.4 22% |
| Write 4k QD32 (MB/s) | 118.8 | 118.2 -1% | 428.7 261% | 177.7 50% | 262 121% | 511 330% | 147.1 24% |

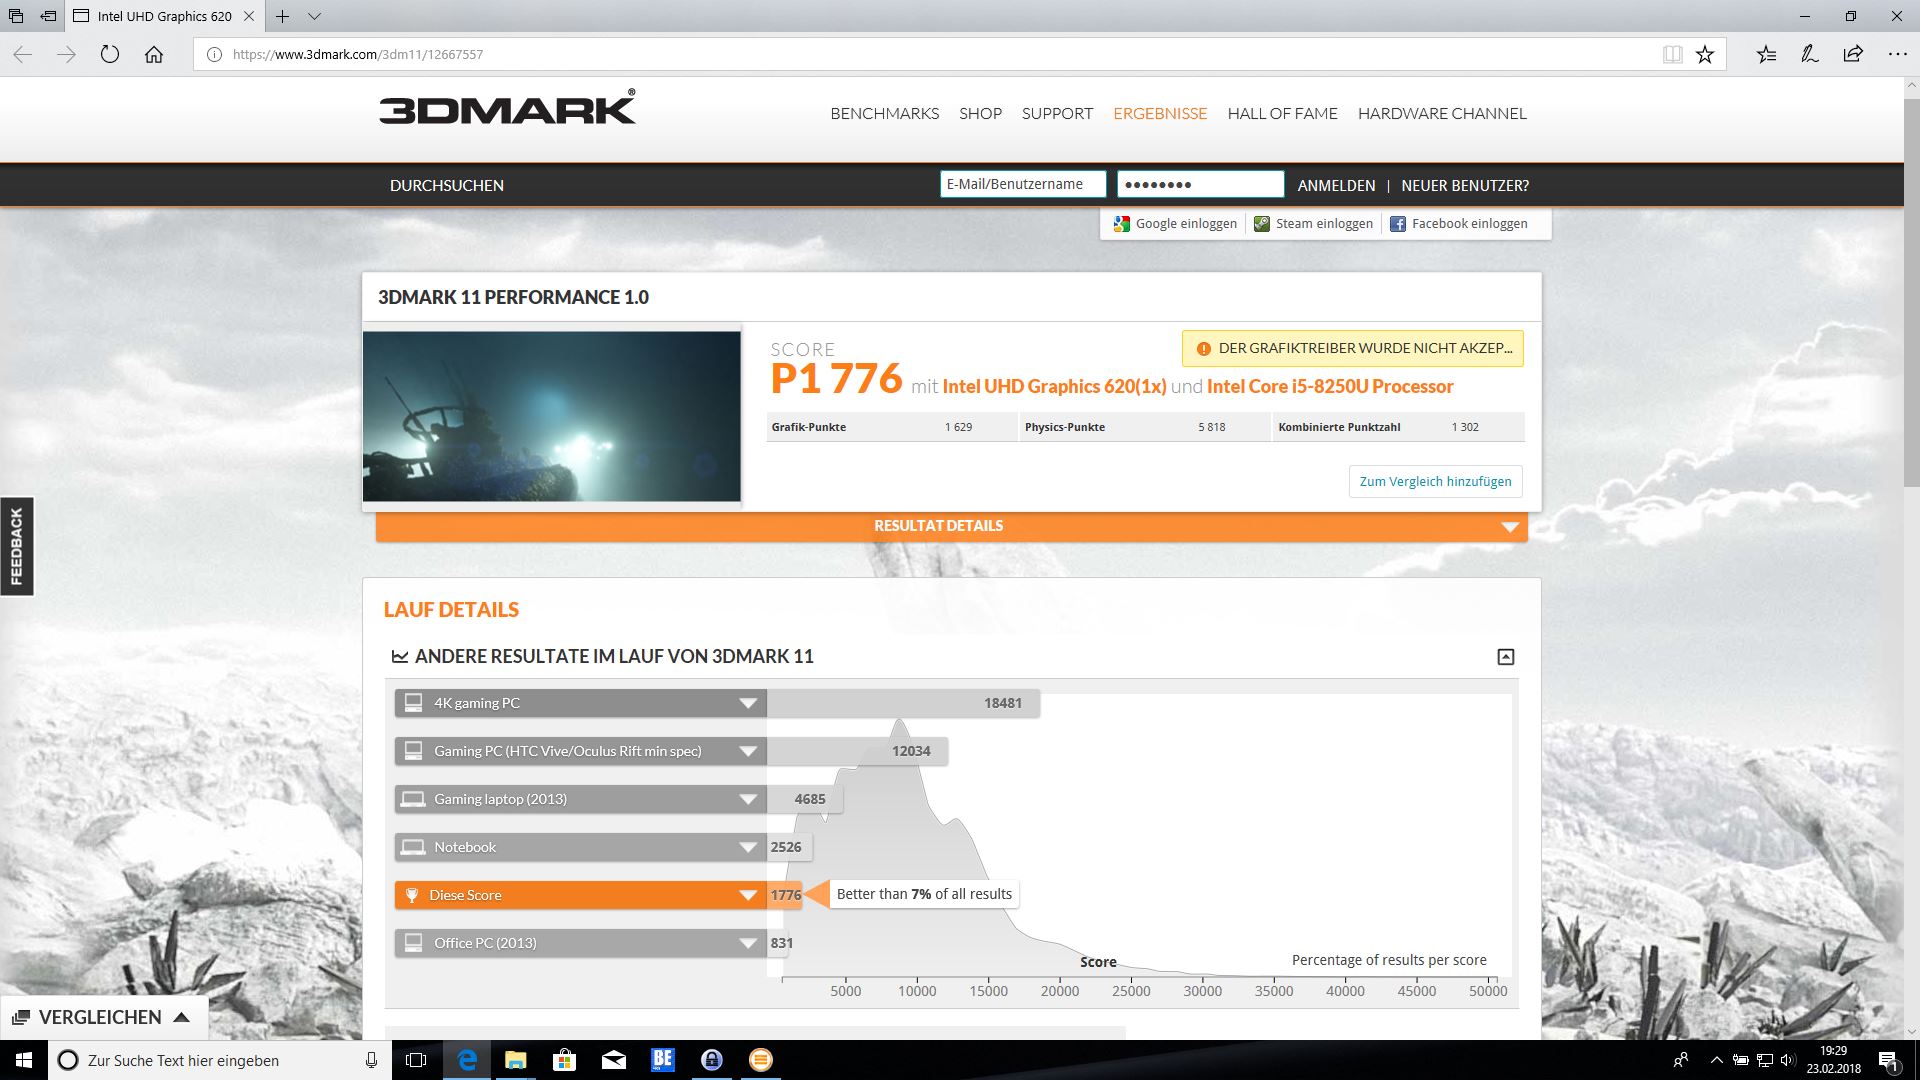
| 3DMark 11 Performance | 1776 punten | |
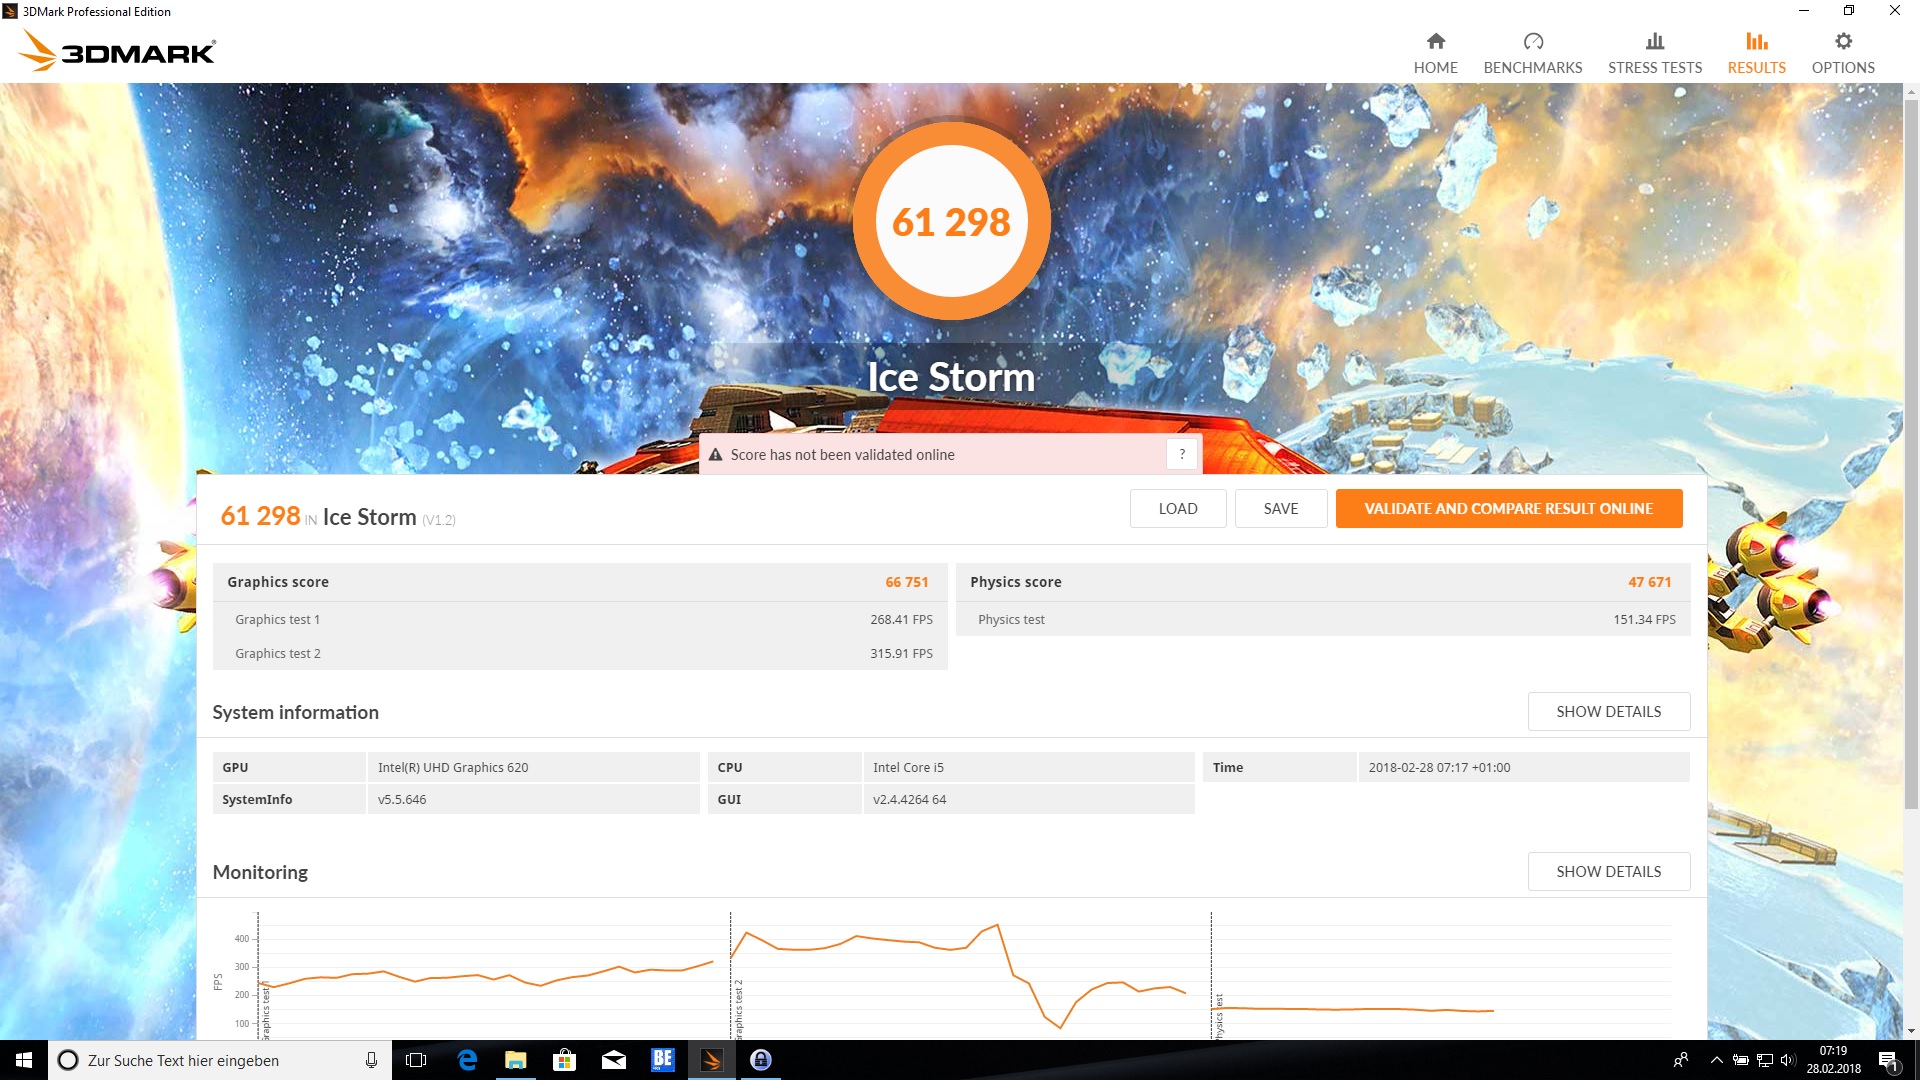
| 3DMark Ice Storm Standard Score | 61298 punten | |
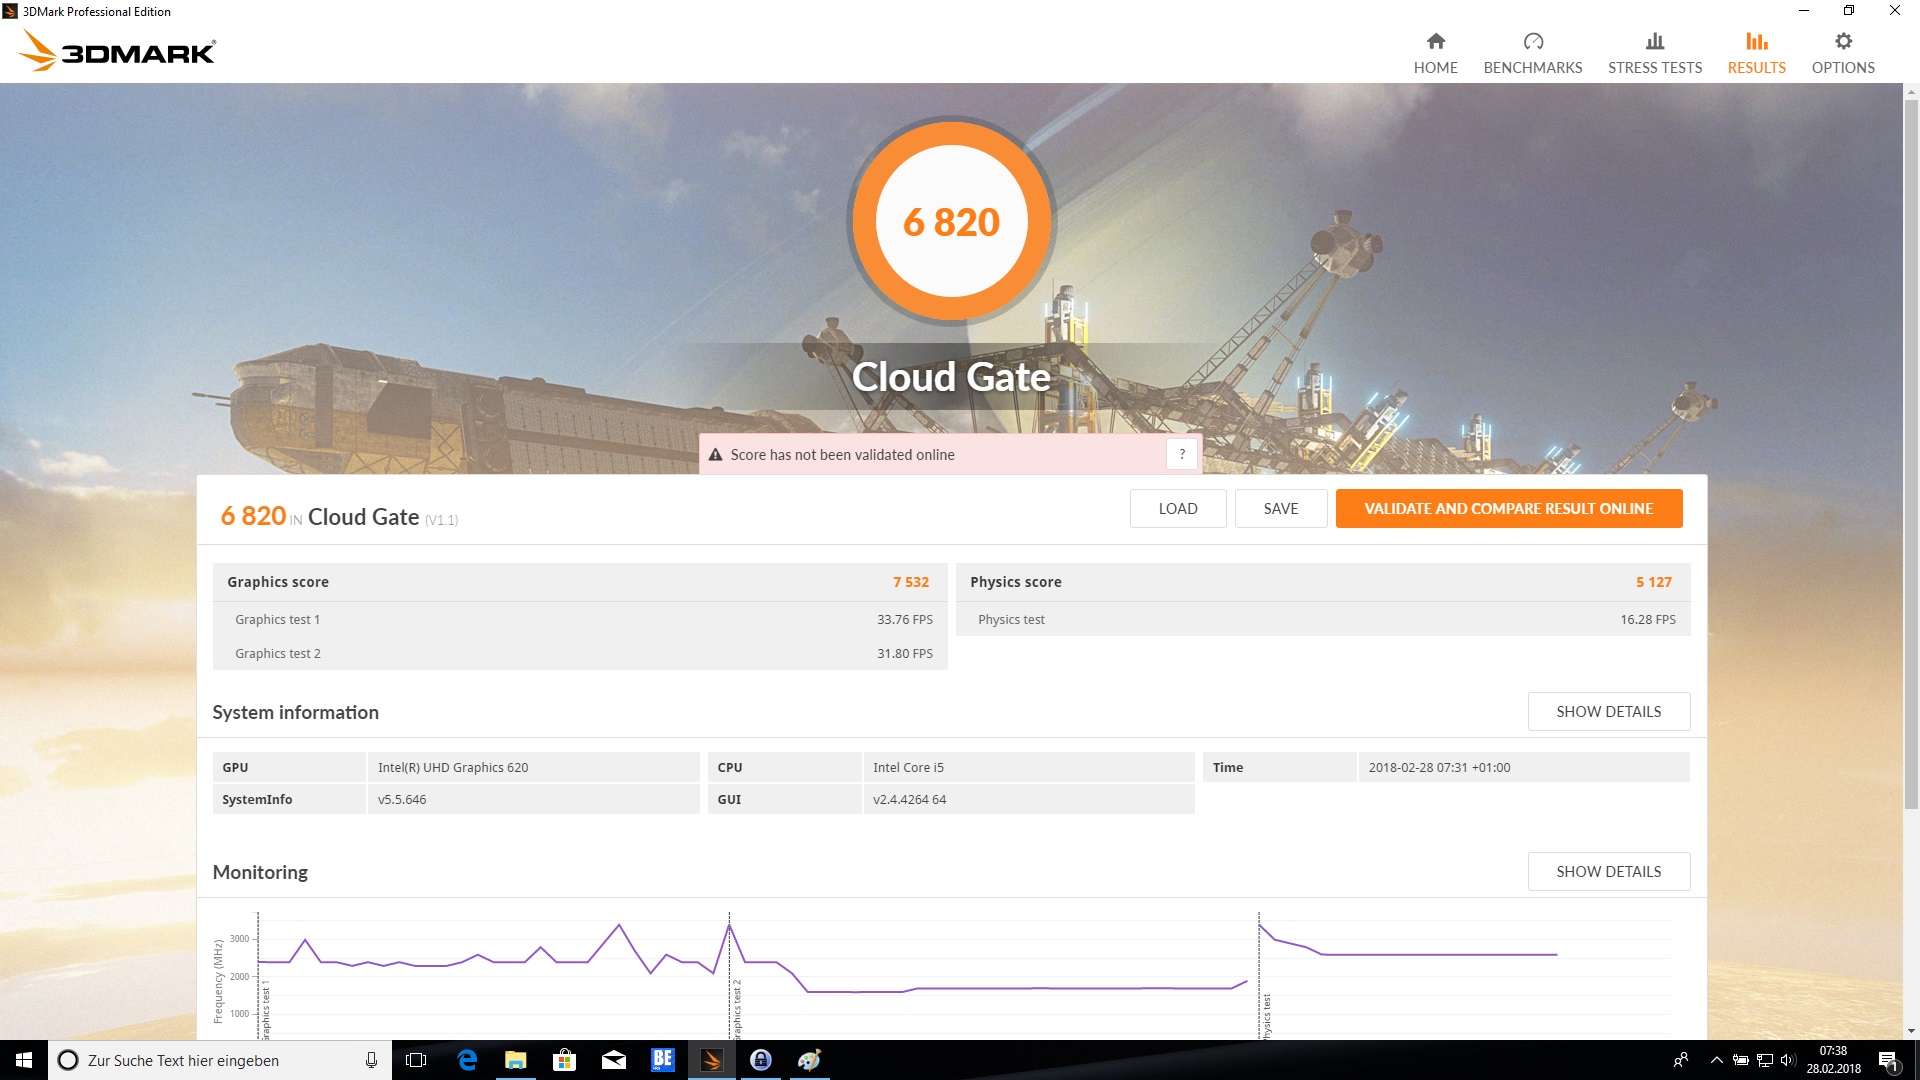
| 3DMark Cloud Gate Standard Score | 6820 punten | |
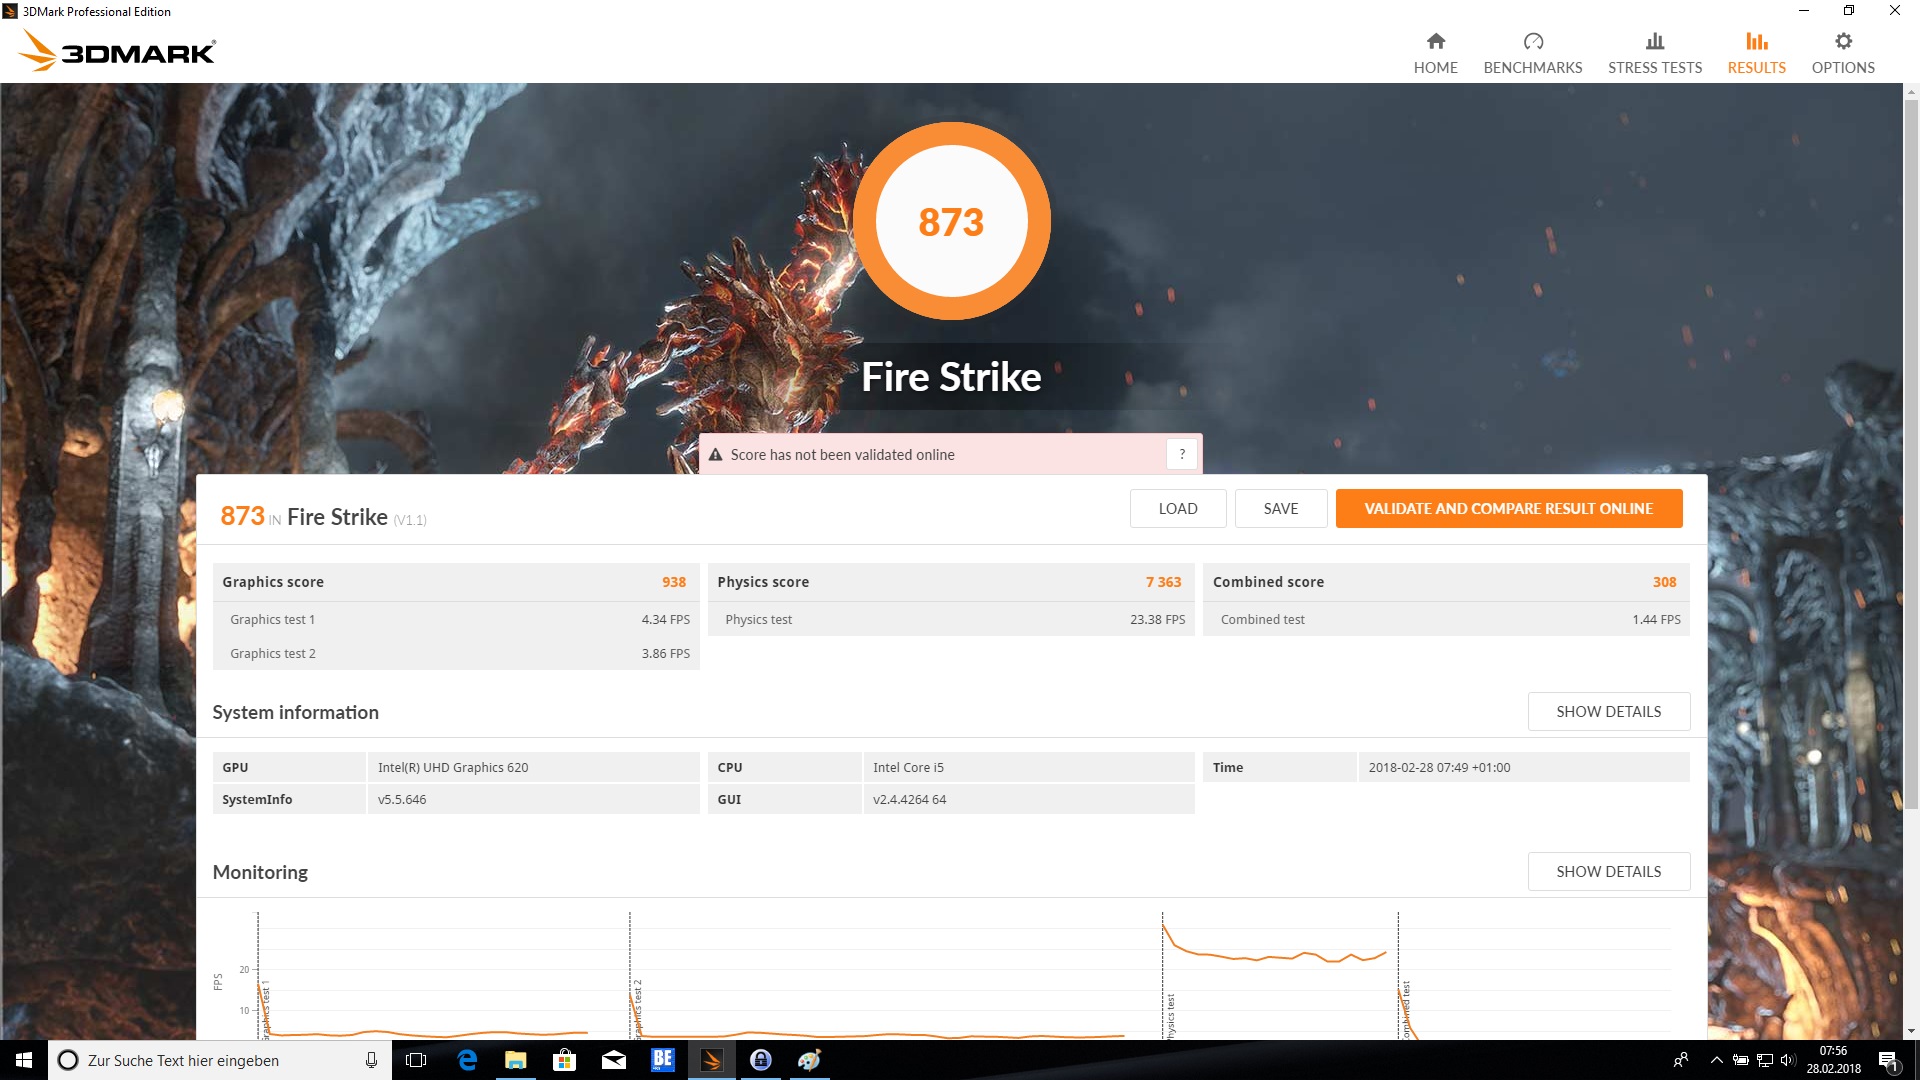
| 3DMark Fire Strike Score | 873 punten | |
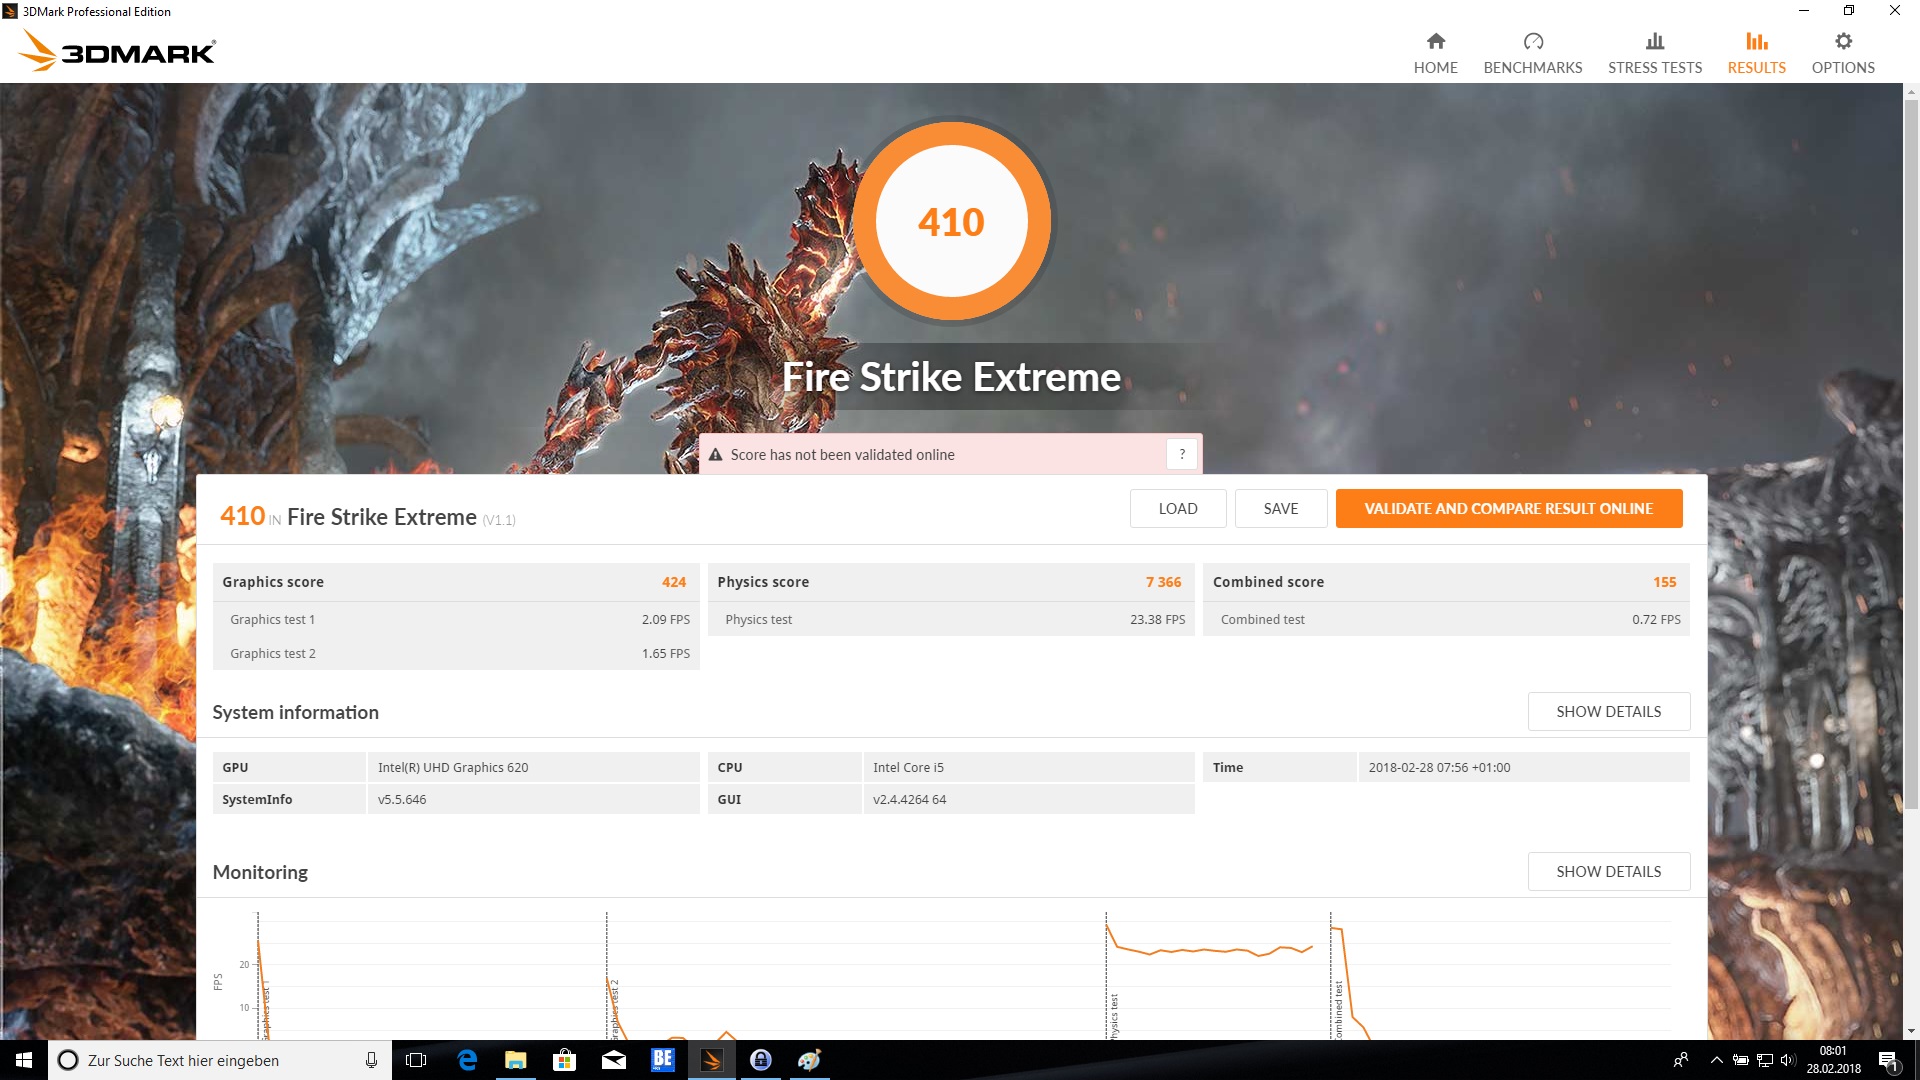
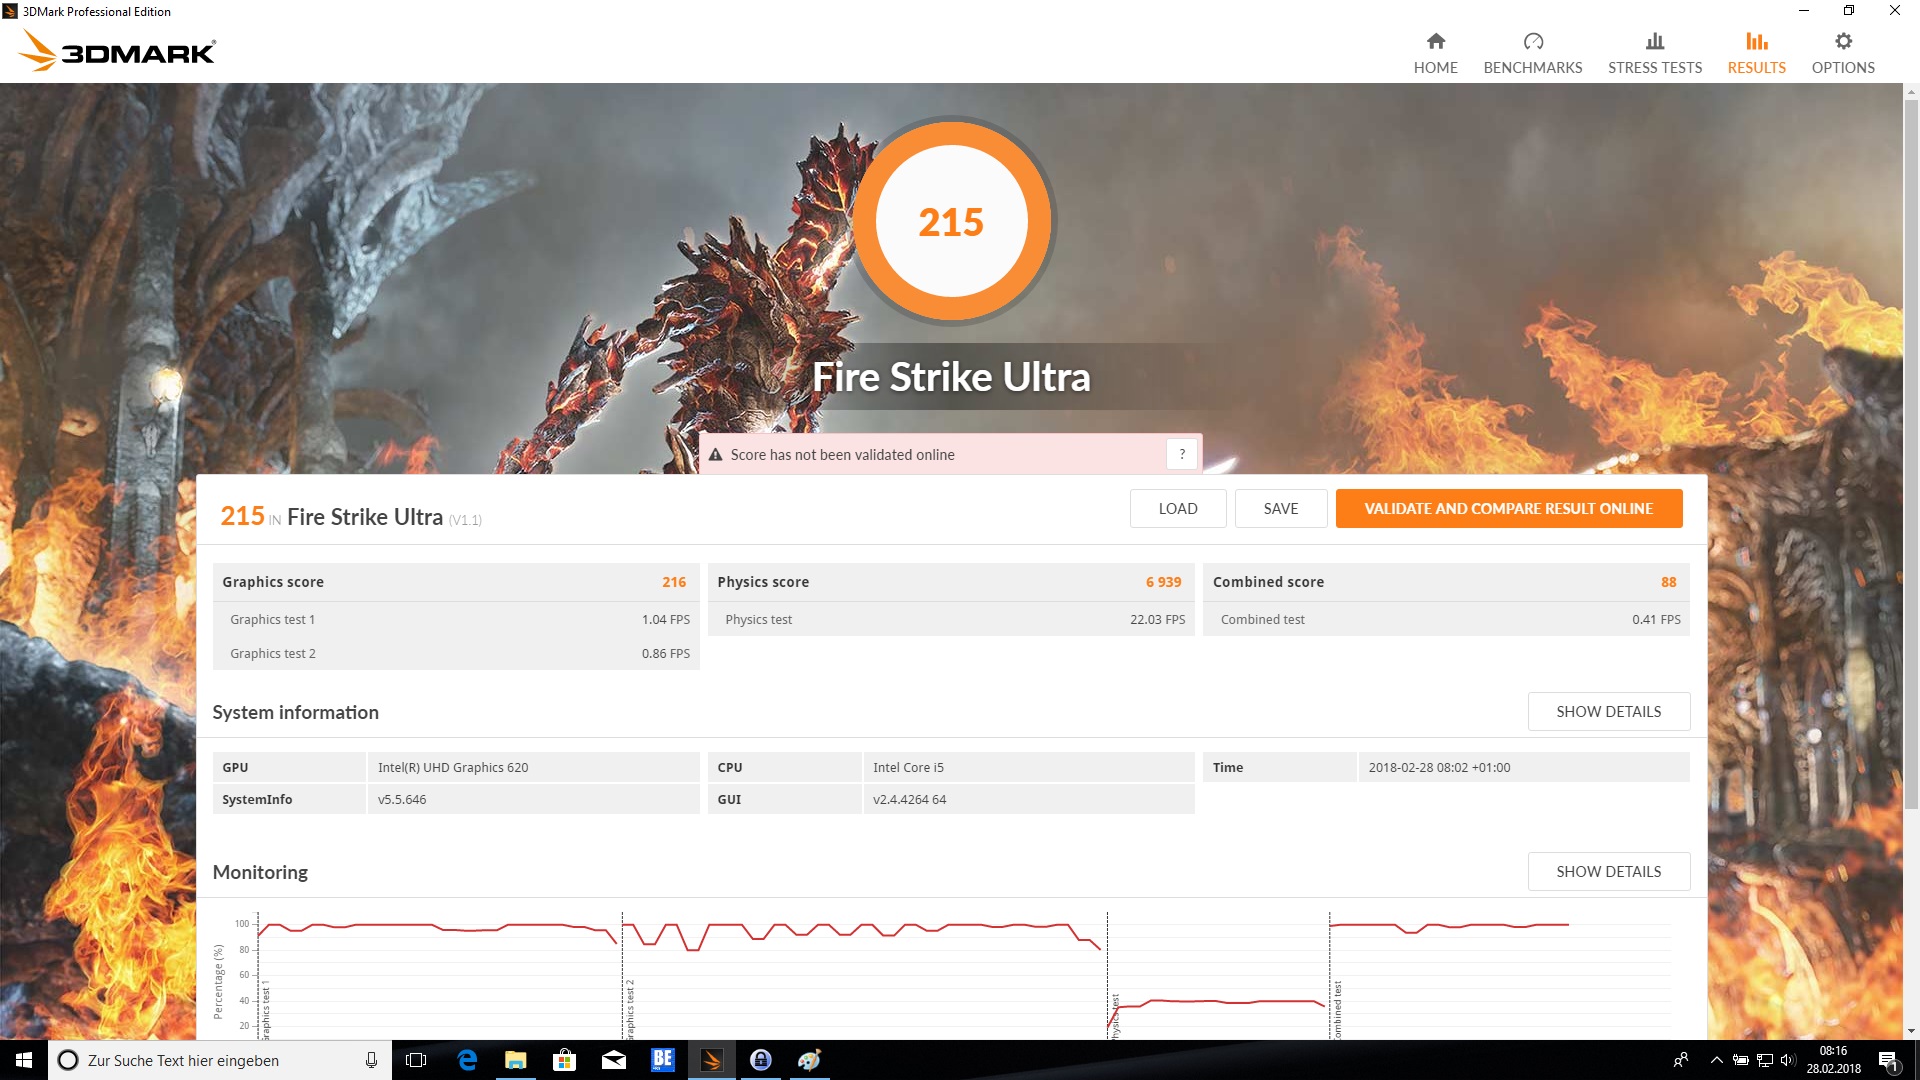
| 3DMark Fire Strike Extreme Score | 410 punten | |
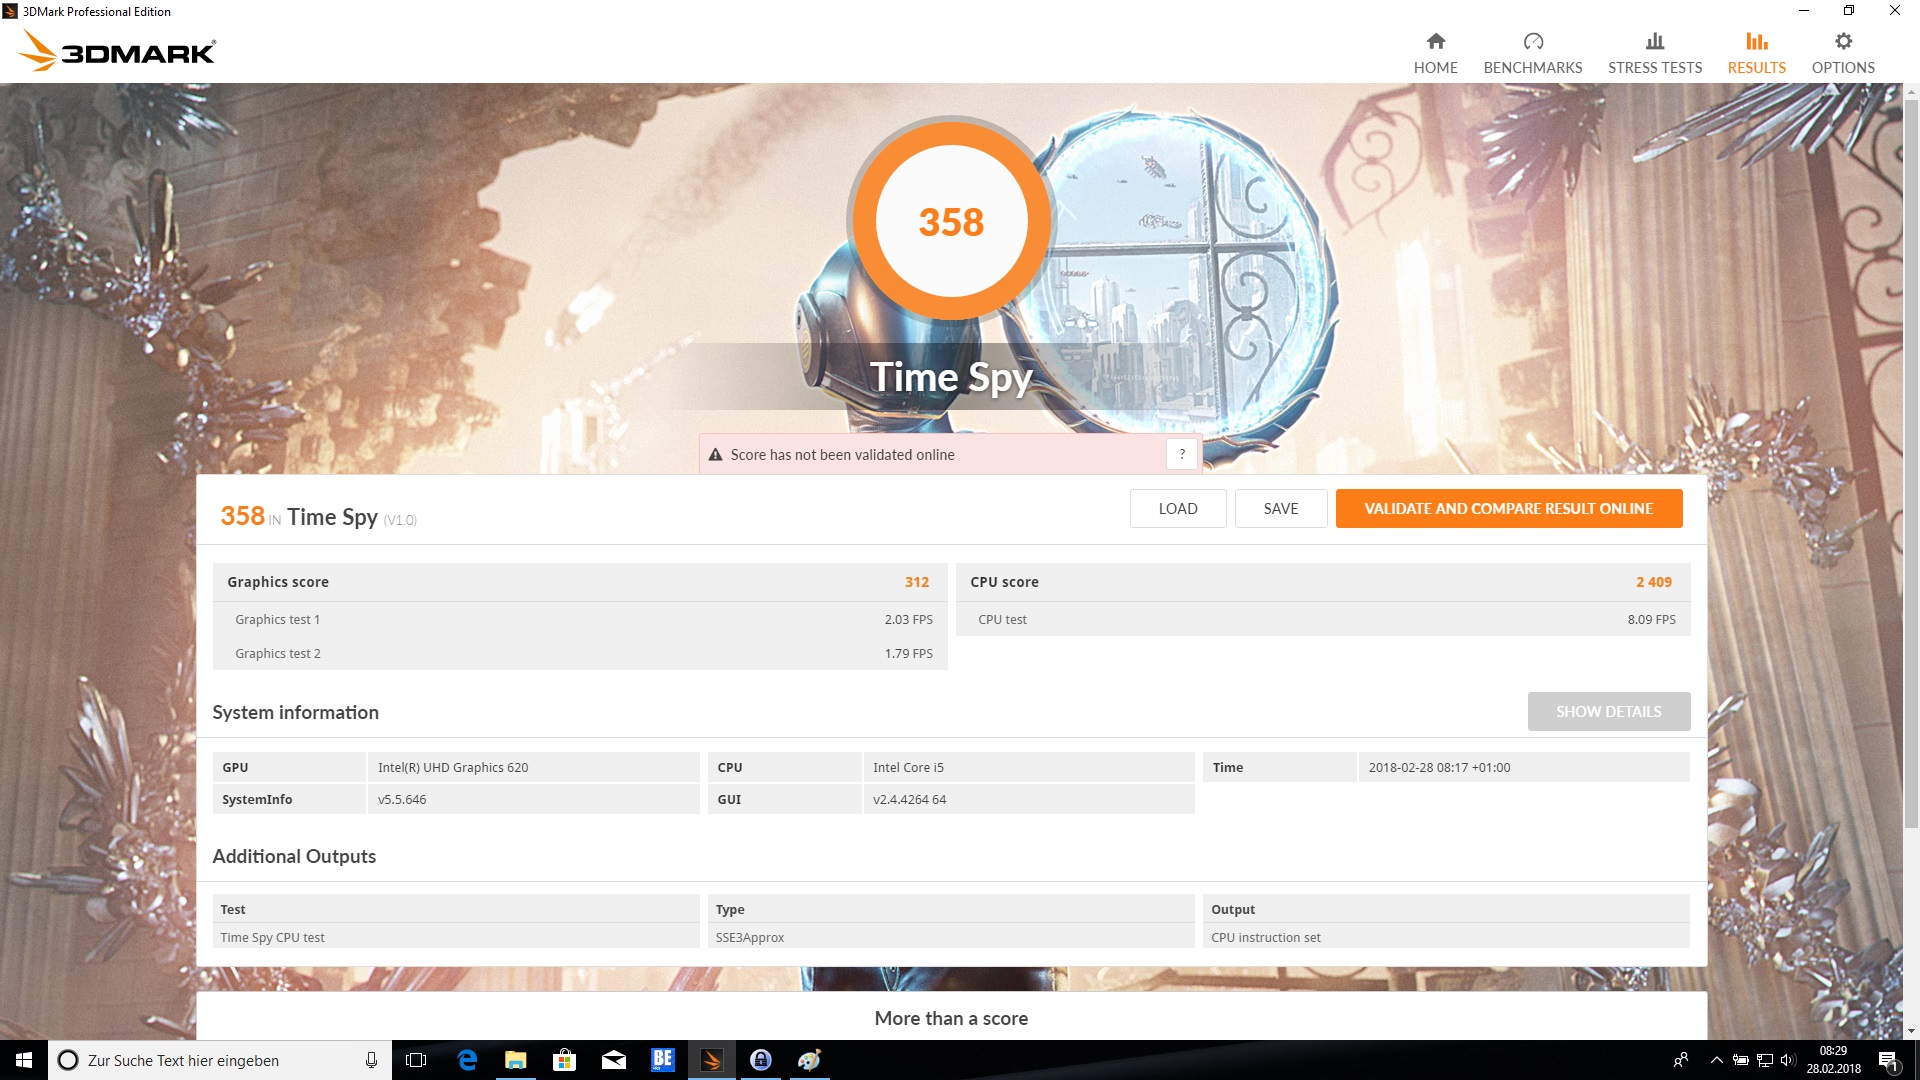
| 3DMark Time Spy Score | 358 punten | |
Help | ||
| lage | gem. | hoge | ultra | |
|---|---|---|---|---|
| BioShock Infinite (2013) | 46.1 | 27.7 | 22.9 | 7.6 |
| The Witcher 3 (2015) | 15.7 | 9.9 | 5.4 | |
| Rise of the Tomb Raider (2016) | 17.2 | 10.6 | 6.1 |
Geluidsniveau
| Onbelast |
| 29.1 / 29.1 / 30.2 dB (A) |
| Belasting |
| 30.8 / 32.8 dB (A) |
 | ||
30 dB stil 40 dB(A) hoorbaar 50 dB(A) luid |
||
min: | ||
| Lenovo ThinkPad E580-20KSCTO1WW UHD Graphics 620, i5-8250U, Toshiba KBG30ZMT128G | Lenovo ThinkPad E580-20KS001RGE Radeon RX 550 (Laptop), i5-8550U, Lenovo LENSE20256GMSP34MEAT2TA | Lenovo ThinkPad E570-20H6S02M00 HD Graphics 620, i5-7200U, Samsung PM961 MZVLW256HEHP | HP ProBook 450 G5-2UB53EA UHD Graphics 620, i5-8250U, SanDisk SD8SN8U256G1006 | Acer TravelMate P2510-M-51ZQ HD Graphics 620, i5-7200U, SK Hynix HFS256G39TND-N210A | Schenker Slim 15 L17 UHD Graphics 620, i5-8550U, Samsung SSD 960 Pro 512 GB m.2 | Dell Vostro 15 3568 HD Graphics 620, i5-7200U, Micron 1100 MTFDDAV256TBN | |
|---|---|---|---|---|---|---|---|
| Noise | -9% | -2% | 1% | -10% | -7% | -7% | |
| uit / omgeving * (dB) | 29.1 | 30.1 -3% | 30.6 -5% | 29.1 -0% | 31.4 -8% | 29.1 -0% | 30.2 -4% |
| Idle Minimum * (dB) | 29.1 | 30.1 -3% | 30.6 -5% | 29.1 -0% | 31.8 -9% | 29.1 -0% | 30.2 -4% |
| Idle Average * (dB) | 29.1 | 30.1 -3% | 30.6 -5% | 29.1 -0% | 31.8 -9% | 29.1 -0% | 30.2 -4% |
| Idle Maximum * (dB) | 30.2 | 31.6 -5% | 30.6 -1% | 29.1 4% | 31.8 -5% | 30.5 -1% | 30.2 -0% |
| Load Average * (dB) | 30.8 | 37.7 -22% | 31.8 -3% | 31.4 -2% | 36.6 -19% | 31.2 -1% | 36.4 -18% |
| Load Maximum * (dB) | 32.8 | 38 -16% | 31.3 5% | 32 2% | 36.5 -11% | 45.9 -40% | 36.5 -11% |
* ... kleiner is beter
(±) De maximumtemperatuur aan de bovenzijde bedraagt 40.4 °C / 105 F, vergeleken met het gemiddelde van 34.3 °C / 94 F, variërend van 21.2 tot 62.5 °C voor de klasse Office.
(±) De bodem warmt op tot een maximum van 43.7 °C / 111 F, vergeleken met een gemiddelde van 36.8 °C / 98 F
(+) Bij onbelast gebruik bedraagt de gemiddelde temperatuur voor de bovenzijde 20.4 °C / 69 F, vergeleken met het apparaatgemiddelde van 29.5 °C / 85 F.
(+) De palmsteunen en het touchpad zijn met een maximum van ###max## °C / 72.7 F koeler dan de huidtemperatuur en voelen daarom koel aan.
(+) De gemiddelde temperatuur van de handpalmsteun van soortgelijke toestellen bedroeg 27.5 °C / 81.5 F (+4.9 °C / 8.8 F).
| Lenovo ThinkPad E580-20KSCTO1WW UHD Graphics 620, i5-8250U, Toshiba KBG30ZMT128G | Lenovo ThinkPad E580-20KS001RGE Radeon RX 550 (Laptop), i5-8550U, Lenovo LENSE20256GMSP34MEAT2TA | Lenovo ThinkPad E570-20H6S02M00 HD Graphics 620, i5-7200U, Samsung PM961 MZVLW256HEHP | HP ProBook 450 G5-2UB53EA UHD Graphics 620, i5-8250U, SanDisk SD8SN8U256G1006 | Acer TravelMate P2510-M-51ZQ HD Graphics 620, i5-7200U, SK Hynix HFS256G39TND-N210A | Schenker Slim 15 L17 UHD Graphics 620, i5-8550U, Samsung SSD 960 Pro 512 GB m.2 | Dell Vostro 15 3568 HD Graphics 620, i5-7200U, Micron 1100 MTFDDAV256TBN | |
|---|---|---|---|---|---|---|---|
| Heat | -33% | -1% | -4% | 6% | -6% | 3% | |
| Maximum Upper Side * (°C) | 40.4 | 60 -49% | 33.2 18% | 42.2 -4% | 32 21% | 38.5 5% | 35.6 12% |
| Maximum Bottom * (°C) | 43.7 | 57 -30% | 39.4 10% | 45.5 -4% | 35.5 19% | 41.8 4% | 35.3 19% |
| Idle Upper Side * (°C) | 21.4 | 29.1 -36% | 25.9 -21% | 23.9 -12% | 25.6 -20% | 26.4 -23% | 25.1 -17% |
| Idle Bottom * (°C) | 25.5 | 30.2 -18% | 27.8 -9% | 24.2 5% | 25.1 2% | 27.9 -9% | 26.1 -2% |
* ... kleiner is beter
| Uit / Standby | |
| Inactief | |
| Belasting |
|
Key:
min: | |
| Lenovo ThinkPad E580-20KSCTO1WW i5-8250U, UHD Graphics 620, Toshiba KBG30ZMT128G, IPS LED, 1920x1080, 15.6" | Lenovo ThinkPad E580-20KS001RGE i5-8550U, Radeon RX 550 (Laptop), Lenovo LENSE20256GMSP34MEAT2TA, IPS LED, 1920x1080, 15.6" | Lenovo ThinkPad E570-20H6S02M00 i5-7200U, HD Graphics 620, Samsung PM961 MZVLW256HEHP, TN LED, 1366x768, 15.6" | HP ProBook 450 G5-2UB53EA i5-8250U, UHD Graphics 620, SanDisk SD8SN8U256G1006, IPS LED, 1920x1080, 15.6" | Acer TravelMate P2510-M-51ZQ i5-7200U, HD Graphics 620, SK Hynix HFS256G39TND-N210A, IPS, 1920x1080, 15.6" | Schenker Slim 15 L17 i5-8550U, UHD Graphics 620, Samsung SSD 960 Pro 512 GB m.2, IPS, 1920x1080, 15.6" | Dell Vostro 15 3568 i5-7200U, HD Graphics 620, Micron 1100 MTFDDAV256TBN, TN LED, 1920x1080, 15.6" | |
|---|---|---|---|---|---|---|---|
| Power Consumption | -65% | 16% | -3% | 2% | -53% | 21% | |
| Idle Minimum * (Watt) | 3.4 | 7.4 -118% | 2.9 15% | 3.6 -6% | 3.4 -0% | 7.2 -112% | 3 12% |
| Idle Average * (Watt) | 6.7 | 10.4 -55% | 5.8 13% | 6.2 7% | 5.8 13% | 10.9 -63% | 5.5 18% |
| Idle Maximum * (Watt) | 7.7 | 10.3 -34% | 6.6 14% | 7.2 6% | 8 -4% | 12.6 -64% | 5.7 26% |
| Load Average * (Watt) | 31.1 | 57 -83% | 29 7% | 35.2 -13% | 38 -22% | 37 -19% | 27 13% |
| Load Maximum * (Watt) | 42.9 | 57 -33% | 29.4 31% | 46.4 -8% | 32 25% | 45.5 -6% | 27.4 36% |
* ... kleiner is beter
| Lenovo ThinkPad E580-20KSCTO1WW i5-8250U, UHD Graphics 620, 45 Wh | Lenovo ThinkPad E580-20KS001RGE i5-8550U, Radeon RX 550 (Laptop), 45 Wh | Lenovo ThinkPad E570-20H6S02M00 i5-7200U, HD Graphics 620, 42 Wh | HP ProBook 450 G5-2UB53EA i5-8250U, UHD Graphics 620, 48 Wh | Acer TravelMate P2510-M-51ZQ i5-7200U, HD Graphics 620, 48 Wh | Schenker Slim 15 L17 i5-8550U, UHD Graphics 620, 44 Wh | Dell Vostro 15 3568 i5-7200U, HD Graphics 620, 40 Wh | |
|---|---|---|---|---|---|---|---|
| Batterijduur | 2% | 5% | 10% | 17% | -34% | 1% | |
| Reader / Idle (h) | 14.4 | 14.4 0% | 18.1 26% | 15.2 6% | 7.4 -49% | 14.6 1% | |
| H.264 (h) | 7.3 | 9.1 25% | 6.5 -11% | 4.3 -41% | |||
| WiFi v1.3 (h) | 7 | 6.7 -4% | 7.2 3% | 7.7 10% | 8.8 26% | 4.6 -34% | 6.3 -10% |
| Load (h) | 1.6 | 1.4 -13% | 1.6 0% | 1.9 19% | 1.4 -13% | 1.8 13% |
Pro
Contra
Dit is de verkorte versie van het originele artikel. Het volledige, Engelse testrapport vind je hier.
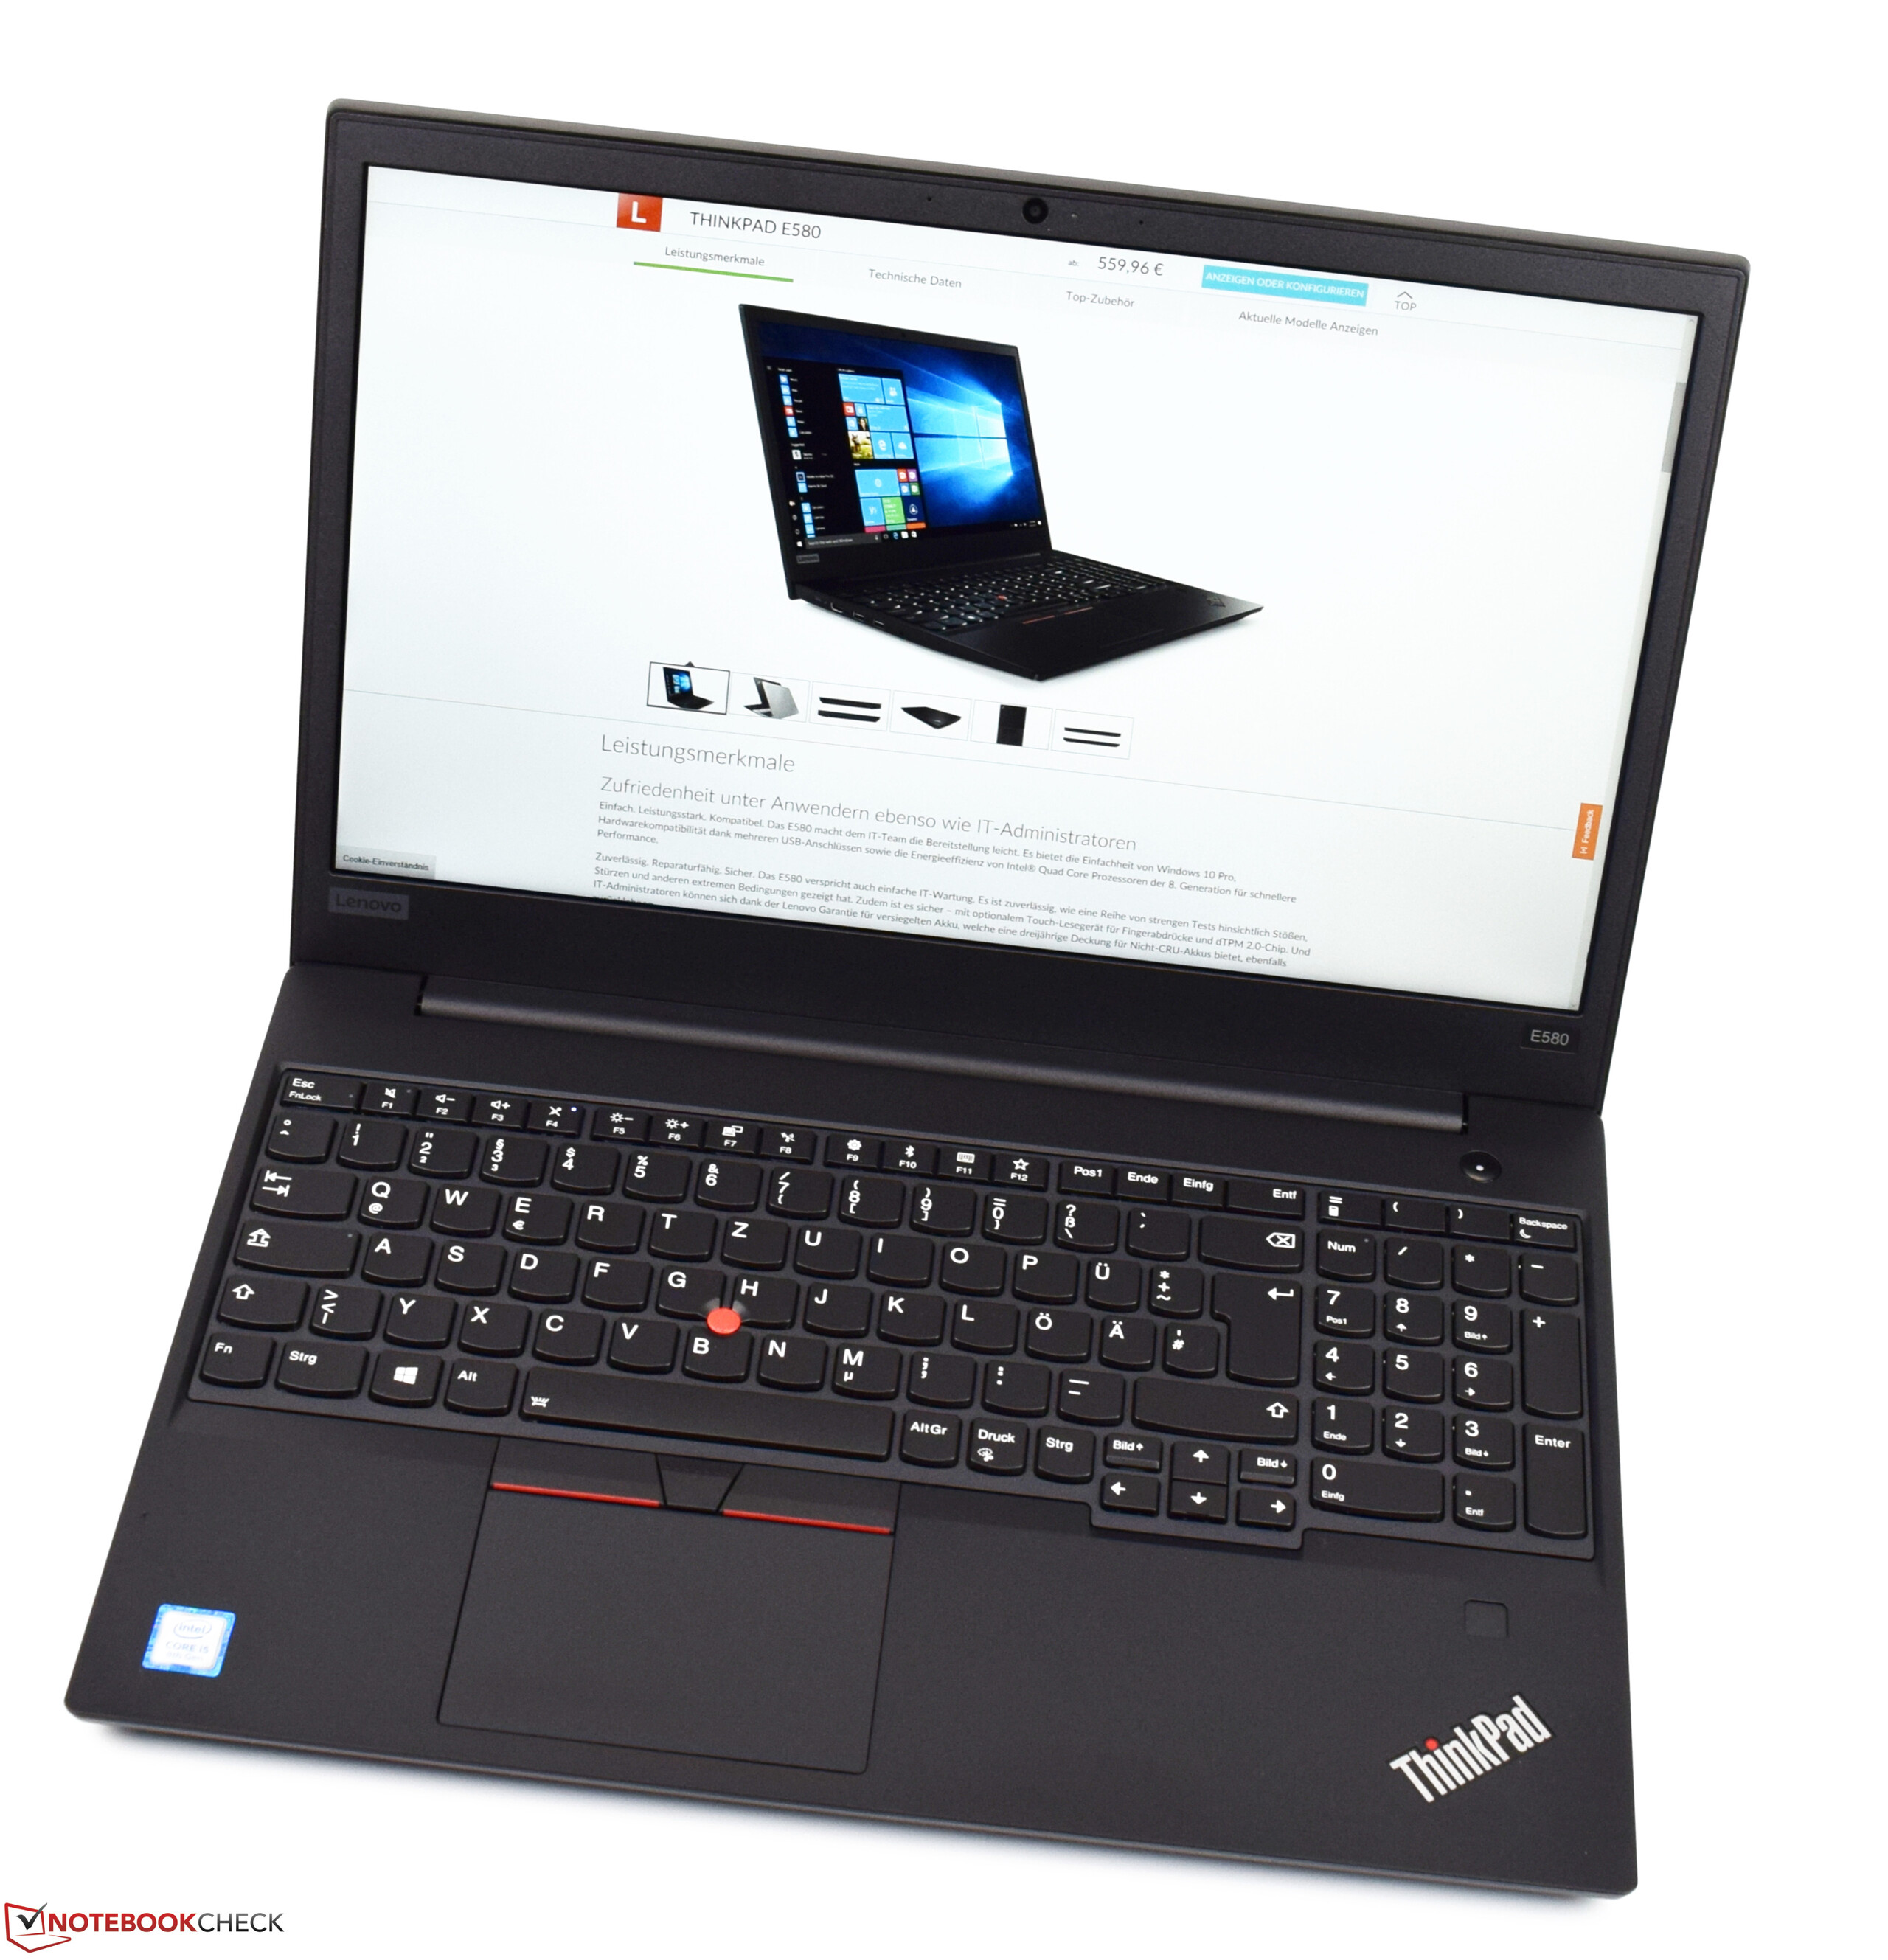
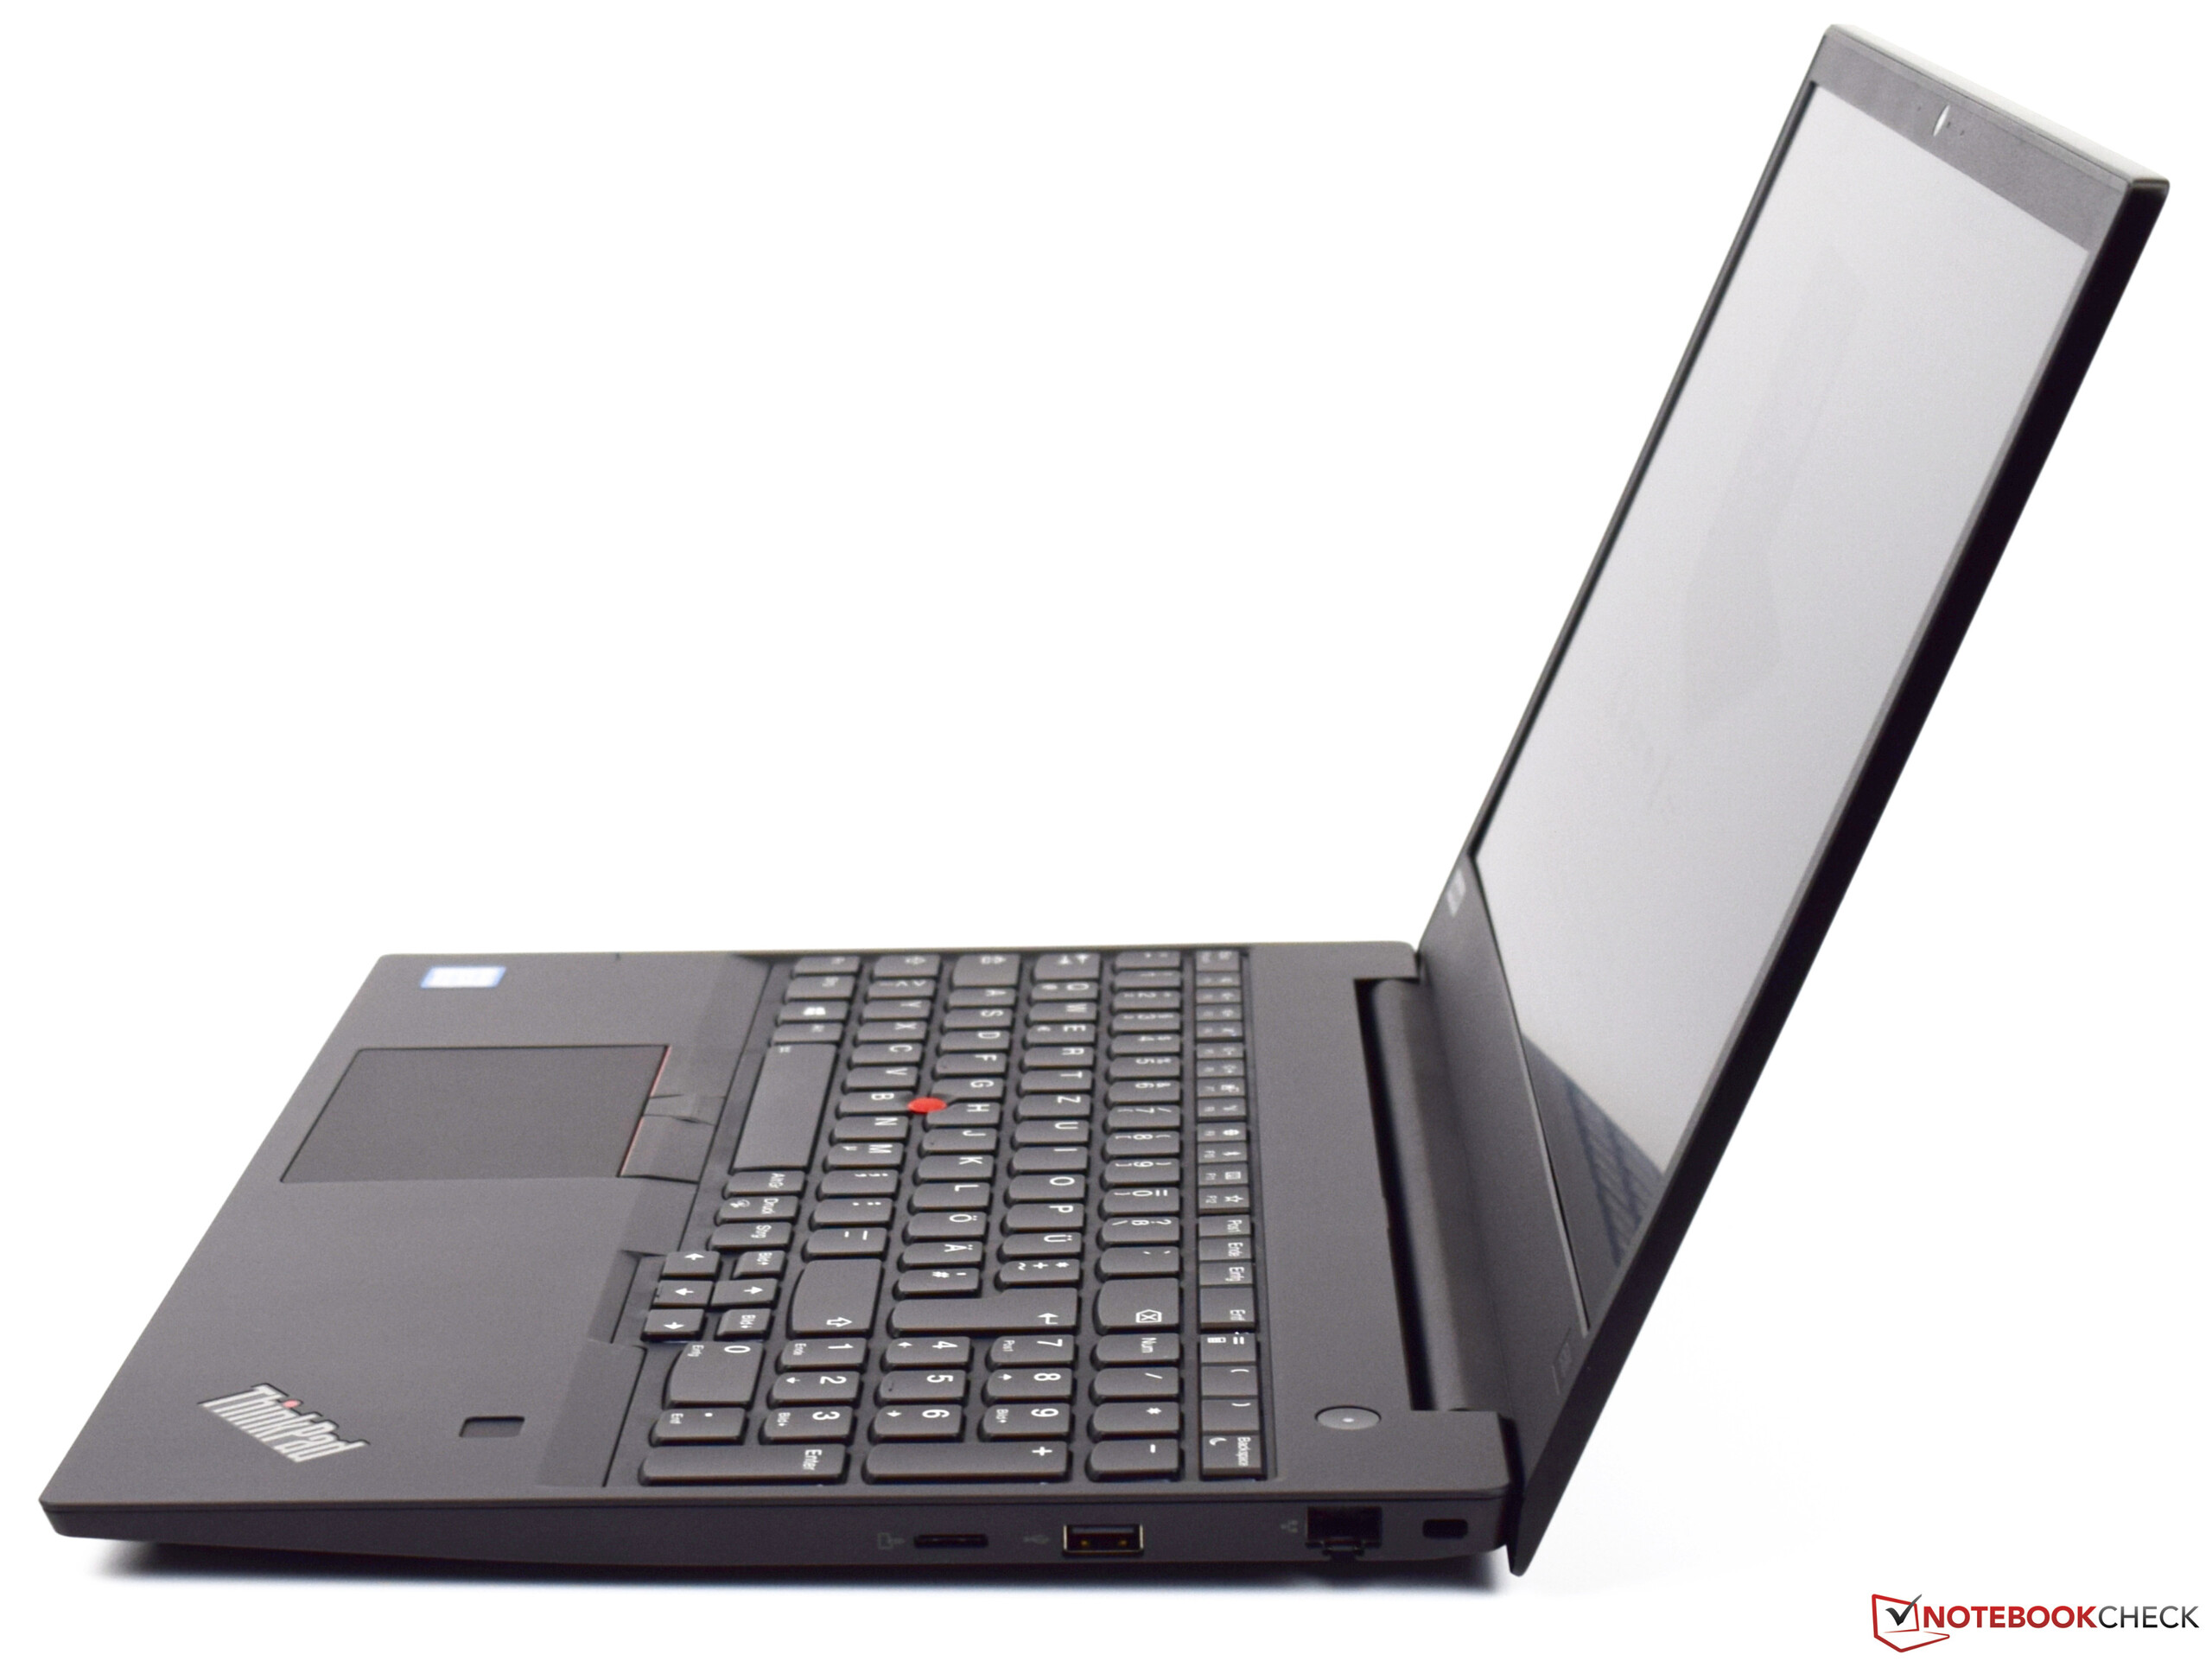
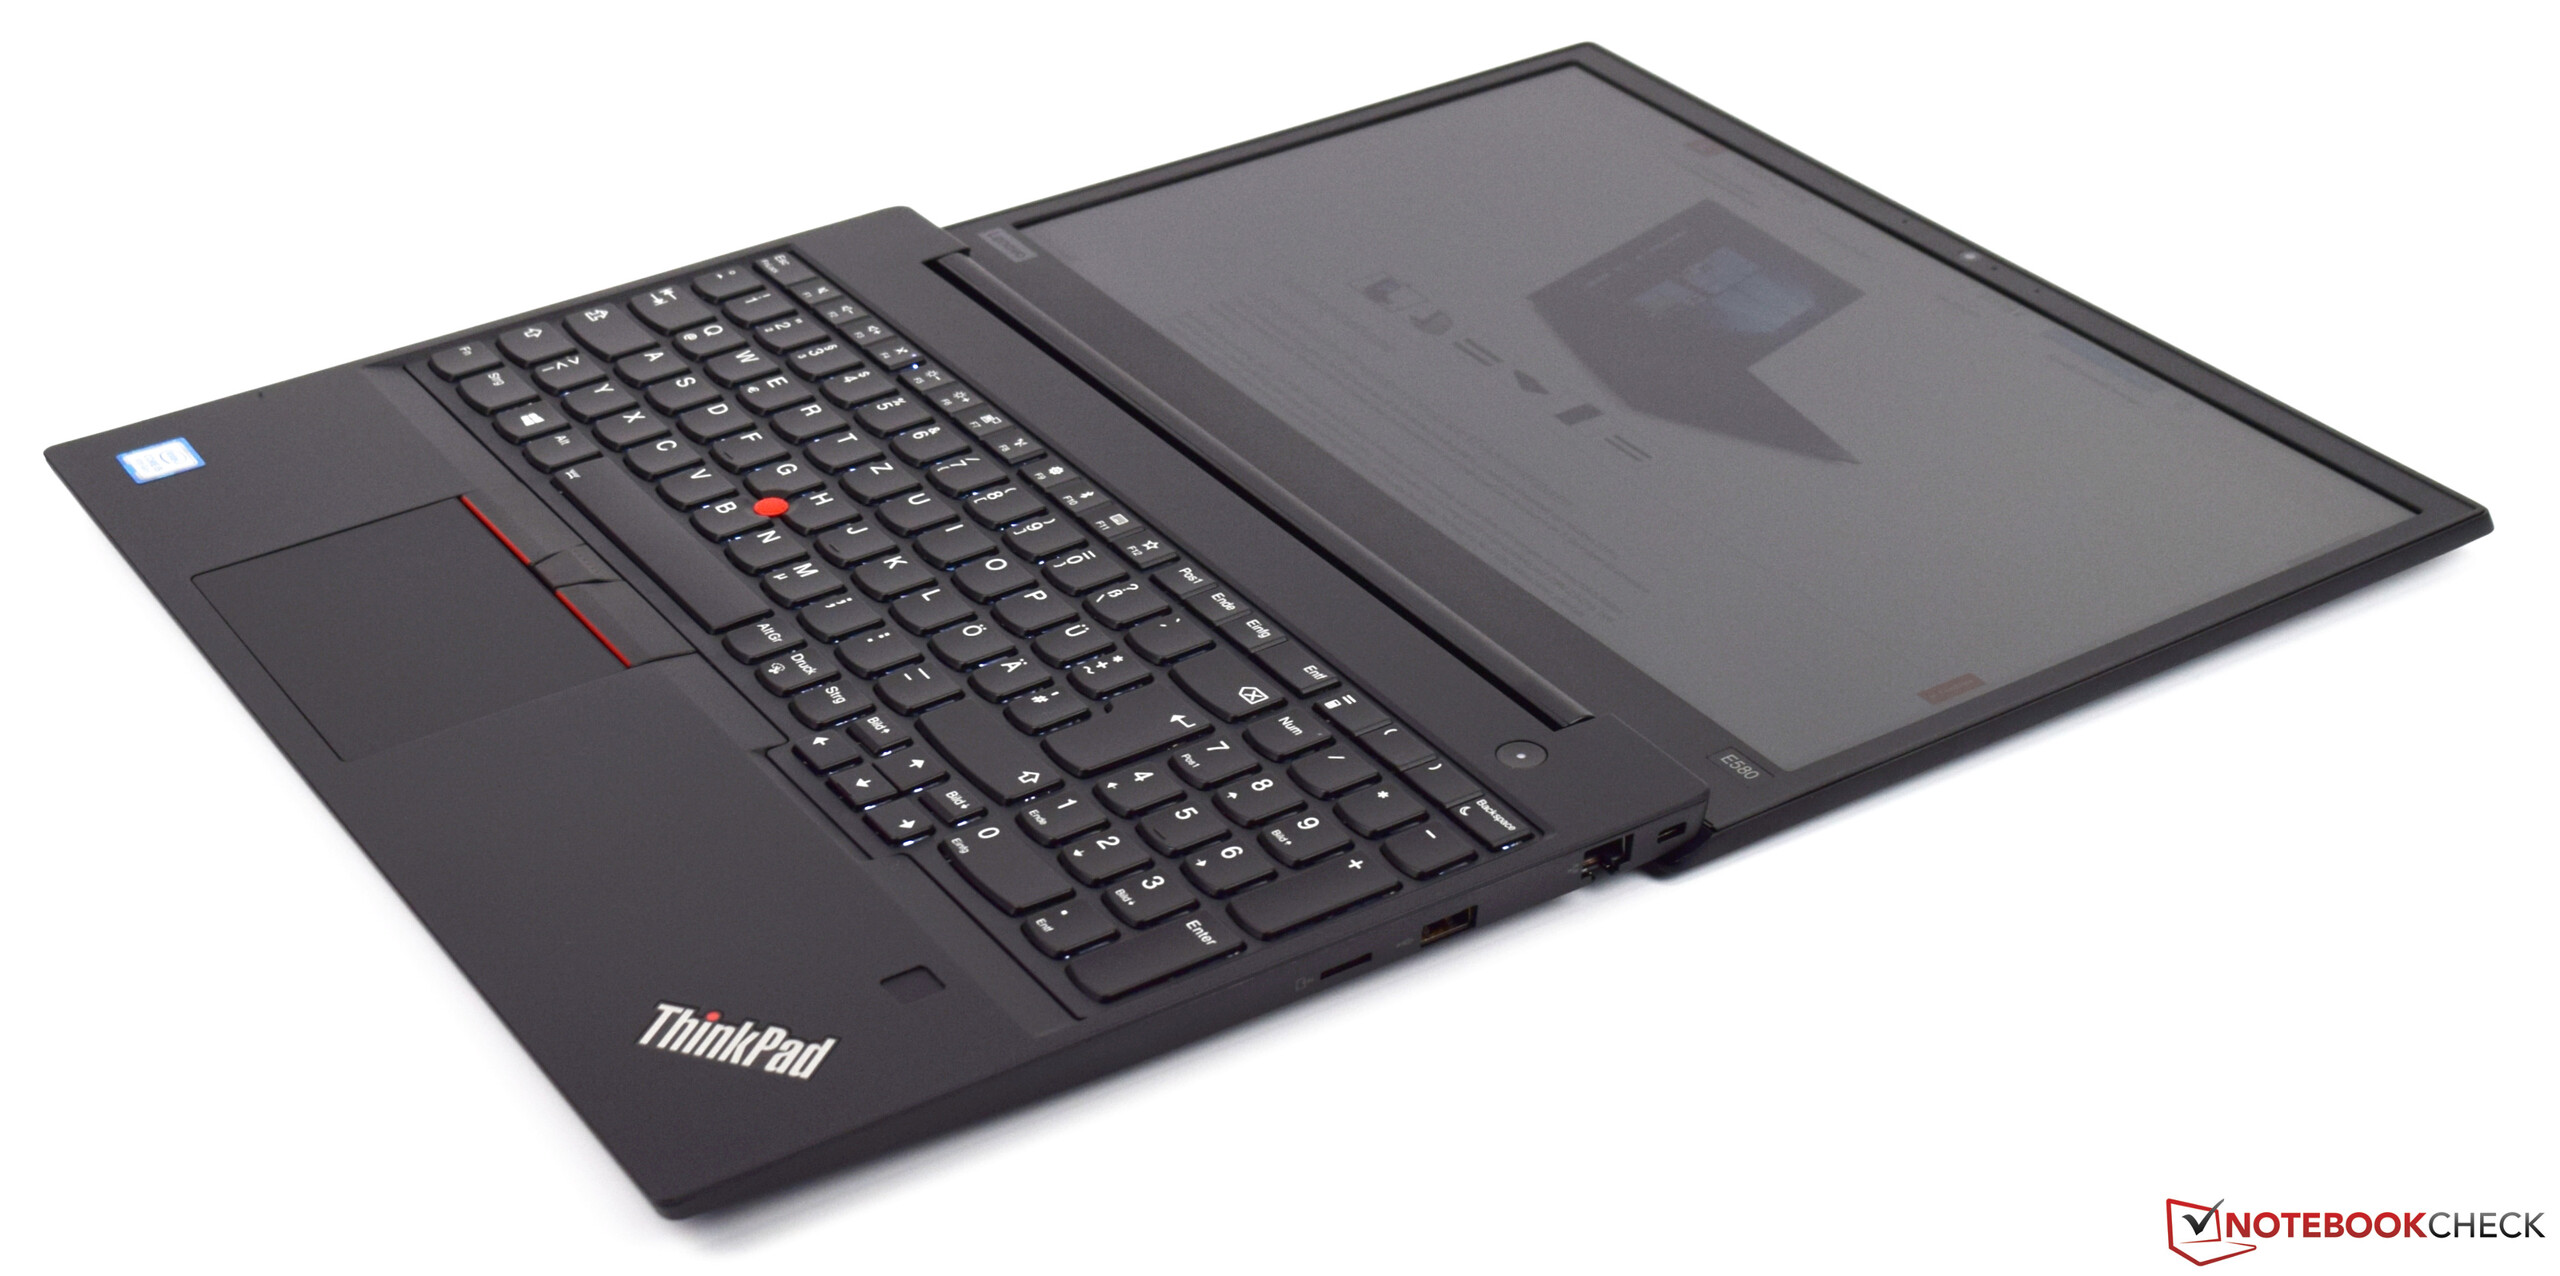
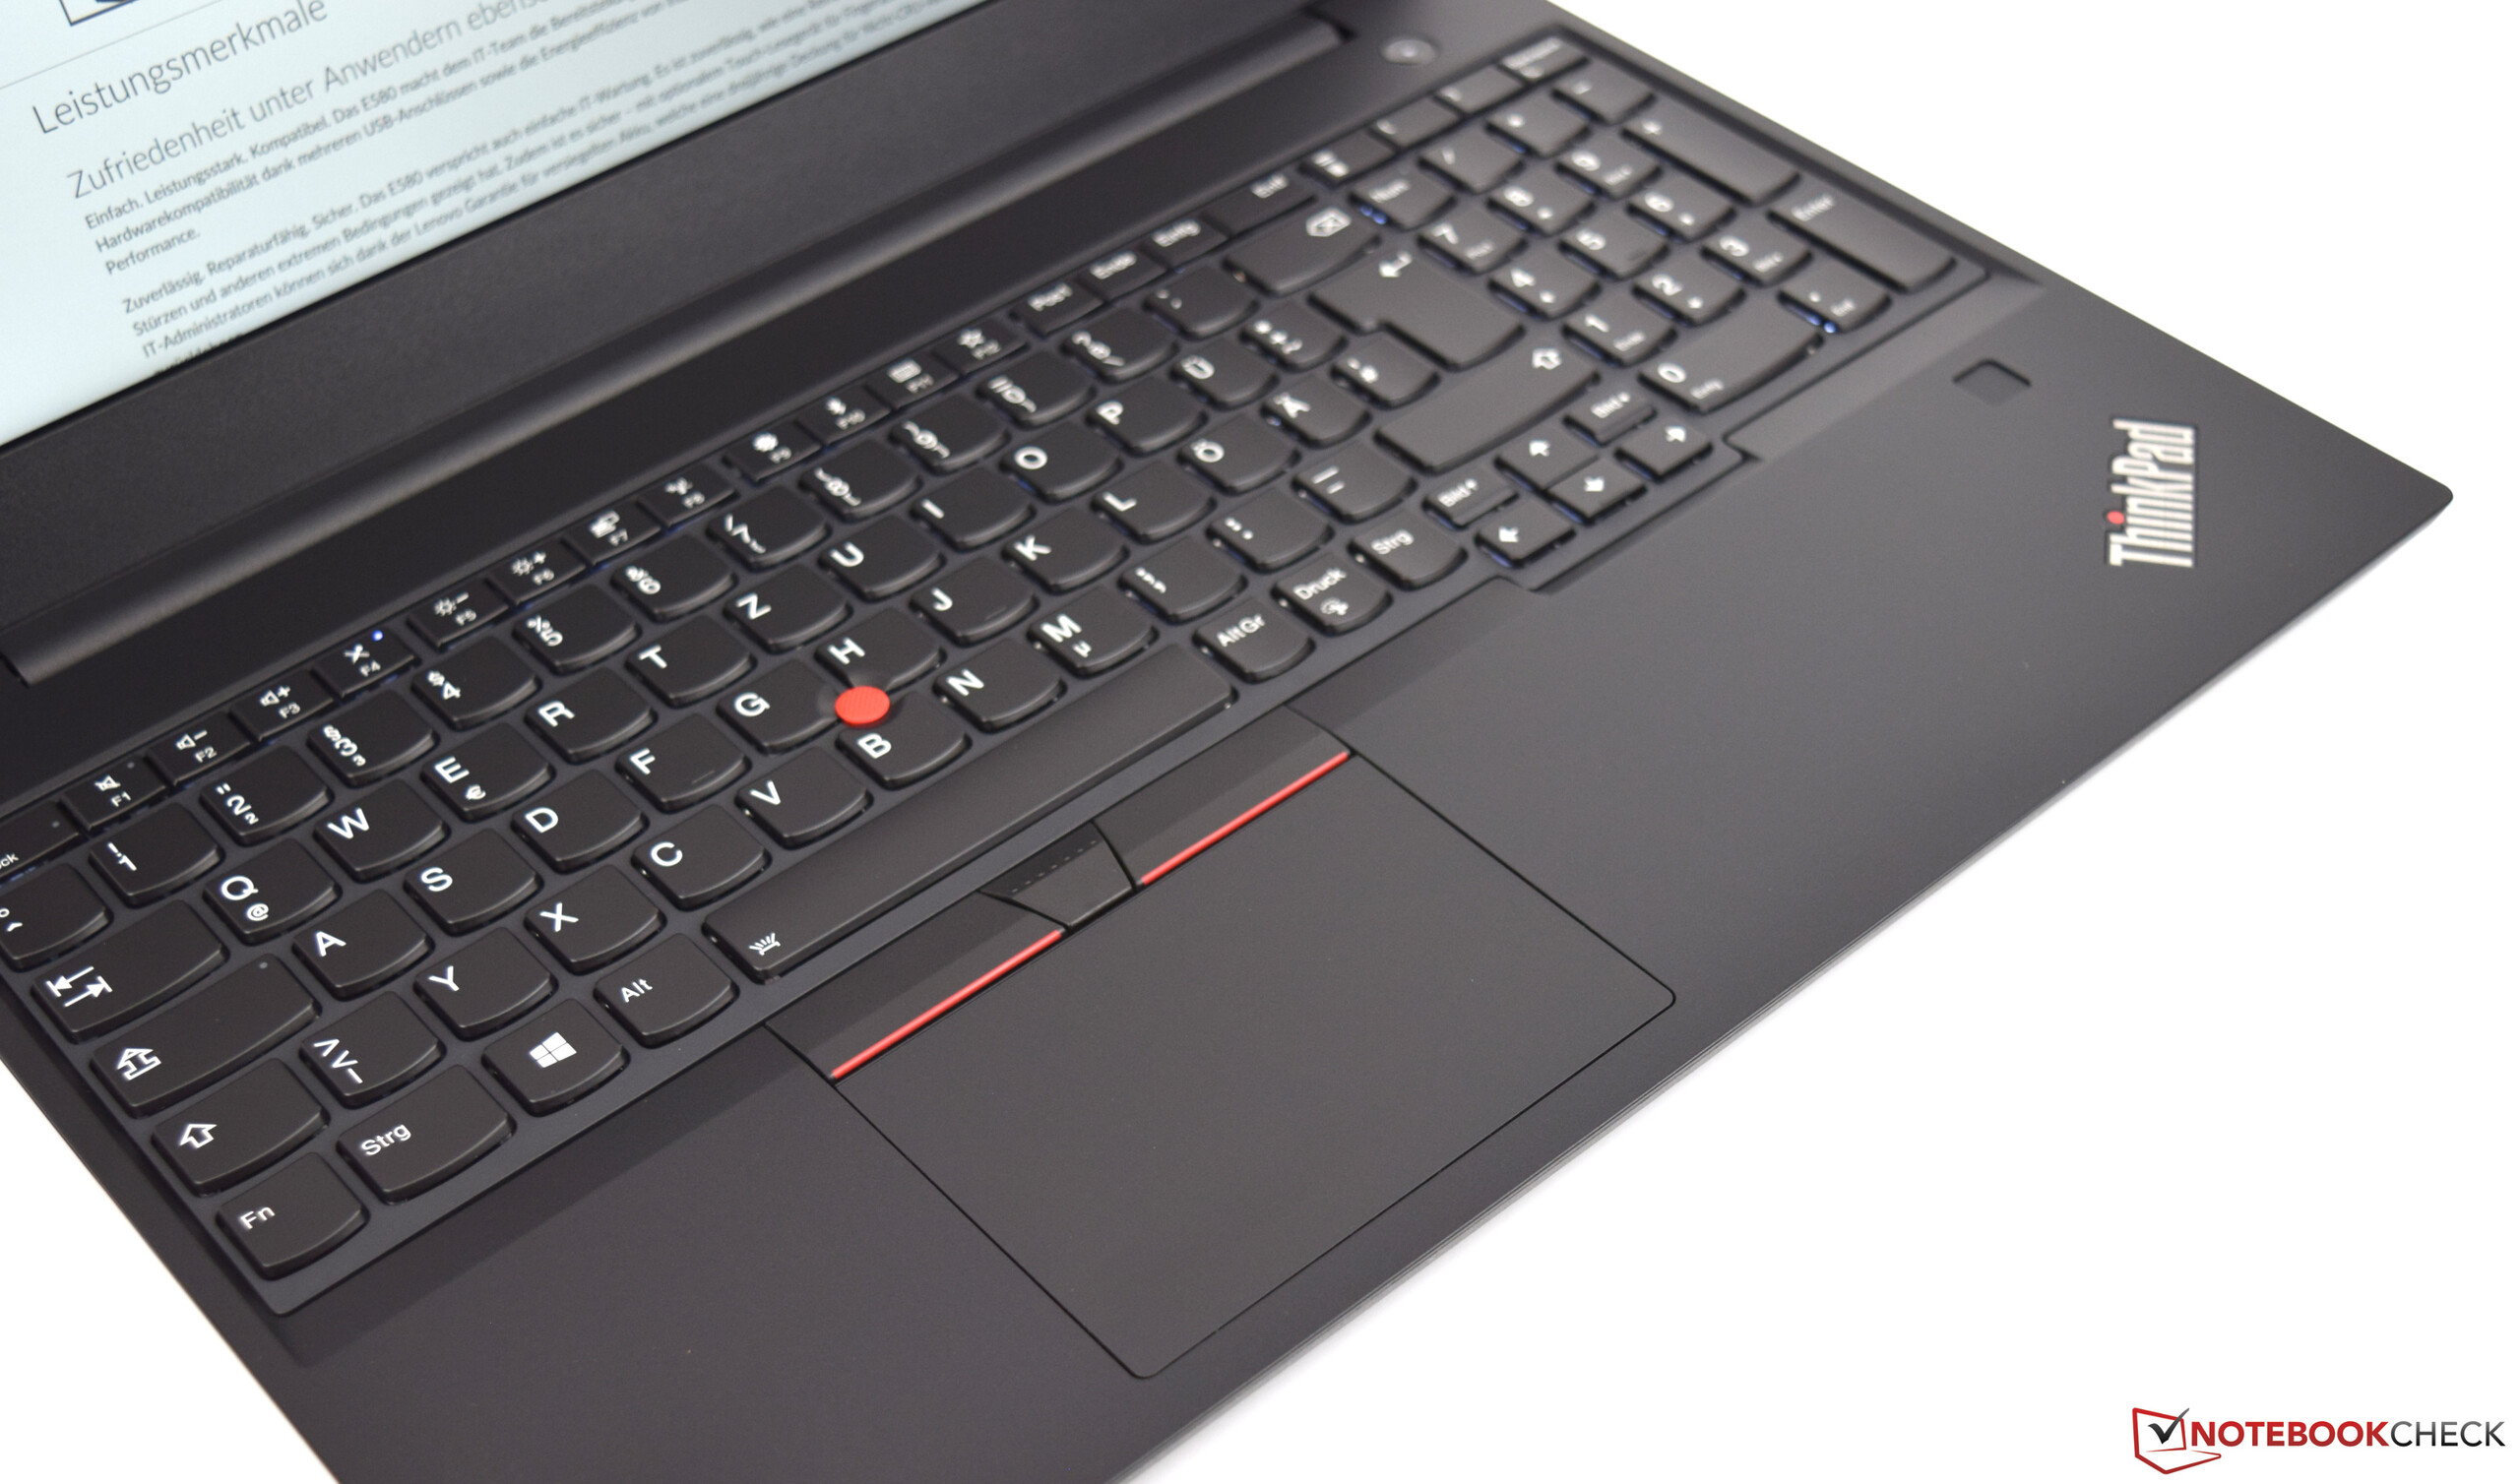
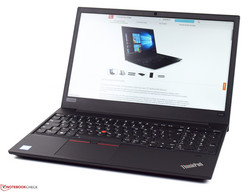
De Lenovo ThinkPad E580 is een betaalbaar instapniveau zakelijk notebook, uitgerust met een krachtige en nieuwe Intel Core i5-8250U processor. 8 GB DDR4 RAM zou voldoende moeten zijn voor alledaagse zakelijke taken. De 128 GB SSD lijkt nu nog voldoende ruimte te hebben, maar na verloop van tijd zal dit toch aan de krappe kant blijken. Een 256 GB SSD zou dan ook een betere keuze zijn. Om mee te beginnen is het 128 GB echter wel voldoende. Het IPS-paneel is met name noemenswaardig, met name gezien de prijs. De meeste betaalbare zakelijke notebooks zijn uitgerust met goedkope en navenant slechte TN-panelen.
De Lenovo ThinkPad E580 heeft alles wat je zou zoeken in een betaalbare zakelijke notebook. De beperkte capaciteit van de SSD is een compromis, maar de algehele prestaties zijn erg goed gezien de lage prijs. We kunnen het notebook dan ook volmondig aanraden.
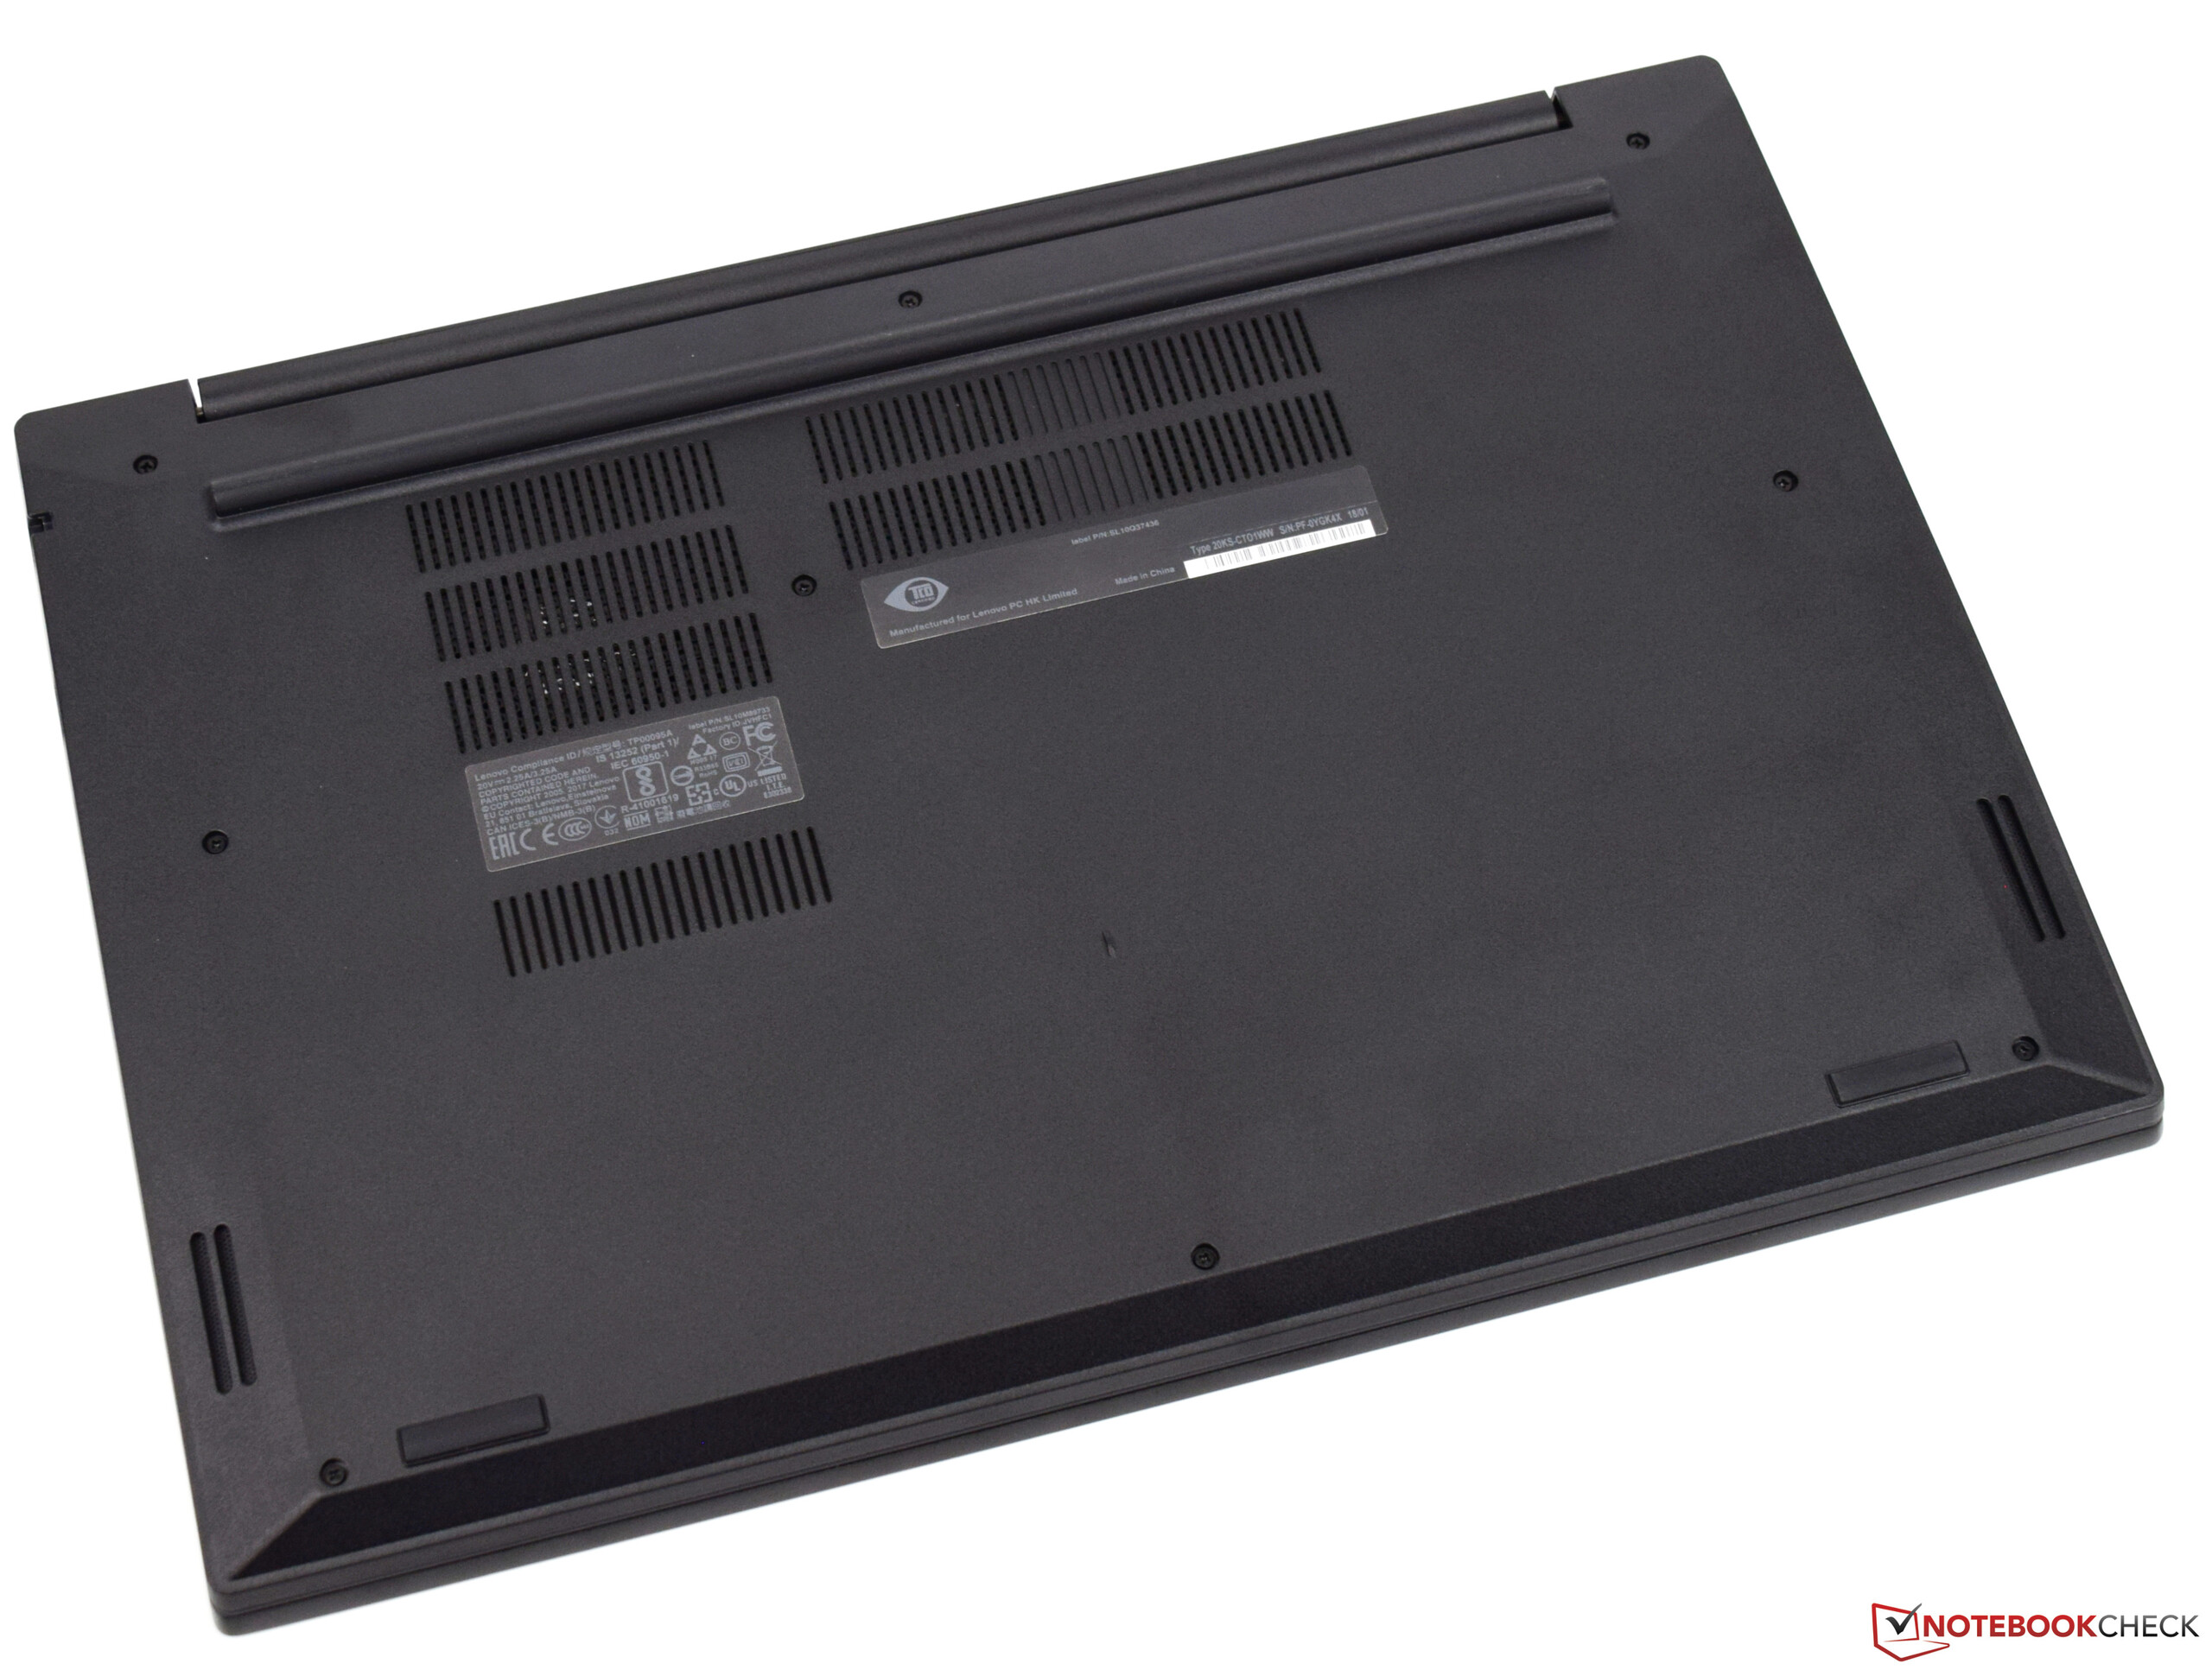
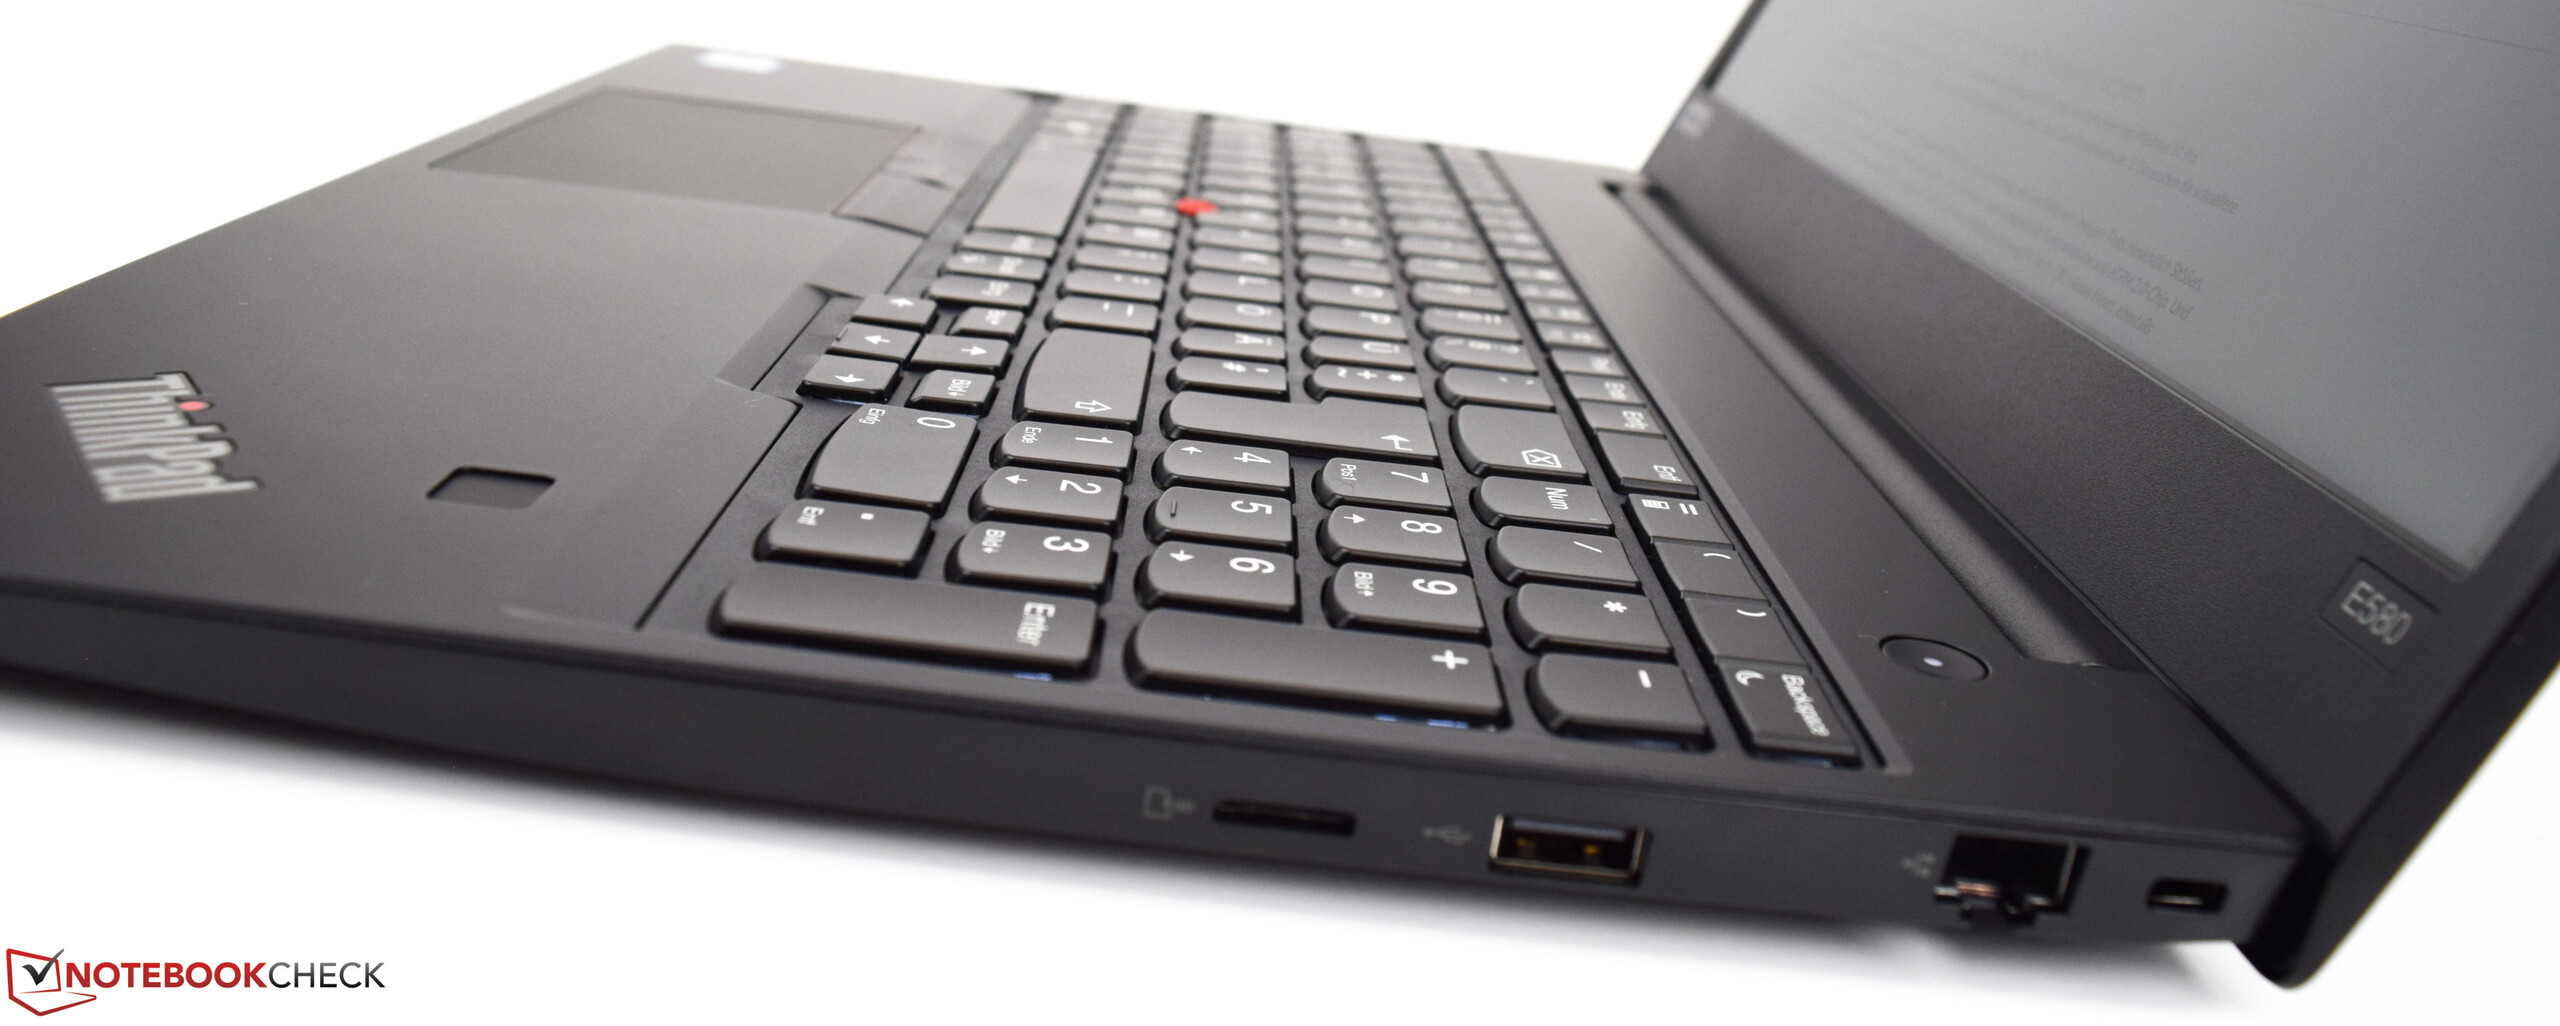
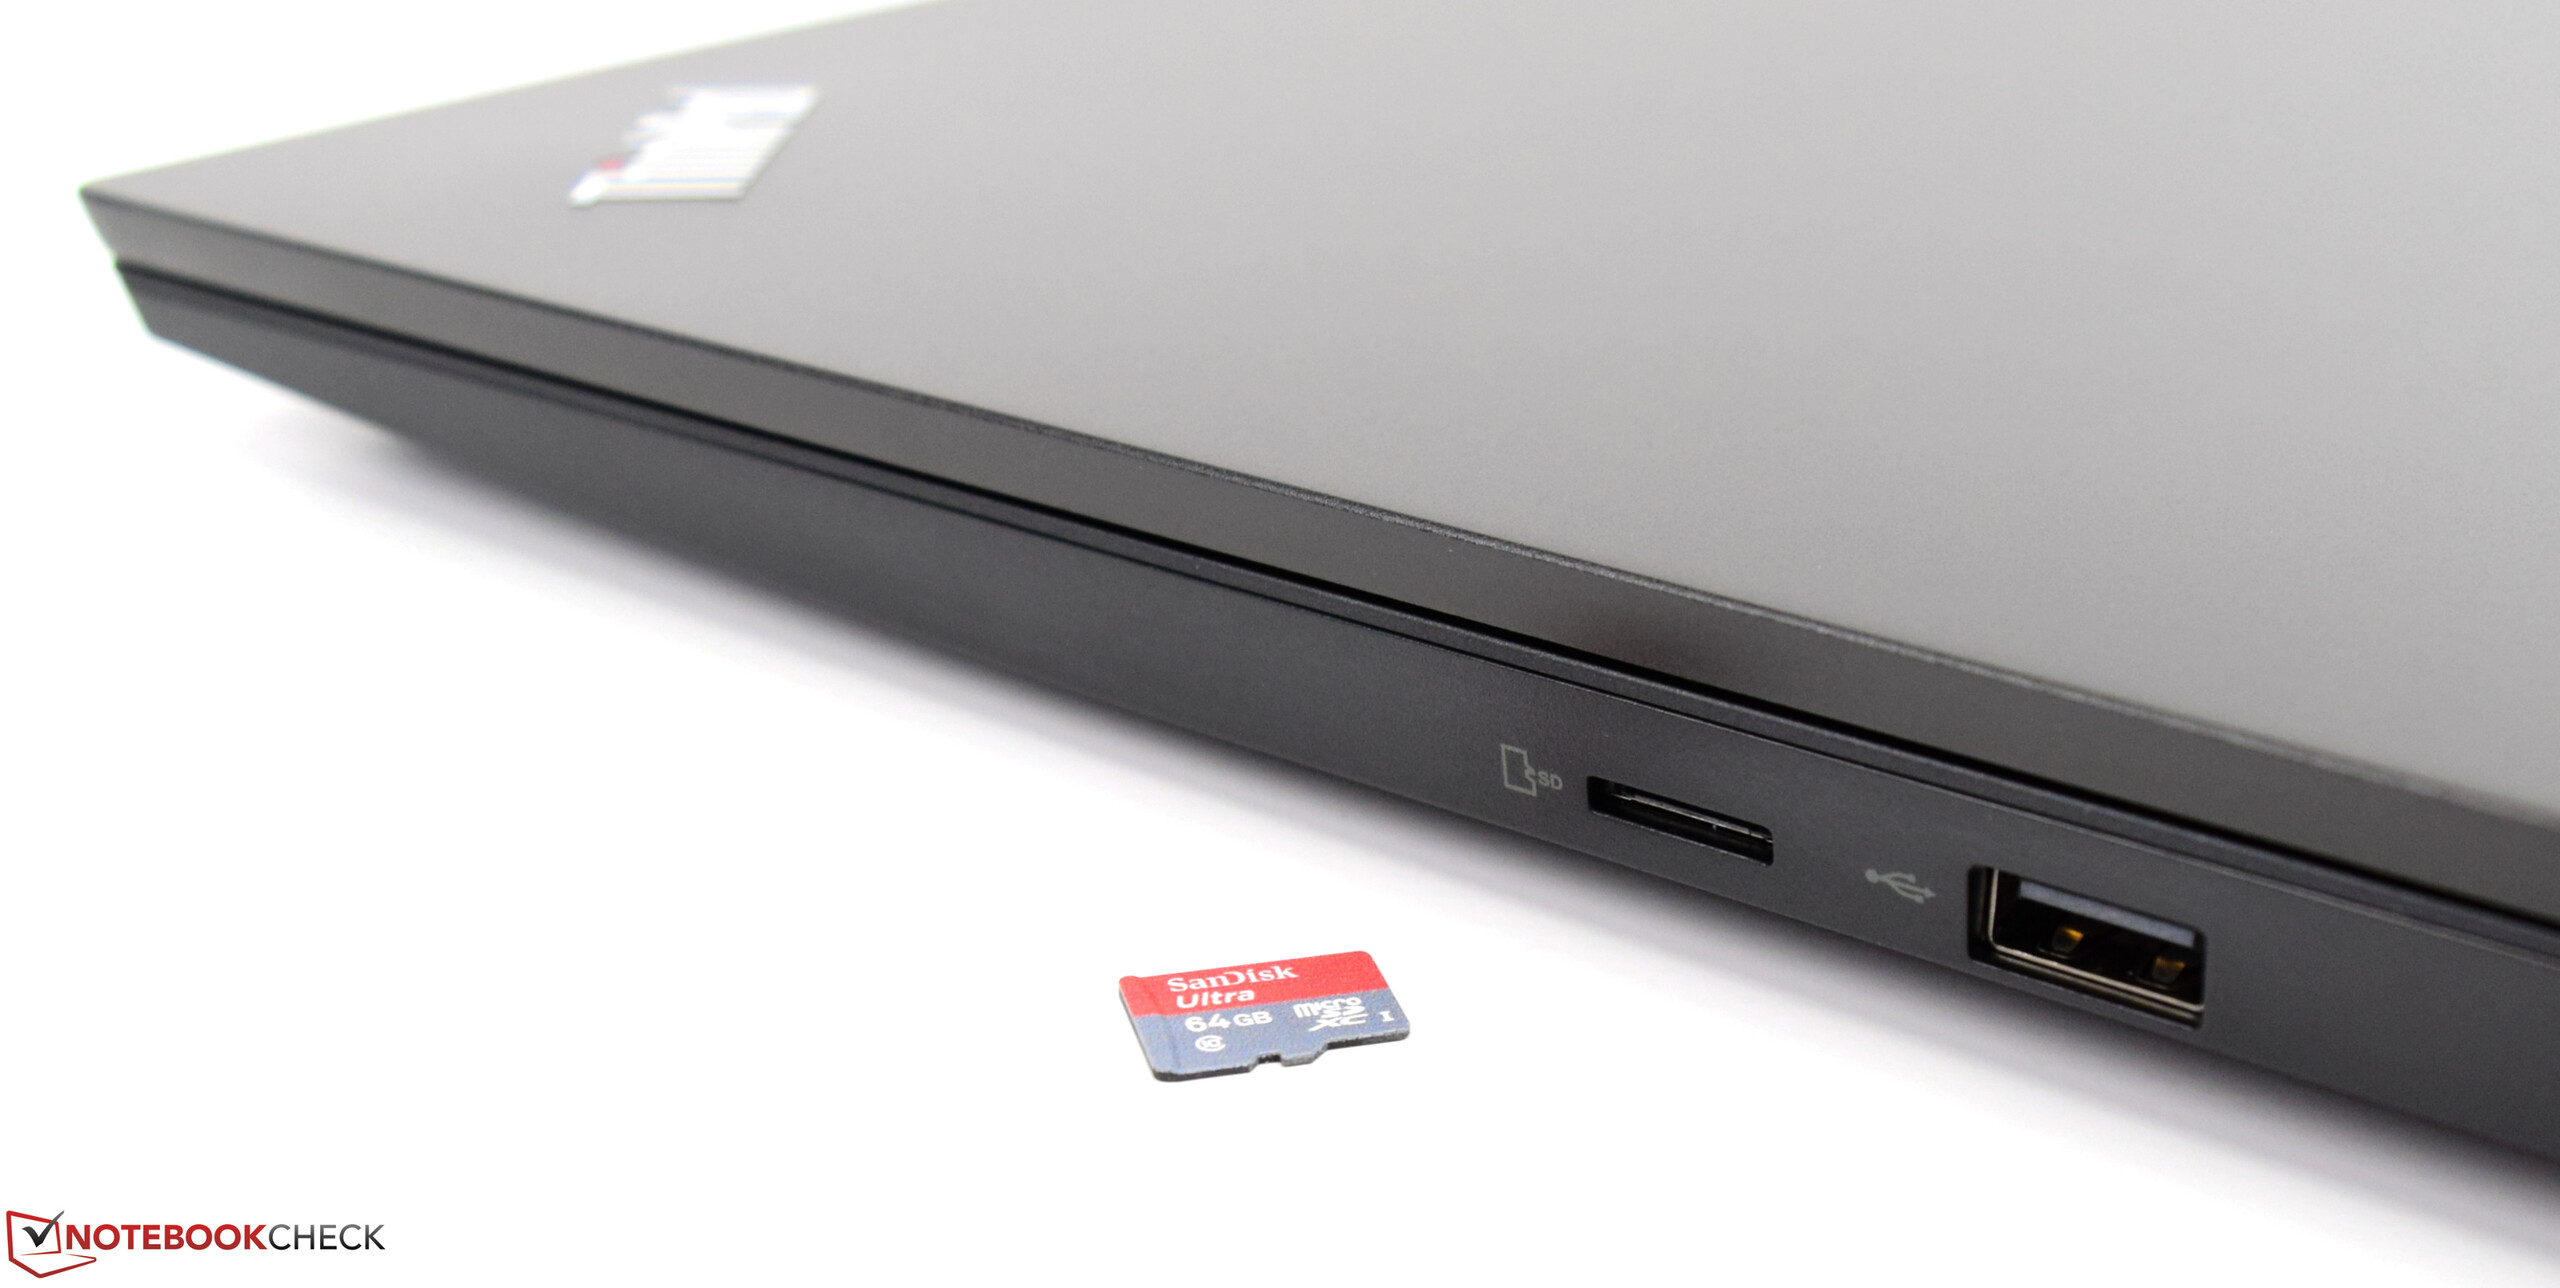
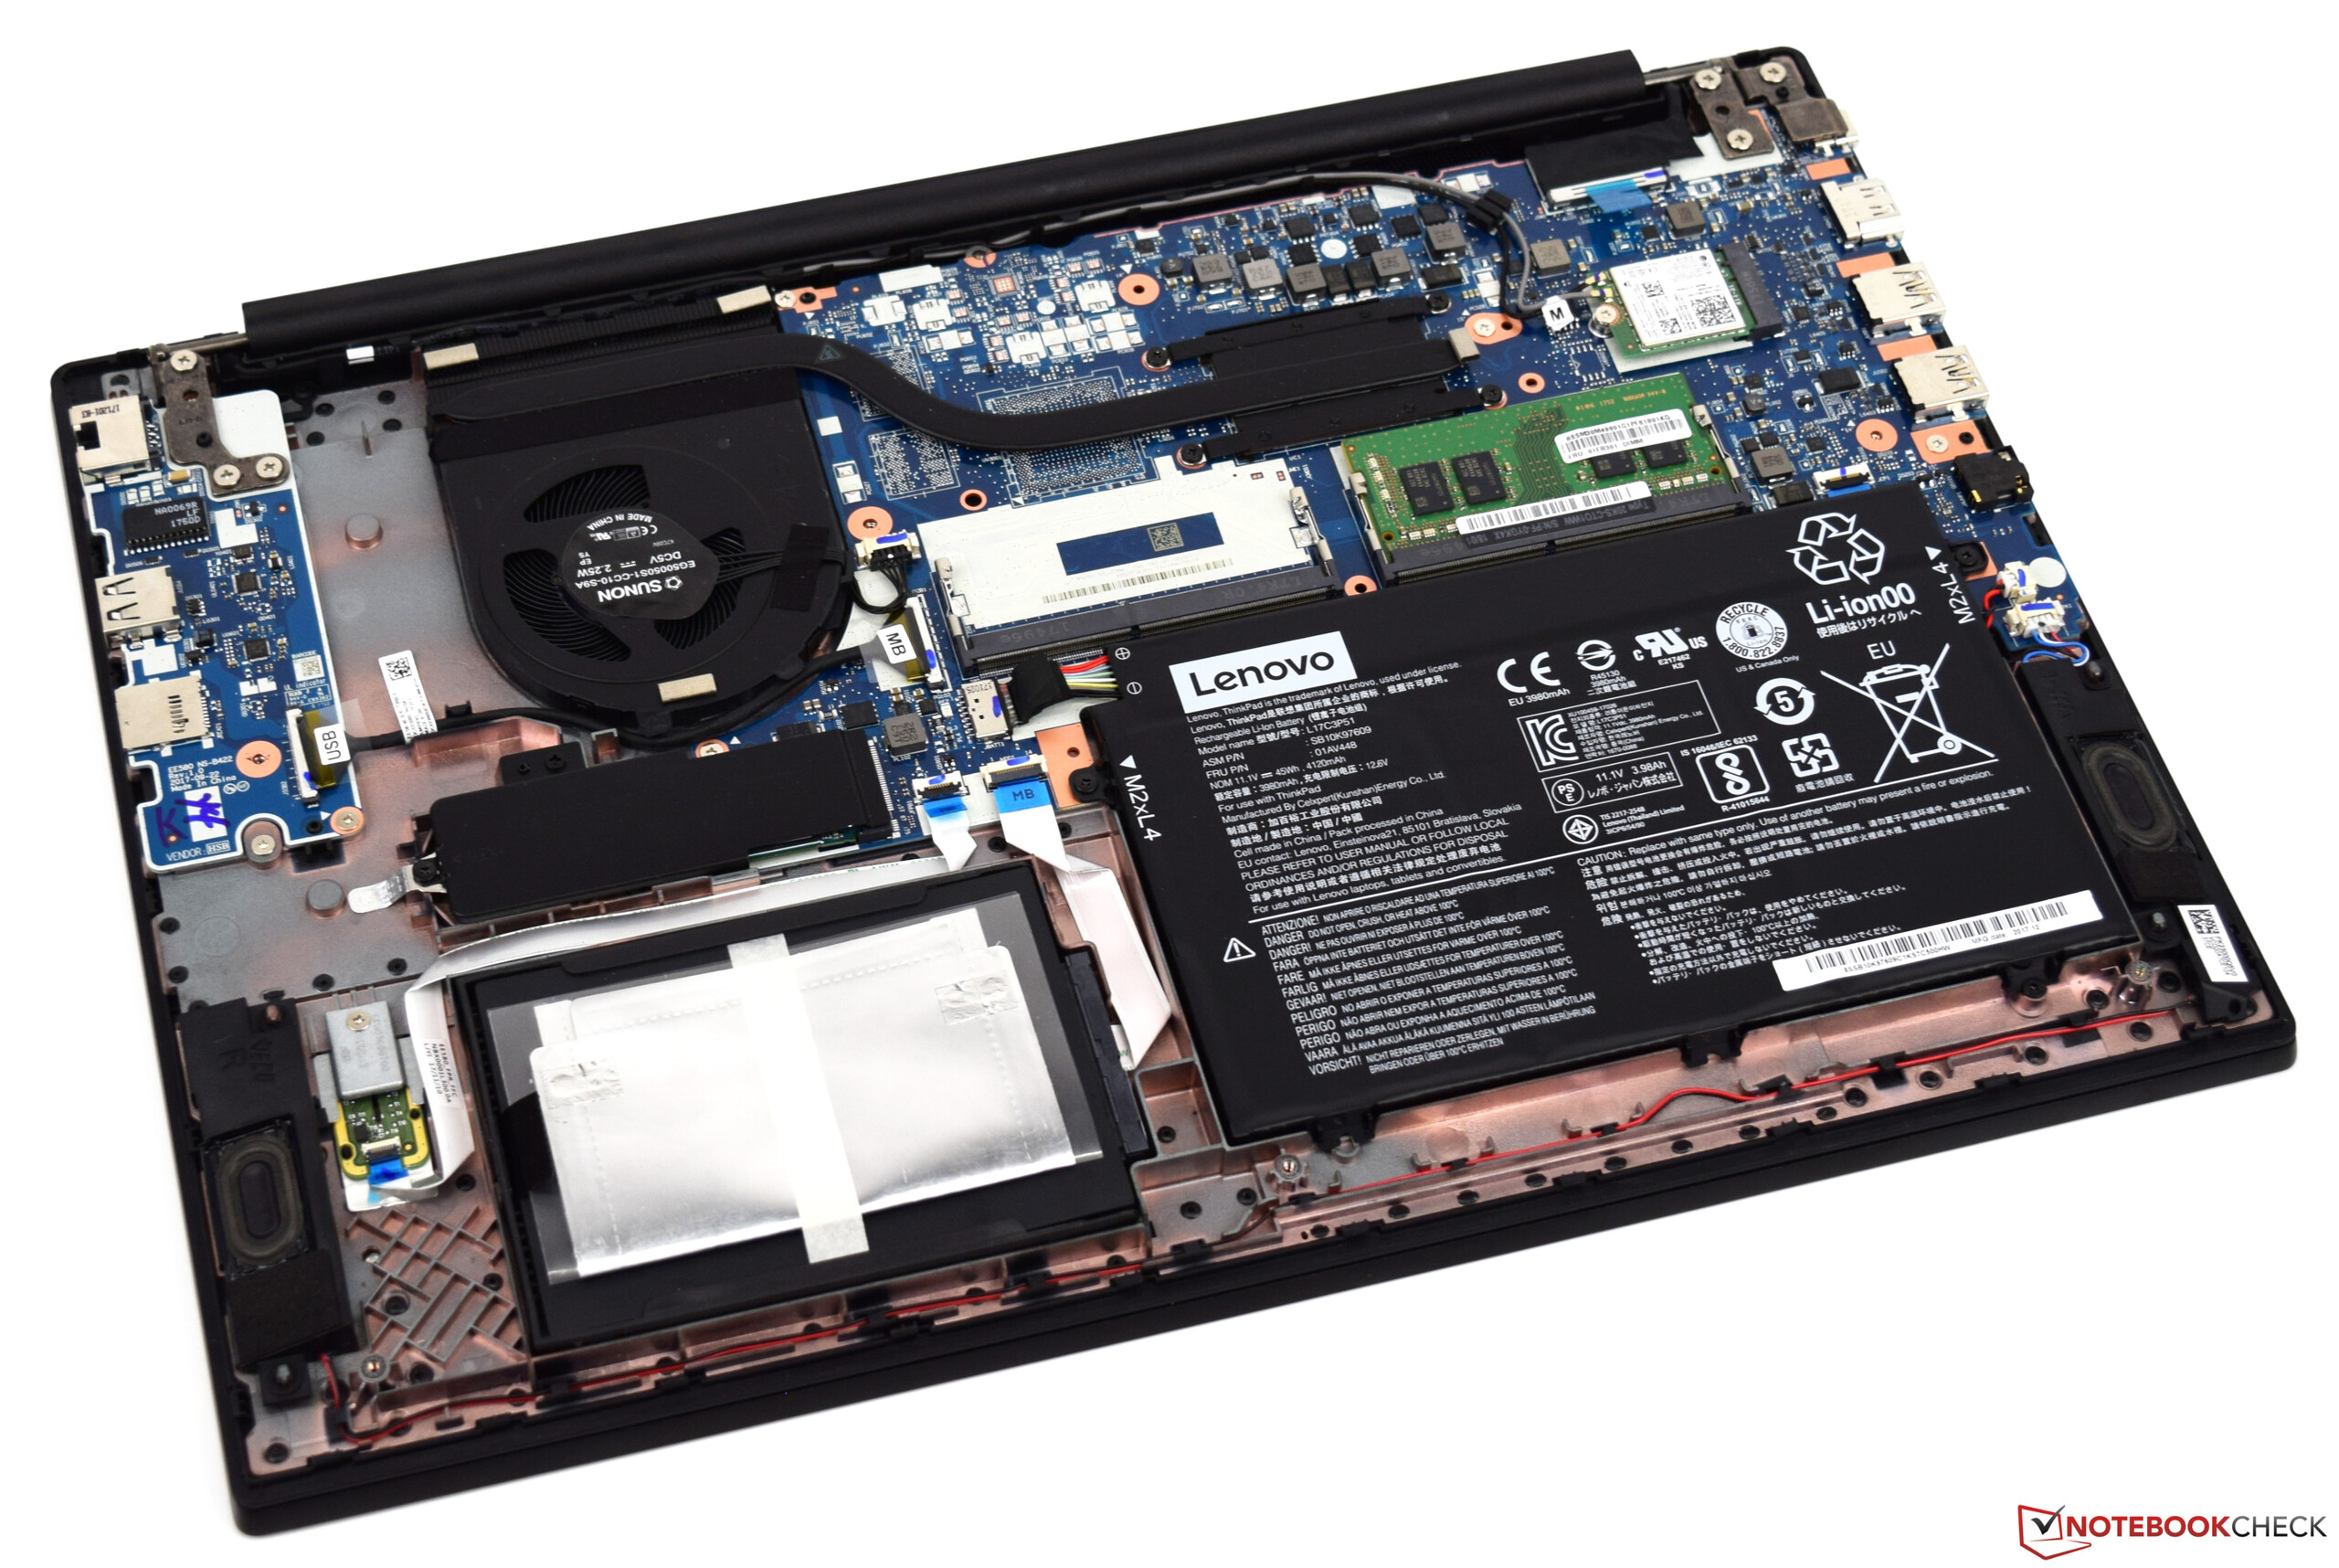
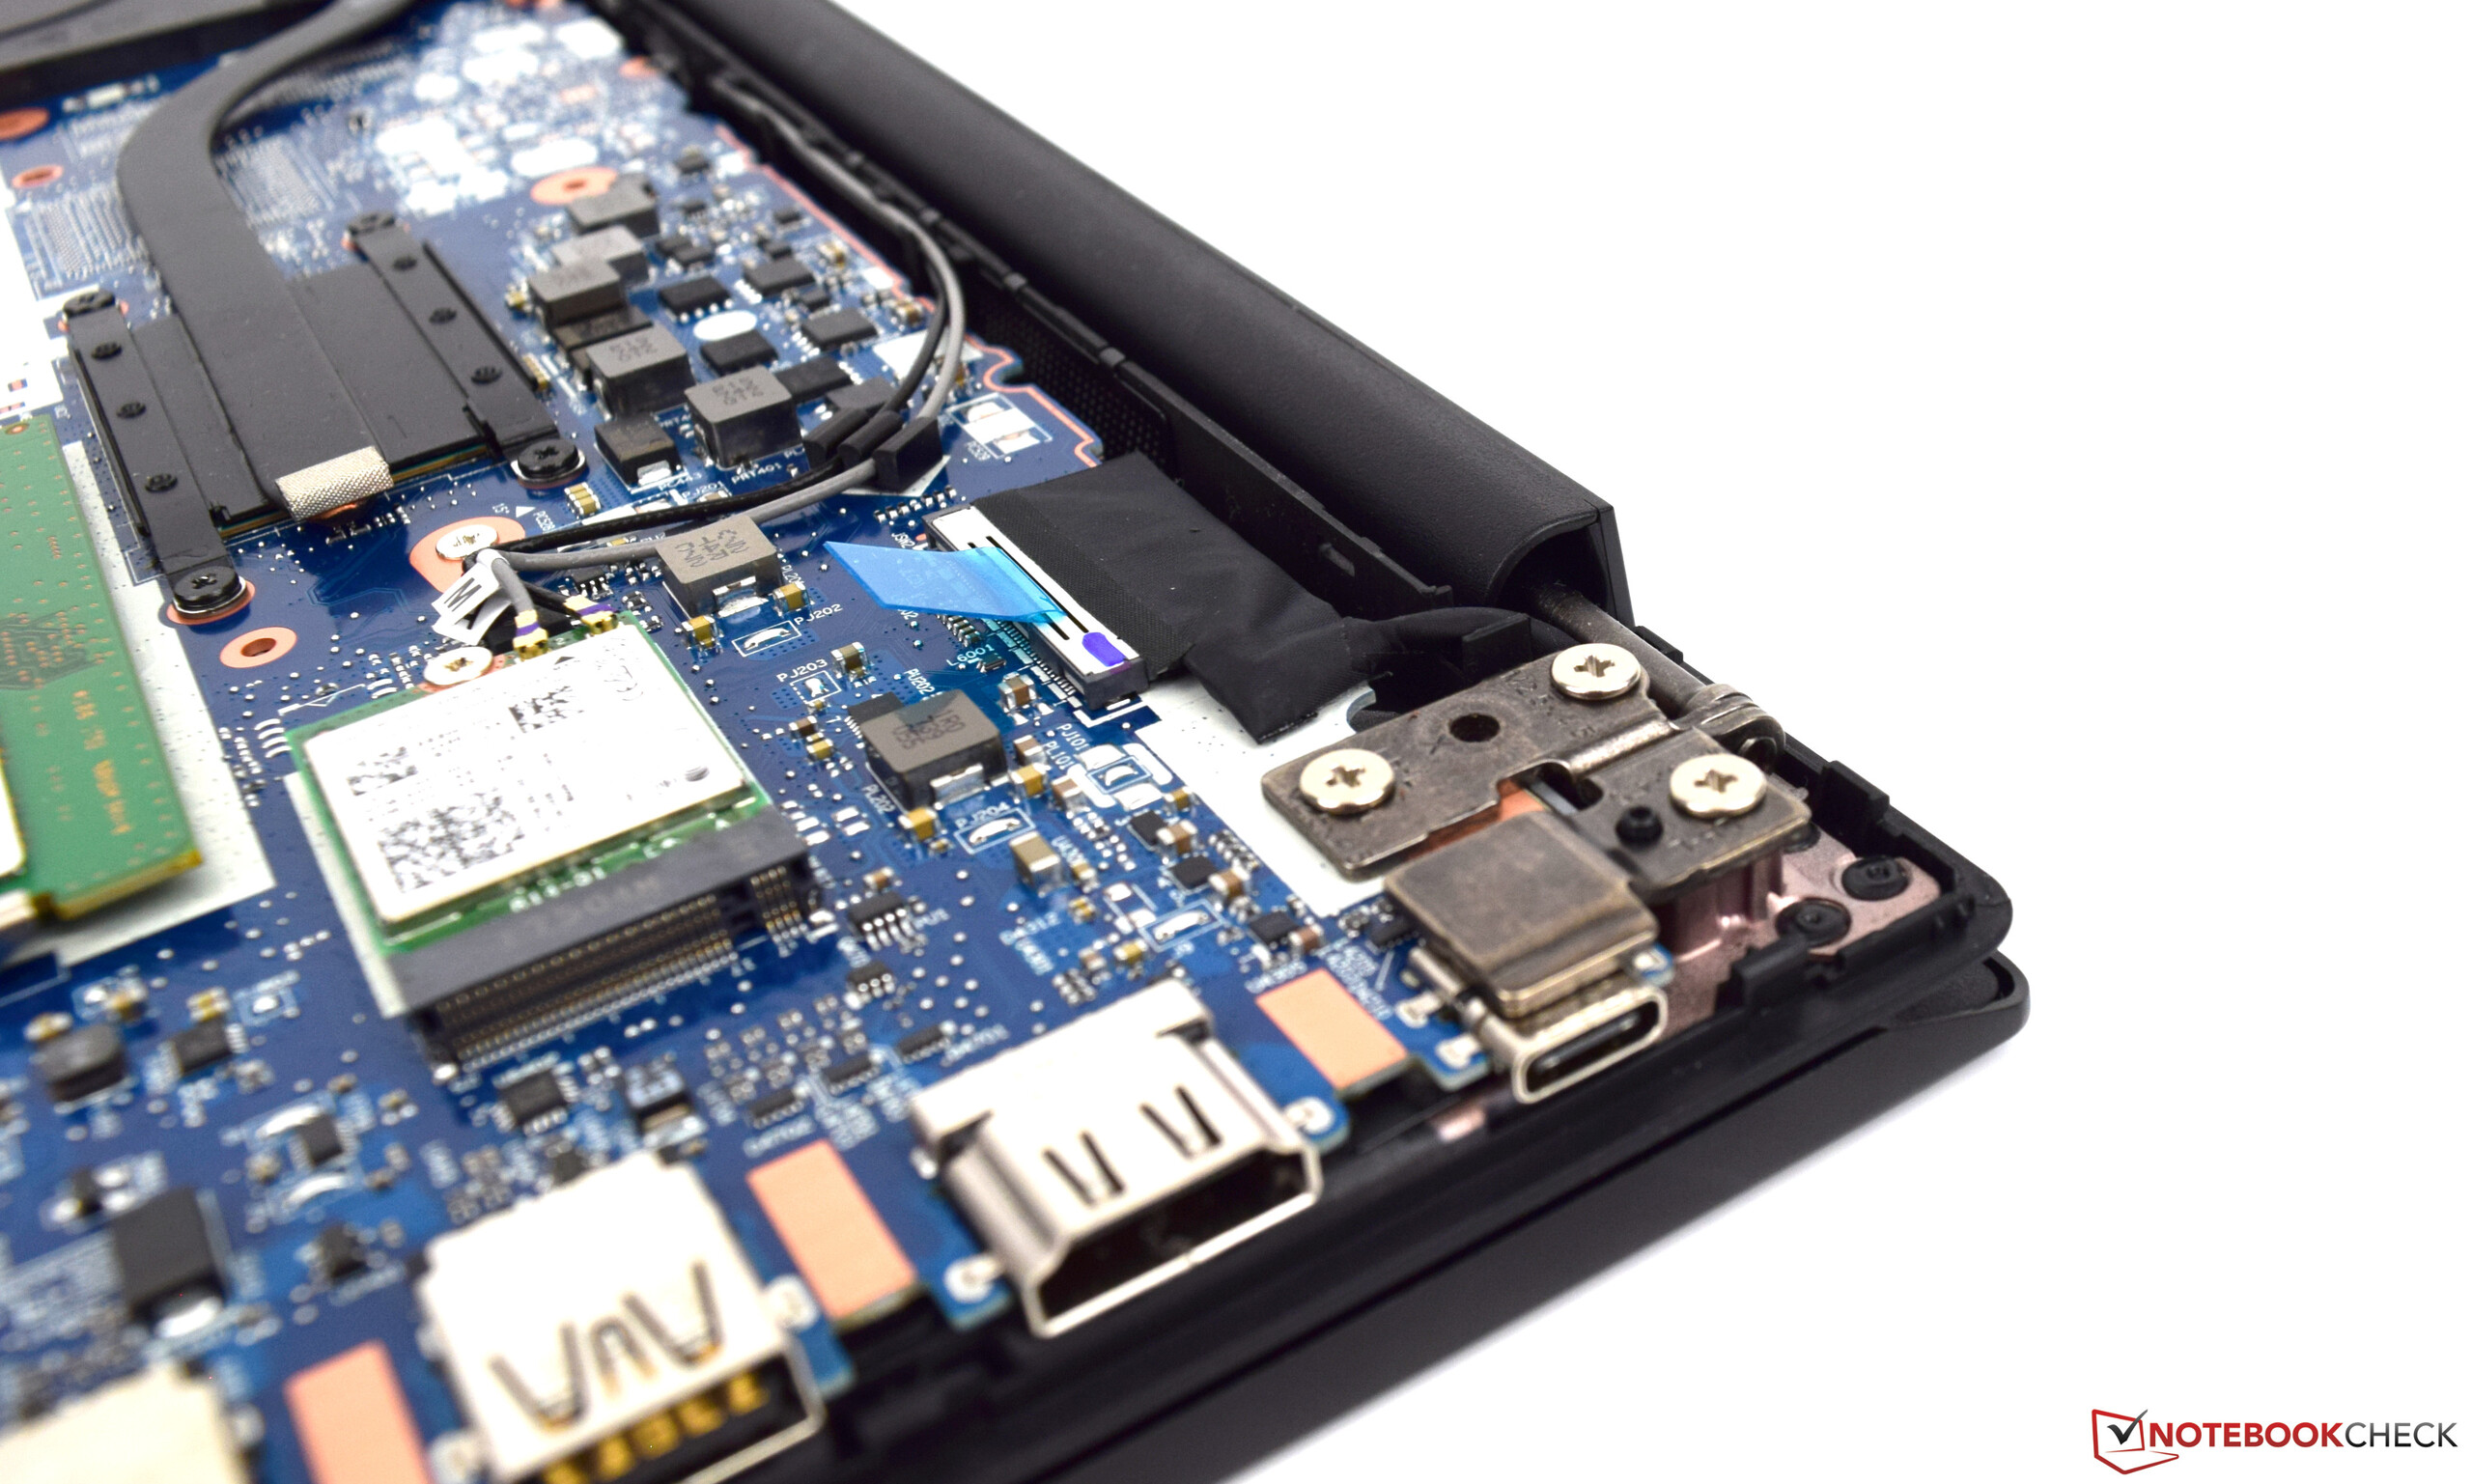
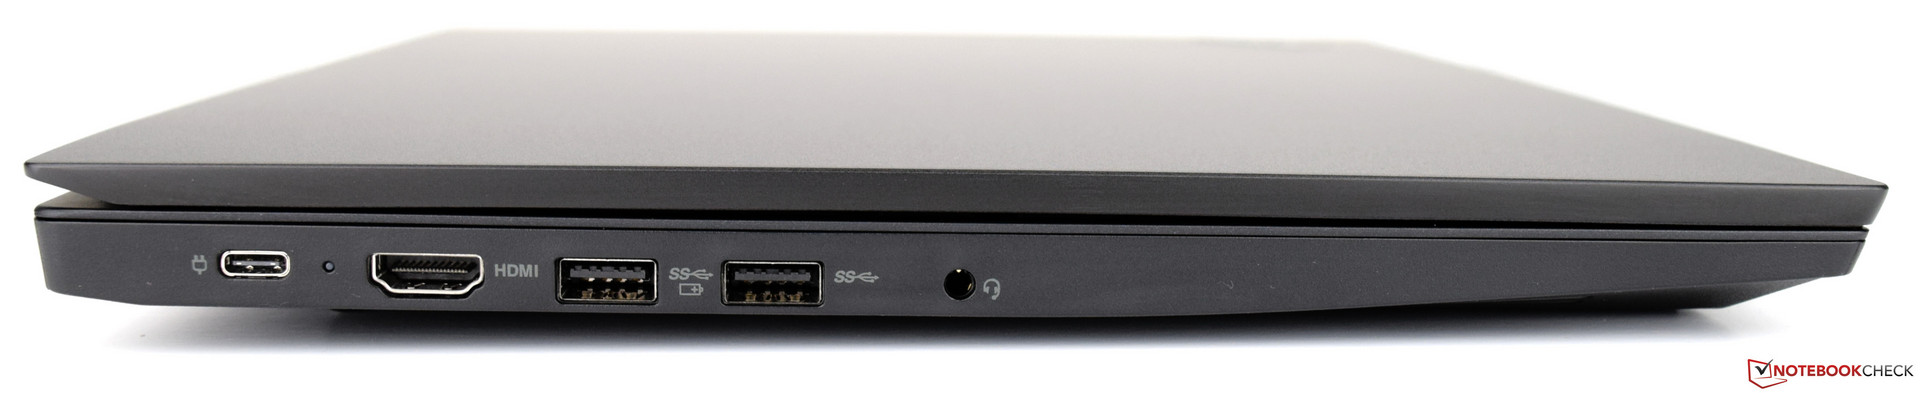
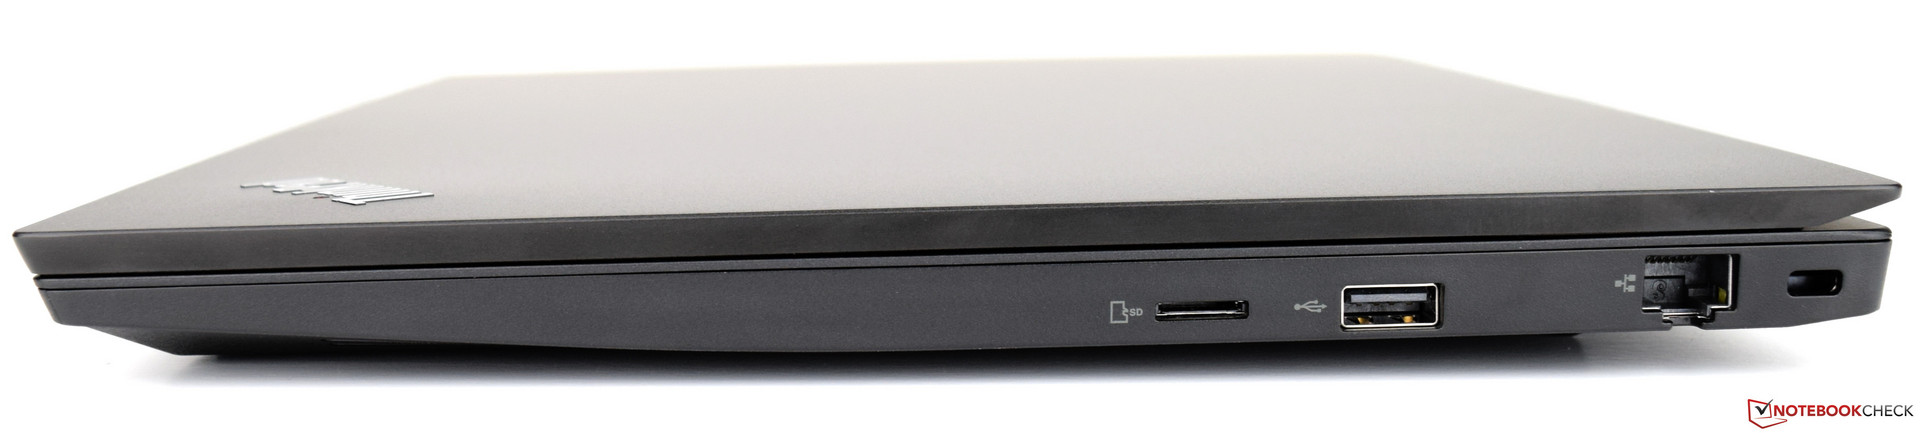
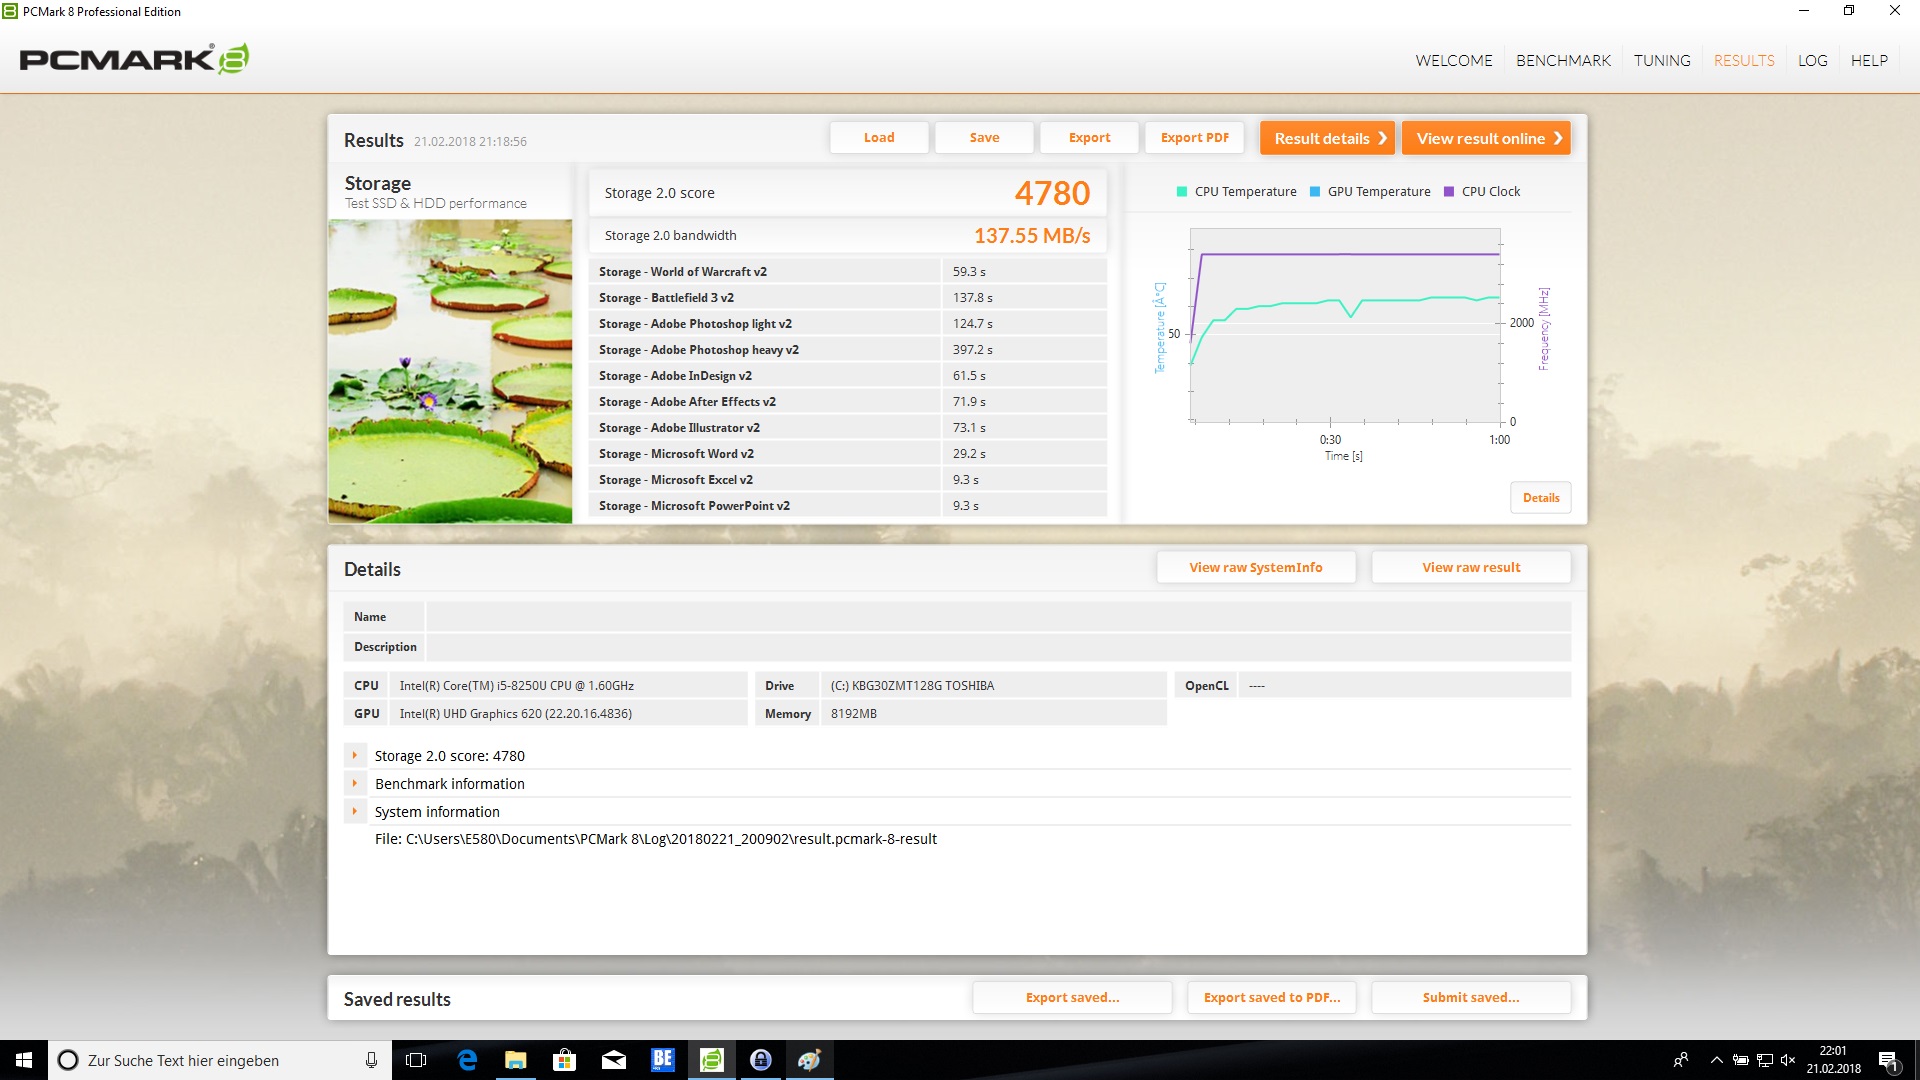
Behalve de hoge bouwkwaliteit willen we ook de gerenommeerde invoerapparaten en de uitbreidbaarheid van de notebook benadrukken, al is er bij de laatste geen aparte onderhoudsopening. Hoewel de 128 GB SSD wat aan de krappe kant is, is dit zeker beter dan een traditionele harde schijf, ondanks de relatief slechte prestaties van de SSD. We vermoeden dat deze veroorzaakt worden door driver compatibiliteits-problemen. Een ander nadeel in de E580 is de MicroSD-kaartlezer - een onbegrijpelijke regressie ten opzichte van het model van vorig jaar.
Lenovo ThinkPad E580-20KSCTO1WW
- 06-03-2018 v6 (old)
Sebastian Bade
Price comparison
