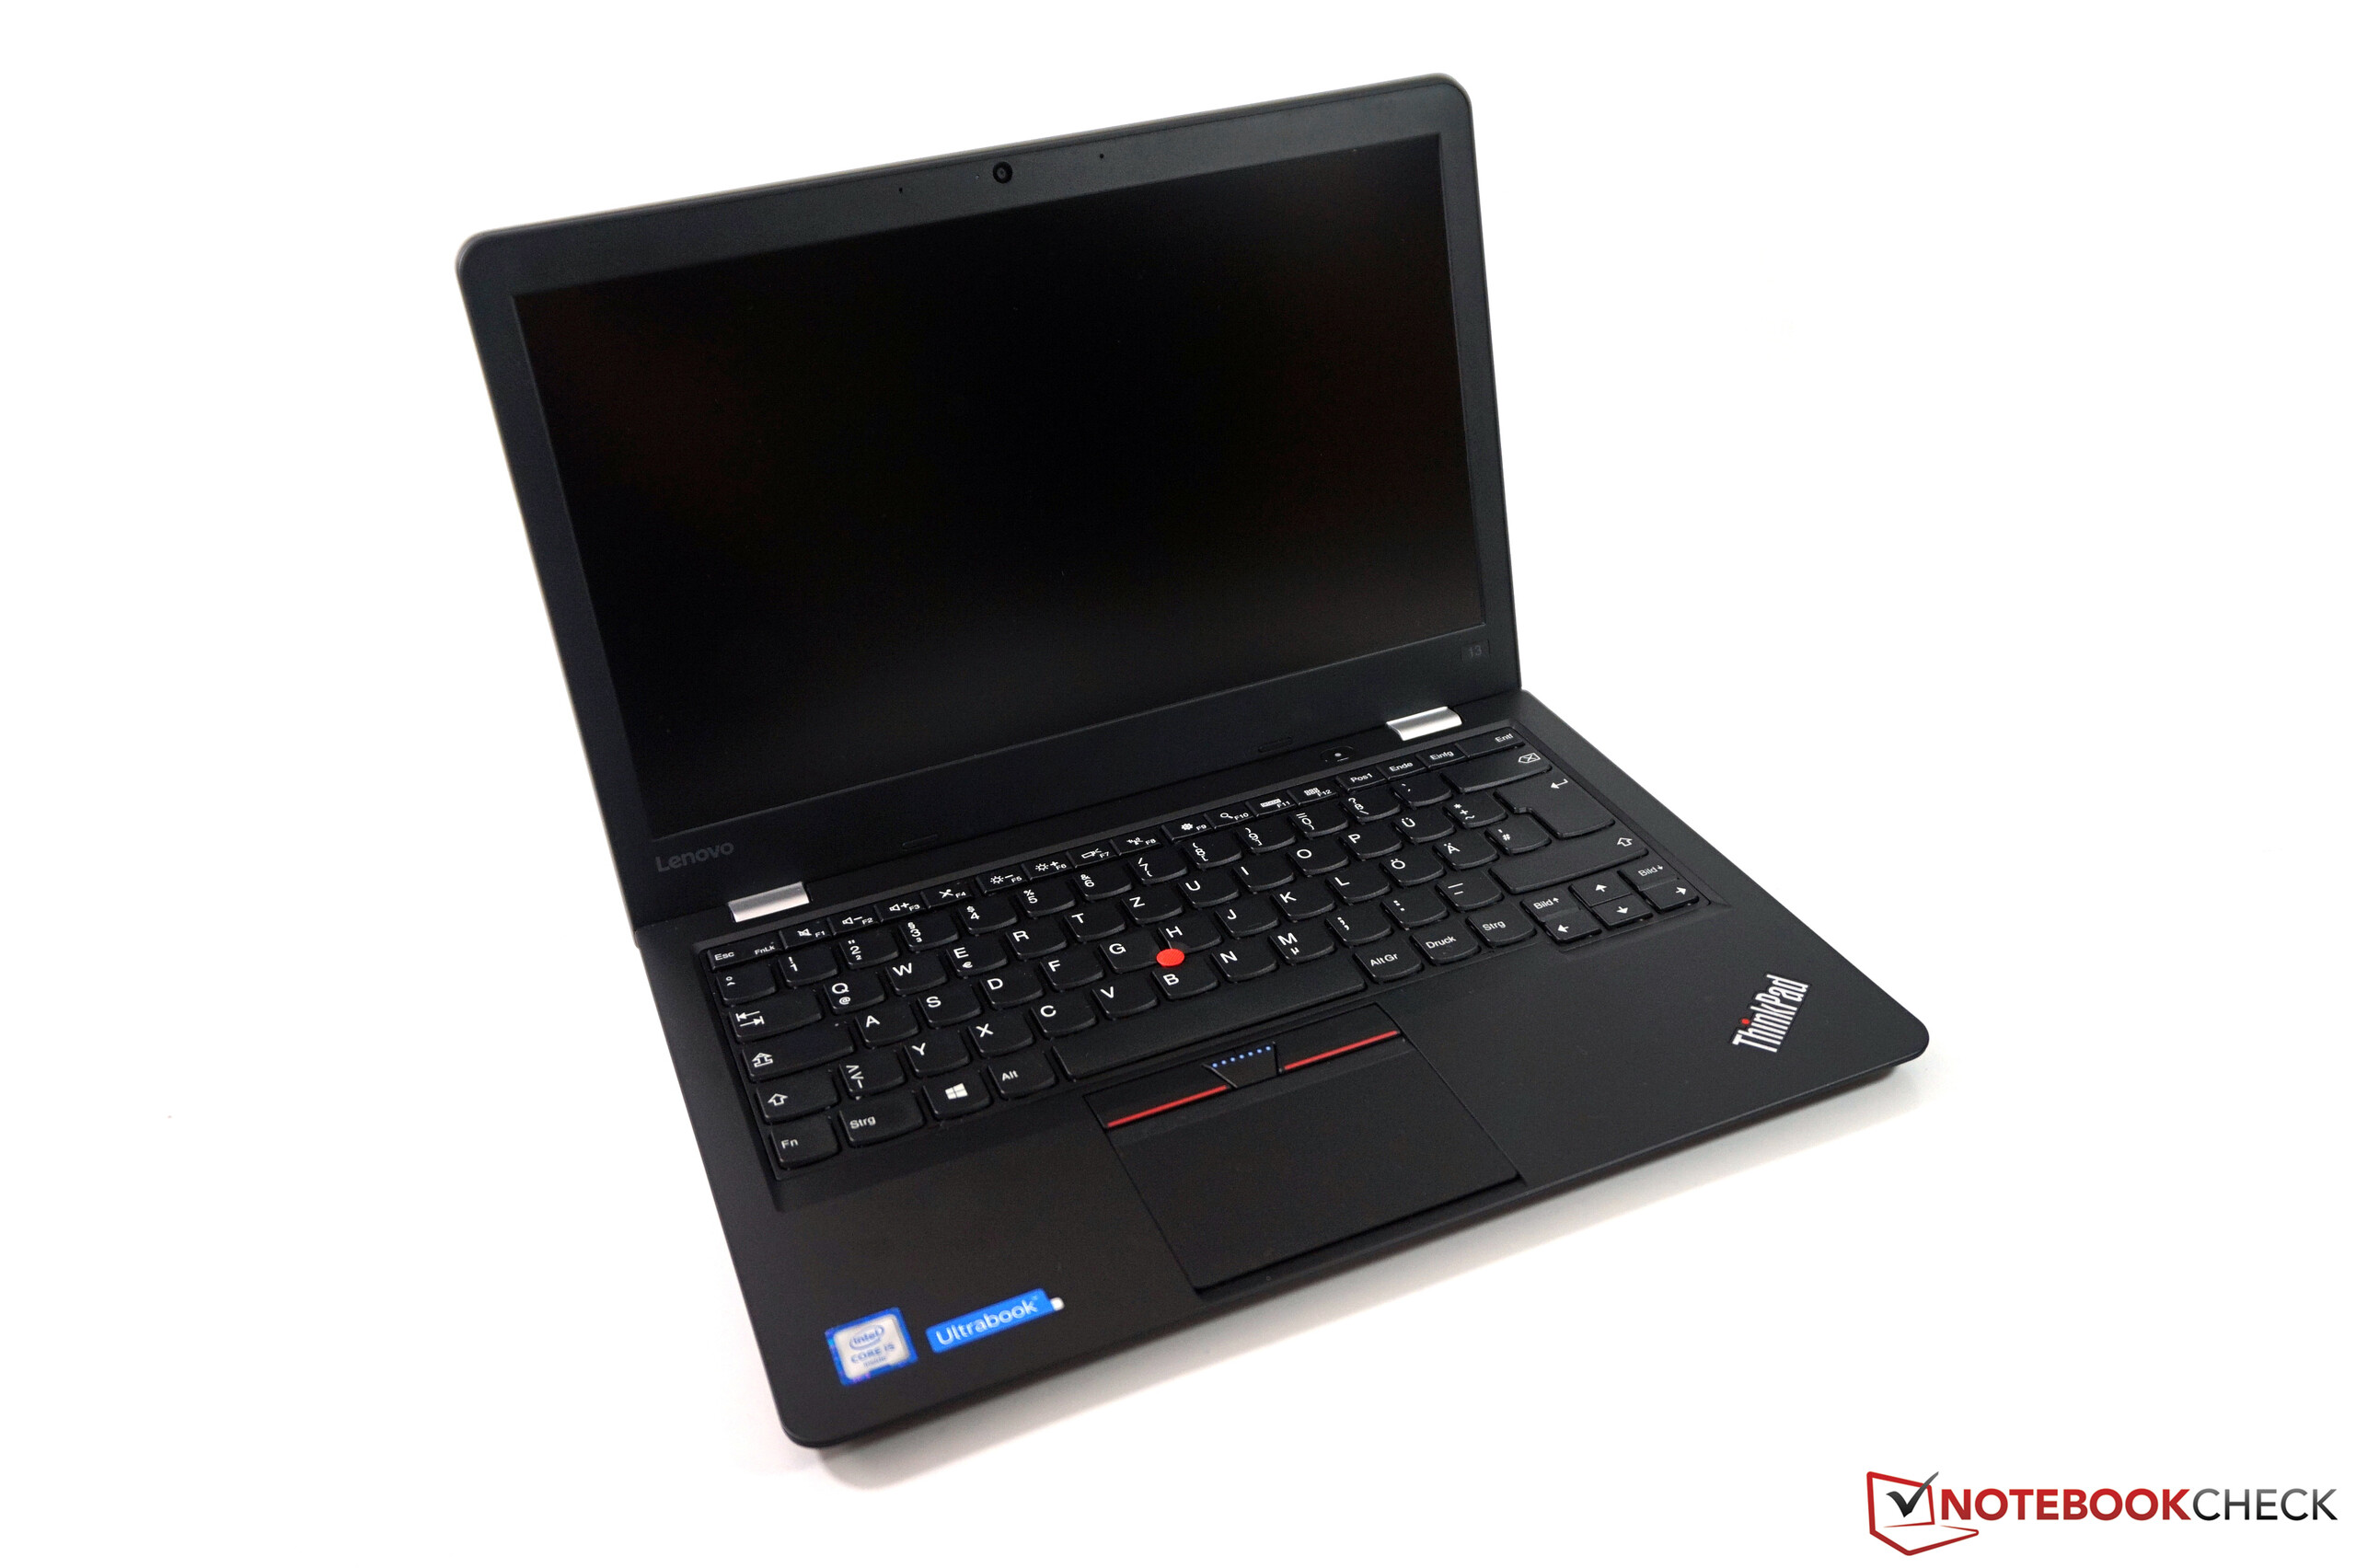
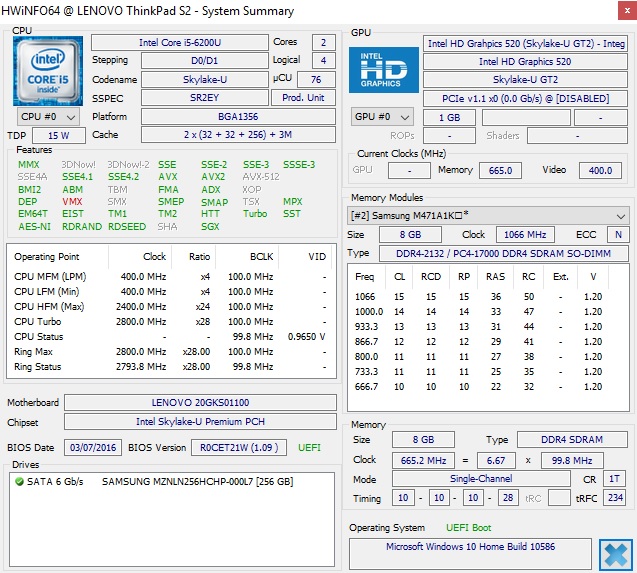
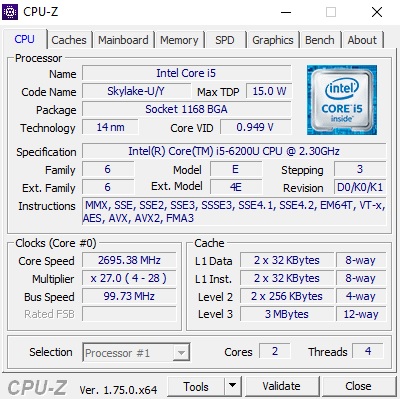
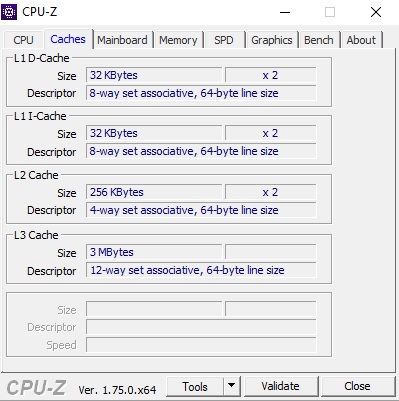
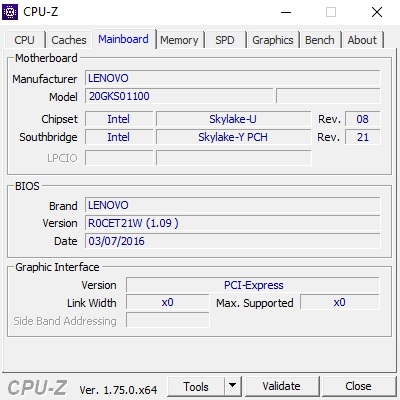
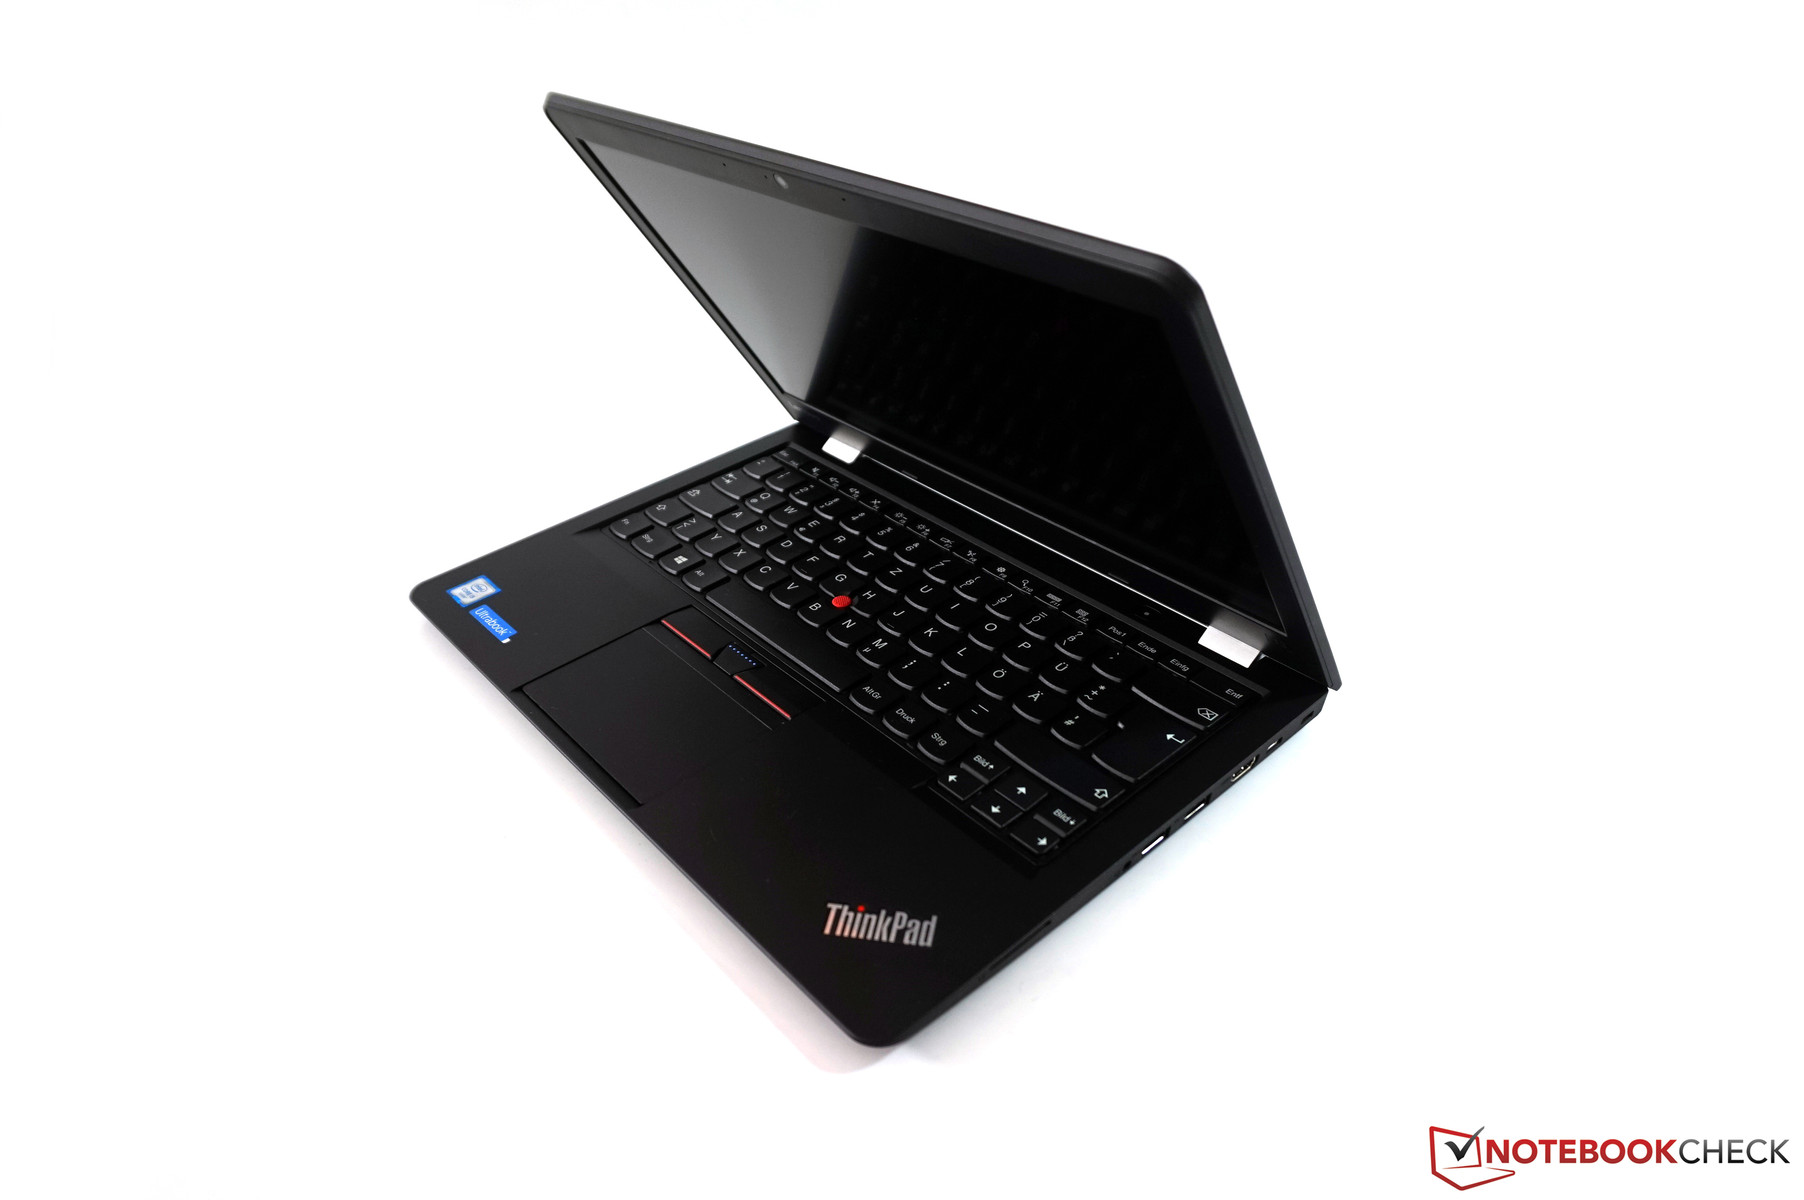
Kort testrapport Lenovo ThinkPad 13 Ultrabook
Screen Flickering / PWM (Pulse-Width Modulation)
| Screen flickering / PWM niet waargenomen | ||
Ter vergelijking: 52 % van alle geteste toestellen maakten geen gebruik van PWM om de schermhelderheid te verlagen. Als het wel werd gebruikt, werd een gemiddelde van 7751 (minimum: 5 - maximum: 343500) Hz waargenomen. | ||
| |||||||||||||||||||||||||
Helderheidsverdeling: 86 %
Helderheid in Batterij-modus: 233 cd/m²
Contrast: 1059:1 (Zwart: 0.22 cd/m²)
ΔE ColorChecker Calman: 5.41 | ∀{0.5-29.43 Ø4.71}
ΔE Greyscale Calman: 4.15 | ∀{0.09-98 Ø4.96}
57.16% sRGB (Argyll 1.6.3 3D)
36.52% AdobeRGB 1998 (Argyll 1.6.3 3D)
39.66% AdobeRGB 1998 (Argyll 3D)
57.4% sRGB (Argyll 3D)
38.35% Display P3 (Argyll 3D)
Gamma: 2.45
CCT: 6773 K
| Lenovo ThinkPad 13-20GKS01100 1920x1080, LP133WF2-SPL1 | Lenovo ThinkPad T460-20FN003LGE IPS, 1920x1080, Lenovo LEN40A9 / N140HCE-EAA | Acer TravelMate P238-M-5575 TN LED, 1366x768, AU Optronics B133XTN01.6 | Asus Zenbook UX303UA-FN121T TN LED, 1366x768, BOE HF HB133WX1-402 | Acer Aspire S 13 S5-371-71QZ IPS, 1920x1080, AUO B133HAN04.1 | Dell XPS 13-9350 IPS, 1920x1080, SHP1420 | Lenovo ThinkPad T460s-20F9003SGE IPS, 1920x1080, N140HCE-EAA, LEN40A9 | |
|---|---|---|---|---|---|---|---|
| Display | 9% | -3% | 12% | 16% | 8% | ||
| Display P3 Coverage (%) | 38.35 | 42.09 10% | 37.25 -3% | 43.08 12% | 44.53 16% | 41.65 9% | |
| sRGB Coverage (%) | 57.4 | 62 8% | 56.1 -2% | 64.8 13% | 66.8 16% | 61.6 7% | |
| AdobeRGB 1998 Coverage (%) | 39.66 | 43.6 10% | 38.49 -3% | 44.52 12% | 45.97 16% | 43.14 9% | |
| Response Times | 5% | -1% | 46% | -13% | -3% | ||
| Response Time Grey 50% / Grey 80% * (ms) | 43.2 ? | 42.4 ? 2% | 42 ? 3% | 23 ? 47% | 50 ? -16% | 42 ? 3% | |
| Response Time Black / White * (ms) | 26.8 ? | 24.8 ? 7% | 28 ? -4% | 15 ? 44% | 29.6 ? -10% | 29.2 ? -9% | |
| PWM Frequency (Hz) | 192 ? | ||||||
| Screen | -16% | -64% | -4% | 20% | 14% | -8% | |
| Brightness middle (cd/m²) | 233 | 230 -1% | 226 -3% | 203 -13% | 375 61% | 277.5 19% | 226 -3% |
| Brightness (cd/m²) | 227 | 216 -5% | 216 -5% | 193 -15% | 358 58% | 276 22% | 211 -7% |
| Brightness Distribution (%) | 86 | 85 -1% | 91 6% | 84 -2% | 87 1% | 88 2% | 89 3% |
| Black Level * (cd/m²) | 0.22 | 0.26 -18% | 0.49 -123% | 0.49 -123% | 0.39 -77% | 0.191 13% | 0.22 -0% |
| Contrast (:1) | 1059 | 885 -16% | 461 -56% | 414 -61% | 962 -9% | 1453 37% | 1027 -3% |
| Colorchecker dE 2000 * | 5.41 | 7.32 -35% | 13.15 -143% | 3.2 41% | 4.6 15% | 4.88 10% | 6.44 -19% |
| Colorchecker dE 2000 max. * | 13.61 | 18.14 -33% | 21.96 -61% | 4.13 70% | 8.8 35% | 17.18 -26% | |
| Greyscale dE 2000 * | 4.15 | 6.98 -68% | 14.47 -249% | 2.77 33% | 4 4% | 4.26 -3% | 5.87 -41% |
| Gamma | 2.45 90% | 2.5 88% | 2.73 81% | 2.46 89% | 2.34 94% | 2.59 85% | 2.37 93% |
| CCT | 6773 96% | 6683 97% | 19989 33% | 7176 91% | 7304 89% | 6562 99% | 6856 95% |
| Color Space (Percent of AdobeRGB 1998) (%) | 36.52 | 39.97 9% | 36 -1% | 41 12% | 57.9 59% | 41.6 14% | 39.58 8% |
| Color Space (Percent of sRGB) (%) | 57.16 | 61.55 8% | 56 -2% | 65 14% | 88.7 55% | 65.79 15% | 61.15 7% |
| Totaal Gemiddelde (Programma / Instellingen) | -1% /
-8% | -23% /
-43% | 18% /
6% | 4% /
15% | 15% /
15% | -1% /
-4% |
* ... kleiner is beter
Responstijd Scherm
| ↔ Responstijd Zwart naar Wit | ||
|---|---|---|
| 26.8 ms ... stijging ↗ en daling ↘ gecombineerd | ↗ 9.6 ms stijging | |
| ↘ 17.2 ms daling | ||
| Het scherm vertoonde relatief trage responstijden in onze tests en is misschien te traag voor games. Ter vergelijking: alle testtoestellen variëren van 0.1 (minimum) tot 240 (maximum) ms. » 67 % van alle toestellen zijn beter. Dit betekent dat de gemeten responstijd slechter is dan het gemiddelde (19.8 ms) van alle geteste toestellen. | ||
| ↔ Responstijd 50% Grijs naar 80% Grijs | ||
| 43.2 ms ... stijging ↗ en daling ↘ gecombineerd | ↗ 19.6 ms stijging | |
| ↘ 23.6 ms daling | ||
| Het scherm vertoonde trage responstijden in onze tests en is misschien te traag voor games. Ter vergelijking: alle testtoestellen variëren van 0.165 (minimum) tot 636 (maximum) ms. » 72 % van alle toestellen zijn beter. Dit betekent dat de gemeten responstijd slechter is dan het gemiddelde (31 ms) van alle geteste toestellen. | ||
| PCMark 8 Home Score Accelerated v2 | 3024 punten | |
| PCMark 8 Creative Score Accelerated v2 | 3651 punten | |
| PCMark 8 Work Score Accelerated v2 | 4041 punten | |
Help | ||

| Lenovo ThinkPad 13-20GKS01100 Samsung SSD PM871 MZNLN256HCHP | Lenovo ThinkPad T460-20FN003LGE Toshiba HG6 THNSFJ256GCSU | Acer TravelMate P238-M-5575 Samsung SSD PM871 MZNLN256HCHP | Acer Aspire S 13 S5-371-71QZ LiteOn CV1-8B512 | Dell XPS 13-9350 Samsung PM951 NVMe MZ-VLV256D | Lenovo ThinkPad T460s-20F9003SGE Samsung CM871 MZ7LF192HCGS | |
|---|---|---|---|---|---|---|
| CrystalDiskMark 3.0 | -4% | 3% | 7% | 31% | -51% | |
| Write 4k QD32 (MB/s) | 276.2 | 216 -22% | 234.4 -15% | 211.2 -24% | 151.5 -45% | 36.43 -87% |
| Read 4k QD32 (MB/s) | 360.9 | 369.9 2% | 235.6 -35% | 301.3 -17% | 244.7 -32% | 94.9 -74% |
| Write 4k (MB/s) | 68.5 | 72.9 6% | 85.2 24% | 86.8 27% | 113 65% | 35.47 -48% |
| Read 4k (MB/s) | 31.85 | 21.7 -32% | 33.03 4% | 29.69 -7% | 38.52 21% | 5.78 -82% |
| Write 512 (MB/s) | 298.4 | 232.7 -22% | 305.1 2% | 389.7 31% | 308.6 3% | 167.2 -44% |
| Read 512 (MB/s) | 351.6 | 371.3 6% | 459.9 31% | 341.3 -3% | 684 95% | 259.2 -26% |
| Write Seq (MB/s) | 297.8 | 394.4 32% | 307.6 3% | 418.9 41% | 307.7 3% | 171.1 -43% |
| Read Seq (MB/s) | 461.7 | 458.9 -1% | 517 12% | 502 9% | 1097 138% | 446.5 -3% |
| 3DMark 06 Standard Score | 7597 punten | |
| 3DMark 11 Performance | 1372 punten | |
| 3DMark Cloud Gate Standard Score | 4922 punten | |
| 3DMark Fire Strike Score | 678 punten | |
Help | ||
| lage | gem. | hoge | ultra | |
|---|---|---|---|---|
| Tomb Raider (2013) | 49.7 | 25.2 | 16.6 | |
| BioShock Infinite (2013) | 35.28 | 20.31 | 16.9 | |
| The Witcher 3 (2015) | 11.89 |
Geluidsniveau
| Onbelast |
| 29.1 / 29.1 / 29.1 dB (A) |
| Belasting |
| 31.5 / 33.5 dB (A) |
 | ||
30 dB stil 40 dB(A) hoorbaar 50 dB(A) luid |
||
min: | ||
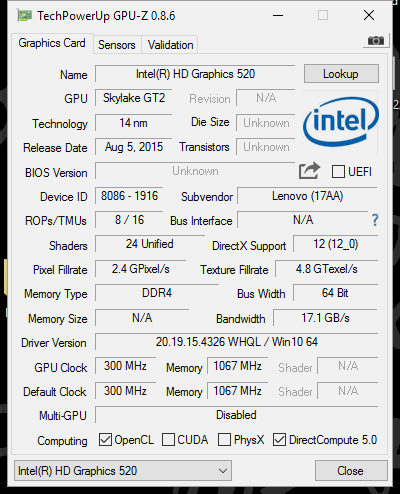
| Lenovo ThinkPad 13-20GKS01100 6200U, HD Graphics 520 | Lenovo ThinkPad T460-20FN003LGE 6200U, HD Graphics 520 | Acer TravelMate P238-M-5575 6200U, HD Graphics 520 | Asus Zenbook UX303UA-FN121T 6200U, HD Graphics 520 | Acer Aspire S 13 S5-371-71QZ 6500U, HD Graphics 520 | Dell XPS 13-9350 6200U, HD Graphics 520 | Lenovo ThinkPad T460s-20F9003SGE 6200U, HD Graphics 520 | |
|---|---|---|---|---|---|---|---|
| Noise | -4% | -9% | -8% | -8% | 4% | -2% | |
| uit / omgeving * (dB) | 29.1 | 29 -0% | 31.2 -7% | 31.2 -7% | 29.1 -0% | ||
| Idle Minimum * (dB) | 29.1 | 29 -0% | 31.2 -7% | 32.6 -12% | 31.2 -7% | 28.2 3% | 29.1 -0% |
| Idle Average * (dB) | 29.1 | 29 -0% | 31.2 -7% | 32.7 -12% | 31.2 -7% | 28.3 3% | 29.1 -0% |
| Idle Maximum * (dB) | 29.1 | 29 -0% | 31.2 -7% | 32.7 -12% | 31.5 -8% | 28.4 2% | 29.1 -0% |
| Load Average * (dB) | 31.5 | 34.2 -9% | 35.71 -13% | 33.4 -6% | 35.7 -13% | 30.2 4% | 32.3 -3% |
| Load Maximum * (dB) | 33.5 | 37.8 -13% | 38.1 -14% | 33.4 -0% | 35.8 -7% | 30.2 10% | 36.6 -9% |
* ... kleiner is beter
(±) De maximumtemperatuur aan de bovenzijde bedraagt 43.7 °C / 111 F, vergeleken met het gemiddelde van 34.3 °C / 94 F, variërend van 21.2 tot 62.5 °C voor de klasse Office.
(±) De bodem warmt op tot een maximum van 44.2 °C / 112 F, vergeleken met een gemiddelde van 36.8 °C / 98 F
(+) Bij onbelast gebruik bedraagt de gemiddelde temperatuur voor de bovenzijde 28.5 °C / 83 F, vergeleken met het apparaatgemiddelde van 29.5 °C / 85 F.
(+) De palmsteunen en het touchpad zijn met een maximum van ###max## °C / 80.2 F koeler dan de huidtemperatuur en voelen daarom koel aan.
(±) De gemiddelde temperatuur van de handpalmsteun van soortgelijke toestellen bedroeg 27.5 °C / 81.5 F (+0.7 °C / 1.3 F).
| Lenovo ThinkPad 13-20GKS01100 6200U, HD Graphics 520 | Lenovo ThinkPad T460-20FN003LGE 6200U, HD Graphics 520 | Acer TravelMate P238-M-5575 6200U, HD Graphics 520 | Asus Zenbook UX303UA-FN121T 6200U, HD Graphics 520 | Acer Aspire S 13 S5-371-71QZ 6500U, HD Graphics 520 | Dell XPS 13-9350 6200U, HD Graphics 520 | Lenovo ThinkPad T460s-20F9003SGE 6200U, HD Graphics 520 | |
|---|---|---|---|---|---|---|---|
| Heat | 7% | 20% | 14% | 8% | 0% | 10% | |
| Maximum Upper Side * (°C) | 43.7 | 37.3 15% | 34.2 22% | 39.7 9% | 38.5 12% | 45.2 -3% | 41.4 5% |
| Maximum Bottom * (°C) | 44.2 | 44.3 -0% | 31 30% | 34.8 21% | 47.7 -8% | 45.2 -2% | 41 7% |
| Idle Upper Side * (°C) | 31.4 | 29 8% | 27.1 14% | 27.4 13% | 27.2 13% | 30.4 3% | 26.7 15% |
| Idle Bottom * (°C) | 32.1 | 30.1 6% | 27.7 14% | 27.7 14% | 27.4 15% | 31.2 3% | 27.8 13% |
* ... kleiner is beter
| Uit / Standby | |
| Inactief | |
| Belasting |
|
Key:
min: | |
| Lenovo ThinkPad 13-20GKS01100 6200U, HD Graphics 520, 1920x1080 | Lenovo ThinkPad T460-20FN003LGE 6200U, HD Graphics 520, 1920x1080 | Acer TravelMate P238-M-5575 6200U, HD Graphics 520, 1366x768 | Asus Zenbook UX303UA-FN121T 6200U, HD Graphics 520, 1366x768 | Acer Aspire S 13 S5-371-71QZ 6500U, HD Graphics 520, 1920x1080 | Lenovo ThinkPad T460s-20F9003SGE 6200U, HD Graphics 520, 1920x1080 | |
|---|---|---|---|---|---|---|
| Power Consumption | -14% | -2% | -12% | -20% | -14% | |
| Idle Minimum * (Watt) | 3.1 | 3.5 -13% | 3.2 -3% | 4.2 -35% | 4.1 -32% | 3.7 -19% |
| Idle Average * (Watt) | 5.5 | 6.7 -22% | 5.5 -0% | 6.2 -13% | 6.7 -22% | 6.8 -24% |
| Idle Maximum * (Watt) | 6 | 7.3 -22% | 6 -0% | 6.4 -7% | 7.4 -23% | 7.3 -22% |
| Load Average * (Watt) | 25.8 | 28.2 -9% | 29.5 -14% | 29 -12% | 32.4 -26% | 26.3 -2% |
| Load Maximum * (Watt) | 33.6 | 34.6 -3% | 30.9 8% | 31 8% | 32.4 4% | 34.6 -3% |
* ... kleiner is beter
| Lenovo ThinkPad 13-20GKS01100 42 Wh | Lenovo ThinkPad T460-20FN003LGE 46 Wh | Acer TravelMate P238-M-5575 49.7 Wh | Asus Zenbook UX303UA-FN121T 50 Wh | Acer Aspire S 13 S5-371-71QZ 45 Wh | Dell XPS 13-9350 56 Wh | Lenovo ThinkPad T460s-20F9003SGE 49 Wh | |
|---|---|---|---|---|---|---|---|
| Batterijduur | -7% | 33% | 18% | 4% | 6% | 1% | |
| Reader / Idle (h) | 15.7 | 15.9 1% | 21.5 37% | 17.1 9% | 13 -17% | 15.3 -3% | |
| H.264 (h) | 7.8 | 8.5 9% | 9.3 19% | 8.9 14% | |||
| WiFi v1.3 (h) | 6.2 | 5.6 -10% | 10.1 63% | 7.3 18% | 7.9 27% | 7.5 21% | 6.6 6% |
| Load (h) | 2.2 | 1.6 -27% | 2.5 14% | 1.7 -23% | 2.5 14% | 1.9 -14% |
Pro
Contra
Dit is de verkorte versie van het originele artikel. Het volledige, Engelse testrapport vind je hier.
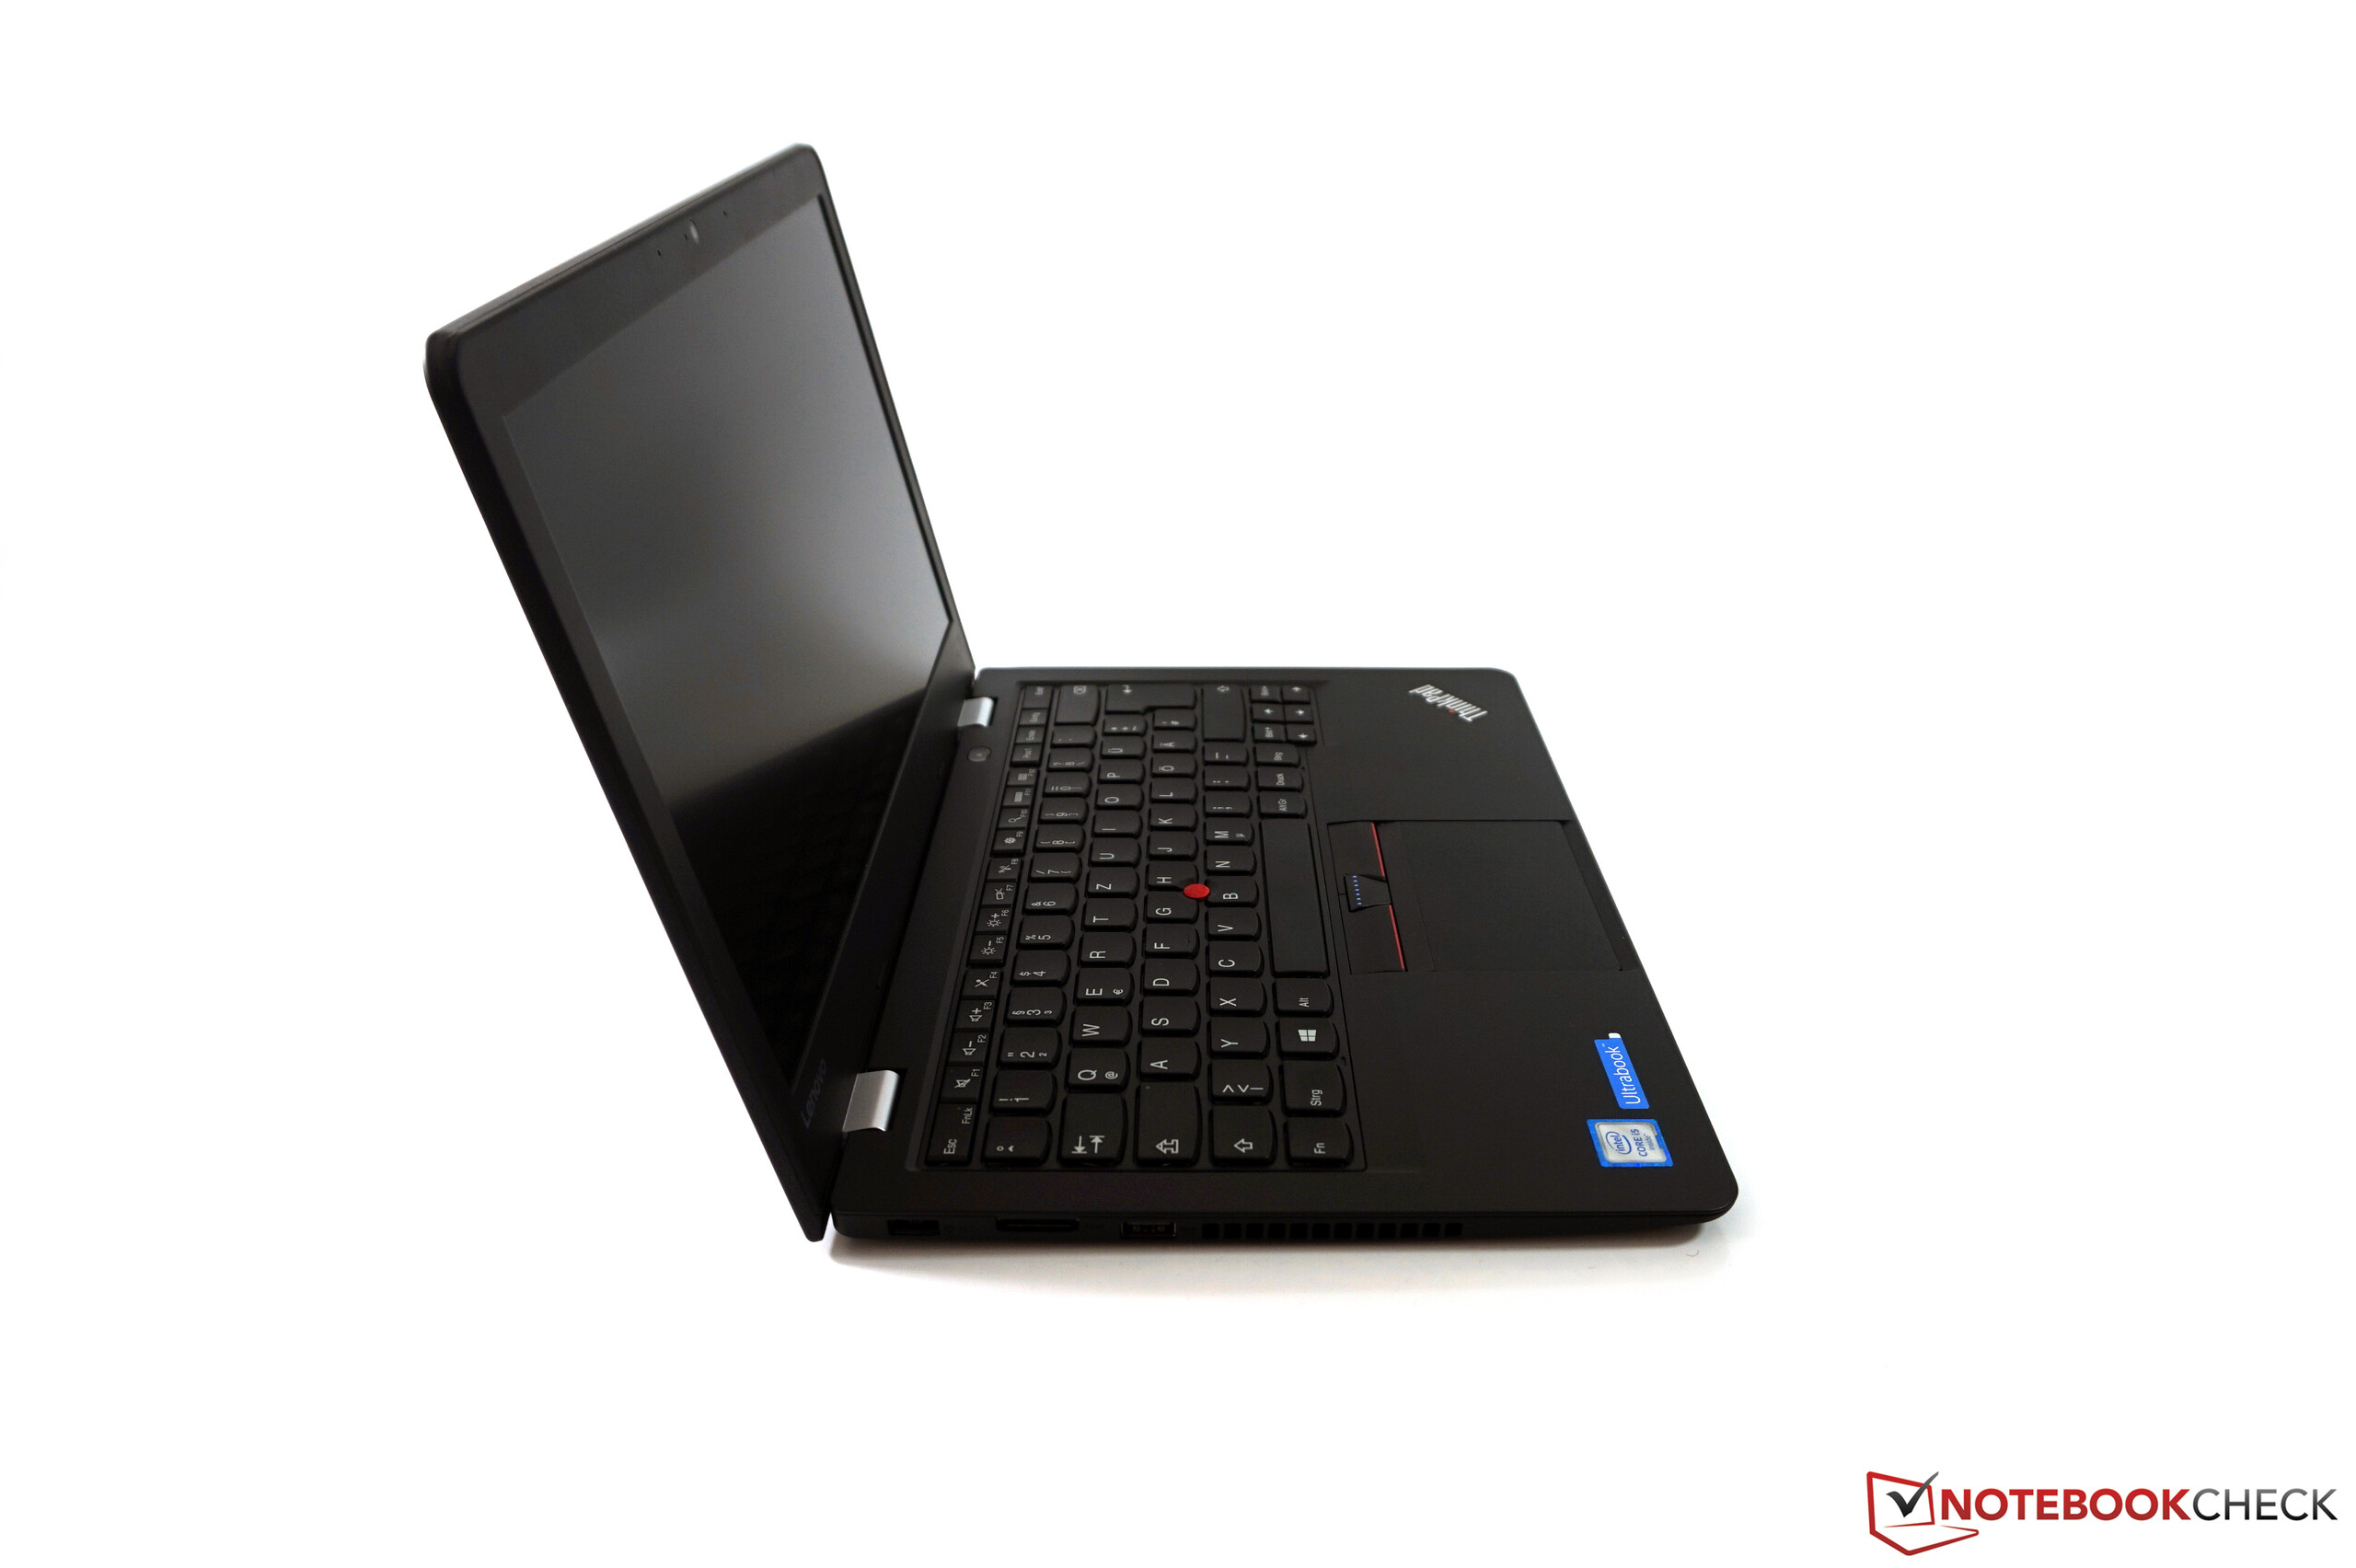
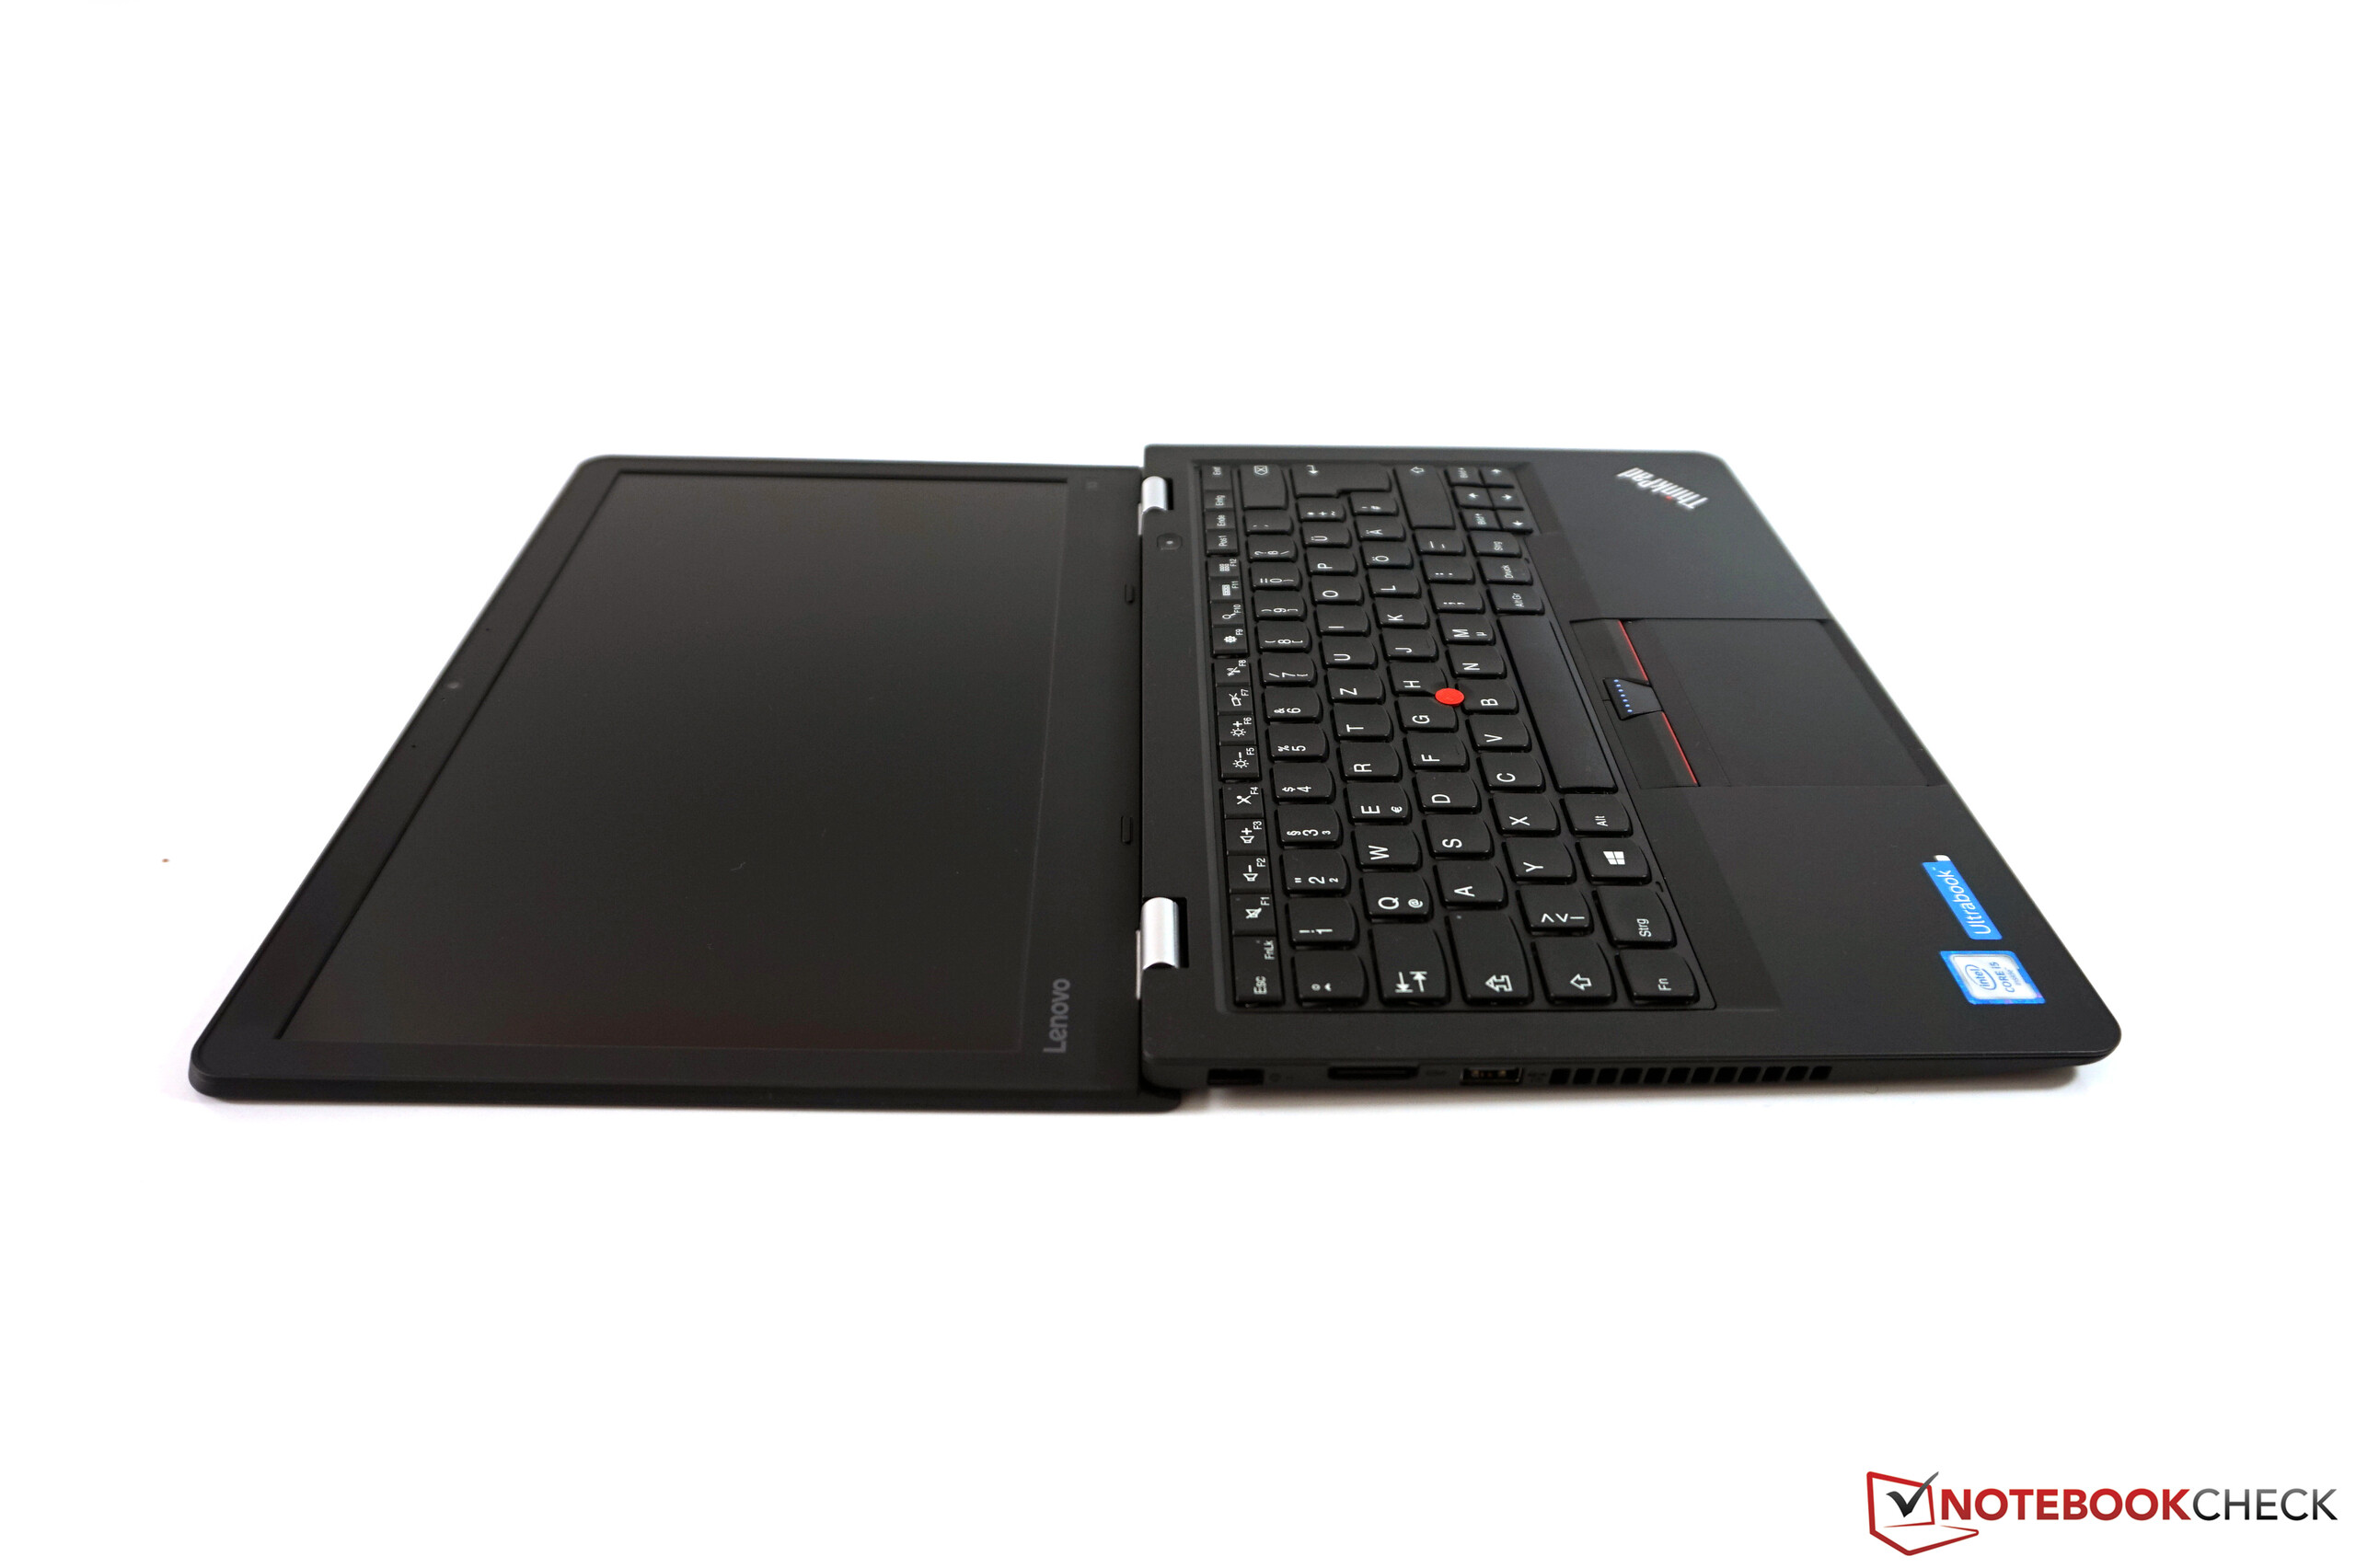
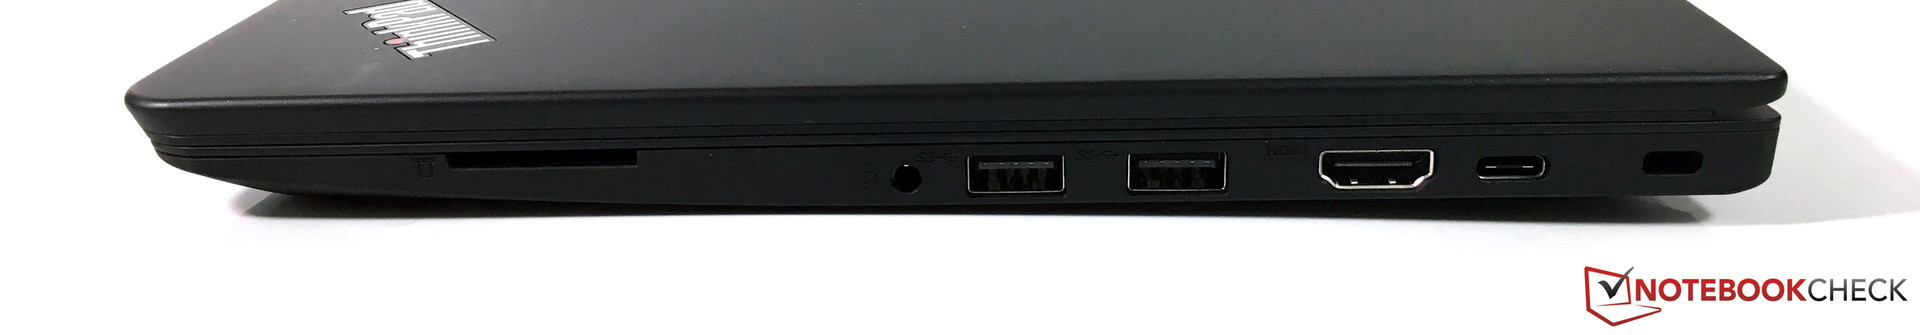
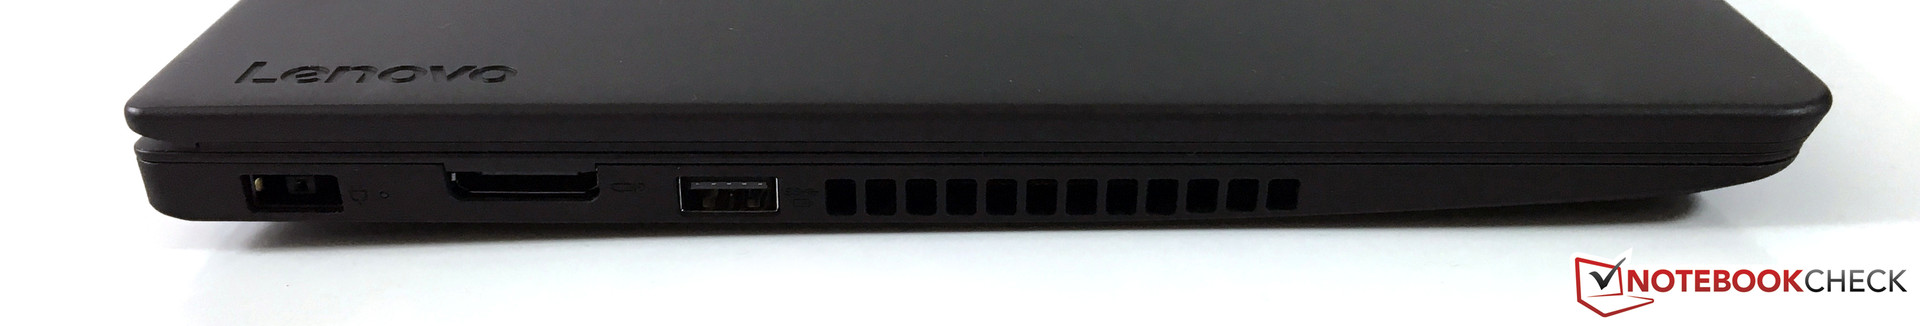
De nieuwe ThinkPad 13 is een interessant toestel: het is een Ultrabook met moderne componenten en poorten die geen enkele ernstige tekortkoming vertoonde in onze tests. We krijgen een degelijk ontspiegeld FHD-IPS-scherm dat weliswaar wat helderder mocht zijn voor comfortabel gebruik buitenshuis. De subjectieve prestaties zijn erg goed dankzij de SSD en het uitstekende ThinkPad-toetsenbord stelde ons erg tevreden, ondanks de afwezige backlight-verlichting.
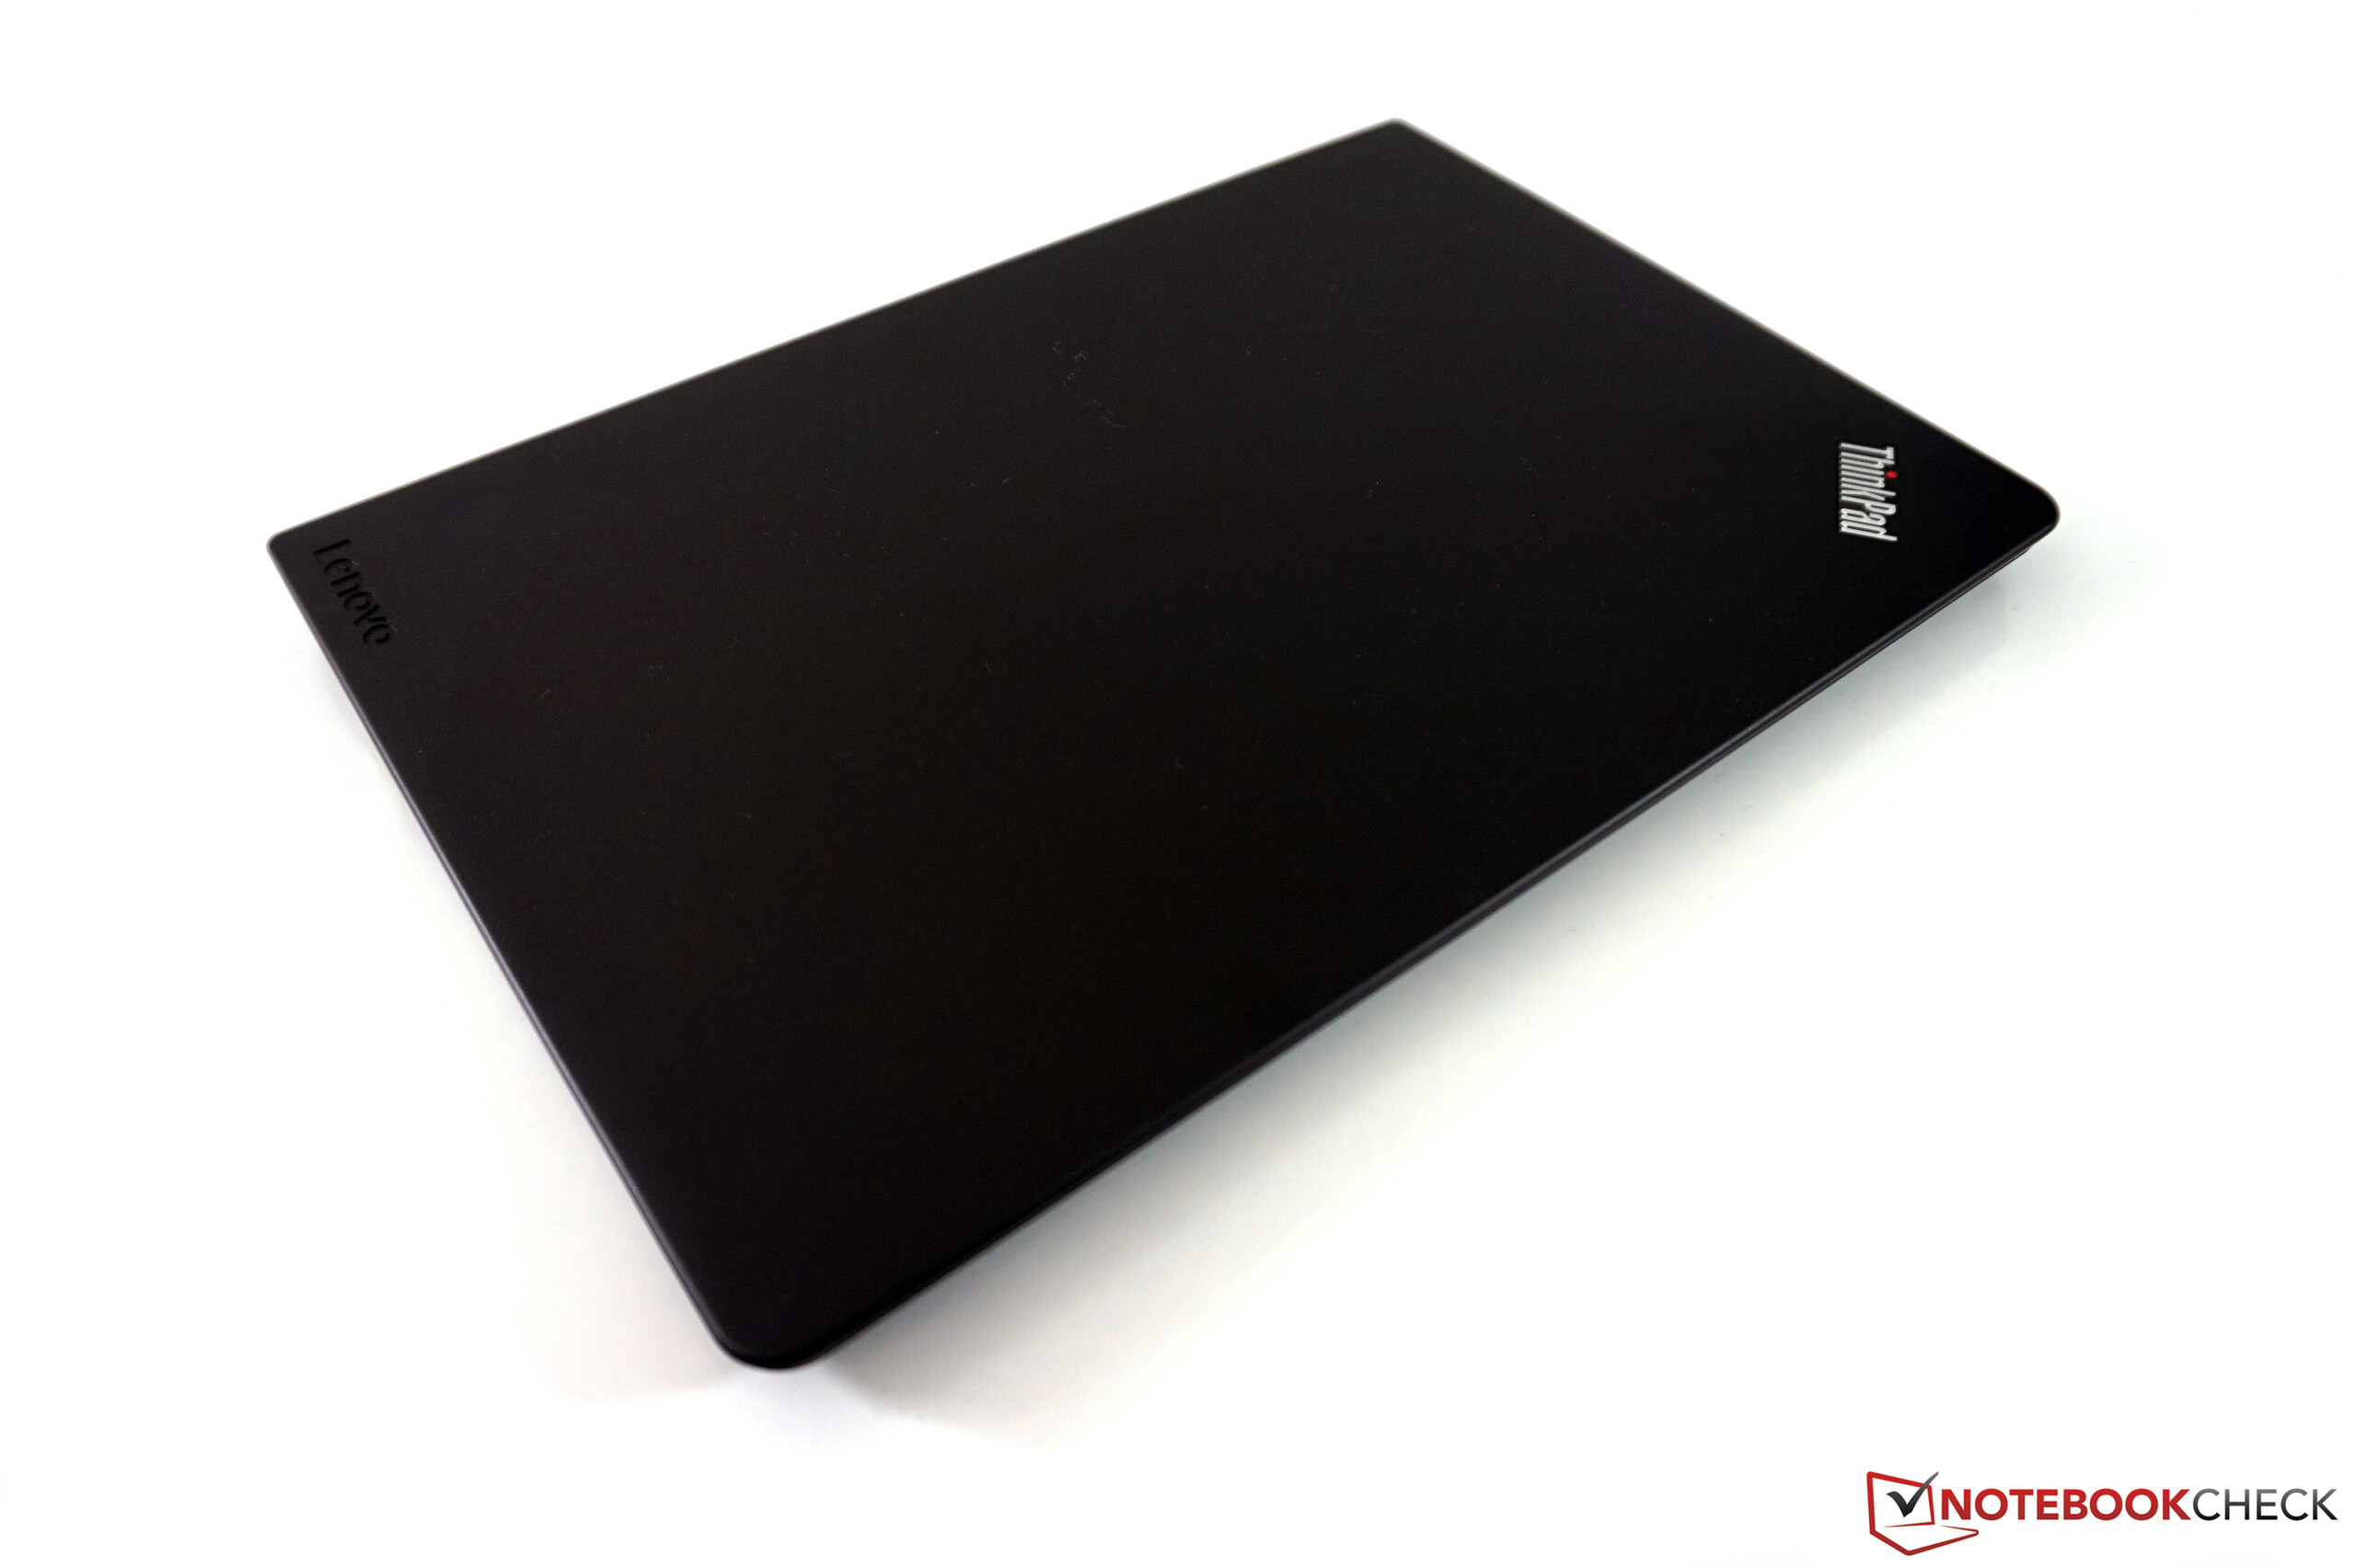
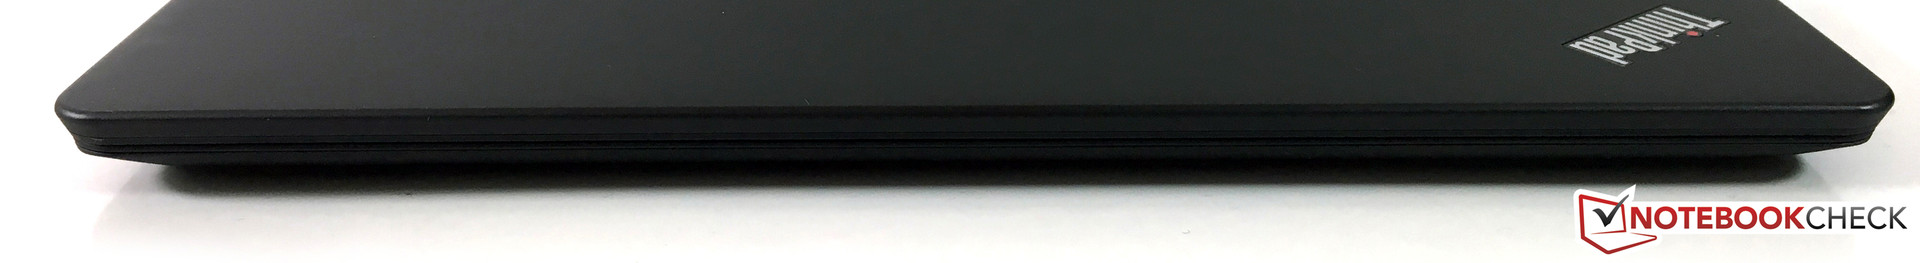
Wat de behuizing betreft moet men enkele compromissen aanvaarden. De stabiliteit van de basisunit is prima, maar vooral het scherm is erg gevoelig voor druk en buiging. De scharnieren zijn evenmin stevig genoeg en kunnen niet vermijden dat het scherm wiebelt. Ook op het vlak van beveiligingsfeatures zijn er enkele beperkingen.
Vooral het Campus-model van de ThinkPad 13 verdient een aanbeveling. De concurrentie is echter aanlokkelijker wanneer je de volle prijs van 1000 euro (~$1119) moet betalen; vooral de Dell XPS 13 is in dit geval een beter alternatief.
Een vergelijking met de andere twee ThinkPad-modellen is hier interessant. De prestaties van de drie notebooks zijn praktisch identiek, wat ook het geval is voor de batterijduur. De meerprijs zorgt voor stevigere bouwkwaliteit, toetsenbordverlichting en meer beveiligingsfeatures, evenals een langere garantieperiode. De situatie voor het scherm is een beetje bedrieglijk: onze twee testmodellen van de T460 en T460s waren uitgerust met panelen van Innolux die inferieur zijn aan het scherm van LG in de ThinkPad 13.
Zowel de ThinkPad 13 als de ThinkPad T460 hebben meer te bieden dan onze twee betaalbare alternatieven van Asus en Acer, tenminste als je toegang hebt tot Lenovo's Campus-programma. De ThinkPad 13 is beter dan de T460 op het vlak van mobiliteit, waardoor een keuze niet eenvoudig is en uiteindelijk afhangt van het beoogde gebruiksscenario. Als je de notebook elke dat naar school meeneemt is de ThinkPad 13 duidelijk de betere kandidaat. Het is moeilijker om de notebook aan te bevelen indien je de volle prijs van ongeveer 1000 euro (~$1119) moet betalen. De Dell XPS 13 in het bijzonder is momenteel een nog beter alternatief in deze prijsklasse.
Lenovo ThinkPad 13-20GKS01100
- 28-04-2017 v6 (old)
Andreas Osthoff
Price comparison
