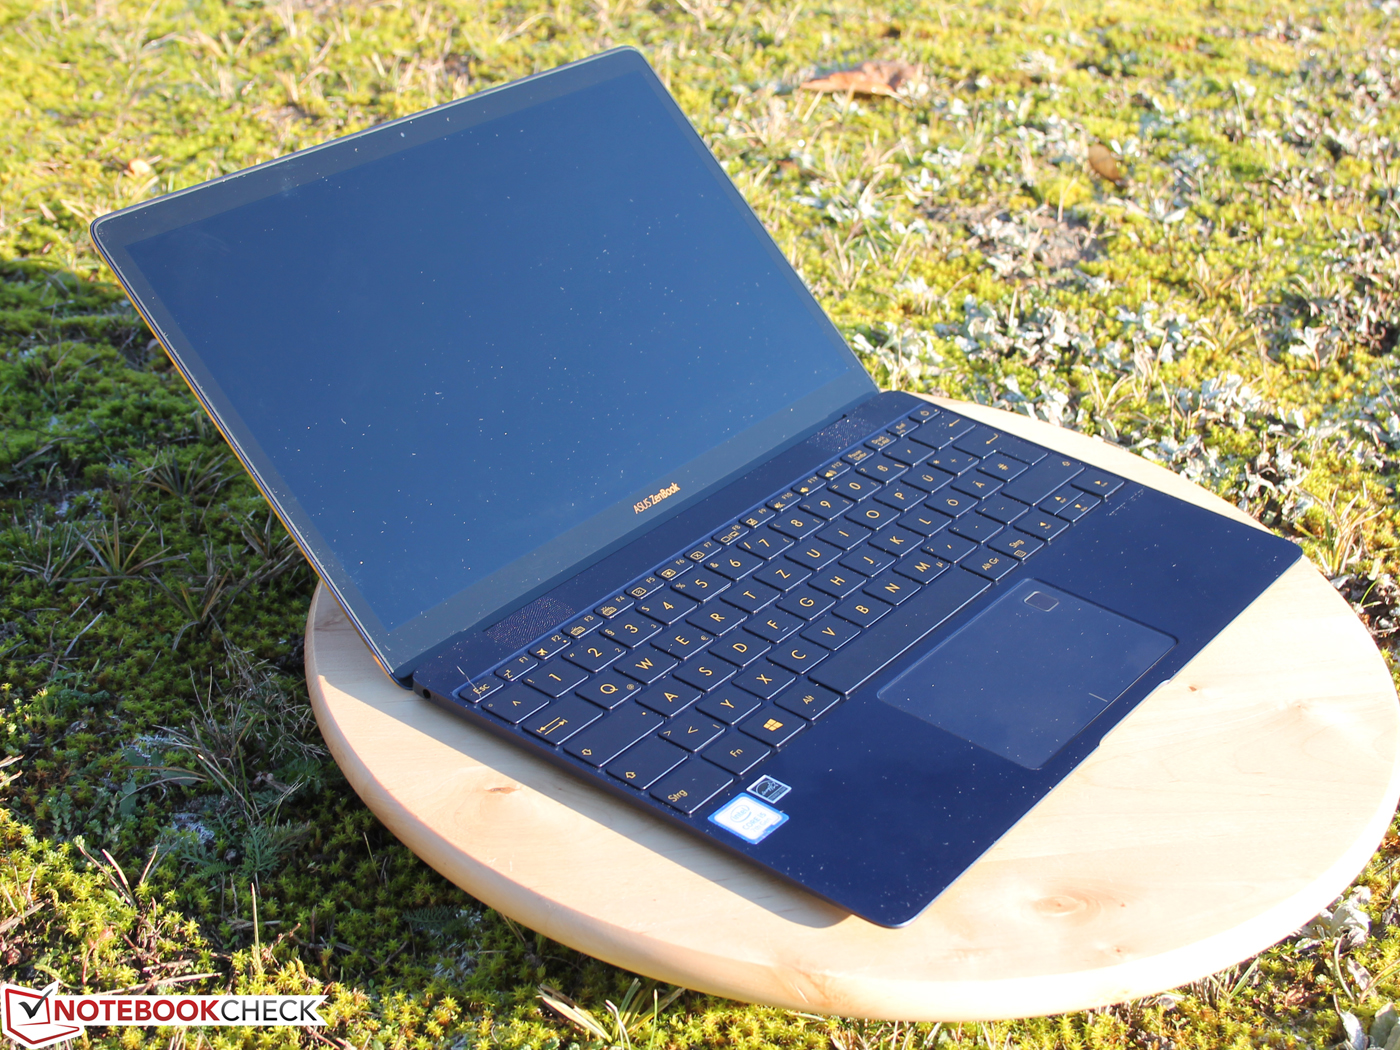
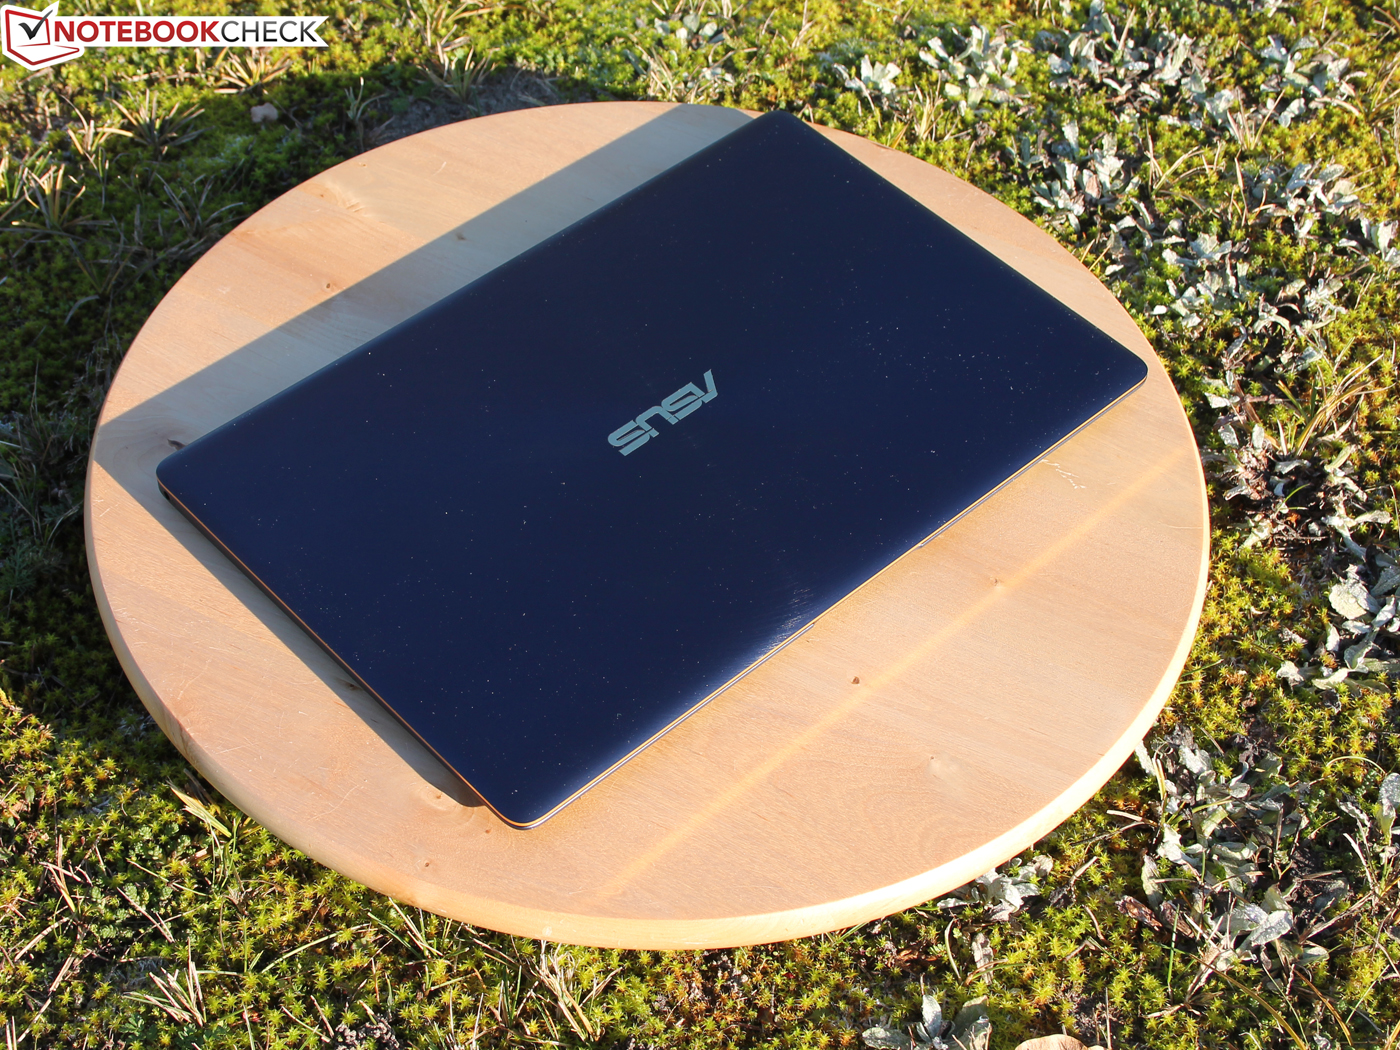
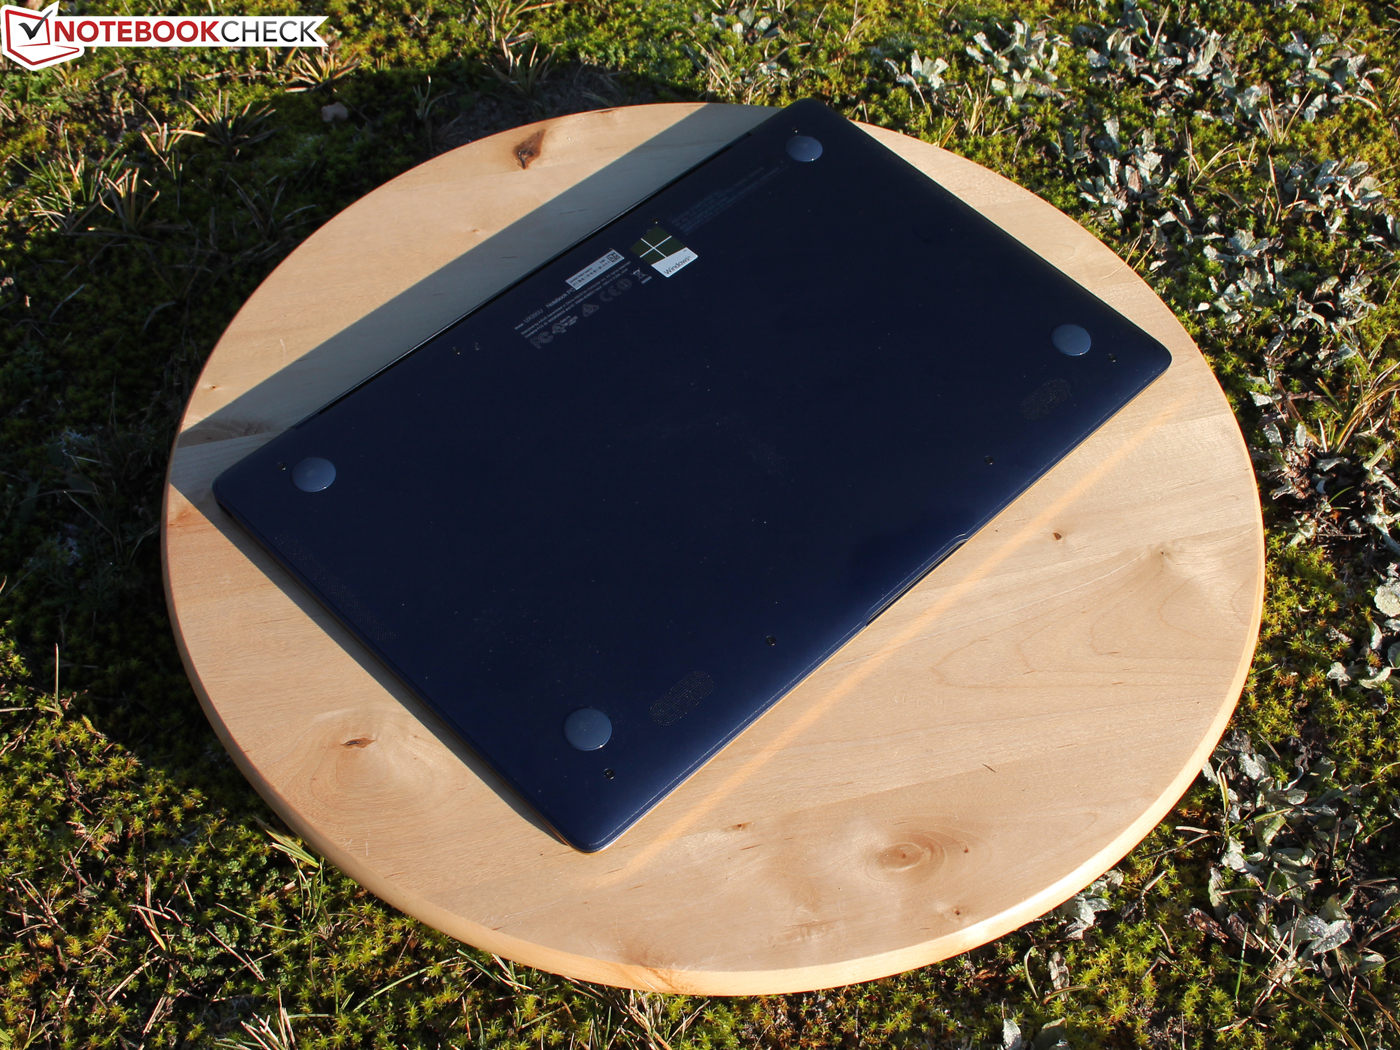
Kort testrapport Asus ZenBook 3 UX390UA-GS041T Notebook
| Networking | |
| iperf Server (receive) TCP 1 m | |
| Asus Zenbook 3 UX390UA-GS041T (jseb) | |
| Apple MacBook 12 (Early 2016) 1.1 GHz | |
| Razer Blade Stealth QHD i7-7500U (sim) | |
| Acer Aspire S 13 S5-371-71QZ | |
| iperf Client (transmit) TCP 1 m | |
| Asus Zenbook 3 UX390UA-GS041T (jseb) | |
| Razer Blade Stealth QHD i7-7500U (sim) | |
| Apple MacBook 12 (Early 2016) 1.1 GHz | |
| Acer Aspire S 13 S5-371-71QZ | |
| |||||||||||||||||||||||||
Helderheidsverdeling: 87 %
Helderheid in Batterij-modus: 355 cd/m²
Contrast: 1183:1 (Zwart: 0.3 cd/m²)
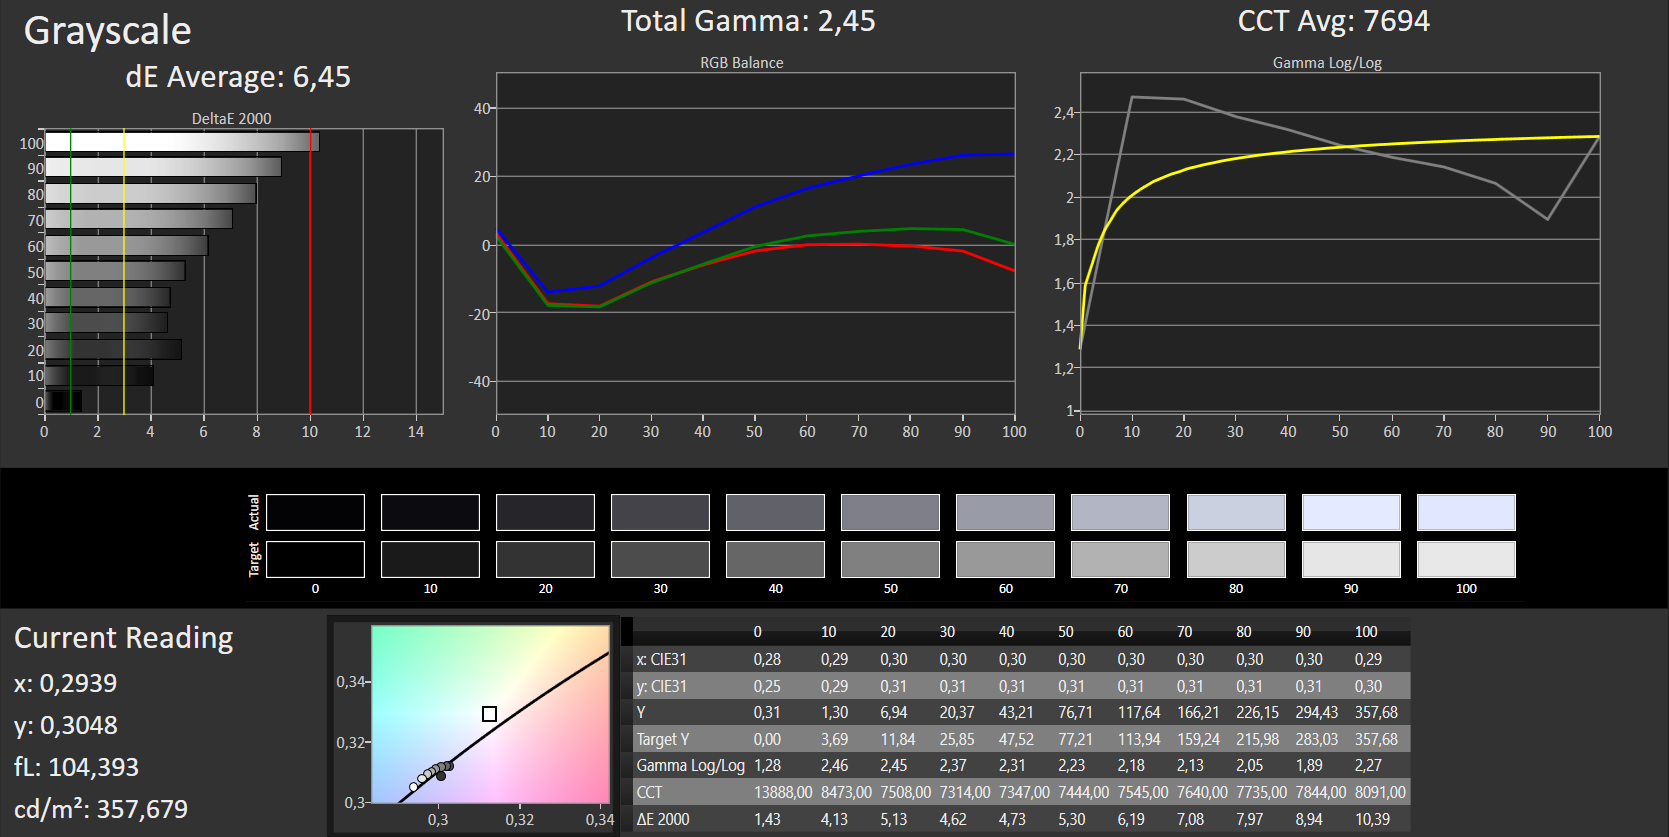
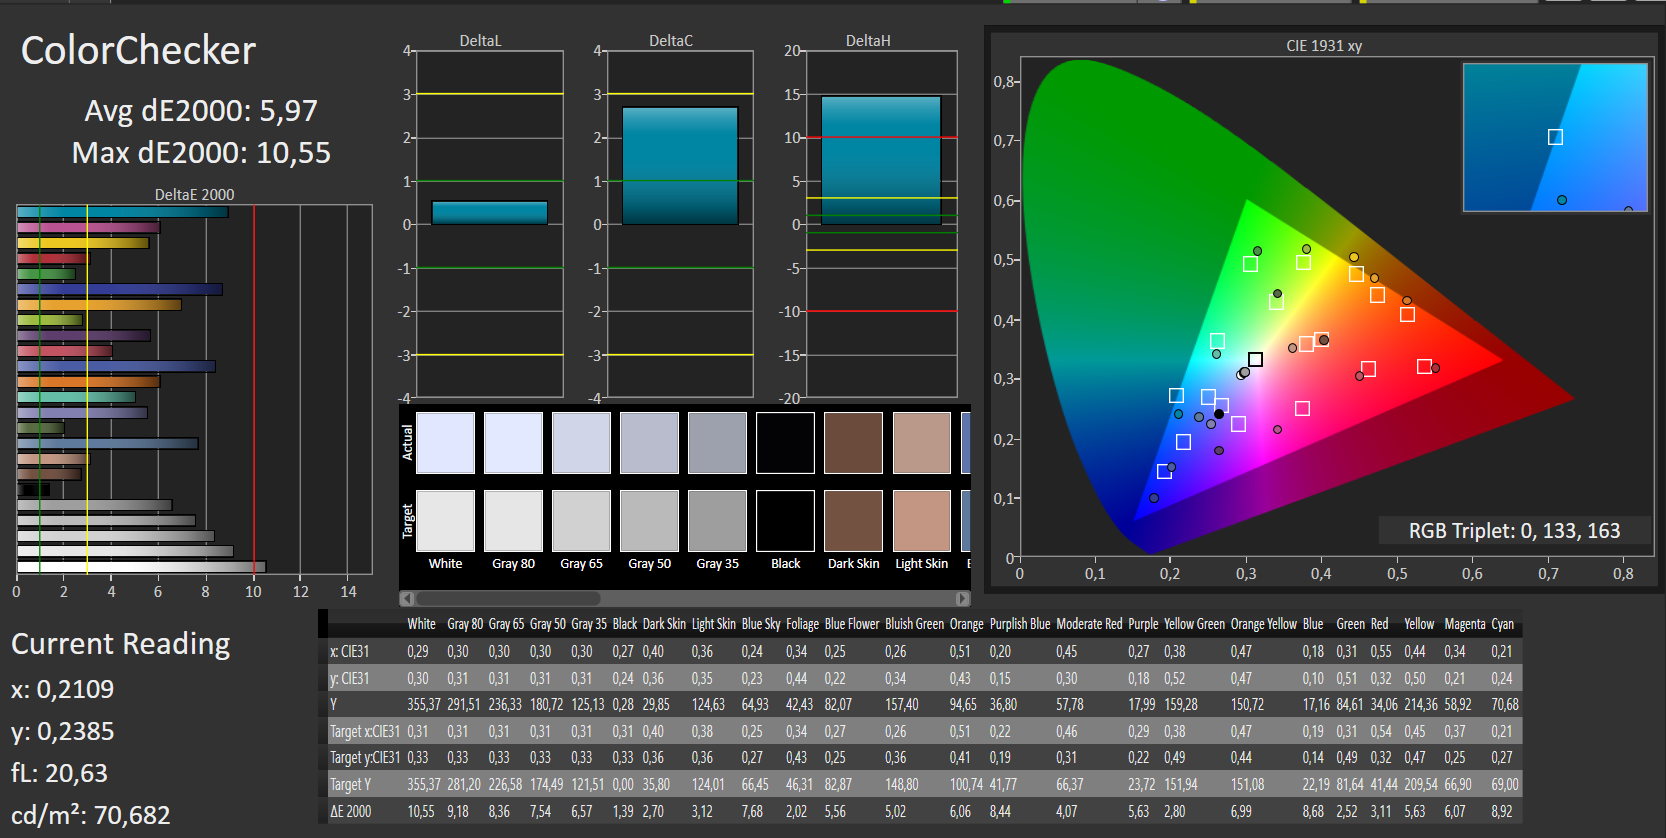
ΔE ColorChecker Calman: 5.97 | ∀{0.5-29.43 Ø4.73}
ΔE Greyscale Calman: 6.45 | ∀{0.09-98 Ø4.97}
89% sRGB (Argyll 1.6.3 3D)
58% AdobeRGB 1998 (Argyll 1.6.3 3D)
65.4% AdobeRGB 1998 (Argyll 3D)
89.6% sRGB (Argyll 3D)
64.7% Display P3 (Argyll 3D)
Gamma: 2.45
CCT: 7694 K
| Asus Zenbook 3 UX390UA-GS041T AUO B125HAN03.0 AUO306D, , 1920x1080, 12.5" | Apple MacBook 12 (Early 2016) 1.1 GHz APPA027, , 2304x1440, 12" | Dell XPS 13 9360 QHD+ i7 Sharp SHP144A, , 3200x1800, 13.3" | HP EliteBook Folio G1 V1C37EA AUO226D, , 1920x1080, 12.5" | Razer Blade Stealth QHD i7-7500U Sharp SHP142F (LQ125T1JW02), , 2560x1440, 12.5" | Acer Aspire S 13 S5-371-71QZ AUO B133HAN04.1, , 1920x1080, 13.3" | HP Spectre 13 1920x1080, 13.3" | |
|---|---|---|---|---|---|---|---|
| Display | 4% | -1% | -29% | 7% | 3% | ||
| Display P3 Coverage (%) | 64.7 | 66.8 3% | 62.8 -3% | 44.45 -31% | 68.7 6% | 65.6 1% | |
| sRGB Coverage (%) | 89.6 | 95.4 6% | 89.4 0% | 65.2 -27% | 95.8 7% | 94.7 6% | |
| AdobeRGB 1998 Coverage (%) | 65.4 | 68 4% | 64.6 -1% | 45.96 -30% | 69.9 7% | 67.5 3% | |
| Response Times | -27% | -29% | 1% | -26% | -41% | -49% | |
| Response Time Grey 50% / Grey 80% * (ms) | 30 ? | 41.2 ? -37% | 43.6 ? -45% | 32 ? -7% | 37 ? -23% | 50 ? -67% | 50.8 ? -69% |
| Response Time Black / White * (ms) | 26 ? | 30.4 ? -17% | 29.2 ? -12% | 24 ? 8% | 33.4 ? -28% | 29.6 ? -14% | 33.2 ? -28% |
| PWM Frequency (Hz) | 50 ? | 200 ? | |||||
| Screen | 15% | 15% | -3% | 7% | 4% | 21% | |
| Brightness middle (cd/m²) | 355 | 387 9% | 396.2 12% | 289 -19% | 402 13% | 375 6% | 300.5 -15% |
| Brightness (cd/m²) | 341 | 358 5% | 357 5% | 298 -13% | 382 12% | 358 5% | 305 -11% |
| Brightness Distribution (%) | 87 | 88 1% | 84 -3% | 87 0% | 88 1% | 87 0% | 76 -13% |
| Black Level * (cd/m²) | 0.3 | 0.47 -57% | 0.266 11% | 0.27 10% | 0.45 -50% | 0.39 -30% | 0.184 39% |
| Contrast (:1) | 1183 | 823 -30% | 1489 26% | 1070 -10% | 893 -25% | 962 -19% | 1633 38% |
| Colorchecker dE 2000 * | 5.97 | 1.6 73% | 3.9 35% | 4.82 19% | 3.6 40% | 4.6 23% | 2.64 56% |
| Colorchecker dE 2000 max. * | 10.55 | 4 62% | 7.58 28% | 10.73 -2% | 7.5 29% | 8.8 17% | 5.06 52% |
| Greyscale dE 2000 * | 6.45 | 1 84% | 4.16 36% | 3.84 40% | 4.3 33% | 4 38% | 2.8 57% |
| Gamma | 2.45 90% | 2.26 97% | 2.31 95% | 2.41 91% | 2.1 105% | 2.34 94% | 2.16 102% |
| CCT | 7694 84% | 6680 97% | 6514 100% | 6492 100% | 6572 99% | 7304 89% | 6999 93% |
| Color Space (Percent of AdobeRGB 1998) (%) | 58 | 61.6 6% | 57.5 -1% | 42.03 -28% | 62.3 7% | 57.9 0% | 60.9 5% |
| Color Space (Percent of sRGB) (%) | 89 | 82.2 -8% | 88.7 0% | 64.8 -27% | 95.7 8% | 88.7 0% | 94.3 6% |
| Totaal Gemiddelde (Programma / Instellingen) | -3% /
7% | -5% /
6% | -10% /
-8% | -4% /
2% | -19% /
-3% | -8% /
8% |
* ... kleiner is beter

Responstijd Scherm
| ↔ Responstijd Zwart naar Wit | ||
|---|---|---|
| 26 ms ... stijging ↗ en daling ↘ gecombineerd | ↗ 6 ms stijging | 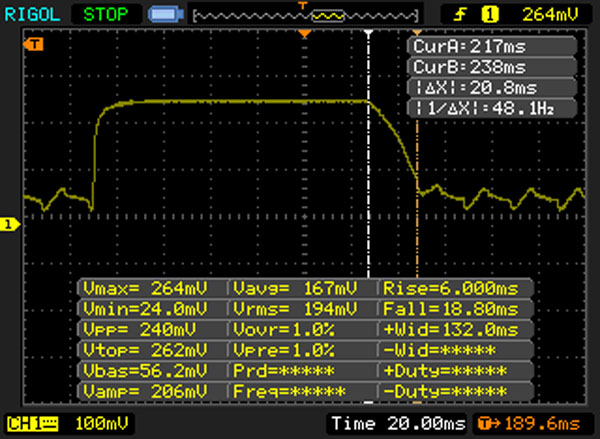 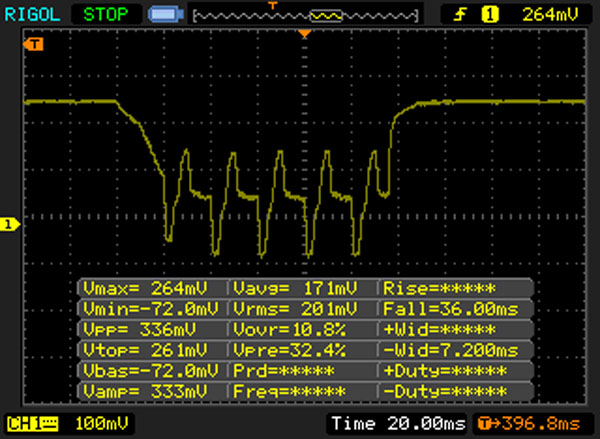 |
| ↘ 20 ms daling | ||
| Het scherm vertoonde relatief trage responstijden in onze tests en is misschien te traag voor games. Ter vergelijking: alle testtoestellen variëren van 0.1 (minimum) tot 240 (maximum) ms. » 62 % van alle toestellen zijn beter. Dit betekent dat de gemeten responstijd slechter is dan het gemiddelde (19.9 ms) van alle geteste toestellen. | ||
| ↔ Responstijd 50% Grijs naar 80% Grijs | ||
| 30 ms ... stijging ↗ en daling ↘ gecombineerd | ↗ 13 ms stijging |  |
| ↘ 17 ms daling | ||
| Het scherm vertoonde trage responstijden in onze tests en is misschien te traag voor games. Ter vergelijking: alle testtoestellen variëren van 0.165 (minimum) tot 636 (maximum) ms. » 40 % van alle toestellen zijn beter. Dit betekent dat de gemeten responstijd vergelijkbaar is met het gemiddelde (31.1 ms) van alle geteste toestellen. | ||
Screen Flickering / PWM (Pulse-Width Modulation)
| Screen flickering / PWM waargenomen | 50 Hz | ≤ 10 % helderheid instelling | 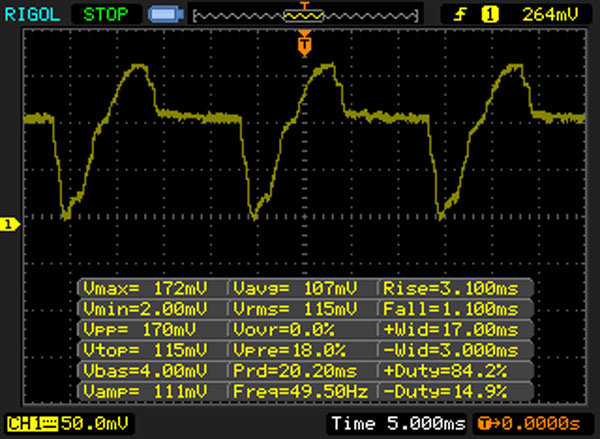 |
De achtergrondverlichting van het scherm flikkert op 50 Hz (in het slechtste geval, bijvoorbeeld bij gebruik van PWM) aan een helderheid van 10 % en lager. Boven deze helderheid zou er geen flickering / PWM mogen optreden. De frequentie van 50 Hz is erg laag en kan dus aanleiding geven tot geïrriteerde ogen en hoofdpijn bij langer gebruik. Ter vergelijking: 52 % van alle geteste toestellen maakten geen gebruik van PWM om de schermhelderheid te verlagen. Als het wel werd gebruikt, werd een gemiddelde van 7798 (minimum: 5 - maximum: 343500) Hz waargenomen. | |||

| PCMark 8 Home Score Accelerated v2 | 2880 punten | |
| PCMark 8 Work Score Accelerated v2 | 4326 punten | |
Help | ||
| Asus Zenbook 3 UX390UA-GS041T SK Hynix Canvas SC300 512GB M.2 (HFS512G39MND) | Apple MacBook 12 (Early 2016) 1.1 GHz Apple SSD AP0256 | Dell XPS 13 9360 QHD+ i7 Toshiba NVMe THNSN5256GPUK | HP EliteBook Folio G1 V1C37EA Samsung SM951 MZVPV256 m.2 | Razer Blade Stealth QHD i7-7500U Samsung PM951 NVMe MZVLV256 | Acer Aspire S 13 S5-371-71QZ LiteOn CV1-8B512 | HP Spectre 13 Samsung PM951 NVMe MZVLV256 | |
|---|---|---|---|---|---|---|---|
| CrystalDiskMark 3.0 | 27% | 74% | 127% | 60% | 2% | 49% | |
| Read Seq (MB/s) | 508 | 754 48% | 1214 139% | 1482 192% | 1178 132% | 502 -1% | 1322 160% |
| Write Seq (MB/s) | 454.4 | 638 40% | 655 44% | 1232 171% | 305.4 -33% | 418.9 -8% | 305.5 -33% |
| Read 512 (MB/s) | 335.5 | 616 84% | 1019 204% | 1191 255% | 638 90% | 341.3 2% | 621 85% |
| Write 512 (MB/s) | 413.9 | 678 64% | 445.7 8% | 1220 195% | 305.7 -26% | 389.7 -6% | 306 -26% |
| Read 4k (MB/s) | 28.13 | 14.6 -48% | 35.55 26% | 46.96 67% | 38.54 37% | 29.69 6% | 40.09 43% |
| Write 4k (MB/s) | 69.8 | 20.5 -71% | 130 86% | 100.7 44% | 153.4 120% | 86.8 24% | 119 70% |
| Read 4k QD32 (MB/s) | 245.7 | 464 89% | 537 119% | 464 89% | 614 150% | 301.3 23% | 513 109% |
| Write 4k QD32 (MB/s) | 277.6 | 315 13% | 173.8 -37% | 292.1 5% | 302.7 9% | 211.2 -24% | 231.5 -17% |

| 3DMark 11 Performance | 1704 punten | |
| 3DMark Cloud Gate Standard Score | 5989 punten | |
Help | ||
| BioShock Infinite - 1280x720 Very Low Preset | |
| Acer Aspire S 13 S5-371-71QZ | |
| Dell XPS 13 9360 QHD+ i7 | |
| HP Spectre 13 | |
| Asus Zenbook 3 UX390UA-GS041T | |
| HP EliteBook Folio G1 V1C37EA | |
| Thief - 1024x768 Very Low Preset | |
| Asus Zenbook 3 UX390UA-GS041T | |
| Dirt Rally - 1024x768 Ultra Low Preset | |
| Asus Zenbook 3 UX390UA-GS041T | |
| Rise of the Tomb Raider - 1024x768 Lowest Preset | |
| Dell XPS 13 9360 QHD+ i7 | |
| Razer Blade Stealth QHD i7-7500U | |
| Asus Zenbook 3 UX390UA-GS041T | |
| Doom - 1280x720 Low Preset | |
| Asus Zenbook 3 UX390UA-GS041T | |
| lage | gem. | hoge | ultra | |
|---|---|---|---|---|
| BioShock Infinite (2013) | 51 | 27.2 | 20.7 | |
| Thief (2014) | 14 | 8.4 | ||
| Dirt Rally (2015) | 119 | 34.5 | 15 | |
| Rise of the Tomb Raider (2016) | 18.8 | 9.4 | ||
| Doom (2016) | 22.6 |
| Asus Zenbook 3 UX390UA-GS041T HD Graphics 620, i5-7200U, SK Hynix Canvas SC300 512GB M.2 (HFS512G39MND) | Apple MacBook 12 (Early 2016) 1.1 GHz HD Graphics 515, 6Y30, Apple SSD AP0256 | Dell XPS 13 9360 QHD+ i7 HD Graphics 620, i7-7500U, Toshiba NVMe THNSN5256GPUK | HP EliteBook Folio G1 V1C37EA HD Graphics 515, 6Y54, Samsung SM951 MZVPV256 m.2 | Razer Blade Stealth QHD i7-7500U HD Graphics 620, i7-7500U, Samsung PM951 NVMe MZVLV256 | Acer Aspire S 13 S5-371-71QZ HD Graphics 520, 6500U, LiteOn CV1-8B512 | HP Spectre 13 HD Graphics 520, 6500U, Samsung PM951 NVMe MZVLV256 | |
|---|---|---|---|---|---|---|---|
| Noise | 7% | 1% | 1% | 1% | |||
| uit / omgeving * (dB) | 30.7 | 28.8 6% | 31 -1% | 31.2 -2% | 28.5 7% | ||
| Idle Minimum * (dB) | 30.7 | 28.8 6% | 31 -1% | 31.2 -2% | 28.5 7% | ||
| Idle Average * (dB) | 30.7 | 28.8 6% | 31 -1% | 31.2 -2% | 30.9 -1% | ||
| Idle Maximum * (dB) | 30.9 | 30.8 -0% | 31 -0% | 31.5 -2% | 31.6 -2% | ||
| Load Average * (dB) | 38.7 | 34.8 10% | 35 10% | 35.7 8% | 38.8 -0% | ||
| Load Maximum * (dB) | 38.9 | 34.8 11% | 40.5 -4% | 35.8 8% | 41.4 -6% |
* ... kleiner is beter
Geluidsniveau
| Onbelast |
| 30.7 / 30.7 / 30.9 dB (A) |
| Belasting |
| 38.7 / 38.9 dB (A) |
 | ||
30 dB stil 40 dB(A) hoorbaar 50 dB(A) luid |
||
min: | ||
(±) De maximumtemperatuur aan de bovenzijde bedraagt 41.6 °C / 107 F, vergeleken met het gemiddelde van 35.9 °C / 97 F, variërend van 21.4 tot 59 °C voor de klasse Subnotebook.
(+) De bodem warmt op tot een maximum van 39.3 °C / 103 F, vergeleken met een gemiddelde van 39.2 °C / 103 F
(+) Bij onbelast gebruik bedraagt de gemiddelde temperatuur voor de bovenzijde 24.5 °C / 76 F, vergeleken met het apparaatgemiddelde van 30.8 °C / 87 F.
(+) De handpalmsteunen en het touchpad bereiken maximaal de huidtemperatuur (32.2 °C / 90 F) en zijn dus niet heet.
(-) De gemiddelde temperatuur van de handpalmsteun van soortgelijke toestellen bedroeg 28.2 °C / 82.8 F (-4 °C / -7.2 F).
Asus Zenbook 3 UX390UA-GS041T audioanalyse
(-) | niet erg luide luidsprekers (71 dB)
Bas 100 - 315 Hz
(-) | bijna geen lage tonen - gemiddeld 20.9% lager dan de mediaan
(±) | lineariteit van de lage tonen is gemiddeld (12.6% delta ten opzichte van de vorige frequentie)
Midden 400 - 2000 Hz
(+) | evenwichtige middens - slechts 4.1% verwijderd van de mediaan
(±) | lineariteit van de middentonen is gemiddeld (8.9% delta ten opzichte van de vorige frequentie)
Hoog 2 - 16 kHz
(+) | evenwichtige hoogtepunten - slechts 2.3% verwijderd van de mediaan
(+) | de hoge tonen zijn lineair (4% delta naar de vorige frequentie)
Algemeen 100 - 16.000 Hz
(±) | lineariteit van het totale geluid is gemiddeld (17.3% verschil met de mediaan)
Vergeleken met dezelfde klasse
» 44% van alle geteste apparaten in deze klasse waren beter, 9% vergelijkbaar, 47% slechter
» De beste had een delta van 5%, het gemiddelde was 18%, de slechtste was 53%
Vergeleken met alle geteste toestellen
» 32% van alle geteste apparaten waren beter, 8% gelijk, 59% slechter
» De beste had een delta van 4%, het gemiddelde was 24%, de slechtste was 134%
Apple MacBook 12 (Early 2016) 1.1 GHz audioanalyse
(+) | luidsprekers kunnen relatief luid spelen (83.6 dB)
Bas 100 - 315 Hz
(±) | verminderde zeebaars - gemiddeld 11.3% lager dan de mediaan
(±) | lineariteit van de lage tonen is gemiddeld (14.2% delta ten opzichte van de vorige frequentie)
Midden 400 - 2000 Hz
(+) | evenwichtige middens - slechts 2.4% verwijderd van de mediaan
(+) | de middentonen zijn lineair (5.5% delta ten opzichte van de vorige frequentie)
Hoog 2 - 16 kHz
(+) | evenwichtige hoogtepunten - slechts 2% verwijderd van de mediaan
(+) | de hoge tonen zijn lineair (4.5% delta naar de vorige frequentie)
Algemeen 100 - 16.000 Hz
(+) | het totale geluid is lineair (10.2% verschil met de mediaan)
Vergeleken met dezelfde klasse
» 7% van alle geteste apparaten in deze klasse waren beter, 2% vergelijkbaar, 91% slechter
» De beste had een delta van 5%, het gemiddelde was 18%, de slechtste was 53%
Vergeleken met alle geteste toestellen
» 5% van alle geteste apparaten waren beter, 1% gelijk, 94% slechter
» De beste had een delta van 4%, het gemiddelde was 24%, de slechtste was 134%
| Uit / Standby | |
| Inactief | |
| Belasting |
|
Key:
min: | |
| Asus Zenbook 3 UX390UA-GS041T i5-7200U, HD Graphics 620, SK Hynix Canvas SC300 512GB M.2 (HFS512G39MND), IPS, 1920x1080, 12.5" | Apple MacBook 12 (Early 2016) 1.1 GHz 6Y30, HD Graphics 515, Apple SSD AP0256, IPS, 2304x1440, 12" | Dell XPS 13 9360 QHD+ i7 i7-7500U, HD Graphics 620, Toshiba NVMe THNSN5256GPUK, IPS, 3200x1800, 13.3" | HP EliteBook Folio G1 V1C37EA 6Y54, HD Graphics 515, Samsung SM951 MZVPV256 m.2, IPS, 1920x1080, 12.5" | Razer Blade Stealth QHD i7-7500U i7-7500U, HD Graphics 620, Samsung PM951 NVMe MZVLV256, , 2560x1440, 12.5" | Acer Aspire S 13 S5-371-71QZ 6500U, HD Graphics 520, LiteOn CV1-8B512, IPS, 1920x1080, 13.3" | HP Spectre 13 6500U, HD Graphics 520, Samsung PM951 NVMe MZVLV256, IPS UWVA, 1920x1080, 13.3" | |
|---|---|---|---|---|---|---|---|
| Power Consumption | 29% | -18% | 2% | -28% | -9% | -62% | |
| Idle Minimum * (Watt) | 3.3 | 2.7 18% | 6.4 -94% | 4.3 -30% | 4.4 -33% | 4.1 -24% | 8.6 -161% |
| Idle Average * (Watt) | 6.2 | 2.7 56% | 6.6 -6% | 6 3% | 5.8 6% | 6.7 -8% | 11 -77% |
| Idle Maximum * (Watt) | 10.4 | 7.2 31% | 6.8 35% | 6.4 38% | 8.6 17% | 7.4 29% | 11.3 -9% |
| Load Average * (Watt) | 28 | 22 21% | 27.5 2% | 22.7 19% | 35.2 -26% | 32.4 -16% | 33.8 -21% |
| Load Maximum * (Watt) | 25.7 | 20.5 20% | 32.4 -26% | 31.2 -21% | 52 -102% | 32.4 -26% | 36.2 -41% |
* ... kleiner is beter
| Asus Zenbook 3 UX390UA-GS041T i5-7200U, HD Graphics 620, 40 Wh | Apple MacBook 12 (Early 2016) 1.1 GHz 6Y30, HD Graphics 515, 41.4 Wh | Dell XPS 13 9360 QHD+ i7 i7-7500U, HD Graphics 620, 60 Wh | HP EliteBook Folio G1 V1C37EA 6Y54, HD Graphics 515, 38 Wh | Razer Blade Stealth QHD i7-7500U i7-7500U, HD Graphics 620, 53.6 Wh | Acer Aspire S 13 S5-371-71QZ 6500U, HD Graphics 520, 45 Wh | HP Spectre 13 6500U, HD Graphics 520, 38 Wh | |
|---|---|---|---|---|---|---|---|
| Batterijduur | 59% | 26% | -1% | 7% | 12% | -20% | |
| Reader / Idle (h) | 14.1 | 17.6 25% | 8.8 -38% | 13.6 -4% | 17.1 21% | 11.9 -16% | |
| H.264 (h) | 6.4 | 8.5 33% | 6.9 8% | ||||
| WiFi v1.3 (h) | 6.6 | 8.4 27% | 8.6 30% | 5.9 -11% | 8.3 26% | 7.9 20% | 5.6 -15% |
| Load (h) | 1.8 | 3.9 117% | 2.2 22% | 2.5 39% | 1.8 0% | 1.7 -6% | 1.3 -28% |
Pro
Contra
Dit is de verkorte versie van het originele artikel. Het volledige, Engelse testrapport vind je hier.
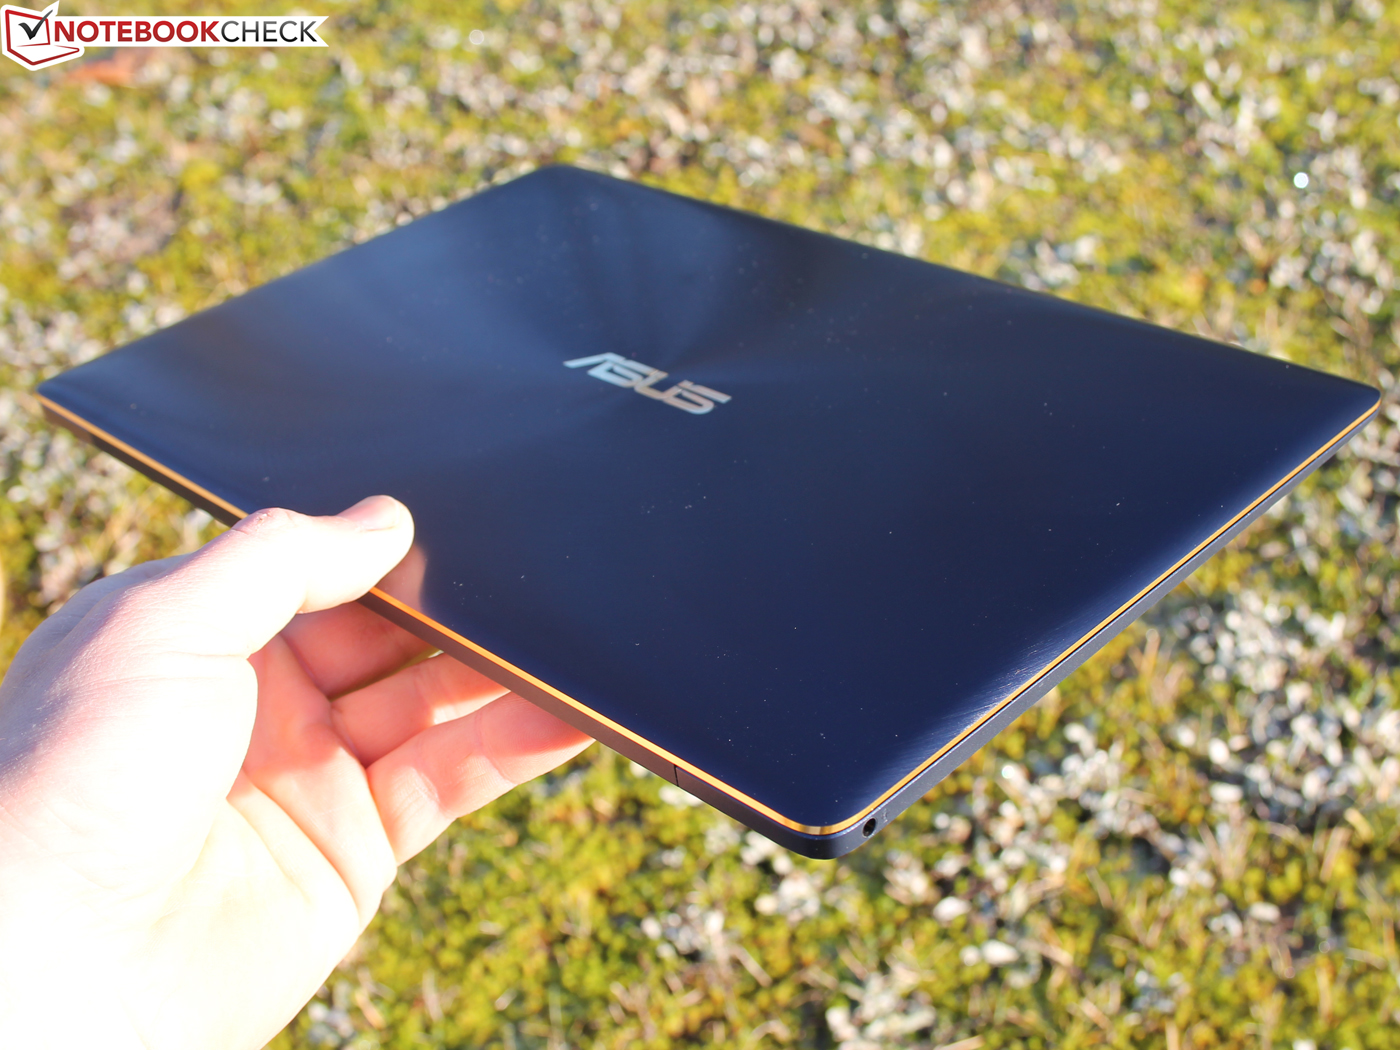
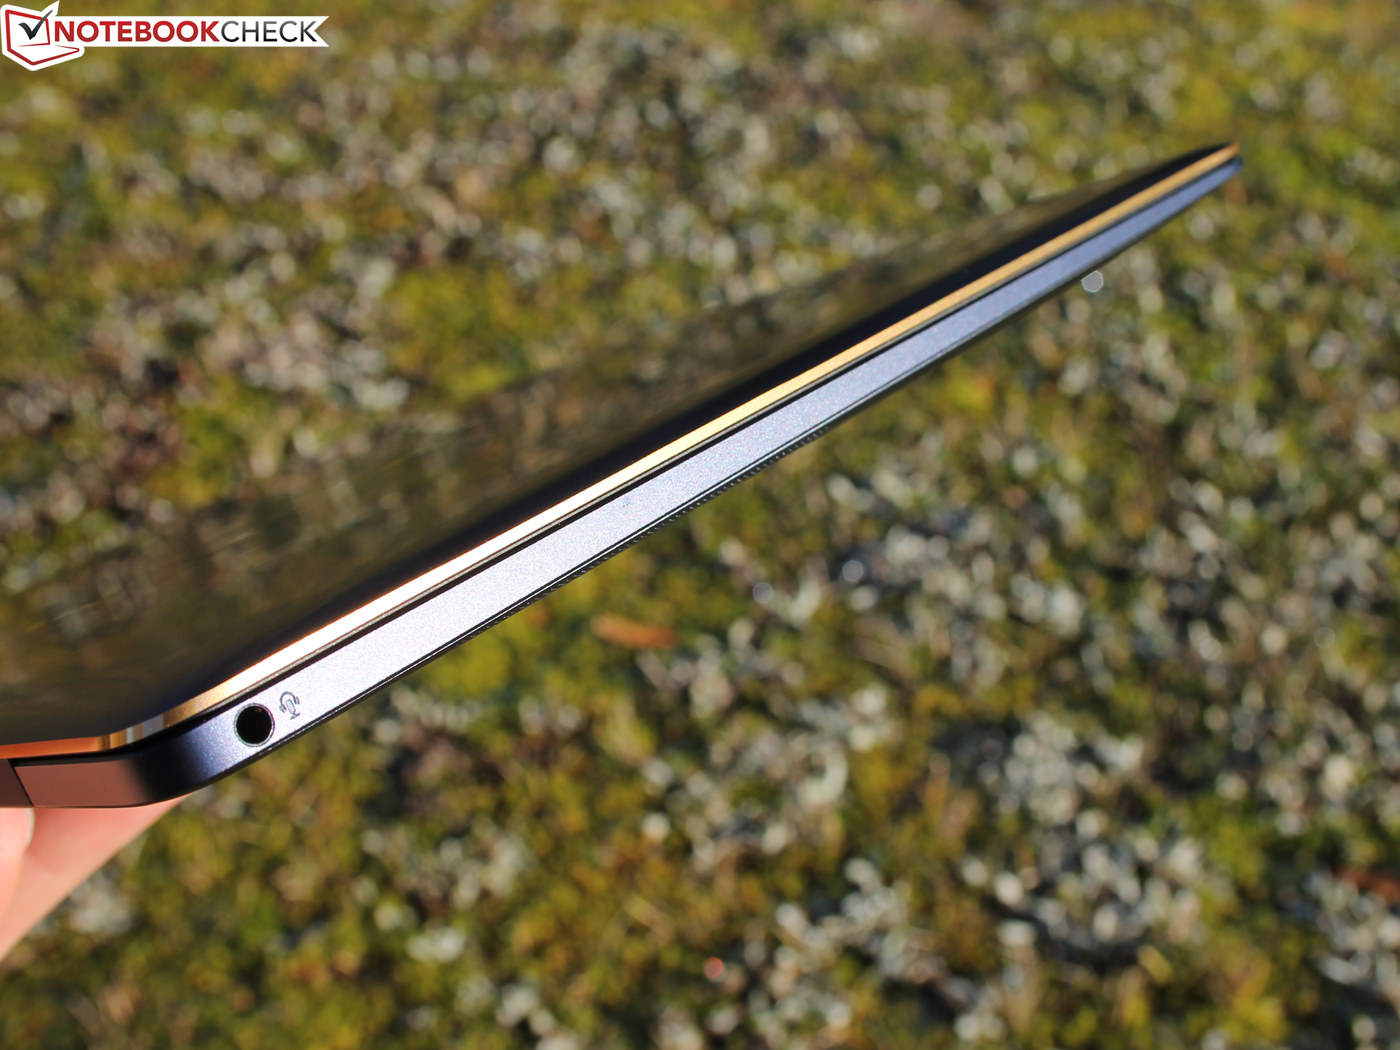
De ZenBook 3 UX390UA-GS041T kan met gemak een plaatsje veroveren tussen de beste subnotebooks op de markt - hetzij niet de allerbeste. De Apple MacBook 12 (Early 2016), Dell XPS 13 9360 QHD+ i7 en HP EliteBook Folio G1 V1C37EA scoren nog beter, al zijn ze ook niet de optimale keuze voor iedere gebruiker.
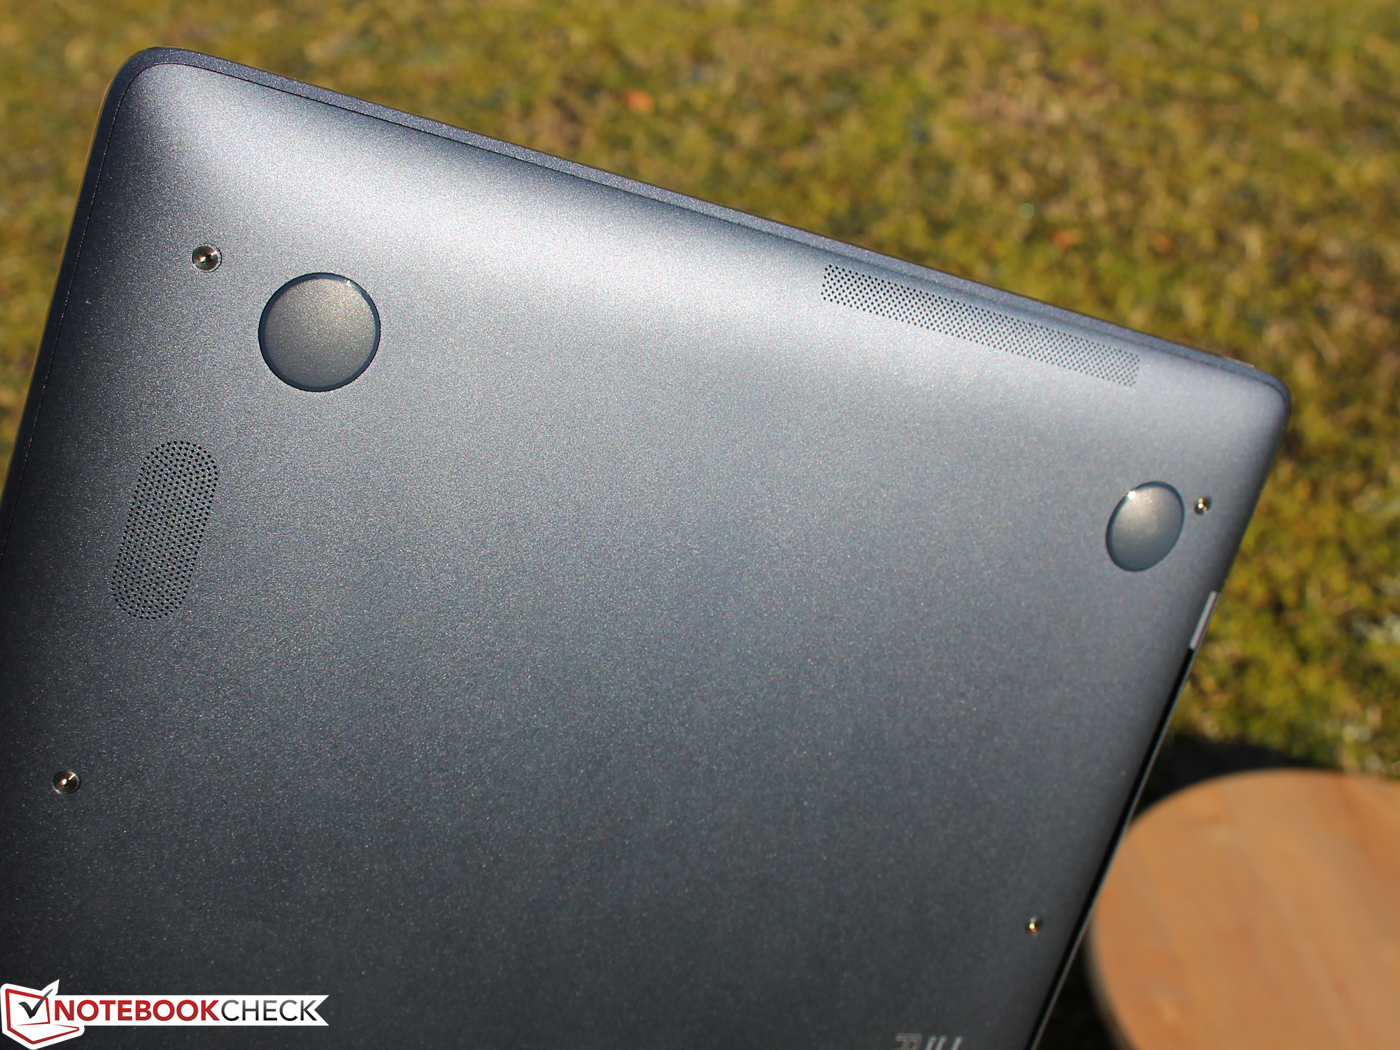
Naast zijn elegante uiterlijk en prima stabiliteit is het grote voordeel van de ZenBook 3 UX390UA zijn sterke prestaties. De MacBook 12 en EliteBook Folio G1 met Core m worden hier verslagen: als CPU-prestaties belangrijk zijn voor jou, zijn de ZenBook 3 UX390UA en de XPS 13 9360 interessanter. Asus was echter genoodzaakt om een ventilator te integreren die redelijk luid wordt onder belasting, al wordt het nooit echt oncomfortabel.
Alle toestellen in de vergelijking zijn redelijk gelijkaardig qua scherm - tenminste als je verschillen in resolutie negeert; hier komen de MacBook 12 (2304x1440) en de XPS 13 (3200x1800) met de hoogste getallen.
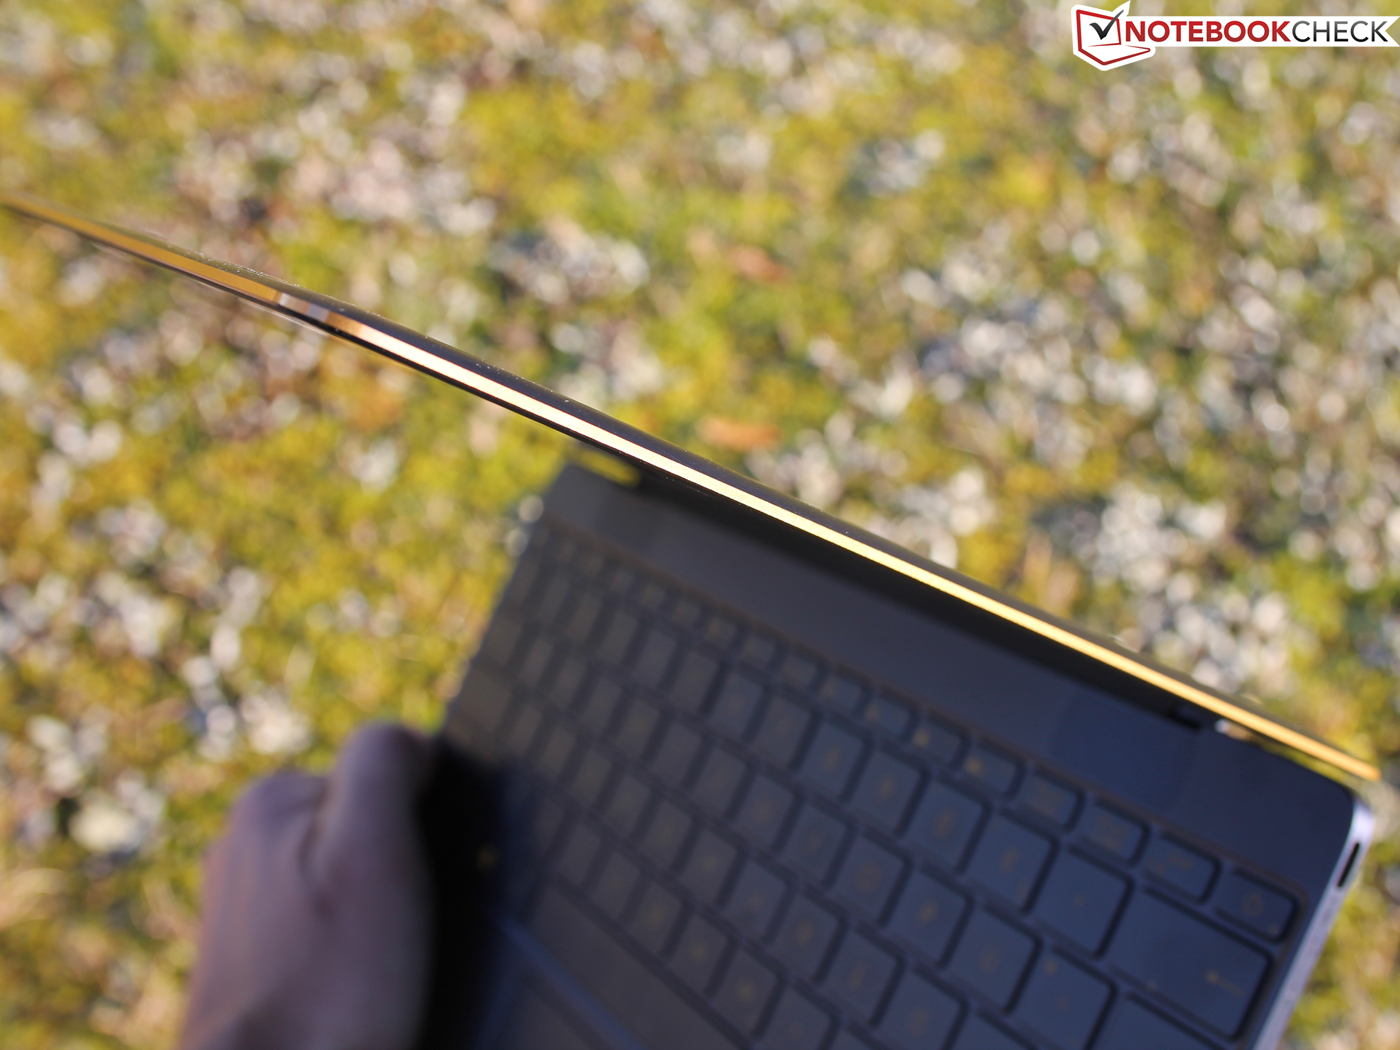
Ons testmodel kan niet de leiding nemen in de loopduur-tests, aangezien hij met zijn totale gewicht van slechts 914 gram gewoonweg geen plaats heeft voor een even grote batterij als in de XPS 13 (60 Wh i.p.v. 40 Wh voor de ZenBook). De ZenBook houdt het 6:30 vol, terwijl de XPS het pas na 8:40 voor bekeken houdt. De XPS weegt echter ook 1,3 kg. De batterij van de MacBook gaat ongeveer even lang mee.
Onze ZenBook 3 UX390UA-GS041T in 'Royal blue' kost ongeveer 1500 euro (~$1595). Zeker geen koopje, maar een MacBook 12 met een SSD van 512 GB kost 1600 euro (~$1702) en de XPS 13 9360 kost 1850 euro (~$1967) met dezelfde opslagcapaciteit. De XPS 13 beschikt wel over poorten van een volwaardig formaat en Thunderbolt 3-ondersteuning, maar is 15 mm dik en geen super-draagbaar 12.5-inch-systeem.
De strijd om de dunste behuizing wordt gewonnen door de HP Spectre 13 met zijn 10,4 millimeter, maar de Core i-chip heeft te lijden onder zijn inefficiënt Turbo-gebruik (throttling zelfs bij lichte werklasten).
Al bij al denken we dat de ZenBook 3 UX390UA het beste totaalpakket biedt voor wie zo veel mogelijk prestaties in een zo klein mogelijke machine wenst. De (objectief meetbare) prestaties in combinatie met zo'n dunne behuizing is een primeur voor mini-subnotebooks.
Als je 'prestaties' echter definieert als een combinatie van batterijduur, ergonomie (geen ventilator) en applicatie-performance, zal je zonder twijfel ook tevreden zijn met de HP EliteBook Folio G1 of de MacBook 12 (Early 2016).
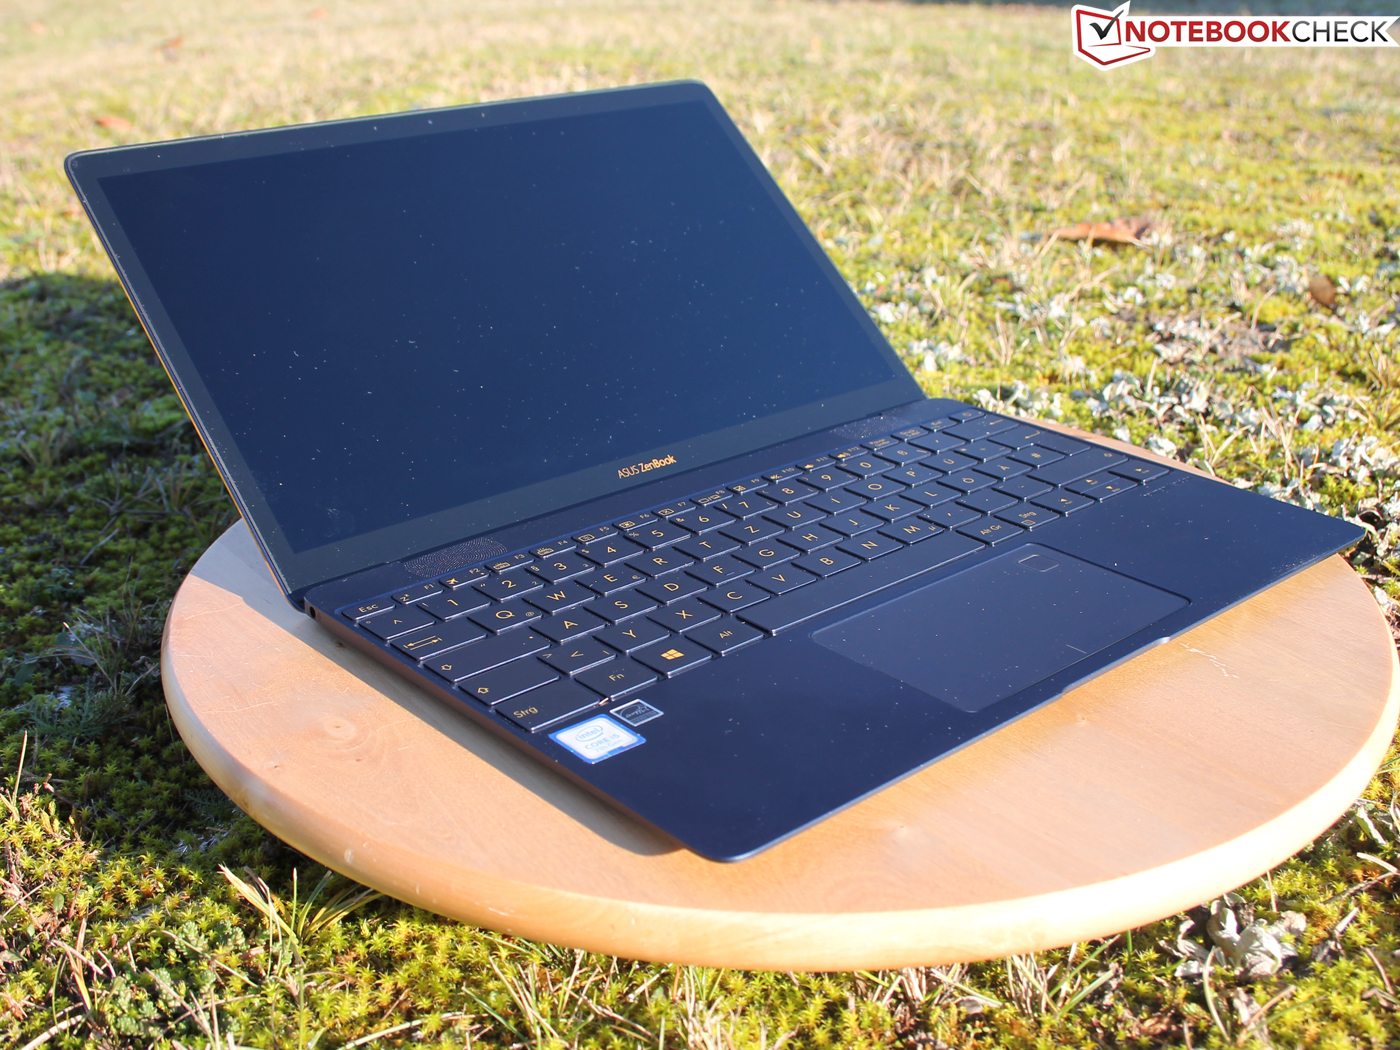
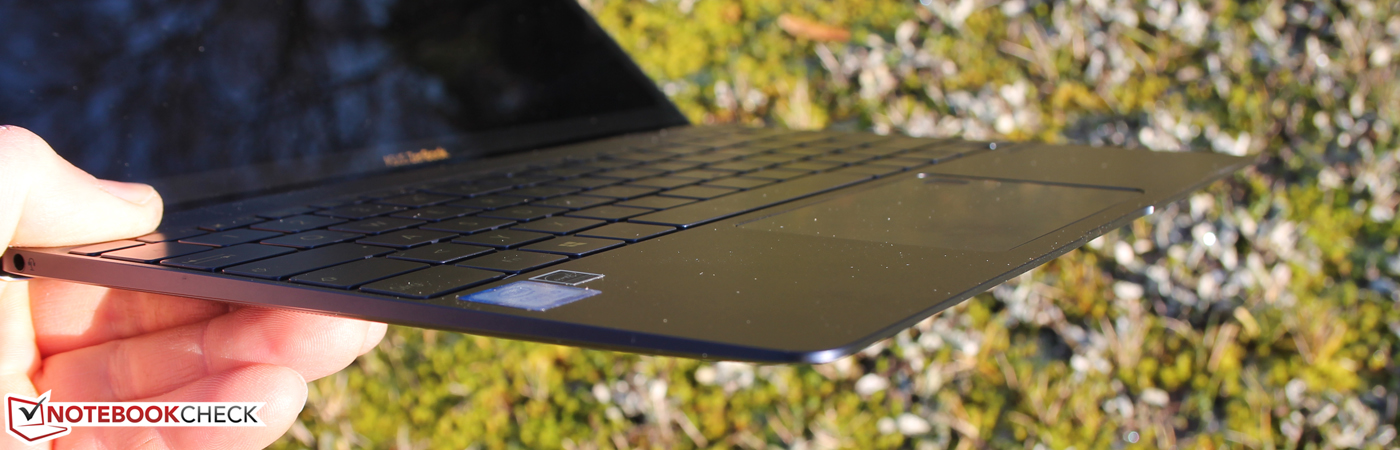
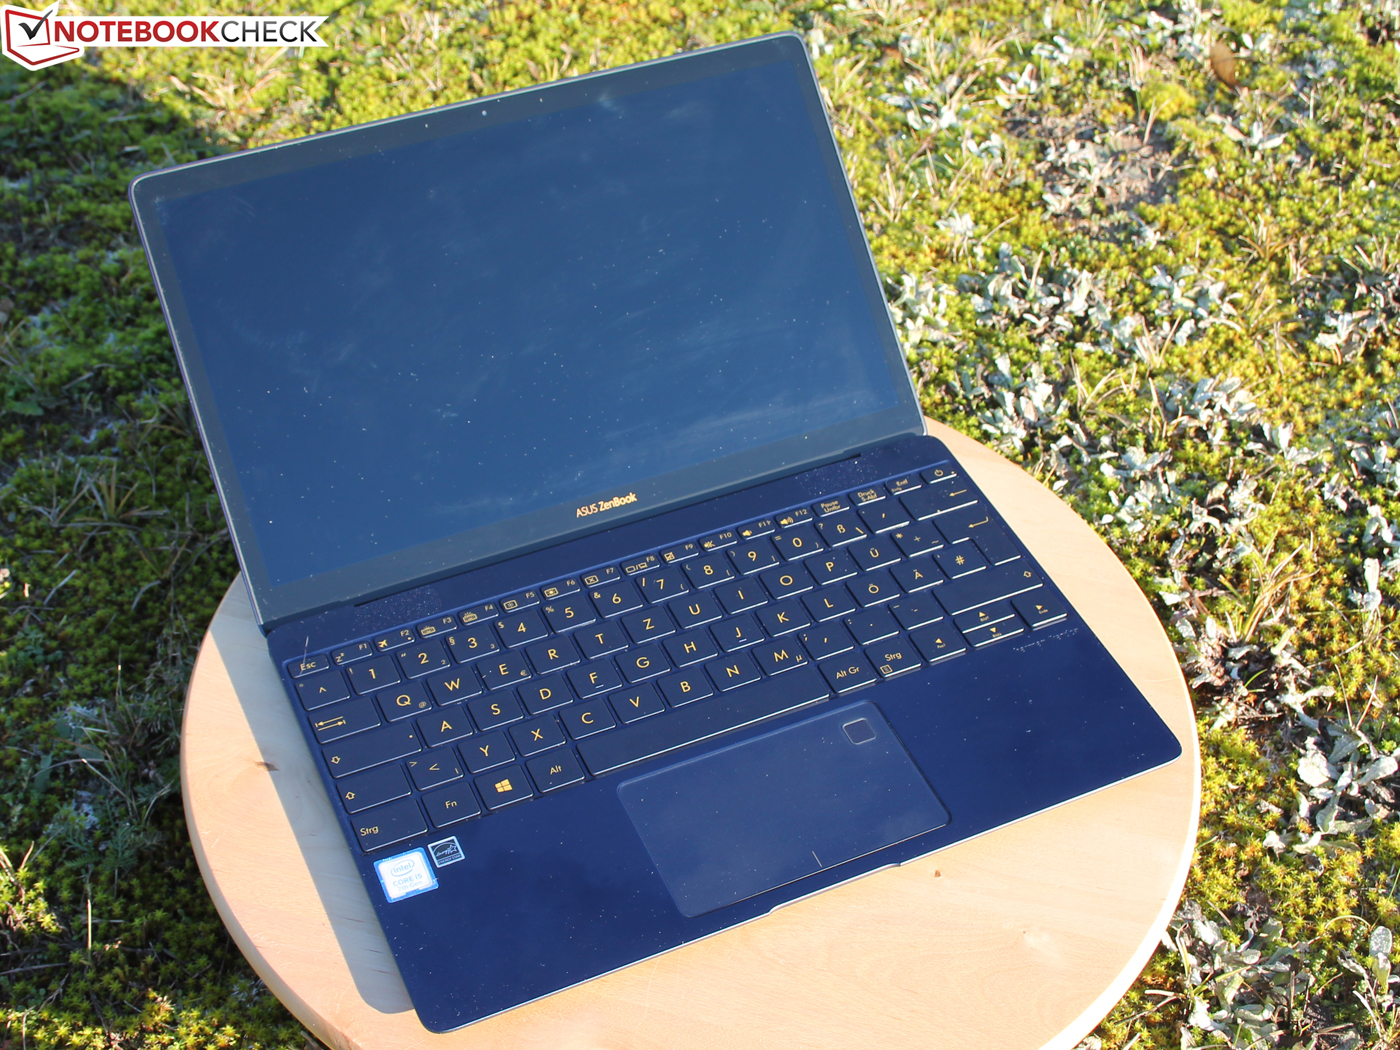
Asus Zenbook 3 UX390UA-GS041T
- 02-12-2016 v5.1 (old)
Sebastian Jentsch
Price comparison
