Notebookcheck Logo

Kort testrapport Asus ASUSPRO Advanced B8430UA-FA0084E Notebook

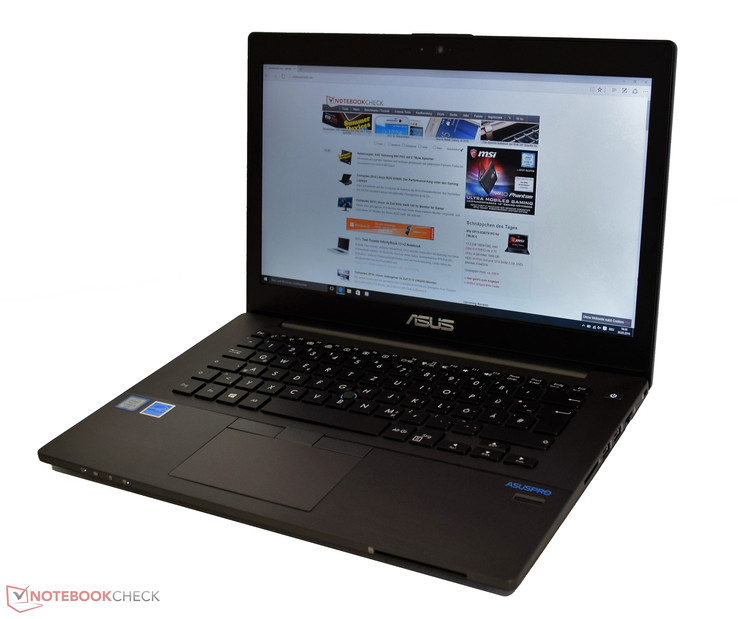
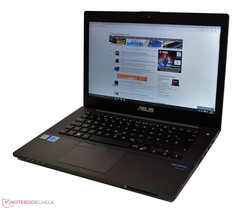
Simpele elegantie. Asus wil aan de groeiende verwachtingen van zakelijke gebruikers voldoen met nieuwe eigenschappen en meer prestaties in de AsusPro Advanced B8430UA. De basis wordt gelegd met een ULV-processor, voldoende werkgeheugen en een snelle SSD. Lees ons testrapport om uit te vinden hoe dit in de praktijk uitpakt voor de AsusPro Advanced B8430UA.
Asus ASUSPRO Advanced B8430UA-FA0084E (ASUSPRO Serie)
Processor
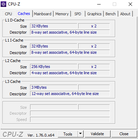
Intel Core i5-6200U 2 x 2.3 - 2.8 GHz, Skylake
Grafische kaart
Intel HD Graphics 520, Core: 1000 MHz, Geheugen: 800 MHz, 20.19.15.4326
Geheugen
8 GB 
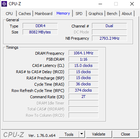
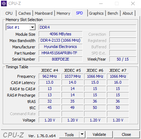
, 4 GB vastgesoldeerd + 1 x 4 GB (slot) 1/1 bezet, DDR4, 2133 MHz Hyundai Electronics, tot max. 20 GB
Beeldscherm
14.00 inch 16:9, 1920 x 1080 pixel 157 PPI, INNOLUX N140HGE-EAA, 262K (6-bit), CIE1931 45%, TN WLED, glimmend: nee
Moederbord
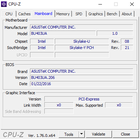
Intel Skylake-U Premium PCH
Opslag
Hynix HFS256G39MND, 256 GB 
, M.2 2280, 153 GB beschikbaar
Geluidskaart
Conexant SmartAudio HD
Verbindingen
4 USB 3.0, 0 USB 3.1 Gen2, 1 VGA, 1 DisplayPort, 1 Kensington Lock, Audio Verbindingen: stereo, Card Reader: MMC, SD, SDHC, SDXC, 1 SmartCard, 1 Vingerafdruklezer, Helderheidssensor, Sensoren: Accelerometer
Netwerkmogelijkheden
Intel Ethernet Connection I219-V (10/100/1000MBit/s), Intel Dual Band Wireless-AC 8260 (a/b/g/n = Wi-Fi 4/ac = Wi-Fi 5/), Bluetooth 4.2
Afmetingen
hoogte x breedte x diepte (in mm): 20.5 x 339 x 236
Batterij
48 Wh, 4110 mAh Lithium-Ion, verwijderbaar, verwijderbaar wanneer de onderhoudsklep open is
Besturingssysteem
Microsoft Windows 10 Pro 64 Bit
Camera
Webcam: 720p-HD
Bijkomende functionaliteiten
Luidsprekers: stereo, Toetsenbord: Chiclet, Toetsenbordverlichting: ja, stroomadapter, Asus Live Update, 24 Maanden Garantie
Gewicht
1.603 kg, Voeding: 312 g
Prijs
0 990
Opmerking: De fabrikant kan onderdelen van verschillende leveranciers gebruiken, waaronder beeldschermen, schijven of geheugensticks met vergelijkbare specificaties.


Left side: power, 2x USB 3.0, VGA, Mini-DisplayPort, 3.5 mm stereo jack
Right side: SD-card reader, 2x USB 3.0, Gigabit-Ethernet, slot for a Kensington lock
Front: Status LEDs, SmartCard reader
194
cd/m²
204
cd/m²
212
cd/m²
205
cd/m²
210
cd/m²
209
cd/m²
210
cd/m²
195
cd/m²
222
cd/m²
Helderheidsverdeling
INNOLUX N140HGE-EAA, 262K (6-bit), CIE1931 45% tested with X-Rite i1Pro 2
Maximum: 222 cd/m² (Nits) Gemiddelde: 206.8 cd/m² Minimum: 11 cd/m²
Helderheidsverdeling: 87 %
Helderheid in Batterij-modus: 213 cd/m²
Contrast: 525:1 (Zwart: 0.4 cd/m²)
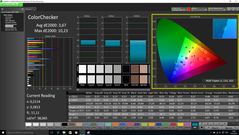
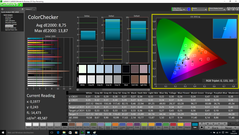
ΔE Color 8.75 | 0.5-29.43 Ø5
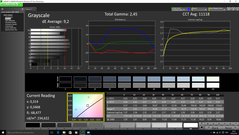
ΔE Greyscale 9.2 | 0.57-98 Ø5.3
57.96% sRGB (Argyll 1.6.3 3D)
37.46% AdobeRGB 1998 (Argyll 1.6.3 3D)
40.63% AdobeRGB 1998 (Argyll 2.2.0 3D)
58.1% sRGB (Argyll 2.2.0 3D)
39.25% Display P3 (Argyll 2.2.0 3D)
Gamma: 2.45
Asus ASUSPRO Advanced B8430UA-FA0084E
TN WLED, 1920x1080
Asus ASUSPRO Advanced BU401LA-CZ020G
TN-Panel, 1600x900
Lenovo ThinkPad L460-20FVS01400
IPS, 1920x1080
Dell Latitude 14 E5470
TN, 1366x768
HP EliteBook 840 G3 T9X59ET#ABD
TN LED, 1920x1080
Lenovo ThinkPad T460s-20F9003SGE
IPS, 1920x1080
Lenovo ThinkPad T460-20FN003LGE
IPS, 1920x1080
Display
20%
8%
3%
25%
6%
7%
Display P3 Coverage
39.25
46.98
20%
42.2
8%
40.06
2%
48.93
25%
41.65
6%
42.09
7%
sRGB Coverage
58.1
69.8
20%
62.3
7%
60.3
4%
73.7
27%
61.6
6%
62
7%
AdobeRGB 1998 Coverage
40.63
48.67
20%
43.72
8%
41.42
2%
50.5
24%
43.14
6%
43.6
7%
Response Times
-23%
-36%
-10%
-19%
-9%
Response Time Grey 50% / Grey 80% *
42 ?(22.4, 19.6)
44.4 ?(20.4, 24)
-6%
56.8 ?(35.6, 21.2)
-35%
43 ?(20, 23)
-2%
42 ?(19.6, 22.4)
-0%
42.4 ?(16, 26.4)
-1%
Response Time Black / White *
21.2 ?(16.8, 4.4)
29.6 ?(17.2, 12.4)
-40%
28.8 ?(19.6, 9.2)
-36%
25 ?(9, 16)
-18%
29.2 ?(16, 13.2)
-38%
24.8 ?(7.6, 17.2)
-17%
PWM Frequency
204 ?(90)
Screen
-2%
19%
-16%
10%
20%
14%
Brightness middle
210
216
3%
245
17%
229
9%
366
74%
226
8%
230
10%
Brightness
207
209
1%
225
9%
207
0%
336
62%
211
2%
216
4%
Brightness Distribution
87
89
2%
83
-5%
80
-8%
87
0%
89
2%
85
-2%
Black Level *
0.4
0.436
-9%
0.24
40%
0.69
-73%
0.65
-63%
0.22
45%
0.26
35%
Contrast
525
495
-6%
1021
94%
332
-37%
563
7%
1027
96%
885
69%
Colorchecker dE 2000 *
8.75
9.63
-10%
6.89
21%
10.16
-16%
10.26
-17%
6.44
26%
7.32
16%
Colorchecker dE 2000 max. *
13.87
17.62
-27%
17.18
-24%
17.18
-24%
18.14
-31%
Greyscale dE 2000 *
9.2
10.72
-17%
6.45
30%
10.87
-18%
11.51
-25%
5.87
36%
6.98
24%
Gamma
2.45 90%
2.49 88%
2.46 89%
2.41 91%
2.4 92%
2.37 93%
2.5 88%
CCT
11118 58%
12873 50%
6857 95%
12881 50%
12725 51%
6856 95%
6683 97%
Color Space (Percent of AdobeRGB 1998)
37.46
44.8
20%
40.1
7%
38.4
3%
47
25%
39.58
6%
39.97
7%
Color Space (Percent of sRGB)
57.96
61.8
7%
60.4
4%
74
28%
61.15
6%
61.55
6%
Totaal Gemiddelde (Programma / Instellingen)
9% / 4%
1% / 11%
-16% / -15%
8% / 11%
2% / 12%
4% / 9%

* ... kleiner is beter

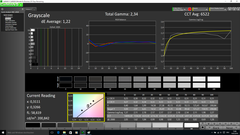
Grayscale (before calibration)
Grayscale (after calibration)
ColorChecker (before calibration)
ColorChecker (after calibration)
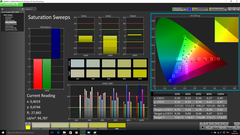
Saturation Sweeps (before calibration)
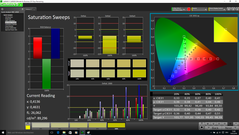
Saturation Sweeps (after calibration)

Responstijd Scherm

De responstijden van het scherm tonen hoe snel het scherm in staat is om van één kleur naar de andere te veranderen. Trage responstijden kunnen aanleiding geven tot 'nabeelden' rond bewegende objecten of het scherm wazig maken (blur). Vooral spelers van snelle 3D-games hebben baat bij een scherm met snelle responstijden.
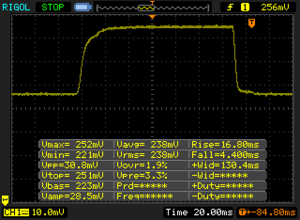
       Responstijd Zwart naar Wit
21.2 ms ... stijging ↗ en daling ↘ gecombineerd↗ 16.8 ms stijging
↘ 4.4 ms daling
Het scherm vertoonde prima responstijden in onze tests maar is misschien wat te traag voor competitieve games.
Ter vergelijking: alle testtoestellen variëren van 0.1 (minimum) tot 240 (maximum) ms. » 41 % van alle toestellen zijn beter.
Dit betekent dat de gemeten responstijd vergelijkbaar is met het gemiddelde (21.5 ms) van alle geteste toestellen.
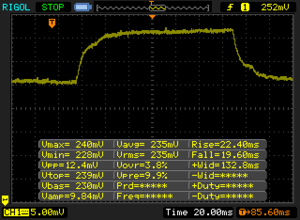
       Responstijd 50% Grijs naar 80% Grijs
42 ms ... stijging ↗ en daling ↘ gecombineerd↗ 22.4 ms stijging
↘ 19.6 ms daling
Het scherm vertoonde trage responstijden in onze tests en is misschien te traag voor games.
Ter vergelijking: alle testtoestellen variëren van 0.2 (minimum) tot 636 (maximum) ms. » 63 % van alle toestellen zijn beter.
Dit betekent dat de gemeten responstijd slechter is dan het gemiddelde (33.7 ms) van alle geteste toestellen.

Screen Flickering / PWM (Pulse-Width Modulation)

Om de schermhelderheid te verlagen schakelen sommige laptops het backlight erg snel aan en uit. Dit gebeurt aan een dergelijk hoge frequentie dat het niet zichtbaar is voor het menselijk oog. Als de frequentie te laag is kunnen personen met gevoelige ogen geïrriteerd geraken, hoofdpijn krijgen en zelfs flickering waarnemen.
Screen flickering / PWM niet waargenomen

Ter vergelijking: 53 % van alle geteste toestellen maakten geen gebruik van PWM om de schermhelderheid te verlagen. Als het wel werd gebruikt, werd een gemiddelde van 17924 (minimum: 5 - maximum: 3846000) Hz waargenomen.

Viewing angles AsusPro Advanced B8430UA
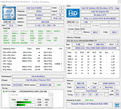
CPU-Z
CPU-Z
CPU-Z
CPU-Z
CPU-Z
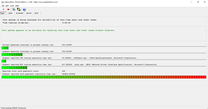
GPU-Z
GPU-Z
HWiNFO
DPC Latency
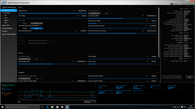
Intel Extreme Tuning Utility
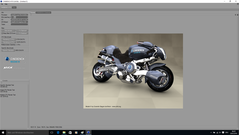
Cinebench R10
Cinebench R10
Cinebench R11.5
Cinebench R11.5
Cinebench R15
Cinebench R15
Jetstream 1.1
Jetstream 1.1
Octane V2
Octane V2
Mozilla Kraken 1.1
Mozilla Kraken 1.1
Cinebench R15
CPU Single 64Bit (sorteer op waarde)
Asus ASUSPRO Advanced B8430UA-FA0084E
Intel Core i5-6200U, 2300 MHz
108 Points
Asus ASUSPRO Advanced BU401LA-CZ020G
Intel Core i7-4650U, 1700 MHz
124 Points +15%
Lenovo ThinkPad L460-20FVS01400
Intel Core i7-6500U, 2500 MHz
127 Points +18%
Dell Latitude 14 E5470
Intel Core i5-6300U, 2400 MHz
124 Points +15%
HP EliteBook 840 G3 T9X59ET#ABD
Intel Core i7-6500U, 2500 MHz
119 Points +10%
Lenovo ThinkPad T460s-20F9003SGE
Intel Core i5-6200U, 2300 MHz
116 Points +7%
Lenovo ThinkPad T460-20FN003LGE
Intel Core i5-6200U, 2300 MHz
115 Points +6%
CPU Multi 64Bit (sorteer op waarde)
Asus ASUSPRO Advanced B8430UA-FA0084E
Intel Core i5-6200U, 2300 MHz
273 Points
Asus ASUSPRO Advanced BU401LA-CZ020G
Intel Core i7-4650U, 1700 MHz
271 Points -1%
Lenovo ThinkPad L460-20FVS01400
Intel Core i7-6500U, 2500 MHz
303 Points +11%
Dell Latitude 14 E5470
Intel Core i5-6300U, 2400 MHz
311 Points +14%
HP EliteBook 840 G3 T9X59ET#ABD
Intel Core i7-6500U, 2500 MHz
322 Points +18%
Lenovo ThinkPad T460s-20F9003SGE
Intel Core i5-6200U, 2300 MHz
288 Points +5%
Lenovo ThinkPad T460-20FN003LGE
Intel Core i5-6200U, 2300 MHz
287 Points +5%
Cinebench R11.5
CPU Single 64Bit (sorteer op waarde)
Asus ASUSPRO Advanced B8430UA-FA0084E
Intel Core i5-6200U, 2300 MHz
1.22 Points
Asus ASUSPRO Advanced BU401LA-CZ020G
Intel Core i7-4650U, 1700 MHz
1.42 Points +16%
Lenovo ThinkPad L460-20FVS01400
Intel Core i7-6500U, 2500 MHz
1.41 Points +16%
Dell Latitude 14 E5470
Intel Core i5-6300U, 2400 MHz
1.42 Points +16%
Lenovo ThinkPad T460s-20F9003SGE
Intel Core i5-6200U, 2300 MHz
1.31 Points +7%
CPU Multi 64Bit (sorteer op waarde)
Asus ASUSPRO Advanced B8430UA-FA0084E
Intel Core i5-6200U, 2300 MHz
3.05 Points
Asus ASUSPRO Advanced BU401LA-CZ020G
Intel Core i7-4650U, 1700 MHz
2.9 Points -5%
Lenovo ThinkPad L460-20FVS01400
Intel Core i7-6500U, 2500 MHz
3.4 Points +11%
Dell Latitude 14 E5470
Intel Core i5-6300U, 2400 MHz
3.44 Points +13%
Lenovo ThinkPad T460s-20F9003SGE
Intel Core i5-6200U, 2300 MHz
3.18 Points +4%
Cinebench R10
Rendering Single CPUs 64Bit (sorteer op waarde)
Asus ASUSPRO Advanced B8430UA-FA0084E
Intel Core i5-6200U, 2300 MHz
5735 Points
Asus ASUSPRO Advanced BU401LA-CZ020G
Intel Core i7-4650U, 1700 MHz
6241 Points +9%
Dell Latitude 14 E5470
Intel Core i5-6300U, 2400 MHz
6250 Points +9%
Rendering Multiple CPUs 64Bit (sorteer op waarde)
Asus ASUSPRO Advanced B8430UA-FA0084E
Intel Core i5-6200U, 2300 MHz
12476 Points
Asus ASUSPRO Advanced BU401LA-CZ020G
Intel Core i7-4650U, 1700 MHz
12576 Points +1%
Dell Latitude 14 E5470
Intel Core i5-6300U, 2400 MHz
13751 Points +10%
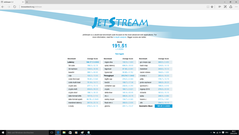
JetStream 1.1 - Total Score (sorteer op waarde)
Asus ASUSPRO Advanced B8430UA-FA0084E
Intel Core i5-6200U, 2300 MHz
191.5 Points
Lenovo ThinkPad L460-20FVS01400
Intel Core i7-6500U, 2500 MHz
210.8 Points +10%
HP EliteBook 840 G3 T9X59ET#ABD
Intel Core i7-6500U, 2500 MHz
197.5 Points +3%
Lenovo ThinkPad T460s-20F9003SGE
Intel Core i5-6200U, 2300 MHz
187 Points -2%
Lenovo ThinkPad T460-20FN003LGE
Intel Core i5-6200U, 2300 MHz
195 Points +2%
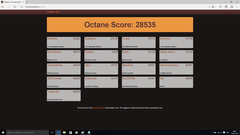
Octane V2 - Total Score (sorteer op waarde)
Asus ASUSPRO Advanced B8430UA-FA0084E
Intel Core i5-6200U, 2300 MHz
28535 Points
Lenovo ThinkPad L460-20FVS01400
Intel Core i7-6500U, 2500 MHz
31034 Points +9%
Dell Latitude 14 E5470
Intel Core i5-6300U, 2400 MHz
30699 Points +8%
HP EliteBook 840 G3 T9X59ET#ABD
Intel Core i7-6500U, 2500 MHz
31545 Points +11%
Lenovo ThinkPad T460s-20F9003SGE
Intel Core i5-6200U, 2300 MHz
28844 Points +1%
Lenovo ThinkPad T460-20FN003LGE
Intel Core i5-6200U, 2300 MHz
28219 Points -1%
Mozilla Kraken 1.1 - Total (sorteer op waarde)
Asus ASUSPRO Advanced B8430UA-FA0084E
Intel Core i5-6200U, 2300 MHz
1264 ms *
Lenovo ThinkPad L460-20FVS01400
Intel Core i7-6500U, 2500 MHz
1111 ms * +12%
Dell Latitude 14 E5470
Intel Core i5-6300U, 2400 MHz
1168 ms * +8%
HP EliteBook 840 G3 T9X59ET#ABD
Intel Core i7-6500U, 2500 MHz
1100 ms * +13%
Lenovo ThinkPad T460s-20F9003SGE
Intel Core i5-6200U, 2300 MHz
1246 ms * +1%
Lenovo ThinkPad T460-20FN003LGE
Intel Core i5-6200U, 2300 MHz
1236 ms * +2%

* ... kleiner is beter

Cinebench R10 Shading 32Bit
7897
Cinebench R10 Rendering Multiple CPUs 32Bit
9670
Cinebench R10 Rendering Single 32Bit
4374
Cinebench R10 Shading 64Bit
8053 Points
Cinebench R10 Rendering Multiple CPUs 64Bit
12476 Points
Cinebench R10 Rendering Single CPUs 64Bit
5735 Points
Cinebench R11.5 CPU Multi 64Bit
3.05 Points
Cinebench R11.5 OpenGL 64Bit
32.2 fps
Cinebench R11.5 CPU Single 64Bit
1.22 Points
Cinebench R15 CPU Multi 64Bit
273 Points
Cinebench R15 CPU Single 64Bit
108 Points
Cinebench R15 Ref. Match 64Bit
97.8 %
Cinebench R15 OpenGL 64Bit
38.27 fps
Help
PCMark 8 Home
PCMark 8 Home
PCMark 8 Creative
PCMark 8 Creative
PCMark 8 Work
PCMark 8 Work
PCMark 8 Storage
PCMark 8 Storage
PCMark 7
PCMark 7
PCMark 8
Home Score Accelerated v2 (sorteer op waarde)
Asus ASUSPRO Advanced B8430UA-FA0084E
Intel Core i5-6200U, 2300 MHz, Hynix HFS256G39MND
3309 Points
Asus ASUSPRO Advanced BU401LA-CZ020G
Intel Core i7-4650U, 1700 MHz, Liteonit LCS-256M6S
2711 Points -18%
Lenovo ThinkPad L460-20FVS01400
Intel Core i7-6500U, 2500 MHz, Toshiba HG6 THNSFJ256GCSU
3092 Points -7%
Dell Latitude 14 E5470
Intel Core i5-6300U, 2400 MHz, Liteon L8H-256V2G
3438 Points +4%
HP EliteBook 840 G3 T9X59ET#ABD
Intel Core i7-6500U, 2500 MHz, Samsung SSD PM851 256 GB MZNTE256HMHP
3231 Points -2%
Lenovo ThinkPad T460s-20F9003SGE
Intel Core i5-6200U, 2300 MHz, Samsung CM871 MZ7LF192HCGS
3024 Points -9%
Lenovo ThinkPad T460-20FN003LGE
Intel Core i5-6200U, 2300 MHz, Toshiba HG6 THNSFJ256GCSU
2891 Points -13%
Creative Score Accelerated v2 (sorteer op waarde)
Asus ASUSPRO Advanced B8430UA-FA0084E
Intel Core i5-6200U, 2300 MHz, Hynix HFS256G39MND
3867 Points
Asus ASUSPRO Advanced BU401LA-CZ020G
Intel Core i7-4650U, 1700 MHz, Liteonit LCS-256M6S
2495 Points -35%
Lenovo ThinkPad L460-20FVS01400
Intel Core i7-6500U, 2500 MHz, Toshiba HG6 THNSFJ256GCSU
3738 Points -3%
Dell Latitude 14 E5470
Intel Core i5-6300U, 2400 MHz, Liteon L8H-256V2G
3946 Points +2%
Lenovo ThinkPad T460s-20F9003SGE
Intel Core i5-6200U, 2300 MHz, Samsung CM871 MZ7LF192HCGS
3644 Points -6%
Work Score Accelerated v2 (sorteer op waarde)
Asus ASUSPRO Advanced B8430UA-FA0084E
Intel Core i5-6200U, 2300 MHz, Hynix HFS256G39MND
4192 Points
Asus ASUSPRO Advanced BU401LA-CZ020G
Intel Core i7-4650U, 1700 MHz, Liteonit LCS-256M6S
3261 Points -22%
Lenovo ThinkPad L460-20FVS01400
Intel Core i7-6500U, 2500 MHz, Toshiba HG6 THNSFJ256GCSU
4591 Points +10%
Dell Latitude 14 E5470
Intel Core i5-6300U, 2400 MHz, Liteon L8H-256V2G
4599 Points +10%
HP EliteBook 840 G3 T9X59ET#ABD
Intel Core i7-6500U, 2500 MHz, Samsung SSD PM851 256 GB MZNTE256HMHP
4275 Points +2%
Lenovo ThinkPad T460s-20F9003SGE
Intel Core i5-6200U, 2300 MHz, Samsung CM871 MZ7LF192HCGS
4121 Points -2%
Lenovo ThinkPad T460-20FN003LGE
Intel Core i5-6200U, 2300 MHz, Toshiba HG6 THNSFJ256GCSU
3956 Points -6%
PCMark 7
Score (sorteer op waarde)
Asus ASUSPRO Advanced B8430UA-FA0084E
Intel Core i5-6200U, 2300 MHz, Hynix HFS256G39MND
4889 Points
Asus ASUSPRO Advanced BU401LA-CZ020G
Intel Core i7-4650U, 1700 MHz, Liteonit LCS-256M6S
5190 Points +6%
Lenovo ThinkPad L460-20FVS01400
Intel Core i7-6500U, 2500 MHz, Toshiba HG6 THNSFJ256GCSU
4911 Points 0%
Dell Latitude 14 E5470
Intel Core i5-6300U, 2400 MHz, Liteon L8H-256V2G
5125 Points +5%
Productivity (sorteer op waarde)
Asus ASUSPRO Advanced B8430UA-FA0084E
Intel Core i5-6200U, 2300 MHz, Hynix HFS256G39MND
9865 Points
Asus ASUSPRO Advanced BU401LA-CZ020G
Intel Core i7-4650U, 1700 MHz, Liteonit LCS-256M6S
3956 Points -60%
Lenovo ThinkPad L460-20FVS01400
Intel Core i7-6500U, 2500 MHz, Toshiba HG6 THNSFJ256GCSU
4271 Points -57%
Dell Latitude 14 E5470
Intel Core i5-6300U, 2400 MHz, Liteon L8H-256V2G
4350 Points -56%
PCMark 7 Score
4889 punten
PCMark 8 Home Score Accelerated v2
3309 punten
PCMark 8 Creative Score Accelerated v2
3867 punten
PCMark 8 Work Score Accelerated v2
4192 punten
Help
CrystalDiskMark
CrystalDiskMark
AS SSD
AS SSD
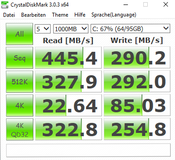
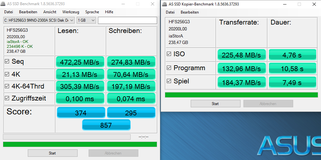
Hynix HFS256G39MND
Sequential Read: 445.4 MB/s
Sequential Write: 290.2 MB/s
512K Read: 327.9 MB/s
512K Write: 292 MB/s
4K Read: 22.64 MB/s
4K Write: 85 MB/s
4K QD32 Read: 322.8 MB/s
4K QD32 Write: 254.8 MB/s
3DMark Ice Storm
3DMark Ice Storm Extreme
3DMark Cloud Gate
3DMark Sky Diver
3DMark Fire Strike
3DMark Fire Strike Extreme
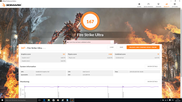
3DMark Fire Strike Ultra
3DMark 11
3DMark06
3DMark05
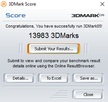
3DMark03
 
3DMark
1280x720 Ice Storm Standard Score (sorteer op waarde)
Asus ASUSPRO Advanced B8430UA-FA0084E
Intel Core i5-6200U, HD Graphics 520
48117 Points
Asus ASUSPRO Advanced BU401LA-CZ020G
Intel Core i7-4650U, HD Graphics 5000
45548 Points -5%
Lenovo ThinkPad L460-20FVS01400
Intel Core i7-6500U, Radeon R5 M330
29533 Points -39%
Dell Latitude 14 E5470
Intel Core i5-6300U, HD Graphics 520
50690 Points +5%
Lenovo ThinkPad T460-20FN003LGE
Intel Core i5-6200U, HD Graphics 520
35373 Points -26%
1280x720 Cloud Gate Standard Score (sorteer op waarde)
Asus ASUSPRO Advanced B8430UA-FA0084E
Intel Core i5-6200U, HD Graphics 520
4958 Points
Asus ASUSPRO Advanced BU401LA-CZ020G
Intel Core i7-4650U, HD Graphics 5000
4565 Points -8%
Lenovo ThinkPad L460-20FVS01400
Intel Core i7-6500U, Radeon R5 M330
4630 Points -7%
Dell Latitude 14 E5470
Intel Core i5-6300U, HD Graphics 520
5176 Points +4%
HP EliteBook 840 G3 T9X59ET#ABD
Intel Core i7-6500U, HD Graphics 520
5346 Points +8%
Lenovo ThinkPad T460s-20F9003SGE
Intel Core i5-6200U, HD Graphics 520
4397 Points -11%
Lenovo ThinkPad T460-20FN003LGE
Intel Core i5-6200U, HD Graphics 520
4165 Points -16%
1920x1080 Fire Strike Score (sorteer op waarde)
Asus ASUSPRO Advanced B8430UA-FA0084E
Intel Core i5-6200U, HD Graphics 520
707 Points
Asus ASUSPRO Advanced BU401LA-CZ020G
Intel Core i7-4650U, HD Graphics 5000
644 Points -9%
Lenovo ThinkPad L460-20FVS01400
Intel Core i7-6500U, Radeon R5 M330
898 Points +27%
Dell Latitude 14 E5470
Intel Core i5-6300U, HD Graphics 520
741 Points +5%
HP EliteBook 840 G3 T9X59ET#ABD
Intel Core i7-6500U, HD Graphics 520
751 Points +6%
Lenovo ThinkPad T460s-20F9003SGE
Intel Core i5-6200U, HD Graphics 520
571 Points -19%
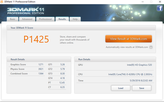
3DMark 11
1280x720 Performance (sorteer op waarde)
Asus ASUSPRO Advanced B8430UA-FA0084E
Intel Core i5-6200U, HD Graphics 520
1425 Points
Asus ASUSPRO Advanced BU401LA-CZ020G
Intel Core i7-4650U, HD Graphics 5000
1120 Points -21%
Lenovo ThinkPad L460-20FVS01400
Intel Core i7-6500U, Radeon R5 M330
1869 Points +31%
Dell Latitude 14 E5470
Intel Core i5-6300U, HD Graphics 520
1418 Points 0%
HP EliteBook 840 G3 T9X59ET#ABD
Intel Core i7-6500U, HD Graphics 520
1468 Points +3%
Lenovo ThinkPad T460s-20F9003SGE
Intel Core i5-6200U, HD Graphics 520
1238 Points -13%
Lenovo ThinkPad T460-20FN003LGE
Intel Core i5-6200U, HD Graphics 520
1263 Points -11%
1280x720 Performance GPU (sorteer op waarde)
Asus ASUSPRO Advanced B8430UA-FA0084E
Intel Core i5-6200U, HD Graphics 520
1271 Points
Asus ASUSPRO Advanced BU401LA-CZ020G
Intel Core i7-4650U, HD Graphics 5000
1032 Points -19%
Lenovo ThinkPad L460-20FVS01400
Intel Core i7-6500U, Radeon R5 M330
1736 Points +37%
Dell Latitude 14 E5470
Intel Core i5-6300U, HD Graphics 520
1290 Points +1%
HP EliteBook 840 G3 T9X59ET#ABD
Intel Core i7-6500U, HD Graphics 520
1327 Points +4%
Lenovo ThinkPad T460s-20F9003SGE
Intel Core i5-6200U, HD Graphics 520
1156 Points -9%
Lenovo ThinkPad T460-20FN003LGE
Intel Core i5-6200U, HD Graphics 520
1165 Points -8%
3DMark 06 - 1280x1024 Standard Score AA:0x AF:0x (sorteer op waarde)
Asus ASUSPRO Advanced B8430UA-FA0084E
Intel Core i5-6200U, HD Graphics 520
8656 Points
Lenovo ThinkPad L460-20FVS01400
Intel Core i7-6500U, Radeon R5 M330
6282 Points -27%
3DMark 03 Standard
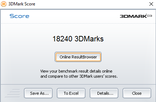
18240 punten
3DMark 06 Standard Score
8656 punten
3DMark 11 Performance
1425 punten
3DMark Ice Storm Standard Score
48117 punten
3DMark Cloud Gate Standard Score
4958 punten
3DMark Fire Strike Score
707 punten
3DMark Fire Strike Extreme Score
331 punten
Help
lage gem. hoge ultra
BioShock Infinite (2013) 44.04 23.58 19.79 5.82
Battlefield 4 (2013) 40.9 24.1 18.7
Rise of the Tomb Raider (2016) 17.8 11.9 7.2

Geluidsniveau

Onbelast
28.8 / 28.8 / 28.8 dB (A)
Belasting
34.7 / 36.1 dB (A)
  red to green bar
 
 
30 dB
stil
40 dB(A)
hoorbaar
50 dB(A)
luid
 
min: dark, med: mid, max: light   ECM8000 + Voltcraft SL-451 (15 cm afstand)   omgevingslawaai: 28.8 dB(A)
Asus ASUSPRO Advanced B8430UA-FA0084E
Intel Core i5-6200U, HD Graphics 520
Asus ASUSPRO Advanced BU401LA-CZ020G
Intel Core i7-4650U, HD Graphics 5000
Lenovo ThinkPad L460-20FVS01400
Intel Core i7-6500U, Radeon R5 M330
Dell Latitude 14 E5470
Intel Core i5-6300U, HD Graphics 520
HP EliteBook 840 G3 T9X59ET#ABD
Intel Core i7-6500U, HD Graphics 520
Lenovo ThinkPad T460s-20F9003SGE
Intel Core i5-6200U, HD Graphics 520
Lenovo ThinkPad T460-20FN003LGE
Intel Core i5-6200U, HD Graphics 520
Noise
-2%
-0%
0%
-9%
0%
-1%
uit / omgeving *
28.8
29.2
-1%
29.2
-1%
31.2
-8%
29.1
-1%
29
-1%
Idle Minimum *
28.8
29.3
-2%
29.2
-1%
29.2
-1%
31.2
-8%
29.1
-1%
29
-1%
Idle Average *
28.8
29.3
-2%
29.2
-1%
29.2
-1%
32.1
-11%
29.1
-1%
29
-1%
Idle Maximum *
28.8
30.9
-7%
29.2
-1%
29.2
-1%
33.1
-15%
29.1
-1%
29
-1%
Load Average *
34.7
33.1
5%
32.5
6%
32.1
7%
36.2
-4%
32.3
7%
34.2
1%
Load Maximum *
36.1
37.3
-3%
37.2
-3%
36.8
-2%
37.8
-5%
36.6
-1%
37.8
-5%

* ... kleiner is beter

Stress test Prime95 + FurMark
Stress test only FurMark
Stress test only Prime95
Max. Belasting
 37.5 °C40.1 °C28.8 °C 
 35.8 °C35.8 °C27.4 °C 
 30.7 °C27.7 °C27 °C 
Maximum: 40.1 °C
Gemiddelde: 32.3 °C
28.7 °C41 °C41.8 °C
27.4 °C39.4 °C39.4 °C
27.3 °C26.8 °C33 °C
Maximum: 41.8 °C
Gemiddelde: 33.9 °C
Stroomadapter (max.)  38.8 °C | Kamertemperatuur 22.2 °C | Fluke 62 Max
(±) De gemiddelde temperatuur voor de bovenzijde bij maximale belasting bedraagt 32.3 °C / 90 F, vergeleken met het gemiddelde van 29.5 °C / ###class_avg_f## F voor de apparaten van de klasse Office.
(±) De maximumtemperatuur aan de bovenzijde bedraagt 40.1 °C / 104 F, vergeleken met het gemiddelde van 34.2 °C / 94 F, variërend van 21.2 tot 62.5 °C voor de klasse Office.
(±) De bodem warmt op tot een maximum van 41.8 °C / 107 F, vergeleken met een gemiddelde van 36.7 °C / 98 F
(+) Bij onbelast gebruik bedraagt de gemiddelde temperatuur voor de bovenzijde 28.8 °C / 84 F, vergeleken met het apparaatgemiddelde van 29.5 °C / 85 F.
(+) De palmsteunen en het touchpad zijn met een maximum van ###max## °C / 87.3 F koeler dan de huidtemperatuur en voelen daarom koel aan.
(-) De gemiddelde temperatuur van de handpalmsteun van soortgelijke toestellen bedroeg 27.7 °C / 81.9 F (-3 °C / -5.4 F).
Asus ASUSPRO Advanced B8430UA-FA0084E
HD Graphics 520, 6200U, Hynix HFS256G39MND
Asus ASUSPRO Advanced BU401LA-CZ020G
HD Graphics 5000, 4650U, Liteonit LCS-256M6S
Lenovo ThinkPad L460-20FVS01400
Radeon R5 M330, 6500U, Toshiba HG6 THNSFJ256GCSU
Dell Latitude 14 E5470
HD Graphics 520, 6300U, Liteon L8H-256V2G
HP EliteBook 840 G3 T9X59ET#ABD
HD Graphics 520, 6500U, Samsung SSD PM851 256 GB MZNTE256HMHP
Lenovo ThinkPad T460s-20F9003SGE
HD Graphics 520, 6200U, Samsung CM871 MZ7LF192HCGS
Lenovo ThinkPad T460-20FN003LGE
HD Graphics 520, 6200U, Toshiba HG6 THNSFJ256GCSU
Power Consumption
4%
-4%
15%
6%
6%
6%
Idle Minimum *
4.2
4.1
2%
3.1
26%
3.5
17%
3.8
10%
3.7
12%
3.5
17%
Idle Average *
6.5
7.1
-9%
6.3
3%
5.3
18%
6.3
3%
6.8
-5%
6.7
-3%
Idle Maximum *
7.2
7.3
-1%
7.9
-10%
6
17%
6.8
6%
7.3
-1%
7.3
-1%
Load Average *
29.2
28.9
1%
29.5
-1%
26.3
10%
34.4
-18%
26.3
10%
28.2
3%
Load Maximum *
41
29.3
29%
57.3
-40%
36.6
11%
28.3
31%
34.6
16%
34.6
16%

* ... kleiner is beter

Stroomgebruik
Uit / Standbydarklight 0.35 / 0.65 Watt
Inactiefdarkmidlight 4.2 / 6.5 / 7.2 Watt
Belasting midlight 29.2 / 41 Watt
 color bar
Key: min: dark, med: mid, max: light        Metrahit Energy
Currently we use the Metrahit Energy, a professional single phase power quality and energy measurement digital multimeter, for our measurements. Find out more about it here. All of our test methods can be found here.
Asus ASUSPRO Advanced B8430UA-FA0084E
48 Wh
Asus ASUSPRO Advanced BU401LA-CZ020G
53 Wh
Lenovo ThinkPad L460-20FVS01400
48 Wh
Dell Latitude 14 E5470
62 Wh
HP EliteBook 840 G3 T9X59ET#ABD
46 Wh
Lenovo ThinkPad T460s-20F9003SGE
49 Wh
Lenovo ThinkPad T460-20FN003LGE
46 Wh
Batterijduur
-7%
22%
75%
29%
23%
15%
Reader / Idle
716
699
-2%
1153
61%
1304
82%
1020
42%
915
28%
953
33%
H.264
336
296
-12%
431
28%
645
92%
534
59%
512
52%
WiFi v1.3
344
425
24%
667
94%
453
32%
395
15%
338
-2%
Load
129
120
-7%
97
-25%
172
33%
146
13%
116
-10%
98
-24%
WiFi
310
Batterijduur
Inactief (zonder WLAN, minimale helderheid)
11h 56min
WiFi Websurfing (EDGE: 25.10586.0.0)
5h 44min
Big Buck Bunny H.264 1080p
5h 36min
Belast (maximale helderheid)
2h 9min

Pro

+ goede systeemprestaties
+ laag gewicht
+ goede invoerapparaten
+ Trackpoint beschikbaar
+ veel beveiligingsfunctionaliteiten
+ erg stil
+ SSD
+ onderhoudsklep
+ 24 maanden garantie
+ aantrekkelijk geprijsd

Contra

- slechts gemiddeld beeldscherm (lage belichting, laag kleurbereik)
- matige luidspreker kwaliteit
- slechte webcam
- geen HDMI-poort
- SSD niet praktisch gepartitioneerd
In review: AsusPro Advanced B8430UA. Test model courtesy of Notebooksbilliger.

Voor het volledige, Engelse testrapport, klik hier.

De AsusPro Advanced B8430UA is een goede en stevige 14-inch zakelijke notebook. Dankzij de moderne componenten zijn de prestaties aanmerkelijk toegenomen ten opzichte van zijn voorganger. Het lage gewicht verzekerd een fatsoenlijke mobiliteit en de prijs van minder dan 1.000 EUR (~$1128) is zeker aantrekkelijk. De goede prestaties zijn een belangrijke eigenschap wanneer je zoekt naar een apparaat voor dagelijks gebruik en de SSD draagt veel bij hieraan doordat het een groot effect heeft op de subjectieve indruk van de systeemprestaties.

De stevige en ingetogen behuizing bevat een gebalanceerde configuratie van componenten - allemaal voor een aantrekkelijke prijs onder 1.000 EUR (~$1128).

We zijn een beetje teleurgesteld in het beeldscherm. Deze weet ondanks de TN-technologie fatsoenlijke kijkhoeken te bieden, maar kan onze verwachtingen qua belichting niet waarmaken. De kleine stereo luidsprekers kunnen ons ook niet overtuigen. De prestaties van het testmodel zijn niet voldoende voor moderne 3D games, maar dat is geen noodzaak voor de doelgroep. Als gamen wel een vereiste is zul je een notebook met een aparte GPU moeten aanschaffen. We vinden de invoerapparaten erg prettig, wat cruciaal is voor een zakelijk notebook, net als de goede batterijlevensduur. De AsusPro Advanced is een waardige opvolger van de AsusPro Advanced BU401LA.

Asus ASUSPRO Advanced B8430UA-FA0084E - 03-07-2016 v5.1(old)
Sebastian Bade
Behuizing
91 / 98 → 93%
Toetsenbord
93%
Aanwijsapparaat
92%
Aansluitmogelijkheden
61 / 80 → 77%
Gewicht
68 / 20-67 → 100%
Batterij
85%
Beeldscherm
76%
Gaming-performance
55 / 68 → 81%
Applicatie-performance
81 / 92 → 88%
Temperatuur
91%
Luidheid
95%
Audio
55%
Camera
48 / 85 → 56%
Gemiddelde
76%
87%
Office - Gewogen Gemiddelde
Pricecompare

Please share our article, every link counts!
> Overzichten en testrapporten over laptops en mobieltjes > Testrapporten > Kort testrapport Asus ASUSPRO Advanced B8430UA-FA0084E Notebook
Sebastian Bade, 2016-06-26 (Update: 2016-07-23)