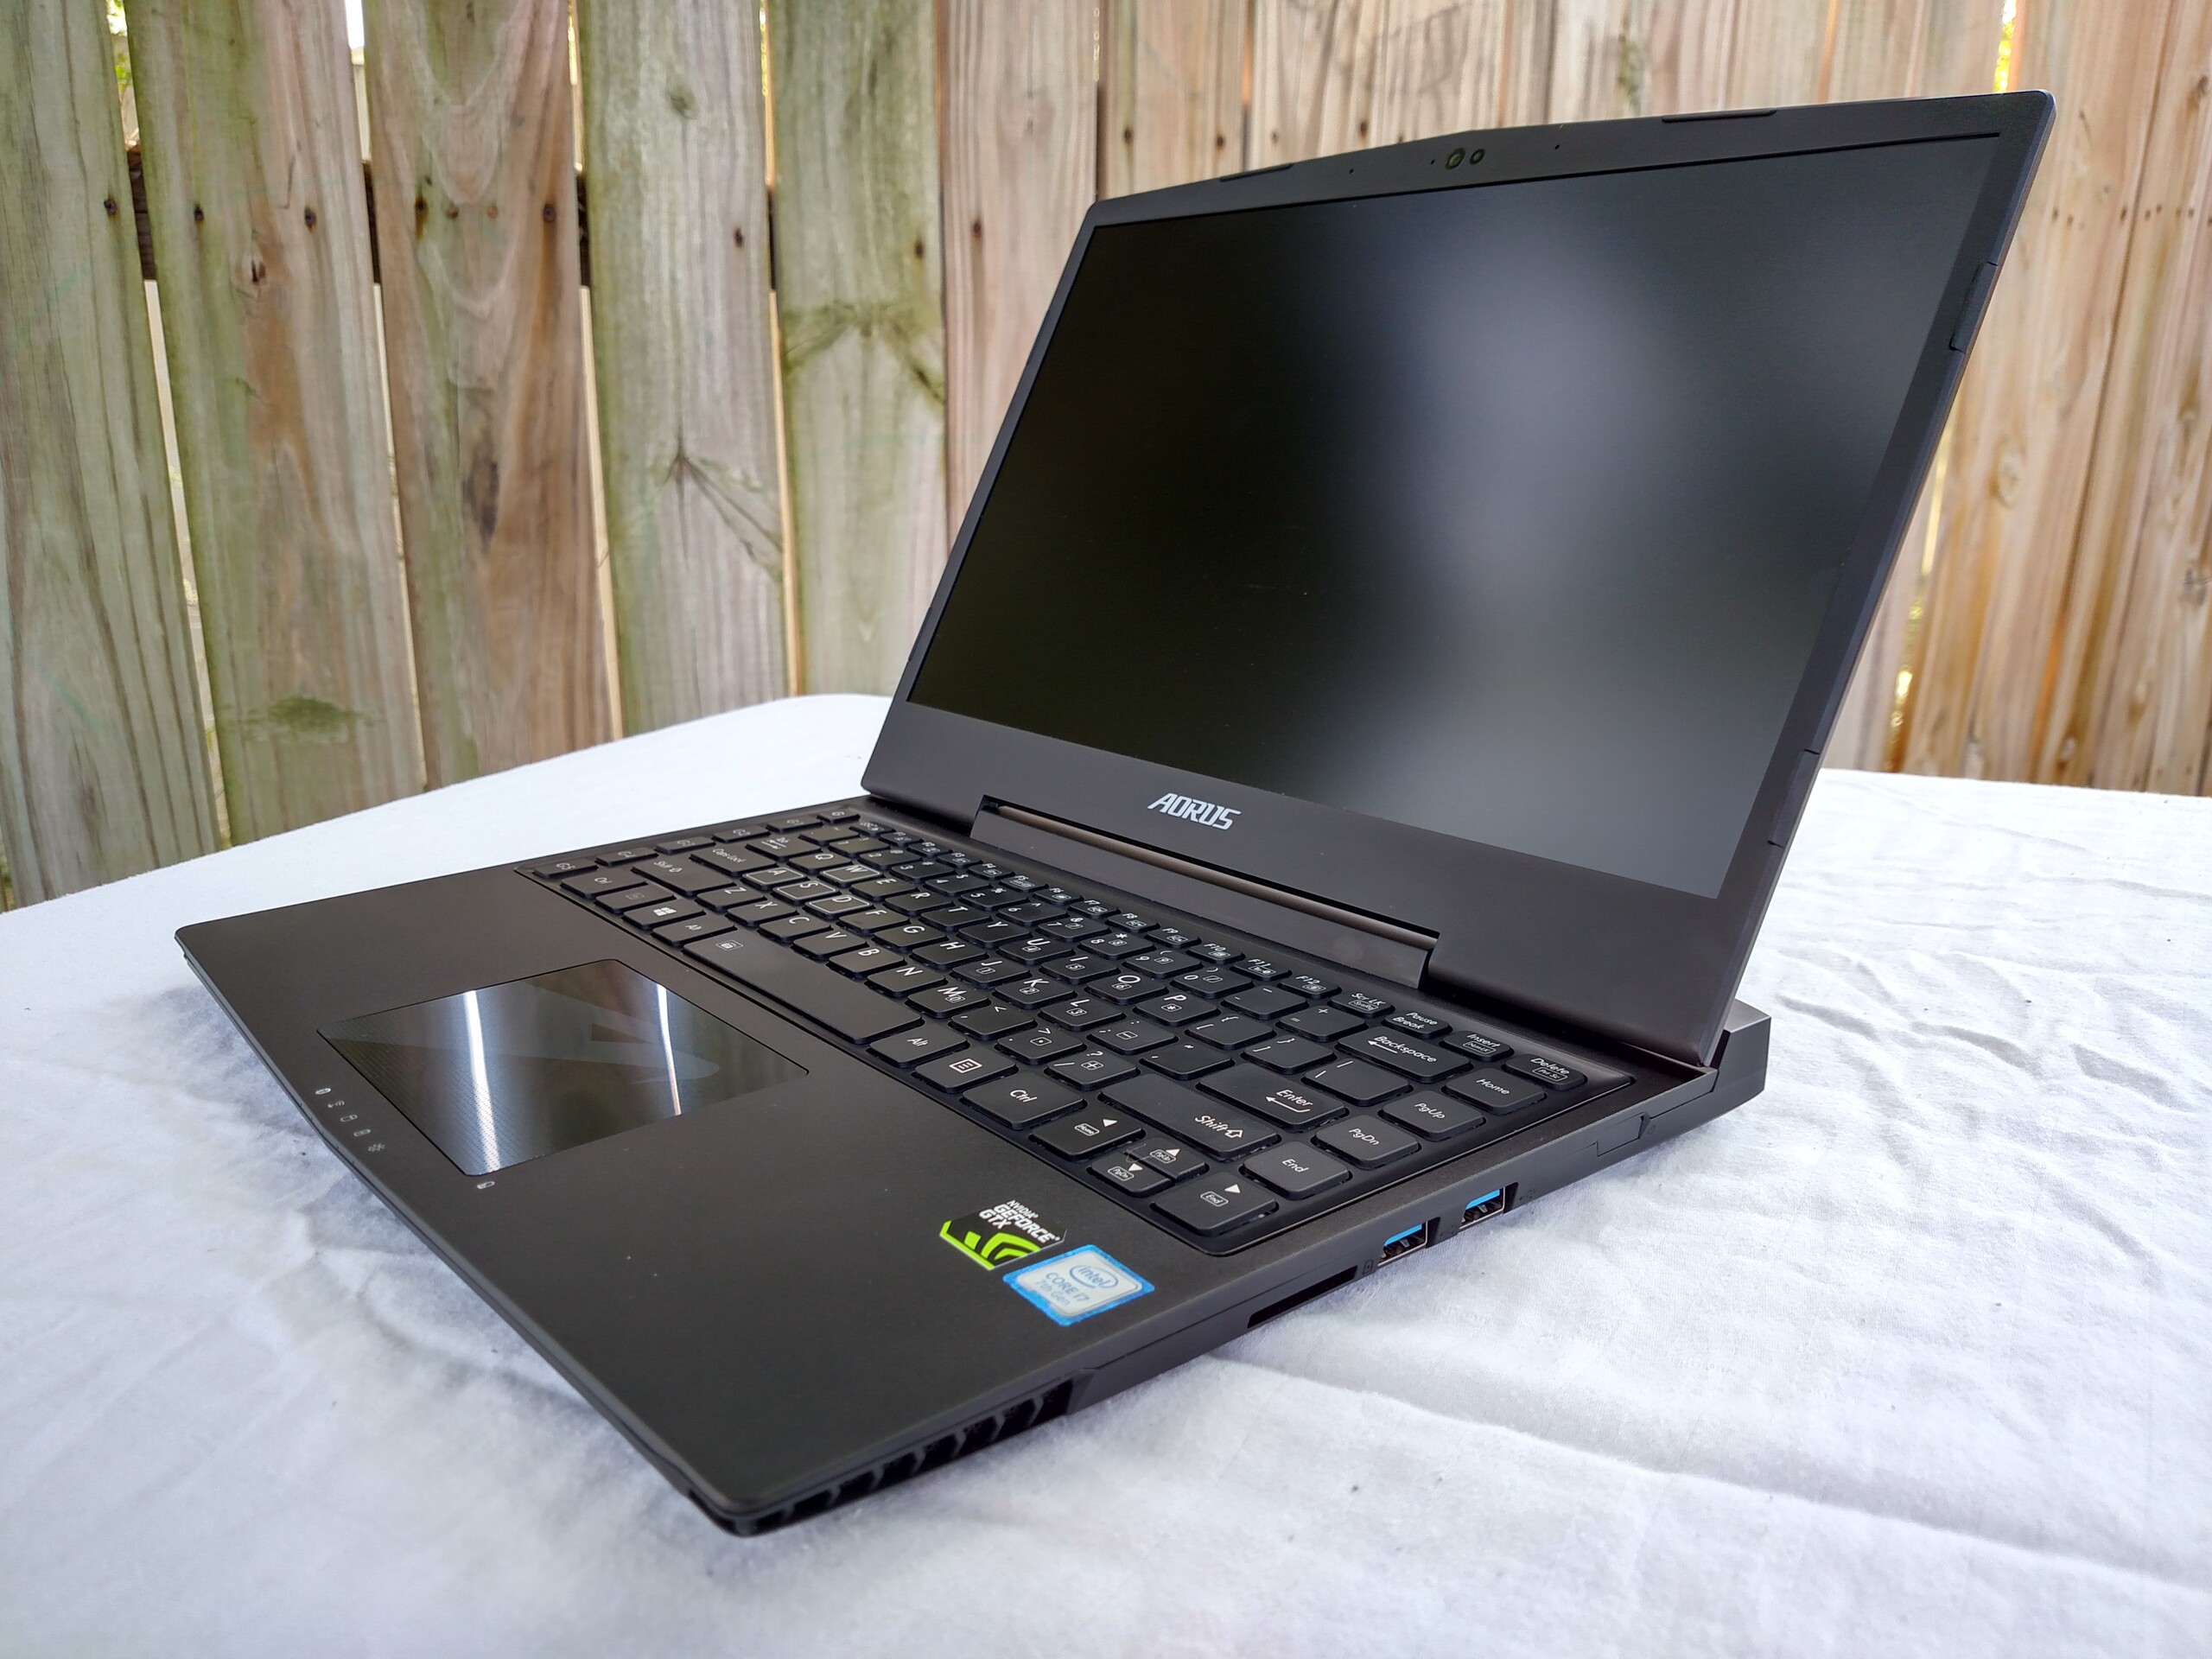
Kort testrapport Aorus X3 Plus v7 (i7-7820HK, GTX 1060) Xotic PC Edition Laptop

| SD Card Reader | |
| average JPG Copy Test (av. of 3 runs) | |
| Eurocom Tornado F5 | |
| Aorus x3 Plus v7 | |
| Gigabyte Aero 15 | |
| Gigabyte Aero 14 | |
| MSI GS63VR 7RF-228US | |
| maximum AS SSD Seq Read Test (1GB) | |
| Eurocom Tornado F5 | |
| Aorus x3 Plus v7 | |
| Gigabyte Aero 15 | |
| Gigabyte Aero 14 | |
| MSI GS63VR 7RF-228US | |
| Networking | |
| iperf3 transmit AX12 | |
| MSI GS63VR 7RF-228US | |
| Alienware 13 R3 | |
| Eurocom Tornado F5 | |
| Gigabyte Aero 14 | |
| Aorus x3 Plus v7 | |
| Gigabyte Aero 15 | |
| iperf3 receive AX12 | |
| Gigabyte Aero 14 | |
| Gigabyte Aero 15 | |
| Alienware 13 R3 | |
| MSI GS63VR 7RF-228US | |
| Aorus x3 Plus v7 | |
| Eurocom Tornado F5 | |
| |||||||||||||||||||||||||
Helderheidsverdeling: 73 %
Helderheid in Batterij-modus: 348 cd/m²
Contrast: 1200:1 (Zwart: 0.29 cd/m²)
ΔE ColorChecker Calman: 2.4 | ∀{0.5-29.43 Ø4.71}
ΔE Greyscale Calman: 2.3 | ∀{0.09-98 Ø4.96}
96% sRGB (Argyll 1.6.3 3D)
62% AdobeRGB 1998 (Argyll 1.6.3 3D)
67.5% AdobeRGB 1998 (Argyll 3D)
96.5% sRGB (Argyll 3D)
66.1% Display P3 (Argyll 3D)
Gamma: 2.21
CCT: 6206 K
| Aorus x3 Plus v7 Sharp SHP1401, IGZO TFT, 13.9", 3200x1800 | Alienware 13 R3 JJT6C_133KL05 (SDCA029), OLED, 13.3", 2560x1440 | Gigabyte Aero 14 LG Philips LP140QH1-SPF1 (LGD049A), IPS, 14", 2560x1440 | Razer Blade (2017) LP140WF3-SPD1, IPS, 14", 1920x1080 | Gigabyte Aero 15 N156HCA-EA1 (CMN15D7), IPS, 15.6", 1920x1080 | Eurocom Tornado F5 IPS, 15.6", 1920x1080 | MSI GS63VR 7RF-228US IPS, 15.6", 3840x2160 | Aorus X5 v6 AO-S107W516-PL-002 Panasonic MEI96A2 / VVX16T028J00, , 15.6", 2880x1620 | |
|---|---|---|---|---|---|---|---|---|
| Display | -4% | -2% | -9% | -26% | 5% | |||
| Display P3 Coverage (%) | 66.1 | 64.4 -3% | 65.2 -1% | 64.5 -2% | 48.21 -27% | 71.7 8% | ||
| sRGB Coverage (%) | 96.5 | 91.8 -5% | 92.5 -4% | 83 -14% | 72.6 -25% | 97.6 1% | ||
| AdobeRGB 1998 Coverage (%) | 67.5 | 65.5 -3% | 66.5 -1% | 60.7 -10% | 49.81 -26% | 72.1 7% | ||
| Response Times | 89% | -5% | 16% | -22% | -8% | 15% | ||
| Response Time Grey 50% / Grey 80% * (ms) | 38 ? | 41 ? -8% | 25.2 ? 34% | 42.8 ? -13% | 33.6 ? 12% | 28 ? 26% | ||
| Response Time Black / White * (ms) | 24.4 ? | 2.8 ? 89% | 25 ? -2% | 24.8 ? -2% | 32 ? -31% | 31.2 ? -28% | 23.6 ? 3% | |
| PWM Frequency (Hz) | 201.6 ? | 240 ? | 21370 | 26000 ? | 1351 ? | |||
| Screen | 10% | -32% | -30% | -40% | -35% | -89% | -15% | |
| Brightness middle (cd/m²) | 348 | 313 -10% | 290 -17% | 272 -22% | 320 -8% | 315.8 -9% | 274.2 -21% | 350 1% |
| Brightness (cd/m²) | 359 | 310 -14% | 257 -28% | 277 -23% | 316 -12% | 310 -14% | 263 -27% | 296 -18% |
| Brightness Distribution (%) | 73 | 87 19% | 79 8% | 84 15% | 90 23% | 90 23% | 92 26% | 79 8% |
| Black Level * (cd/m²) | 0.29 | 0.3 -3% | 0.26 10% | 0.36 -24% | 0.33 -14% | 0.44 -52% | 0.4 -38% | |
| Contrast (:1) | 1200 | 967 -19% | 1046 -13% | 889 -26% | 957 -20% | 623 -48% | 875 -27% | |
| Colorchecker dE 2000 * | 2.4 | 2.54 -6% | 4.59 -91% | 4.59 -91% | 4.62 -93% | 5 -108% | 8 -233% | |
| Colorchecker dE 2000 max. * | 5.1 | 3.94 23% | 8.68 -70% | 8.49 -66% | 9.75 -91% | 10.1 -98% | 14.6 -186% | |
| Greyscale dE 2000 * | 2.3 | 1.43 38% | 4.32 -88% | 4.28 -86% | 6 -161% | 4.2 -83% | 9.1 -296% | |
| Gamma | 2.21 100% | 2.3 96% | 2.25 98% | 2.23 99% | 2.46 89% | 2.12 104% | 2.24 98% | |
| CCT | 6206 105% | 6337 103% | 7320 89% | 6848 95% | 6761 96% | 6107 106% | 5020 129% | |
| Color Space (Percent of AdobeRGB 1998) (%) | 62 | 78 26% | 59 -5% | 55 -11% | 60 -3% | 54.5 -12% | 45.7 -26% | |
| Color Space (Percent of sRGB) (%) | 96 | 97 1% | 92 -4% | 83 -14% | 92 -4% | 83 -14% | 72.1 -25% | |
| Totaal Gemiddelde (Programma / Instellingen) | 50% /
18% | -14% /
-23% | -7% /
-22% | -21% /
-30% | -17% /
-26% | -33% /
-62% | -5% /
-7% |
* ... kleiner is beter
Responstijd Scherm
| ↔ Responstijd Zwart naar Wit | ||
|---|---|---|
| 24.4 ms ... stijging ↗ en daling ↘ gecombineerd | ↗ 11.2 ms stijging | 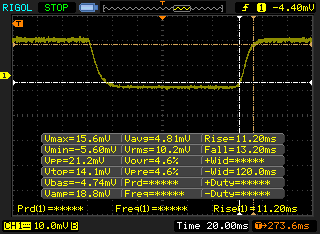 |
| ↘ 13.2 ms daling | ||
| Het scherm vertoonde prima responstijden in onze tests maar is misschien wat te traag voor competitieve games. Ter vergelijking: alle testtoestellen variëren van 0.1 (minimum) tot 240 (maximum) ms. » 58 % van alle toestellen zijn beter. Dit betekent dat de gemeten responstijd slechter is dan het gemiddelde (19.8 ms) van alle geteste toestellen. | ||
| ↔ Responstijd 50% Grijs naar 80% Grijs | ||
| 38 ms ... stijging ↗ en daling ↘ gecombineerd | ↗ 19.6 ms stijging | 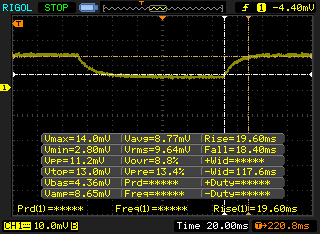 |
| ↘ 18.4 ms daling | ||
| Het scherm vertoonde trage responstijden in onze tests en is misschien te traag voor games. Ter vergelijking: alle testtoestellen variëren van 0.165 (minimum) tot 636 (maximum) ms. » 55 % van alle toestellen zijn beter. Dit betekent dat de gemeten responstijd slechter is dan het gemiddelde (31 ms) van alle geteste toestellen. | ||
Screen Flickering / PWM (Pulse-Width Modulation)
| Screen flickering / PWM waargenomen | 201.6 Hz | ≤ 50 % helderheid instelling | 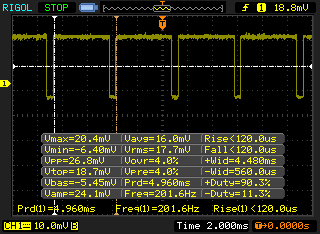 |
De achtergrondverlichting van het scherm flikkert op 201.6 Hz (in het slechtste geval, bijvoorbeeld bij gebruik van PWM) aan een helderheid van 50 % en lager. Boven deze helderheid zou er geen flickering / PWM mogen optreden. De frequentie van 201.6 Hz is redelijk laag en de meeste mensen die gevoelig zijn aan flickering kunnen dit dus waarnemen of geïrriteerde ogen krijgen (gebruikmakend van de vermelde helderheid en lager). Ter vergelijking: 52 % van alle geteste toestellen maakten geen gebruik van PWM om de schermhelderheid te verlagen. Als het wel werd gebruikt, werd een gemiddelde van 7757 (minimum: 5 - maximum: 343500) Hz waargenomen. | |||
| Cinebench R15 | |
| CPU Single 64Bit | |
| Eurocom Tornado F5 | |
| Aorus x3 Plus v7 | |
| Aorus X5 v6 AO-S107W516-PL-002 | |
| MSI GS63VR 7RF-228US | |
| Gigabyte Aero 15 | |
| Alienware 13 R3 | |
| Gigabyte Aero 14 | |
| Razer Blade (2017) | |
| CPU Multi 64Bit | |
| Eurocom Tornado F5 | |
| Aorus x3 Plus v7 | |
| Aorus X5 v6 AO-S107W516-PL-002 | |
| MSI GS63VR 7RF-228US | |
| Gigabyte Aero 15 | |
| Alienware 13 R3 | |
| Gigabyte Aero 14 | |
| Razer Blade (2017) | |
| Cinebench R11.5 | |
| CPU Single 64Bit | |
| Eurocom Tornado F5 | |
| Aorus x3 Plus v7 | |
| Gigabyte Aero 15 | |
| Alienware 13 R3 | |
| MSI GS63VR 7RF-228US | |
| CPU Multi 64Bit | |
| Eurocom Tornado F5 | |
| Aorus x3 Plus v7 | |
| Gigabyte Aero 15 | |
| MSI GS63VR 7RF-228US | |
| Alienware 13 R3 | |
| Cinebench R10 | |
| Rendering Multiple CPUs 32Bit | |
| Aorus x3 Plus v7 | |
| Eurocom Tornado F5 | |
| MSI GS63VR 7RF-228US | |
| Rendering Single 32Bit | |
| Aorus x3 Plus v7 | |
| Eurocom Tornado F5 | |
| MSI GS63VR 7RF-228US | |
| wPrime 2.10 - 1024m | |
| Aorus x3 Plus v7 | |
| MSI GS63VR 7RF-228US | |
| Aorus X5 v6 AO-S107W516-PL-002 | |
| Eurocom Tornado F5 | |
* ... kleiner is beter
| PCMark 8 | |
| Home Score Accelerated v2 | |
| Eurocom Tornado F5 | |
| Gigabyte Aero 15 | |
| MSI GS63VR 7RF-228US | |
| Razer Blade (2017) | |
| Alienware 13 R3 | |
| Gigabyte Aero 14 | |
| Aorus x3 Plus v7 | |
| Work Score Accelerated v2 | |
| Eurocom Tornado F5 | |
| Gigabyte Aero 15 | |
| MSI GS63VR 7RF-228US | |
| Razer Blade (2017) | |
| Alienware 13 R3 | |
| Gigabyte Aero 14 | |
| Aorus x3 Plus v7 | |
| Creative Score Accelerated v2 | |
| Eurocom Tornado F5 | |
| MSI GS63VR 7RF-228US | |
| Alienware 13 R3 | |
| Aorus x3 Plus v7 | |
| PCMark 7 Score | 5966 punten | |
| PCMark 8 Home Score Accelerated v2 | 3266 punten | |
| PCMark 8 Creative Score Accelerated v2 | 4278 punten | |
| PCMark 8 Work Score Accelerated v2 | 4605 punten | |
Help | ||
| Aorus x3 Plus v7 Toshiba NVMe THNSN5512GPU7 | Alienware 13 R3 Toshiba NVMe THNSN5256GPUK | Gigabyte Aero 14 LiteOn CX2-8B256 | Razer Blade (2017) Samsung PM951 NVMe MZVLV256 | Gigabyte Aero 15 Lite-On CX2-8B512-Q11 | Eurocom Tornado F5 Samsung SSD 960 Pro 512 GB m.2 | MSI GS63VR 7RF-228US Samsung SM961 MZVKW512HMJP m.2 PCI-e | Aorus X5 v6 AO-S107W516-PL-002 LiteOn CX2-8B256 | |
|---|---|---|---|---|---|---|---|---|
| CrystalDiskMark 3.0 | -23% | -14% | -38% | -6% | 12% | 7% | -12% | |
| Read Seq (MB/s) | 1498 | 1373 -8% | 1584 6% | 1122 -25% | 1769 18% | 2145 43% | 2141 43% | 1605 7% |
| Write Seq (MB/s) | 1324 | 789 -40% | 795 -40% | 311 -77% | 1133 -14% | 1724 30% | 1621 22% | 767 -42% |
| Read 512 (MB/s) | 966 | 1070 11% | 985 2% | 682 -29% | 891 -8% | 715 -26% | 499.7 -48% | 952 -1% |
| Write 512 (MB/s) | 1221 | 405.6 -67% | 814 -33% | 310 -75% | 1069 -12% | 967 -21% | 1531 25% | 724 -41% |
| Read 4k (MB/s) | 44.8 | 37.65 -16% | 44.93 0% | 34.8 -22% | 44.7 0% | 55.9 25% | 54.2 21% | 46.13 3% |
| Write 4k (MB/s) | 156 | 140.2 -10% | 131.2 -16% | 134.3 -14% | 123.3 -21% | 180.6 16% | 158.2 1% | 143.2 -8% |
| Read 4k QD32 (MB/s) | 700 | 593 -15% | 602 -14% | 565 -19% | 645 -8% | 744 6% | 632 -10% | 644 -8% |
| Write 4k QD32 (MB/s) | 517 | 311.2 -40% | 441 -15% | 308 -40% | 490.5 -5% | 634 23% | 527 2% | 486.2 -6% |

| 3DMark | |
| 1280x720 Cloud Gate Standard Graphics | |
| Eurocom Tornado F5 | |
| Aorus X5 v6 AO-S107W516-PL-002 | |
| Gigabyte Aero 15 | |
| Alienware 13 R3 | |
| Aorus x3 Plus v7 | |
| Gigabyte Aero 14 | |
| MSI GS63VR 7RF-228US | |
| 1920x1080 Fire Strike Graphics | |
| Aorus X5 v6 AO-S107W516-PL-002 | |
| Eurocom Tornado F5 | |
| Aorus x3 Plus v7 | |
| Gigabyte Aero 14 | |
| Alienware 13 R3 | |
| MSI GS63VR 7RF-228US | |
| Gigabyte Aero 15 | |
| Razer Blade (2017) | |
| 3DMark Ice Storm Standard Score | 33625 punten | |
| 3DMark Cloud Gate Standard Score | 20785 punten | |
| 3DMark Fire Strike Score | 10361 punten | |
| 3DMark Fire Strike Extreme Score | 5532 punten | |
Help | ||
| BioShock Infinite - 1920x1080 Ultra Preset, DX11 (DDOF) (sorteer op waarde) | |
| Aorus x3 Plus v7 | |
| Eurocom Tornado F5 | |
| MSI GS63VR 7RF-228US | |
| Aorus X5 v6 AO-S107W516-PL-002 | |
| Metro: Last Light - 1920x1080 Very High (DX11) AF:16x (sorteer op waarde) | |
| Aorus x3 Plus v7 | |
| Eurocom Tornado F5 | |
| MSI GS63VR 7RF-228US | |
| Thief - 1920x1080 Very High Preset AA:FXAA & High SS AF:8x (sorteer op waarde) | |
| Aorus x3 Plus v7 | |
| MSI GS63VR 7RF-228US | |
| Aorus X5 v6 AO-S107W516-PL-002 | |
| The Witcher 3 - 1920x1080 Ultra Graphics & Postprocessing (HBAO+) (sorteer op waarde) | |
| Aorus x3 Plus v7 | |
| Gigabyte Aero 14 | |
| Razer Blade (2017) | |
| Gigabyte Aero 15 | |
| MSI GS63VR 7RF-228US | |
| Aorus X5 v6 AO-S107W516-PL-002 | |
| Rise of the Tomb Raider - 1920x1080 Very High Preset AA:FX AF:16x (sorteer op waarde) | |
| Aorus x3 Plus v7 | |
| Razer Blade (2017) | |
| Eurocom Tornado F5 | |
| MSI GS63VR 7RF-228US | |
| Ashes of the Singularity - 1920x1080 high (sorteer op waarde) | |
| Aorus x3 Plus v7 | |
| Eurocom Tornado F5 | |
| Doom - 1920x1080 Ultra Preset AA:SM (sorteer op waarde) | |
| Aorus x3 Plus v7 | |
| Eurocom Tornado F5 | |
| MSI GS63VR 7RF-228US | |
| Fallout 4 - 1920x1080 Ultra Preset AA:T AF:16x (sorteer op waarde) | |
| Aorus x3 Plus v7 | |
| Eurocom Tornado F5 | |
| MSI GS63VR 7RF-228US | |
| lage | gem. | hoge | ultra | |
|---|---|---|---|---|
| BioShock Infinite (2013) | 109 | |||
| Metro: Last Light (2013) | 82 | |||
| Thief (2014) | 42 | |||
| The Witcher 3 (2015) | 40 | |||
| Fallout 4 (2015) | 77 | |||
| Rise of the Tomb Raider (2016) | 65 | |||
| Ashes of the Singularity (2016) | 50 | |||
| Doom (2016) | 97 | |||
| Mafia 3 (2016) | 45 |
Geluidsniveau
| Onbelast |
| 31.4 / 37 / 40.8 dB (A) |
| Belasting |
| 50 / 53.6 dB (A) |
 | ||
30 dB stil 40 dB(A) hoorbaar 50 dB(A) luid |
||
min: | ||
| Aorus x3 Plus v7 GeForce GTX 1060 Mobile, i7-7820HK, Toshiba NVMe THNSN5512GPU7 | Alienware 13 R3 GeForce GTX 1060 Mobile, i7-7700HQ, Toshiba NVMe THNSN5256GPUK | Gigabyte Aero 14 GeForce GTX 1060 Mobile, i7-7700HQ, LiteOn CX2-8B256 | Razer Blade (2017) GeForce GTX 1060 Mobile, i7-7700HQ, Samsung PM951 NVMe MZVLV256 | Gigabyte Aero 15 GeForce GTX 1060 Mobile, i7-7700HQ, Lite-On CX2-8B512-Q11 | Eurocom Tornado F5 GeForce GTX 1070 Mobile, i7-7700K, Samsung SSD 960 Pro 512 GB m.2 | MSI GS63VR 7RF-228US GeForce GTX 1060 Mobile, i7-7700HQ, Samsung SM961 MZVKW512HMJP m.2 PCI-e | Aorus X5 v6 AO-S107W516-PL-002 GeForce GTX 1070 Mobile, 6820HK, LiteOn CX2-8B256 | |
|---|---|---|---|---|---|---|---|---|
| Noise | 15% | 9% | 10% | 10% | 6% | 11% | 1% | |
| uit / omgeving * (dB) | 29.1 | 29 -0% | 31 -7% | 31 -7% | 29.4 -1% | 28.8 1% | ||
| Idle Minimum * (dB) | 31.4 | 29 8% | 31 1% | 30 4% | 32 -2% | 33.3 -6% | 33.1 -5% | 33.4 -6% |
| Idle Average * (dB) | 37 | 30 19% | 32 14% | 30 19% | 33 11% | 33.5 9% | 33.1 11% | 34.2 8% |
| Idle Maximum * (dB) | 40.8 | 31 24% | 33 19% | 30 26% | 34 17% | 33.5 18% | 34 17% | 35 14% |
| Load Average * (dB) | 50 | 36 28% | 42 16% | 51 -2% | 39 22% | 44.2 12% | 37.2 26% | 53.3 -7% |
| Witcher 3 ultra * (dB) | 53.6 | 45 16% | 43 20% | 46.1 14% | ||||
| Load Maximum * (dB) | 53.6 | 49 9% | 53 1% | 51 5% | 50 7% | 52.5 2% | 47.1 12% | 57 -6% |
* ... kleiner is beter
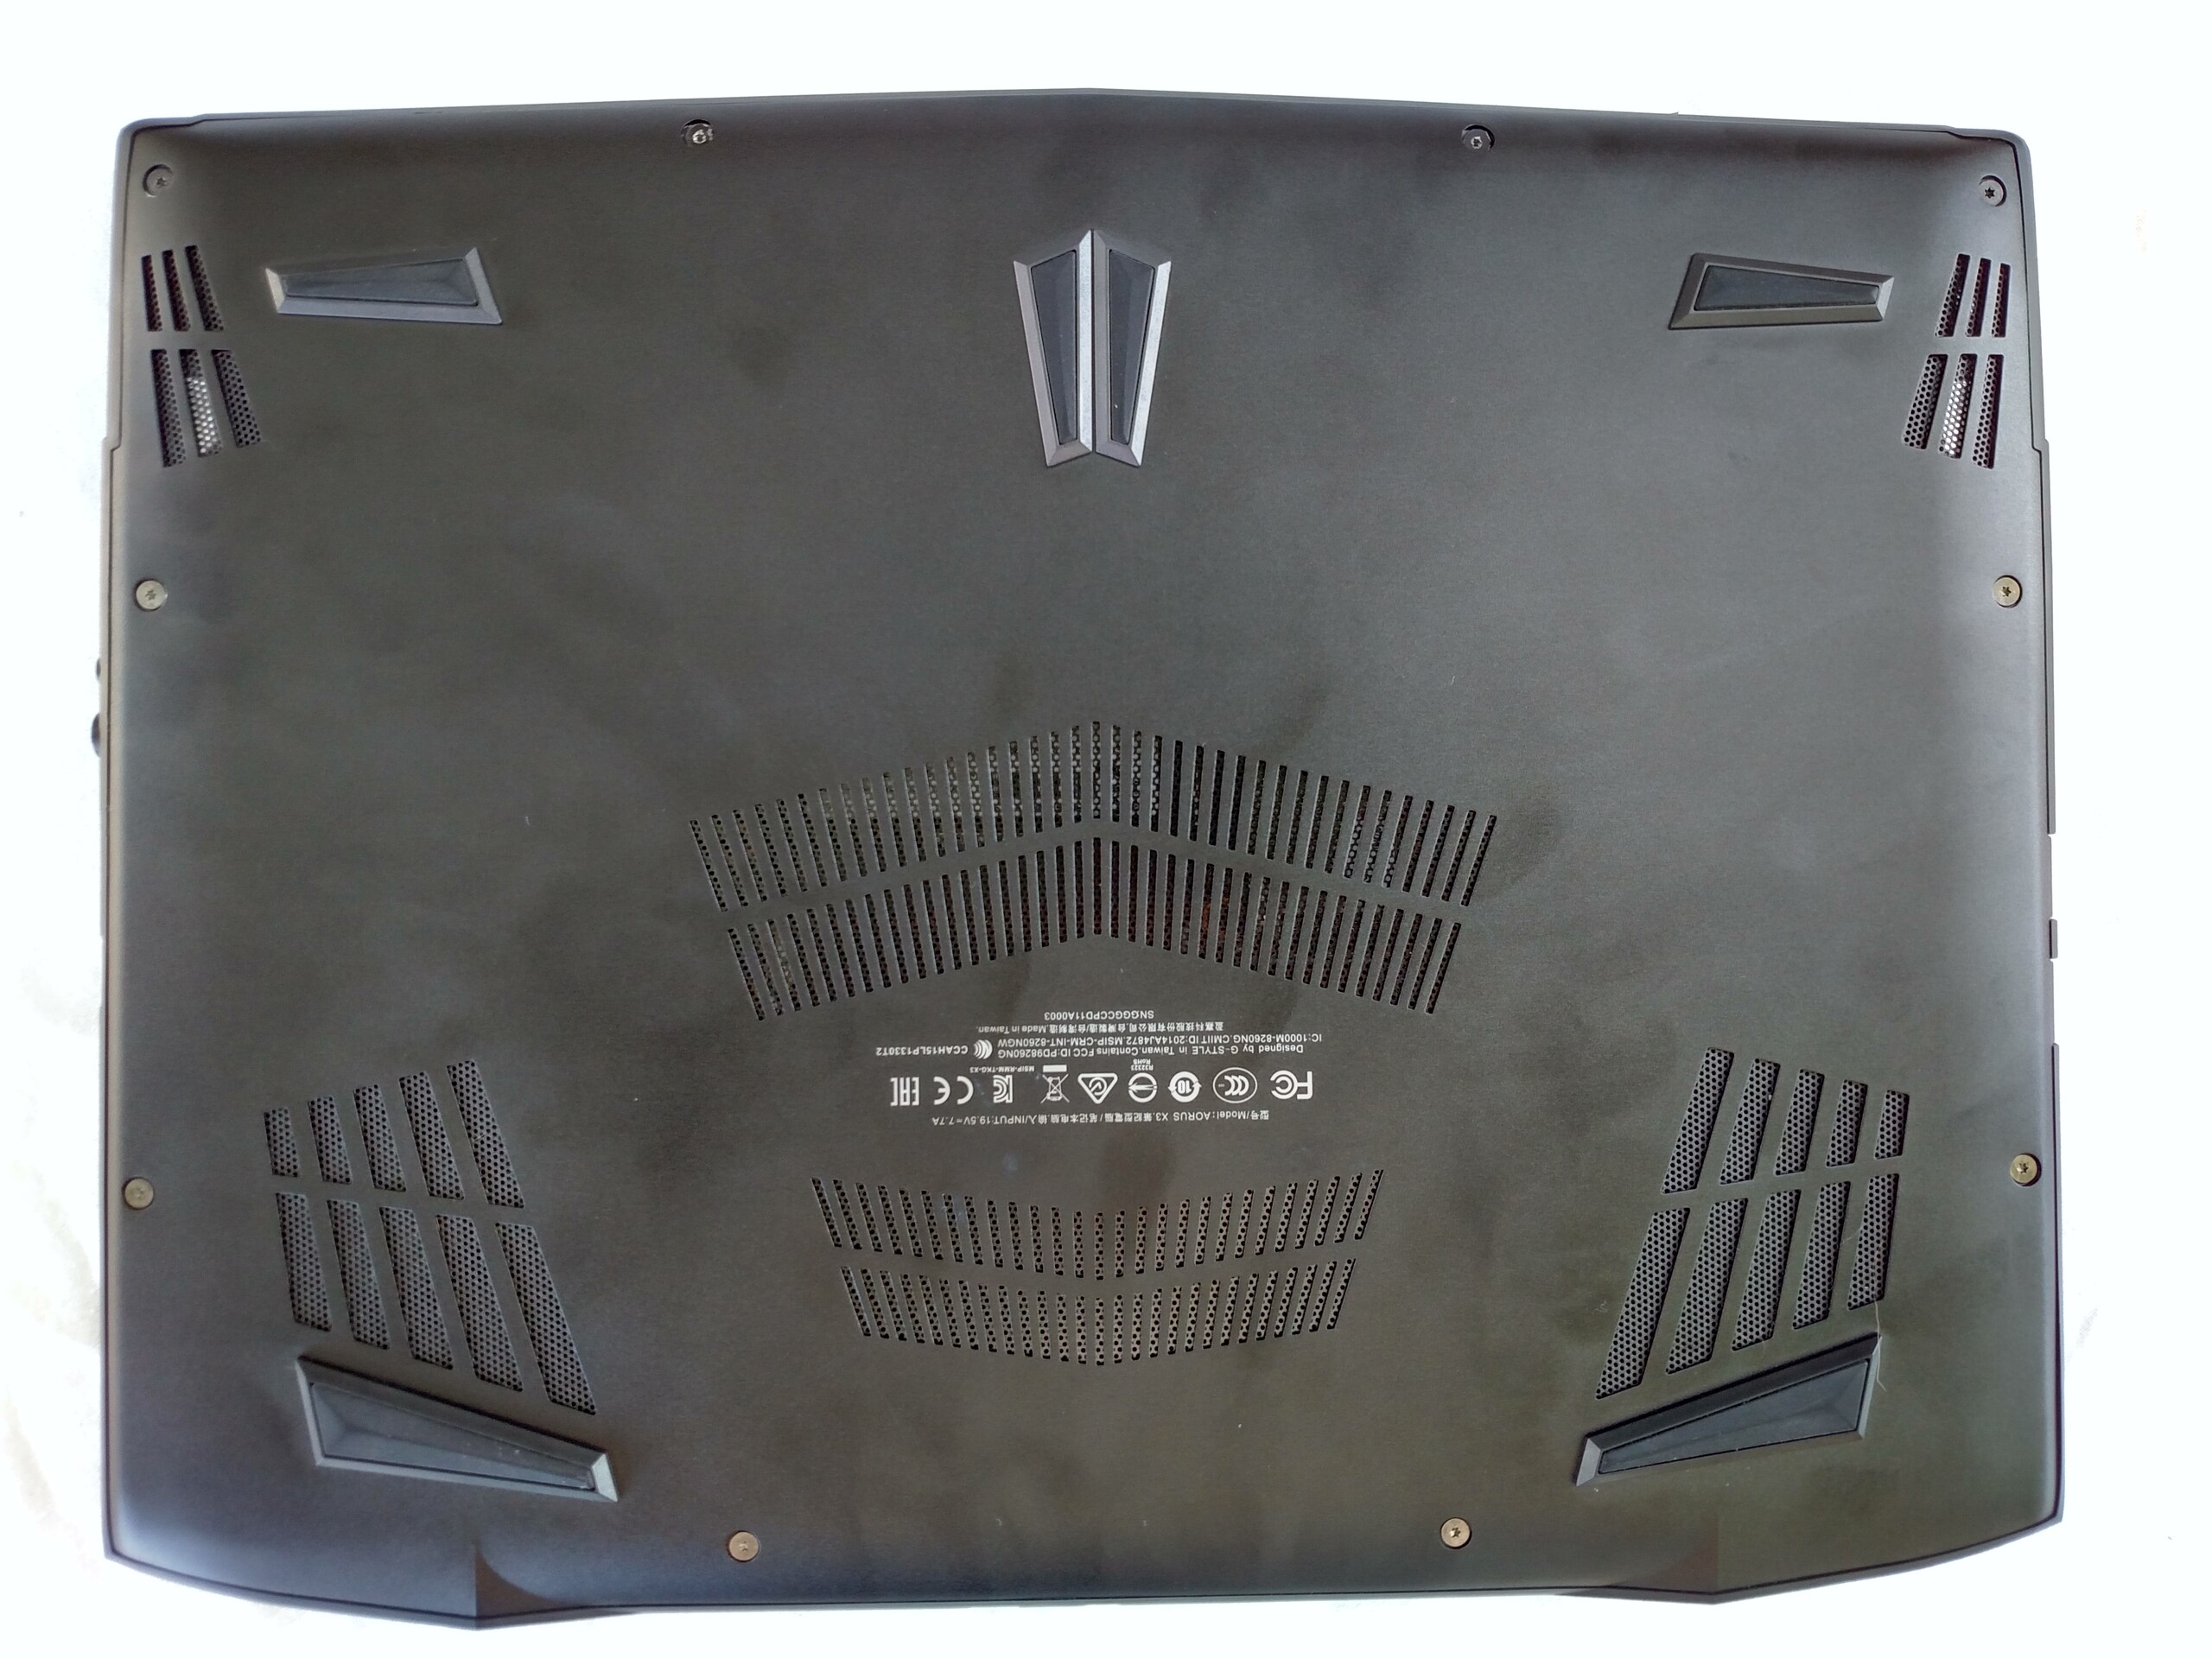
(-) De maximumtemperatuur aan de bovenzijde bedraagt 46.8 °C / 116 F, vergeleken met het gemiddelde van 40.4 °C / 105 F, variërend van 21.2 tot 68.8 °C voor de klasse Gaming.
(-) De bodem warmt op tot een maximum van 55.2 °C / 131 F, vergeleken met een gemiddelde van 43.2 °C / 110 F
(+) Bij onbelast gebruik bedraagt de gemiddelde temperatuur voor de bovenzijde 25 °C / 77 F, vergeleken met het apparaatgemiddelde van 33.9 °C / 93 F.
(±) Bij het spelen van The Witcher 3 is de gemiddelde temperatuur voor de bovenzijde 32.6 °C / 91 F, vergeleken met het apparaatgemiddelde van 33.9 °C / 93 F.
(+) De palmsteunen en het touchpad zijn met een maximum van ###max## °C / 80.6 F koeler dan de huidtemperatuur en voelen daarom koel aan.
(±) De gemiddelde temperatuur van de handpalmsteun van soortgelijke toestellen bedroeg 28.8 °C / 83.8 F (+1.8 °C / 3.2 F).
Aorus x3 Plus v7 audioanalyse
(±) | luidspreker luidheid is gemiddeld maar goed (72.5 dB)
Bas 100 - 315 Hz
(-) | bijna geen lage tonen - gemiddeld 18.4% lager dan de mediaan
(±) | lineariteit van de lage tonen is gemiddeld (12.6% delta ten opzichte van de vorige frequentie)
Midden 400 - 2000 Hz
(+) | evenwichtige middens - slechts 1.6% verwijderd van de mediaan
(±) | lineariteit van de middentonen is gemiddeld (7.1% delta ten opzichte van de vorige frequentie)
Hoog 2 - 16 kHz
(+) | evenwichtige hoogtepunten - slechts 4% verwijderd van de mediaan
(±) | lineariteit van de hoogtepunten is gemiddeld (8% delta ten opzichte van de vorige frequentie)
Algemeen 100 - 16.000 Hz
(±) | lineariteit van het totale geluid is gemiddeld (25.5% verschil met de mediaan)
Vergeleken met dezelfde klasse
» 91% van alle geteste apparaten in deze klasse waren beter, 2% vergelijkbaar, 7% slechter
» De beste had een delta van 6%, het gemiddelde was 18%, de slechtste was 132%
Vergeleken met alle geteste toestellen
» 78% van alle geteste apparaten waren beter, 4% gelijk, 17% slechter
» De beste had een delta van 4%, het gemiddelde was 23%, de slechtste was 134%
Alienware 13 R3 audioanalyse
(±) | luidspreker luidheid is gemiddeld maar goed (79 dB)
Bas 100 - 315 Hz
(±) | verminderde zeebaars - gemiddeld 14.8% lager dan de mediaan
(±) | lineariteit van de lage tonen is gemiddeld (10% delta ten opzichte van de vorige frequentie)
Midden 400 - 2000 Hz
(+) | evenwichtige middens - slechts 3.8% verwijderd van de mediaan
(+) | de middentonen zijn lineair (6.2% delta ten opzichte van de vorige frequentie)
Hoog 2 - 16 kHz
(+) | evenwichtige hoogtepunten - slechts 3.6% verwijderd van de mediaan
(+) | de hoge tonen zijn lineair (6.9% delta naar de vorige frequentie)
Algemeen 100 - 16.000 Hz
(±) | lineariteit van het totale geluid is gemiddeld (18.4% verschil met de mediaan)
Vergeleken met dezelfde klasse
» 59% van alle geteste apparaten in deze klasse waren beter, 9% vergelijkbaar, 32% slechter
» De beste had een delta van 6%, het gemiddelde was 18%, de slechtste was 132%
Vergeleken met alle geteste toestellen
» 41% van alle geteste apparaten waren beter, 8% gelijk, 51% slechter
» De beste had een delta van 4%, het gemiddelde was 23%, de slechtste was 134%
| Uit / Standby | |
| Inactief | |
| Belasting |
|
Key:
min: | |
| Aorus x3 Plus v7 i7-7820HK, GeForce GTX 1060 Mobile, Toshiba NVMe THNSN5512GPU7, IGZO TFT, 3200x1800, 13.9" | Alienware 13 R3 i7-7700HQ, GeForce GTX 1060 Mobile, Toshiba NVMe THNSN5256GPUK, OLED, 2560x1440, 13.3" | Gigabyte Aero 14 i7-7700HQ, GeForce GTX 1060 Mobile, LiteOn CX2-8B256, IPS, 2560x1440, 14" | Razer Blade (2017) i7-7700HQ, GeForce GTX 1060 Mobile, Samsung PM951 NVMe MZVLV256, IPS, 1920x1080, 14" | Gigabyte Aero 15 i7-7700HQ, GeForce GTX 1060 Mobile, Lite-On CX2-8B512-Q11, IPS, 1920x1080, 15.6" | Eurocom Tornado F5 i7-7700K, GeForce GTX 1070 Mobile, Samsung SSD 960 Pro 512 GB m.2, IPS, 1920x1080, 15.6" | MSI GS63VR 7RF-228US i7-7700HQ, GeForce GTX 1060 Mobile, Samsung SM961 MZVKW512HMJP m.2 PCI-e, IPS, 3840x2160, 15.6" | Aorus X5 v6 AO-S107W516-PL-002 6820HK, GeForce GTX 1070 Mobile, LiteOn CX2-8B256, , 2880x1620, 15.6" | |
|---|---|---|---|---|---|---|---|---|
| Power Consumption | 21% | 18% | 29% | 9% | -46% | 2% | -70% | |
| Idle Minimum * (Watt) | 15.1 | 7 54% | 8 47% | 7.5 50% | 12 21% | 21.2 -40% | 14.5 4% | 23.3 -54% |
| Idle Average * (Watt) | 15.8 | 12 24% | 13 18% | 12.1 23% | 15 5% | 25.1 -59% | 17.3 -9% | 30.1 -91% |
| Idle Maximum * (Watt) | 16.7 | 18 -8% | 20 -20% | 14.3 14% | 20 -20% | 26.3 -57% | 17.4 -4% | 31 -86% |
| Load Average * (Watt) | 110.9 | 76 31% | 78 30% | 73.5 34% | 82 26% | 169.4 -53% | 93 16% | 195.8 -77% |
| Witcher 3 ultra * (Watt) | 135 | 110 19% | 108 20% | 111 18% | 128.8 5% | |||
| Load Maximum * (Watt) | 170.4 | 161 6% | 146 14% | 110.2 35% | 161 6% | 202.4 -19% | 242 -42% |
* ... kleiner is beter
| Aorus x3 Plus v7 i7-7820HK, GeForce GTX 1060 Mobile, 74 Wh | Alienware 13 R3 i7-7700HQ, GeForce GTX 1060 Mobile, 76 Wh | Gigabyte Aero 14 i7-7700HQ, GeForce GTX 1060 Mobile, 94 Wh | Razer Blade (2017) i7-7700HQ, GeForce GTX 1060 Mobile, 70 Wh | Gigabyte Aero 15 i7-7700HQ, GeForce GTX 1060 Mobile, 94.24 Wh | Eurocom Tornado F5 i7-7700K, GeForce GTX 1070 Mobile, 75.24 Wh | MSI GS63VR 7RF-228US i7-7700HQ, GeForce GTX 1060 Mobile, 65 Wh | Aorus X5 v6 AO-S107W516-PL-002 6820HK, GeForce GTX 1070 Mobile, 94.2 Wh | |
|---|---|---|---|---|---|---|---|---|
| Batterijduur | 2% | 66% | 86% | 29% | -34% | -21% | -50% | |
| Reader / Idle (h) | 8 | 8.7 9% | 15.2 90% | 10.6 33% | 4.9 -39% | 6.4 -20% | 4 -50% | |
| WiFi v1.3 (h) | 4.9 | 5.3 8% | 8.7 78% | 9.1 86% | 7 43% | 3.6 -27% | 3.9 -20% | |
| Load (h) | 1.7 | 1.5 -12% | 2.2 29% | 1.9 12% | 1.1 -35% | 1.3 -24% | ||
| WiFi (h) | 3 |
Pro
Contra

Dit is de verkorte versie van het originele artikel. Het volledige, Engelse testrapport vind je hier.
De X3 Plus v7 is een ambitieus apparaat. Het gaat verder met de drive van Aorus om krachtige hardware in een compacte behuizing te plaatsen. Helaas lijkt de X3 een stapje te ver gegaan te zijn en het eindresultaat is een notebook vol compromissen. Hoewel er zeker hoogtepunten zijn, zijn er om dit prestatieniveau te halen ook afwegingen gemaakt die verkeerd uitpakten.
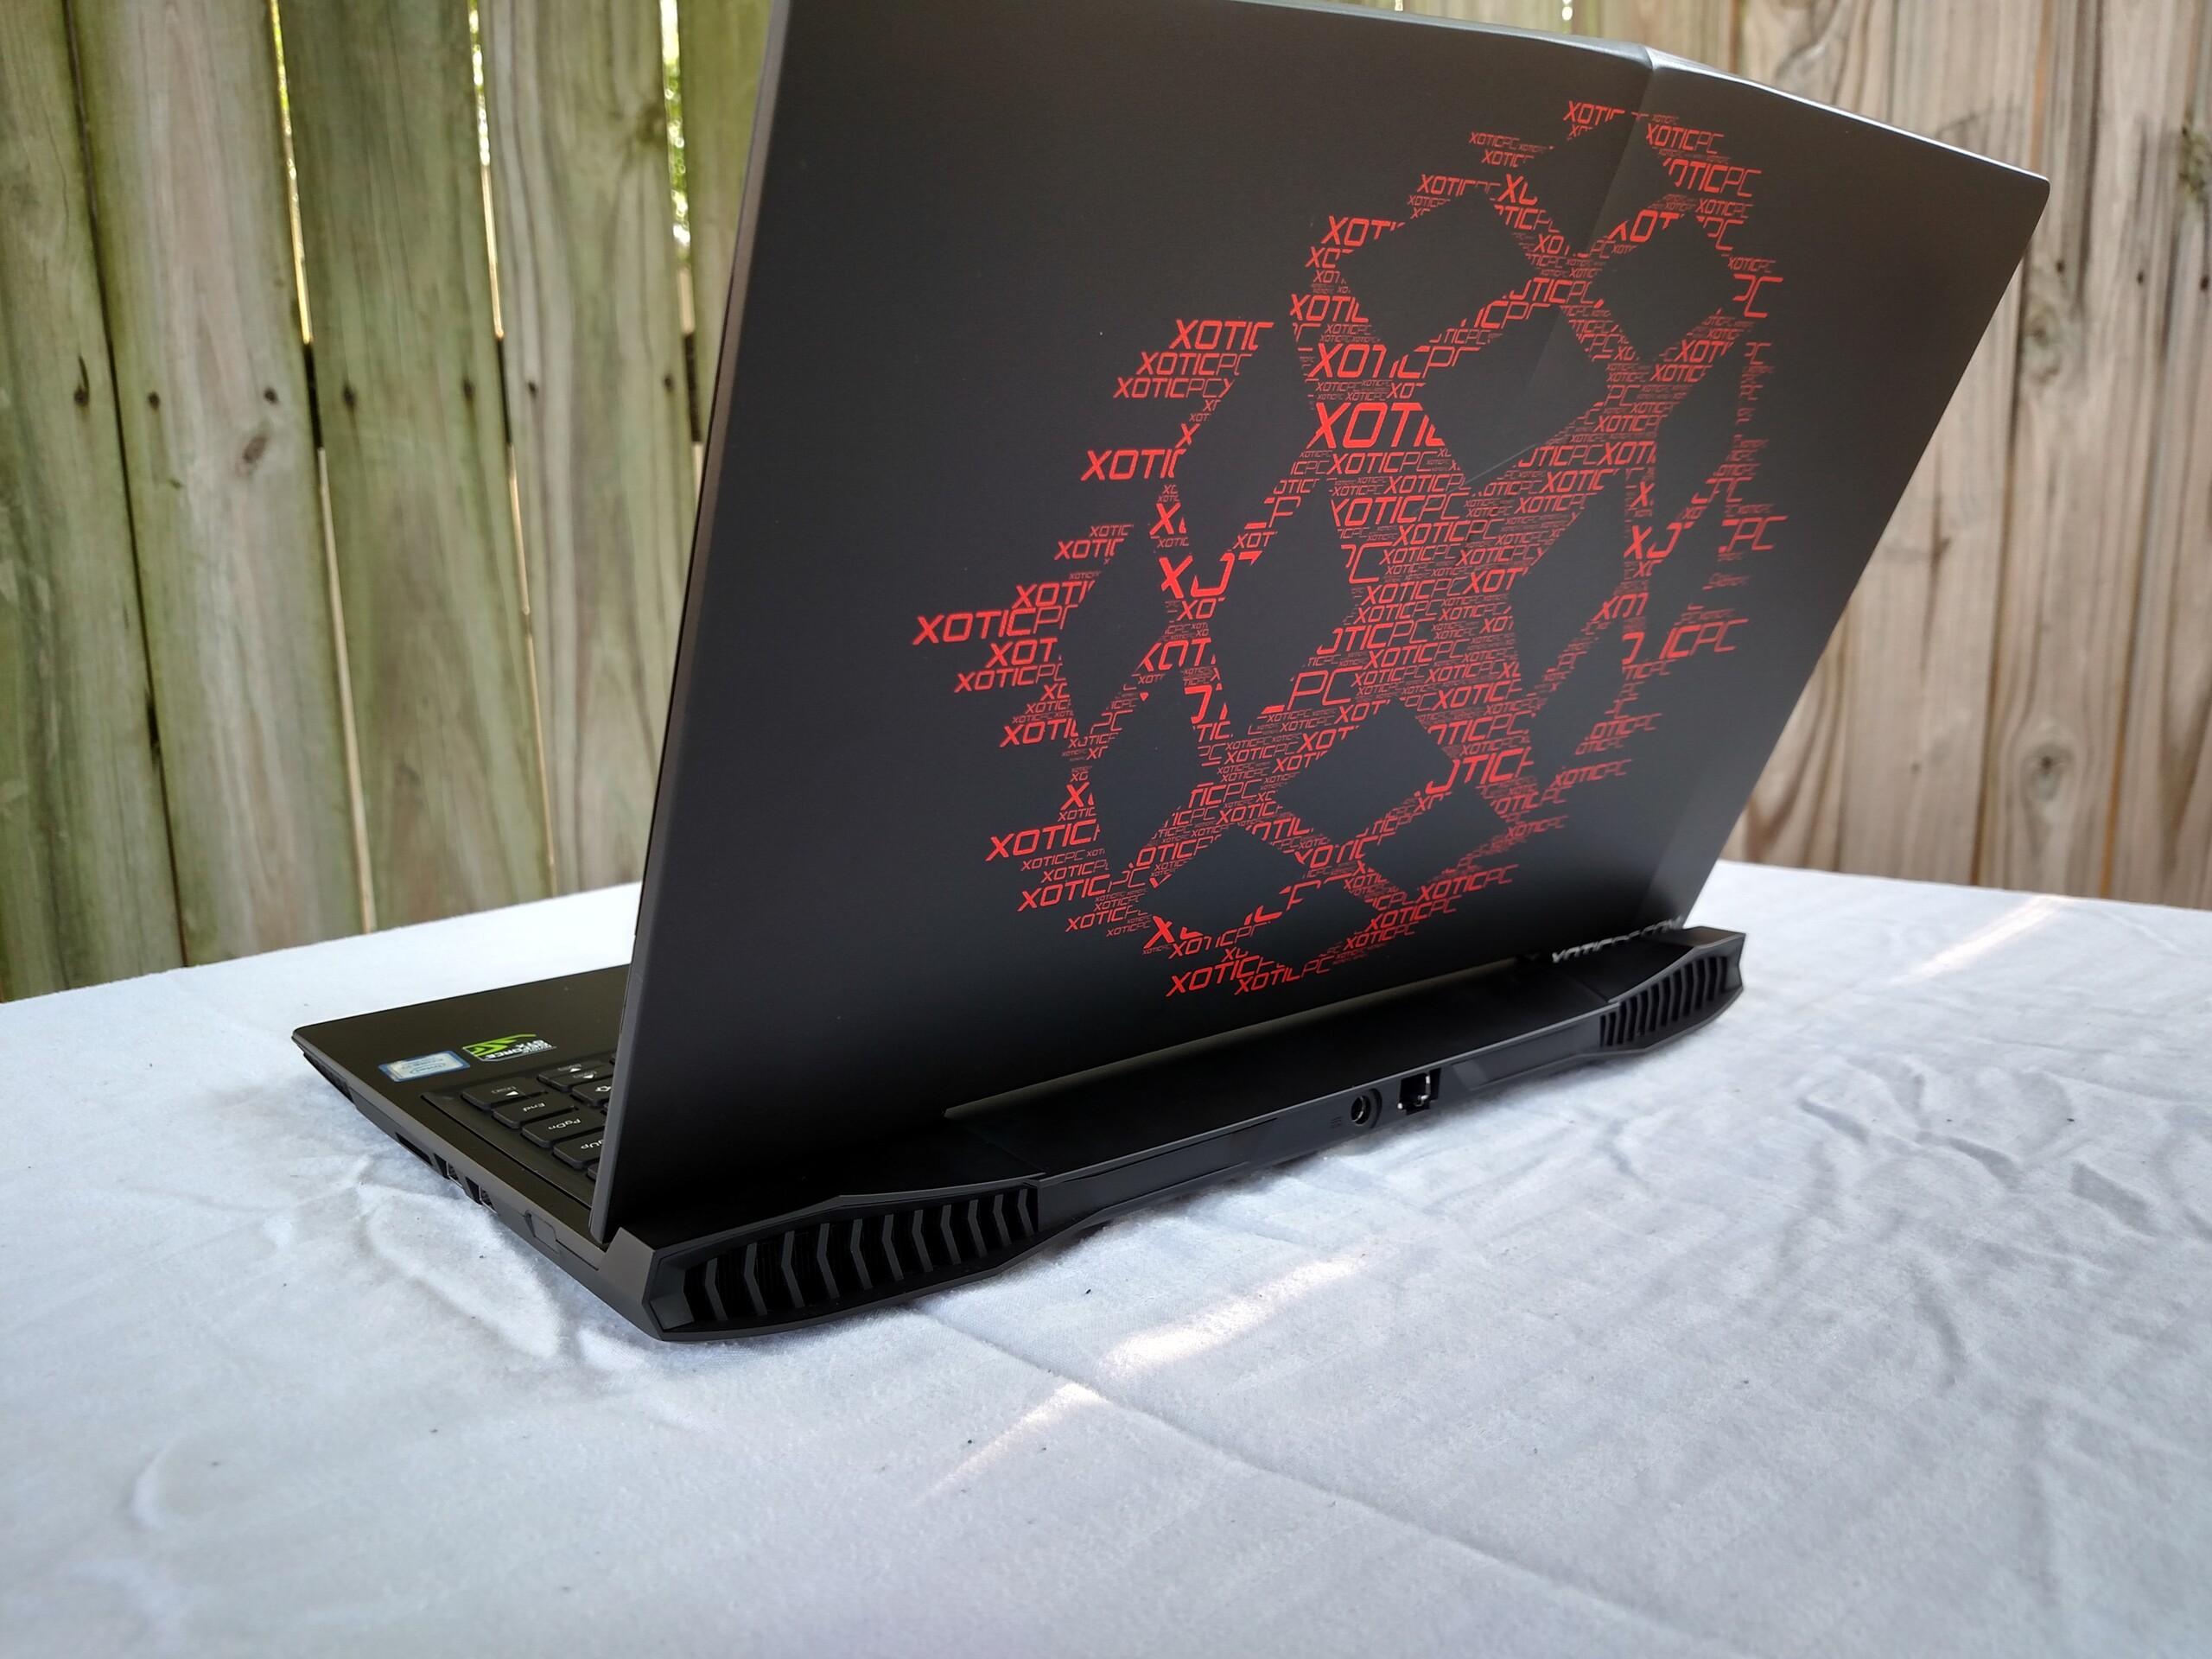
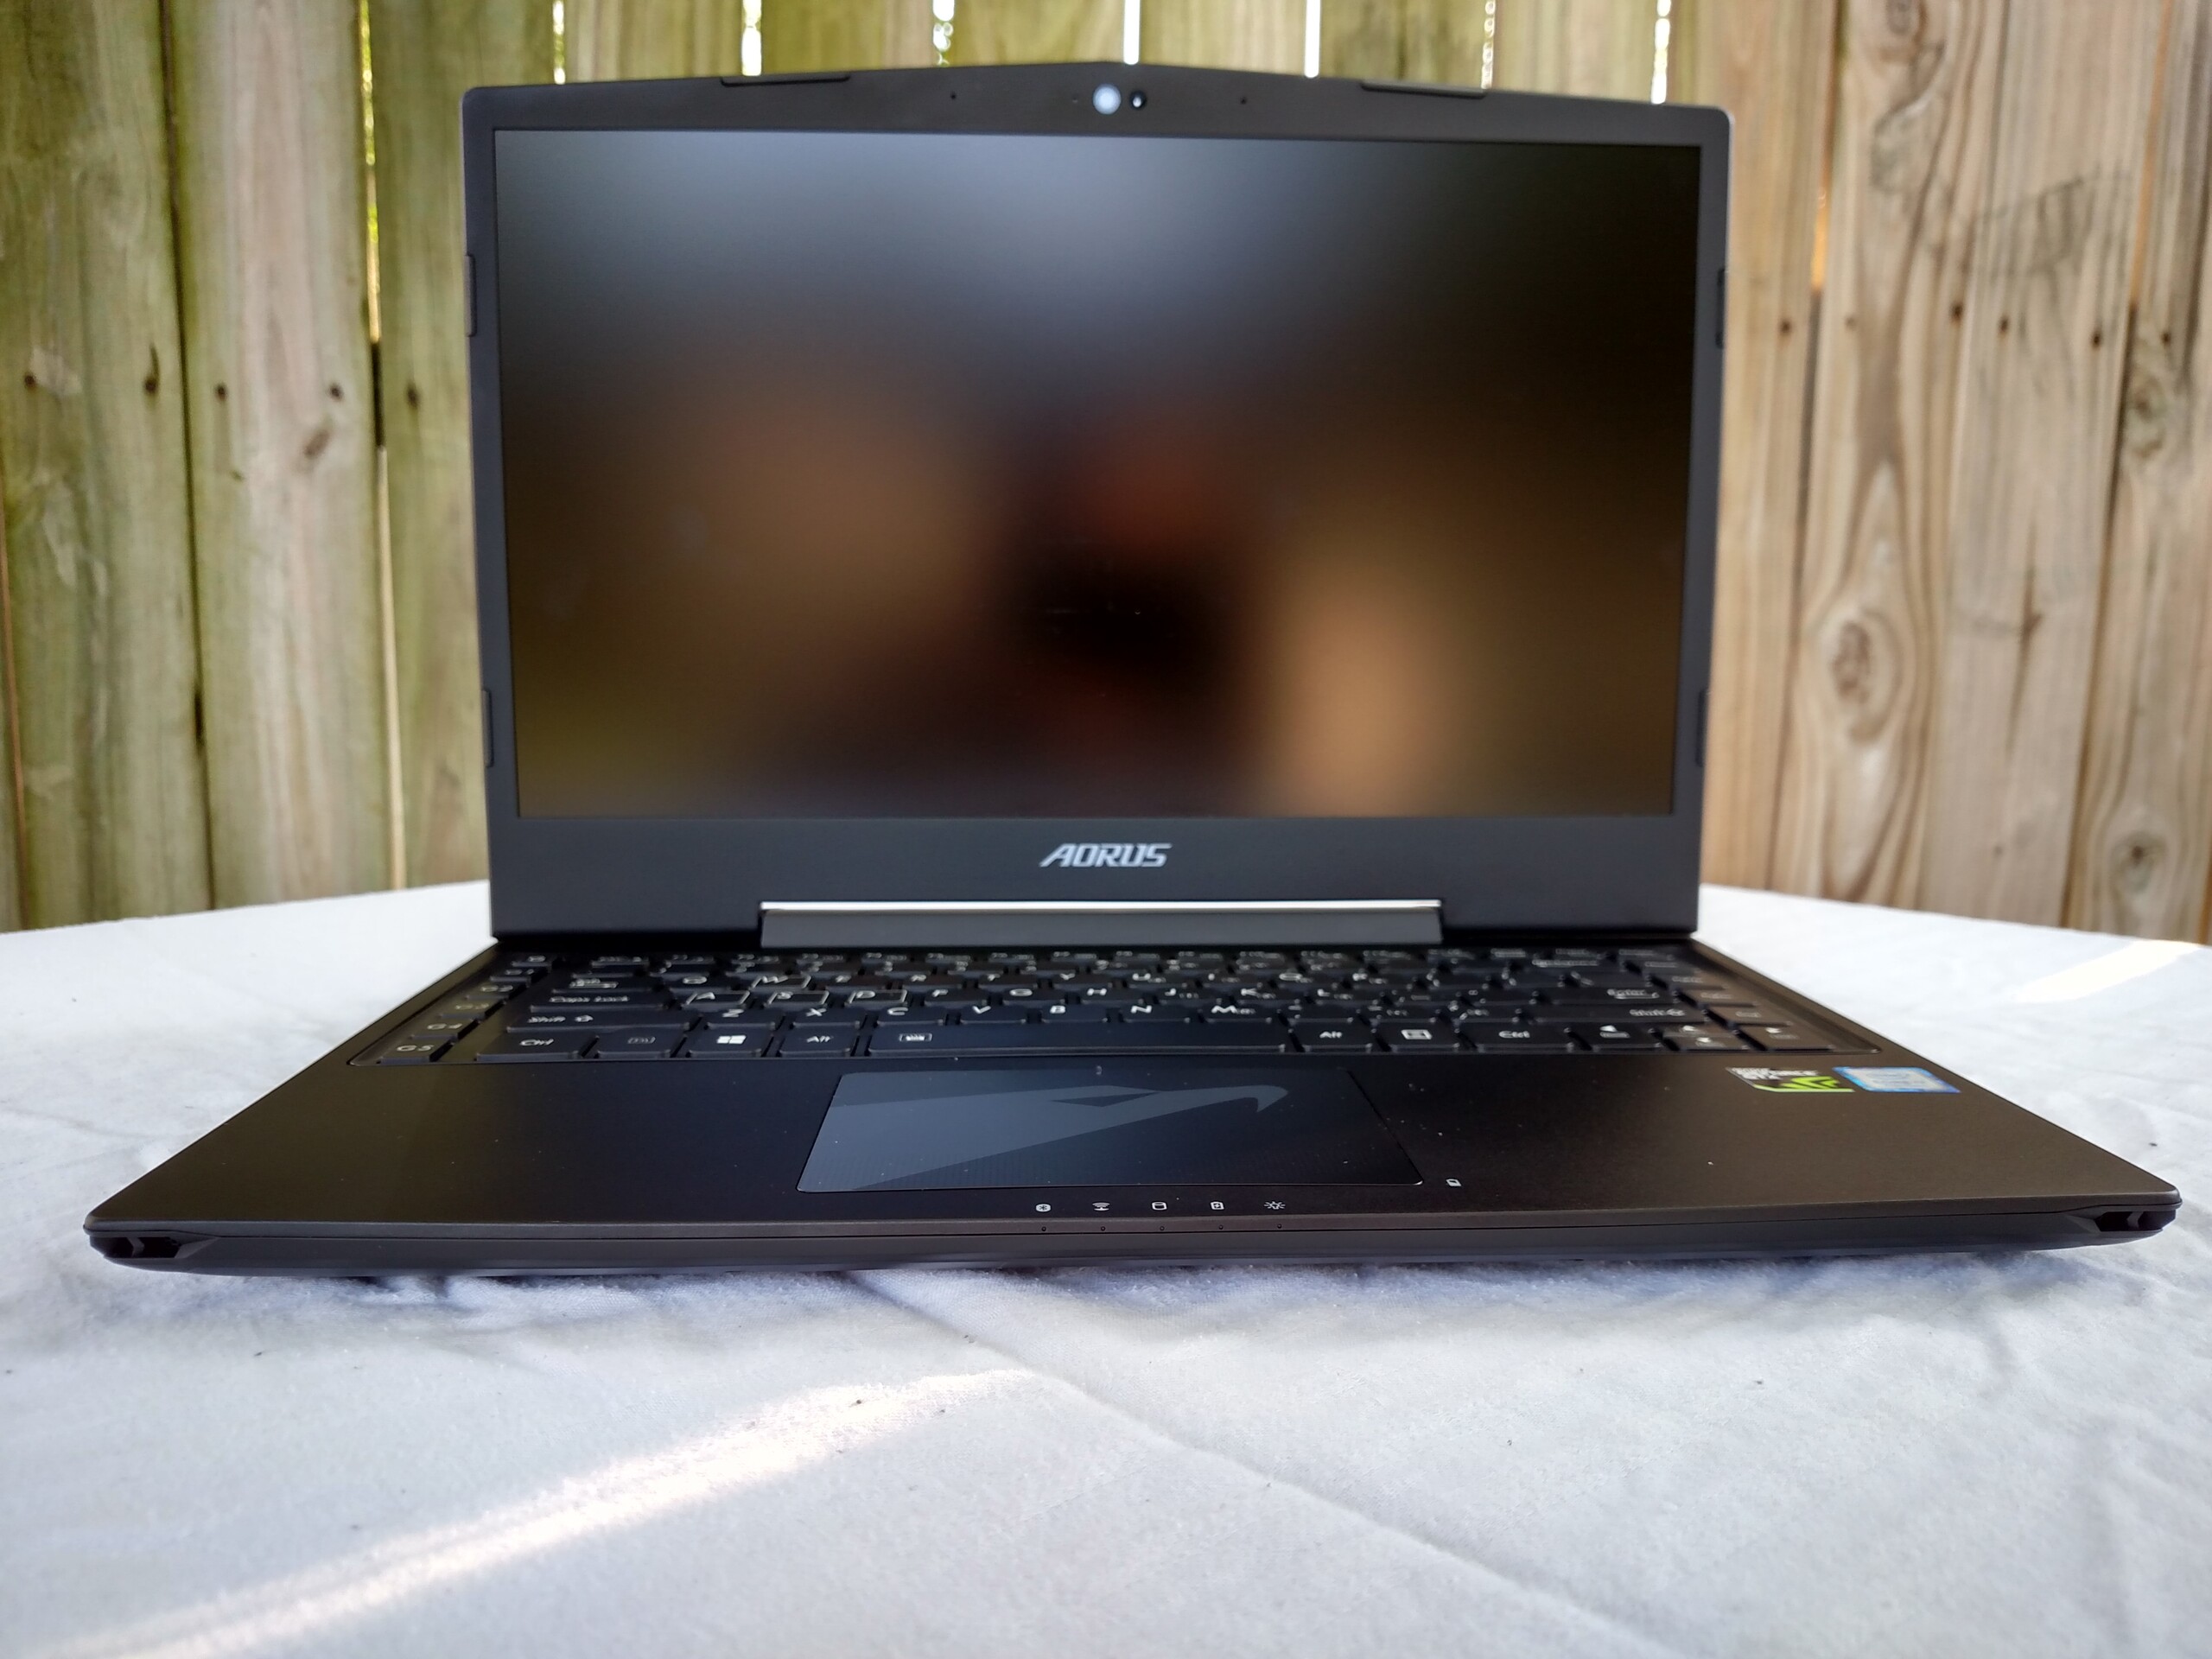
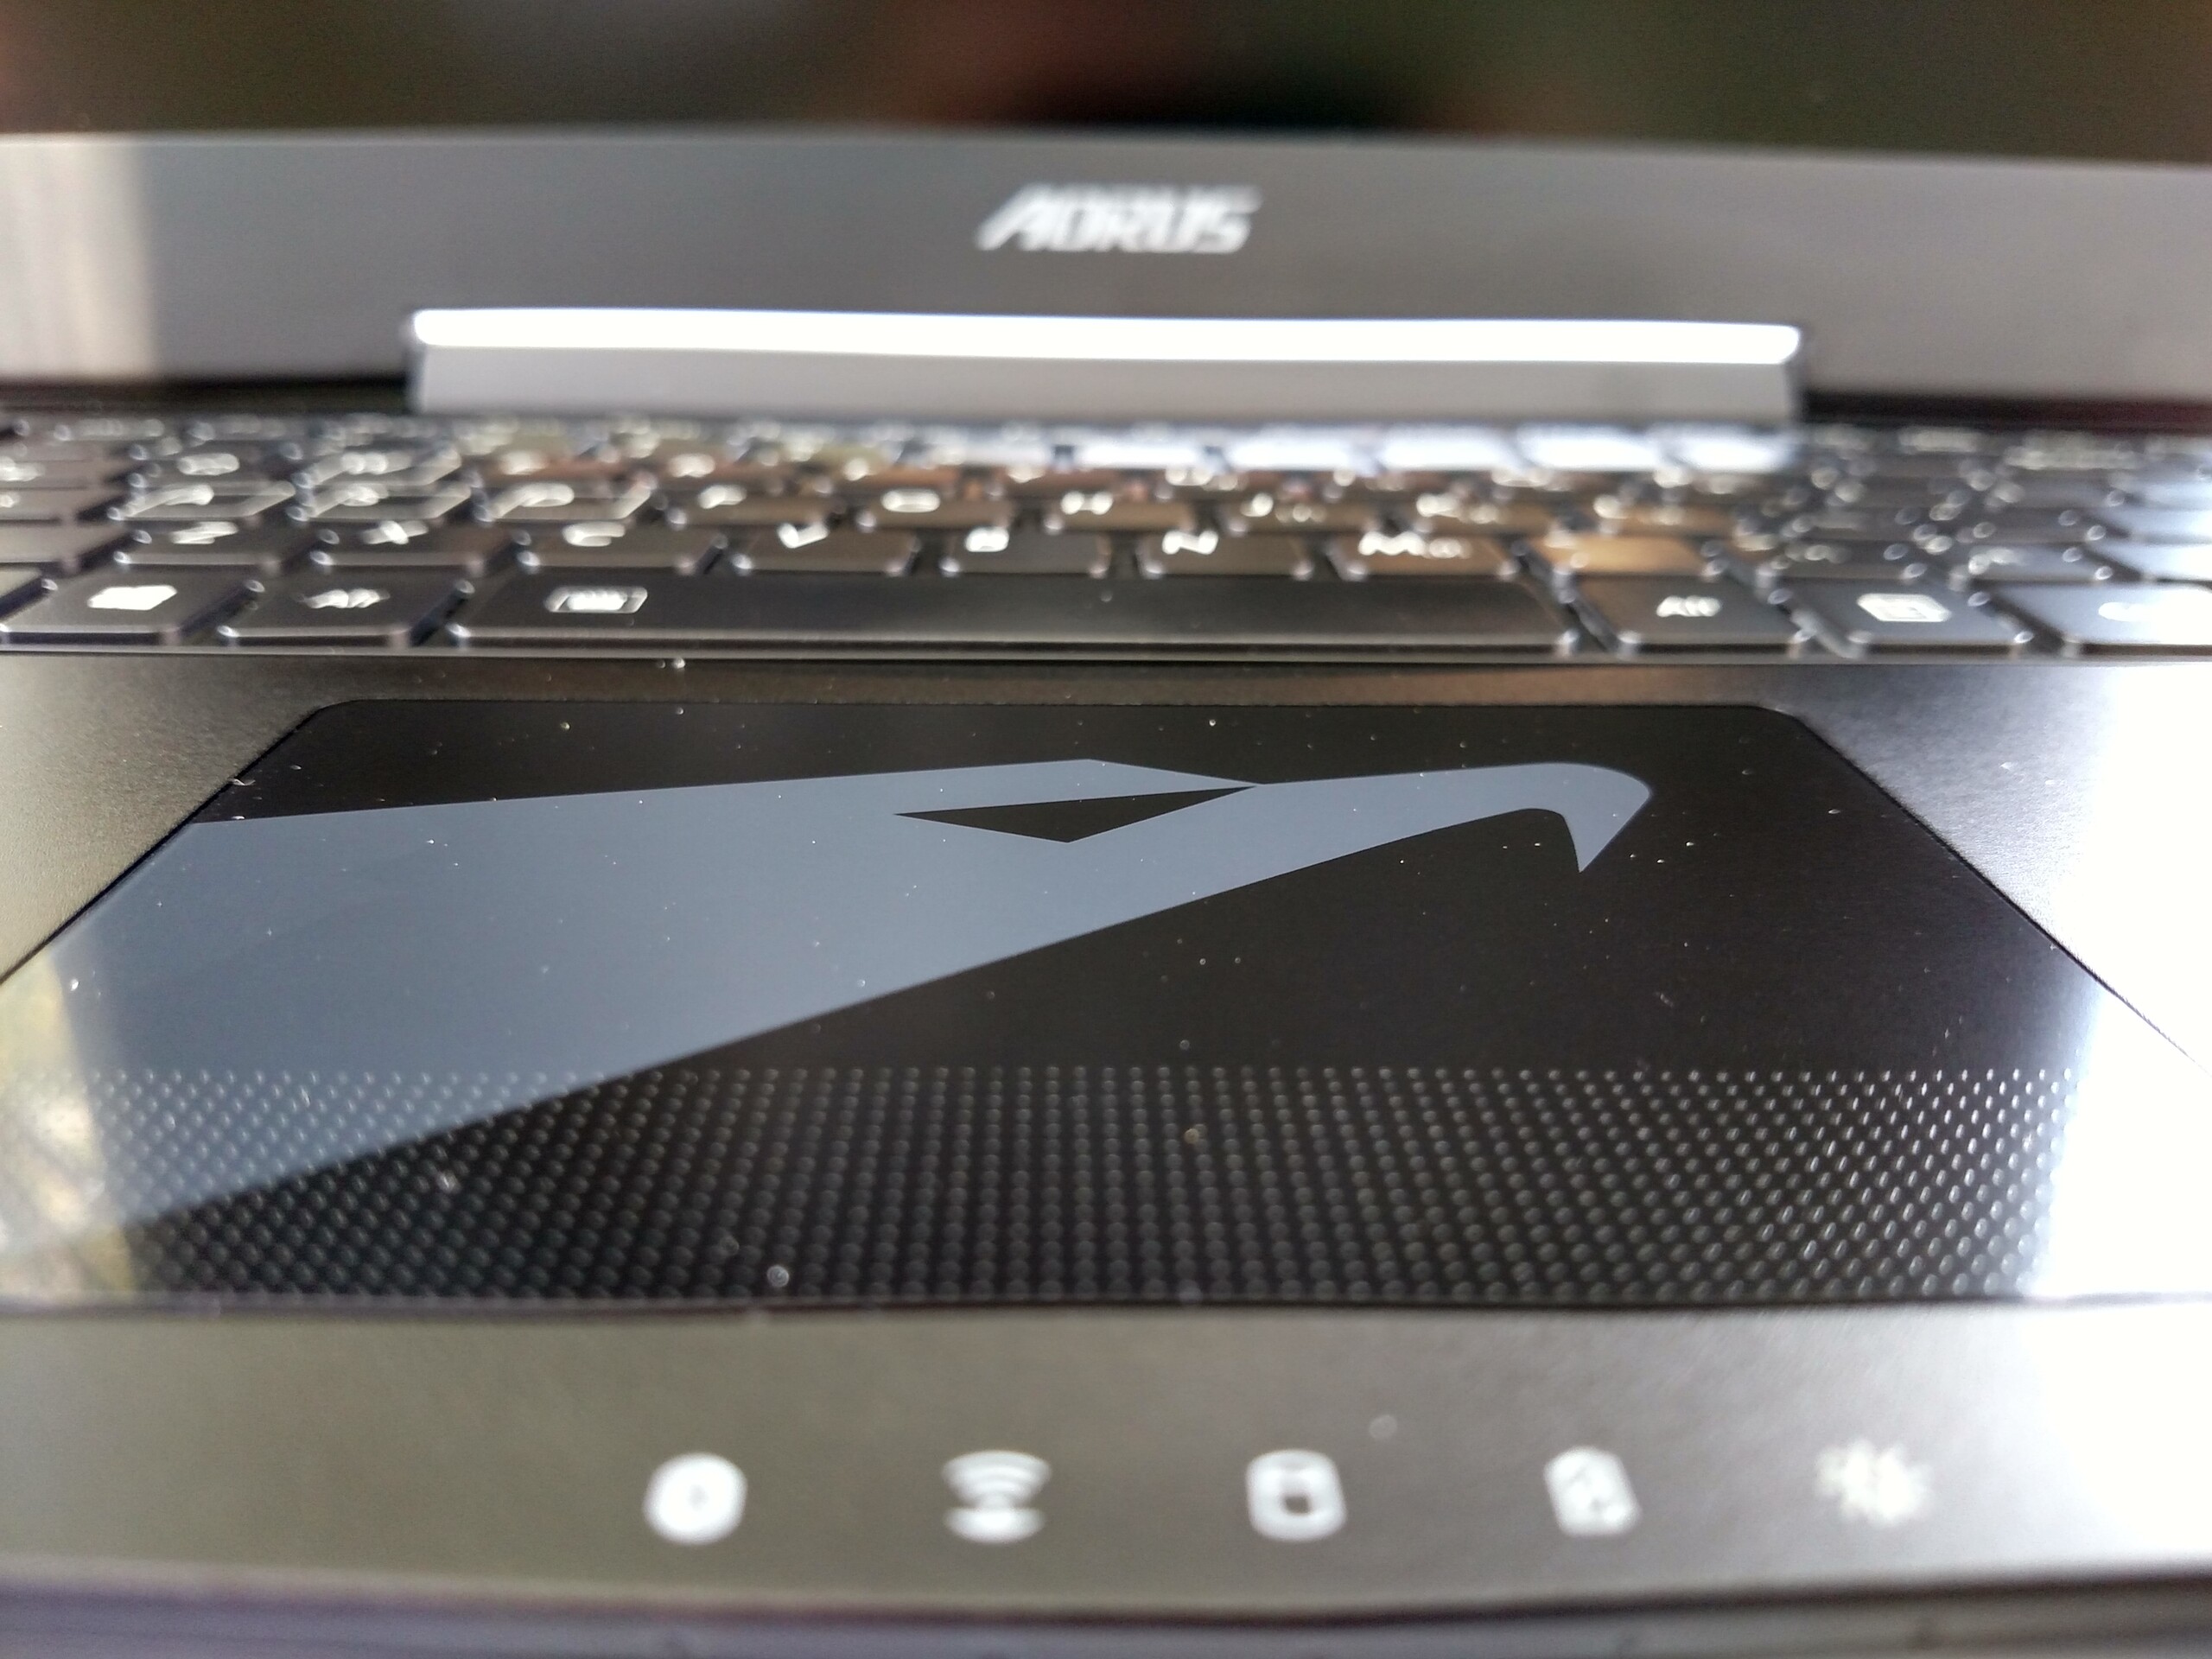
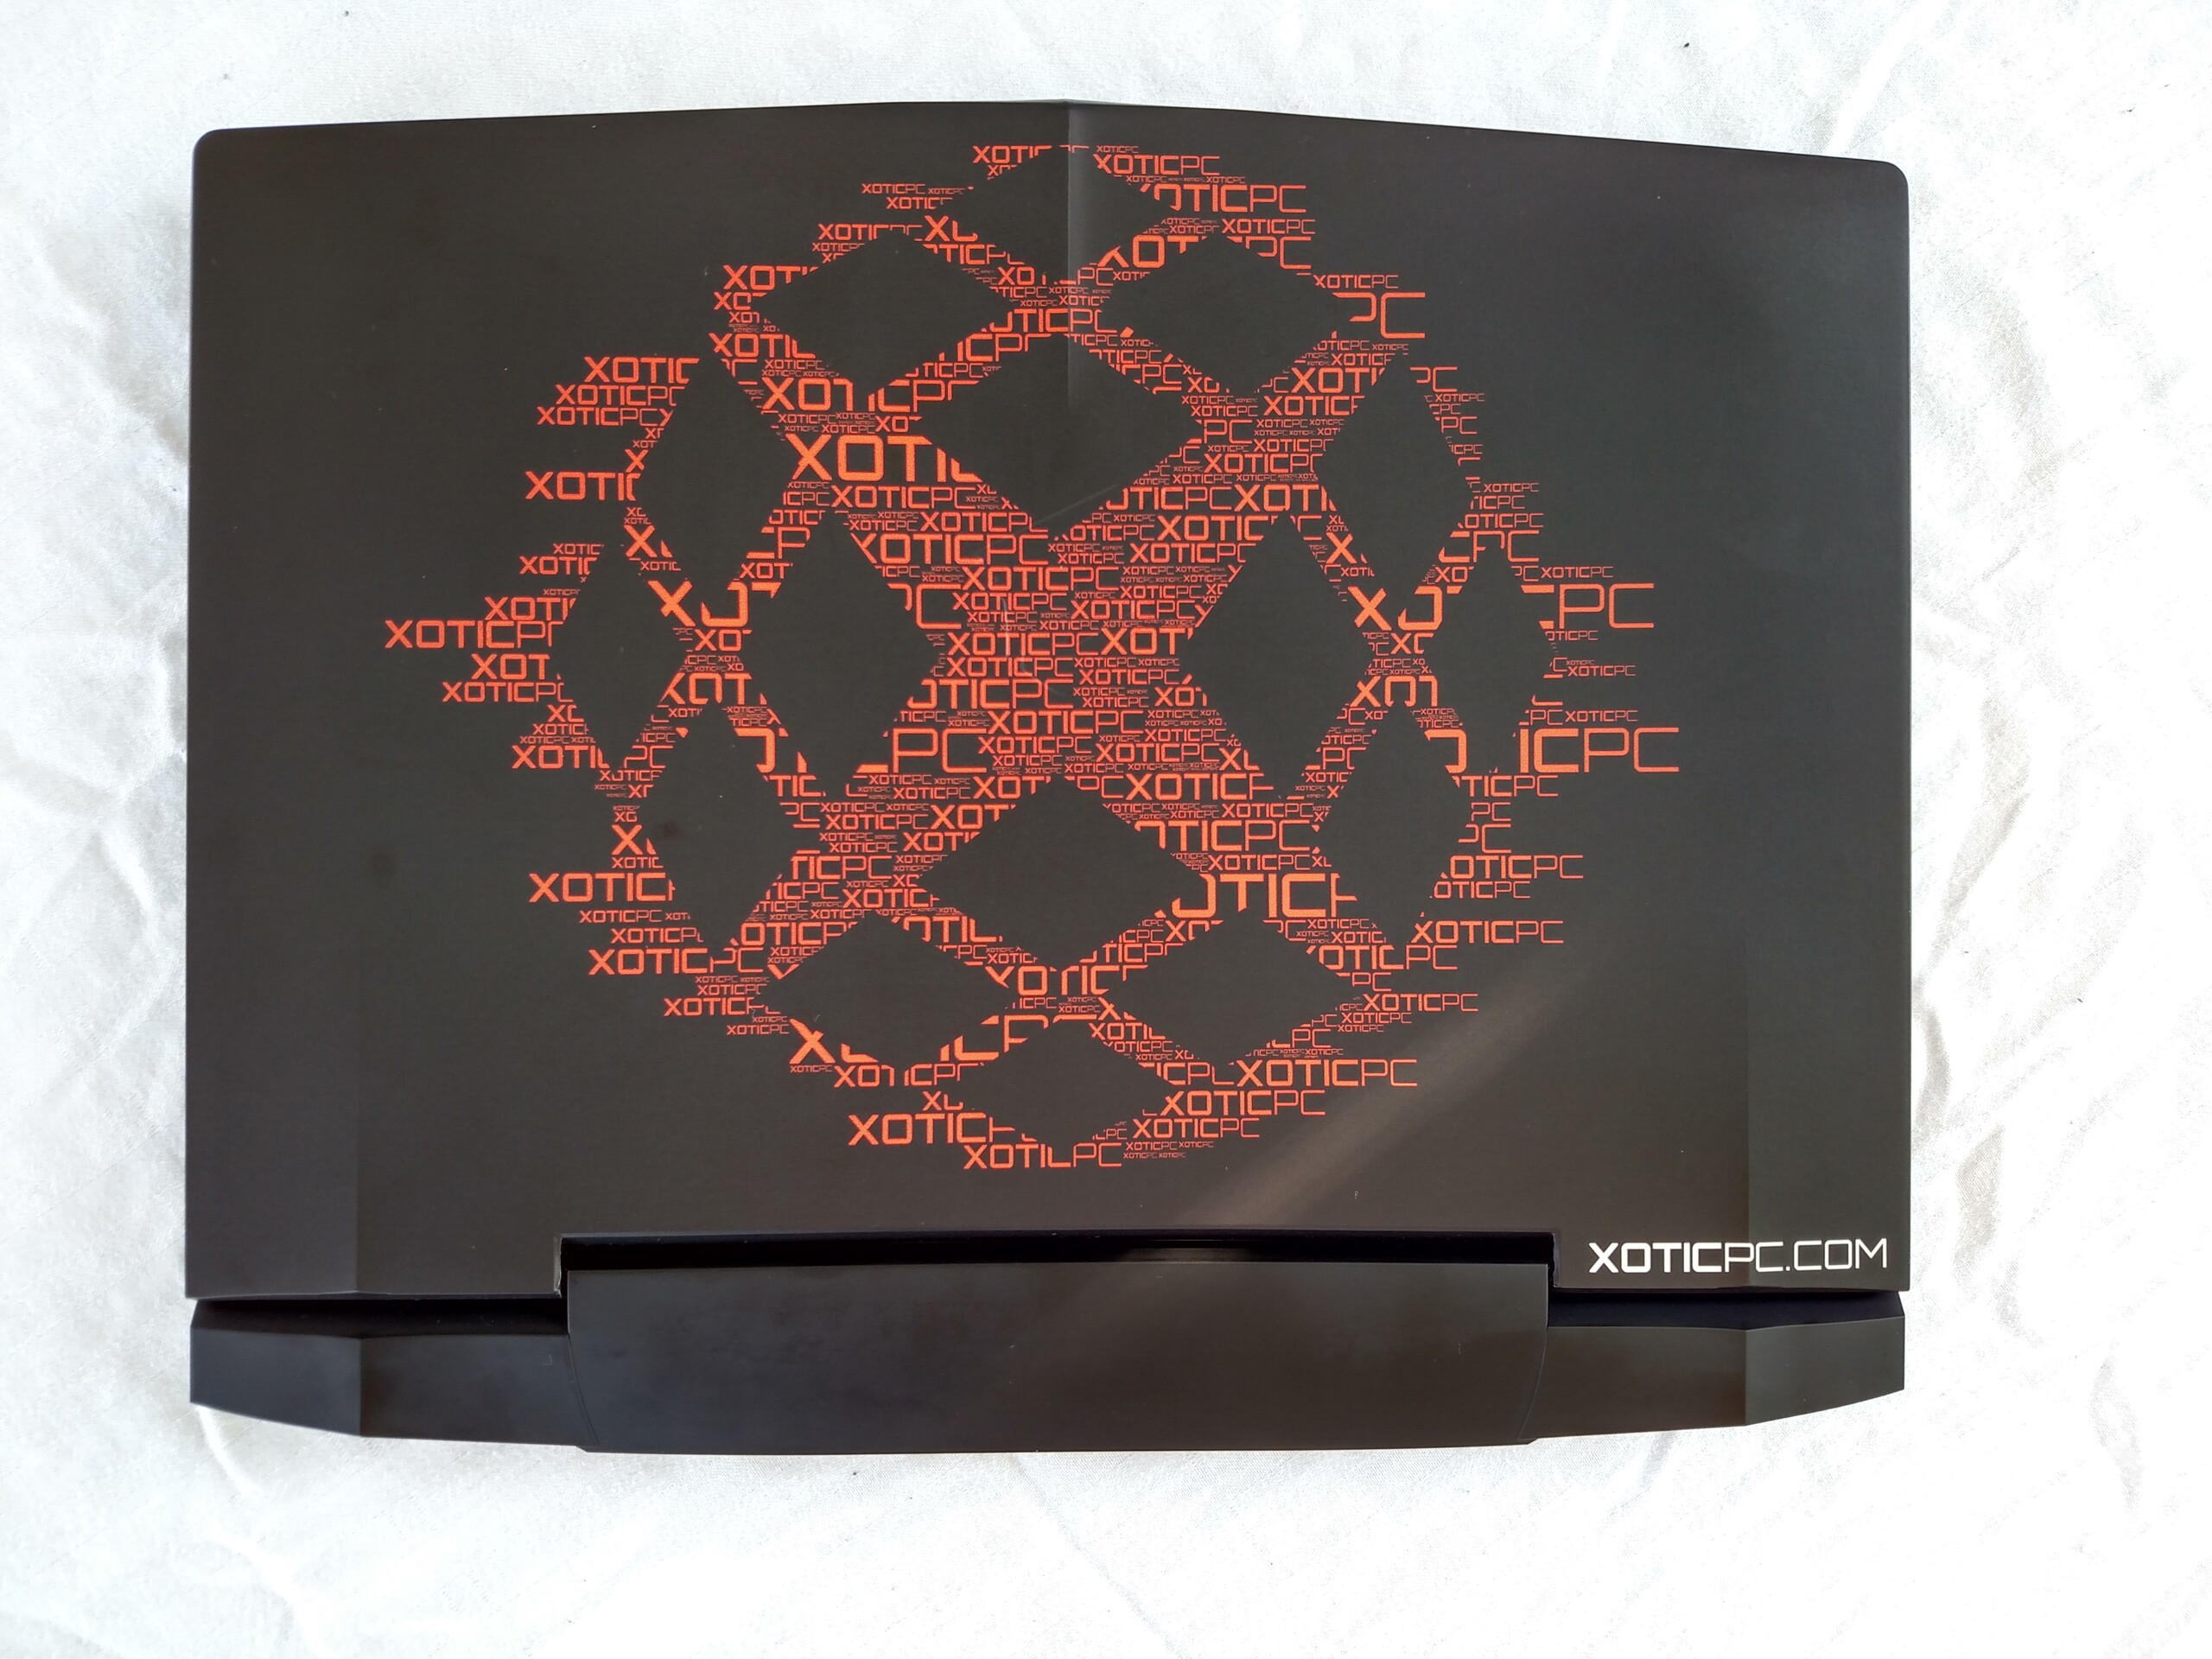
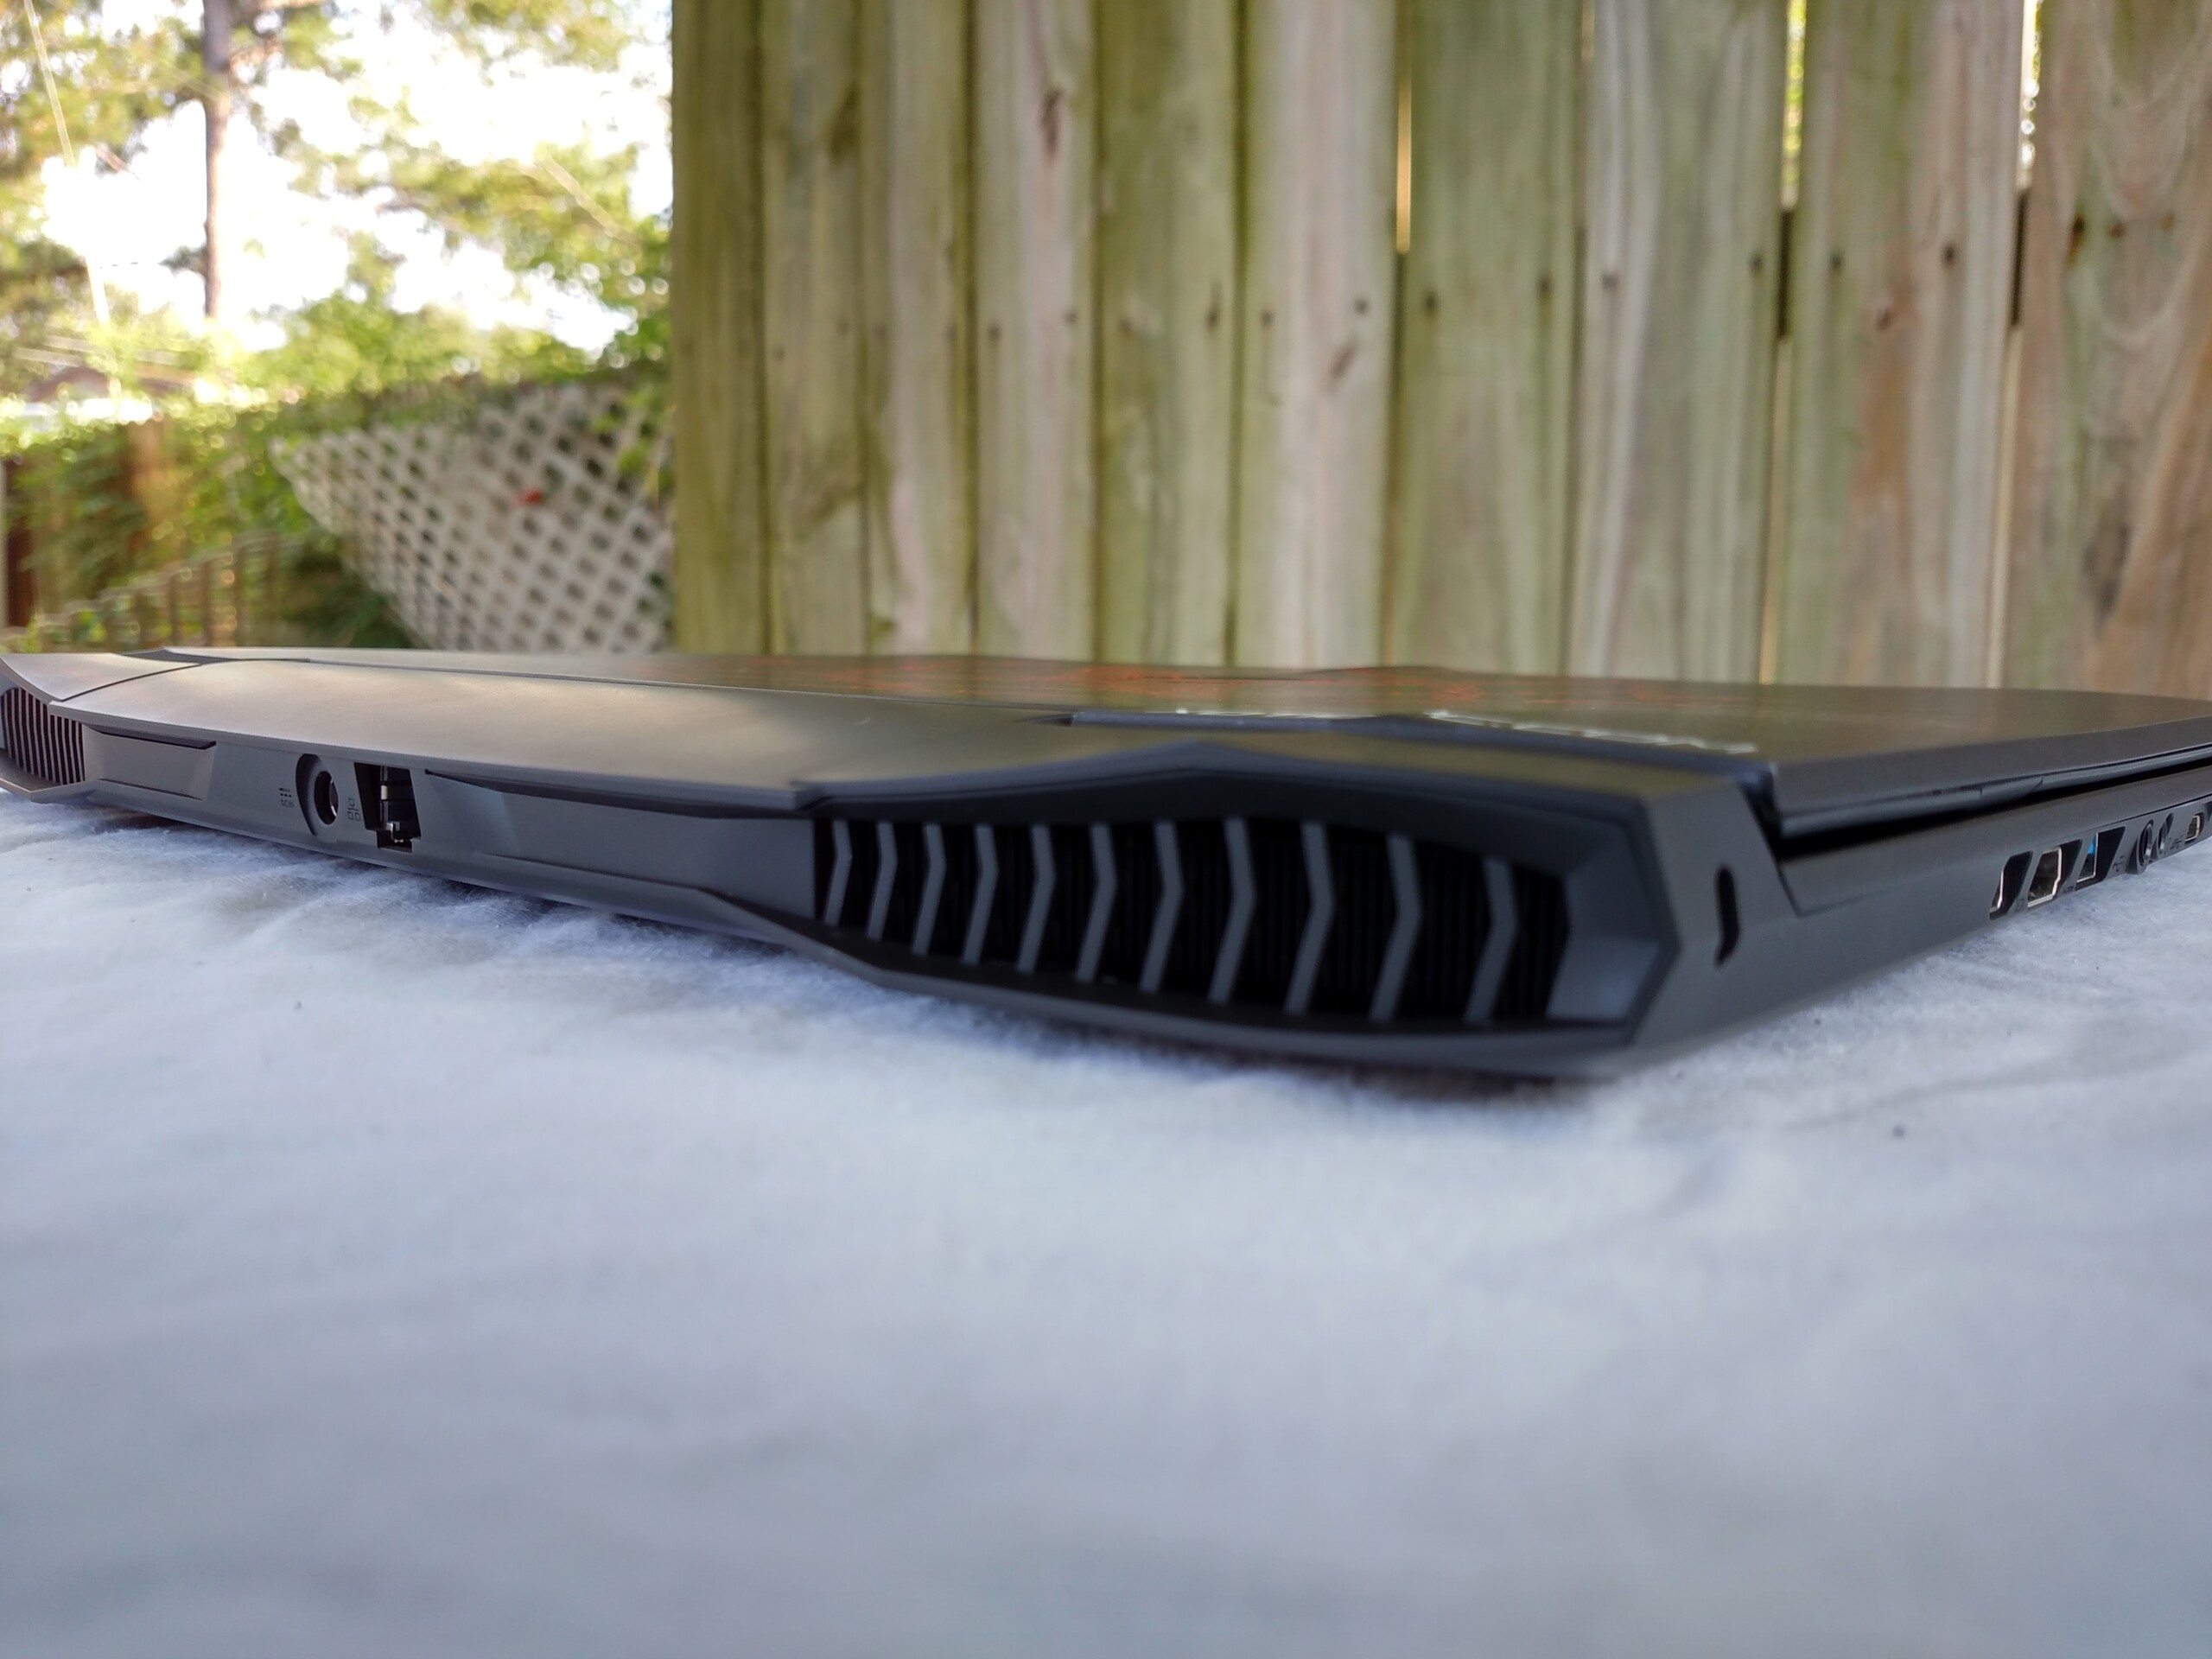
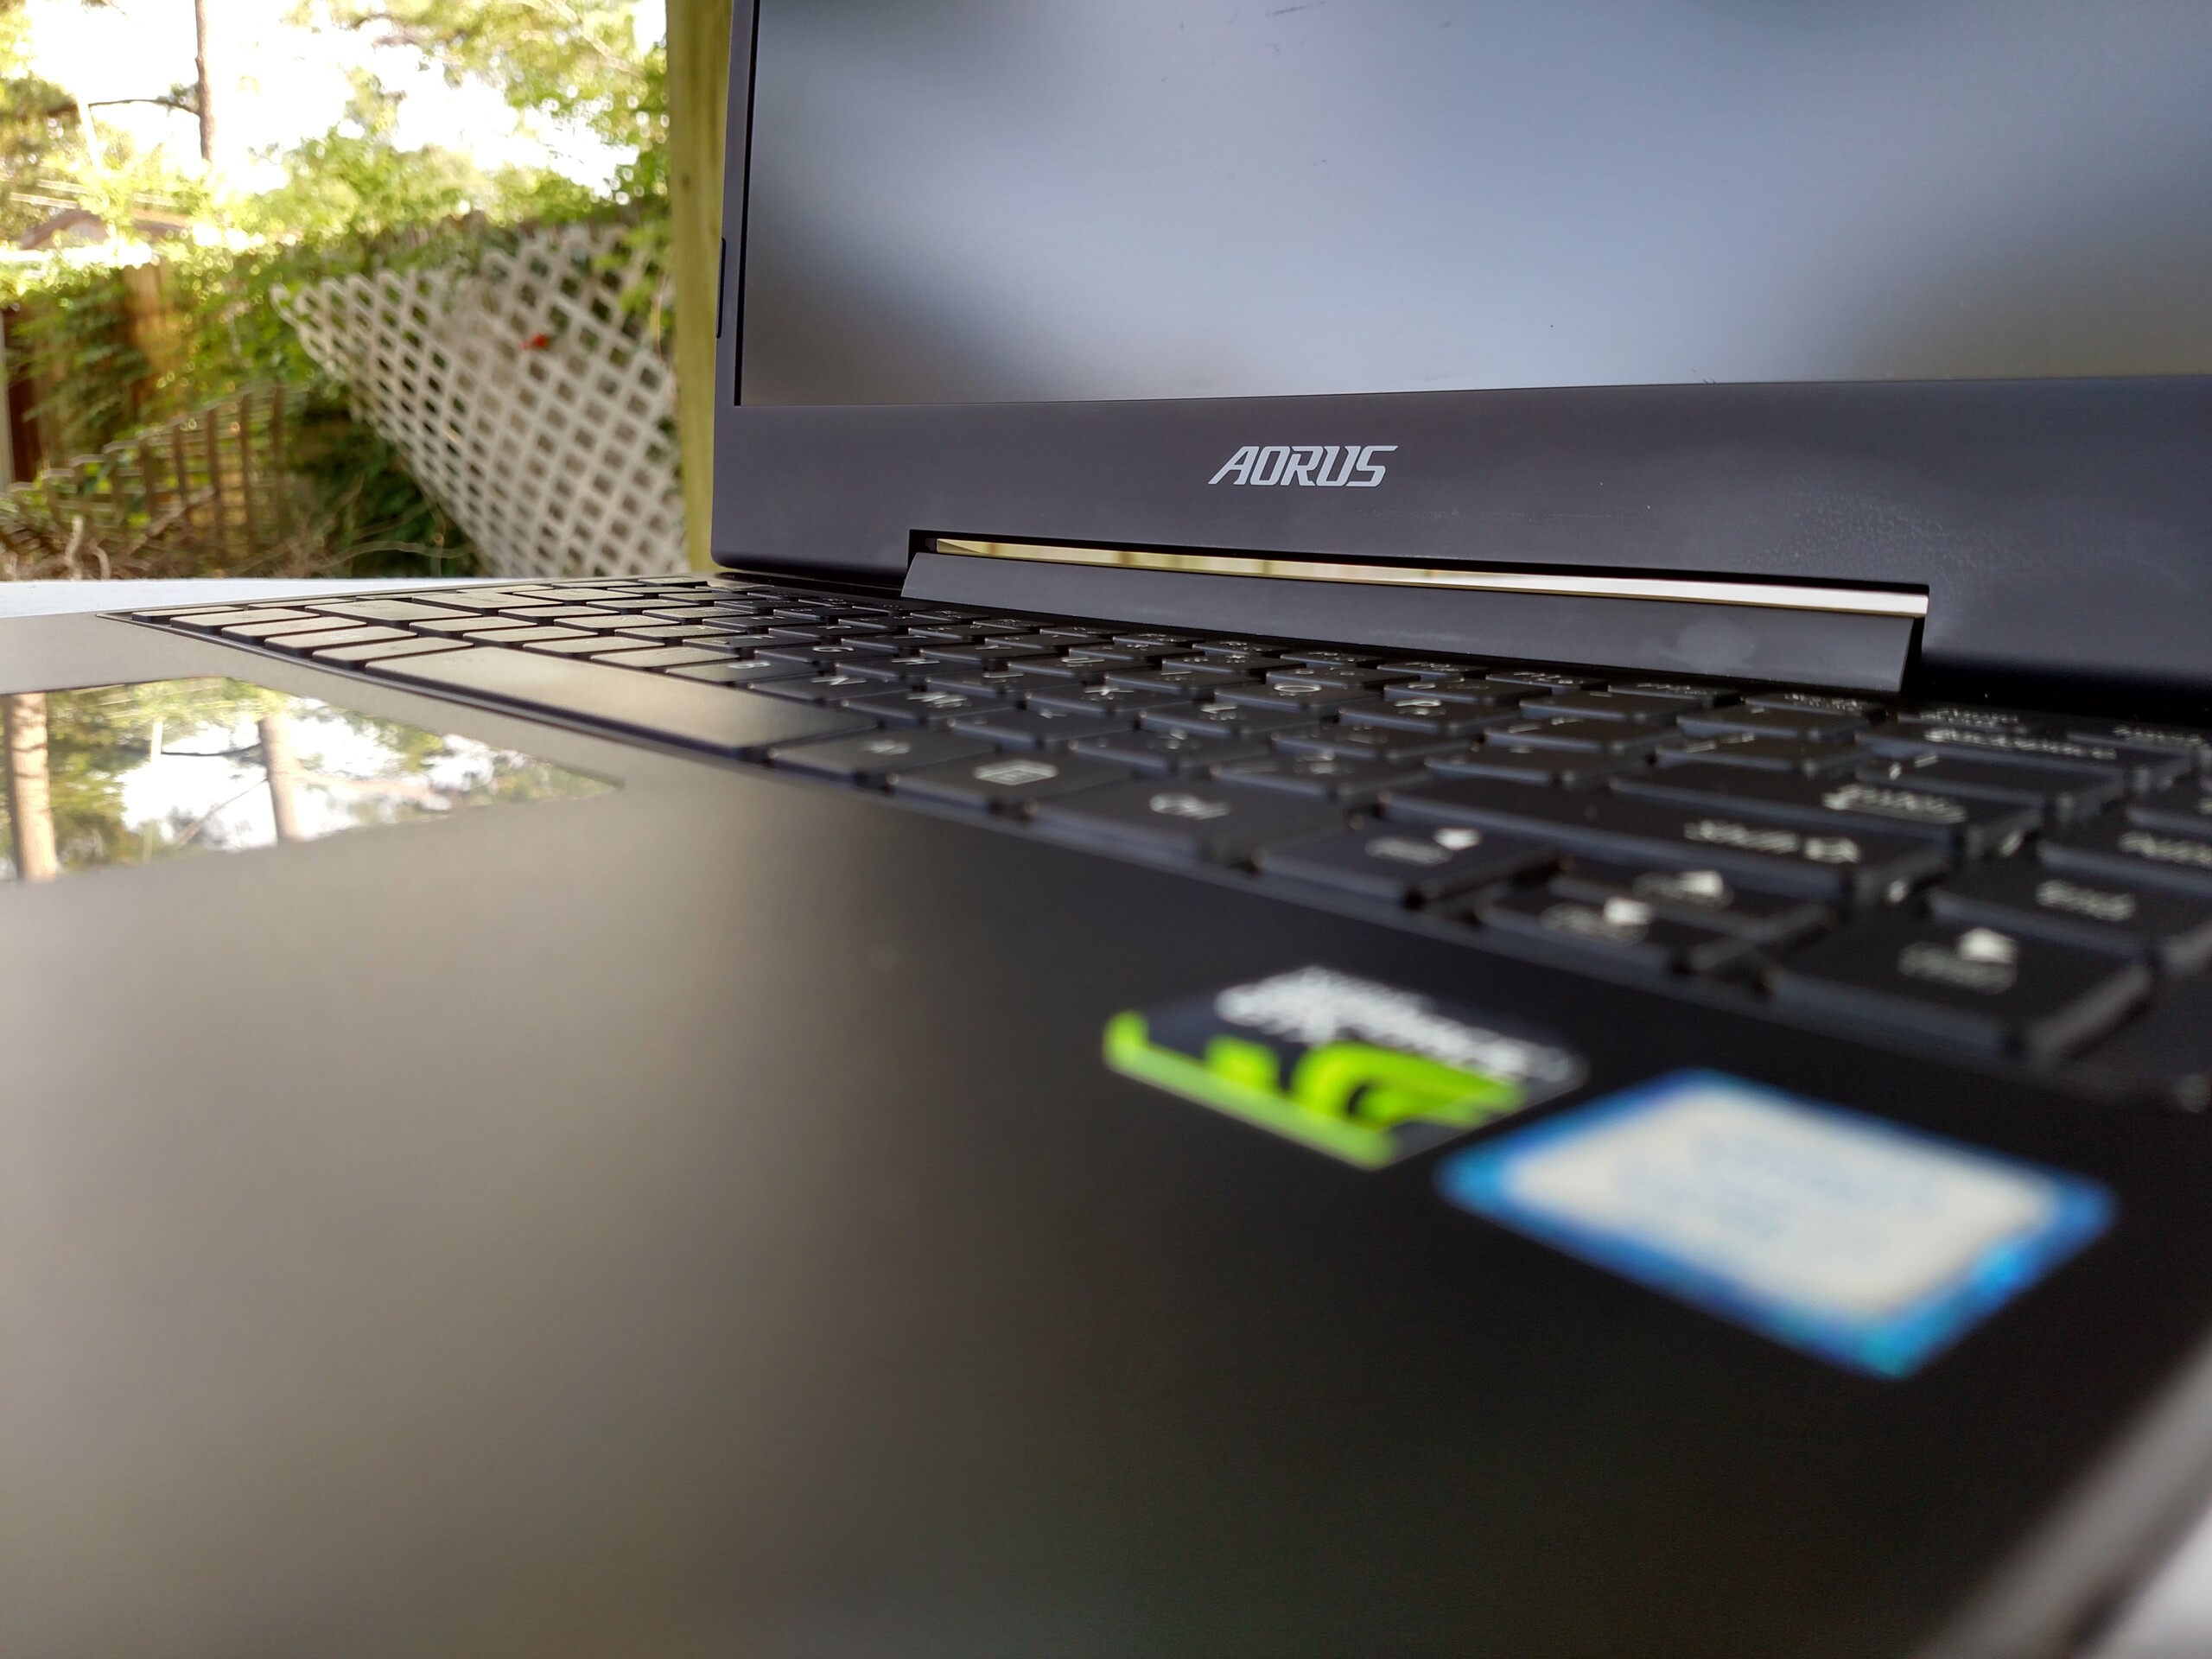
Het ontwerp van de X3 is uitstekend. De aantrekkelijke afwerking in combinatie met de subtiele accenten zorgen voor een knappe behuizing en het gebruik van metaal rondom geven het notebook een high-end gevoel. Het QHD beeldscherm is ook schitterend. Afbeeldingen en tekst zijn scherp genoeg om je aan te snijden, de kleuren zijn levendig en accuraat en het beeldscherm blijft zelfs in direct zonlicht helder en leesbaar. We zijn ook onder de indruk van de game prestaties. Het blijft ongelooflijk dat gebruikers nu desktop-niveau (of beter!) prestaties kunnen krijgen in een notebook dat zo compact is. Ook de optie om de CPU en GPU te overklokken zijn mooie toevoegingen; meer flexibiliteit voegt waarde toe.
Helaas komen de prestaties wel met een prijs. De behuizing is te klein om voldoende de warmteontwikkeling van de krachtige componenten onder controle te houden, waardoor de ventilatoren vaak en agressief gaan blazen. Het eindresultaat is een luid notebook dat erg heet wordt en bij zware belasting gaat throttlen. Het enorme stroomverbruik baart ook zorgen, omdat het meer is dan de stroomadapter kan leveren. Nogmaals, gebruikers zullen iets voorzichtig moeten zijn wanneer ze de grenzen van het notebook opzoeken.
Al met al stellen we de Aorus X3 Plus v7 op prijs. De prestaties zijn fantastisch, maar op andere gebieden blijft het notebook achter bij concurrenten als de Gigabyte Aero 14 en Alienware 13. Het matige toetsenbord, het frustrerende touchpad en de warmte- en geluidsontwikkeling houden de X3 buiten de hoogste regionen van de dun-en-licht game notebooks.
Aorus x3 Plus v7
- 16-05-2017 v6 (old)
Sam Medley
Price comparison
