 Deutsch
 English
 Español
 Français
 Italiano
 Nederlands
 Polski
 Português
 Русский
 Türkçe
 Svenska
 Chinese
 Magyar
Kort testrapport Asus VivoBook Pro 15 (i7-7700HQ, GTX 1050) Laptop
| |||||||||||||||||||||||||
Helderheidsverdeling: 85 %
Helderheid in Batterij-modus: 246 cd/m²
Contrast: 515:1 (Zwart: 0.48 cd/m²)
ΔE Color 5.39 | 0.5-29.43 Ø5
ΔE Greyscale 5.25 | 0.57-98 Ø5.3
60% sRGB (Argyll 1.6.3 3D)
38% AdobeRGB 1998 (Argyll 1.6.3 3D)
41.27% AdobeRGB 1998 (Argyll 2.2.0 3D)
59.8% sRGB (Argyll 2.2.0 3D)
39.92% Display P3 (Argyll 2.2.0 3D)
Gamma: 2.48
| Asus VivoBook Pro 15 N580VD-DM028T INNOLUX N156HGA-EAB, , 1920x1080, 15.60 | Asus ZenBook Pro UX550VD CMN15E8 (N156HCE-EN1), , 1920x1080, 15.60 | Gigabyte Sabre 15G ID: LGD0533, Name: LG Display LP156WF6-SPK3, , 1920x1080, 15.60 | HP Pavilion 15t-X7P42AV AU Optronics AUO41ED, , 1920x1080, 15.60 | Acer Aspire VX15 VX5-591G-589S BOE CQ NV156HFM-N42, , 1920x1080, 15.60 | Dell XPS 15 2017 9560 (7300HQ, Full-HD) Sharp SHP1453 LQ156M1, , 1920x1080, 15.60 | |
|---|---|---|---|---|---|---|
| Display | 59% | -2% | -5% | 1% | 70% | |
| Display P3 Coverage | 39.92 | 65.7 65% | 38.97 -2% | 38.03 -5% | 40.56 2% | 68.9 73% |
| sRGB Coverage | 59.8 | 90.3 51% | 58.2 -3% | 56.5 -6% | 59.4 -1% | 98.9 65% |
| AdobeRGB 1998 Coverage | 41.27 | 65.9 60% | 40.3 -2% | 39.29 -5% | 41.9 2% | 70.9 72% |
| Response Times | -31% | -30% | -55% | -62% | -163% | |
| Response Time Grey 50% / Grey 80% * | 44 ? | 38.8 ? 12% | 32 ? 27% | 44.4 ? -1% | 46 ? -5% | 54 ? -23% |
| Response Time Black / White * | 13 ? | 27.2 ? -109% | 25.6 ? -97% | 27.2 ? -109% | 34 ? -162% | 52.4 ? -303% |
| PWM Frequency | 25000 ? | 25910 ? 4% | 20000 ? -20% | 20000 ? -20% | ||
| Screen | 36% | -18% | -16% | 23% | 46% | |
| Brightness middle | 247 | 335 36% | 248.4 1% | 209.7 -15% | 277 12% | 400 62% |
| Brightness | 224 | 313 40% | 241 8% | 193 -14% | 268 20% | 392 75% |
| Brightness Distribution | 85 | 83 -2% | 84 -1% | 75 -12% | 91 7% | 89 5% |
| Black Level * | 0.48 | 0.27 44% | 0.3 37% | 0.19 60% | 0.26 46% | 0.26 46% |
| Contrast | 515 | 1241 141% | 828 61% | 1104 114% | 1065 107% | 1538 199% |
| Colorchecker dE 2000 * | 5.39 | 4.7 13% | 7.5 -39% | 7.8 -45% | 5.05 6% | 4.9 9% |
| Colorchecker dE 2000 max. * | 7.98 | 8.1 -2% | 25.2 -216% | 24.1 -202% | 8.93 -12% | 11 -38% |
| Greyscale dE 2000 * | 5.25 | 5.8 -10% | 6.5 -24% | 7.3 -39% | 2.97 43% | 7.2 -37% |
| Gamma | 2.48 89% | 2.06 107% | 2.19 100% | 2.39 92% | 2.39 92% | 2.11 104% |
| CCT | 7609 85% | 6518 100% | 7852 83% | 5771 113% | 6466 101% | 6911 94% |
| Color Space (Percent of AdobeRGB 1998) | 38 | 58.7 54% | 37 -3% | 39.3 3% | 38 0% | 64.2 69% |
| Color Space (Percent of sRGB) | 60 | 90.1 50% | 57.9 -3% | 56.5 -6% | 59 -2% | 98.9 65% |
| Totaal Gemiddelde (Programma / Instellingen) | 21% /
28% | -17% /
-17% | -25% /
-19% | -13% /
3% | -16% /
23% |
* ... kleiner is beter
Responstijd Scherm
| ↔ Responstijd Zwart naar Wit | ||
|---|---|---|
| 13 ms ... stijging ↗ en daling ↘ gecombineerd | ↗ 10 ms stijging | 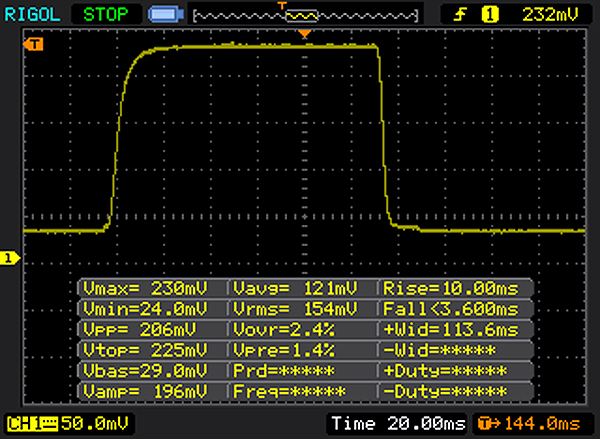 |
| ↘ 3 ms daling | ||
| Het scherm vertoonde prima responstijden in onze tests maar is misschien wat te traag voor competitieve games. Ter vergelijking: alle testtoestellen variëren van 0.1 (minimum) tot 240 (maximum) ms. » 28 % van alle toestellen zijn beter. Dit betekent dat de gemeten responstijd beter is dan het gemiddelde (21.5 ms) van alle geteste toestellen. | ||
| ↔ Responstijd 50% Grijs naar 80% Grijs | ||
| 44 ms ... stijging ↗ en daling ↘ gecombineerd | ↗ 25 ms stijging | 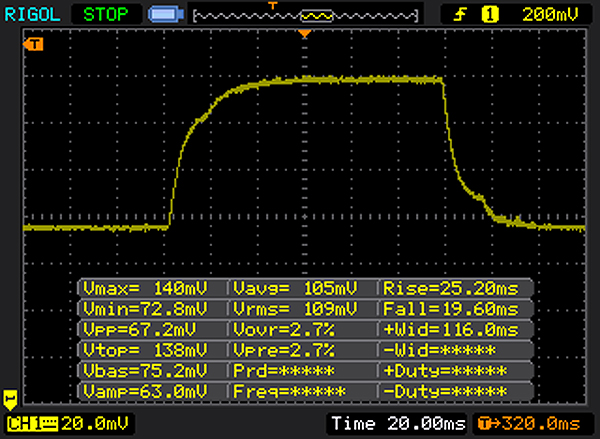 |
| ↘ 19 ms daling | ||
| Het scherm vertoonde trage responstijden in onze tests en is misschien te traag voor games. Ter vergelijking: alle testtoestellen variëren van 0.2 (minimum) tot 636 (maximum) ms. » 70 % van alle toestellen zijn beter. Dit betekent dat de gemeten responstijd slechter is dan het gemiddelde (33.7 ms) van alle geteste toestellen. | ||
Screen Flickering / PWM (Pulse-Width Modulation)
| Screen flickering / PWM waargenomen | 25000 Hz | ≤ 30 % helderheid instelling | 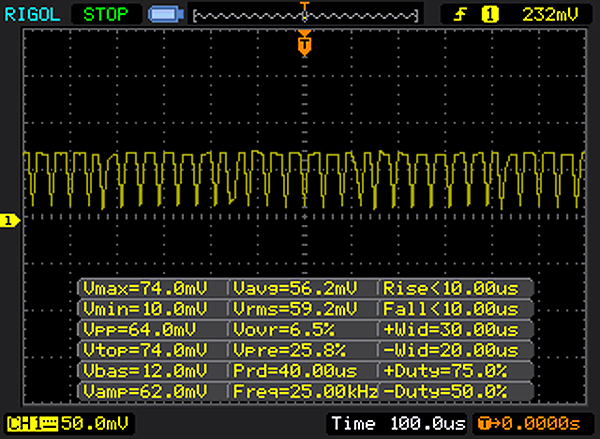 |
Het backlight van het scherm flikkert aan 25000 Hz (hoogstwaarschijnlijk met PWM - Pulse-Width Modulation) aan een helderheid van 30 % en lager. Boven deze helderheid zou er geen flickering / PWM mogen optreden. De frequentie van 25000 Hz is redelijk hoog en de meeste mensen die gevoelig zijn aan flickering zouden dit dus niet mogen waarnemen of geïrriteerde ogen krijgen. Ter vergelijking: 53 % van alle geteste toestellen maakten geen gebruik van PWM om de schermhelderheid te verlagen. Als het wel werd gebruikt, werd een gemiddelde van 17903 (minimum: 5 - maximum: 3846000) Hz waargenomen. | |||
| Cinebench R11.5 | |
| CPU Multi 64Bit | |
| Gigabyte Sabre 15G | |
| Asus VivoBook Pro 15 N580VD-DM028T | |
| HP Pavilion 15t-X7P42AV | |
| CPU Single 64Bit | |
| Gigabyte Sabre 15G | |
| HP Pavilion 15t-X7P42AV | |
| Asus VivoBook Pro 15 N580VD-DM028T | |
| Cinebench R10 | |
| Rendering Multiple CPUs 64Bit | |
| Asus VivoBook Pro 15 N580VD-DM028T | |
| Rendering Single CPUs 64Bit | |
| Asus VivoBook Pro 15 N580VD-DM028T | |
| PCMark 8 Home Score Accelerated v2 | 3833 punten | |
| PCMark 8 Work Score Accelerated v2 | 4934 punten | |
Help | ||
| Asus VivoBook Pro 15 N580VD-DM028T Micron 1100 MTFDDAV256TBN | Asus ZenBook Pro UX550VD Samsung PM961 NVMe MZVLW512HMJP | HP Pavilion 15t-X7P42AV Samsung CM871a MZNTY128HDHP | Acer Aspire VX15 VX5-591G-589S Hynix HFS128G39TND | Dell XPS 15 2017 9560 (7300HQ, Full-HD) WDC WD10SPCX-75KHST0 + SanDisk Z400s M.2 2242 32 GB Cache | |
|---|---|---|---|---|---|
| CrystalDiskMark 3.0 | 142% | 9% | -3% | -80% | |
| Read Seq | 483.9 | 1434 196% | 522 8% | 510 5% | 123 -75% |
| Write Seq | 408.3 | 1365 234% | 476.6 17% | 137.6 -66% | 74.2 -82% |
| Read 512 | 319 | 614 92% | 399.7 25% | 362.1 14% | 101.7 -68% |
| Write 512 | 346.7 | 688 98% | 185.4 -47% | 137.2 -60% | 42.51 -88% |
| Read 4k | 24.77 | 60.6 145% | 33.12 34% | 35.18 42% | 10.84 -56% |
| Write 4k | 79.4 | 158 99% | 89.8 13% | 104.8 32% | 1.021 -99% |
| Read 4k QD32 | 246.1 | 617 151% | 400.9 63% | 375.8 53% | 69.8 -72% |
| Write 4k QD32 | 241.5 | 525 117% | 140.2 -42% | 138.1 -43% | 1.057 -100% |

| 3DMark | |
| 1280x720 Cloud Gate Standard Graphics | |
| Dell XPS 15 2017 9560 (7300HQ, Full-HD) | |
| Gigabyte Sabre 15G | |
| HP Pavilion 15t-X7P42AV | |
| Asus VivoBook Pro 15 N580VD-DM028T | |
| Asus ZenBook Pro UX550VD | |
| 1920x1080 Fire Strike Graphics | |
| Dell XPS 15 2017 9560 (7300HQ, Full-HD) | |
| Gigabyte Sabre 15G | |
| HP Pavilion 15t-X7P42AV | |
| Asus ZenBook Pro UX550VD | |
| Asus VivoBook Pro 15 N580VD-DM028T | |
| 3DMark 11 Performance | 7558 punten | |
| 3DMark Cloud Gate Standard Score | 20059 punten | |
| 3DMark Fire Strike Score | 5452 punten | |
Help | ||
| The Witcher 3 | |
| 1024x768 Low Graphics & Postprocessing (sorteer op waarde) | |
| Asus VivoBook Pro 15 N580VD-DM028T | |
| HP Pavilion 15t-X7P42AV | |
| Dell XPS 15 2017 9560 (7300HQ, Full-HD) | |
| 1366x768 Medium Graphics & Postprocessing (sorteer op waarde) | |
| Asus VivoBook Pro 15 N580VD-DM028T | |
| Asus ZenBook Pro UX550VD | |
| HP Pavilion 15t-X7P42AV | |
| Dell XPS 15 2017 9560 (7300HQ, Full-HD) | |
| 1920x1080 High Graphics & Postprocessing (Nvidia HairWorks Off) (sorteer op waarde) | |
| Asus VivoBook Pro 15 N580VD-DM028T | |
| Asus ZenBook Pro UX550VD | |
| Gigabyte Sabre 15G | |
| HP Pavilion 15t-X7P42AV | |
| Dell XPS 15 2017 9560 (7300HQ, Full-HD) | |
| lage | gem. | hoge | ultra | |
| The Witcher 3 (2015) | 111.4 | 69.8 | 31.02 | 20 |
| Rise of the Tomb Raider (2016) | 124.2 | 69.3 | 39.12 | 31.59 |
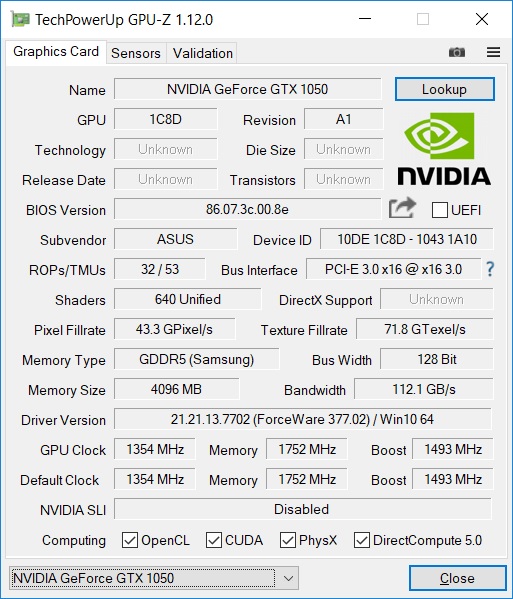
| Asus VivoBook Pro 15 N580VD-DM028T GeForce GTX 1050 Mobile, i7-7700HQ, Micron 1100 MTFDDAV256TBN | Asus ZenBook Pro UX550VD GeForce GTX 1050 Mobile, i7-7700HQ, Samsung PM961 NVMe MZVLW512HMJP | Gigabyte Sabre 15G GeForce GTX 1050 Mobile, i7-7700HQ, Liteonit CV3-8D128 | HP Pavilion 15t-X7P42AV GeForce GTX 1050 Mobile, i7-7700HQ, Samsung CM871a MZNTY128HDHP | Acer Aspire VX15 VX5-591G-589S GeForce GTX 1050 Mobile, i5-7300HQ, Hynix HFS128G39TND | Dell XPS 15 2017 9560 (7300HQ, Full-HD) GeForce GTX 1050 Mobile, i5-7300HQ, WDC WD10SPCX-75KHST0 + SanDisk Z400s M.2 2242 32 GB Cache | |
|---|---|---|---|---|---|---|
| Noise | 7% | -7% | -5% | 7% | -6% | |
| uit / omgeving * | 30.5 | 29.4 4% | 28.2 8% | 29.3 4% | 30 2% | 30.3 1% |
| Idle Minimum * | 30.6 | 29.4 4% | 33 -8% | 32.3 -6% | 30 2% | 31.6 -3% |
| Idle Average * | 30.9 | 29.9 3% | 33.3 -8% | 32.3 -5% | 30 3% | 31.6 -2% |
| Idle Maximum * | 31.9 | 29.9 6% | 34.7 -9% | 32.4 -2% | 31.1 3% | 33.4 -5% |
| Load Average * | 38.6 | 38.3 1% | 44.5 -15% | 44.4 -15% | 31.3 19% | 47.8 -24% |
| Witcher 3 ultra * | 47.3 | 39.8 16% | 49.2 -4% | |||
| Load Maximum * | 45.7 | 39.6 13% | 52.8 -16% | 49.2 -8% | 38.9 15% | 47.8 -5% |
* ... kleiner is beter
Geluidsniveau
| Onbelast |
| 30.6 / 30.9 / 31.9 dB (A) |
| HDD |
| 30.9 dB (A) |
| Belasting |
| 38.6 / 45.7 dB (A) |
 | ||
30 dB stil 40 dB(A) hoorbaar 50 dB(A) luid |
||
min: | ||
(±) De maximumtemperatuur aan de bovenzijde bedraagt 41.8 °C / 107 F, vergeleken met het gemiddelde van 36.9 °C / 98 F, variërend van 21.1 tot 71 °C voor de klasse Multimedia.
(+) De bodem warmt op tot een maximum van 36.8 °C / 98 F, vergeleken met een gemiddelde van 39.1 °C / 102 F
(+) Bij onbelast gebruik bedraagt de gemiddelde temperatuur voor de bovenzijde 25.2 °C / 77 F, vergeleken met het apparaatgemiddelde van 31.2 °C / 88 F.
(-) Bij het spelen van The Witcher 3 is de gemiddelde temperatuur voor de bovenzijde 38.8 °C / 102 F, vergeleken met het apparaatgemiddelde van 31.2 °C / 88 F.
(+) De handpalmsteunen en het touchpad bereiken maximaal de huidtemperatuur (34.8 °C / 94.6 F) en zijn dus niet heet.
(-) De gemiddelde temperatuur van de handpalmsteun van soortgelijke toestellen bedroeg 28.8 °C / 83.8 F (-6 °C / -10.8 F).
| Asus VivoBook Pro 15 N580VD-DM028T GeForce GTX 1050 Mobile, i7-7700HQ, Micron 1100 MTFDDAV256TBN | Asus ZenBook Pro UX550VD GeForce GTX 1050 Mobile, i7-7700HQ, Samsung PM961 NVMe MZVLW512HMJP | Gigabyte Sabre 15G GeForce GTX 1050 Mobile, i7-7700HQ, Liteonit CV3-8D128 | HP Pavilion 15t-X7P42AV GeForce GTX 1050 Mobile, i7-7700HQ, Samsung CM871a MZNTY128HDHP | Acer Aspire VX15 VX5-591G-589S GeForce GTX 1050 Mobile, i5-7300HQ, Hynix HFS128G39TND | Dell XPS 15 2017 9560 (7300HQ, Full-HD) GeForce GTX 1050 Mobile, i5-7300HQ, WDC WD10SPCX-75KHST0 + SanDisk Z400s M.2 2242 32 GB Cache | |
|---|---|---|---|---|---|---|
| Heat | -9% | -8% | 6% | -16% | -14% | |
| Maximum Upper Side * | 41.8 | 43.6 -4% | 43.6 -4% | 41.8 -0% | 47.2 -13% | 47.6 -14% |
| Maximum Bottom * | 36.8 | 44.5 -21% | 40.2 -9% | 33.4 9% | 42.2 -15% | 42.1 -14% |
| Idle Upper Side * | 26.2 | 28 -7% | 27.8 -6% | 24.4 7% | 31.8 -21% | 29.9 -14% |
| Idle Bottom * | 25.9 | 26.7 -3% | 29.2 -13% | 23.8 8% | 29.5 -14% | 29.8 -15% |
* ... kleiner is beter
Asus VivoBook Pro 15 N580VD-DM028T audioanalyse
(-) | niet erg luide luidsprekers (71.6 dB)
Bas 100 - 315 Hz
(±) | verminderde zeebaars - gemiddeld 10.1% lager dan de mediaan
(±) | lineariteit van de lage tonen is gemiddeld (11.8% delta ten opzichte van de vorige frequentie)
Mids 400 - 2000 Hz
(+) | evenwichtige middens - slechts 1.6% verwijderd van de mediaan
(+) | de middentonen zijn lineair (4.9% delta ten opzichte van de vorige frequentie)
Hoog 2 - 16 kHz
(+) | evenwichtige hoogtepunten - slechts 1.3% verwijderd van de mediaan
(+) | de hoge tonen zijn lineair (3% delta naar de vorige frequentie)
Algemeen 100 - 16.000 Hz
(+) | het totale geluid is lineair (9.3% verschil met de mediaan)
Vergeleken met dezelfde klasse
» 8% van alle geteste apparaten in deze klasse waren beter, 0% vergelijkbaar, 92% slechter
» De beste had een delta van 5%, het gemiddelde was 18%, de slechtste was 45%
Vergeleken met alle geteste toestellen
» 2% van alle geteste apparaten waren beter, 1% gelijk, 97% slechter
» De beste had een delta van 4%, het gemiddelde was 25%, de slechtste was 134%
Apple MacBook 12 (Early 2016) 1.1 GHz audioanalyse
(+) | luidsprekers kunnen relatief luid spelen (83.6 dB)
Bas 100 - 315 Hz
(±) | verminderde zeebaars - gemiddeld 11.3% lager dan de mediaan
(±) | lineariteit van de lage tonen is gemiddeld (14.2% delta ten opzichte van de vorige frequentie)
Mids 400 - 2000 Hz
(+) | evenwichtige middens - slechts 2.4% verwijderd van de mediaan
(+) | de middentonen zijn lineair (5.5% delta ten opzichte van de vorige frequentie)
Hoog 2 - 16 kHz
(+) | evenwichtige hoogtepunten - slechts 2% verwijderd van de mediaan
(+) | de hoge tonen zijn lineair (4.5% delta naar de vorige frequentie)
Algemeen 100 - 16.000 Hz
(+) | het totale geluid is lineair (10.2% verschil met de mediaan)
Vergeleken met dezelfde klasse
» 5% van alle geteste apparaten in deze klasse waren beter, 2% vergelijkbaar, 93% slechter
» De beste had een delta van 5%, het gemiddelde was 19%, de slechtste was 53%
Vergeleken met alle geteste toestellen
» 3% van alle geteste apparaten waren beter, 1% gelijk, 96% slechter
» De beste had een delta van 4%, het gemiddelde was 25%, de slechtste was 134%
| Uit / Standby | |
| Inactief | |
| Belasting |
|
| Asus VivoBook Pro 15 N580VD-DM028T i7-7700HQ, GeForce GTX 1050 Mobile, Micron 1100 MTFDDAV256TBN, TN, 1920x1080, 15.60 | Asus ZenBook Pro UX550VD i7-7700HQ, GeForce GTX 1050 Mobile, Samsung PM961 NVMe MZVLW512HMJP, IPS, 1920x1080, 15.60 | Gigabyte Sabre 15G i7-7700HQ, GeForce GTX 1050 Mobile, Liteonit CV3-8D128, IPS, 1920x1080, 15.60 | HP Pavilion 15t-X7P42AV i7-7700HQ, GeForce GTX 1050 Mobile, Samsung CM871a MZNTY128HDHP, IPS, 1920x1080, 15.60 | Acer Aspire VX15 VX5-591G-589S i5-7300HQ, GeForce GTX 1050 Mobile, Hynix HFS128G39TND, IPS, 1920x1080, 15.60 | Dell XPS 15 2017 9560 (7300HQ, Full-HD) i5-7300HQ, GeForce GTX 1050 Mobile, WDC WD10SPCX-75KHST0 + SanDisk Z400s M.2 2242 32 GB Cache, LED IGZO IPS InfinityEdge, 1920x1080, 15.60 | |
|---|---|---|---|---|---|---|
| Power Consumption | -2% | -14% | -19% | -27% | -12% | |
| Idle Minimum * | 4.7 | 5.05 -7% | 8 -70% | 8.29 -76% | 8.4 -79% | 6.6 -40% |
| Idle Average * | 7.7 | 8.2 -6% | 10.9 -42% | 8.9 -16% | 13.1 -70% | 9 -17% |
| Idle Maximum * | 10.9 | 12.2 -12% | 11 -1% | 10.2 6% | 14.2 -30% | 10.7 2% |
| Load Average * | 82 | 82 -0% | 76.7 6% | 77.1 6% | 50 39% | 77.5 5% |
| Witcher 3 ultra * | 109 | 93.1 15% | 94.9 13% | |||
| Load Maximum * | 120 | 120 -0% | 106.4 11% | 136.6 -14% | 111 7% | 130 -8% |
* ... kleiner is beter
| Asus VivoBook Pro 15 N580VD-DM028T i7-7700HQ, GeForce GTX 1050 Mobile, 47 Wh | Asus ZenBook Pro UX550VD i7-7700HQ, GeForce GTX 1050 Mobile, 73 Wh | Gigabyte Sabre 15G i7-7700HQ, GeForce GTX 1050 Mobile, 47 Wh | HP Pavilion 15t-X7P42AV i7-7700HQ, GeForce GTX 1050 Mobile, 63.3 Wh | Acer Aspire VX15 VX5-591G-589S i5-7300HQ, GeForce GTX 1050 Mobile, 52.5 Wh | Dell XPS 15 2017 9560 (7300HQ, Full-HD) i5-7300HQ, GeForce GTX 1050 Mobile, 56 Wh | |
|---|---|---|---|---|---|---|
| Batterijduur | 32% | -19% | 32% | -16% | -7% | |
| Reader / Idle | 609 | 1061 74% | 493 -19% | 961 58% | 565 -7% | |
| H.264 | 352 | 465 32% | ||||
| WiFi v1.3 | 392 | 535 36% | 261 -33% | 389 -1% | 330 -16% | 334 -15% |
| Load | 82 | 70 -15% | 77 -6% | 115 40% | 84 2% | |
| Witcher 3 ultra | 68 |
Pro
Contra
Voor het volledige, Engelse testrapport, klik hier.
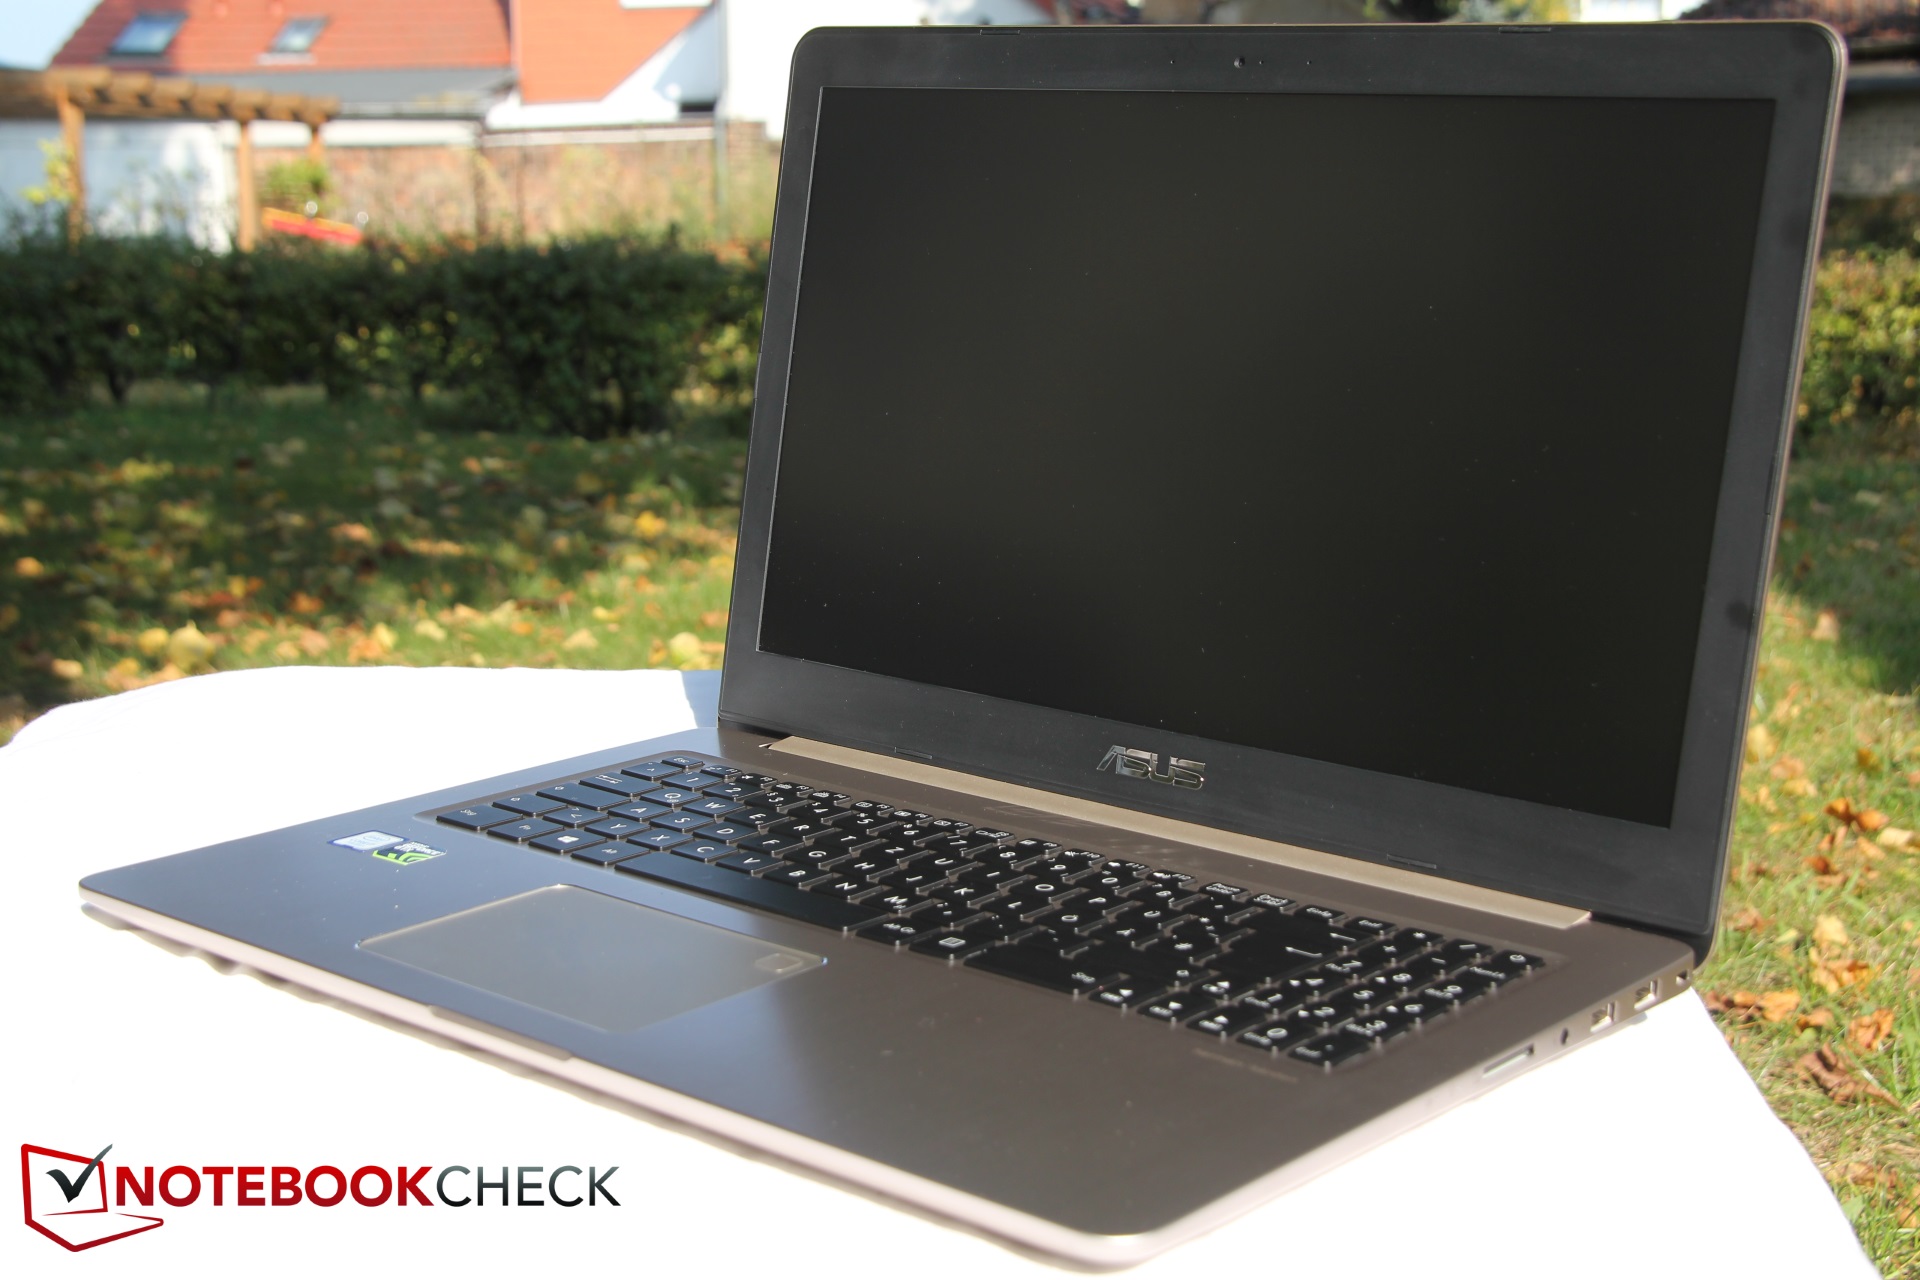
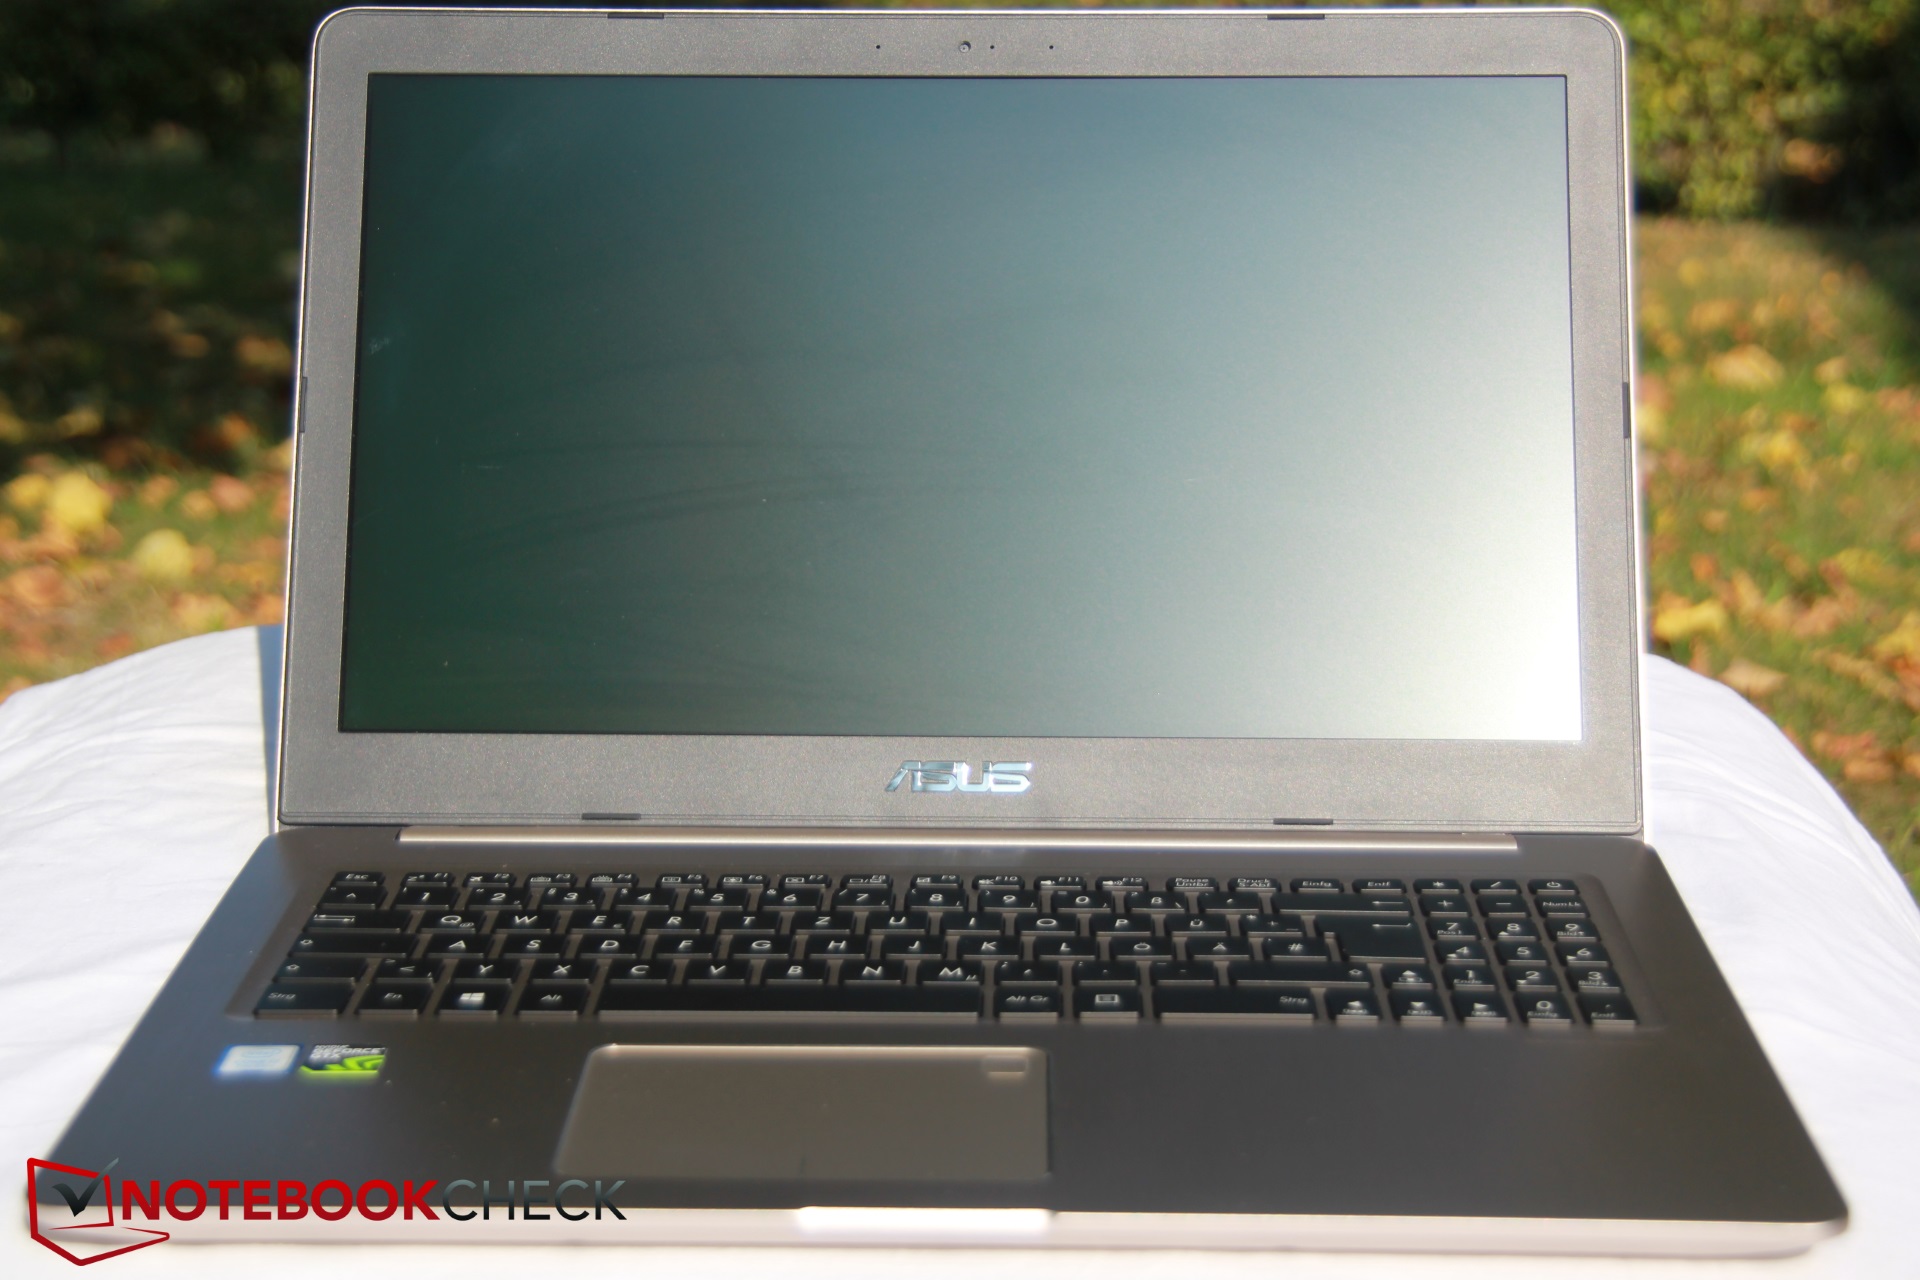
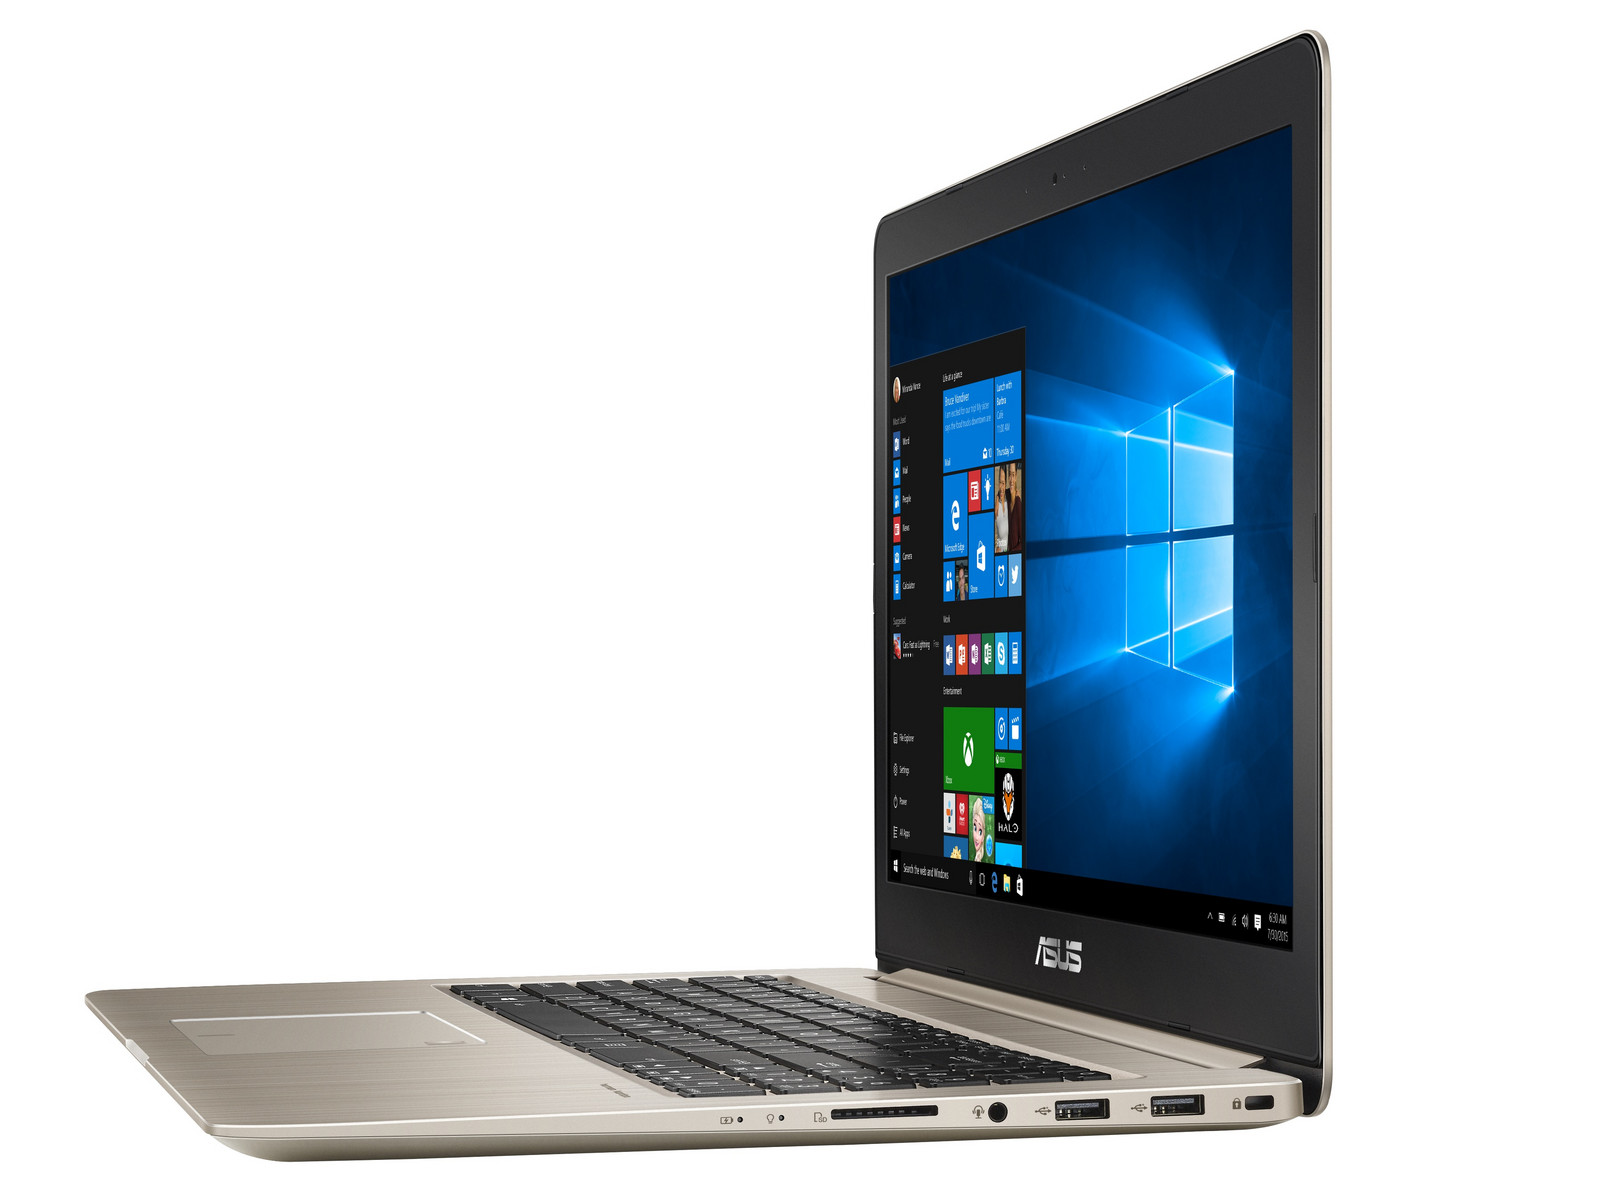
De Asus VivoBook Pro 15 heeft een elegante behuizing en maakt indruk met stille ventilatoren bij lage belasting, een handzaam gewicht, goede luidsprekers en effectief temperatuurbeheer.
We hebben op dit moment moeite de VivoBook een aanbeveling te geven, vanwege extreme prestatiebeperkingen op accustroom, pulserende ventilator en omdat het apparaat soms uitvalt. Al deze problemen kunnen met updates verhopen worden. Echter, ook het beeldscherm en het aanbod van poorten valt tegen. Het blijft een van de duurdere modellen.
Momenteel wordt het totaalbeeld vooral gevormd door de negatieve aspecten. Het is lijkt niet een probleem met de hardware te zijn, maar eerder een firmware probleem. Asus zou dit snel moeten rechtzetten zodat de VivoBook een goede laptop kan zijn. Ook vinden we de prijs aan de hoge kant; sommige concurrenten zijn minder duur.
De Asus VivoBook Pro 15 wordt geplaagd door uitval, wachttijden, extreme prestatiebeperkingen op accustroom en een pulserende ventilator. Ook valt het TN beeldscherm tegen en is de hoge prijs niet gerechtvaardigd.
Asus VivoBook Pro 15 N580VD-DM028T
-
09-10-2017 v6(old)
Christian Hintze
Pricecompare
