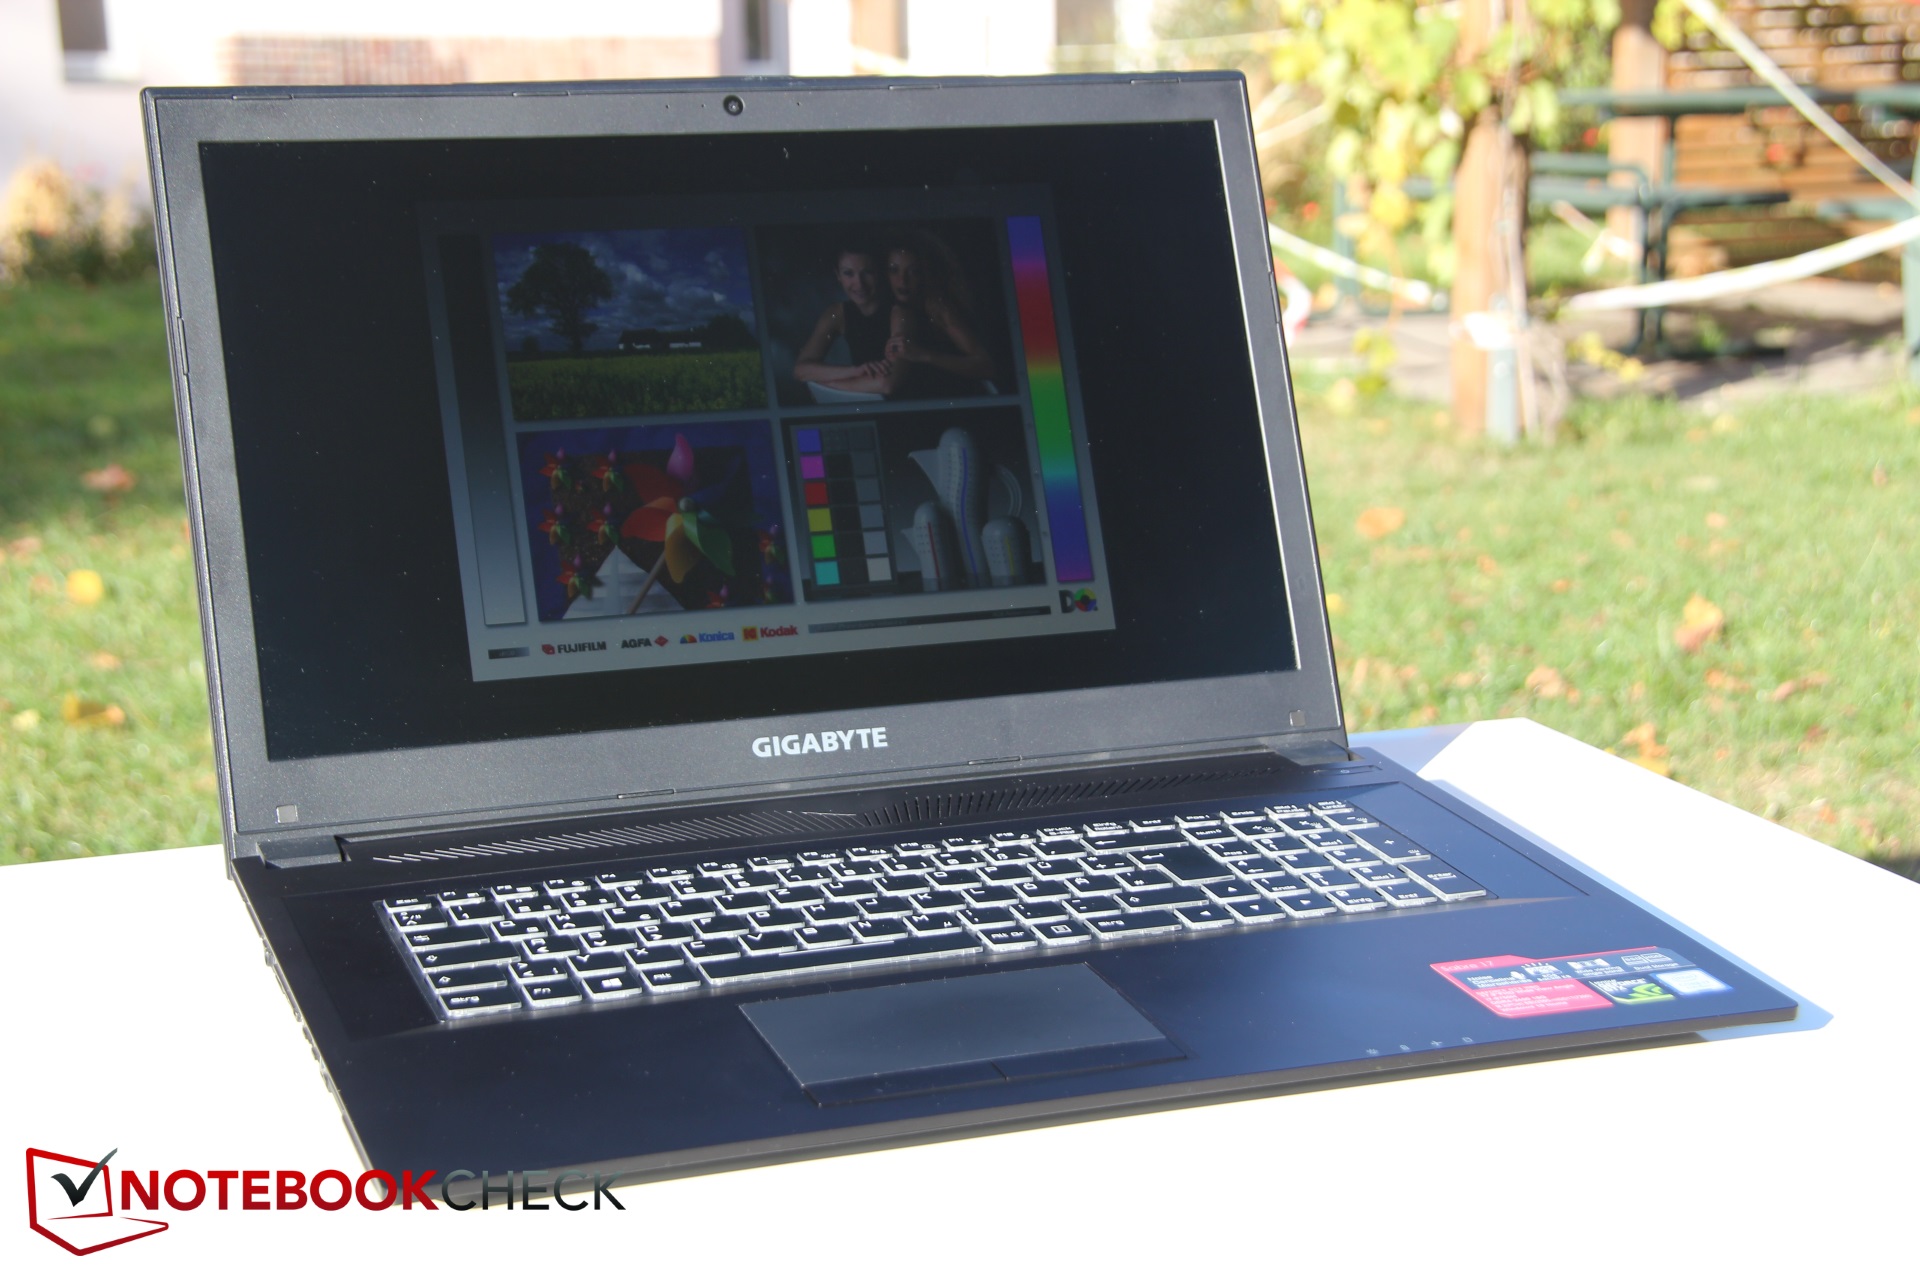
Kort testrapport Gigabyte Sabre 17 (i7-8750H, GTX 1060) Laptop
| SD Card Reader | |
| average JPG Copy Test (av. of 3 runs) | |
| Gemiddelde van klas Multimedia (23 - 531, n=43, laatste 2 jaar) | |
| Asus Strix GL703GM-DS74 (Toshiba Exceria Pro SDXC 64 GB UHS-II) | |
| Gigabyte Sabre 17-W8 (Toshiba Exceria Pro SDXC 64 GB UHS-II) | |
| Razer Blade Pro RZ09-0220 (Toshiba Exceria Pro SDXC 64 GB UHS-II) | |
| MSI GP72VR 7RFX (Toshiba Exceria Pro SDXC 64 GB UHS-II) | |
| maximum AS SSD Seq Read Test (1GB) | |
| Gemiddelde van klas Multimedia (27.9 - 1455, n=42, laatste 2 jaar) | |
| Asus Strix GL703GM-DS74 (Toshiba Exceria Pro SDXC 64 GB UHS-II) | |
| Gigabyte Sabre 17-W8 (Toshiba Exceria Pro SDXC 64 GB UHS-II) | |
| Razer Blade Pro RZ09-0220 (Toshiba Exceria Pro SDXC 64 GB UHS-II) | |
| MSI GP72VR 7RFX (Toshiba Exceria Pro SDXC 64 GB UHS-II) | |
| Networking | |
| iperf3 transmit AX12 | |
| Asus TUF FX705GM | |
| Razer Blade Pro RZ09-0220 | |
| Asus Strix GL703GM-DS74 | |
| Gigabyte Sabre 17-W8 | |
| MSI GP72VR 7RFX | |
| iperf3 receive AX12 | |
| Asus TUF FX705GM | |
| Asus Strix GL703GM-DS74 | |
| Razer Blade Pro RZ09-0220 | |
| Gigabyte Sabre 17-W8 | |
| MSI GP72VR 7RFX | |
| |||||||||||||||||||||||||
Helderheidsverdeling: 82 %
Helderheid in Batterij-modus: 327 cd/m²
Contrast: 1207:1 (Zwart: 0.27 cd/m²)
ΔE ColorChecker Calman: 9.11 | ∀{0.5-29.43 Ø4.73}
calibrated: 2.62
ΔE Greyscale Calman: 11.17 | ∀{0.09-98 Ø4.97}
100% sRGB (Argyll 1.6.3 3D)
76% AdobeRGB 1998 (Argyll 1.6.3 3D)
85.1% AdobeRGB 1998 (Argyll 3D)
100% sRGB (Argyll 3D)
89.9% Display P3 (Argyll 3D)
Gamma: 2.28
CCT: 12475 K
| Gigabyte Sabre 17-W8 Chi Mei CMN1747, , 1920x1080, 17.3" | Asus TUF FX705GM AU Optronics B173HAN04.0 (AUO409D), , 1920x1080, 17.3" | Asus Strix GL703GM-DS74 Chi Mei CMN1747 M173JJE-G32, , 1920x1080, 17.3" | Razer Blade Pro RZ09-0220 ID: AUO169D, Name: AU Optronics B173HAN01.6, , 1920x1080, 17.3" | MSI GP72VR 7RFX CMN1747, , 1920x1080, 17.3" | |
|---|---|---|---|---|---|
| Display | -22% | 0% | -21% | 1% | |
| Display P3 Coverage (%) | 89.9 | 62.4 -31% | 90 0% | 64 -29% | 89.9 0% |
| sRGB Coverage (%) | 100 | 88.8 -11% | 100 0% | 89.7 -10% | 99.7 0% |
| AdobeRGB 1998 Coverage (%) | 85.1 | 63.8 -25% | 84.8 0% | 64.9 -24% | 86.5 2% |
| Response Times | -4% | 5% | -337% | -79% | |
| Response Time Grey 50% / Grey 80% * (ms) | 9 ? | 7.4 ? 18% | 8.8 ? 2% | 36.8 ? -309% | 21.6 ? -140% |
| Response Time Black / White * (ms) | 8 ? | 10 ? -25% | 7.4 ? 7% | 37.2 ? -365% | 9.4 ? -18% |
| PWM Frequency (Hz) | 25000 ? | 25510 ? | 25000 ? | ||
| Screen | 18% | 10% | 13% | -72% | |
| Brightness middle (cd/m²) | 326 | 234 -28% | 297.8 -9% | 367.4 13% | 309 -5% |
| Brightness (cd/m²) | 309 | 228 -26% | 285 -8% | 363 17% | 290 -6% |
| Brightness Distribution (%) | 82 | 85 4% | 84 2% | 86 5% | 88 7% |
| Black Level * (cd/m²) | 0.27 | 0.2 26% | 0.33 -22% | 0.32 -19% | 0.22 19% |
| Contrast (:1) | 1207 | 1170 -3% | 902 -25% | 1148 -5% | 1405 16% |
| Colorchecker dE 2000 * | 9.11 | 2.16 76% | 3.68 60% | 3.8 58% | 7.2 21% |
| Colorchecker dE 2000 max. * | 14.14 | 3.39 76% | 7.71 45% | 10.4 26% | 12.8 9% |
| Colorchecker dE 2000 calibrated * | 2.62 | 2.02 23% | 2.71 -3% | ||
| Greyscale dE 2000 * | 11.17 | 2 82% | 5 55% | 3.5 69% | 98 -777% |
| Gamma | 2.28 96% | 2.46 89% | 2.06 107% | 2.18 101% | 1.96 112% |
| CCT | 12475 52% | 6394 102% | 6728 97% | 6467 101% | 10963 59% |
| Color Space (Percent of AdobeRGB 1998) (%) | 76 | 58 -24% | 84.77 12% | 58.1 -24% | 77 1% |
| Color Space (Percent of sRGB) (%) | 100 | 89 -11% | 99.97 0% | 89.3 -11% | 100 0% |
| Totaal Gemiddelde (Programma / Instellingen) | -3% /
8% | 5% /
7% | -115% /
-41% | -50% /
-58% |
* ... kleiner is beter
Responstijd Scherm
| ↔ Responstijd Zwart naar Wit | ||
|---|---|---|
| 8 ms ... stijging ↗ en daling ↘ gecombineerd | ↗ 6 ms stijging | 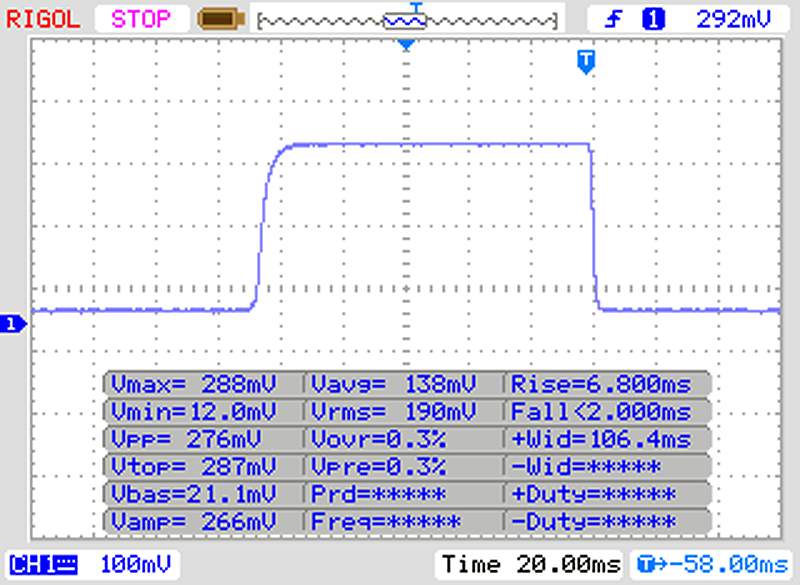 |
| ↘ 2 ms daling | ||
| Het scherm vertoonde snelle responstijden in onze tests en zou geschikt moeten zijn voor games. Ter vergelijking: alle testtoestellen variëren van 0.1 (minimum) tot 240 (maximum) ms. » 22 % van alle toestellen zijn beter. Dit betekent dat de gemeten responstijd beter is dan het gemiddelde (19.9 ms) van alle geteste toestellen. | ||
| ↔ Responstijd 50% Grijs naar 80% Grijs | ||
| 9 ms ... stijging ↗ en daling ↘ gecombineerd | ↗ 5 ms stijging | 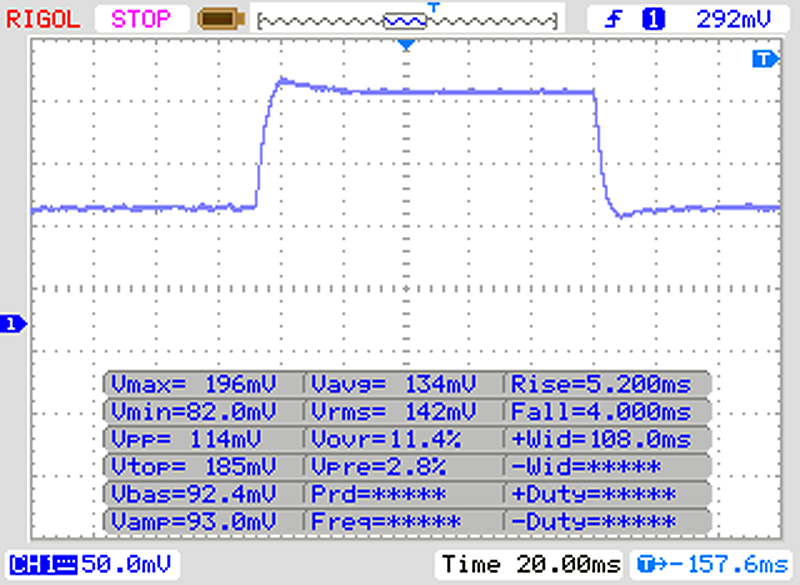 |
| ↘ 4 ms daling | ||
| Het scherm vertoonde snelle responstijden in onze tests en zou geschikt moeten zijn voor games. Ter vergelijking: alle testtoestellen variëren van 0.165 (minimum) tot 636 (maximum) ms. » 22 % van alle toestellen zijn beter. Dit betekent dat de gemeten responstijd beter is dan het gemiddelde (31.1 ms) van alle geteste toestellen. | ||
Screen Flickering / PWM (Pulse-Width Modulation)
| Screen flickering / PWM waargenomen | 25000 Hz | ≤ 20 % helderheid instelling | 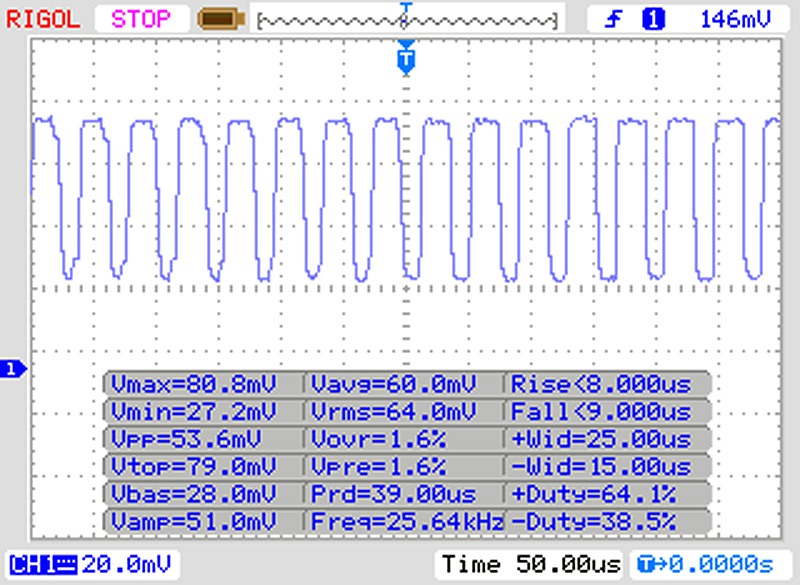 |
De achtergrondverlichting van het scherm flikkert op 25000 Hz (in het slechtste geval, bijvoorbeeld bij gebruik van PWM) aan een helderheid van 20 % en lager. Boven deze helderheid zou er geen flickering / PWM mogen optreden. De frequentie van 25000 Hz is redelijk hoog en de meeste mensen die gevoelig zijn aan flickering zouden dit dus niet mogen waarnemen of geïrriteerde ogen krijgen. Ter vergelijking: 52 % van alle geteste toestellen maakten geen gebruik van PWM om de schermhelderheid te verlagen. Als het wel werd gebruikt, werd een gemiddelde van 7791 (minimum: 5 - maximum: 343500) Hz waargenomen. | |||
| Cinebench R10 | |
| Rendering Single CPUs 64Bit | |
| Gigabyte Sabre 17-W8 | |
| Gemiddeld Intel Core i7-8750H (8472 - 8665, n=5) | |
| Rendering Multiple CPUs 64Bit | |
| Gigabyte Sabre 17-W8 | |
| Gemiddeld Intel Core i7-8750H (33944 - 46384, n=5) | |
| PCMark 8 Home Score Accelerated v2 | 4231 punten | |
| PCMark 8 Work Score Accelerated v2 | 5340 punten | |
| PCMark 10 Score | 5049 punten | |
Help | ||
| Gigabyte Sabre 17-W8 Toshiba NVMe THNSN5256GPU7 | Asus TUF FX705GM WDC PC SN520 SDAPNUW-256G | Asus Strix GL703GM-DS74 Samsung PM961 MZVLW256HEHP | Razer Blade Pro RZ09-0220 Samsung SSD PM951 MZVLV256HCHP | MSI GP72VR 7RFX Samsung SM961 MZVKW512HMJP m.2 PCI-e | Gemiddeld Toshiba NVMe THNSN5256GPU7 | |
|---|---|---|---|---|---|---|
| CrystalDiskMark 5.2 / 6 | 9% | 2% | -3% | 51% | 11% | |
| Write 4K (MB/s) | 104.7 | 104.2 0% | 87.8 -16% | 155.1 48% | 186 78% | 107.5 ? 3% |
| Read 4K (MB/s) | 37.39 | 41.46 11% | 38.41 3% | 44.22 18% | 55.6 49% | 38.8 ? 4% |
| Write Seq (MB/s) | 866 | 1295 50% | 1177 36% | 311.2 -64% | 1599 85% | 625 ? -28% |
| Read Seq (MB/s) | 944 | 1325 40% | 868 -8% | 1247 32% | 999 6% | 733 ? -22% |
| Write 4K Q32T1 (MB/s) | 293.3 | 282.8 -4% | 266.5 -9% | 310.3 6% | 493.3 68% | 466 ? 59% |
| Read 4K Q32T1 (MB/s) | 374.3 | 321.3 -14% | 307.1 -18% | 551 47% | 556 49% | 636 ? 70% |
| Write Seq Q32T1 (MB/s) | 1064 | 1301 22% | 1212 14% | 311.5 -71% | 1674 57% | 1109 ? 4% |
| Read Seq Q32T1 (MB/s) | 2616 | 1704 -35% | 3006 15% | 1560 -40% | 3083 18% | 2504 ? -4% |

| 3DMark 11 Performance | 12678 punten | |
| 3DMark Cloud Gate Standard Score | 30202 punten | |
| 3DMark Fire Strike Score | 10404 punten | |
Help | ||
The Witcher 3 framerate graph
| The Witcher 3 | |
| 1024x768 Low Graphics & Postprocessing | |
| Asus Strix GL703GM-DS74 | |
| Gemiddeld NVIDIA GeForce GTX 1060 Mobile (130.2 - 207, n=17) | |
| Gemiddelde van klas Multimedia (68 - 380, n=10, laatste 2 jaar) | |
| Gigabyte Sabre 17-W8 | |
| 1366x768 Medium Graphics & Postprocessing | |
| Asus Strix GL703GM-DS74 | |
| Gemiddeld NVIDIA GeForce GTX 1060 Mobile (91.7 - 138.7, n=16) | |
| Gigabyte Sabre 17-W8 | |
| Gemiddelde van klas Multimedia (41 - 93, n=4, laatste 2 jaar) | |
| 1920x1080 High Graphics & Postprocessing (Nvidia HairWorks Off) | |
| Gemiddelde van klas Multimedia (22 - 224, n=13, laatste 2 jaar) | |
| Gemiddeld NVIDIA GeForce GTX 1060 Mobile (52.6 - 80.6, n=49) | |
| Razer Blade Pro RZ09-0220 | |
| Asus TUF FX705GM | |
| Asus Strix GL703GM-DS74 | |
| Gigabyte Sabre 17-W8 | |
| 1920x1080 Ultra Graphics & Postprocessing (HBAO+) | |
| Gemiddelde van klas Multimedia (11 - 121, n=13, laatste 2 jaar) | |
| Asus Strix GL703GM-DS74 | |
| MSI GP72VR 7RFX | |
| Gemiddeld NVIDIA GeForce GTX 1060 Mobile (24 - 42.3, n=60) | |
| Razer Blade Pro RZ09-0220 | |
| Asus TUF FX705GM | |
| Gigabyte Sabre 17-W8 | |
| Rise of the Tomb Raider | |
| 1024x768 Lowest Preset | |
| Asus Strix GL703GM-DS74 | |
| Gemiddeld NVIDIA GeForce GTX 1060 Mobile (105.7 - 203, n=15) | |
| Gigabyte Sabre 17-W8 | |
| 1366x768 Medium Preset AF:2x | |
| Asus Strix GL703GM-DS74 | |
| Gemiddeld NVIDIA GeForce GTX 1060 Mobile (82.2 - 140, n=14) | |
| Gigabyte Sabre 17-W8 | |
| 1920x1080 High Preset AA:FX AF:4x | |
| Asus Strix GL703GM-DS74 | |
| Gigabyte Sabre 17-W8 | |
| Gemiddeld NVIDIA GeForce GTX 1060 Mobile (65.3 - 82, n=24) | |
| Razer Blade Pro RZ09-0220 | |
| 1920x1080 Very High Preset AA:FX AF:16x | |
| Asus Strix GL703GM-DS74 | |
| Gemiddeld NVIDIA GeForce GTX 1060 Mobile (51 - 68.8, n=37) | |
| Gigabyte Sabre 17-W8 | |
| Razer Blade Pro RZ09-0220 | |
| Doom | |
| 1280x720 Low Preset | |
| Gemiddeld NVIDIA GeForce GTX 1060 Mobile (121.4 - 155.3, n=3) | |
| Gigabyte Sabre 17-W8 | |
| 1366x768 Medium Preset | |
| Gemiddeld NVIDIA GeForce GTX 1060 Mobile (115.5 - 146.4, n=3) | |
| Gigabyte Sabre 17-W8 | |
| 1920x1080 Medium Preset | |
| Gemiddeld NVIDIA GeForce GTX 1060 Mobile (72.3 - 110, n=3) | |
| Gigabyte Sabre 17-W8 | |
| 1920x1080 High Preset AA:FX | |
| Gemiddeld NVIDIA GeForce GTX 1060 Mobile (68.6 - 102.2, n=6) | |
| Gigabyte Sabre 17-W8 | |
| 1920x1080 Ultra Preset AA:SM | |
| Gemiddeld NVIDIA GeForce GTX 1060 Mobile (66 - 103.3, n=17) | |
| Gigabyte Sabre 17-W8 | |
| lage | gem. | hoge | ultra | |
|---|---|---|---|---|
| The Witcher 3 (2015) | 131.3 | 91.7 | 53.9 | 24 |
| Rise of the Tomb Raider (2016) | 113.4 | 82.2 | 74.4 | 60.9 |
| Doom (2016) | 121.4 | 115.5 | 68.6 | 66 |
| Gigabyte Sabre 17-W8 GeForce GTX 1060 Mobile, i7-8750H, Toshiba NVMe THNSN5256GPU7 | Asus TUF FX705GM GeForce GTX 1060 Mobile, i7-8750H, WDC PC SN520 SDAPNUW-256G | Asus Strix GL703GM-DS74 GeForce GTX 1060 Mobile, i7-8750H, Samsung PM961 MZVLW256HEHP | Razer Blade Pro RZ09-0220 GeForce GTX 1060 Mobile, i7-7700HQ, Samsung SSD PM951 MZVLV256HCHP | MSI GP72VR 7RFX GeForce GTX 1060 Mobile, i7-7700HQ, Samsung SM961 MZVKW512HMJP m.2 PCI-e | |
|---|---|---|---|---|---|
| Noise | -7% | 4% | 9% | 2% | |
| uit / omgeving * (dB) | 30.5 | 29 5% | 28.6 6% | 28.1 8% | 28.3 7% |
| Idle Minimum * (dB) | 32.1 | 32 -0% | 29.4 8% | 29.5 8% | 29.2 9% |
| Idle Average * (dB) | 32.1 | 33 -3% | 29.4 8% | 29.6 8% | 29.2 9% |
| Idle Maximum * (dB) | 32.3 | 44 -36% | 33.7 -4% | 29.6 8% | 37 -15% |
| Load Average * (dB) | 42.9 | 46 -7% | 41.2 4% | 31.6 26% | 43.7 -2% |
| Load Maximum * (dB) | 48.8 | 50 -2% | 48.3 1% | 51.8 -6% | 46.4 5% |
| Witcher 3 ultra * (dB) | 48 | 47.3 | 46 | 45.7 |
* ... kleiner is beter
Geluidsniveau
| Onbelast |
| 32.1 / 32.1 / 32.3 dB (A) |
| HDD |
| 32.4 dB (A) |
| Belasting |
| 42.9 / 48.8 dB (A) |
 | ||
30 dB stil 40 dB(A) hoorbaar 50 dB(A) luid |
||
min: | ||
| Gigabyte Sabre 17-W8 GeForce GTX 1060 Mobile, i7-8750H, Toshiba NVMe THNSN5256GPU7 | Asus TUF FX705GM GeForce GTX 1060 Mobile, i7-8750H, WDC PC SN520 SDAPNUW-256G | Asus Strix GL703GM-DS74 GeForce GTX 1060 Mobile, i7-8750H, Samsung PM961 MZVLW256HEHP | Razer Blade Pro RZ09-0220 GeForce GTX 1060 Mobile, i7-7700HQ, Samsung SSD PM951 MZVLV256HCHP | MSI GP72VR 7RFX GeForce GTX 1060 Mobile, i7-7700HQ, Samsung SM961 MZVKW512HMJP m.2 PCI-e | |
|---|---|---|---|---|---|
| Heat | -27% | -27% | -8% | -35% | |
| Maximum Upper Side * (°C) | 35 | 54 -54% | 54.6 -56% | 48.2 -38% | 53.8 -54% |
| Maximum Bottom * (°C) | 34.3 | 53 -55% | 41.2 -20% | 43.2 -26% | 52.2 -52% |
| Idle Upper Side * (°C) | 30.1 | 30 -0% | 35 -16% | 25.4 16% | 37.2 -24% |
| Idle Bottom * (°C) | 30.5 | 30 2% | 35.2 -15% | 25.8 15% | 34 -11% |
* ... kleiner is beter
(+) De maximumtemperatuur aan de bovenzijde bedraagt 35 °C / 95 F, vergeleken met het gemiddelde van 36.8 °C / 98 F, variërend van 21 tot 71 °C voor de klasse Multimedia.
(+) De bodem warmt op tot een maximum van 34.3 °C / 94 F, vergeleken met een gemiddelde van 39.1 °C / 102 F
(+) Bij onbelast gebruik bedraagt de gemiddelde temperatuur voor de bovenzijde 27.8 °C / 82 F, vergeleken met het apparaatgemiddelde van 31.3 °C / 88 F.
(+) De handpalmsteunen en het touchpad bereiken maximaal de huidtemperatuur (34.6 °C / 94.3 F) en zijn dus niet heet.
(-) De gemiddelde temperatuur van de handpalmsteun van soortgelijke toestellen bedroeg 28.7 °C / 83.7 F (-5.9 °C / -10.6 F).
Gigabyte Sabre 17-W8 audioanalyse
(-) | niet erg luide luidsprekers (69.2 dB)
Bas 100 - 315 Hz
(-) | bijna geen lage tonen - gemiddeld 25.8% lager dan de mediaan
(±) | lineariteit van de lage tonen is gemiddeld (8.6% delta ten opzichte van de vorige frequentie)
Midden 400 - 2000 Hz
(±) | hogere middens - gemiddeld 8.1% hoger dan de mediaan
(±) | lineariteit van de middentonen is gemiddeld (12.8% delta ten opzichte van de vorige frequentie)
Hoog 2 - 16 kHz
(±) | higher highs - on average 7.7% higher than median
(-) | hoogten zijn niet lineair (15.3% delta tot vorige frequentie)
Algemeen 100 - 16.000 Hz
(-) | het totale geluid is niet lineair (35.6% verschil met de mediaan)
Vergeleken met dezelfde klasse
» 98% van alle geteste apparaten in deze klasse waren beter, 0% vergelijkbaar, 1% slechter
» De beste had een delta van 5%, het gemiddelde was 17%, de slechtste was 45%
Vergeleken met alle geteste toestellen
» 94% van alle geteste apparaten waren beter, 1% gelijk, 6% slechter
» De beste had een delta van 4%, het gemiddelde was 24%, de slechtste was 134%
Asus TUF FX705GM audioanalyse
(±) | luidspreker luidheid is gemiddeld maar goed (76 dB)
Bas 100 - 315 Hz
(-) | bijna geen lage tonen - gemiddeld 16.1% lager dan de mediaan
(±) | lineariteit van de lage tonen is gemiddeld (11.5% delta ten opzichte van de vorige frequentie)
Midden 400 - 2000 Hz
(+) | evenwichtige middens - slechts 4% verwijderd van de mediaan
(+) | de middentonen zijn lineair (5.7% delta ten opzichte van de vorige frequentie)
Hoog 2 - 16 kHz
(±) | higher highs - on average 5.1% higher than median
(+) | de hoge tonen zijn lineair (4.6% delta naar de vorige frequentie)
Algemeen 100 - 16.000 Hz
(±) | lineariteit van het totale geluid is gemiddeld (21.6% verschil met de mediaan)
Vergeleken met dezelfde klasse
» 77% van alle geteste apparaten in deze klasse waren beter, 5% vergelijkbaar, 18% slechter
» De beste had een delta van 6%, het gemiddelde was 18%, de slechtste was 132%
Vergeleken met alle geteste toestellen
» 61% van alle geteste apparaten waren beter, 7% gelijk, 32% slechter
» De beste had een delta van 4%, het gemiddelde was 24%, de slechtste was 134%
| Uit / Standby | |
| Inactief | |
| Belasting |
|
Key:
min: | |
| Gigabyte Sabre 17-W8 i7-8750H, GeForce GTX 1060 Mobile, Toshiba NVMe THNSN5256GPU7, TN, 1920x1080, 17.3" | Asus TUF FX705GM i7-8750H, GeForce GTX 1060 Mobile, WDC PC SN520 SDAPNUW-256G, IPS, 1920x1080, 17.3" | Asus Strix GL703GM-DS74 i7-8750H, GeForce GTX 1060 Mobile, Samsung PM961 MZVLW256HEHP, TN LED, 1920x1080, 17.3" | Razer Blade Pro RZ09-0220 i7-7700HQ, GeForce GTX 1060 Mobile, Samsung SSD PM951 MZVLV256HCHP, IPS, 1920x1080, 17.3" | MSI GP72VR 7RFX i7-7700HQ, GeForce GTX 1060 Mobile, Samsung SM961 MZVKW512HMJP m.2 PCI-e, TN LED, 1920x1080, 17.3" | Gemiddeld NVIDIA GeForce GTX 1060 Mobile | Gemiddelde van klas Multimedia | |
|---|---|---|---|---|---|---|---|
| Power Consumption | -26% | -54% | -1% | -31% | -17% | 30% | |
| Idle Minimum * (Watt) | 9.3 | 13 -40% | 18.88 -103% | 10.6 -14% | 17.3 -86% | 12.7 ? -37% | 5.71 ? 39% |
| Idle Average * (Watt) | 14.8 | 17 -15% | 24.36 -65% | 16 -8% | 22.5 -52% | 17.5 ? -18% | 10.1 ? 32% |
| Idle Maximum * (Watt) | 22 | 24 -9% | 32.27 -47% | 16.4 25% | 22.5 -2% | 21.8 ? 1% | 12.4 ? 44% |
| Load Average * (Watt) | 63 | 106 -68% | 107.74 -71% | 75.9 -20% | 85.1 -35% | 91.7 ? -46% | 65 ? -3% |
| Load Maximum * (Watt) | 187 | 179 4% | 160.28 14% | 163.8 12% | 151.3 19% | 156.4 ? 16% | 112.2 ? 40% |
| Witcher 3 ultra * (Watt) | 151 | 142 | 111.2 | 141.7 |
* ... kleiner is beter
| Gigabyte Sabre 17-W8 i7-8750H, GeForce GTX 1060 Mobile, 62 Wh | Asus TUF FX705GM i7-8750H, GeForce GTX 1060 Mobile, 64 Wh | Asus Strix GL703GM-DS74 i7-8750H, GeForce GTX 1060 Mobile, 74 Wh | Razer Blade Pro RZ09-0220 i7-7700HQ, GeForce GTX 1060 Mobile, 70 Wh | MSI GP72VR 7RFX i7-7700HQ, GeForce GTX 1060 Mobile, 41 Wh | Gemiddelde van klas Multimedia | |
|---|---|---|---|---|---|---|
| Battery Runtime | ||||||
| WiFi Websurfing (h) | 5.4 | 4.5 -17% | 3.6 -33% | 7 30% | 2.1 -61% | 12 ? 122% |
| Batterijduur | -5% | -19% | 30% | 27% | 165% | |
| Reader / Idle (h) | 6.9 | 6.3 -9% | 5.3 -23% | 12 74% | 0.7 -90% | 25.2 ? 265% |
| H.264 (h) | 5.3 | 4.3 -19% | 16.4 ? 209% | |||
| Load (h) | 1.4 | 1.6 14% | 1.2 -14% | 1.2 -14% | 3.4 143% | 1.675 ? 20% |
| Totaal Gemiddelde (Programma / Instellingen) | -11% /
-8% | -26% /
-23% | 30% /
30% | -17% /
-3% | 144% /
154% |
Pro
Contra
Dit is de verkorte versie van het originele artikel. Het volledige, Engelse testrapport vind je hier.
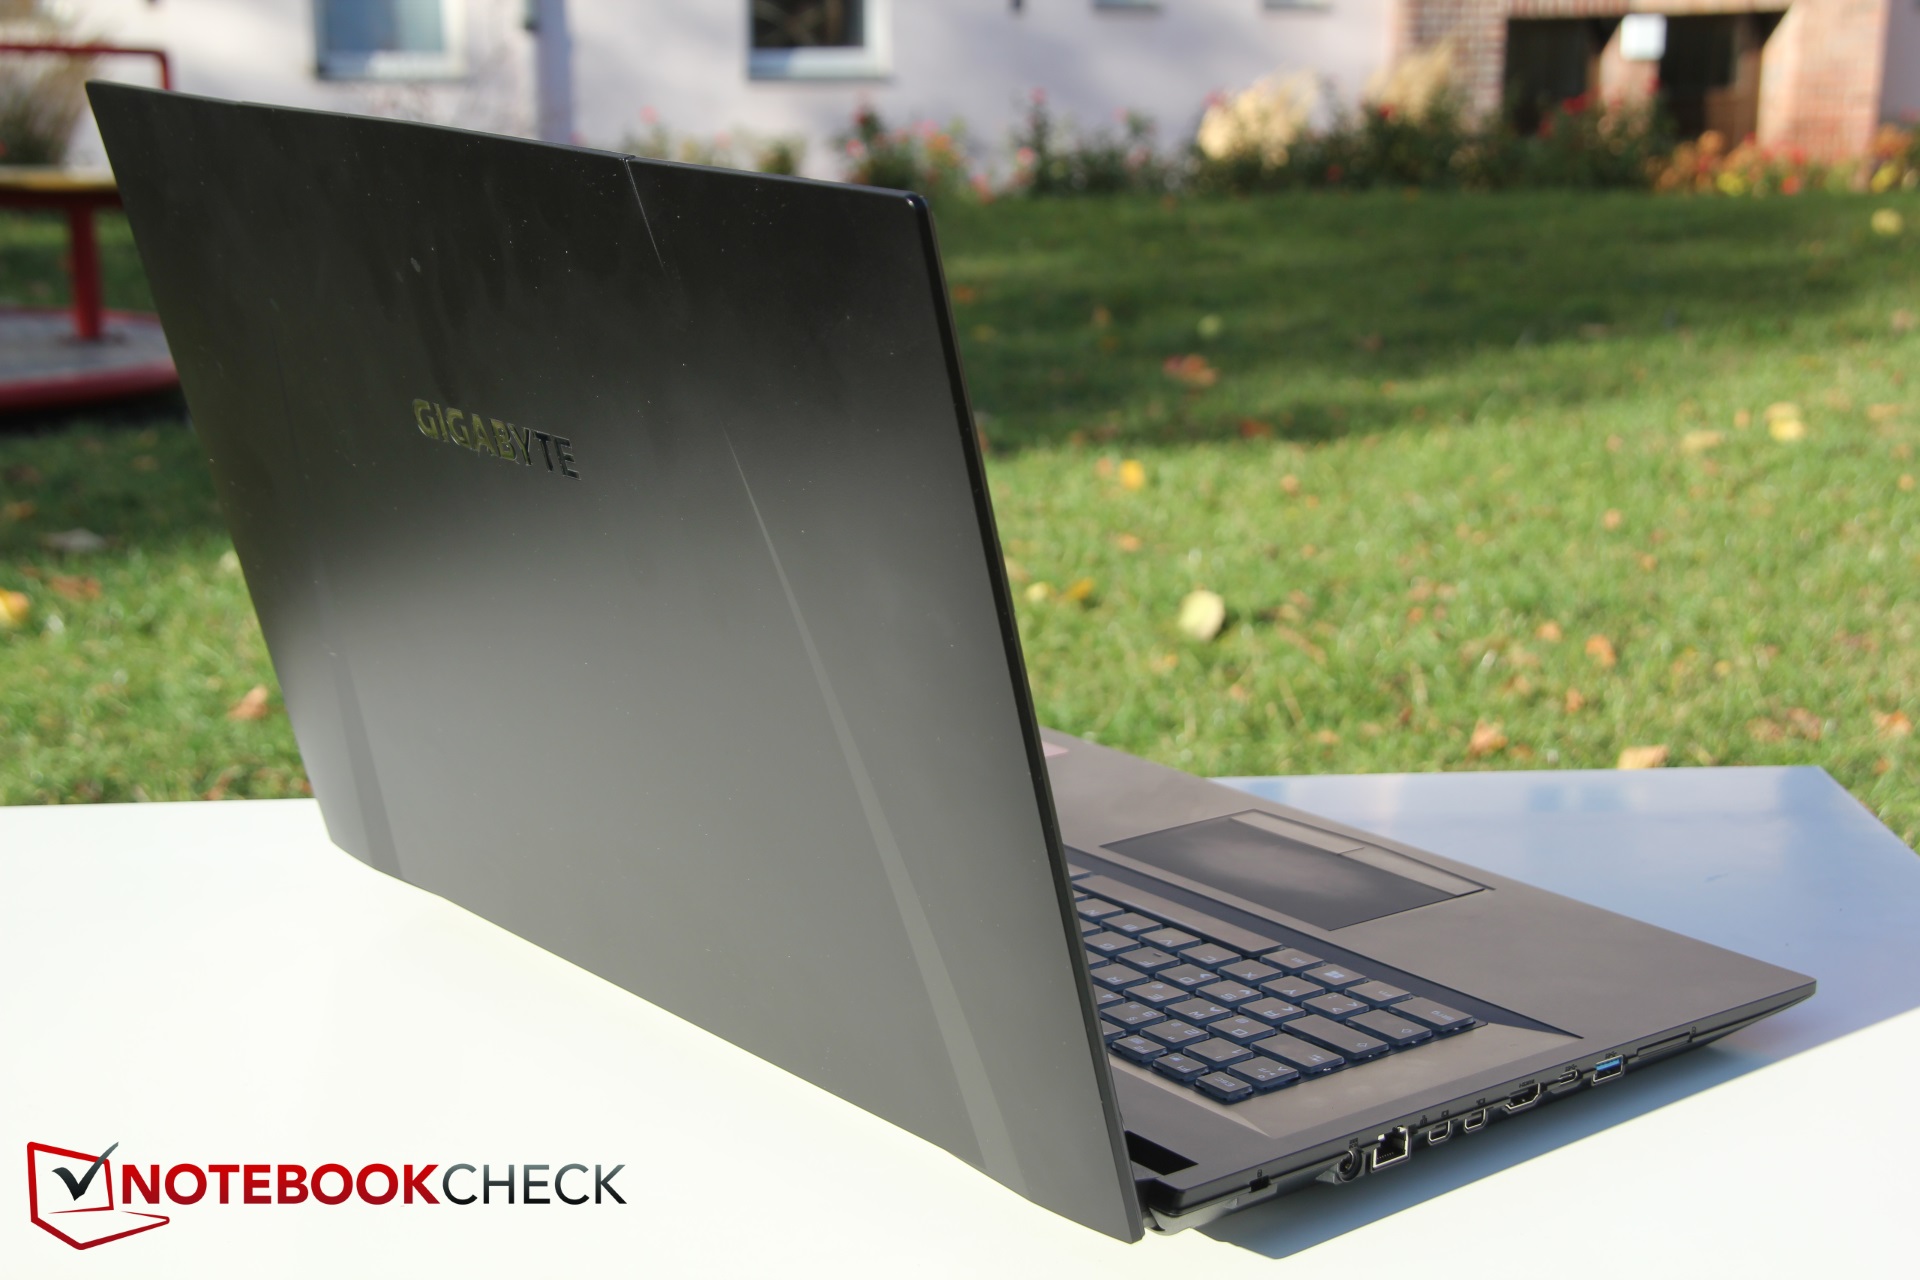
Al met al is de Gigabyte Sabre 17 WV8 een goede desktopvervanger die bijna alle taken goed aankan. Veel wordt goed gedaan, maar op een cruciaal vlak struikelt het notebook - game prestaties.
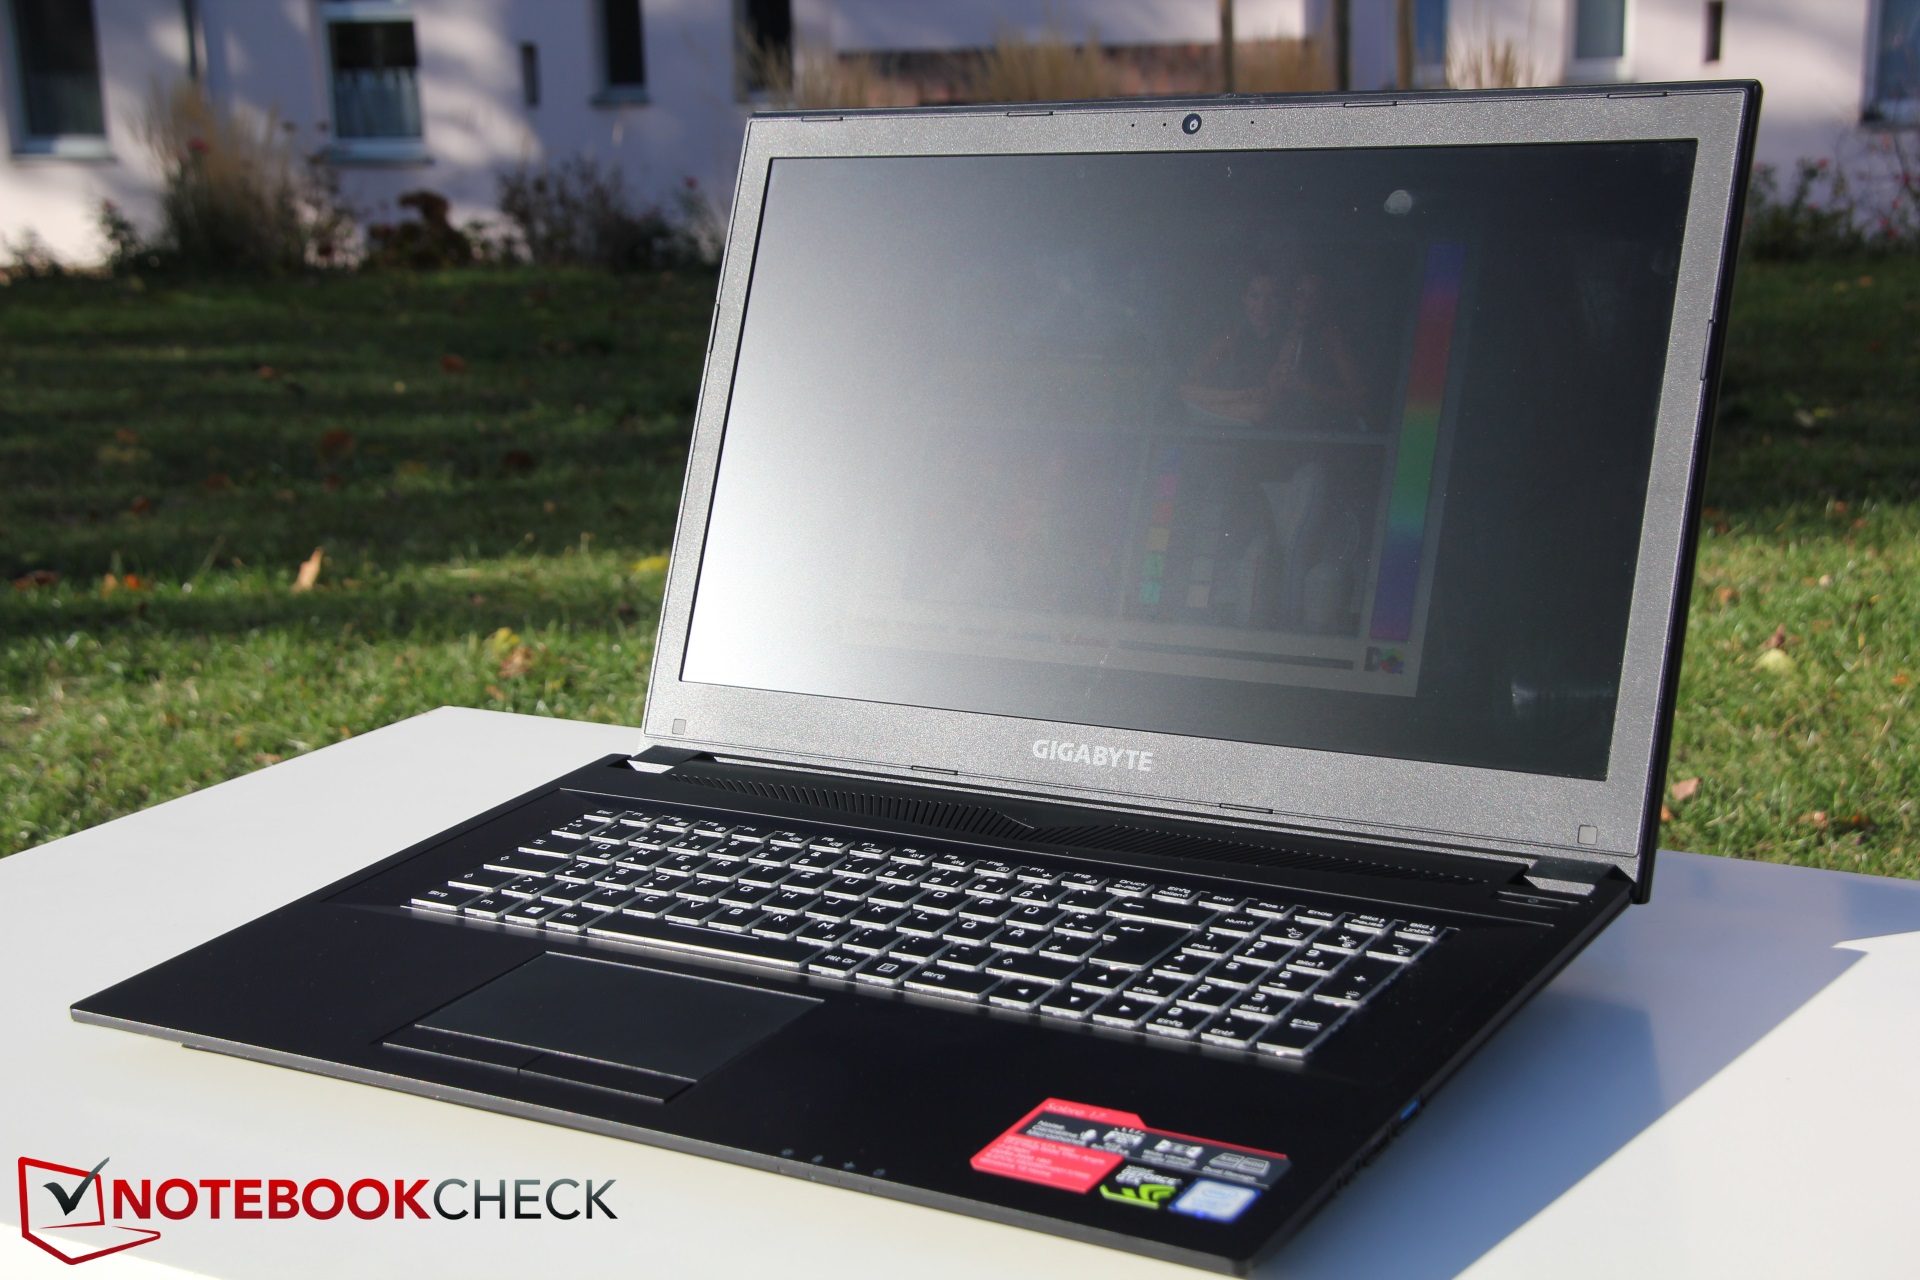
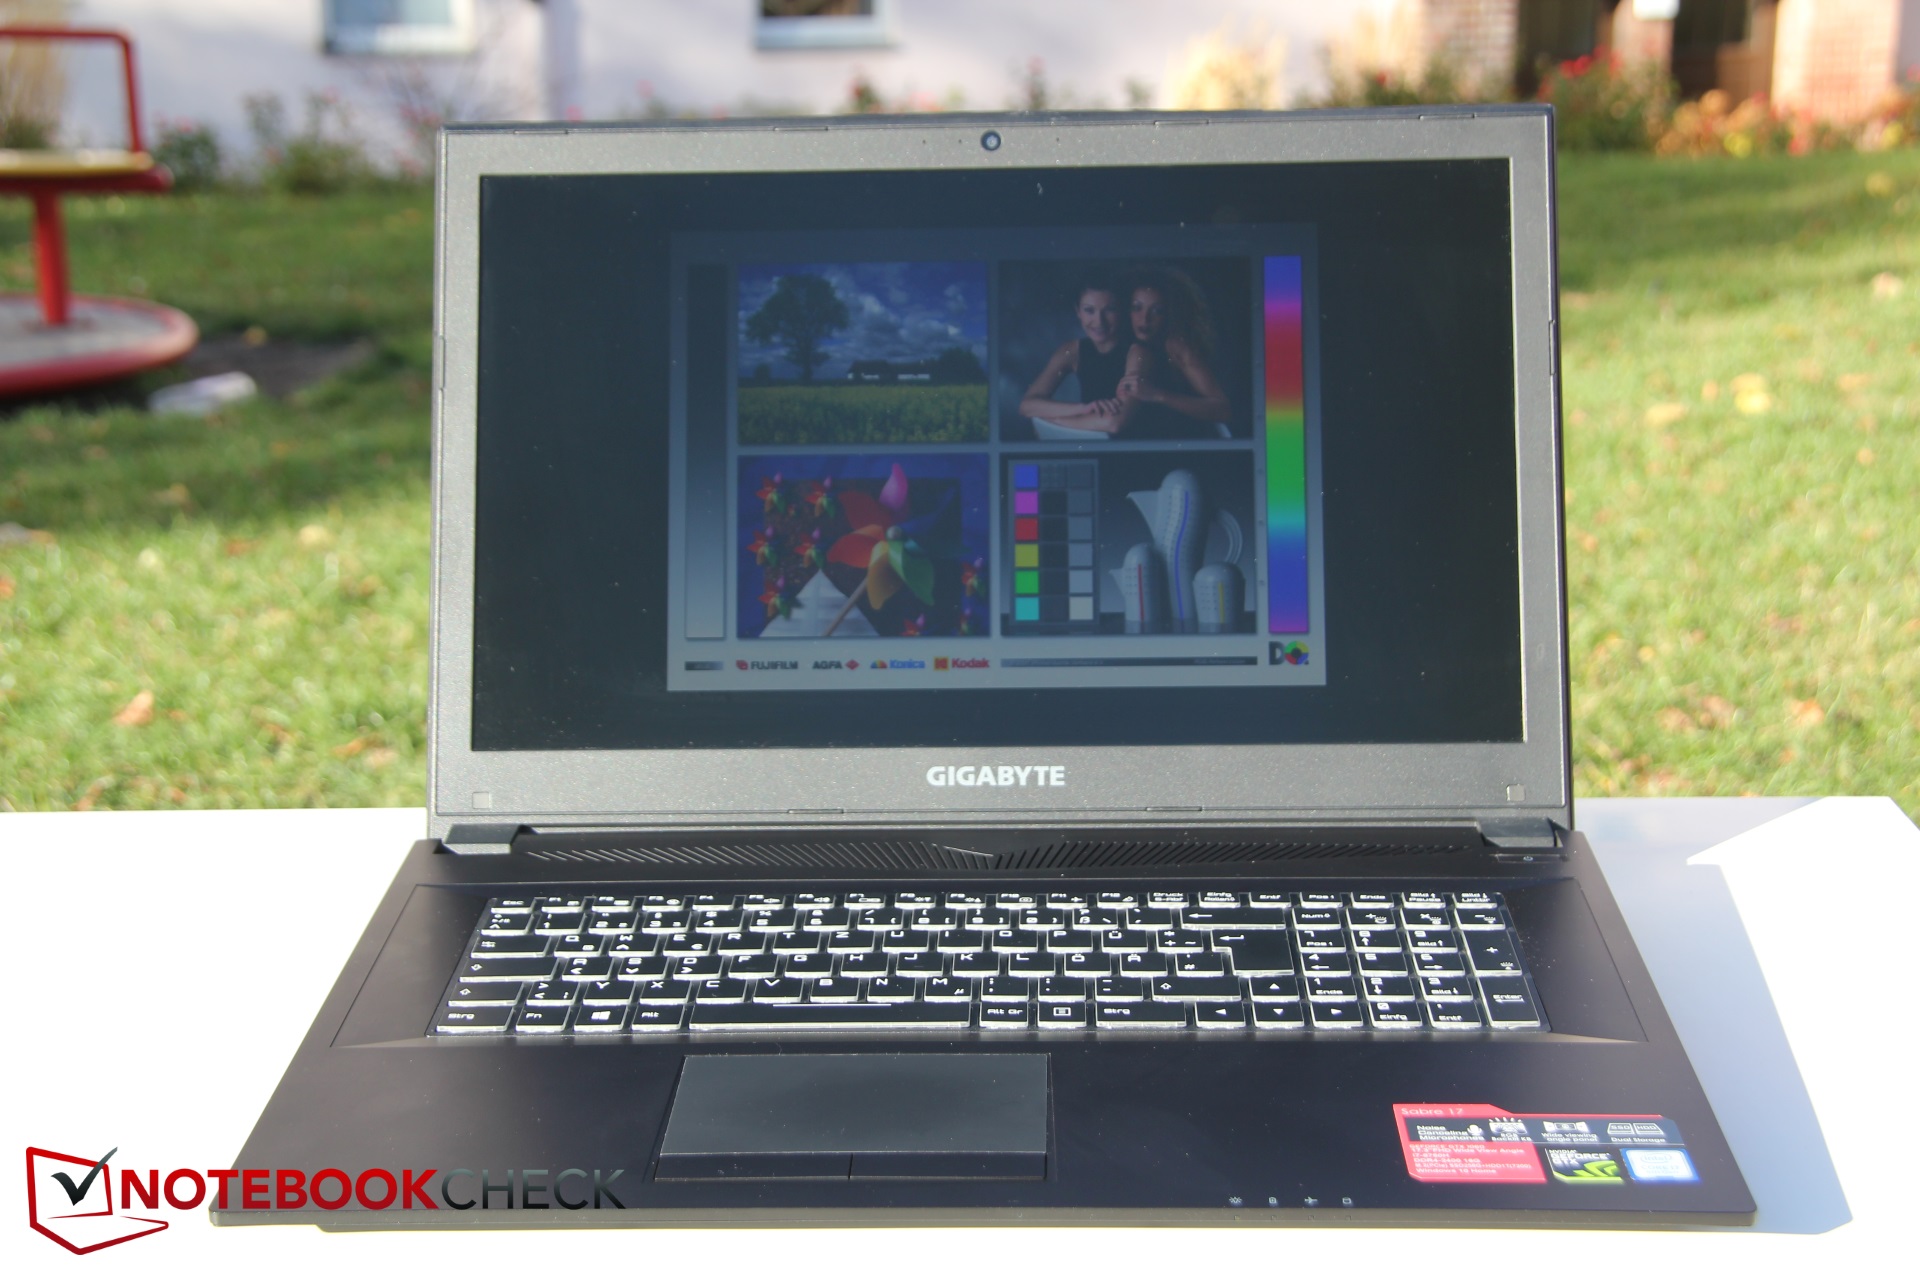
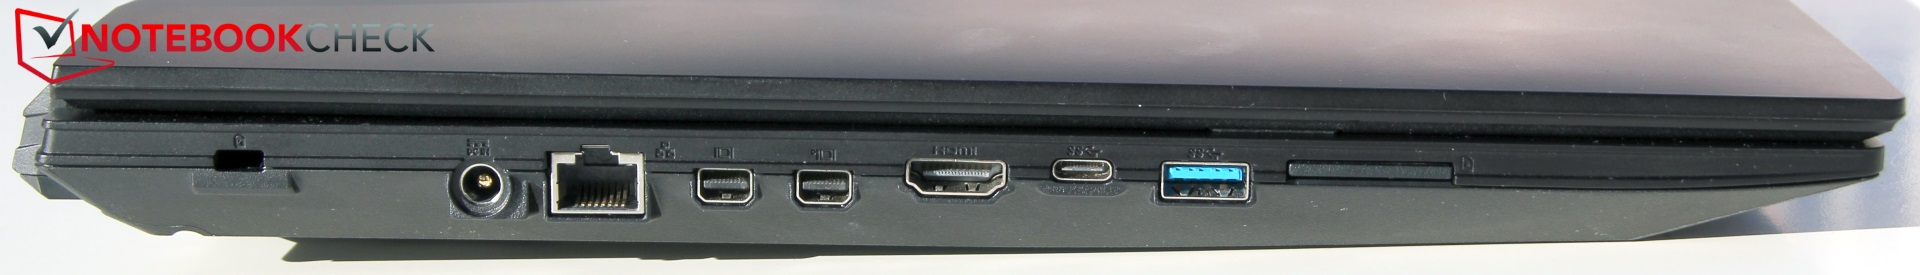
Het beeldscherm is duidelijk ontworpen voor gamen en heeft erg goede responstijden, al zullen gebruikers daardoor het wel zonder levendige kleuren moeten doen. Op bijna alle vlakken scoort de laptop erg hoog - behalve qua gamen, waar de directe concurrentie het beter doet. De Sabre laat de concurrentie op andere vlakken achter zich, bijvoorbeeld in de Cinebench benchmarks. Ook het energieverbruik is goed. Zelfs onder belasting blijft de Gigabyte altijd stil en koel. En extra punten worden gehaald met de batterijduur. De vele aansluitingen voor externe monitoren zijn ook een prettige feature.
De Sabre verdient kritiek op zijn zwakke game prestaties en de blikkerige, te stille luidsprekers. De Sabre 17 lijkt onnodig punten te laten liggen op deze vlakken. Het notebook kan gekocht worden voor ongeveer € 1500.
Potentiële kopers op zoek naar een stil, koel en relatief energiezuinige desktopvervanger zullen de Sabre 17 waarderen. Maar als game prestaties de hoogste prioriteit hebben, kun je beter verder kijken.
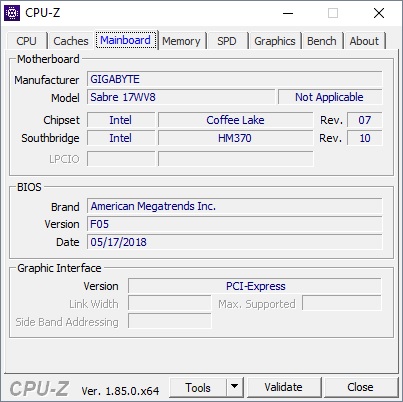
Gigabyte Sabre 17-W8
- 01-11-2018 v6 (old)
Christian Hintze