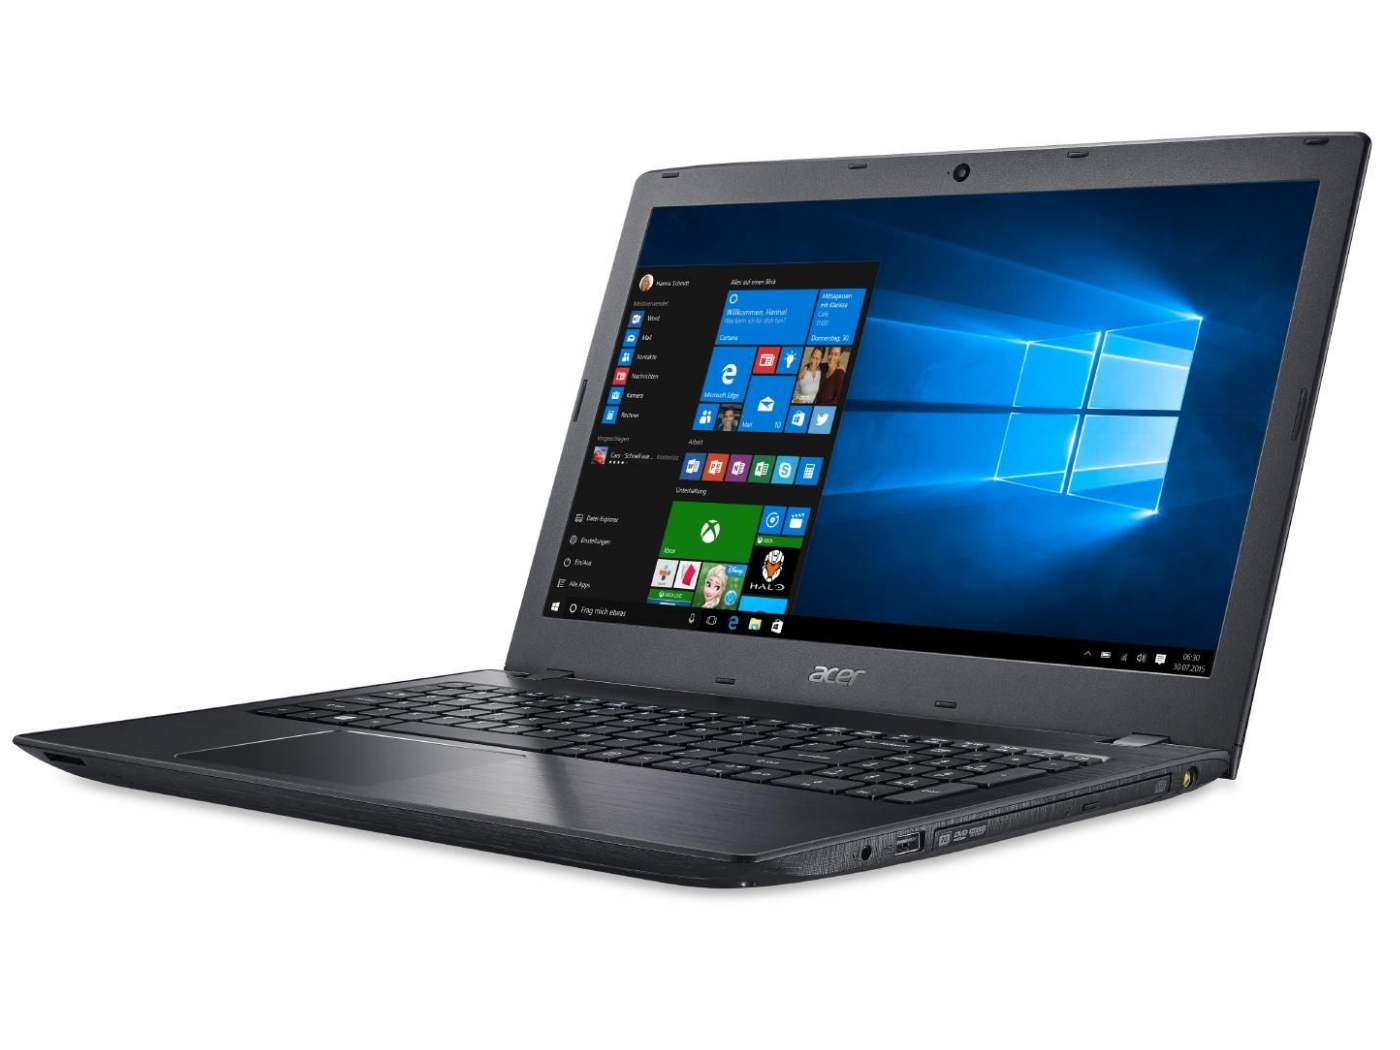
Kort testrapport Acer TravelMate P259-MG-71UU Notebook

| SD Card Reader | |
| average JPG Copy Test (av. of 3 runs) | |
| HP ProBook 450 G4 Y8B60EA | |
| Acer TravelMate P259-MG-71UU | |
| Lenovo ThinkPad E560-20EWS00000 | |
| Dell Latitude 15-3570 | |
| maximum AS SSD Seq Read Test (1GB) | |
| HP ProBook 450 G4 Y8B60EA | |
| Lenovo ThinkPad E560-20EWS00000 | |
| Dell Latitude 15-3570 | |
| Networking | |
| iperf Server (receive) TCP 1 m | |
| HP ProBook 450 G4 Y8B60EA | |
| iperf Client (transmit) TCP 1 m | |
| HP ProBook 450 G4 Y8B60EA | |
| iperf3 receive AX12 | |
| Acer TravelMate P259-MG-71UU | |
| iperf3 transmit AX12 | |
| Acer TravelMate P259-MG-71UU | |
| |||||||||||||||||||||||||
Helderheidsverdeling: 93 %
Helderheid in Batterij-modus: 180 cd/m²
Contrast: 400:1 (Zwart: 0.45 cd/m²)
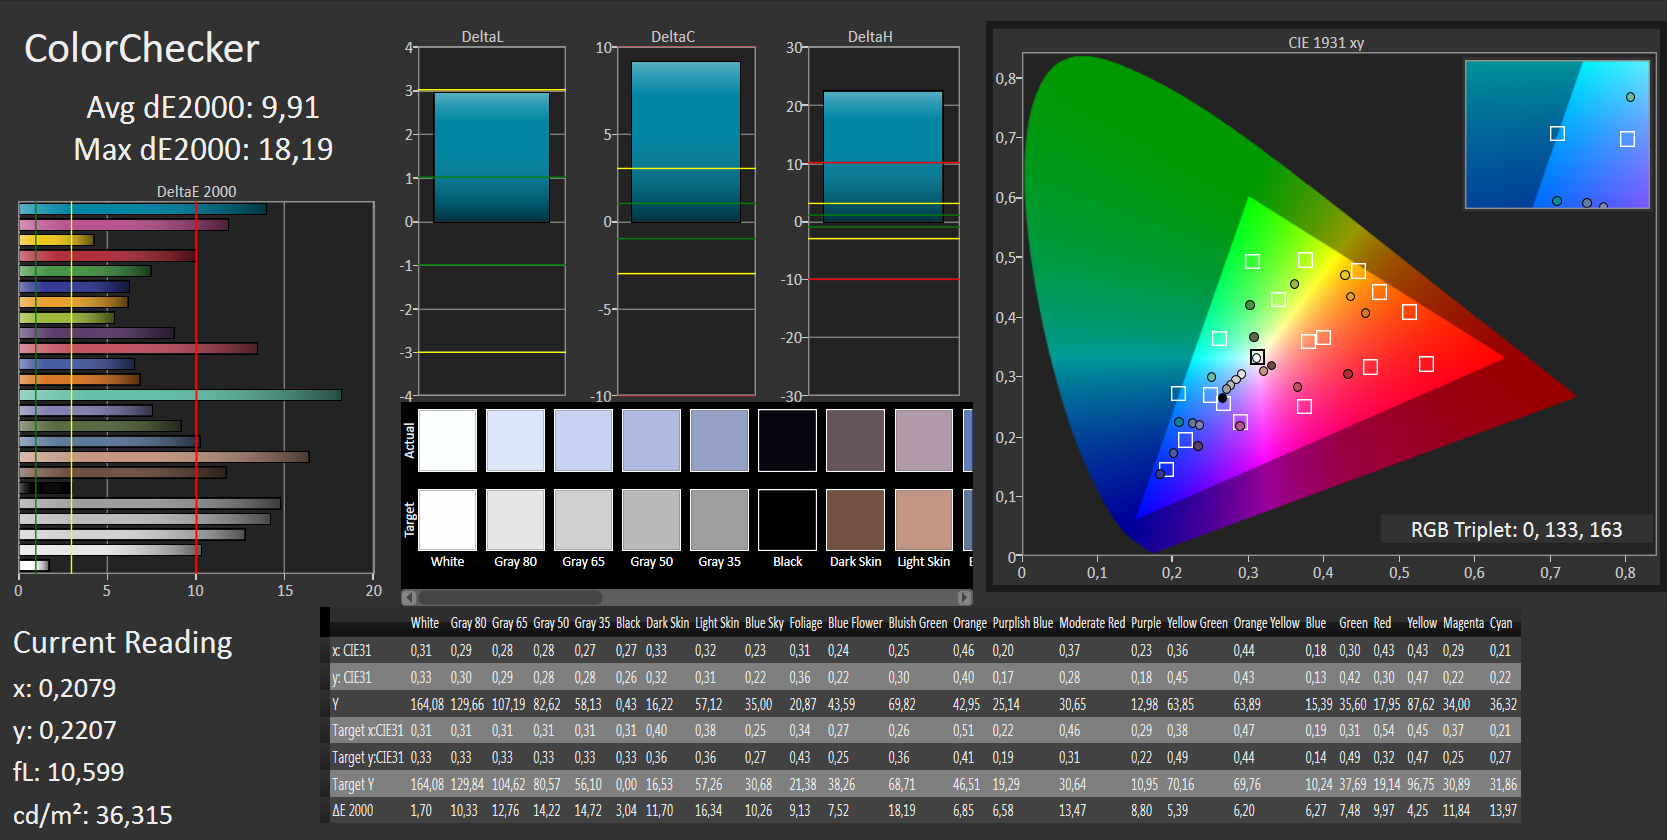
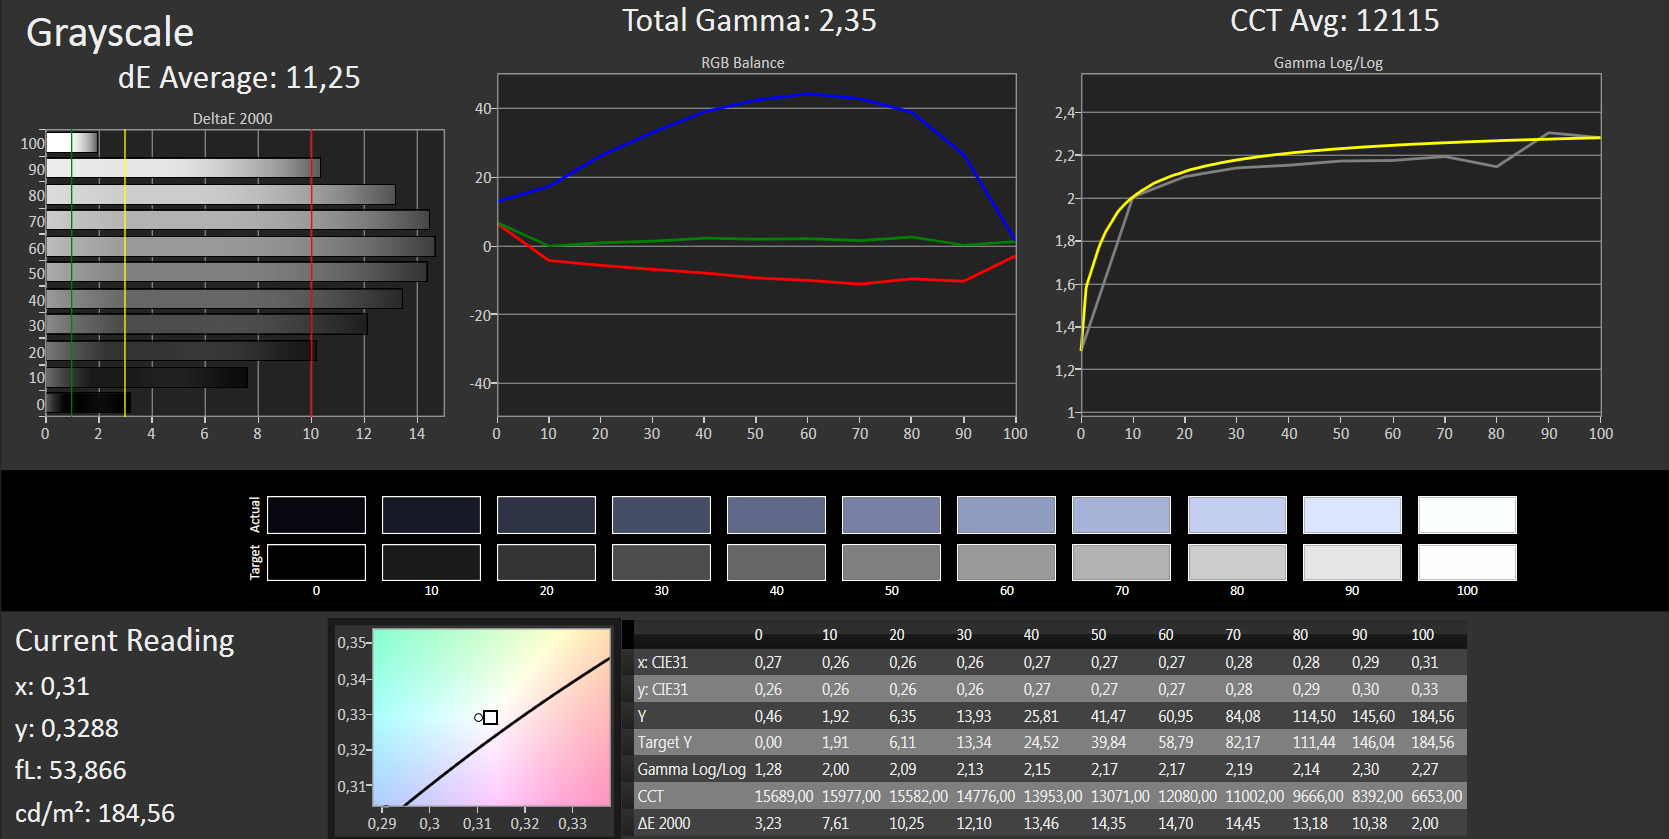
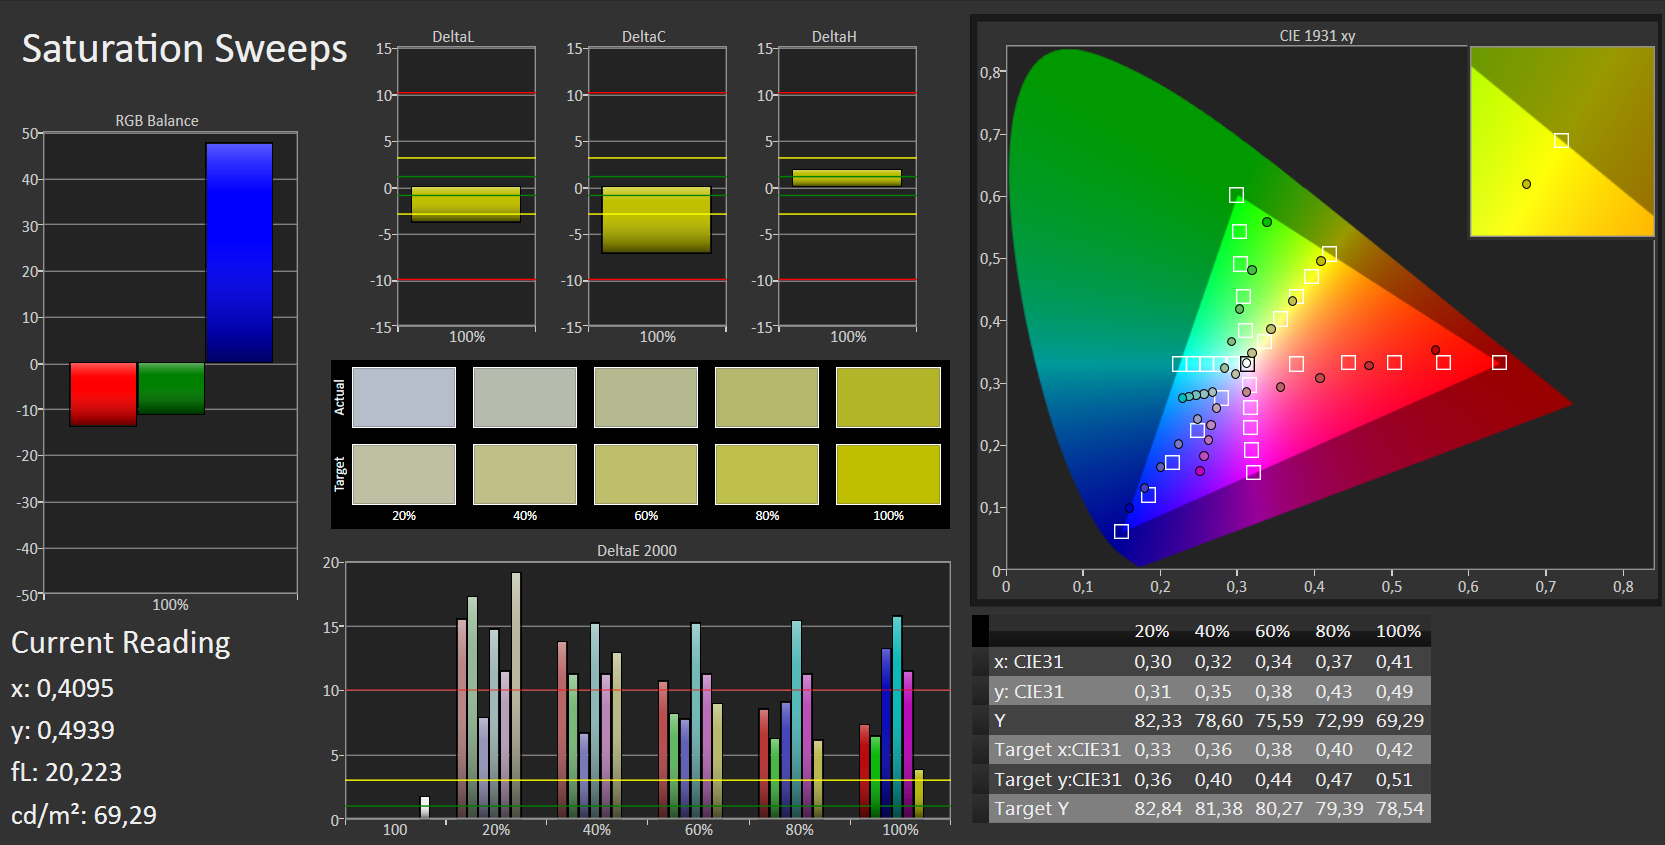
ΔE ColorChecker Calman: 9.91 | ∀{0.5-29.43 Ø4.71}
ΔE Greyscale Calman: 11.25 | ∀{0.09-98 Ø4.96}
58% sRGB (Argyll 1.6.3 3D)
37% AdobeRGB 1998 (Argyll 1.6.3 3D)
39.85% AdobeRGB 1998 (Argyll 3D)
58% sRGB (Argyll 3D)
38.58% Display P3 (Argyll 3D)
Gamma: 2.35
CCT: 12115 K
| Acer TravelMate P259-MG-71UU TN LED, 1920x1080, 15.6" | HP ProBook 450 G4 Y8B60EA TN LED, 1920x1080, 15.6" | Lenovo ThinkPad E560-20EWS00000 IPS-Panel, 1920x1080, 15.6" | Dell Latitude 15-3570 TN LED, 1366x768, 15.6" | Fujitsu LifeBook A556 PL 1366x768, 15.6" | |
|---|---|---|---|---|---|
| Display | 3% | -0% | 5% | 6% | |
| Display P3 Coverage (%) | 38.58 | 39.89 3% | 38.5 0% | 40.61 5% | 41.18 7% |
| sRGB Coverage (%) | 58 | 59.5 3% | 57.5 -1% | 61.1 5% | 60.9 5% |
| AdobeRGB 1998 Coverage (%) | 39.85 | 41.24 3% | 39.8 0% | 41.96 5% | 42.7 7% |
| Response Times | -28% | 5% | -27% | ||
| Response Time Grey 50% / Grey 80% * (ms) | 43 ? | 51 ? -19% | 38.4 ? 11% | 37 ? 14% | |
| Response Time Black / White * (ms) | 22 ? | 30 ? -36% | 22.4 ? -2% | 37 ? -68% | |
| PWM Frequency (Hz) | 50 ? | ||||
| Screen | 4% | 35% | -7% | -35% | |
| Brightness middle (cd/m²) | 180 | 214 19% | 257 43% | 202 12% | 250.7 39% |
| Brightness (cd/m²) | 178 | 201 13% | 234 31% | 211 19% | 249 40% |
| Brightness Distribution (%) | 93 | 77 -17% | 83 -11% | 88 -5% | 83 -11% |
| Black Level * (cd/m²) | 0.45 | 0.43 4% | 0.27 40% | 0.62 -38% | 1.3 -189% |
| Contrast (:1) | 400 | 498 25% | 952 138% | 326 -18% | 193 -52% |
| Colorchecker dE 2000 * | 9.91 | 10.68 -8% | 7.16 28% | 12.35 -25% | |
| Colorchecker dE 2000 max. * | 18.19 | 18.07 1% | 19.9 -9% | ||
| Greyscale dE 2000 * | 11.25 | 11.32 -1% | 6.28 44% | 13.46 -20% | |
| Gamma | 2.35 94% | 2.26 97% | 2.44 90% | 2.44 90% | |
| CCT | 12115 54% | 12204 53% | 6806 96% | 15217 43% | |
| Color Space (Percent of AdobeRGB 1998) (%) | 37 | 38 3% | 36.6 -1% | 39 5% | |
| Color Space (Percent of sRGB) (%) | 58 | 59 2% | 57.3 -1% | 61 5% | |
| Totaal Gemiddelde (Programma / Instellingen) | -7% /
-0% | 13% /
23% | -10% /
-8% | -15% /
-19% |
* ... kleiner is beter
Screen Flickering / PWM (Pulse-Width Modulation)
| Screen flickering / PWM niet waargenomen | ||
Ter vergelijking: 52 % van alle geteste toestellen maakten geen gebruik van PWM om de schermhelderheid te verlagen. Als het wel werd gebruikt, werd een gemiddelde van 7754 (minimum: 5 - maximum: 343500) Hz waargenomen. | ||
Responstijd Scherm
| ↔ Responstijd Zwart naar Wit | ||
|---|---|---|
| 22 ms ... stijging ↗ en daling ↘ gecombineerd | ↗ 6 ms stijging | 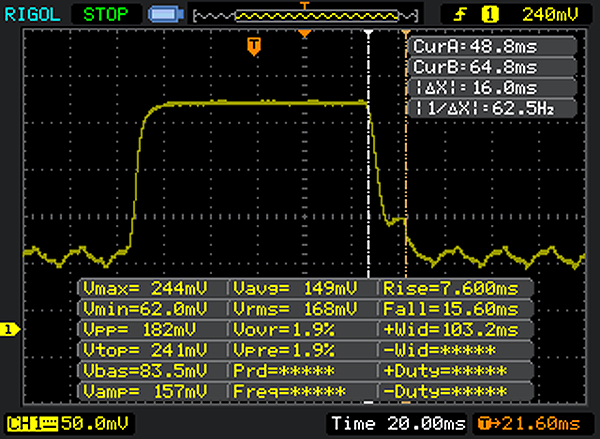 |
| ↘ 16 ms daling | ||
| Het scherm vertoonde prima responstijden in onze tests maar is misschien wat te traag voor competitieve games. Ter vergelijking: alle testtoestellen variëren van 0.1 (minimum) tot 240 (maximum) ms. » 49 % van alle toestellen zijn beter. Dit betekent dat de gemeten responstijd slechter is dan het gemiddelde (19.8 ms) van alle geteste toestellen. | ||
| ↔ Responstijd 50% Grijs naar 80% Grijs | ||
| 43 ms ... stijging ↗ en daling ↘ gecombineerd | ↗ 20 ms stijging | 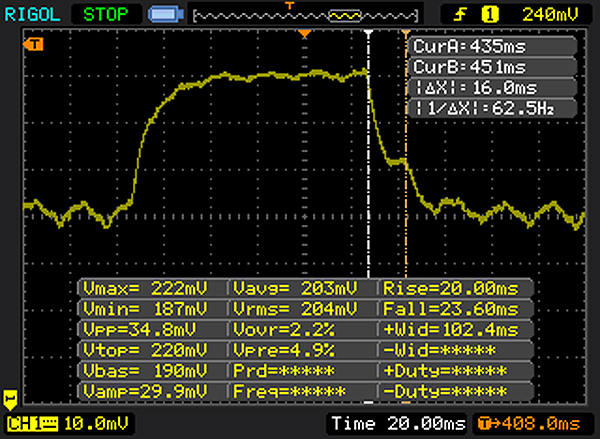 |
| ↘ 23 ms daling | ||
| Het scherm vertoonde trage responstijden in onze tests en is misschien te traag voor games. Ter vergelijking: alle testtoestellen variëren van 0.165 (minimum) tot 636 (maximum) ms. » 71 % van alle toestellen zijn beter. Dit betekent dat de gemeten responstijd slechter is dan het gemiddelde (31 ms) van alle geteste toestellen. | ||
| Cinebench R15 | |
| CPU Single 64Bit | |
| HP ProBook 450 G4 Y8B60EA | |
| Acer TravelMate P259-MG-71UU | |
| Lenovo ThinkPad E560-20EWS00000 | |
| Dell Latitude 15-3570 | |
| Fujitsu LifeBook A556 PL | |
| CPU Multi 64Bit | |
| HP ProBook 450 G4 Y8B60EA | |
| Acer TravelMate P259-MG-71UU | |
| Lenovo ThinkPad E560-20EWS00000 | |
| Dell Latitude 15-3570 | |
| Fujitsu LifeBook A556 PL | |
| Cinebench R11.5 | |
| CPU Multi 64Bit | |
| Lenovo ThinkPad E560-20EWS00000 | |
| Acer TravelMate P259-MG-71UU | |
| CPU Single 64Bit | |
| Acer TravelMate P259-MG-71UU | |
| Lenovo ThinkPad E560-20EWS00000 | |
| Cinebench R10 | |
| Rendering Multiple CPUs 32Bit | |
| Acer TravelMate P259-MG-71UU | |
| Lenovo ThinkPad E560-20EWS00000 | |
| Rendering Single 32Bit | |
| Lenovo ThinkPad E560-20EWS00000 | |
| Acer TravelMate P259-MG-71UU | |
| Geekbench 3 | |
| 32 Bit Single-Core Score | |
| Acer TravelMate P259-MG-71UU | |
| Lenovo ThinkPad E560-20EWS00000 | |
| 32 Bit Multi-Core Score | |
| Acer TravelMate P259-MG-71UU | |
| Lenovo ThinkPad E560-20EWS00000 | |
| Geekbench 4.0 | |
| 64 Bit Single-Core Score | |
| Acer TravelMate P259-MG-71UU | |
| 64 Bit Multi-Core Score | |
| Acer TravelMate P259-MG-71UU | |
| JetStream 1.1 - 1.1 Total | |
| HP ProBook 450 G4 Y8B60EA | |
| Lenovo ThinkPad E560-20EWS00000 | |
| Acer TravelMate P259-MG-71UU | |
| Mozilla Kraken 1.1 - Total | |
| Acer TravelMate P259-MG-71UU | |
| Lenovo ThinkPad E560-20EWS00000 | |
| HP ProBook 450 G4 Y8B60EA | |
* ... kleiner is beter
| PCMark 7 Score | 4890 punten | |
| PCMark 8 Home Score Accelerated v2 | 3823 punten | |
| PCMark 8 Creative Score Accelerated v2 | 4112 punten | |
| PCMark 8 Work Score Accelerated v2 | 4699 punten | |
Help | ||
| PCMark 8 | |
| Home Score Accelerated v2 | |
| Acer TravelMate P259-MG-71UU | |
| Lenovo ThinkPad E560-20EWS00000 | |
| Dell Latitude 15-3570 | |
| HP ProBook 450 G4 Y8B60EA | |
| Work Score Accelerated v2 | |
| HP ProBook 450 G4 Y8B60EA | |
| Acer TravelMate P259-MG-71UU | |
| Lenovo ThinkPad E560-20EWS00000 | |
| Dell Latitude 15-3570 | |

| Acer TravelMate P259-MG-71UU Liteonit CV3-8D256 | Lenovo ThinkPad E560-20EWS00000 Samsung CM871 MZ7LF192HCGS | Dell Latitude 15-3570 Samsung CM871 MZNLF128HCHP | Fujitsu LifeBook A556 PL Toshiba MQ02ABF050H (SSHD 500 + 8 GB) | |
|---|---|---|---|---|
| CrystalDiskMark 3.0 | -38% | -44% | -89% | |
| Read Seq (MB/s) | 478.5 | 462 -3% | 453.2 -5% | 105.8 -78% |
| Write Seq (MB/s) | 258.2 | 174.5 -32% | 137.7 -47% | 88.8 -66% |
| Read 512 (MB/s) | 254.3 | 306.8 21% | 308.5 21% | 29.45 -88% |
| Write 512 (MB/s) | 264.8 | 168.6 -36% | 134.1 -49% | 36.9 -86% |
| Read 4k (MB/s) | 28.32 | 16.14 -43% | 19.06 -33% | 0.428 -98% |
| Write 4k (MB/s) | 76.3 | 36.24 -53% | 21.31 -72% | 0.646 -99% |
| Read 4k QD32 (MB/s) | 346.2 | 95.7 -72% | 93.5 -73% | 0.978 -100% |
| Write 4k QD32 (MB/s) | 240.2 | 36.23 -85% | 23.3 -90% | 0.615 -100% |
| 3DMark 06 Standard Score | 14930 punten | |
| 3DMark 11 Performance | 3027 punten | |
| 3DMark Ice Storm Standard Score | 48176 punten | |
| 3DMark Cloud Gate Standard Score | 5606 punten | |
| 3DMark Fire Strike Score | 2025 punten | |
| 3DMark Fire Strike Extreme Score | 953 punten | |
Help | ||
| 3DMark 11 - 1280x720 Performance GPU | |
| Acer TravelMate P259-MG-71UU | |
| Dell Inspiron 17 7778 | |
| Lenovo ThinkPad E470-20H2S00400 | |
| Lenovo ThinkPad E560-20EWS00000 | |
| HP ProBook 450 G4 Y8B60EA | |
| Fujitsu LifeBook A556 PL | |
| Dell Latitude 15-3570 | |
| 3DMark | |
| 1280x720 Cloud Gate Standard Graphics | |
| Acer TravelMate P259-MG-71UU | |
| Dell Inspiron 17 7778 | |
| Lenovo ThinkPad E560-20EWS00000 | |
| Lenovo ThinkPad E470-20H2S00400 | |
| HP ProBook 450 G4 Y8B60EA | |
| Fujitsu LifeBook A556 PL | |
| Dell Latitude 15-3570 | |
| 1920x1080 Fire Strike Graphics | |
| Acer TravelMate P259-MG-71UU | |
| Dell Inspiron 17 7778 | |
| Lenovo ThinkPad E560-20EWS00000 | |
| Lenovo ThinkPad E470-20H2S00400 | |
| HP ProBook 450 G4 Y8B60EA | |
| Fujitsu LifeBook A556 PL | |
| lage | gem. | hoge | ultra | |
|---|---|---|---|---|
| Tomb Raider (2013) | 182.8 | 95.9 | 62.6 | 29.4 |
| BioShock Infinite (2013) | 117 | 70.9 | 61.9 | 24 |
| Battlefield 4 (2013) | 82.7 | 58.3 | 42.9 | 17.4 |
| FIFA 17 (2016) | 135.4 | 105.3 | 58.3 | 55 |
| Battlefield 1 (2016) | 61.7 | 40.5 | 19 | 17 |
| Civilization 6 (2016) | 48.8 | 26 | 13.5 | 10.5 |
| Farming Simulator 17 (2016) | 146.2 | 99.6 | 42.8 | 28.2 |
| Titanfall 2 (2016) | 68.6 | 44.8 | 20 | 16.4 |
| Call of Duty Infinite Warfare (2016) | 42.8 | 39.2 | 21.8 | 16.4 |
| Dishonored 2 (2016) | 33.4 | 26 | 13.6 | 11.3 |
| Watch Dogs 2 (2016) | 33.2 | 28.6 | 13.8 | 8.5 |
| BioShock Infinite - 1366x768 High Preset | |
| Acer TravelMate P259-MG-71UU | |
| Dell Inspiron 17 7778 | |
| Dell Vostro 15 5568 | |
| Lenovo ThinkPad E560-20EWS00000 | |
| Lenovo ThinkPad E470-20H2S00400 | |
| HP ProBook 450 G4 Y8B60EA | |
| Fujitsu LifeBook A556 PL | |
| Dell Latitude 15-3570 | |
| Battlefield 4 - 1366x768 Medium Preset | |
| Acer TravelMate P259-MG-71UU | |
| Lenovo ThinkPad E560-20EWS00000 | |
| Lenovo ThinkPad E470-20H2S00400 | |
| Dell Inspiron 17 7778 | |
Geluidsniveau
| Onbelast |
| 31.6 / 31.6 / 32 dB (A) |
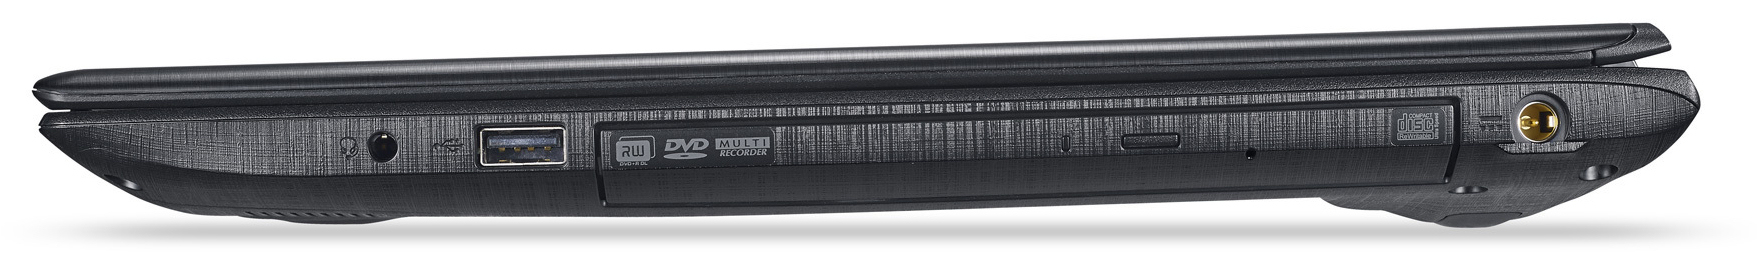
| DVD |
| 35.8 / dB (A) |
| Belasting |
| 35.5 / 38.3 dB (A) |
 | ||
30 dB stil 40 dB(A) hoorbaar 50 dB(A) luid |
||
min: | ||
| Acer TravelMate P259-MG-71UU 6500U, GeForce 940MX | HP ProBook 450 G4 Y8B60EA i7-7500U, GeForce 930MX | Lenovo ThinkPad E560-20EWS00000 6500U, Radeon R7 M370 | Dell Latitude 15-3570 6200U, HD Graphics 520 | Fujitsu LifeBook A556 PL 6200U, HD Graphics 520 | |
|---|---|---|---|---|---|
| Noise | -4% | 7% | 3% | -0% | |
| uit / omgeving * (dB) | 30.5 | 31.6 -4% | 31 -2% | ||
| Idle Minimum * (dB) | 31.6 | 32.6 -3% | 29.2 8% | 31 2% | 30.9 2% |
| Idle Average * (dB) | 31.6 | 32.6 -3% | 29.2 8% | 31 2% | 31 2% |
| Idle Maximum * (dB) | 32 | 33 -3% | 29.2 9% | 31 3% | 31.1 3% |
| Load Average * (dB) | 35.5 | 38.9 -10% | 33.6 5% | 34.2 4% | 36.9 -4% |
| Load Maximum * (dB) | 38.3 | 38.9 -2% | 35.5 7% | 34.3 10% | 39.8 -4% |
* ... kleiner is beter
(+) De maximumtemperatuur aan de bovenzijde bedraagt 35.1 °C / 95 F, vergeleken met het gemiddelde van 34.3 °C / 94 F, variërend van 21.2 tot 62.5 °C voor de klasse Office.
(-) De bodem warmt op tot een maximum van 46.7 °C / 116 F, vergeleken met een gemiddelde van 36.8 °C / 98 F
(+) Bij onbelast gebruik bedraagt de gemiddelde temperatuur voor de bovenzijde 25.1 °C / 77 F, vergeleken met het apparaatgemiddelde van 29.5 °C / 85 F.
(+) De handpalmsteunen en het touchpad bereiken maximaal de huidtemperatuur (34 °C / 93.2 F) en zijn dus niet heet.
(-) De gemiddelde temperatuur van de handpalmsteun van soortgelijke toestellen bedroeg 27.5 °C / 81.5 F (-6.5 °C / -11.7 F).
| Acer TravelMate P259-MG-71UU 6500U, GeForce 940MX | HP ProBook 450 G4 Y8B60EA i7-7500U, GeForce 930MX | Lenovo ThinkPad E560-20EWS00000 6500U, Radeon R7 M370 | Dell Latitude 15-3570 6200U, HD Graphics 520 | Fujitsu LifeBook A556 PL 6200U, HD Graphics 520 | |
|---|---|---|---|---|---|
| Heat | -7% | -3% | -10% | 14% | |
| Maximum Upper Side * (°C) | 35.1 | 44.3 -26% | 45 -28% | 36.1 -3% | 33.2 5% |
| Maximum Bottom * (°C) | 46.7 | 46.3 1% | 39.8 15% | 47 -1% | 30.1 36% |
| Idle Upper Side * (°C) | 27 | 27.8 -3% | 26.1 3% | 31.7 -17% | 25.3 6% |
| Idle Bottom * (°C) | 27.4 | 27.7 -1% | 27.7 -1% | 32.9 -20% | 25 9% |
* ... kleiner is beter
Acer TravelMate P259-MG-71UU audioanalyse
(±) | luidspreker luidheid is gemiddeld maar goed (73 dB)
Bas 100 - 315 Hz
(-) | bijna geen lage tonen - gemiddeld 24.4% lager dan de mediaan
(±) | lineariteit van de lage tonen is gemiddeld (11.7% delta ten opzichte van de vorige frequentie)
Midden 400 - 2000 Hz
(+) | evenwichtige middens - slechts 4.1% verwijderd van de mediaan
(±) | lineariteit van de middentonen is gemiddeld (11.3% delta ten opzichte van de vorige frequentie)
Hoog 2 - 16 kHz
(±) | higher highs - on average 7.5% higher than median
(±) | lineariteit van de hoogtepunten is gemiddeld (8.5% delta ten opzichte van de vorige frequentie)
Algemeen 100 - 16.000 Hz
(±) | lineariteit van het totale geluid is gemiddeld (26.8% verschil met de mediaan)
Vergeleken met dezelfde klasse
» 82% van alle geteste apparaten in deze klasse waren beter, 6% vergelijkbaar, 11% slechter
» De beste had een delta van 7%, het gemiddelde was 21%, de slechtste was 53%
Vergeleken met alle geteste toestellen
» 82% van alle geteste apparaten waren beter, 4% gelijk, 14% slechter
» De beste had een delta van 4%, het gemiddelde was 23%, de slechtste was 134%
Apple MacBook 12 (Early 2016) 1.1 GHz audioanalyse
(+) | luidsprekers kunnen relatief luid spelen (83.6 dB)
Bas 100 - 315 Hz
(±) | verminderde zeebaars - gemiddeld 11.3% lager dan de mediaan
(±) | lineariteit van de lage tonen is gemiddeld (14.2% delta ten opzichte van de vorige frequentie)
Midden 400 - 2000 Hz
(+) | evenwichtige middens - slechts 2.4% verwijderd van de mediaan
(+) | de middentonen zijn lineair (5.5% delta ten opzichte van de vorige frequentie)
Hoog 2 - 16 kHz
(+) | evenwichtige hoogtepunten - slechts 2% verwijderd van de mediaan
(+) | de hoge tonen zijn lineair (4.5% delta naar de vorige frequentie)
Algemeen 100 - 16.000 Hz
(+) | het totale geluid is lineair (10.2% verschil met de mediaan)
Vergeleken met dezelfde klasse
» 7% van alle geteste apparaten in deze klasse waren beter, 2% vergelijkbaar, 90% slechter
» De beste had een delta van 5%, het gemiddelde was 18%, de slechtste was 53%
Vergeleken met alle geteste toestellen
» 5% van alle geteste apparaten waren beter, 1% gelijk, 94% slechter
» De beste had een delta van 4%, het gemiddelde was 23%, de slechtste was 134%
| Uit / Standby | |
| Inactief | |
| Belasting |
|
Key:
min: | |
| Acer TravelMate P259-MG-71UU 6500U, GeForce 940MX | HP ProBook 450 G4 Y8B60EA i7-7500U, GeForce 930MX | Lenovo ThinkPad E560-20EWS00000 6500U, Radeon R7 M370 | Dell Latitude 15-3570 6200U, HD Graphics 520 | Fujitsu LifeBook A556 PL 6200U, HD Graphics 520 | |
|---|---|---|---|---|---|
| Power Consumption | 15% | 3% | 30% | 23% | |
| Idle Minimum * (Watt) | 7 | 3.8 46% | 4.2 40% | 4.9 30% | 4.5 36% |
| Idle Average * (Watt) | 8 | 6.6 17% | 7.5 6% | 7.2 10% | 6.1 24% |
| Idle Maximum * (Watt) | 10.6 | 11.3 -7% | 8.2 23% | 7.5 29% | 10.5 1% |
| Load Average * (Watt) | 39.7 | 38 4% | 49.6 -25% | 25.4 36% | 29.9 25% |
| Load Maximum * (Watt) | 51.9 | 45 13% | 65.8 -27% | 28 46% | 37.2 28% |
* ... kleiner is beter
| Acer TravelMate P259-MG-71UU 6500U, GeForce 940MX, 41 Wh | HP ProBook 450 G4 Y8B60EA i7-7500U, GeForce 930MX, 45 Wh | Lenovo ThinkPad E560-20EWS00000 6500U, Radeon R7 M370, 48 Wh | Dell Latitude 15-3570 6200U, HD Graphics 520, 65 Wh | Fujitsu LifeBook A556 PL 6200U, HD Graphics 520, 45 Wh | |
|---|---|---|---|---|---|
| Batterijduur | 79% | 55% | 115% | -5% | |
| Reader / Idle (h) | 10.3 | 12.4 20% | 14.7 43% | 17.1 66% | 9.8 -5% |
| H.264 (h) | 4.1 | 6.9 68% | |||
| WiFi v1.3 (h) | 4.7 | 8.6 83% | 5.7 21% | 9 91% | |
| Load (h) | 0.9 | 2.1 133% | 1.7 89% | 2.6 189% | |
| WiFi (h) | 5.8 |
Pro
Contra
Dit is de verkorte versie van het originele artikel. Het volledige, Engelse testrapport vind je hier.
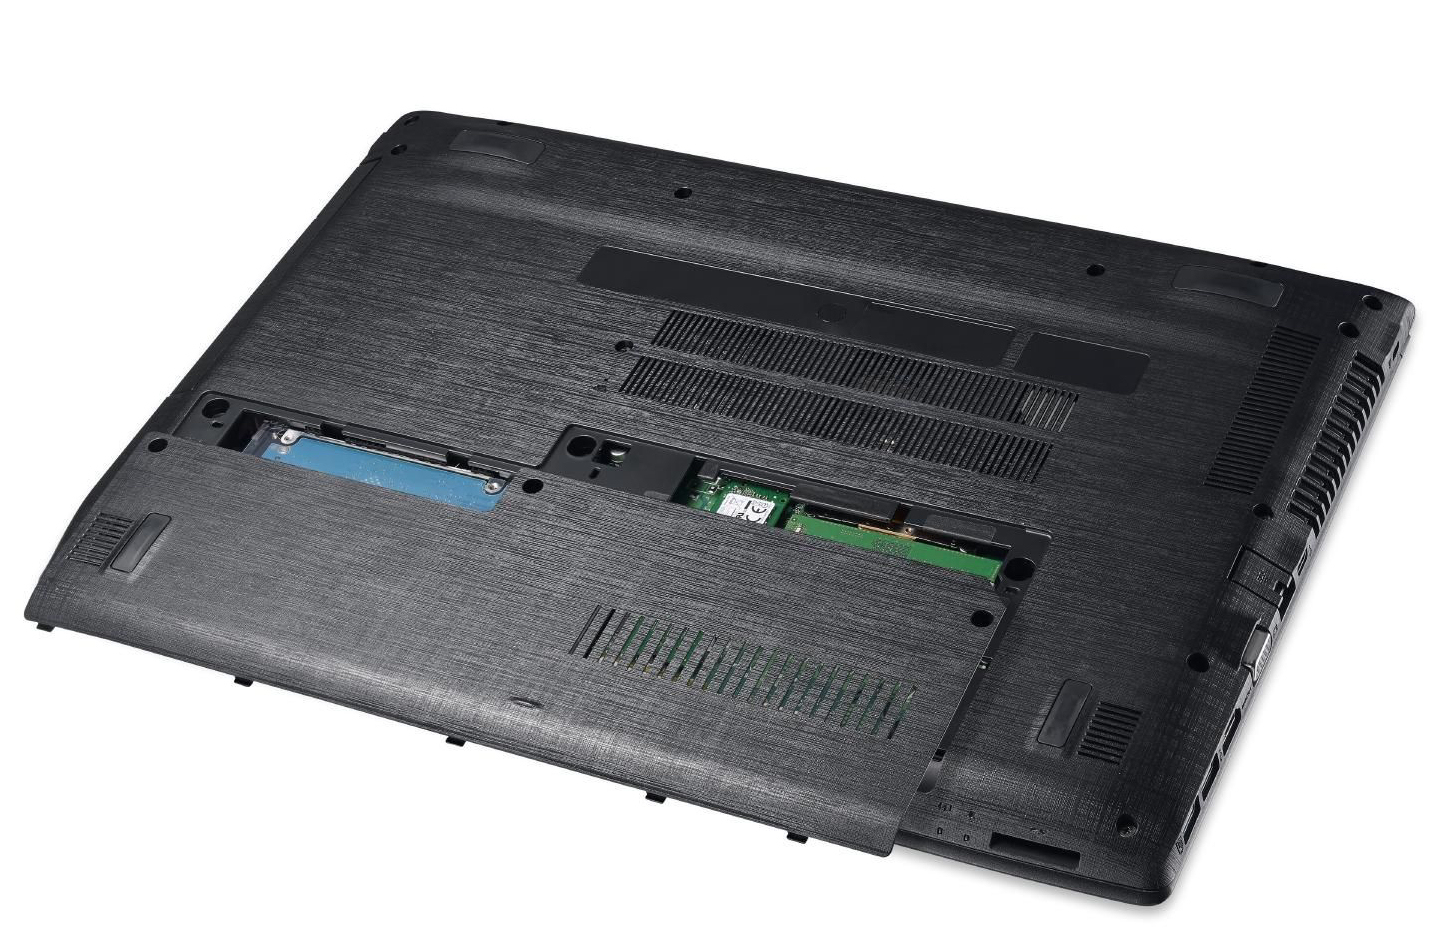
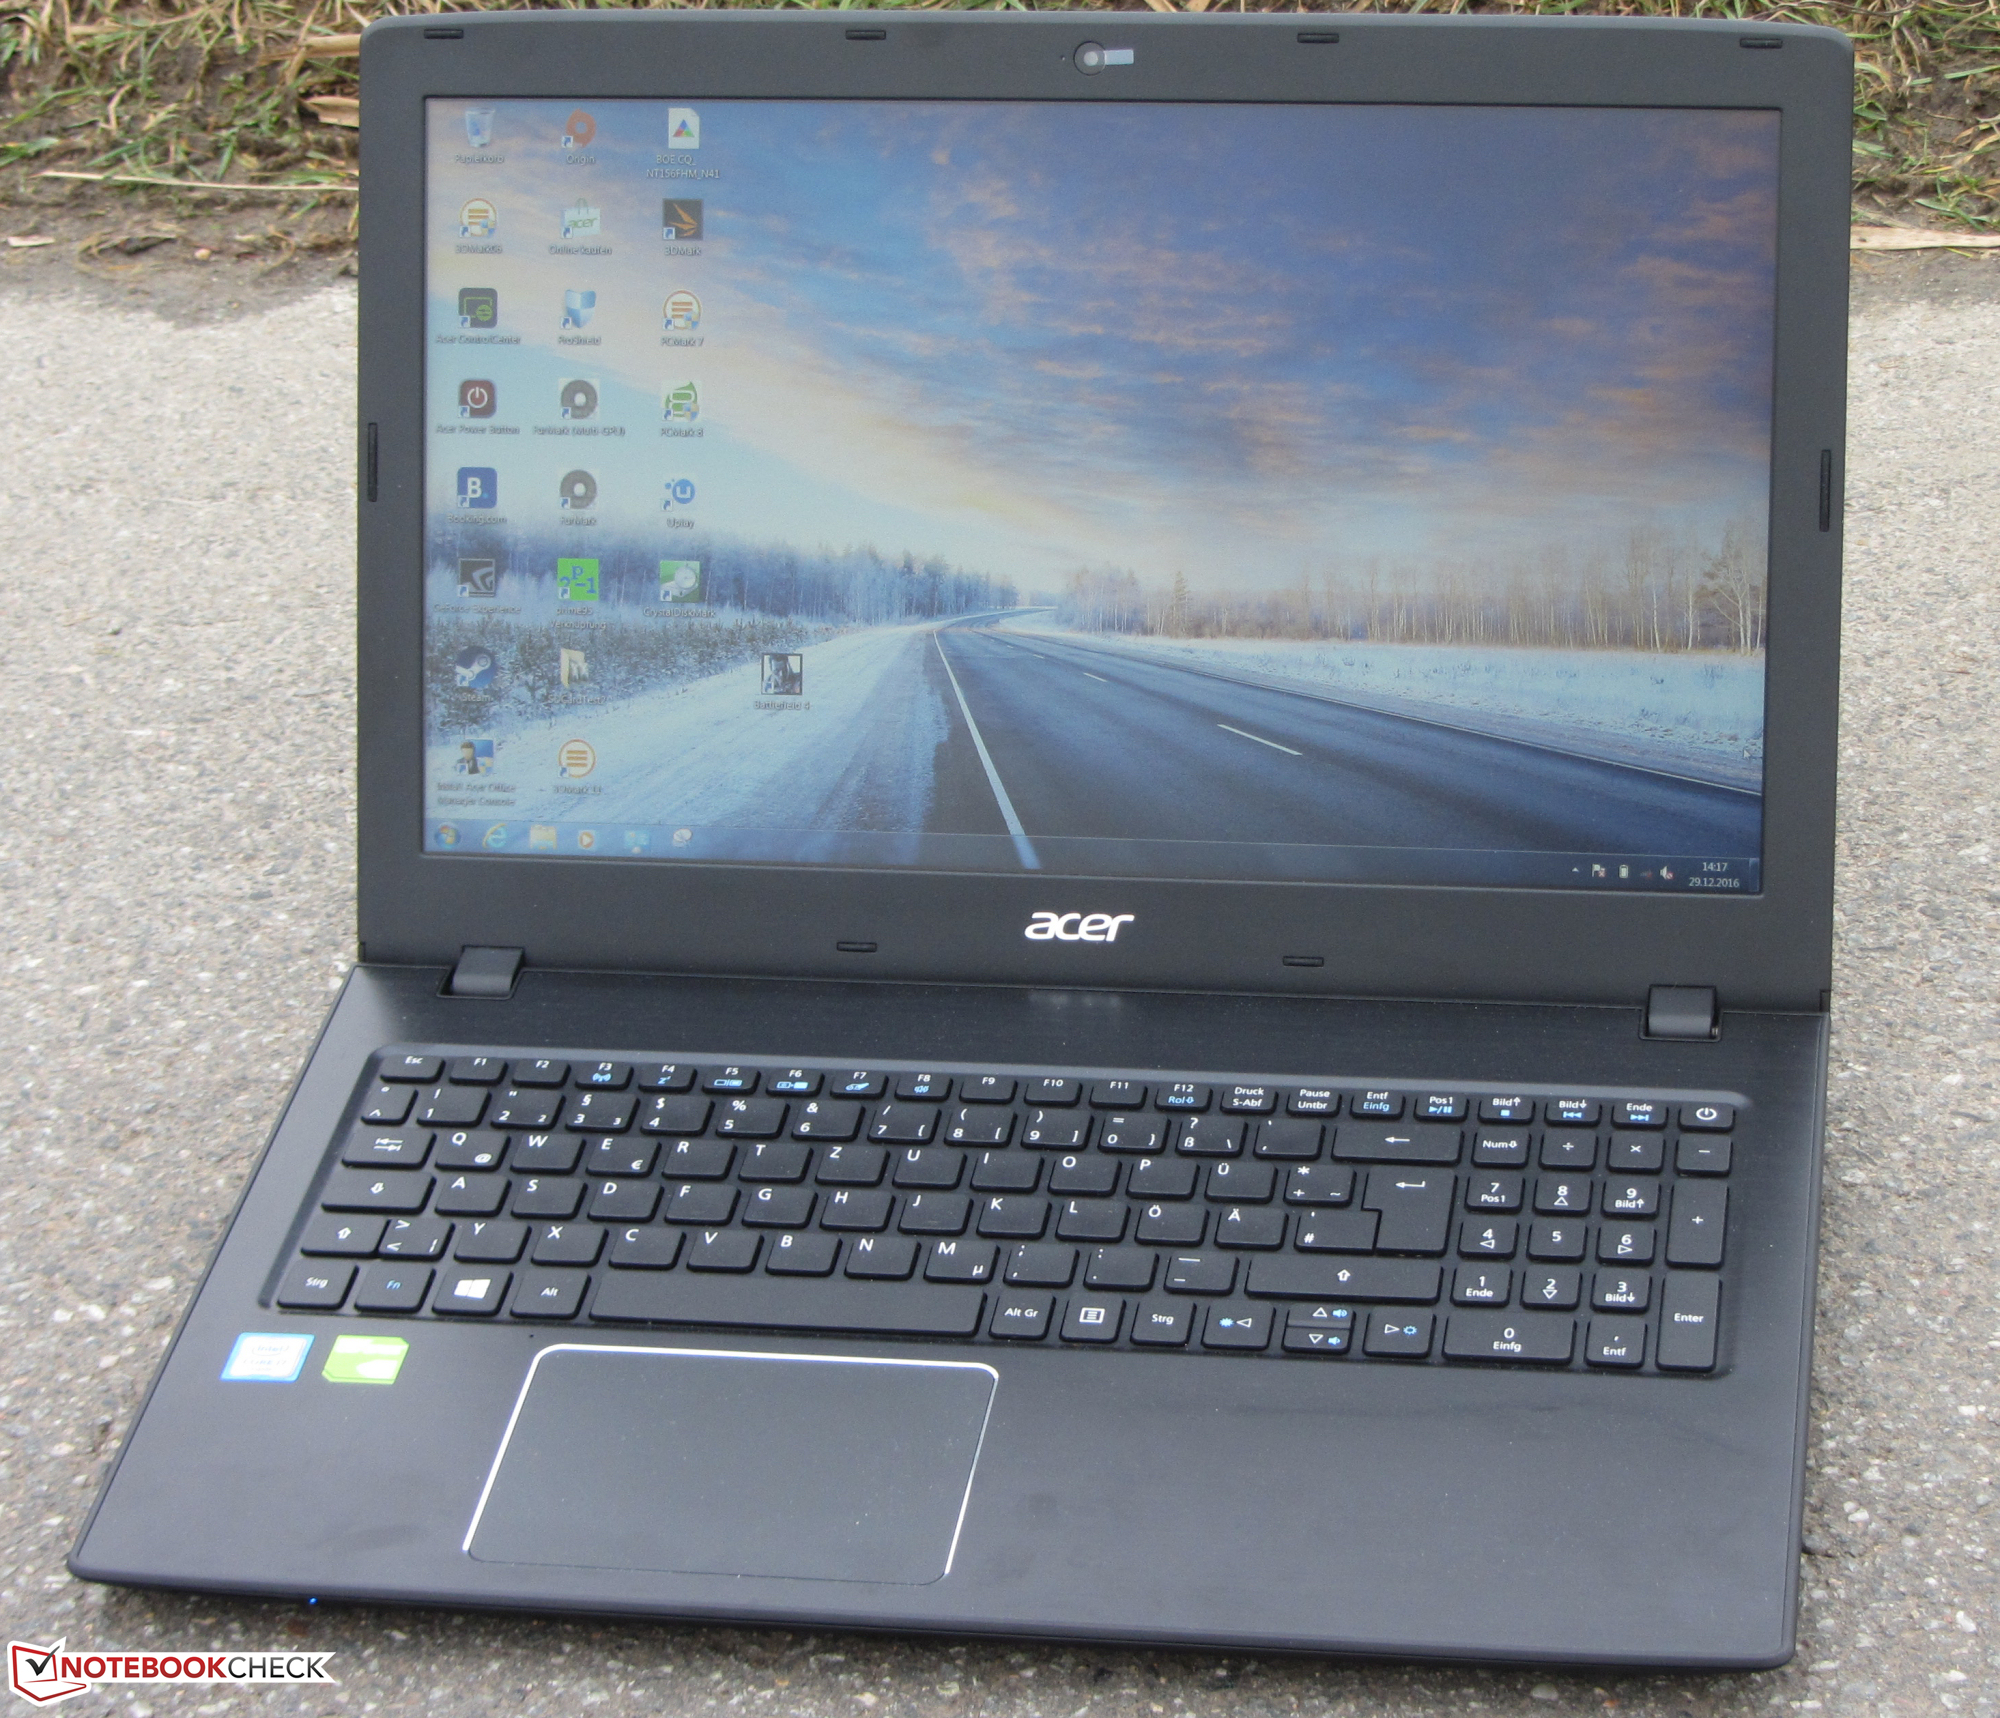
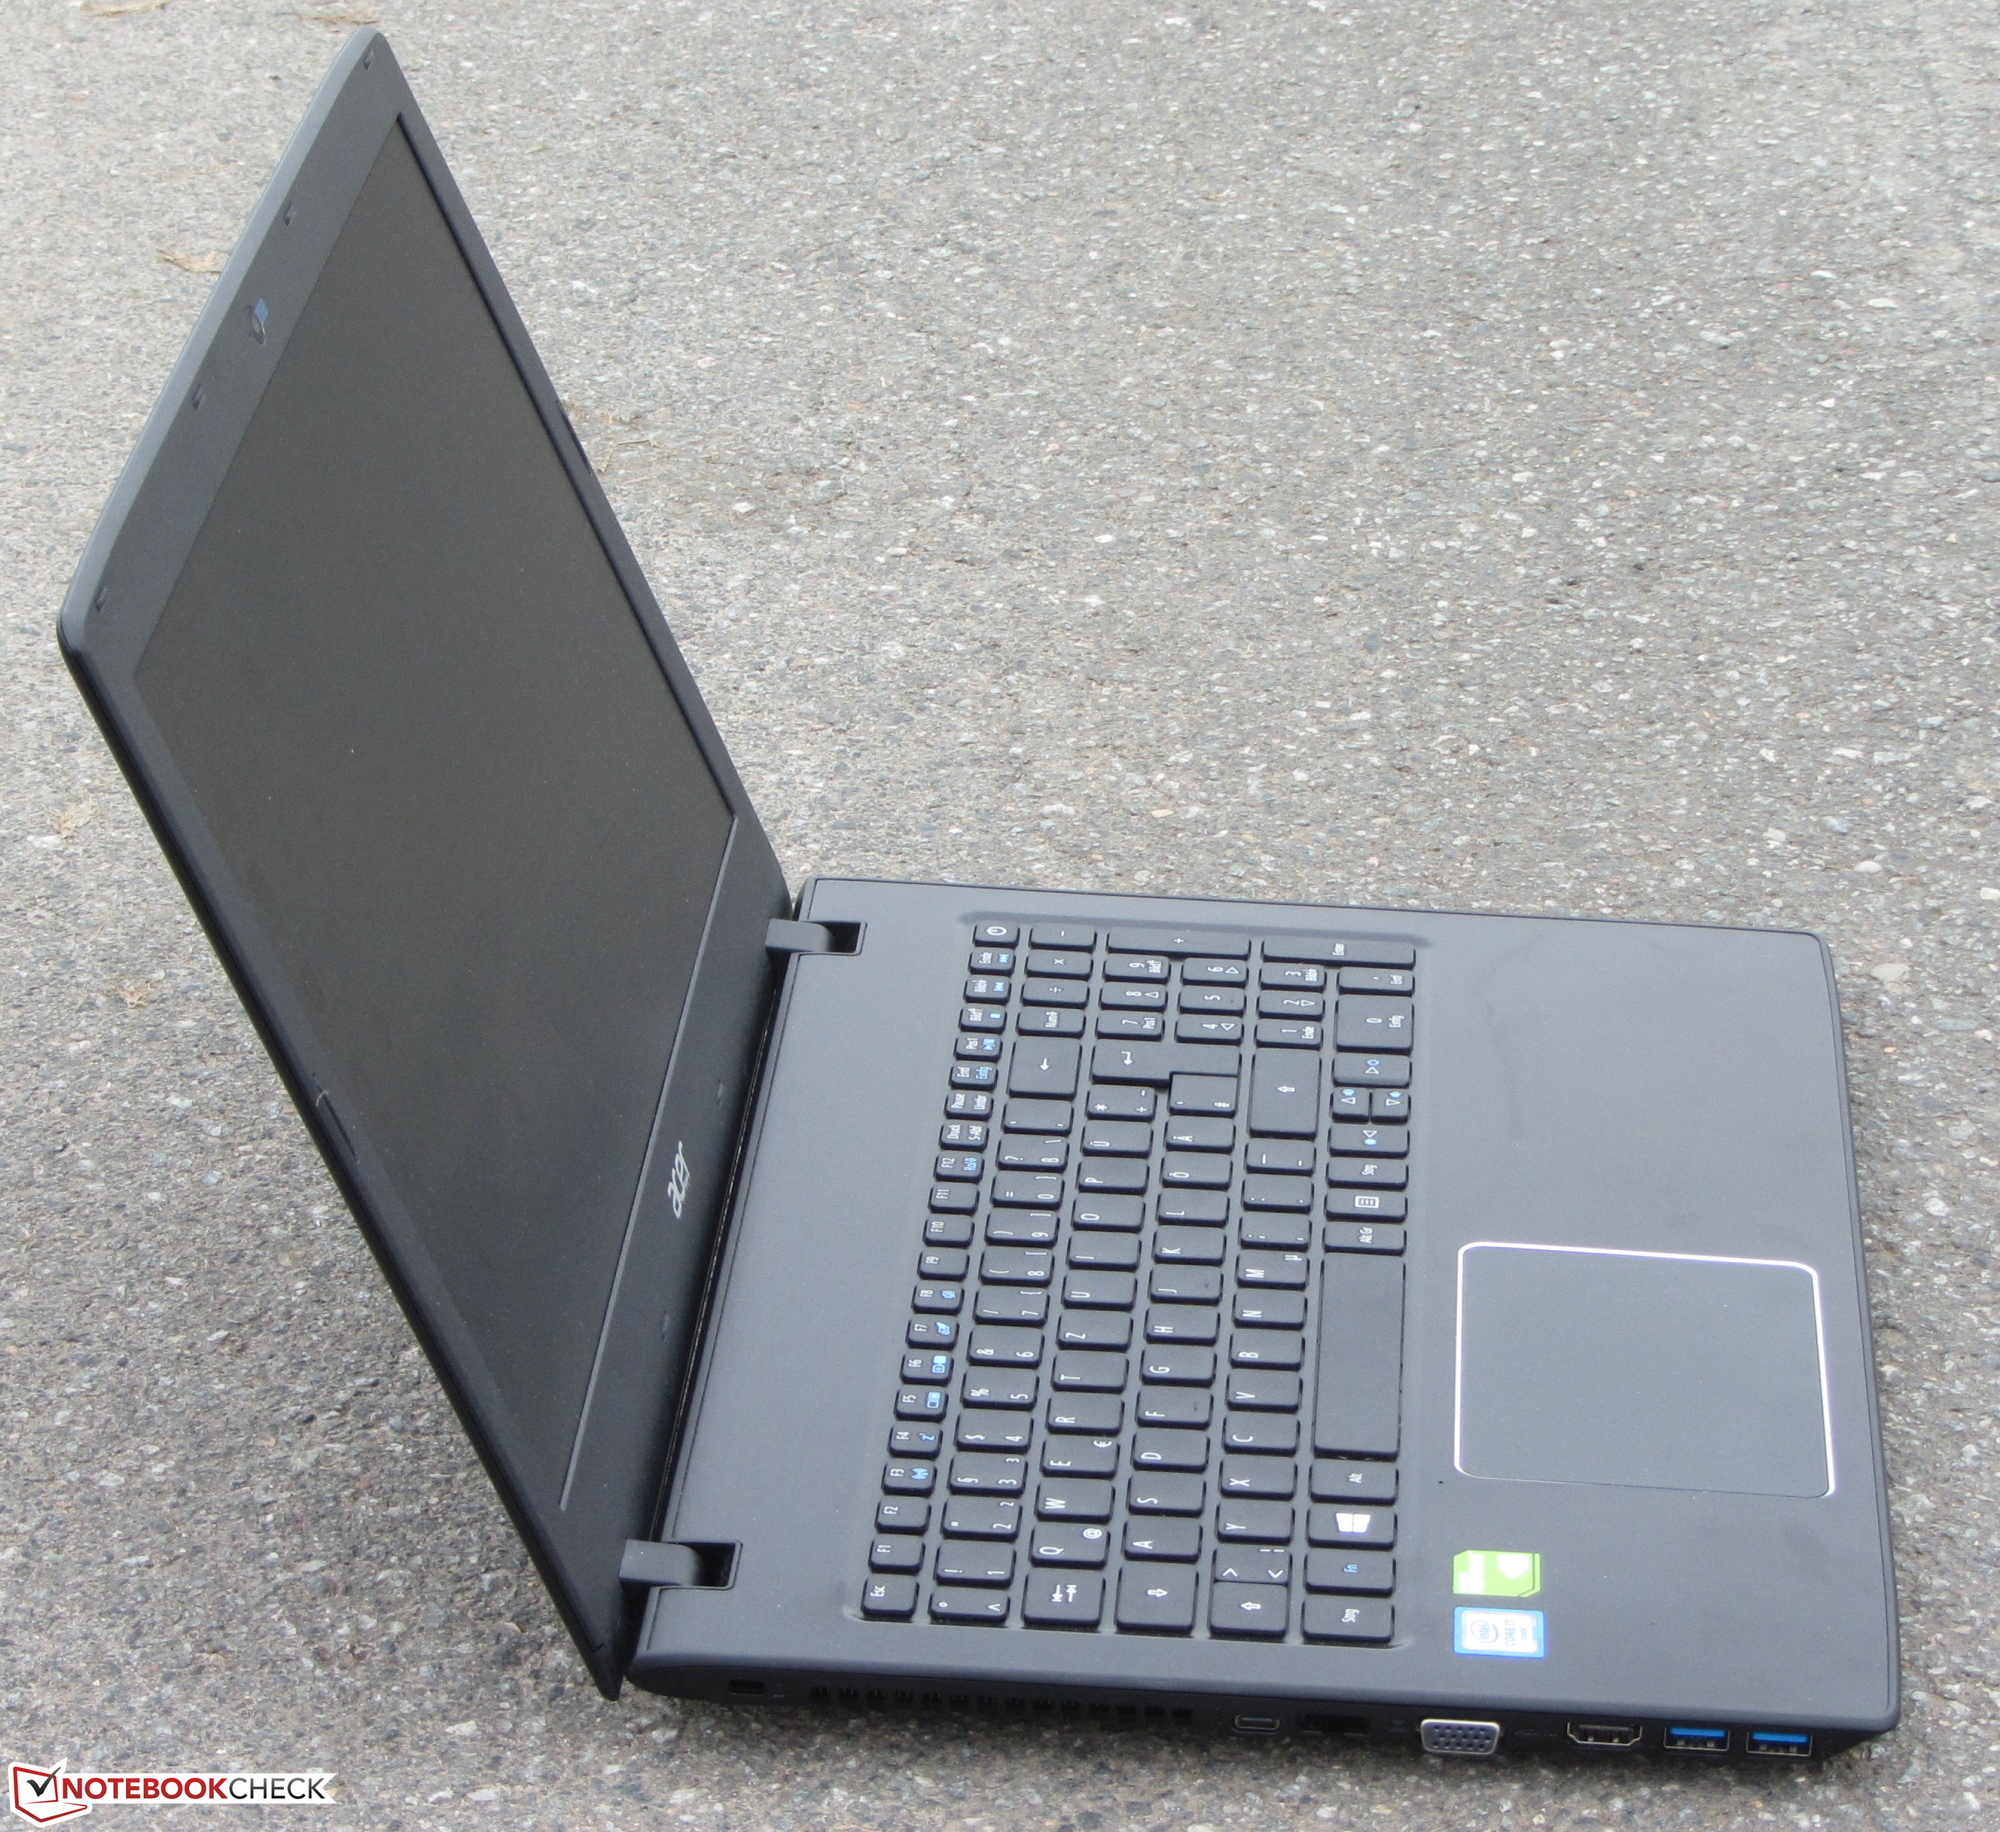
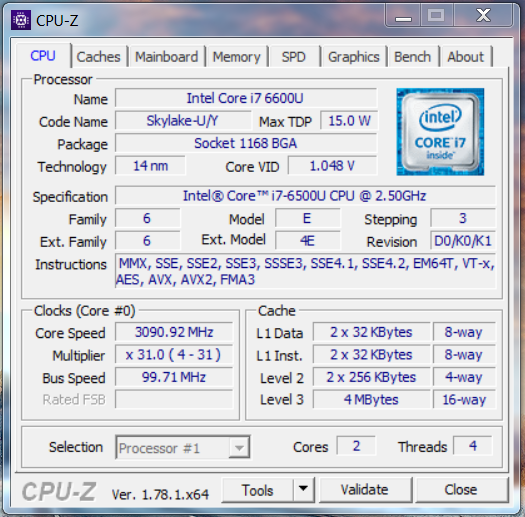
Kaby Lake is nog niet te vinden in de TravelMate-serie. De geïnstalleerde Core i7 processor uit de Skylake generatie biedt echter meer dan voldoende applicatie prestaties. Dankzij de GeForce grafische kaart zijn vele moderne en de meeste oudere games speelbaar. De laptop wordt nooit echt luid. Bij weinig tot geen belasting is het notebook zelfs geruisloos te noemen. De temperaturen blijven ook ruim binnen de perken. De aanwezigheid van de onderhoudsdeksel maakt het makkelijk vervangen van beide opslagapparaten mogelijk. Het geïnstalleerde toetsenbord werkt naar volle tevredenheid. Het pakket wordt afgerond met 3 jaar garantie.
Acer heeft een goede klus geklaard met de TravelMate P259-MG-71UU, maar zijn slechte beeldschermkeuze staat een betere beoordeling in de weg.
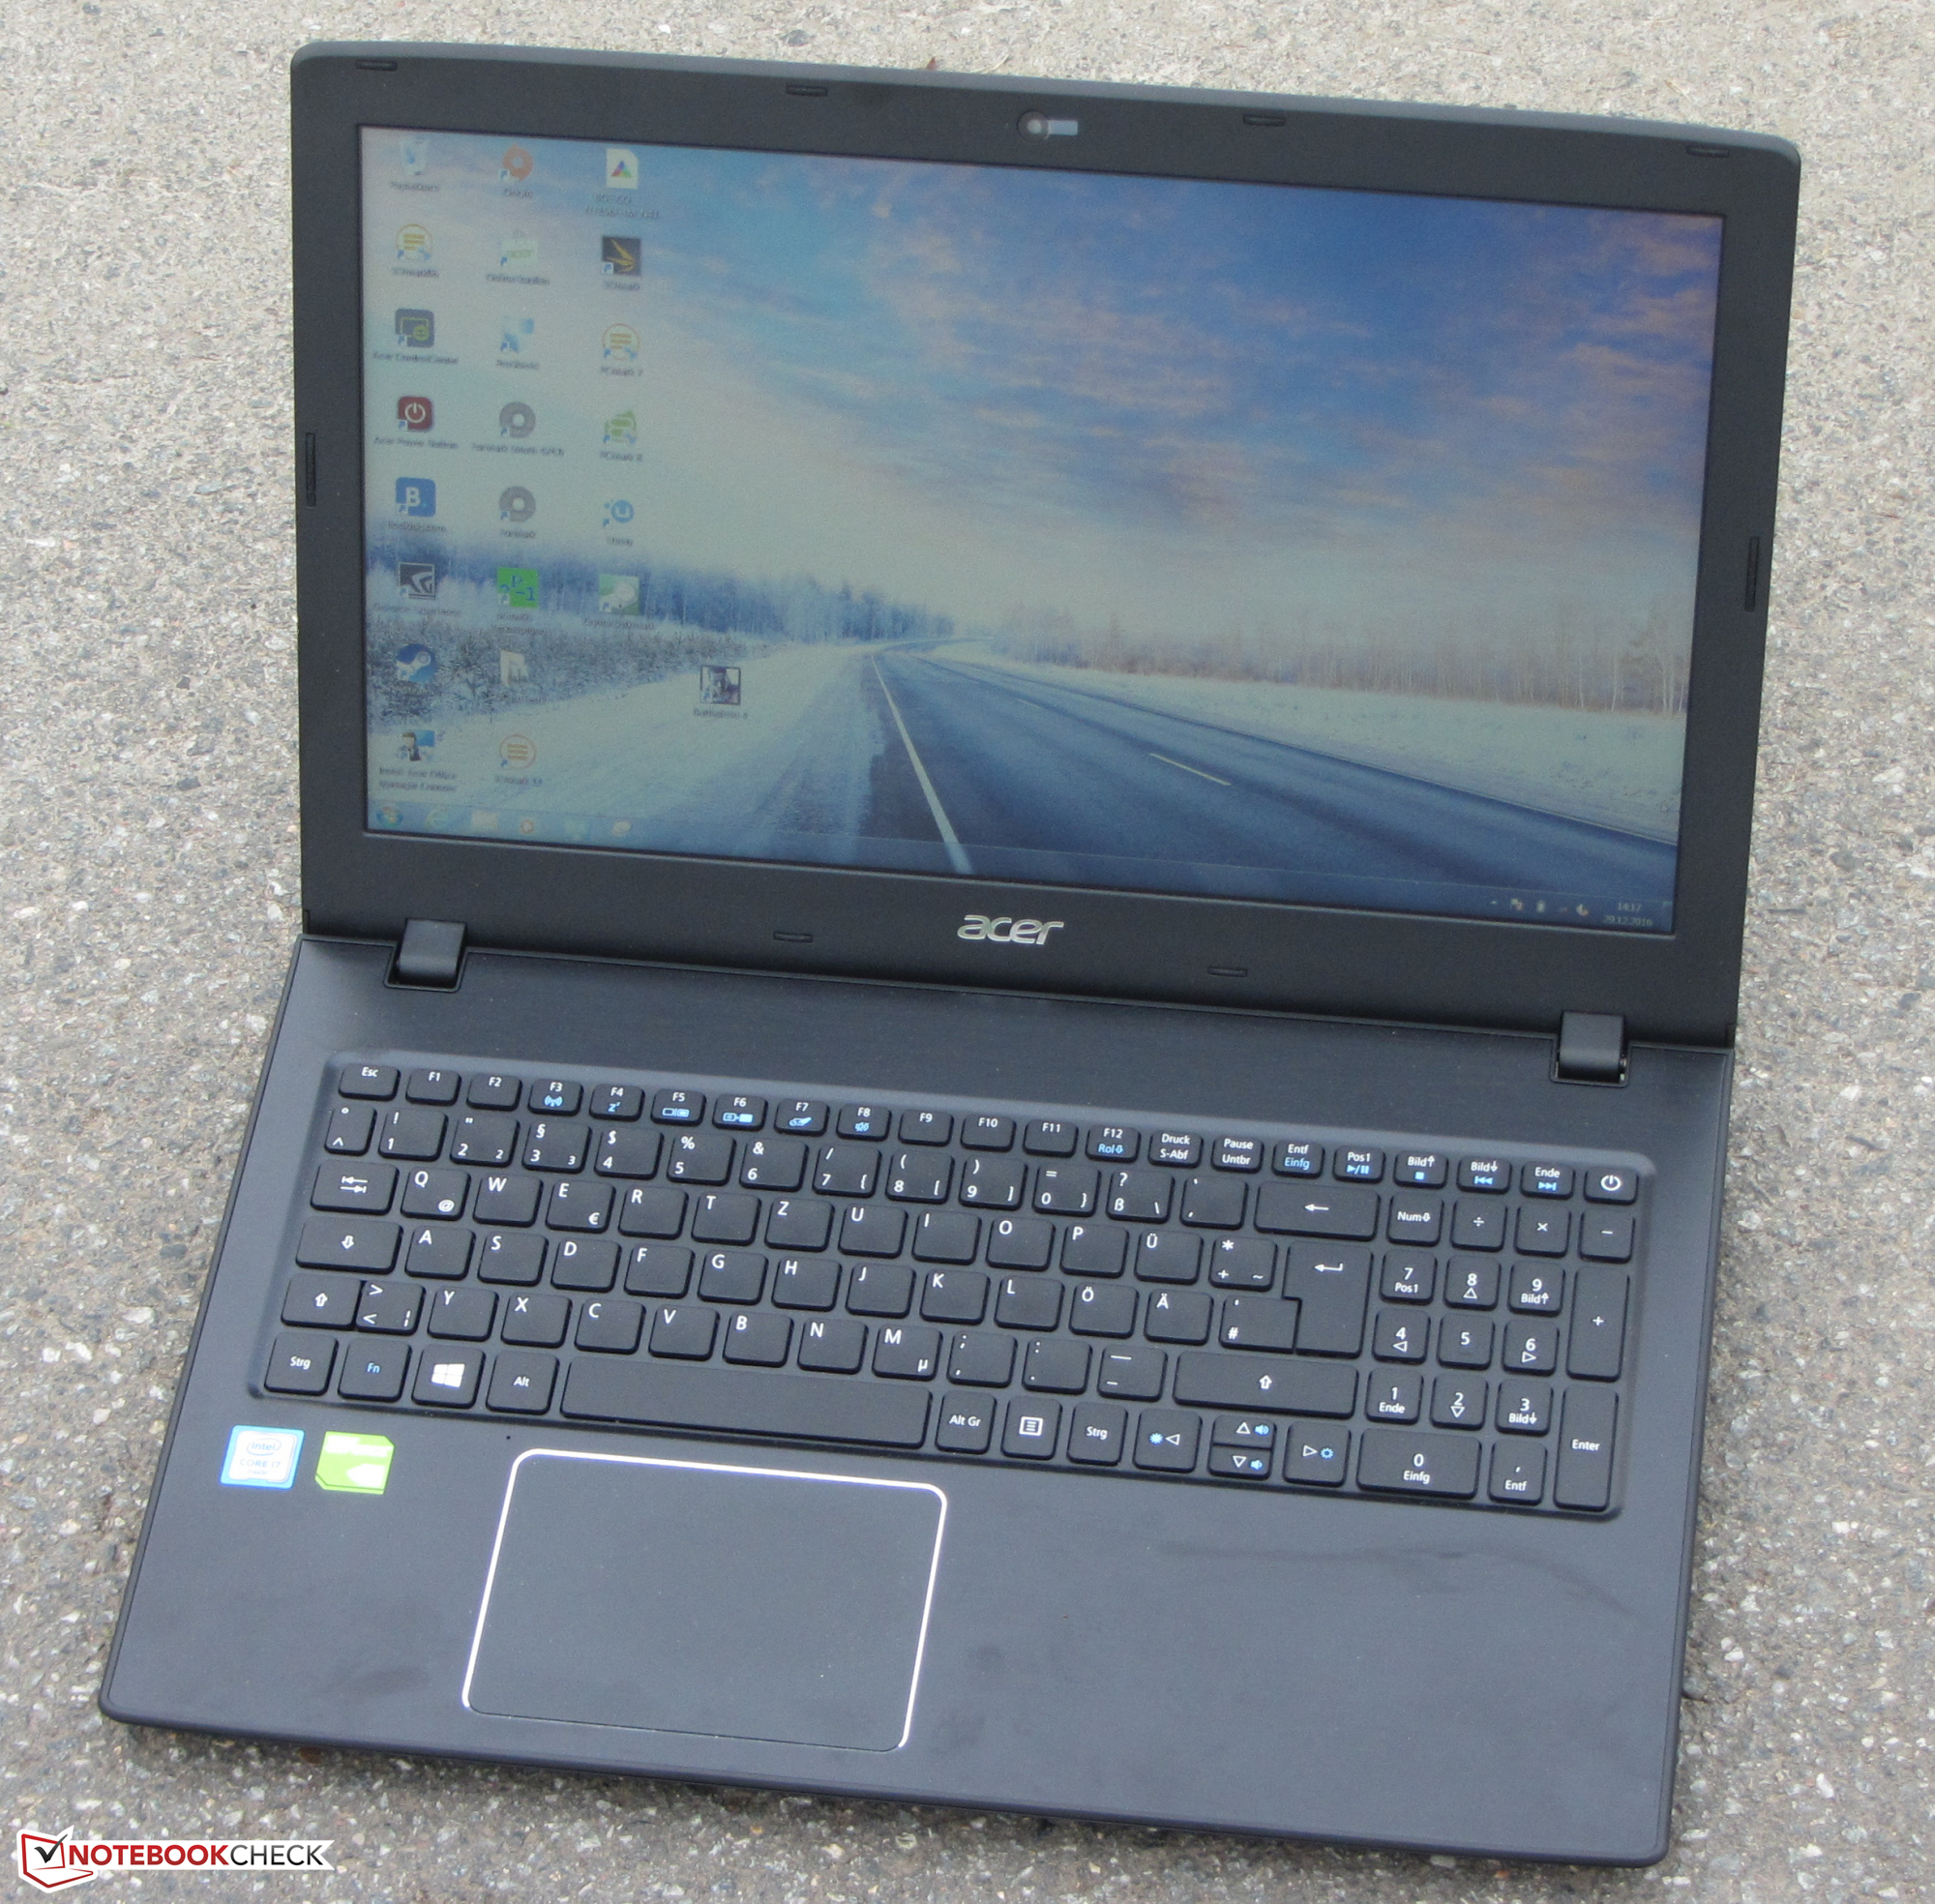
Het geïnstalleerde beeldscherm is donker, heeft een laag contrast en heeft zeer beperkt kijkhoeken. We hadden een veel beter IPS paneel verwacht in een 1.000 EUR apparaat zoals de TravelMate. Een verlicht toetsenbord zou ook tot de basisconfiguratie moeten horen: een laptop die specifiek gericht is op professionele gebruikers zou op dit vlak meer moeten bieden. De TravelMate P259-MG moet hierdoor eerder gezien worden als een 15.6-inch all-rounder voor het thuiskantoor dan een zakelijk notebook.
Acer TravelMate P259-MG-71UU
- 01-01-2017 v6 (old)
Sascha Mölck