Conclusie - De XMG Focus 17 biedt hoge prestaties met enkele compromissen
Met de nieuwe Focus 17 M25 wil XMG duidelijk de hoogst mogelijke prestaties tegen de laagst mogelijke prijs bieden. Om dit te bereiken is de nieuwe GeForce RTX 5070 Ti laptop GPU (12 GB VRAM) in de snelste 140-watt variant gecombineerd met de oudere Core i9-13900HX. De prestaties zijn echter nog steeds voldoende, vooral bij gamen. Hierdoor is het spelen van games met een native QHD-resolutie zonder problemen mogelijk. Bij het aanroepen van vol vermogen worden de ventilatoren wel erg luid, maar dat is niet anders dan bij de concurrentie. Desondanks blijft de koeleenheid erg stil bij dagelijks gebruik, en met de uitgebreide energieprofielen kunt u een stil systeem configureren zonder negatieve invloed op de prestaties.
Het matte 240 Hz IPS-scherm is ook zeer geschikt voor gaming. Helaas is het nog steeds een 16:9 scherm dat moeite heeft om de helderheid van zijn concurrenten te evenaren. Andere compromissen zijn het ontbreken van Thunderbolt/USB 4.0 en Advanced Optimus, maar deze zijn te overzien. De luidsprekers zijn ook vrij zwak en de 230 watt voeding is op het randje van ondermaats.
Al met al krijgt u een snelle spelcomputer voor een uitstekende prijs, en met 12 GB VRAM is de GPU ook meer toekomstbestendig dan bijvoorbeeld de standaard RTX 5070 laptop GPU.
Pro
Contra
Prijs en beschikbaarheid
De nieuwe XMG Focus 17 M25 kan bij Bestware besteld worden vanaf $1.849 - ongeveer $2.100 tegen de wisselkoers op het moment van deze recensie.
Inhoudsopgave
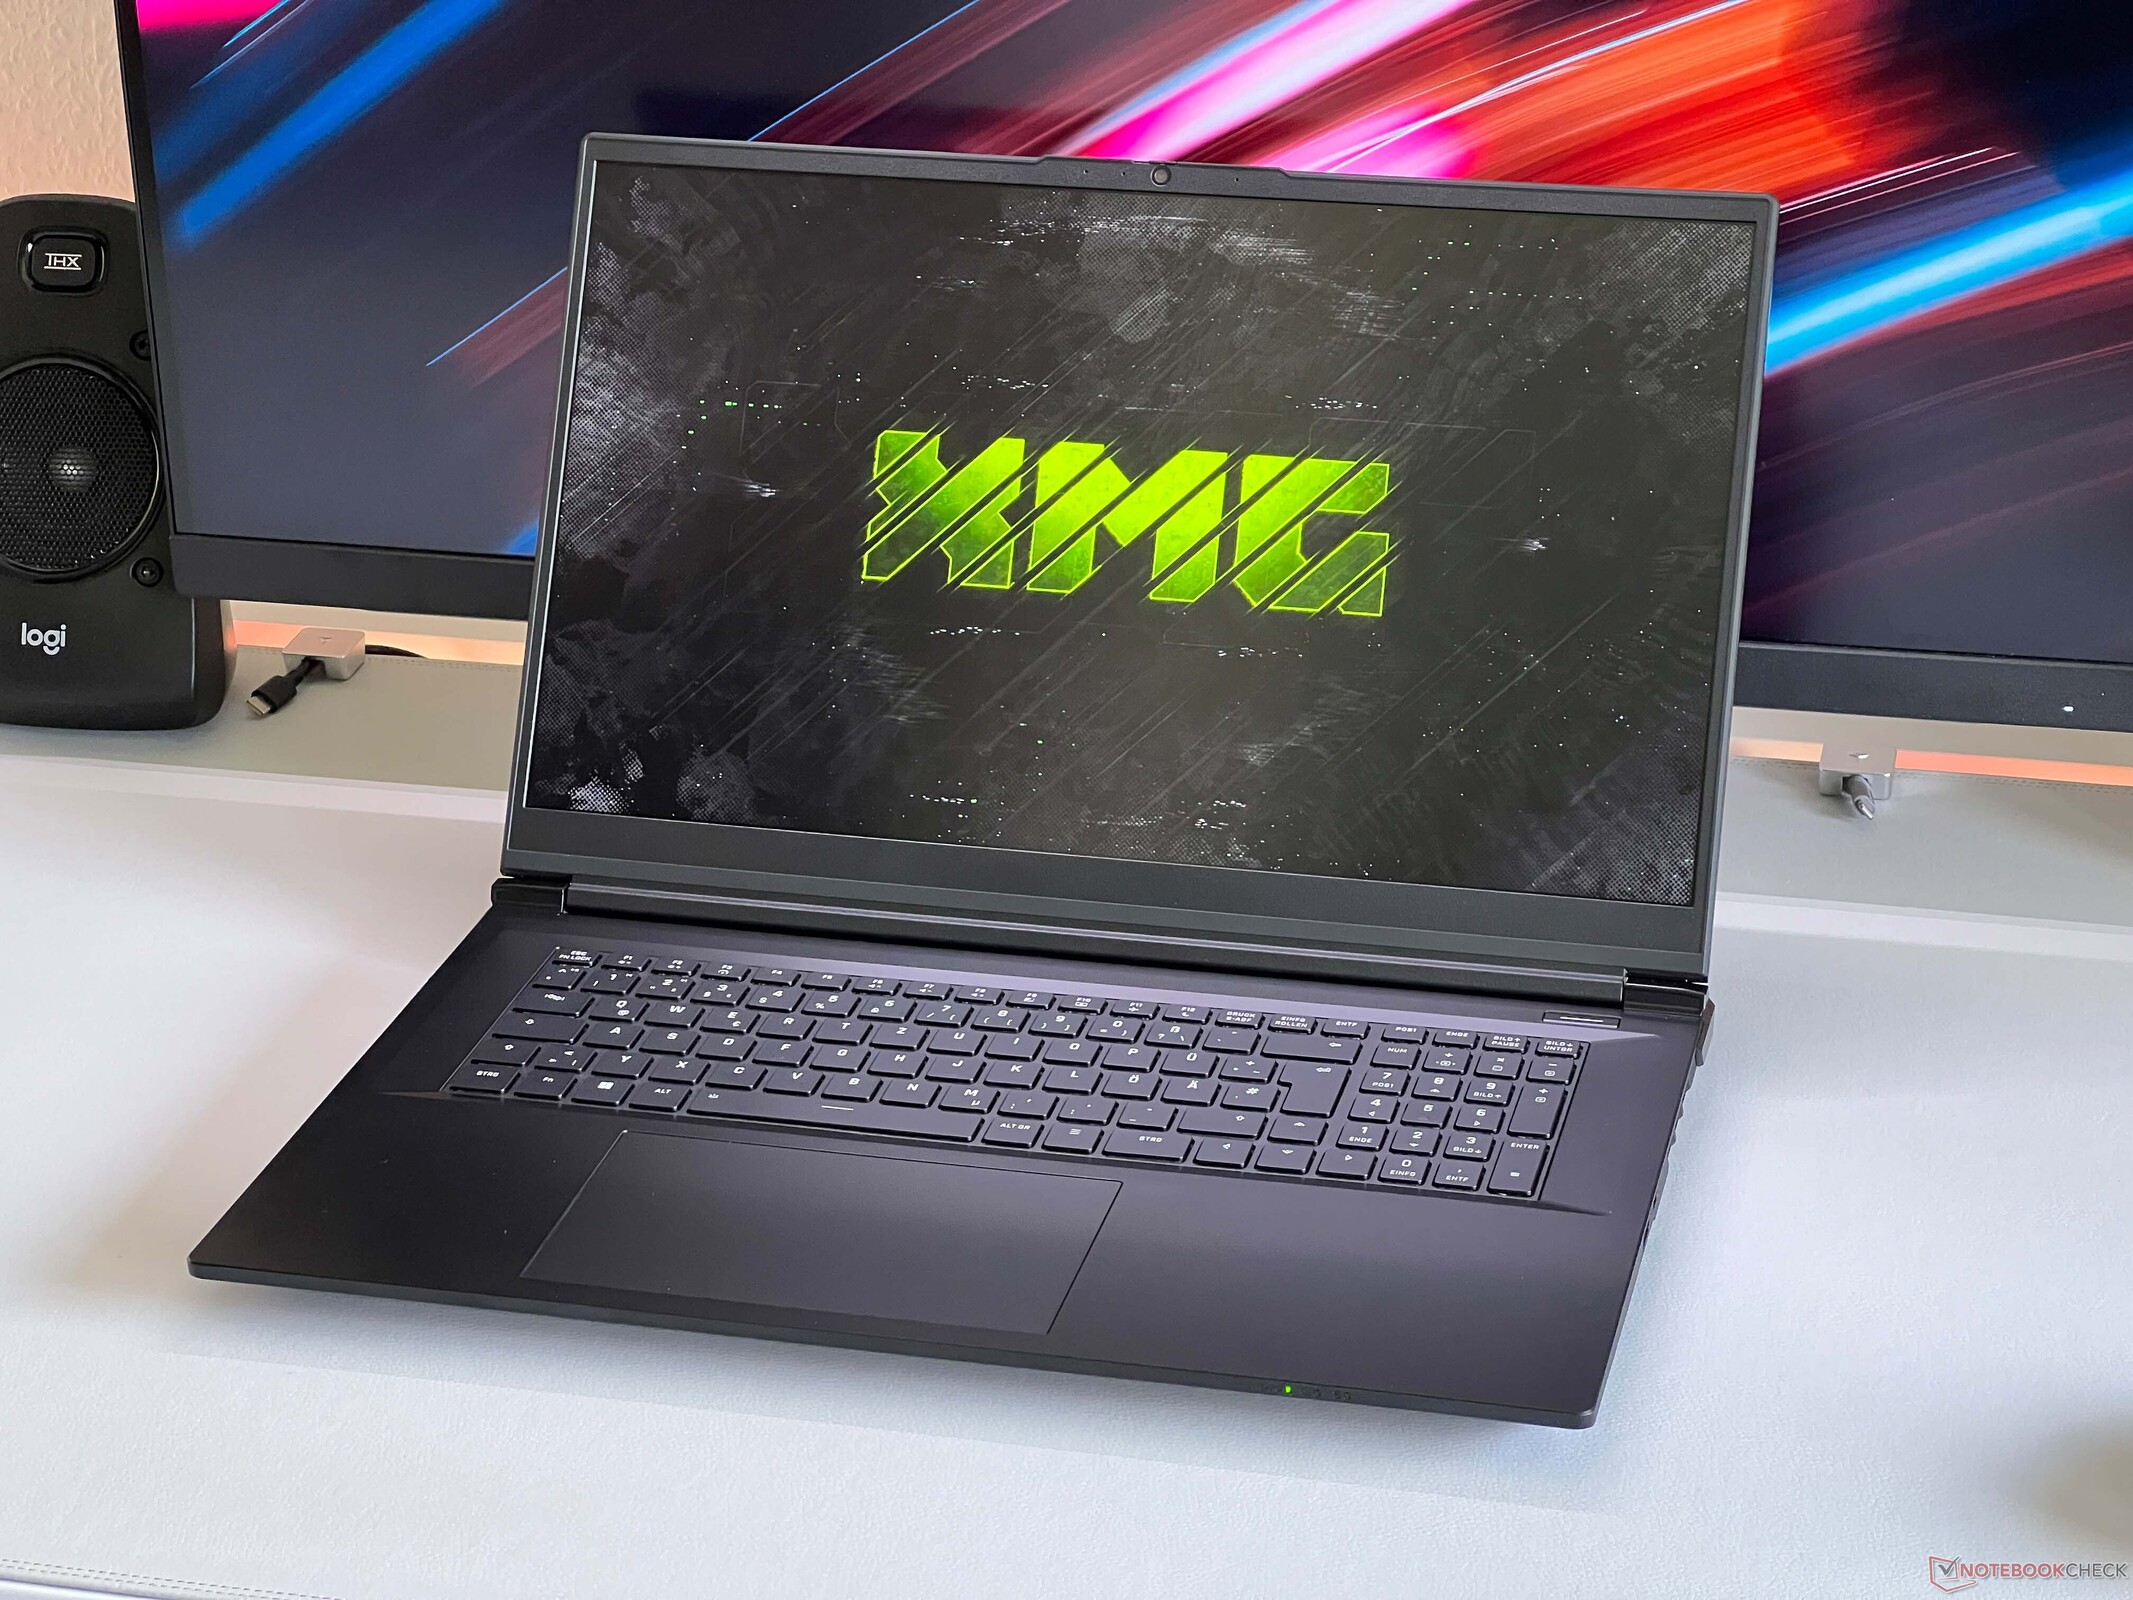
Met de nieuwe Focus 17 M25 biedt XMG een 17-inch gaming laptop die maximale prestaties moet leveren tegen een lage prijs. De vanafprijs voor de Core i9-13900HX, 16 GB RAM, een 1 TB SSD en de nieuwe GeForce RTX 5070 Ti laptop GPU (140 watt) is €1.849 ($2.100), en onze 32 GB RAM, Wi-Fi 7 en Windows 11 Home reviewconfiguratie kost €1.990 ($2.300).
Er zijn nauwelijks echte 17-inch concurrenten, want de MSI Vector 17 HX met de RTX 5070 Ti is momenteel verkrijgbaar voor ongeveer €3.100 ($3.600). Er zijn verschillende vergelijkbare apparaten in het 16-inch segment, maar dit is ook een gebied waar de Focus 17 een prijsvoordeel heeft.
Specificaties
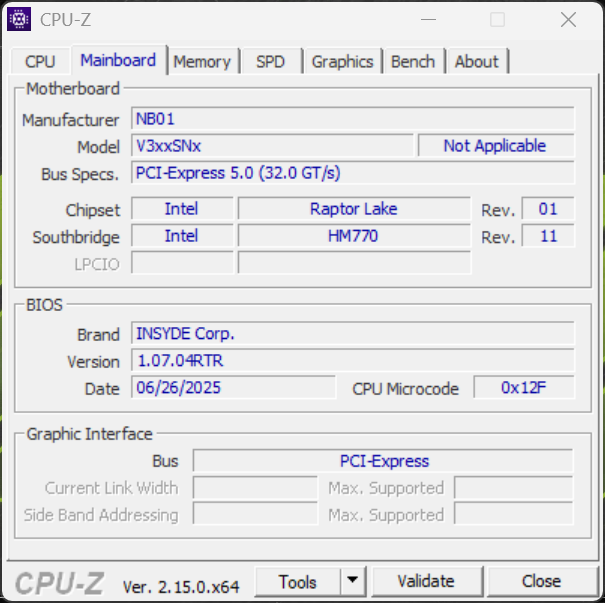
Behuizing & functies
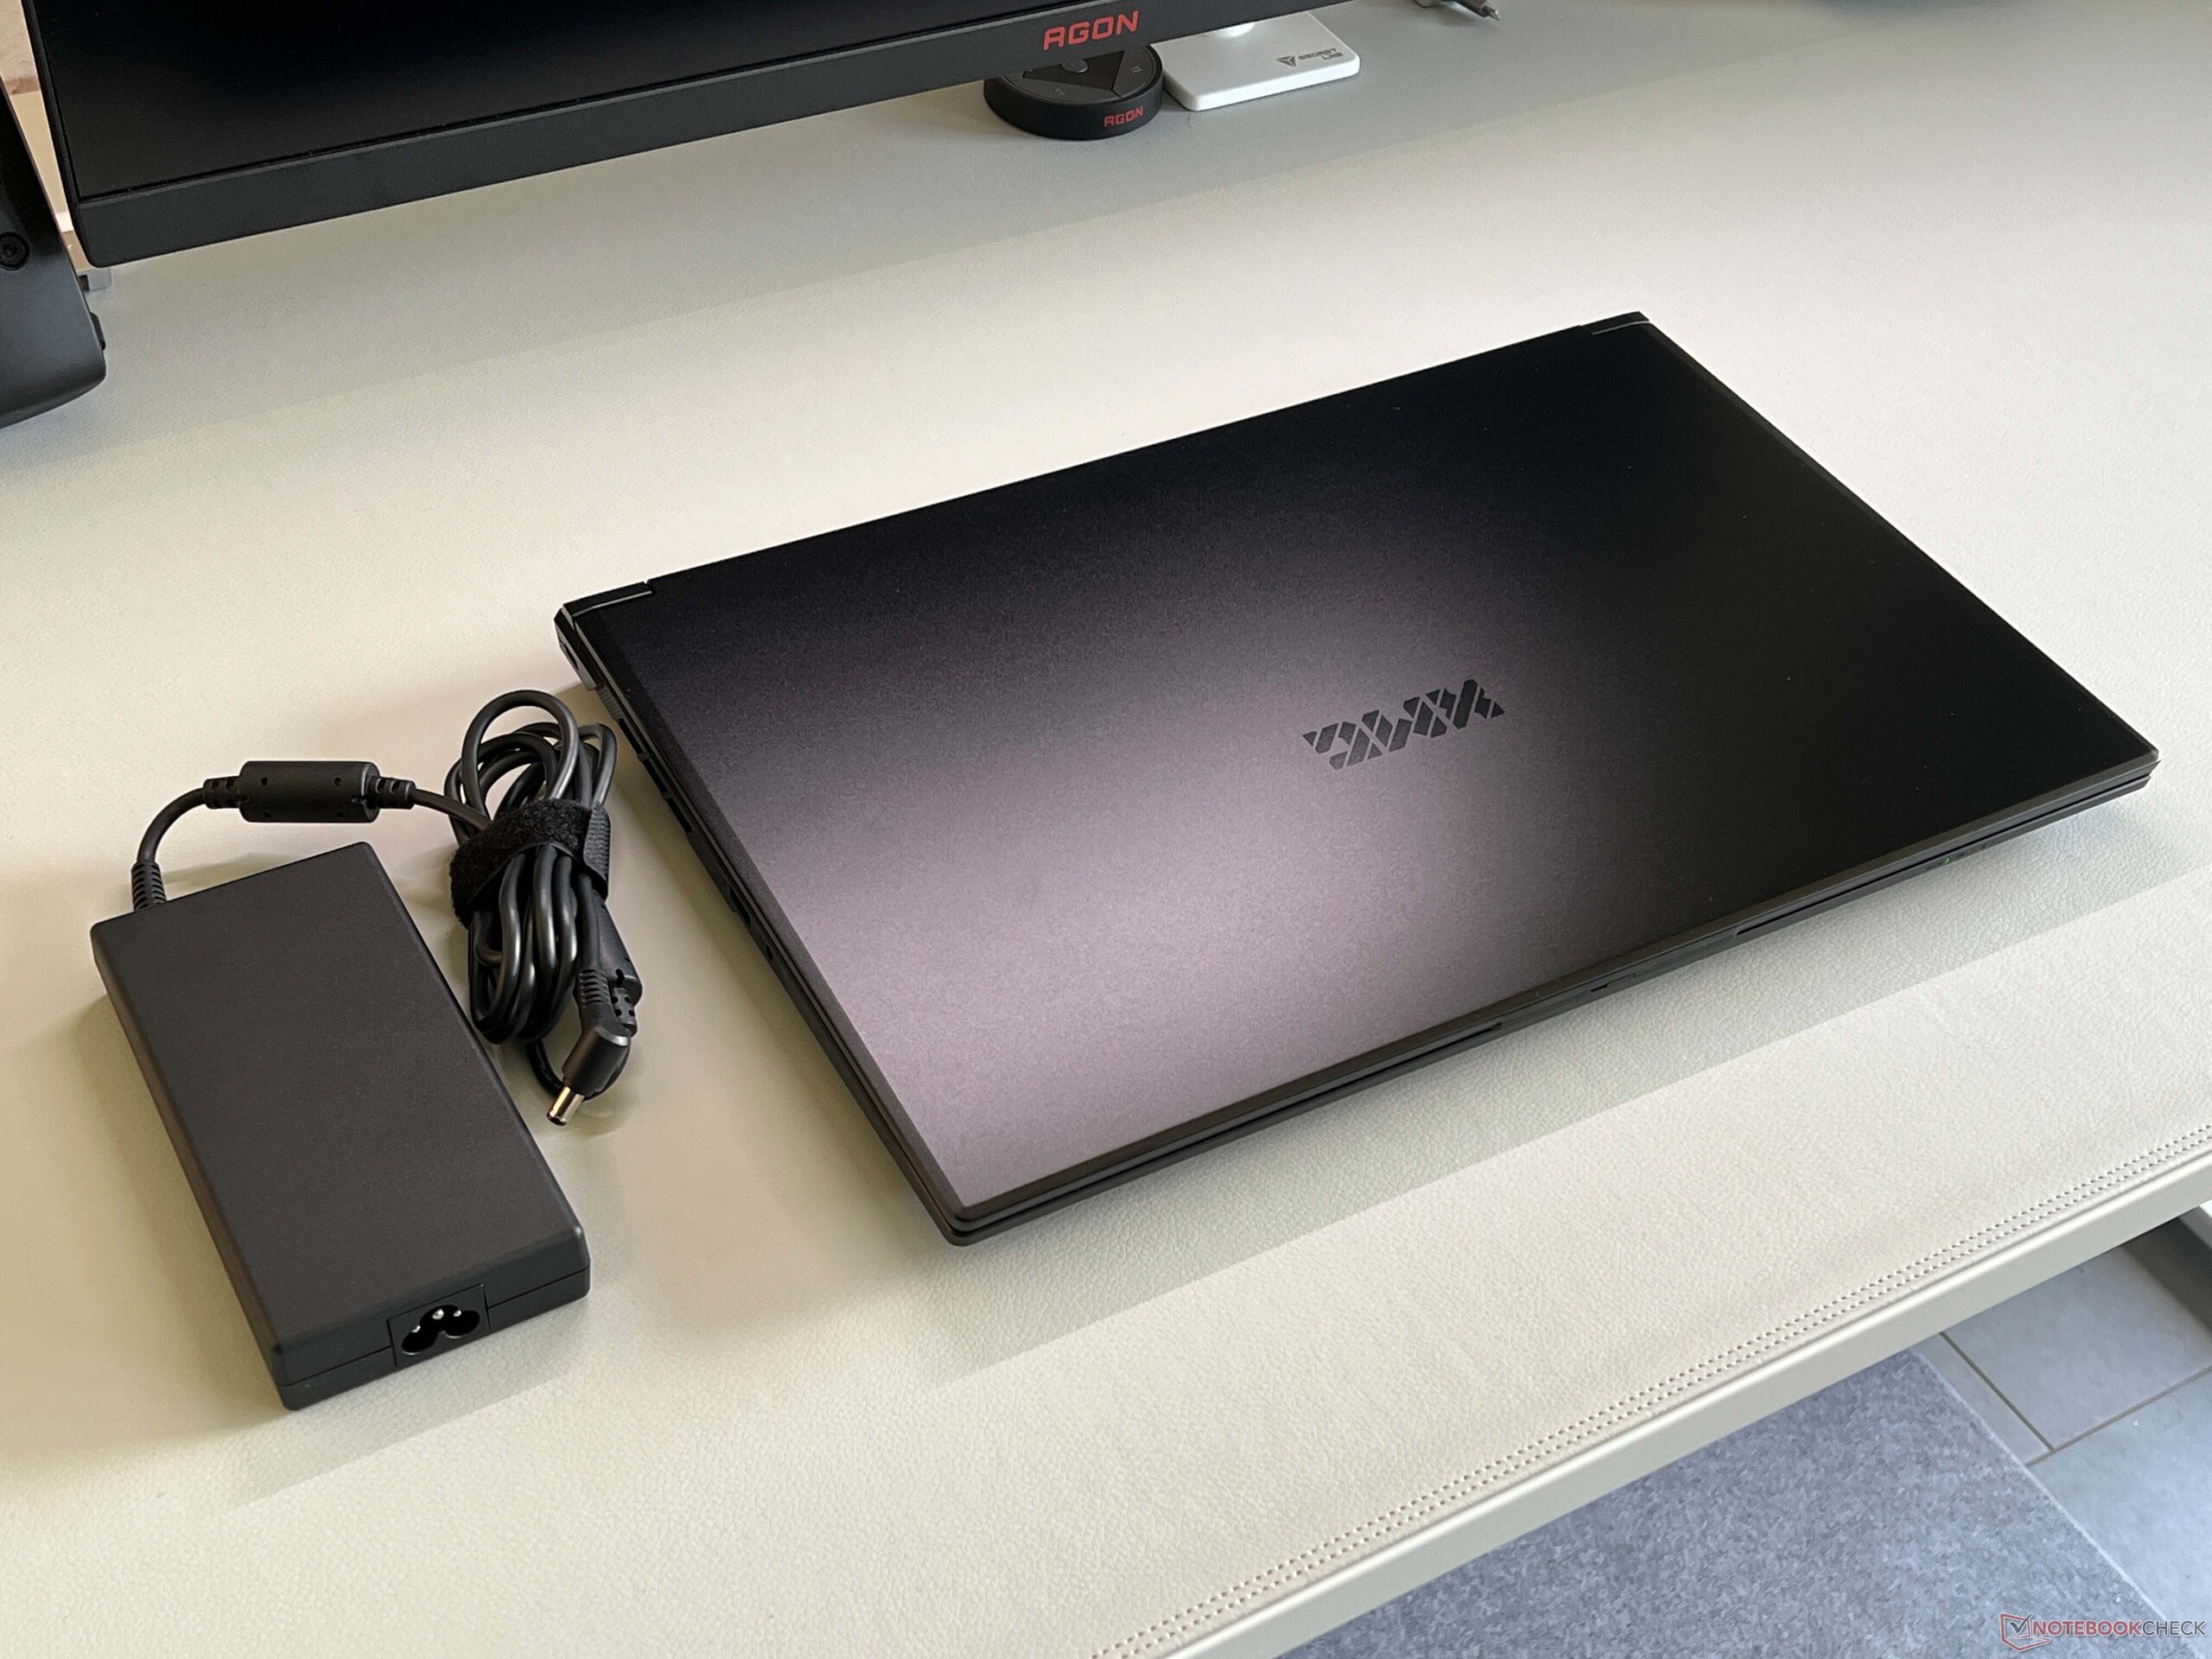
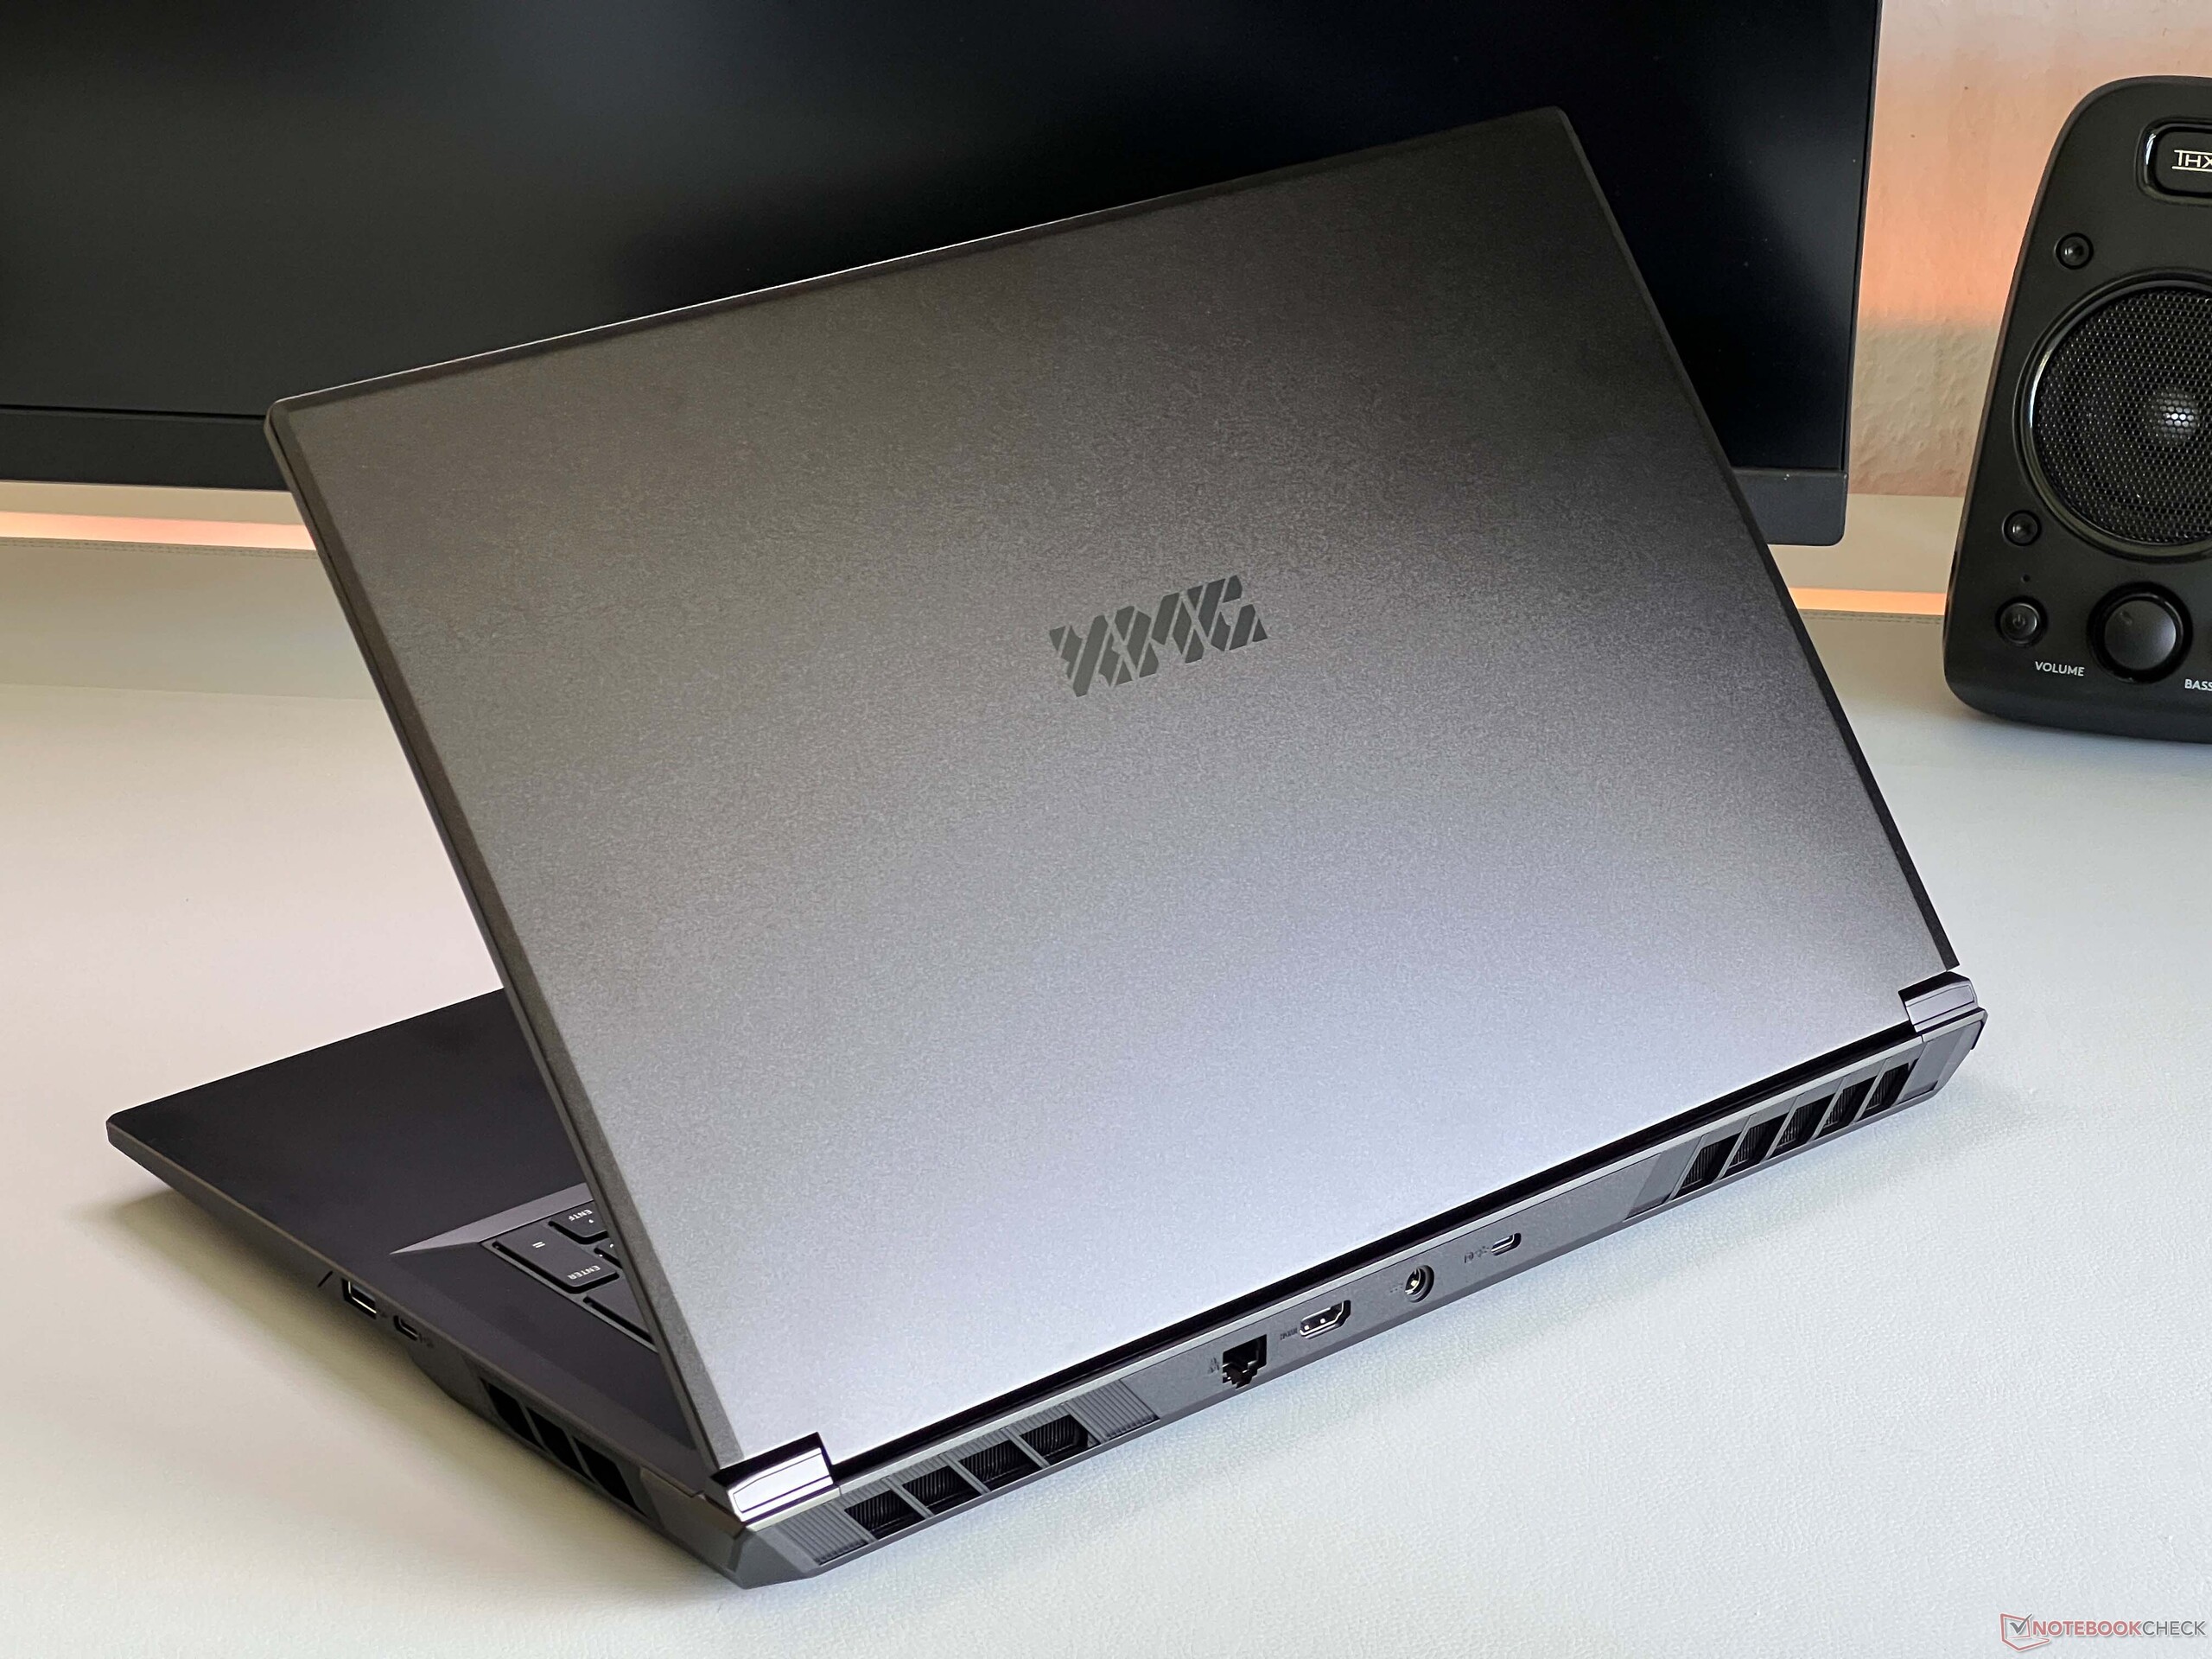
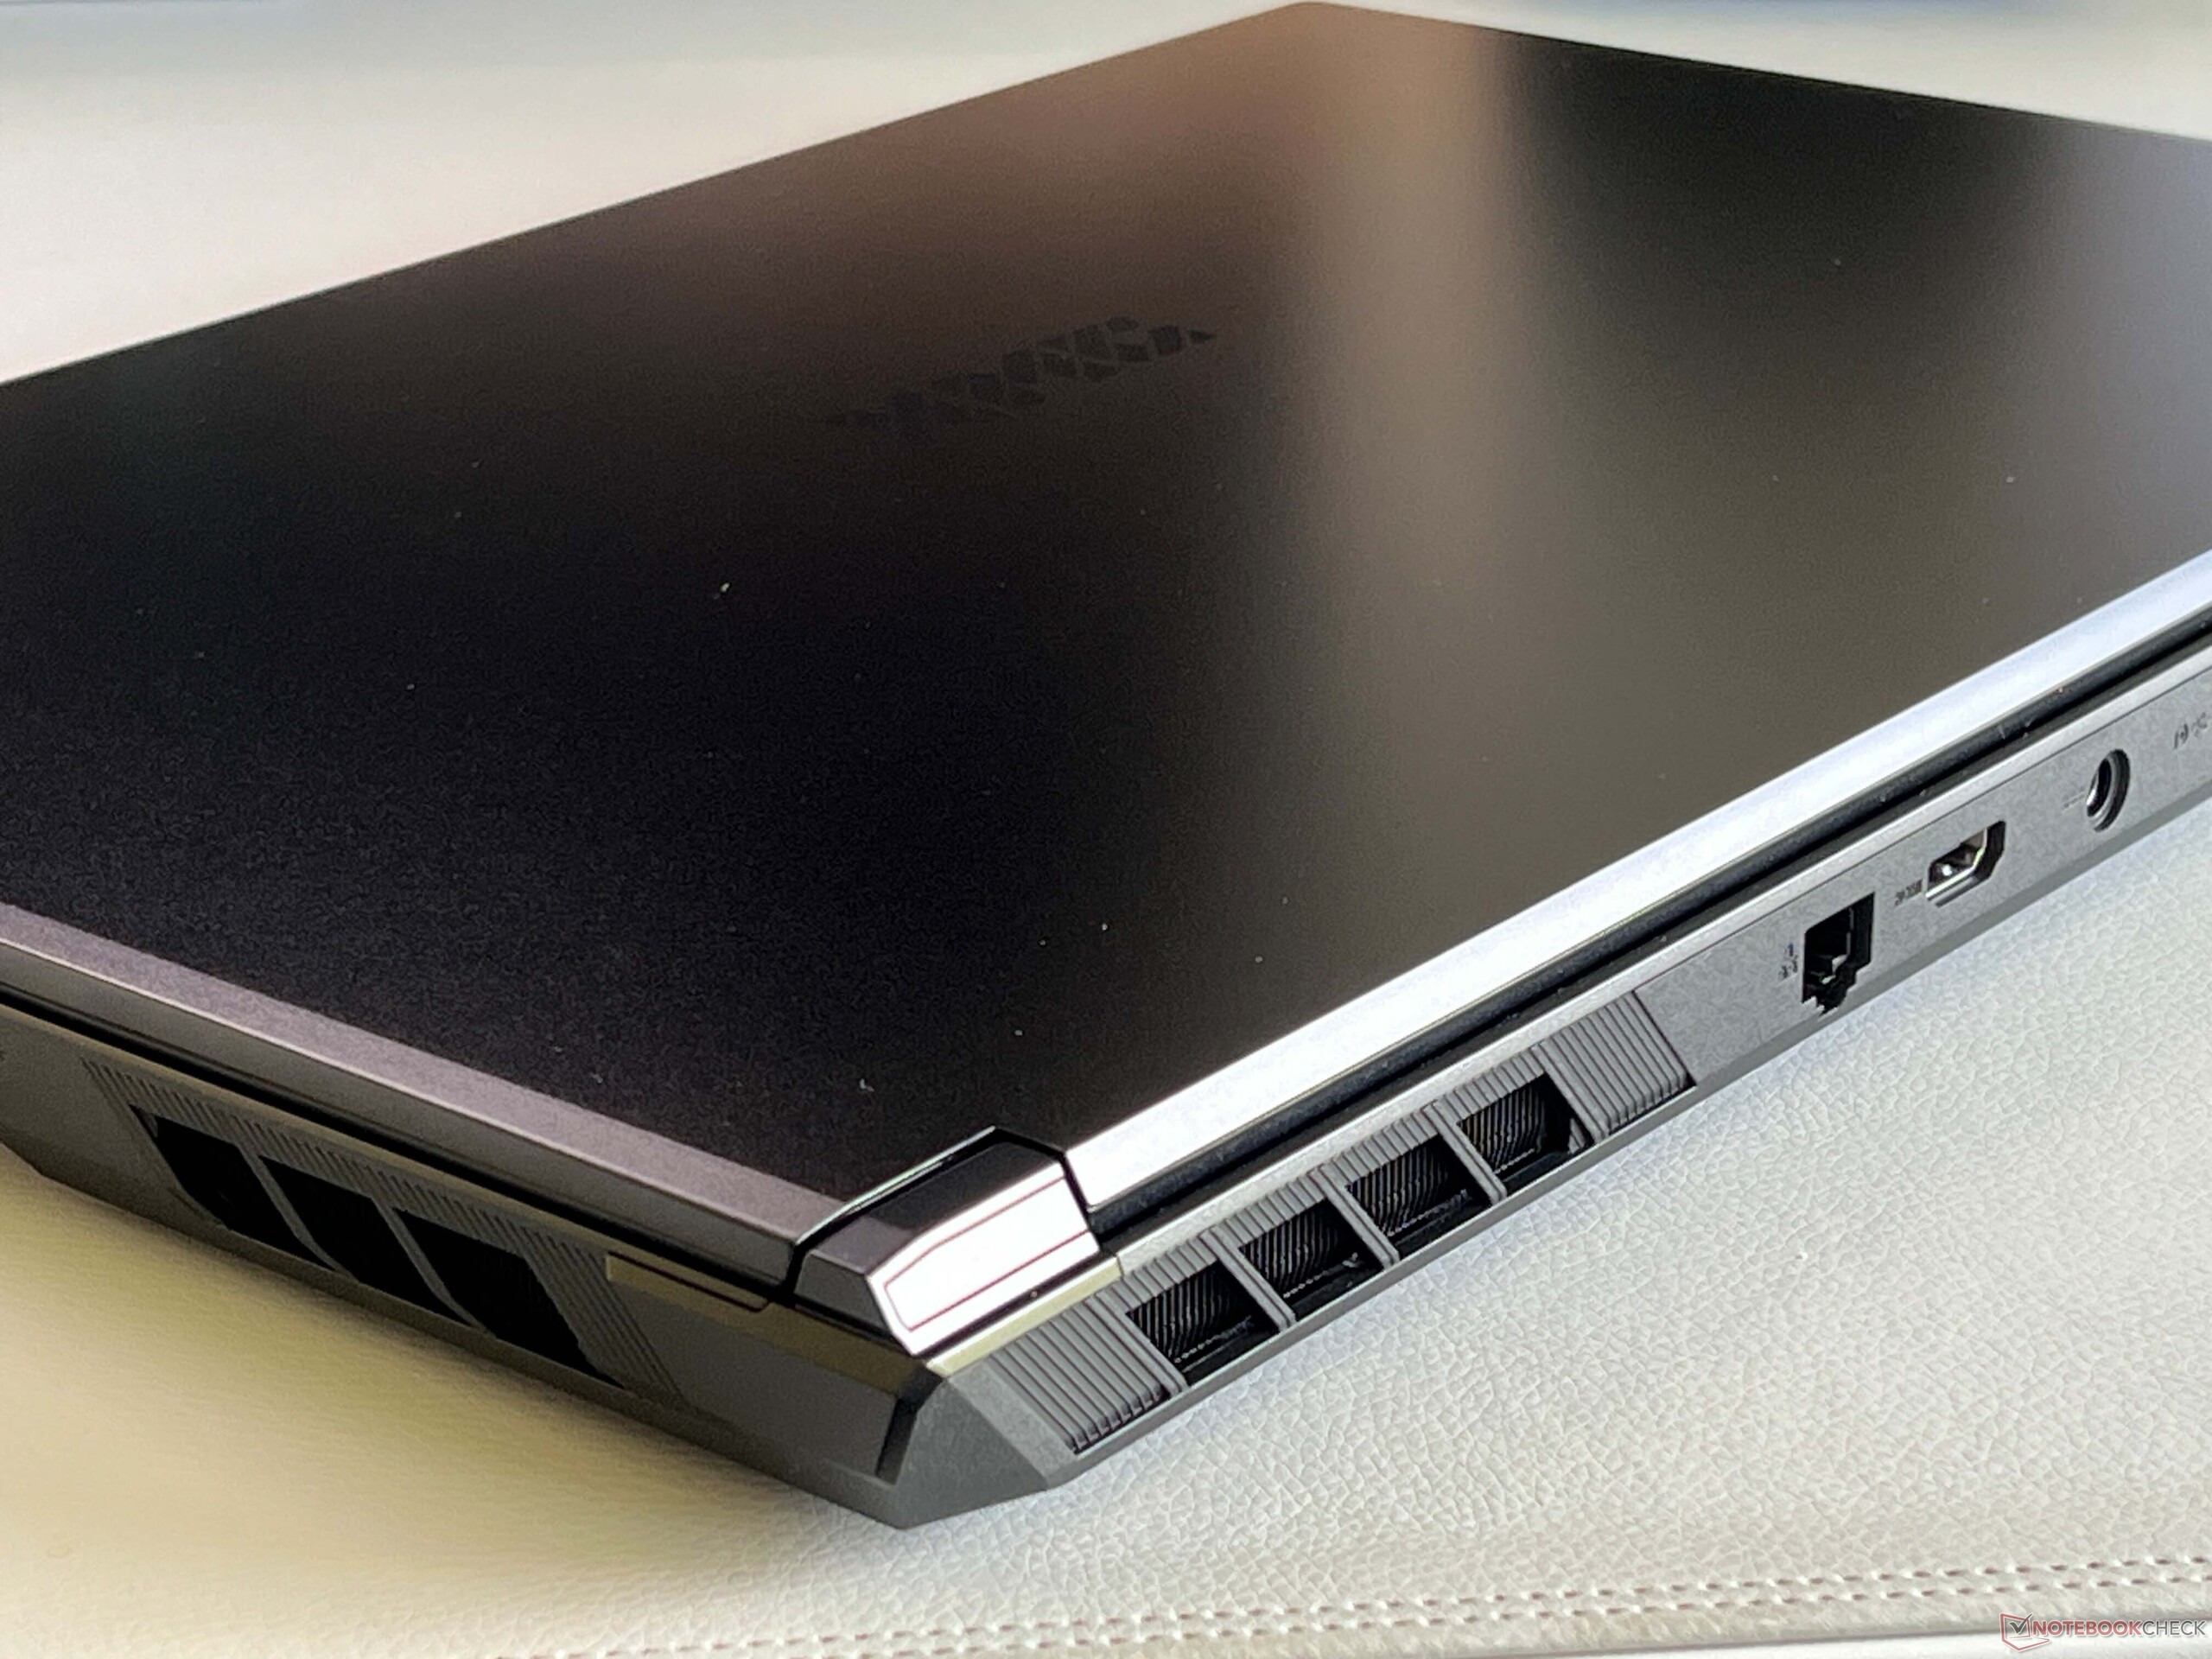
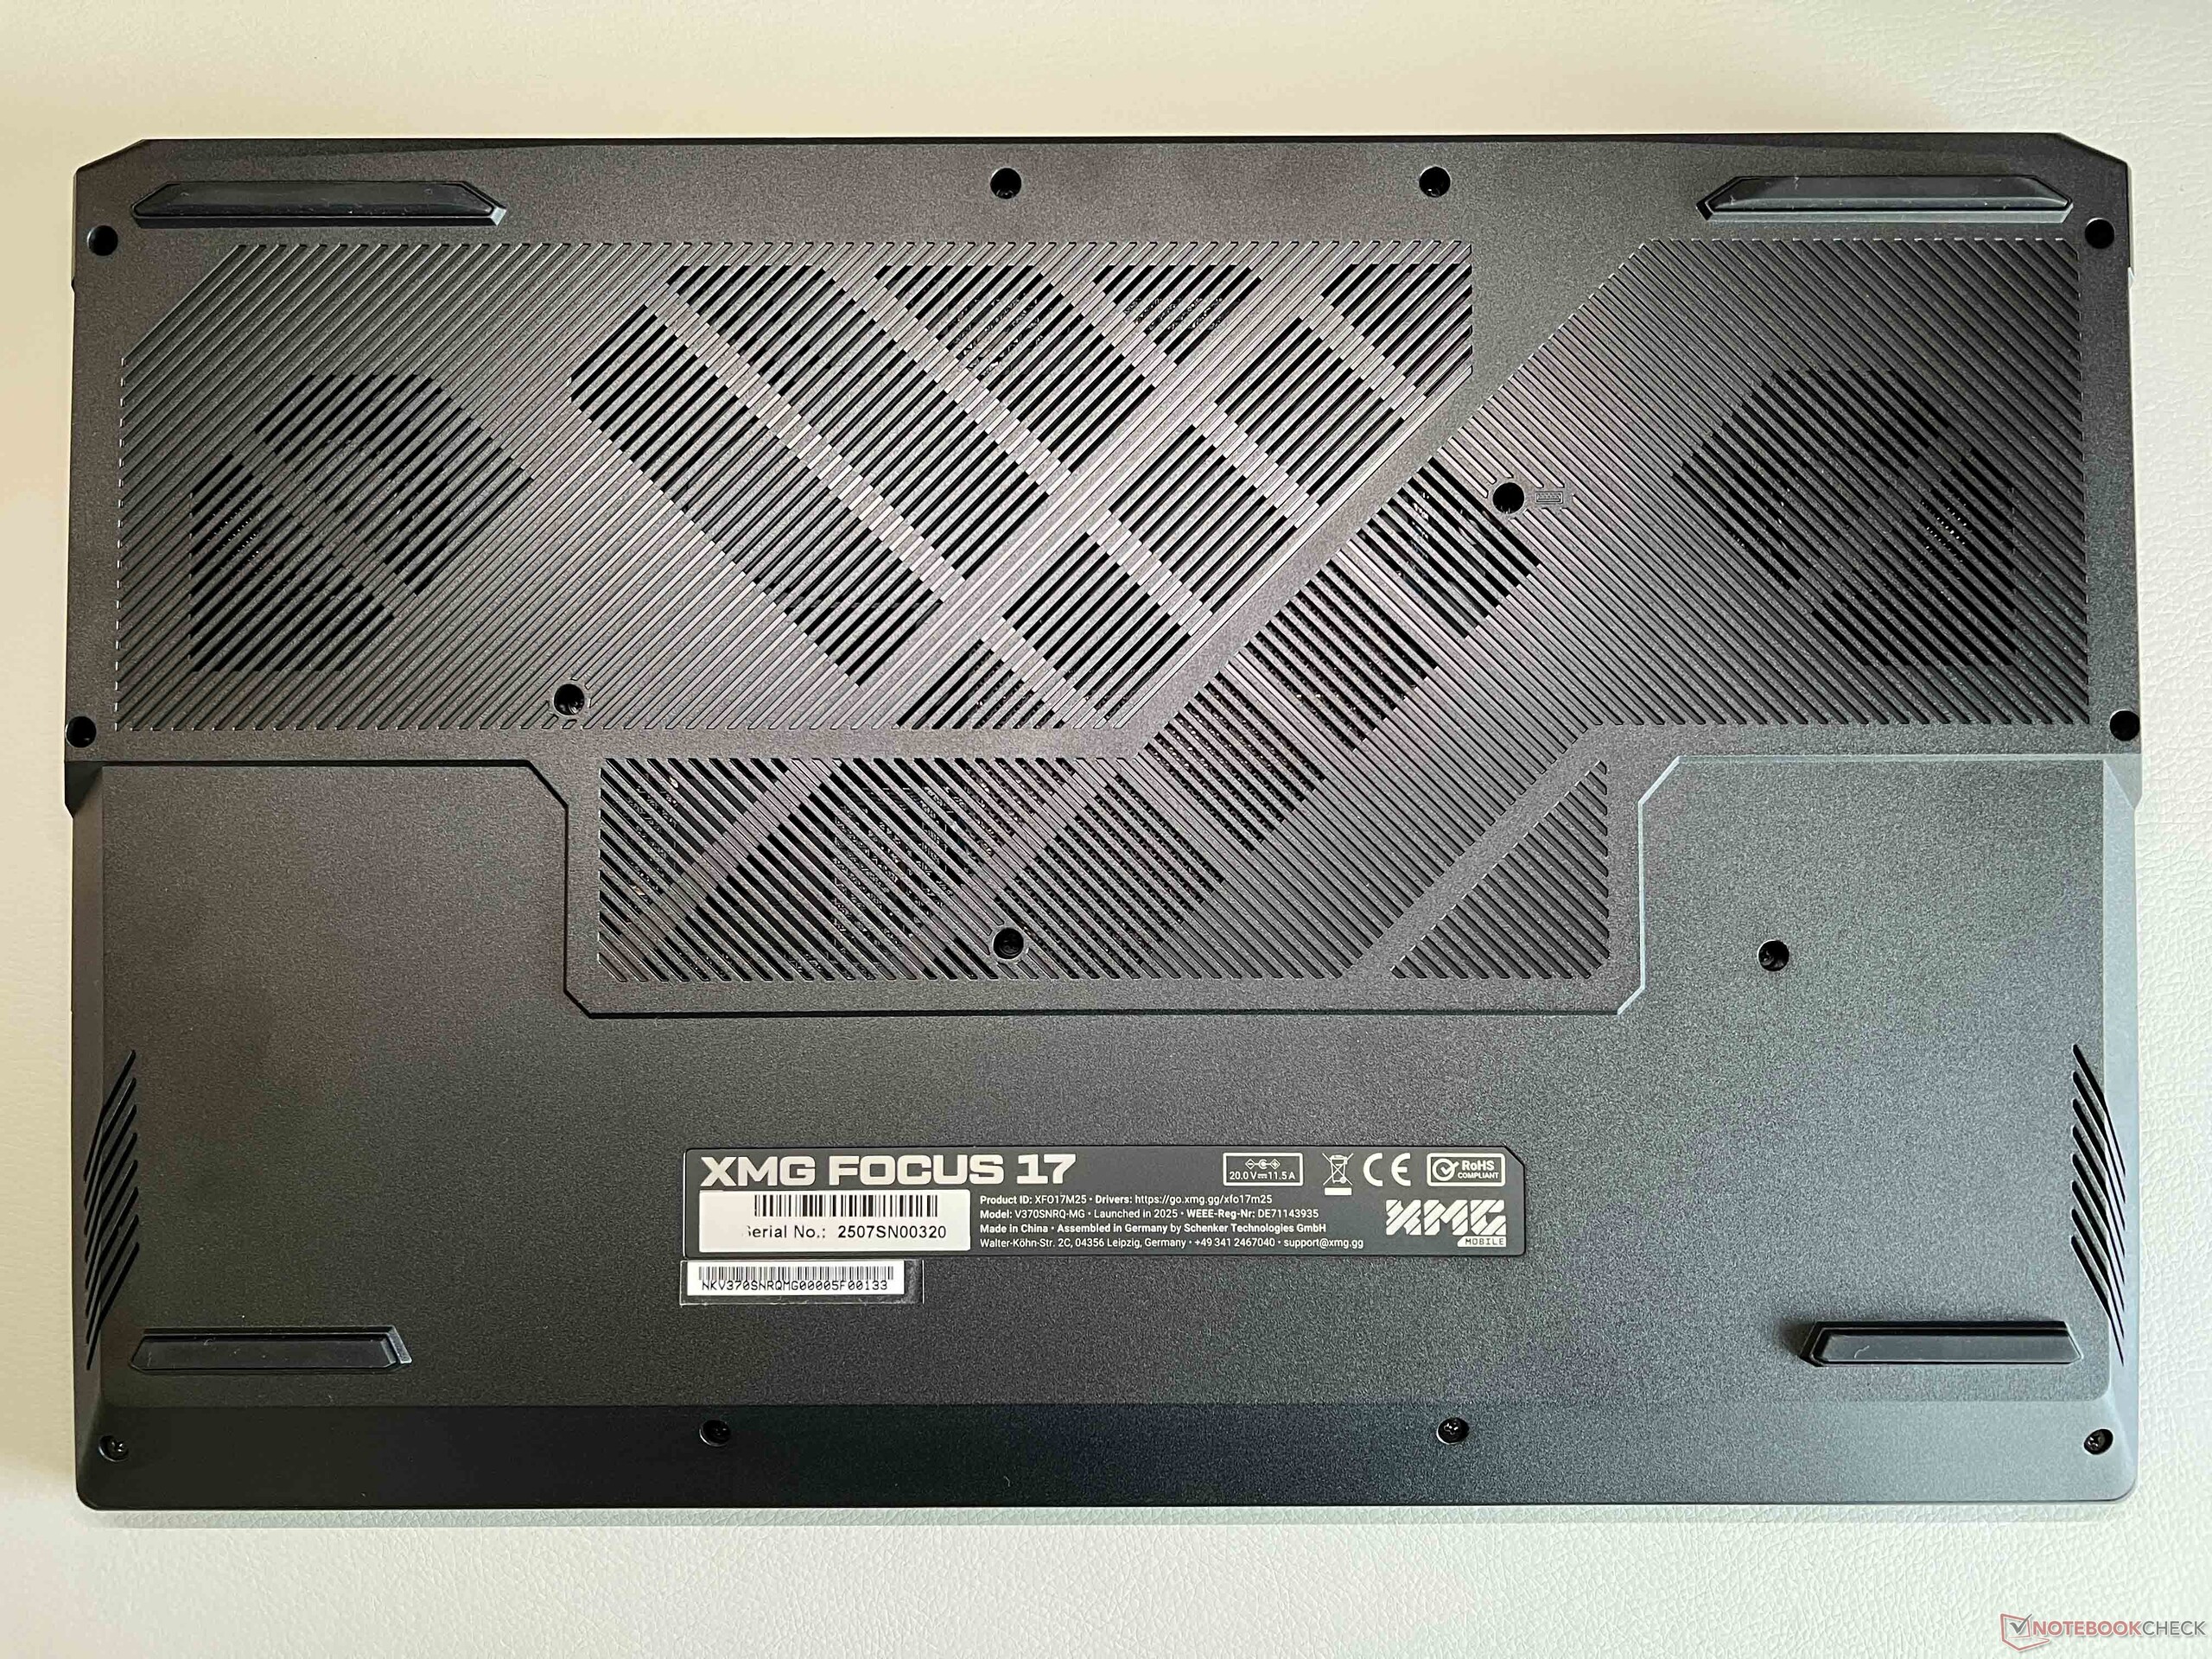
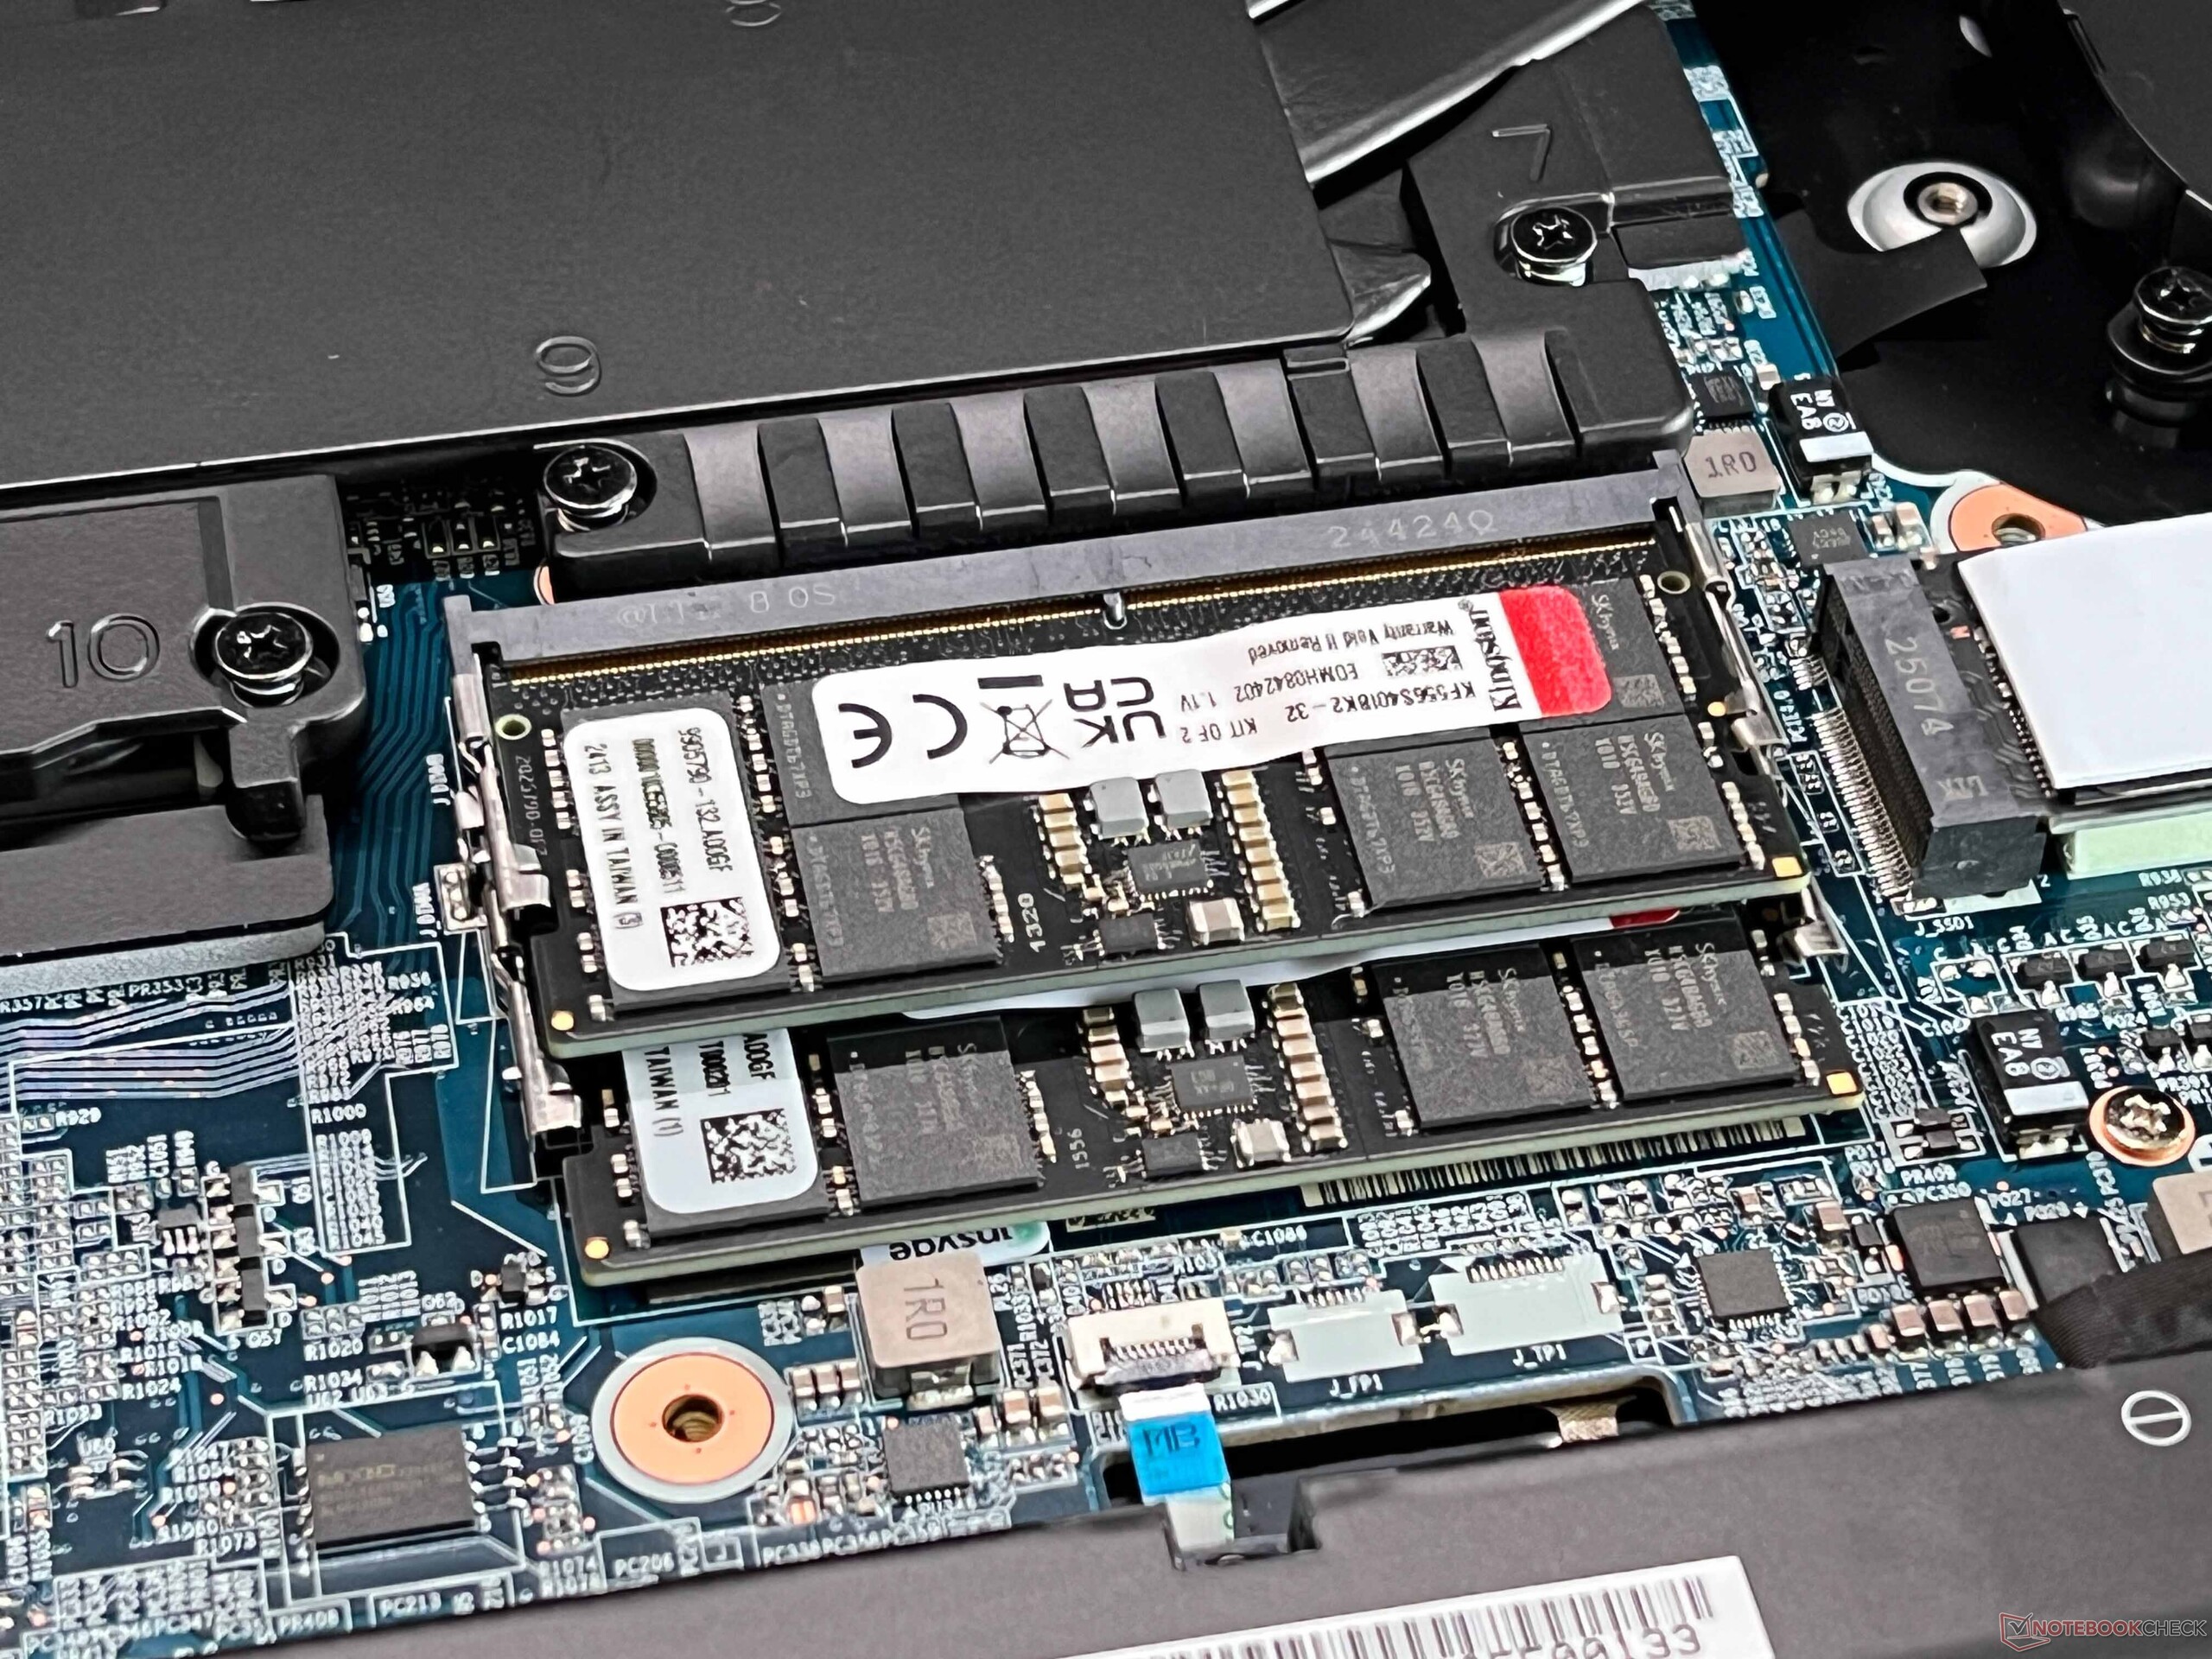
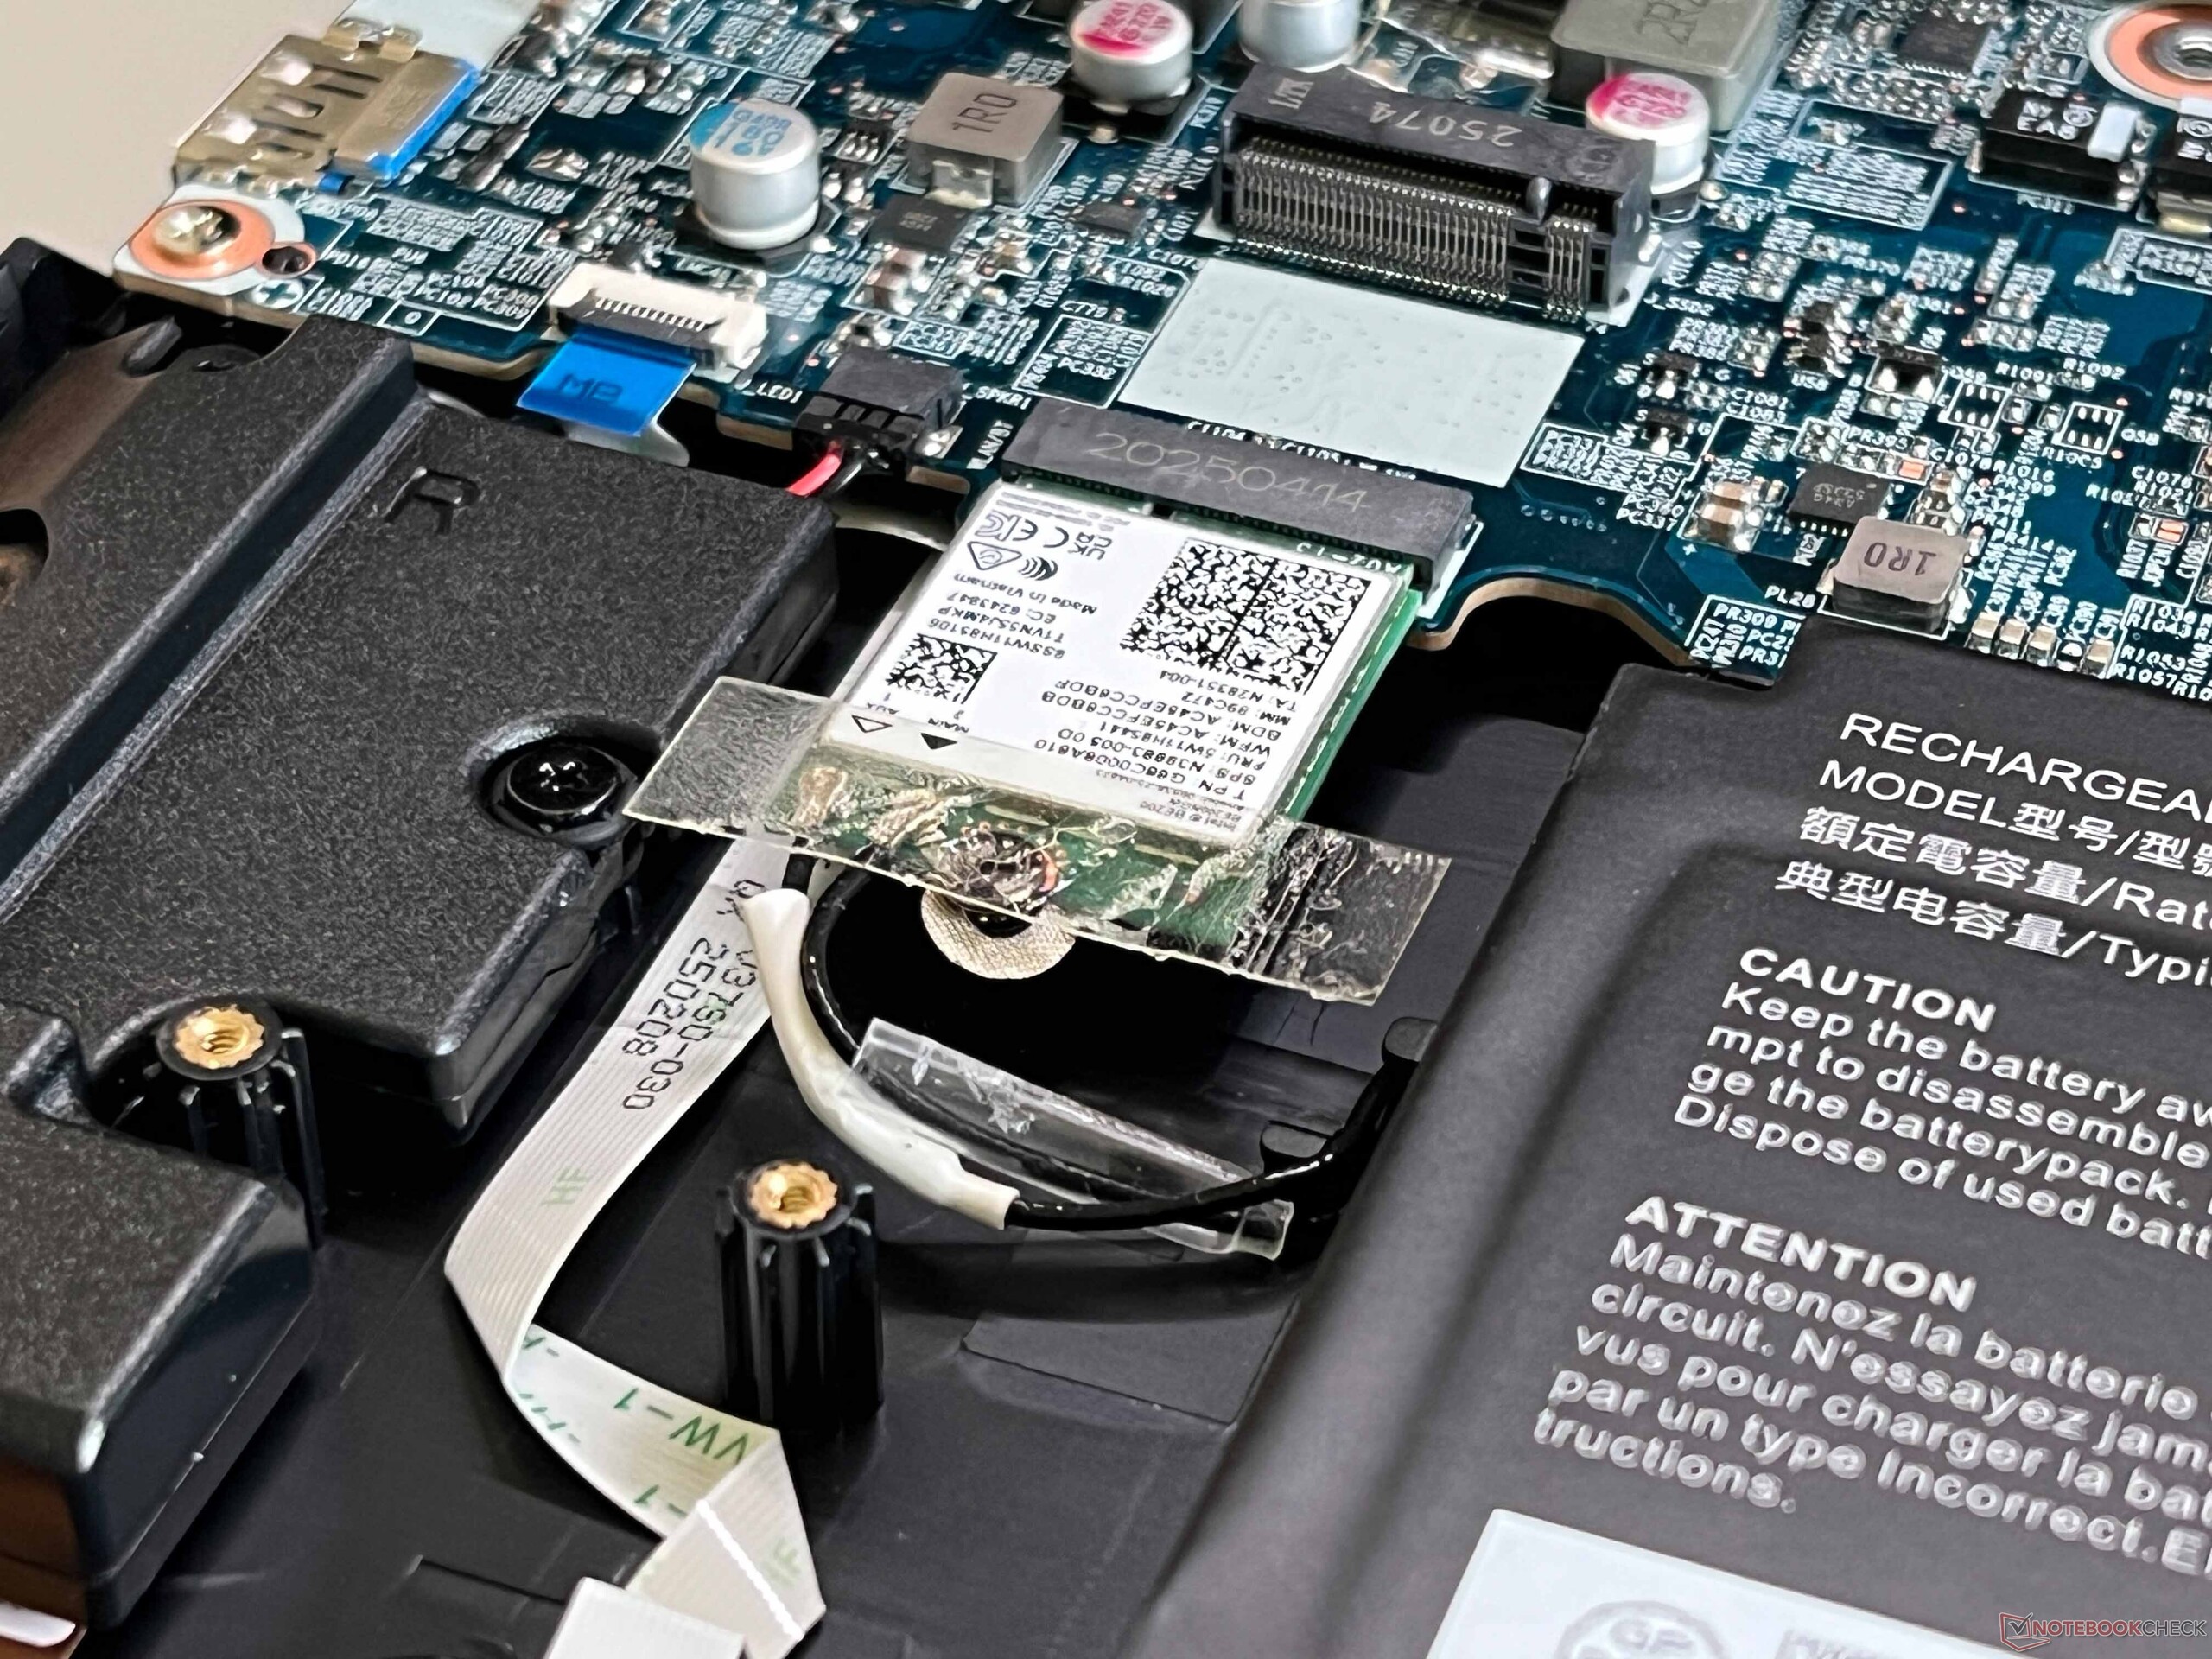
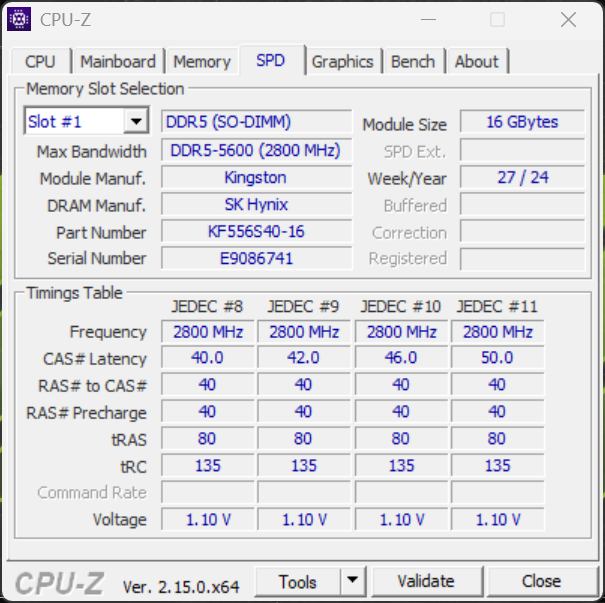
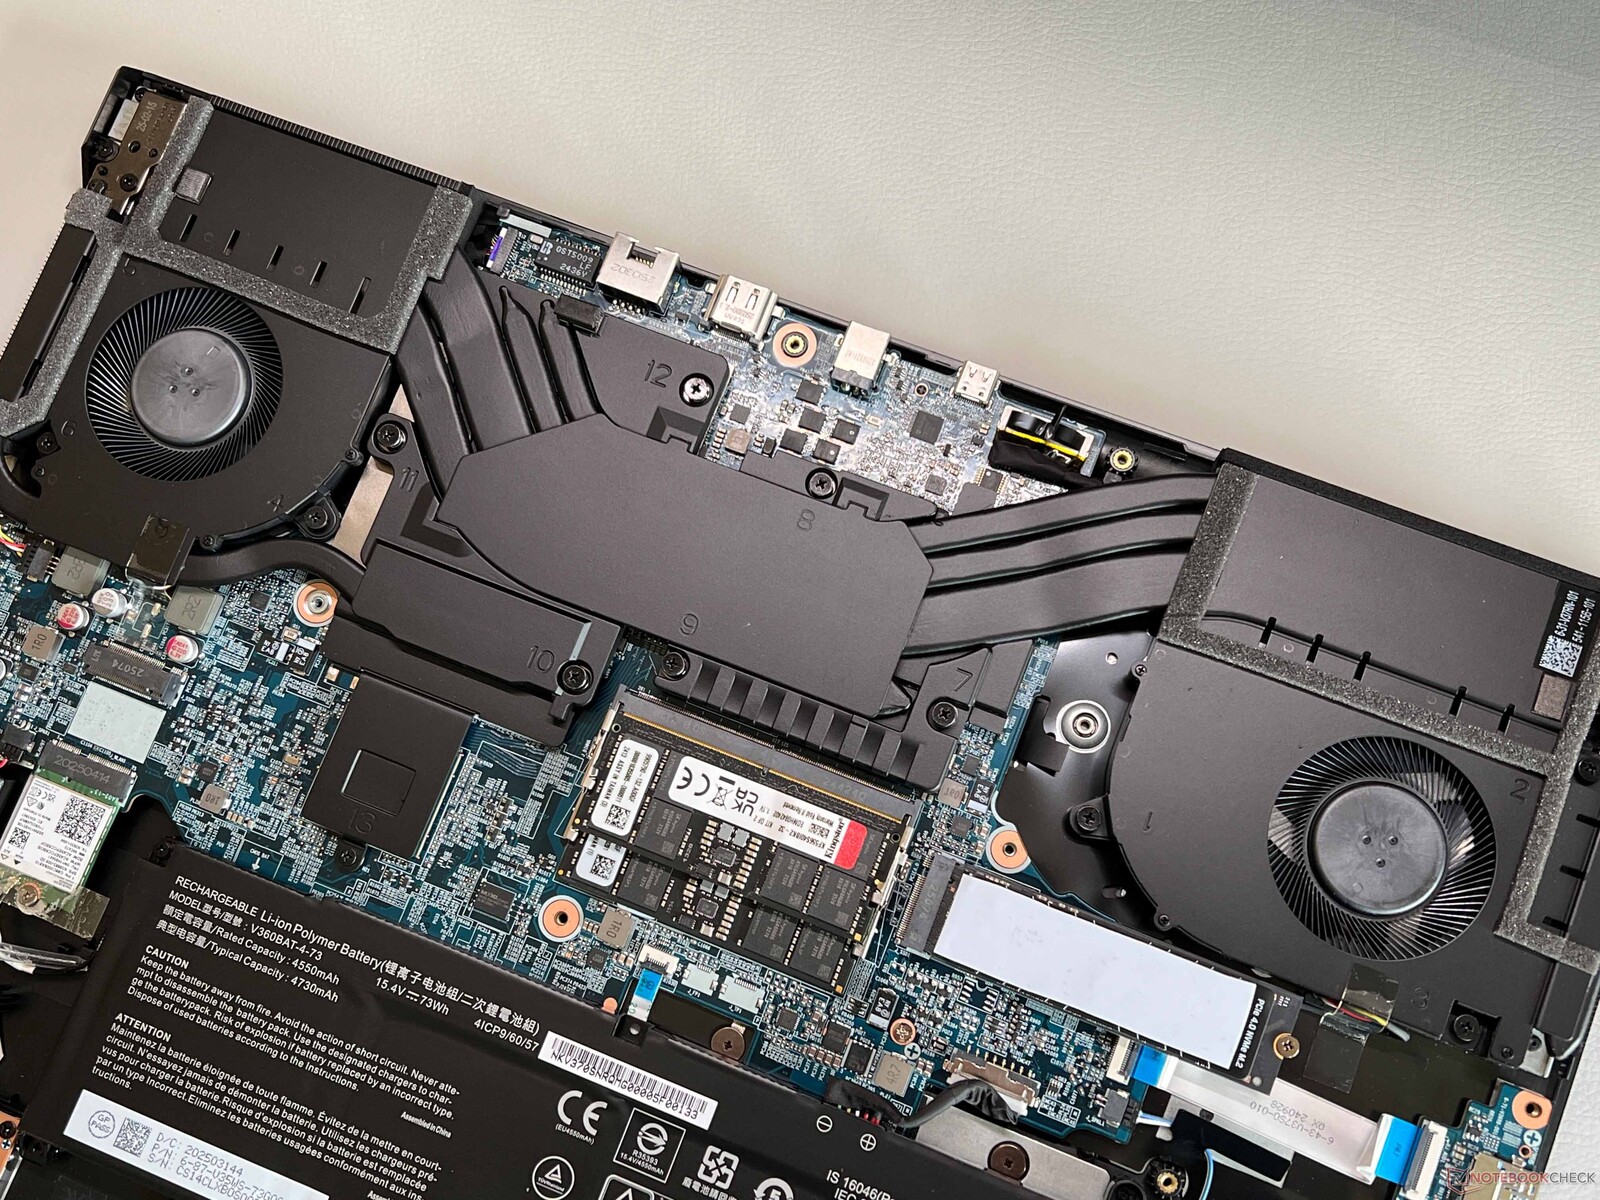
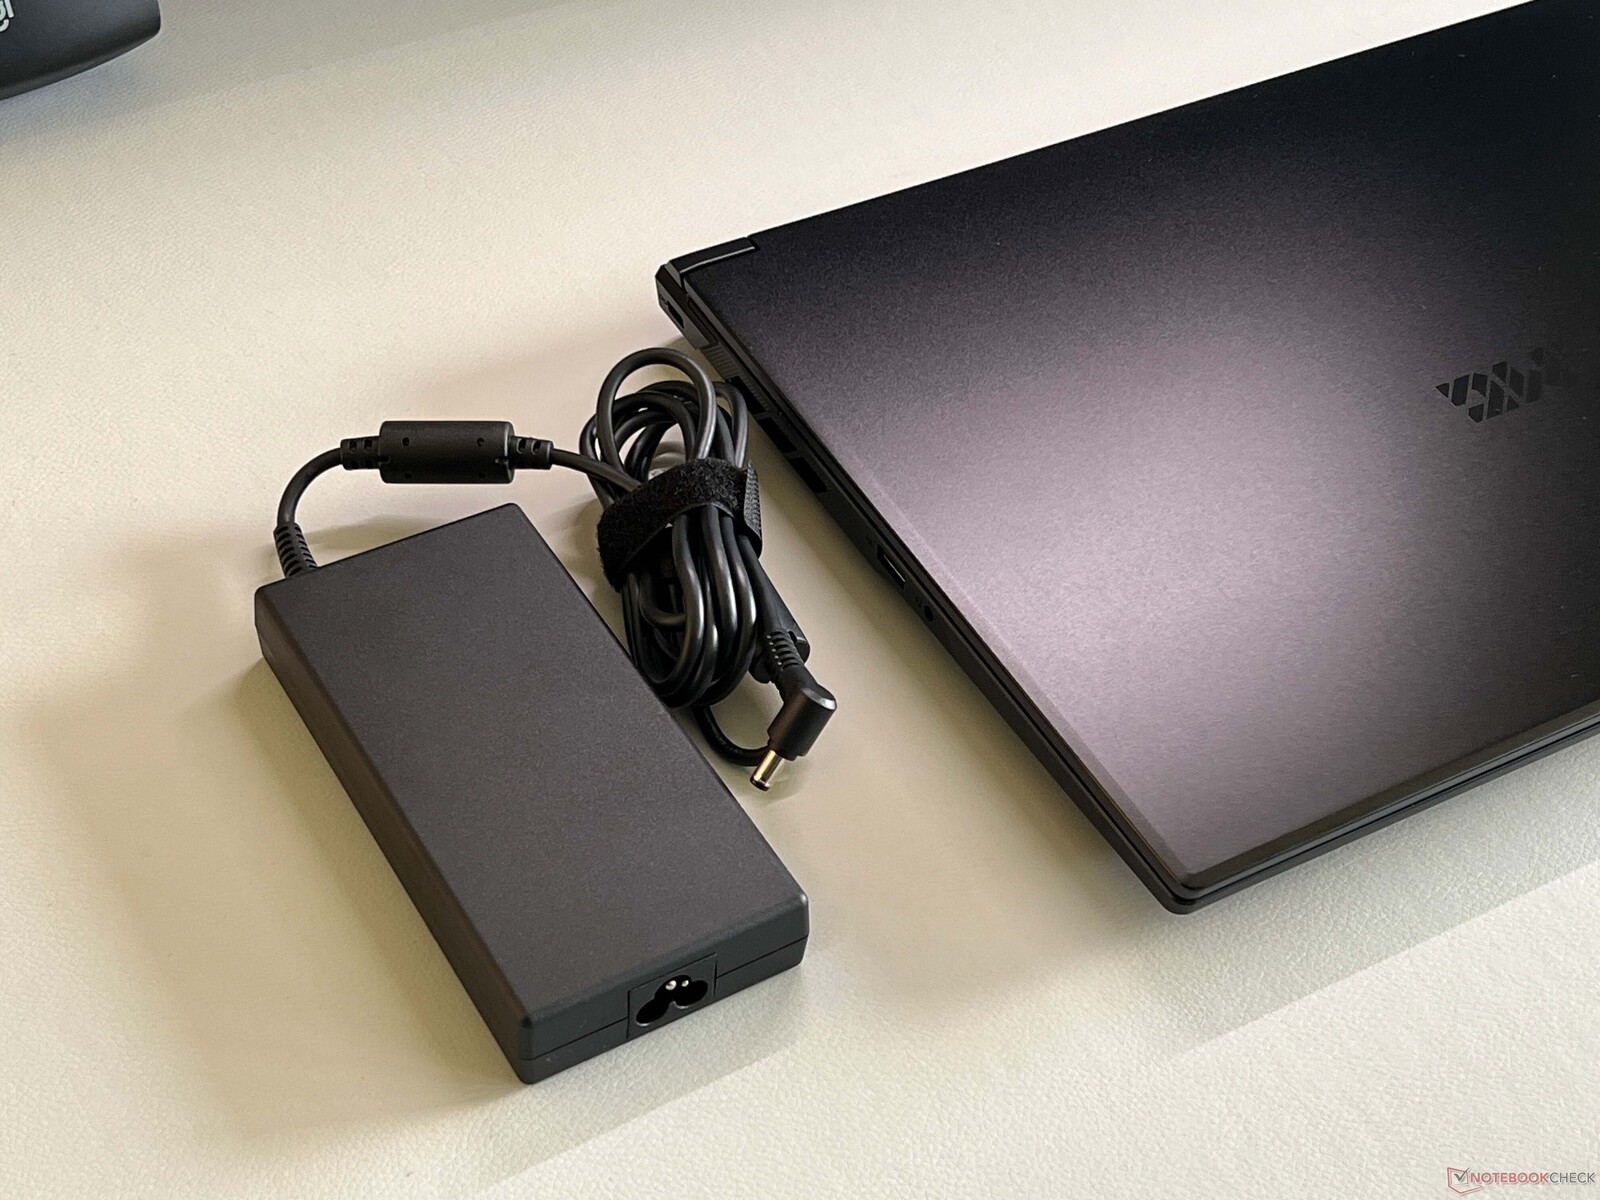
Met zijn zwarte oppervlakken is het ontwerp van de behuizing erg rechtlijnig, en er zijn geen verlichtingselementen behalve het toetsenbord. Het deksel is gemaakt van aluminium, maar de rest van de behuizing is van plastic, en de oppervlakken zijn over het algemeen erg gevoelig voor vuil. Noch de bouwkwaliteit noch de stabiliteit leveren grote problemen op, hoewel de basiseenheid lichte krakende geluiden maakt wanneer er druk wordt uitgeoefend. De maximale openingshoek van het scherm is 130 graden, maar de scharnieren wiebelen een beetje. De onderhoudsmogelijkheden zijn over het algemeen erg goed, aangezien er twee sleuven zijn voor zowel RAM als SSD's, de Wi-Fi-module en de batterij indien nodig vervangen kunnen worden, en de ventilatoren ook gemakkelijk schoon te maken zijn.
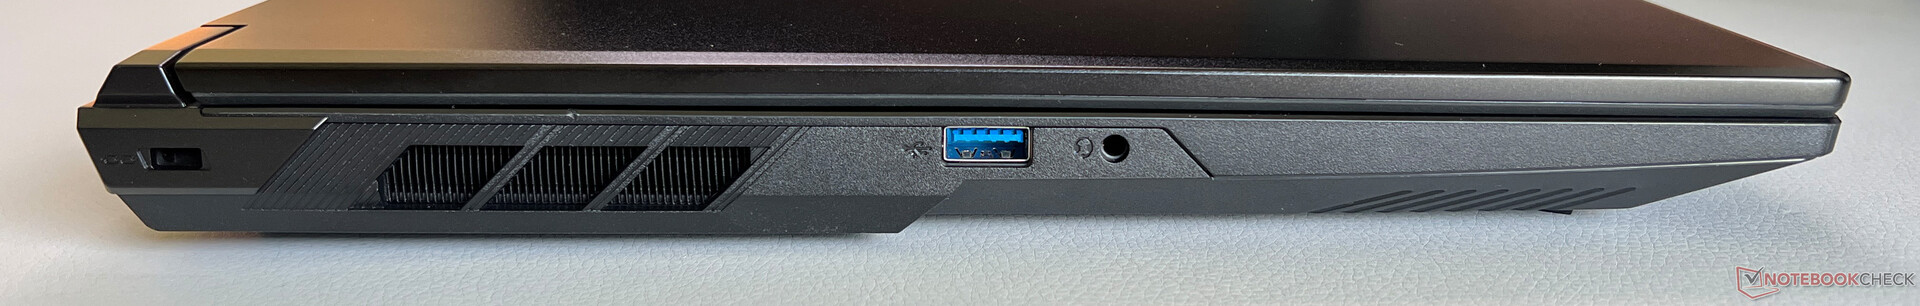
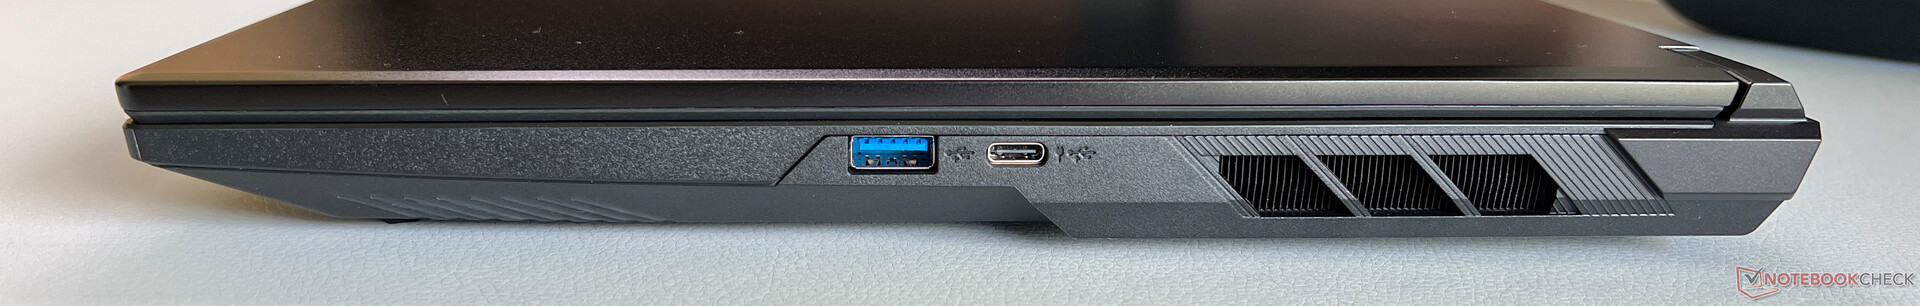
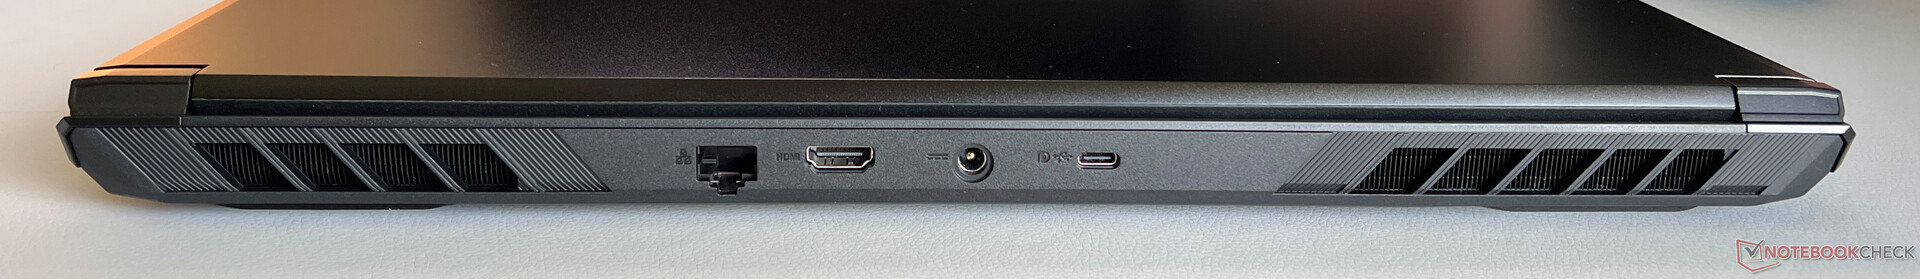
Thunderbolt ontbreekt, maar er zijn voldoende USB-poorten, evenals een Intel Wi-Fi 7 module, die indruk maakt met goede, stabiele overdrachtssnelheden. De 1080p webcam (met mechanische sluiter) maakt slechts gemiddelde foto's, en er is geen IR-module.


| Networking | |
| Schenker XMG Focus 17 M25 | |
| iperf3 transmit AXE11000 | |
| iperf3 receive AXE11000 | |
| MSI Vector 17 HX AI A2XWIG | |
| iperf3 transmit AXE11000 | |
| iperf3 receive AXE11000 | |
| iperf3 transmit AXE11000 6GHz | |
| iperf3 receive AXE11000 6GHz | |
| Lenovo Legion 5 Pro 16IAX10H | |
| iperf3 transmit AXE11000 | |
| iperf3 receive AXE11000 | |
| MSI Vector 16 HX AI A2XWHG | |
| iperf3 transmit AXE11000 | |
| iperf3 receive AXE11000 | |
| Schenker XMG Pro 16 (E25) | |
| iperf3 transmit AXE11000 | |
| iperf3 receive AXE11000 | |


Duurzaamheid
De fabrikant heeft geen uitspraken gedaan over duurzaamheid. De verpakking is volledig recyclebaar.
Invoerapparaten
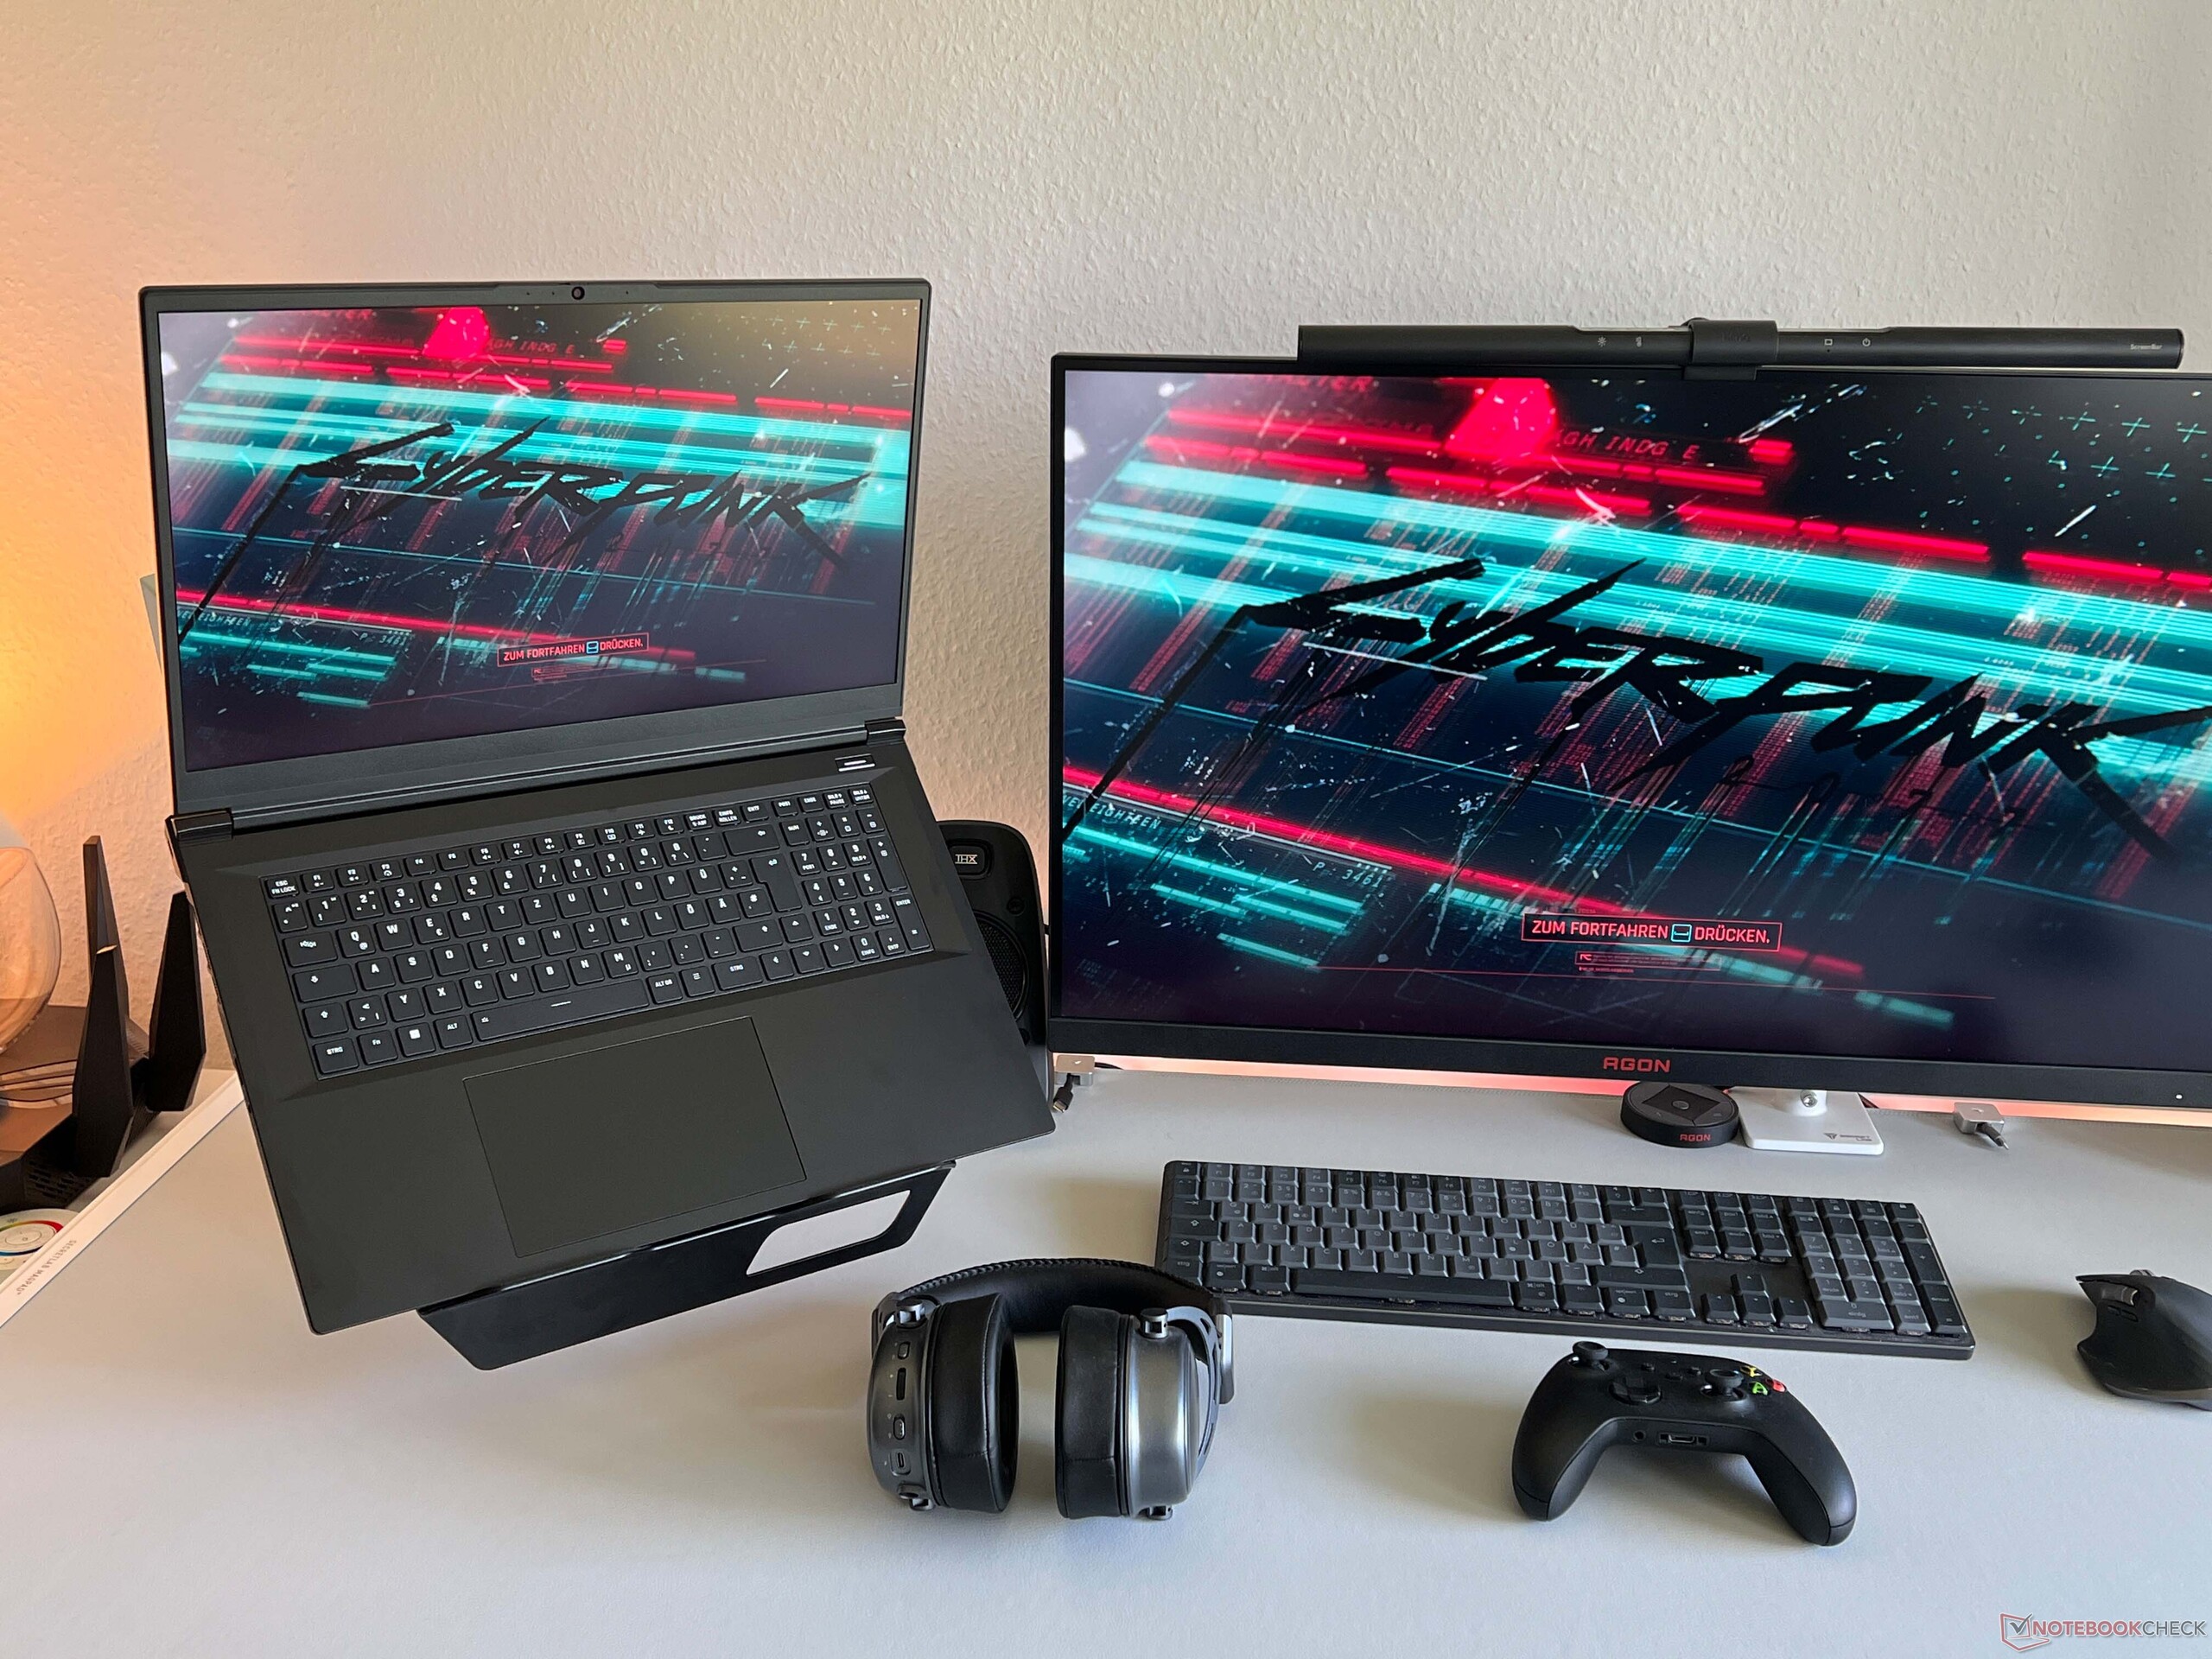
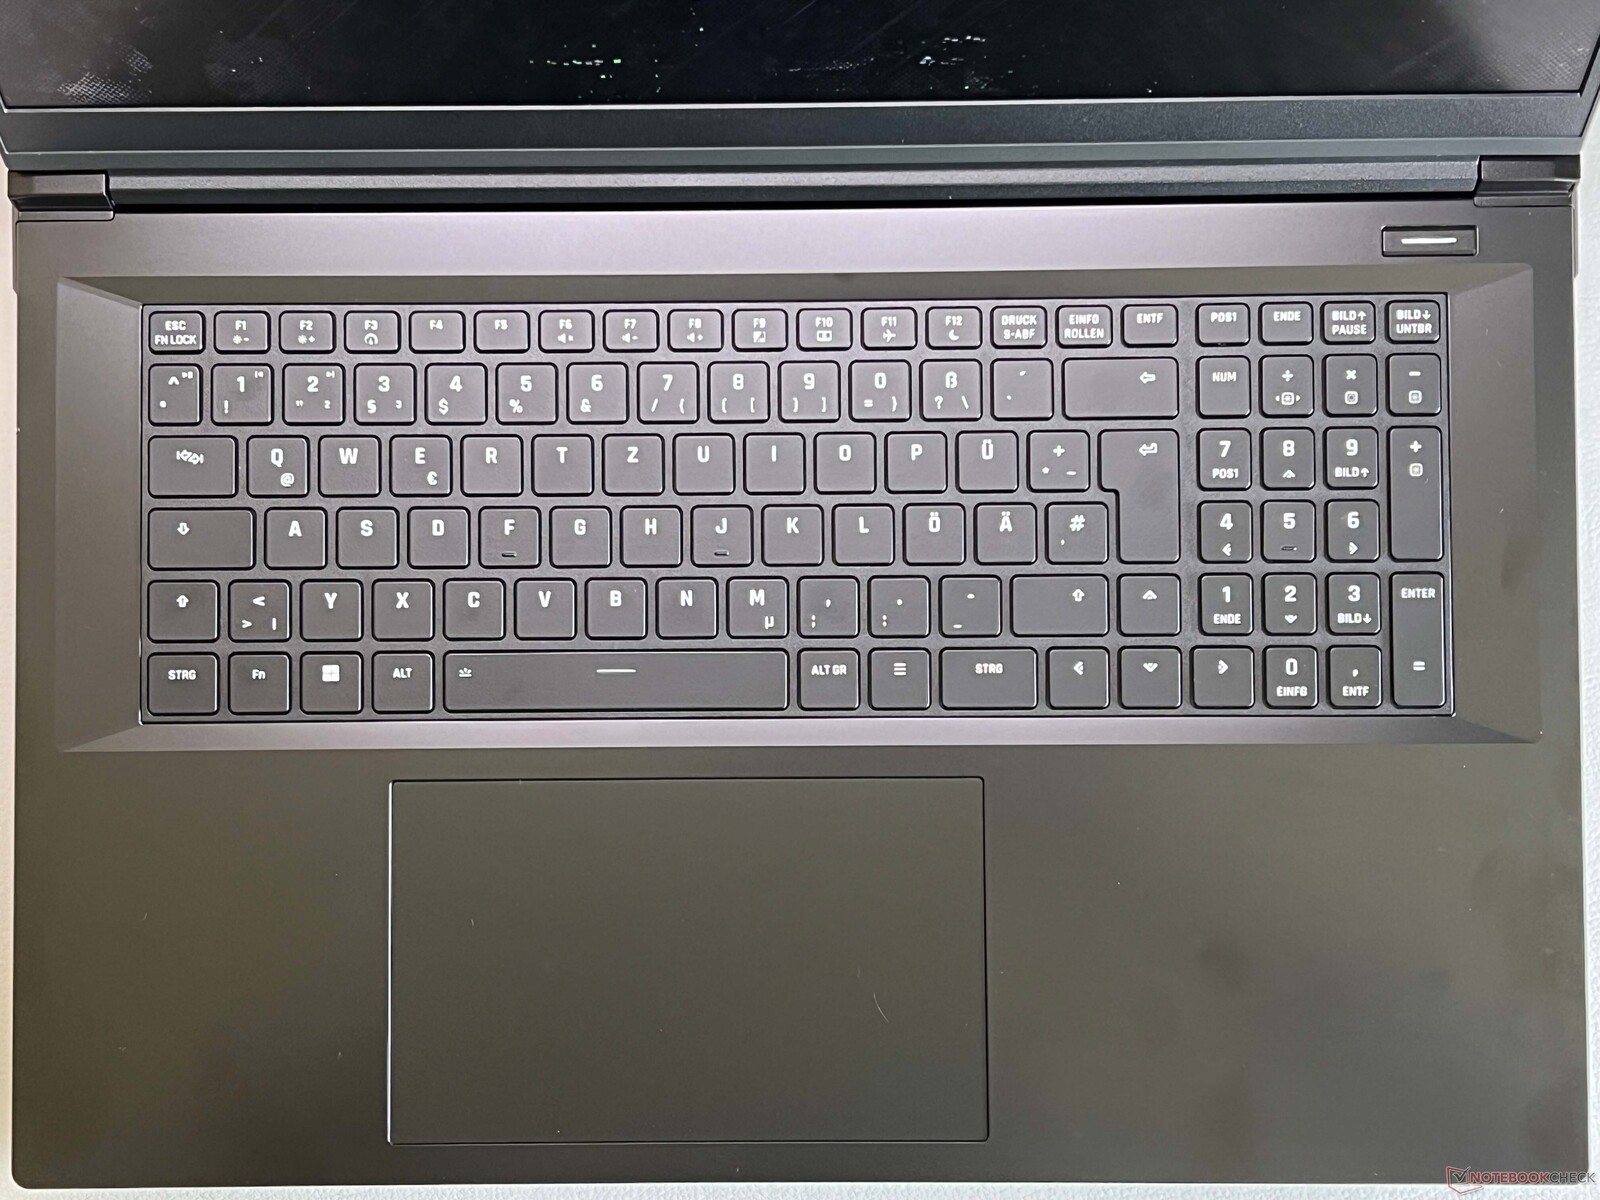
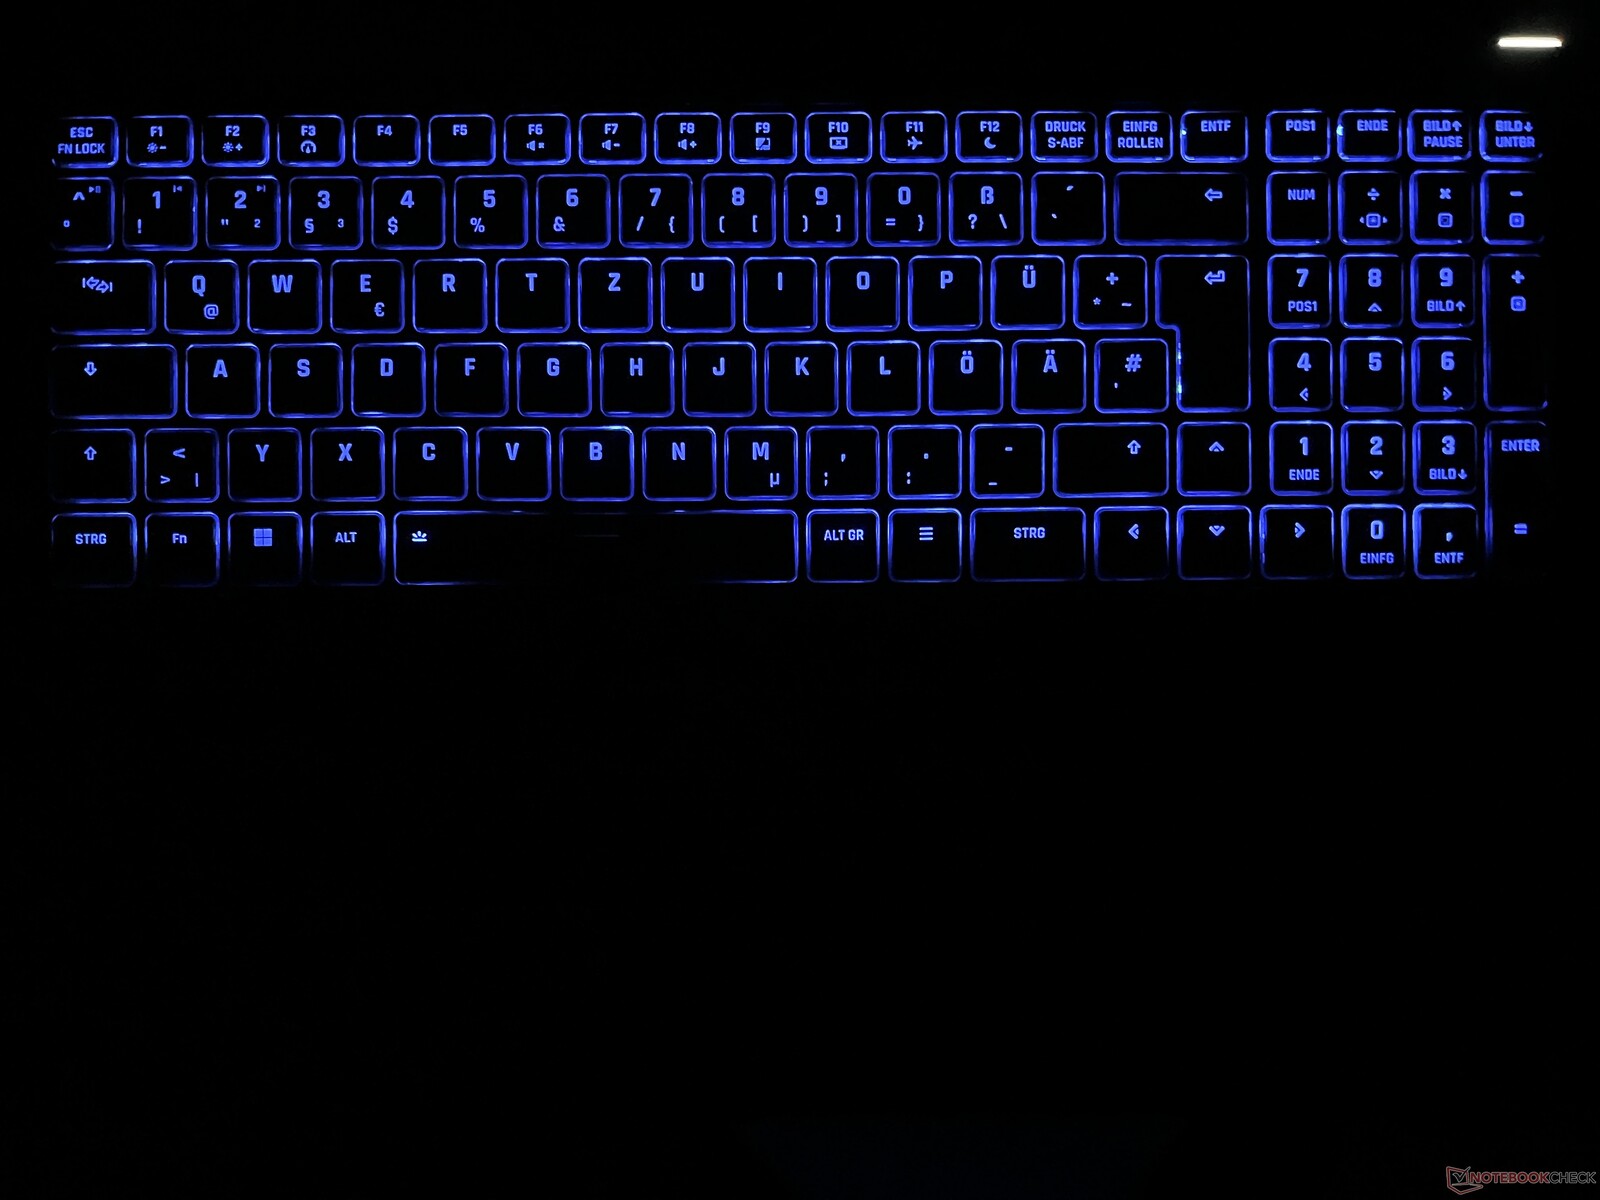
XMG heeft een toetsenbord voorzien van een speciaal numeriek toetsenblok en RGB-verlichting met één zone. Typen is comfortabel, met voldoende toetsbereik en nauwkeurige feedback. Bovendien zijn de toetsen niet te luid. Het grote clickpad voelt relatief soepel aan. Het is voldoende groot (15 x 9 cm) en zeer goed gevoerd (geen gerammel). Alleen de mechanische klikken in het onderste gedeelte zijn erg luid.
Beeldscherm - Een 240 Hz IPS

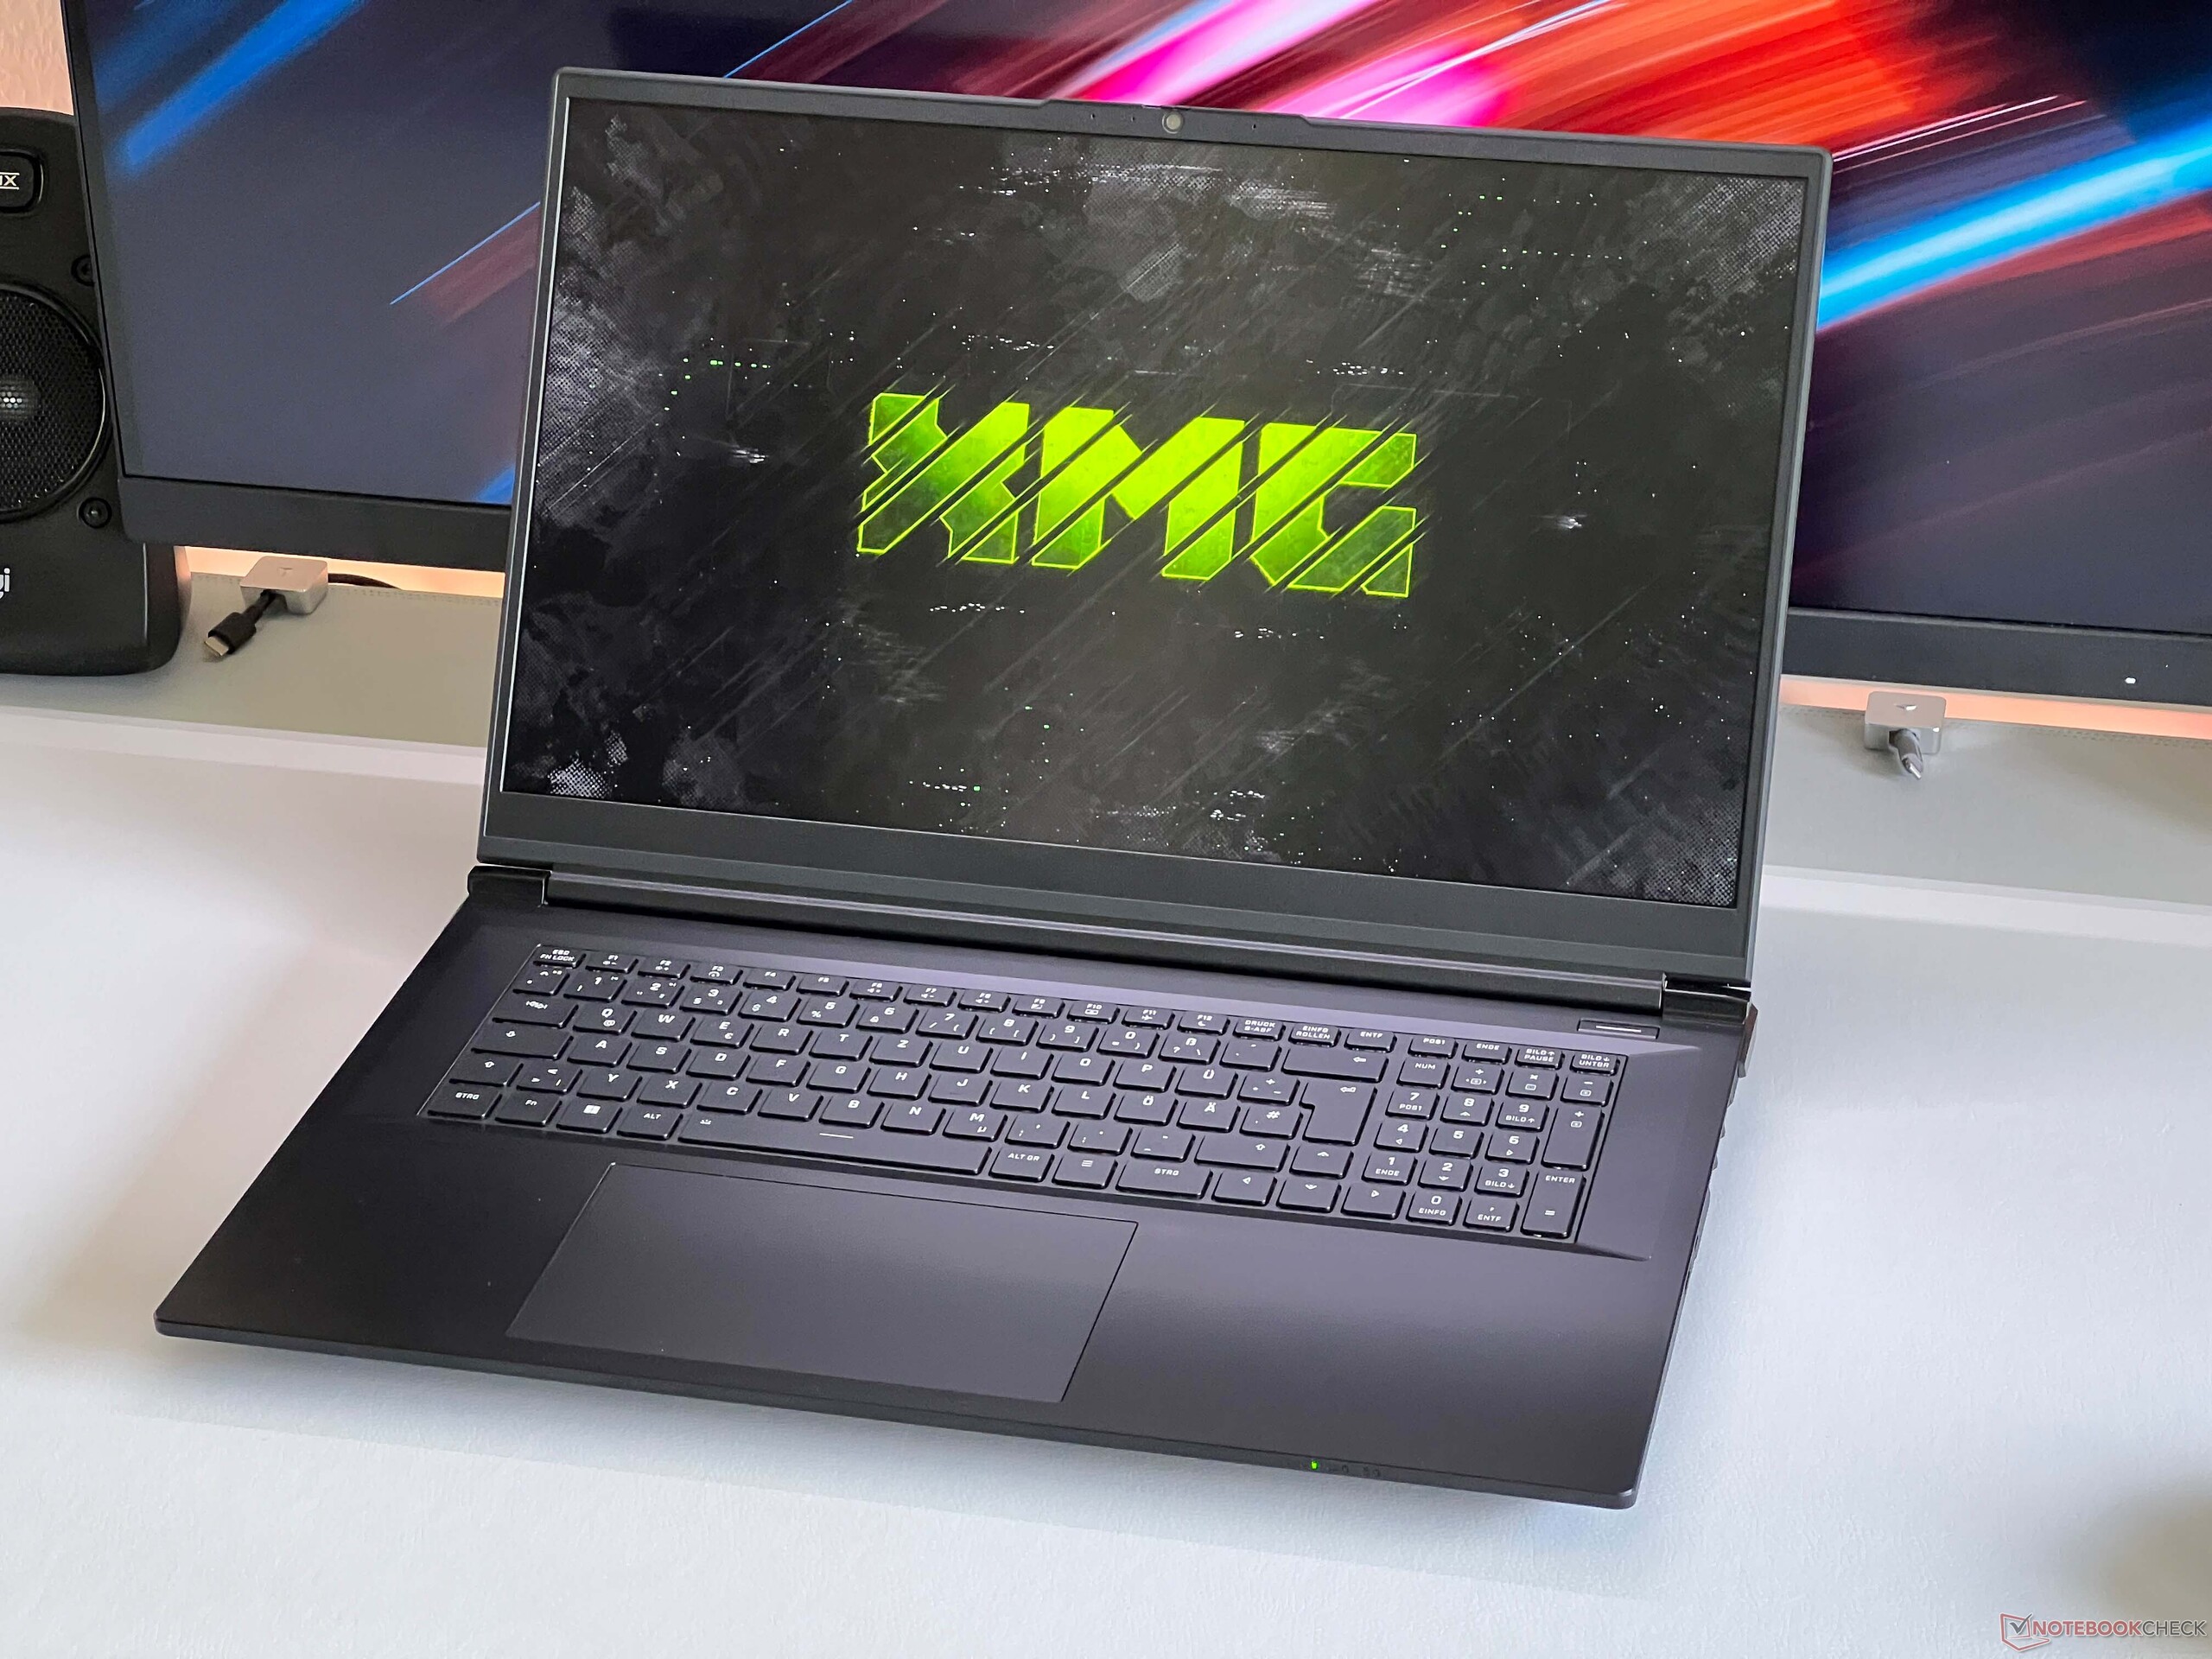
De Focus maakt gebruik van een 17,3 inch IPS-paneel met een beeldverhouding van 16:9 en een QHD-resolutie van 2.560 x 1.440 pixels. De beeldkwaliteit van het matte paneel is goed, met heldere gebieden die slechts minimaal korrelig lijken, hoewel dit bij dagelijks gebruik nauwelijks merkbaar is. Kleuren zijn levendig en bewegingen zijn vloeiend dankzij de 240 Hz vernieuwingsfrequentie. De responstijden zijn ook snel en er is geen PWM-flikkering.
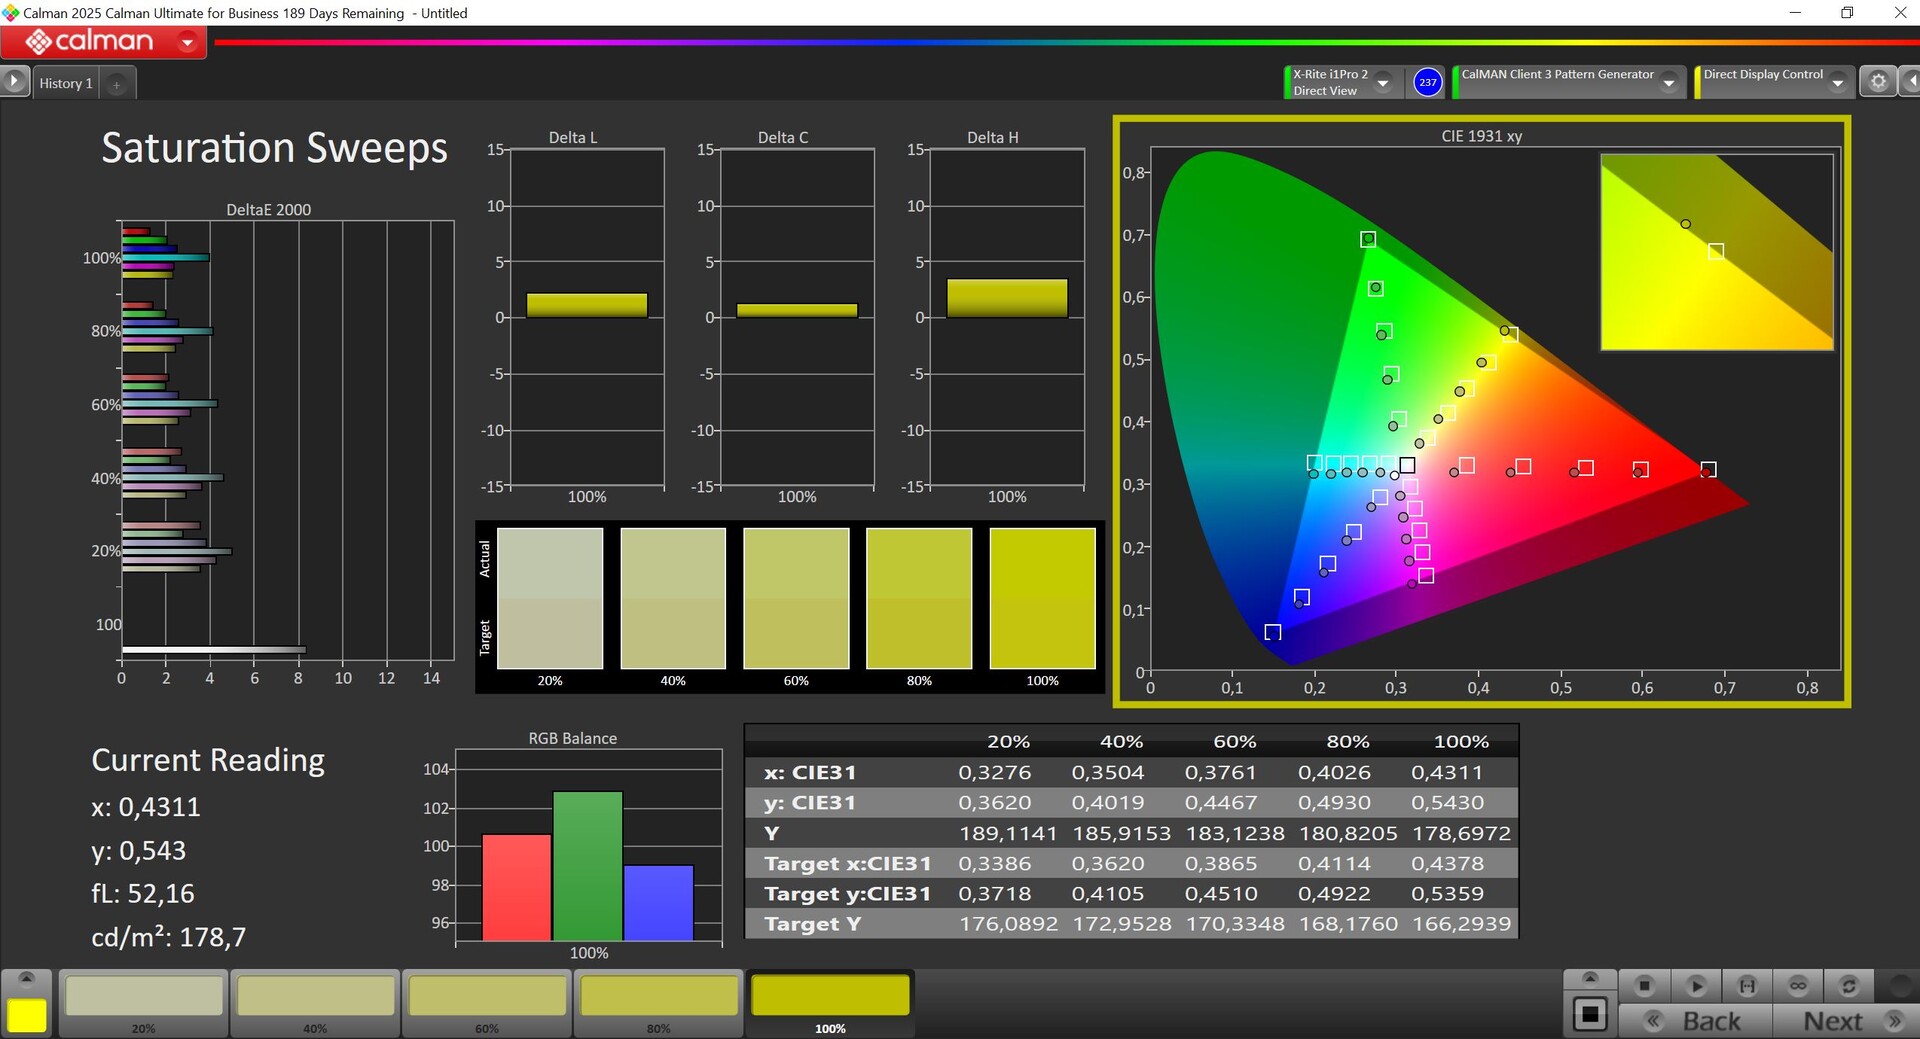
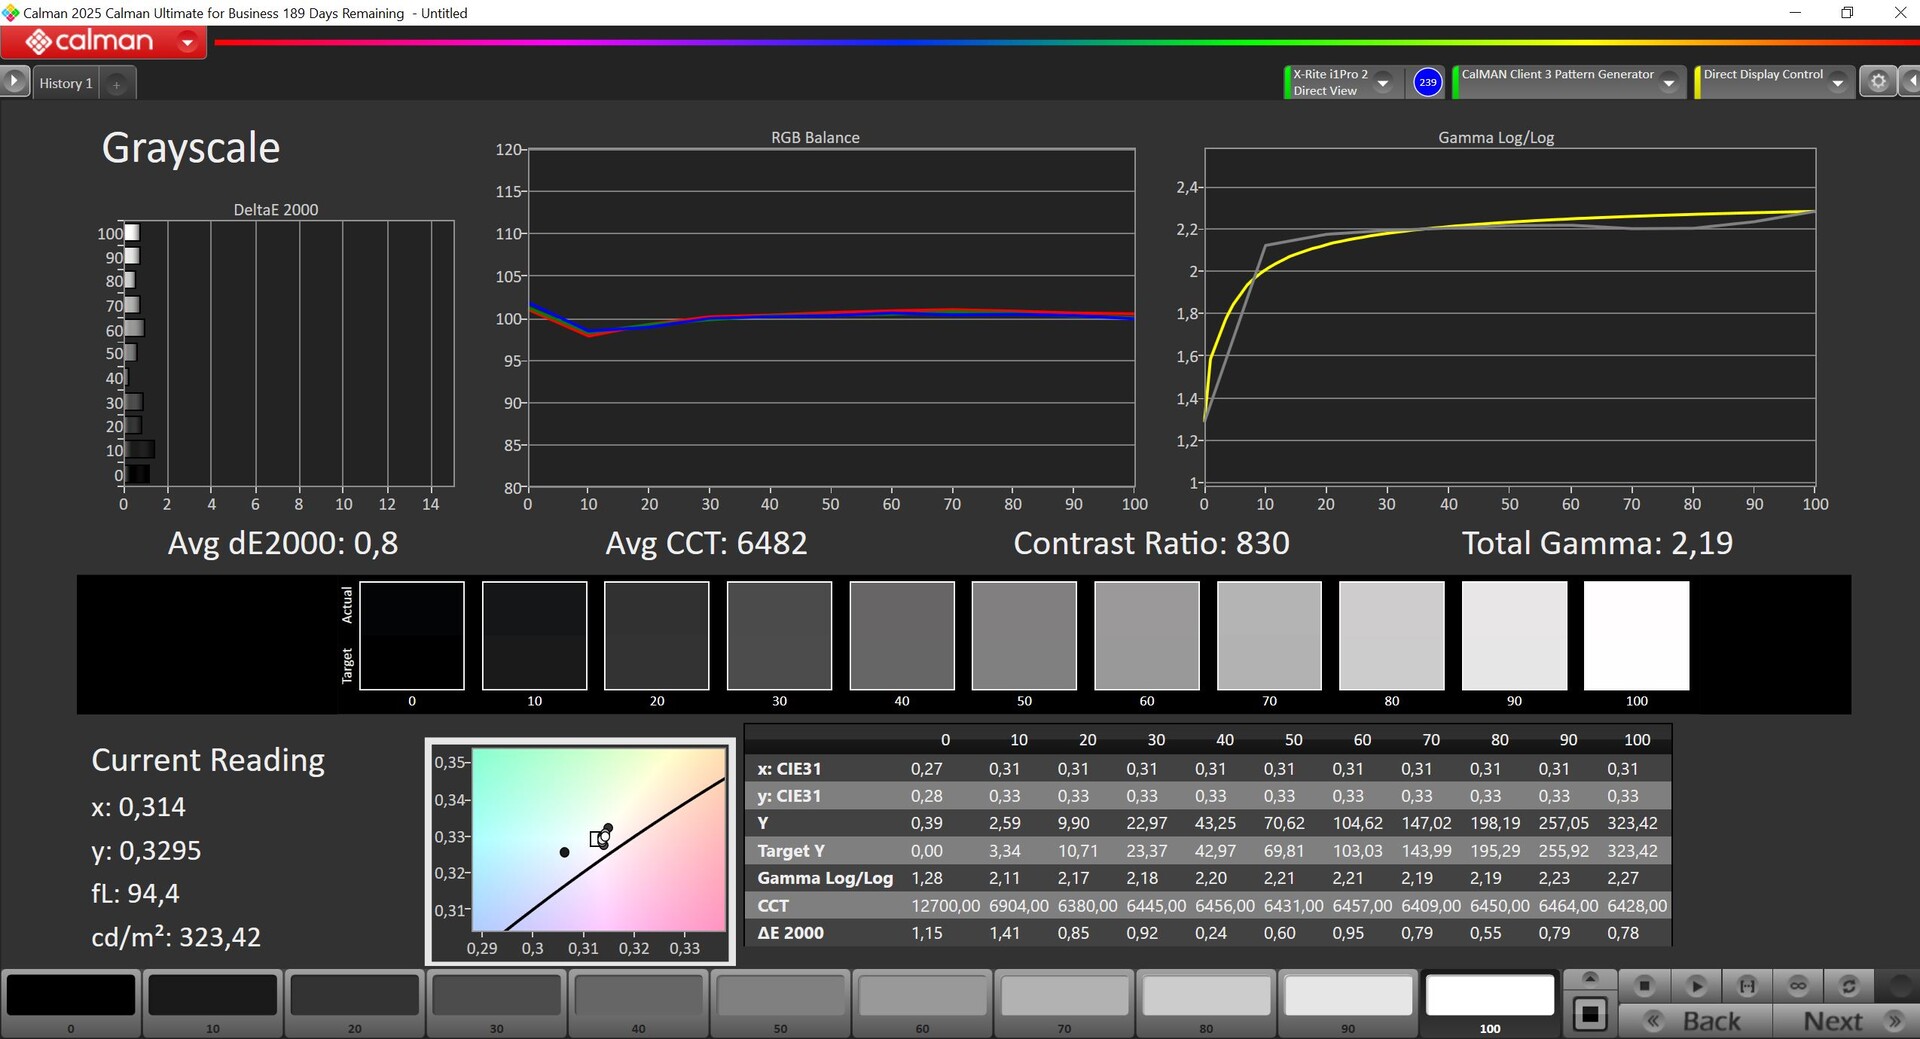
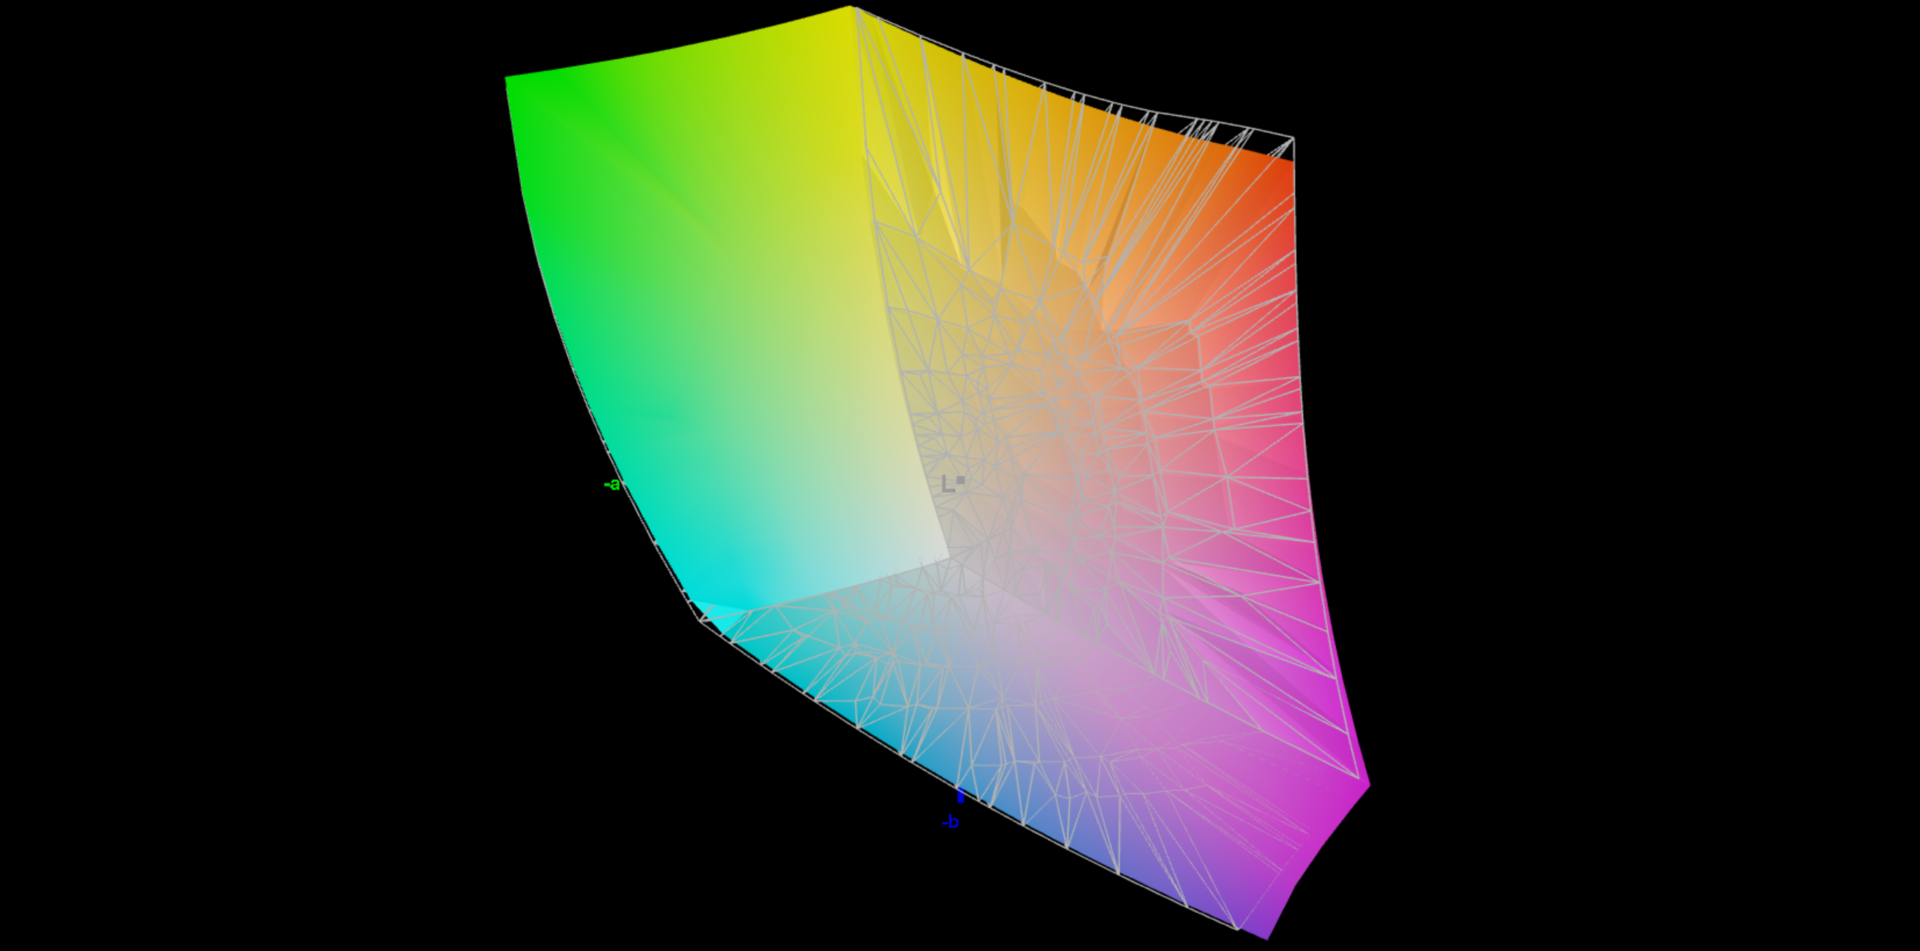
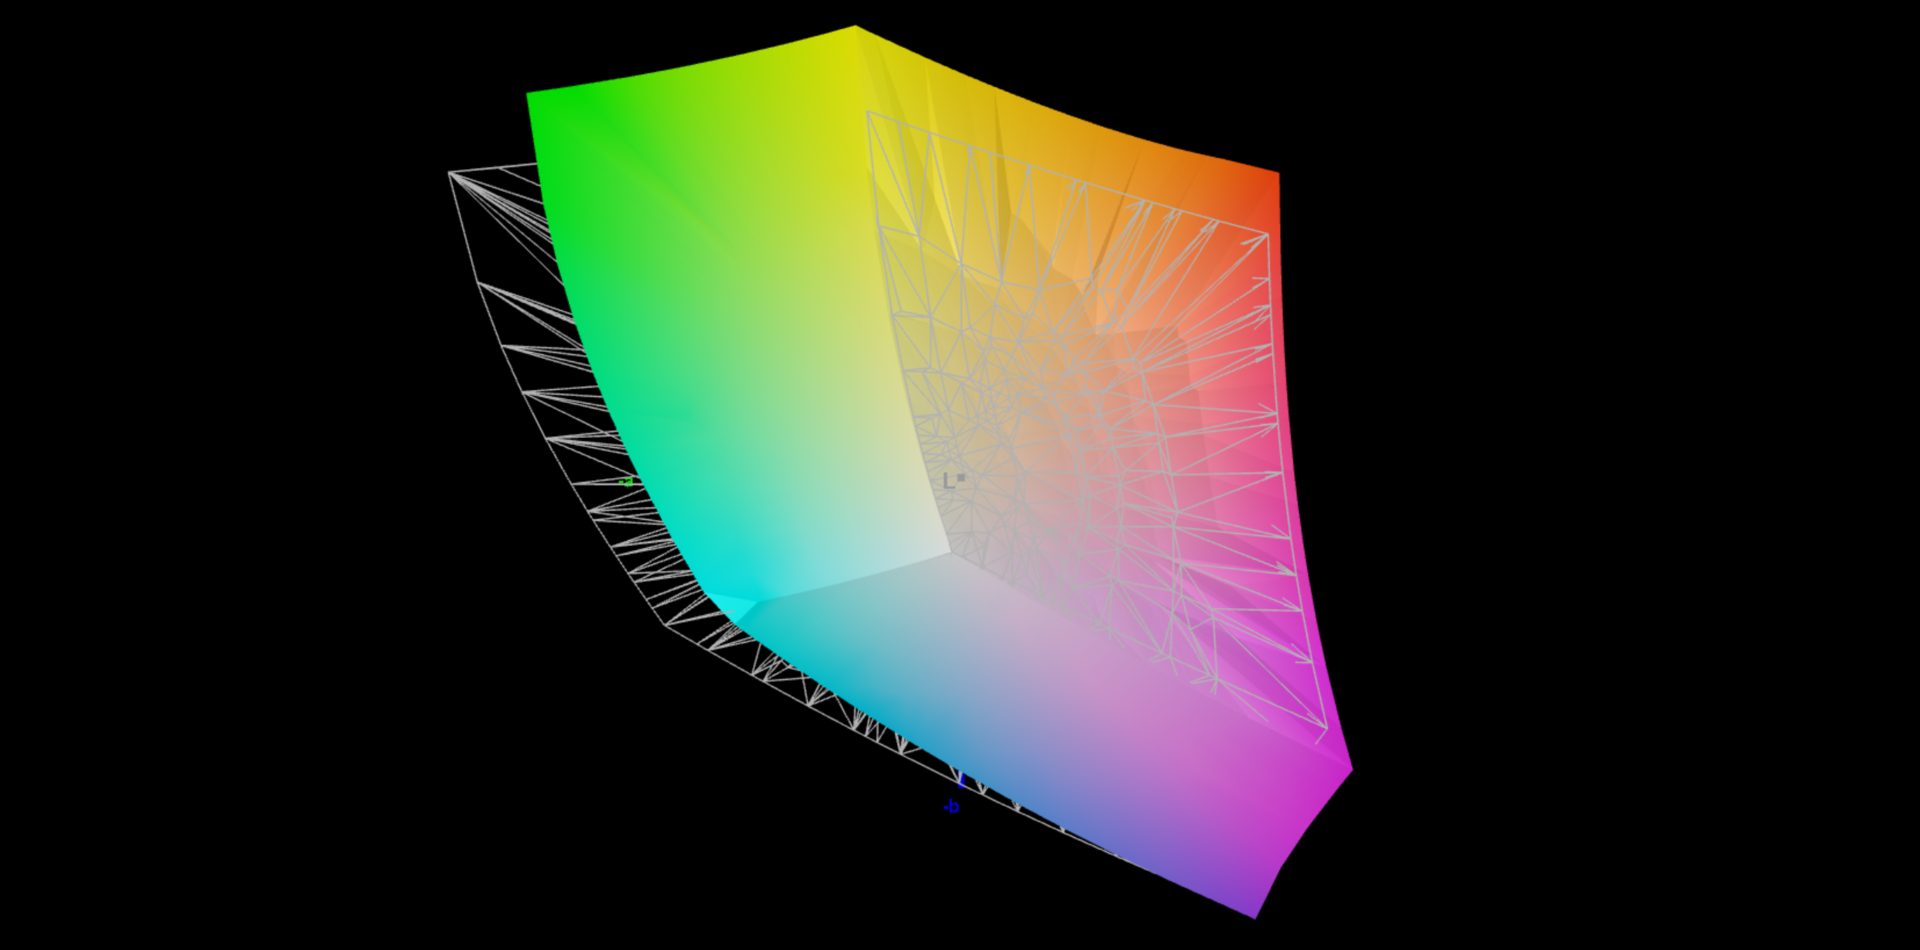
XMG heeft een helderheid van 300 cd/m² opgegeven, die ons testmodel weet te overtreffen met een maximum van 347 cd/m² (gemiddeld 325 cd/m²). De contrastverhouding is goed met een maximum van 1.335:1, maar onze analyse met de professionele CalMAN software wijst op een duidelijke blauwe tint in de fabrieksinstellingen, gecombineerd met een te koele kleurtemperatuur. Bovendien zijn er ook aanzienlijke kleurafwijkingen. Met onze kalibratie (het profiel kunt u gratis downloaden in het vak rechts) konden we de weergegeven beelden aanzienlijk verbeteren. Zowel de P3 als sRGB kleurruimtes worden volledig gedekt, maar er is geen sRGB profiel. Over het algemeen is het paneel goed geschikt voor gaming, maar de concurrentie is superieur, vooral op het gebied van helderheid.
| |||||||||||||||||||||||||
Helderheidsverdeling: 84 %
Helderheid in Batterij-modus: 347 cd/m²
Contrast: 1335:1 (Zwart: 0.26 cd/m²)
ΔE ColorChecker Calman: 3.3 | ∀{0.5-29.43 Ø4.73}
calibrated: 0.9
ΔE Greyscale Calman: 4.5 | ∀{0.09-98 Ø4.97}
86% AdobeRGB 1998 (Argyll 3D)
99.9% sRGB (Argyll 3D)
98.3% Display P3 (Argyll 3D)
Gamma: 2.05
CCT: 7365 K
| Schenker XMG Focus 17 M25 NE173QHM-NZ1, IPS, 2560x1440, 17.3", 240 Hz | MSI Vector 17 HX AI A2XWIG B170QAN01.2 (AUO84A6), IPS, 2560x1600, 17", 240 Hz | Lenovo Legion 5 Pro 16IAX10H ATNA60HS01-0 (Samsung SDC420A), OLED, 2560x1600, 16", 165 Hz | MSI Vector 16 HX AI A2XWHG B160QAN02.3 (AUO7DB2), IPS, 2560x1600, 16", 240 Hz | Schenker XMG Pro 16 (E25) NE160QDM-NZL, IPS, 2560x1600, 16", 300 Hz | |
|---|---|---|---|---|---|
| Display | 1% | 4% | -1% | -12% | |
| Display P3 Coverage (%) | 98.3 | 99.6 1% | 99.9 2% | 96.6 -2% | 74.7 -24% |
| sRGB Coverage (%) | 99.9 | 100 0% | 100 0% | 99.8 0% | 99.8 0% |
| AdobeRGB 1998 Coverage (%) | 86 | 87.4 2% | 94.1 9% | 84.4 -2% | 75.4 -12% |
| Response Times | 56% | 84% | 45% | 26% | |
| Response Time Grey 50% / Grey 80% * (ms) | 13.7 ? | 3.6 ? 74% | 2 ? 85% | 4.3 ? 69% | 10.5 ? 23% |
| Response Time Black / White * (ms) | 7.6 ? | 4.8 ? 37% | 1.4 ? 82% | 6 ? 21% | 5.4 ? 29% |
| PWM Frequency (Hz) | 1300 | ||||
| PWM Amplitude * (%) | 16.7 | ||||
| Screen | 4% | 12% | -2% | 19% | |
| Brightness middle (cd/m²) | 347 | 488 41% | 518 49% | 473 36% | 538 55% |
| Brightness (cd/m²) | 325 | 473 46% | 522 61% | 426 31% | 508 56% |
| Brightness Distribution (%) | 84 | 91 8% | 97 15% | 85 1% | 88 5% |
| Black Level * (cd/m²) | 0.26 | 0.74 -185% | 0.42 -62% | 0.47 -81% | |
| Contrast (:1) | 1335 | 659 -51% | 1126 -16% | 1145 -14% | |
| Colorchecker dE 2000 * | 3.3 | 1.67 49% | 2.49 25% | 3.47 -5% | 1.9 42% |
| Colorchecker dE 2000 max. * | 8.4 | 3.43 59% | 5.25 37% | 7.24 14% | 4 52% |
| Colorchecker dE 2000 calibrated * | 0.9 | 0.8 11% | 2.15 -139% | 1.36 -51% | |
| Greyscale dE 2000 * | 4.5 | 2.08 54% | 3.02 33% | 3.1 31% | 2.7 40% |
| Gamma | 2.05 107% | 2.55 86% | 2.37 93% | 2.486 88% | 2.24 98% |
| CCT | 7365 88% | 6240 104% | 6426 101% | 6832 95% | 7027 93% |
| Totaal Gemiddelde (Programma / Instellingen) | 20% /
10% | 33% /
22% | 14% /
5% | 11% /
13% |
* ... kleiner is beter


Responstijd Scherm
| ↔ Responstijd Zwart naar Wit | ||
|---|---|---|
| 7.6 ms ... stijging ↗ en daling ↘ gecombineerd | ↗ 3.1 ms stijging | 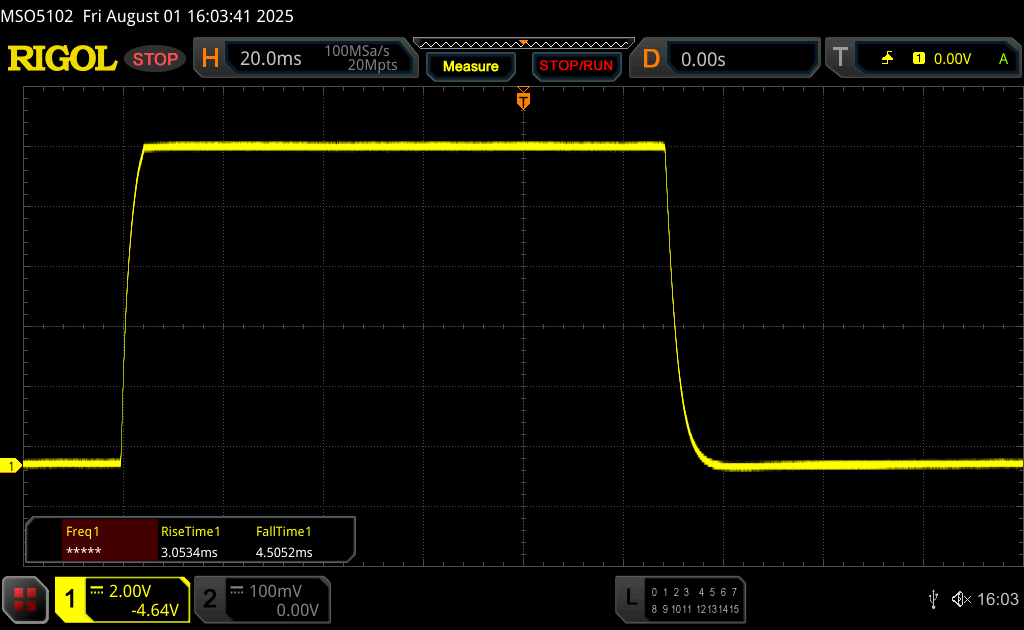 |
| ↘ 4.5 ms daling | ||
| Het scherm vertoonde erg snelle responstijden in onze tests en zou zeer geschikt moeten zijn voor snelle games. Ter vergelijking: alle testtoestellen variëren van 0.1 (minimum) tot 240 (maximum) ms. » 22 % van alle toestellen zijn beter. Dit betekent dat de gemeten responstijd beter is dan het gemiddelde (19.9 ms) van alle geteste toestellen. | ||
| ↔ Responstijd 50% Grijs naar 80% Grijs | ||
| 13.7 ms ... stijging ↗ en daling ↘ gecombineerd | ↗ 6.5 ms stijging | 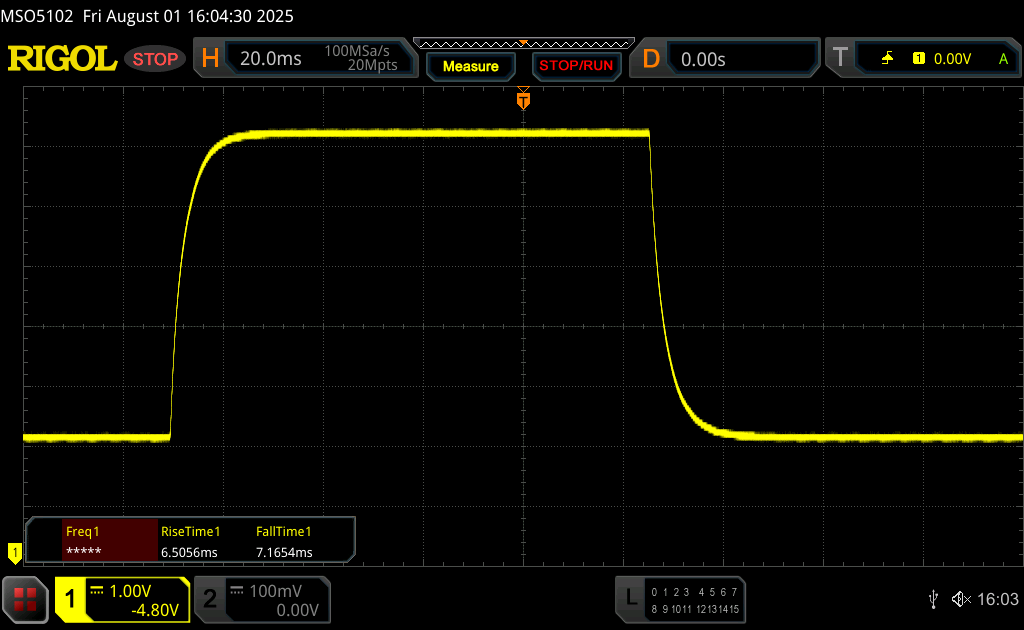 |
| ↘ 7.2 ms daling | ||
| Het scherm vertoonde prima responstijden in onze tests maar is misschien wat te traag voor competitieve games. Ter vergelijking: alle testtoestellen variëren van 0.165 (minimum) tot 636 (maximum) ms. » 27 % van alle toestellen zijn beter. Dit betekent dat de gemeten responstijd beter is dan het gemiddelde (31.1 ms) van alle geteste toestellen. | ||
Screen Flickering / PWM (Pulse-Width Modulation)
| Screen flickering / PWM niet waargenomen |  | ||
Ter vergelijking: 52 % van alle geteste toestellen maakten geen gebruik van PWM om de schermhelderheid te verlagen. Als het wel werd gebruikt, werd een gemiddelde van 7798 (minimum: 5 - maximum: 343500) Hz waargenomen. | |||


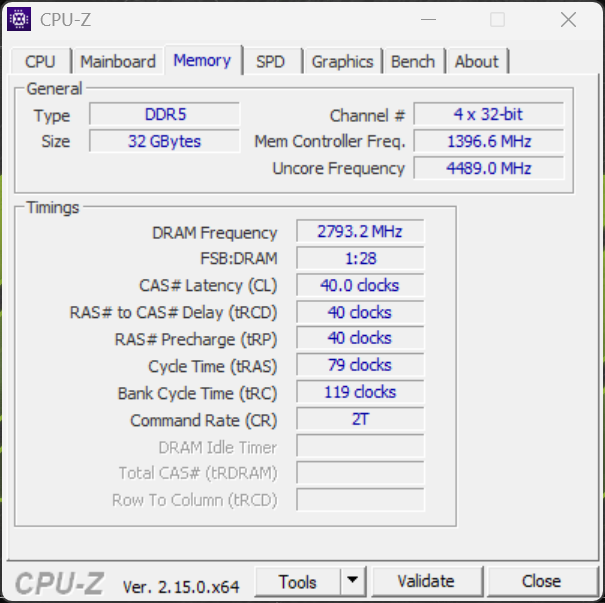
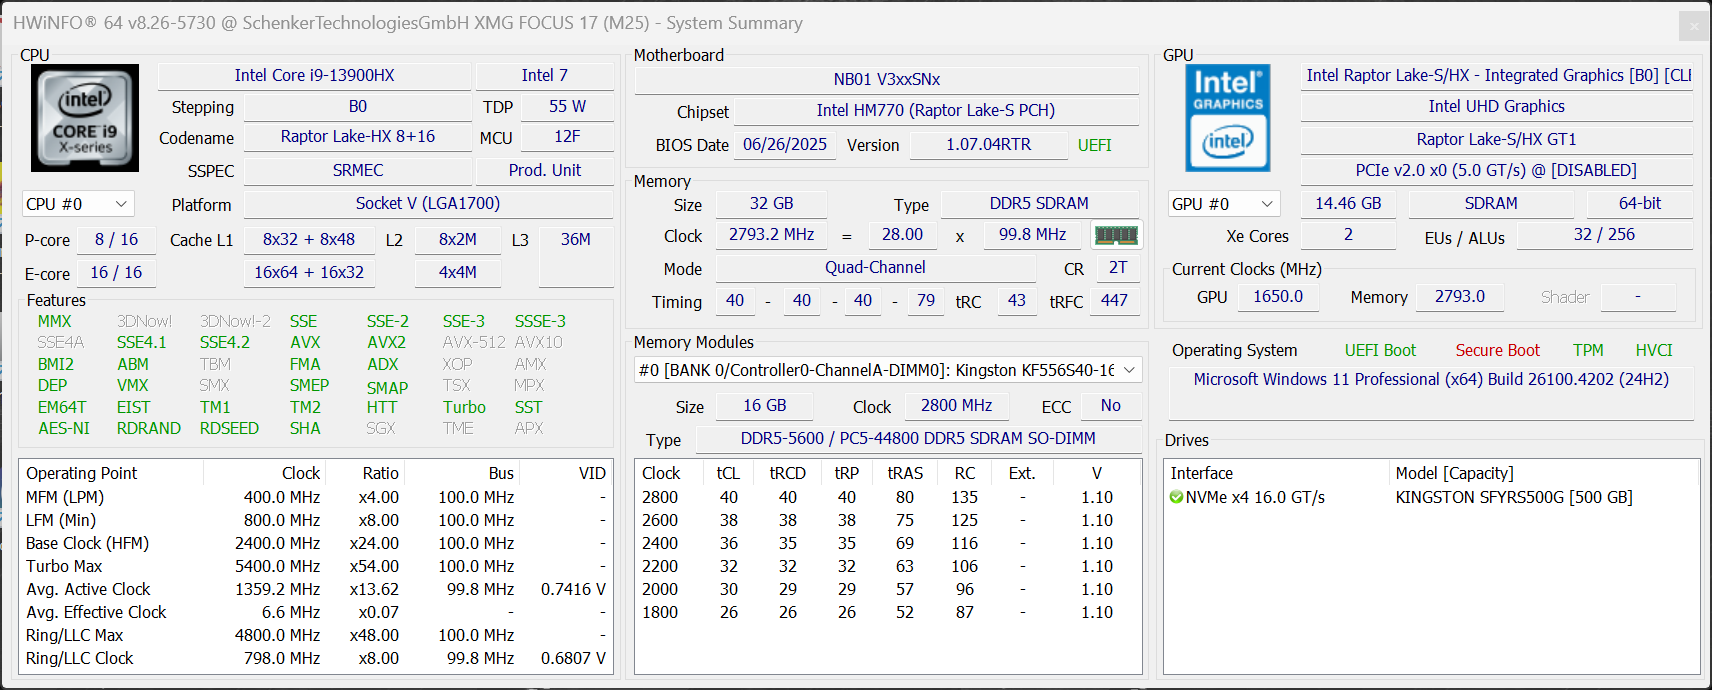
Prestaties - Een 5070 Ti laptop GPU met tot 96 GB RAM
Testomstandigheden
Er zijn verschillende energieprofielen beschikbaar in het Control Center, elk met subprofielen. Maximale gamingprestaties zijn alleen beschikbaar in de modus Prestaties/Turbo. Hoewel maximale GPU-prestaties over het algemeen beschikbaar zijn in de modus Prestaties/Auto, verschillen de prestaties bij gamen met gelijktijdige CPU-belasting (maximale TGP dan 100 watt).
| Energieprofiel | CPU TDP | CB24 Multi | GPU TGP | Time Spy Graphics | CP2077 QHD Ultra | max. ventilatorvolume |
|---|---|---|---|---|---|---|
| Stil | 30/28 watt | 591 punten | 100 watt | 14.202 punten | 61.2fps | 37 dB(A) |
| Entertainment | 115/45 watt | 1.013 punten | 100 watt | 14.463 punten | 68,1 fps | 46,6 dB(A) |
| Prestaties (Auto) | 150/120 watt | 1.624 punten | 140/100 watt | 14.833 punten | 69.8fps | 51.9 dB(A) |
| Prestaties (Turbo) | 150/135 watt | 1.675 punten | 140 watt | 17.211 punten | 81fps | 56,2 dB(A) |
| Batterij | 30 watt | 619 punten | 35 watt | 3.423 punten | 17,9 fps | 33,6 dB(A) |
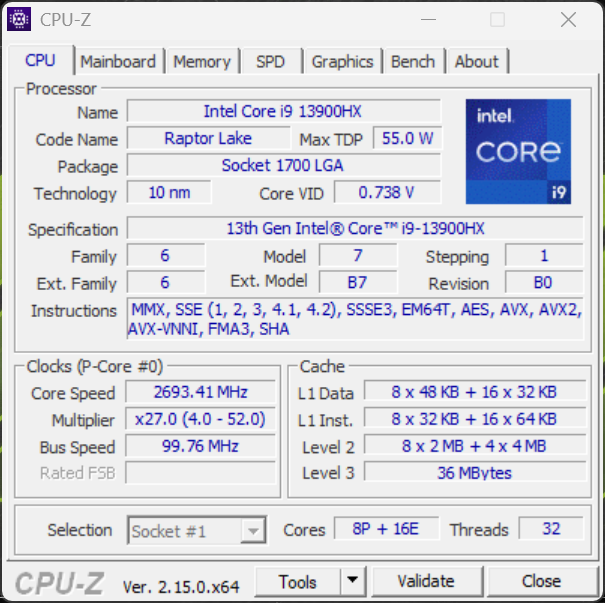
Processor - Core i9-13900HX
Standaard is de Focus 17 M25 uitgerust met de oude Core i9-13900HX. De Core i9-14900HX is echter ook optioneel verkrijgbaar. De CPU-prestaties blijven goed, maar zoals verwacht blijft de Raptor Lake achter bij de Core Ultra 9 275HX. De duurdere Vector 17 met de 275HX is slechts minimaal sneller vanwege de lagere vermogenslimieten.
Cinebench R15 Multi Sustained Test
Cinebench 2024: CPU Multi Core | CPU Single Core
Cinebench R23: Multi Core | Single Core
Cinebench R20: CPU (Multi Core) | CPU (Single Core)
Cinebench R15: CPU Multi 64Bit | CPU Single 64Bit
Blender: v2.79 BMW27 CPU
7-Zip 18.03: 7z b 4 | 7z b 4 -mmt1
Geekbench 6.7: Multi-Core | Single-Core
Geekbench 5.5: Multi-Core | Single-Core
HWBOT x265 Benchmark v2.2: 4k Preset
LibreOffice : 20 Documents To PDF
R Benchmark 2.5: Overall mean
| CPU Performance rating | |
| Schenker XMG Pro 16 (E25) | |
| Lenovo Legion 5 Pro 16IAX10H -2! | |
| MSI Vector 17 HX AI A2XWIG -2! | |
| Schenker XMG Focus 17 M25 | |
| Gemiddeld Intel Core i9-13900HX | |
| MSI Vector 16 HX AI A2XWHG | |
| Gemiddelde van klas Gaming | |
| Cinebench 2024 / CPU Multi Core | |
| Schenker XMG Pro 16 (E25) | |
| Schenker XMG Focus 17 M25 | |
| Gemiddeld Intel Core i9-13900HX (n=1) | |
| MSI Vector 16 HX AI A2XWHG | |
| Gemiddelde van klas Gaming (486 - 2298, n=92, laatste 2 jaar) | |
| Cinebench 2024 / CPU Single Core | |
| Schenker XMG Pro 16 (E25) | |
| MSI Vector 16 HX AI A2XWHG | |
| Schenker XMG Focus 17 M25 | |
| Gemiddeld Intel Core i9-13900HX (n=1) | |
| Gemiddelde van klas Gaming (95 - 138.2, n=92, laatste 2 jaar) | |
| Cinebench R23 / Multi Core | |
| Lenovo Legion 5 Pro 16IAX10H | |
| Schenker XMG Pro 16 (E25) | |
| MSI Vector 17 HX AI A2XWIG | |
| Schenker XMG Focus 17 M25 | |
| Gemiddeld Intel Core i9-13900HX (24270 - 32623, n=23) | |
| MSI Vector 16 HX AI A2XWHG | |
| Gemiddelde van klas Gaming (10488 - 40970, n=113, laatste 2 jaar) | |
| Cinebench R23 / Single Core | |
| Lenovo Legion 5 Pro 16IAX10H | |
| Schenker XMG Pro 16 (E25) | |
| MSI Vector 17 HX AI A2XWIG | |
| MSI Vector 16 HX AI A2XWHG | |
| Schenker XMG Focus 17 M25 | |
| Gemiddeld Intel Core i9-13900HX (1867 - 2105, n=20) | |
| Gemiddelde van klas Gaming (1166 - 2356, n=113, laatste 2 jaar) | |
| Cinebench R20 / CPU (Multi Core) | |
| Lenovo Legion 5 Pro 16IAX10H | |
| Schenker XMG Pro 16 (E25) | |
| MSI Vector 17 HX AI A2XWIG | |
| Schenker XMG Focus 17 M25 | |
| Gemiddeld Intel Core i9-13900HX (9152 - 12541, n=21) | |
| MSI Vector 16 HX AI A2XWHG | |
| Gemiddelde van klas Gaming (4029 - 16108, n=112, laatste 2 jaar) | |
| Cinebench R20 / CPU (Single Core) | |
| Lenovo Legion 5 Pro 16IAX10H | |
| Schenker XMG Pro 16 (E25) | |
| MSI Vector 17 HX AI A2XWIG | |
| MSI Vector 16 HX AI A2XWHG | |
| Schenker XMG Focus 17 M25 | |
| Gemiddeld Intel Core i9-13900HX (722 - 810, n=21) | |
| Gemiddelde van klas Gaming (442 - 895, n=112, laatste 2 jaar) | |
| Cinebench R15 / CPU Multi 64Bit | |
| Lenovo Legion 5 Pro 16IAX10H | |
| Schenker XMG Pro 16 (E25) | |
| MSI Vector 17 HX AI A2XWIG | |
| Gemiddeld Intel Core i9-13900HX (3913 - 4970, n=22) | |
| Schenker XMG Focus 17 M25 | |
| MSI Vector 16 HX AI A2XWHG | |
| Gemiddelde van klas Gaming (1578 - 6271, n=113, laatste 2 jaar) | |
| Cinebench R15 / CPU Single 64Bit | |
| MSI Vector 17 HX AI A2XWIG | |
| MSI Vector 17 HX AI A2XWIG | |
| Schenker XMG Pro 16 (E25) | |
| Lenovo Legion 5 Pro 16IAX10H | |
| MSI Vector 16 HX AI A2XWHG | |
| Schenker XMG Focus 17 M25 | |
| Gemiddelde van klas Gaming (188.8 - 343, n=112, laatste 2 jaar) | |
| Gemiddeld Intel Core i9-13900HX (247 - 304, n=22) | |
| Blender / v2.79 BMW27 CPU | |
| Gemiddelde van klas Gaming (80 - 330, n=110, laatste 2 jaar) | |
| MSI Vector 16 HX AI A2XWHG | |
| Gemiddeld Intel Core i9-13900HX (101 - 153, n=22) | |
| MSI Vector 17 HX AI A2XWIG | |
| Schenker XMG Focus 17 M25 | |
| Lenovo Legion 5 Pro 16IAX10H | |
| Schenker XMG Pro 16 (E25) | |
| 7-Zip 18.03 / 7z b 4 | |
| Schenker XMG Focus 17 M25 | |
| Schenker XMG Pro 16 (E25) | |
| Lenovo Legion 5 Pro 16IAX10H | |
| Gemiddeld Intel Core i9-13900HX (90675 - 127283, n=21) | |
| MSI Vector 17 HX AI A2XWIG | |
| Gemiddelde van klas Gaming (33491 - 148086, n=111, laatste 2 jaar) | |
| MSI Vector 16 HX AI A2XWHG | |
| 7-Zip 18.03 / 7z b 4 -mmt1 | |
| Schenker XMG Focus 17 M25 | |
| Schenker XMG Pro 16 (E25) | |
| Gemiddeld Intel Core i9-13900HX (6340 - 7177, n=21) | |
| Lenovo Legion 5 Pro 16IAX10H | |
| MSI Vector 17 HX AI A2XWIG | |
| MSI Vector 16 HX AI A2XWHG | |
| Gemiddelde van klas Gaming (4199 - 7436, n=111, laatste 2 jaar) | |
| Geekbench 6.7 / Multi-Core | |
| Schenker XMG Pro 16 (E25) | |
| Lenovo Legion 5 Pro 16IAX10H | |
| MSI Vector 17 HX AI A2XWIG | |
| MSI Vector 16 HX AI A2XWHG | |
| Schenker XMG Focus 17 M25 | |
| Gemiddeld Intel Core i9-13900HX (15031 - 18014, n=3) | |
| Gemiddelde van klas Gaming (6625 - 22104, n=112, laatste 2 jaar) | |
| Geekbench 6.7 / Single-Core | |
| Schenker XMG Pro 16 (E25) | |
| MSI Vector 17 HX AI A2XWIG | |
| Lenovo Legion 5 Pro 16IAX10H | |
| MSI Vector 16 HX AI A2XWHG | |
| Schenker XMG Focus 17 M25 | |
| Gemiddelde van klas Gaming (1490 - 3259, n=112, laatste 2 jaar) | |
| Gemiddeld Intel Core i9-13900HX (2548 - 2892, n=3) | |
| Geekbench 5.5 / Multi-Core | |
| Schenker XMG Pro 16 (E25) | |
| Lenovo Legion 5 Pro 16IAX10H | |
| MSI Vector 17 HX AI A2XWIG | |
| Schenker XMG Focus 17 M25 | |
| Gemiddeld Intel Core i9-13900HX (17614 - 21075, n=22) | |
| MSI Vector 16 HX AI A2XWHG | |
| Gemiddelde van klas Gaming (6460 - 27010, n=111, laatste 2 jaar) | |
| Geekbench 5.5 / Single-Core | |
| Schenker XMG Pro 16 (E25) | |
| Lenovo Legion 5 Pro 16IAX10H | |
| MSI Vector 17 HX AI A2XWIG | |
| MSI Vector 16 HX AI A2XWHG | |
| Schenker XMG Focus 17 M25 | |
| Gemiddelde van klas Gaming (986 - 2474, n=111, laatste 2 jaar) | |
| Gemiddeld Intel Core i9-13900HX (1345 - 2093, n=22) | |
| HWBOT x265 Benchmark v2.2 / 4k Preset | |
| Schenker XMG Pro 16 (E25) | |
| Lenovo Legion 5 Pro 16IAX10H | |
| MSI Vector 17 HX AI A2XWIG | |
| MSI Vector 16 HX AI A2XWHG | |
| Schenker XMG Focus 17 M25 | |
| Gemiddeld Intel Core i9-13900HX (23.5 - 34.4, n=22) | |
| Gemiddelde van klas Gaming (11.5 - 44.3, n=111, laatste 2 jaar) | |
| LibreOffice / 20 Documents To PDF | |
| Gemiddelde van klas Gaming (19 - 88.8, n=111, laatste 2 jaar) | |
| Schenker XMG Pro 16 (E25) | |
| Schenker XMG Focus 17 M25 | |
| Gemiddeld Intel Core i9-13900HX (32.8 - 51.1, n=21) | |
| MSI Vector 16 HX AI A2XWHG | |
| MSI Vector 17 HX AI A2XWIG | |
| Lenovo Legion 5 Pro 16IAX10H | |
| R Benchmark 2.5 / Overall mean | |
| Gemiddelde van klas Gaming (0.3439 - 0.759, n=112, laatste 2 jaar) | |
| MSI Vector 16 HX AI A2XWHG | |
| MSI Vector 17 HX AI A2XWIG | |
| Lenovo Legion 5 Pro 16IAX10H | |
| Schenker XMG Pro 16 (E25) | |
| Schenker XMG Focus 17 M25 | |
| Gemiddeld Intel Core i9-13900HX (0.375 - 0.4564, n=22) | |
* ... kleiner is beter
AIDA64: FP32 Ray-Trace | FPU Julia | CPU SHA3 | CPU Queen | FPU SinJulia | FPU Mandel | CPU AES | CPU ZLib | FP64 Ray-Trace | CPU PhotoWorxx
| Performance rating | |
| Lenovo Legion 5 Pro 16IAX10H | |
| Schenker XMG Pro 16 (E25) | |
| Schenker XMG Focus 17 M25 | |
| MSI Vector 17 HX AI A2XWIG | |
| Gemiddeld Intel Core i9-13900HX | |
| Gemiddelde van klas Gaming | |
| MSI Vector 16 HX AI A2XWHG | |
| AIDA64 / FP32 Ray-Trace | |
| Lenovo Legion 5 Pro 16IAX10H | |
| Schenker XMG Pro 16 (E25) | |
| Gemiddelde van klas Gaming (10227 - 85542, n=110, laatste 2 jaar) | |
| MSI Vector 17 HX AI A2XWIG | |
| MSI Vector 16 HX AI A2XWHG | |
| Schenker XMG Focus 17 M25 | |
| Gemiddeld Intel Core i9-13900HX (17589 - 27615, n=22) | |
| AIDA64 / FPU Julia | |
| Lenovo Legion 5 Pro 16IAX10H | |
| Schenker XMG Pro 16 (E25) | |
| MSI Vector 17 HX AI A2XWIG | |
| MSI Vector 16 HX AI A2XWHG | |
| Gemiddelde van klas Gaming (51376 - 238426, n=110, laatste 2 jaar) | |
| Schenker XMG Focus 17 M25 | |
| Gemiddeld Intel Core i9-13900HX (88686 - 137015, n=22) | |
| AIDA64 / CPU SHA3 | |
| Schenker XMG Pro 16 (E25) | |
| Lenovo Legion 5 Pro 16IAX10H | |
| MSI Vector 17 HX AI A2XWIG | |
| Schenker XMG Focus 17 M25 | |
| MSI Vector 16 HX AI A2XWHG | |
| Gemiddelde van klas Gaming (2180 - 9817, n=110, laatste 2 jaar) | |
| Gemiddeld Intel Core i9-13900HX (4362 - 7029, n=22) | |
| AIDA64 / CPU Queen | |
| Lenovo Legion 5 Pro 16IAX10H | |
| Schenker XMG Focus 17 M25 | |
| Gemiddeld Intel Core i9-13900HX (125644 - 141385, n=22) | |
| Schenker XMG Pro 16 (E25) | |
| MSI Vector 17 HX AI A2XWIG | |
| Gemiddelde van klas Gaming (49785 - 173351, n=101, laatste 2 jaar) | |
| MSI Vector 16 HX AI A2XWHG | |
| AIDA64 / FPU SinJulia | |
| Schenker XMG Focus 17 M25 | |
| Gemiddeld Intel Core i9-13900HX (12334 - 17179, n=22) | |
| Gemiddelde van klas Gaming (4424 - 33636, n=110, laatste 2 jaar) | |
| Schenker XMG Pro 16 (E25) | |
| Lenovo Legion 5 Pro 16IAX10H | |
| MSI Vector 17 HX AI A2XWIG | |
| MSI Vector 16 HX AI A2XWHG | |
| AIDA64 / FPU Mandel | |
| Schenker XMG Pro 16 (E25) | |
| Lenovo Legion 5 Pro 16IAX10H | |
| MSI Vector 17 HX AI A2XWIG | |
| MSI Vector 16 HX AI A2XWHG | |
| Gemiddelde van klas Gaming (25115 - 128721, n=110, laatste 2 jaar) | |
| Schenker XMG Focus 17 M25 | |
| Gemiddeld Intel Core i9-13900HX (43850 - 69202, n=22) | |
| AIDA64 / CPU AES | |
| Gemiddeld Intel Core i9-13900HX (89413 - 237881, n=22) | |
| Lenovo Legion 5 Pro 16IAX10H | |
| Schenker XMG Pro 16 (E25) | |
| Schenker XMG Focus 17 M25 | |
| MSI Vector 17 HX AI A2XWIG | |
| Gemiddelde van klas Gaming (39258 - 247074, n=110, laatste 2 jaar) | |
| MSI Vector 16 HX AI A2XWHG | |
| AIDA64 / CPU ZLib | |
| Lenovo Legion 5 Pro 16IAX10H | |
| Schenker XMG Pro 16 (E25) | |
| Schenker XMG Focus 17 M25 | |
| Gemiddeld Intel Core i9-13900HX (1284 - 1958, n=22) | |
| MSI Vector 17 HX AI A2XWIG | |
| Gemiddelde van klas Gaming (574 - 2531, n=110, laatste 2 jaar) | |
| MSI Vector 16 HX AI A2XWHG | |
| AIDA64 / FP64 Ray-Trace | |
| Lenovo Legion 5 Pro 16IAX10H | |
| Schenker XMG Pro 16 (E25) | |
| Gemiddelde van klas Gaming (5509 - 45446, n=110, laatste 2 jaar) | |
| MSI Vector 16 HX AI A2XWHG | |
| MSI Vector 17 HX AI A2XWIG | |
| Schenker XMG Focus 17 M25 | |
| Gemiddeld Intel Core i9-13900HX (9481 - 15279, n=22) | |
| AIDA64 / CPU PhotoWorxx | |
| Schenker XMG Pro 16 (E25) | |
| Lenovo Legion 5 Pro 16IAX10H | |
| MSI Vector 17 HX AI A2XWIG | |
| Schenker XMG Focus 17 M25 | |
| Gemiddeld Intel Core i9-13900HX (42994 - 51994, n=22) | |
| Gemiddelde van klas Gaming (12271 - 89891, n=110, laatste 2 jaar) | |
| MSI Vector 16 HX AI A2XWHG | |
Systeemprestaties
De Focus 17 is een zeer snelle metgezel in alledaagse situaties, en de benchmarkresultaten zijn ook goed. Tijdens het testen zijn we geen problemen tegengekomen met de stabiliteit van het systeem.
PCMark 10: Score | Essentials | Productivity | Digital Content Creation
CrossMark: Overall | Productivity | Creativity | Responsiveness
WebXPRT 3: Overall
WebXPRT 4: Overall
Mozilla Kraken 1.1: Total
| Performance rating | |
| Lenovo Legion 5 Pro 16IAX10H | |
| Schenker XMG Pro 16 (E25) | |
| MSI Vector 17 HX AI A2XWIG | |
| Schenker XMG Focus 17 M25 | |
| Gemiddeld Intel Core i9-13900HX, NVIDIA GeForce RTX 5070 Ti Laptop | |
| Gemiddelde van klas Gaming | |
| MSI Vector 16 HX AI A2XWHG | |
| PCMark 10 / Score | |
| Schenker XMG Pro 16 (E25) | |
| MSI Vector 17 HX AI A2XWIG | |
| Gemiddelde van klas Gaming (5828 - 11574, n=96, laatste 2 jaar) | |
| Lenovo Legion 5 Pro 16IAX10H | |
| MSI Vector 16 HX AI A2XWHG | |
| Schenker XMG Focus 17 M25 | |
| Gemiddeld Intel Core i9-13900HX, NVIDIA GeForce RTX 5070 Ti Laptop (n=1) | |
| PCMark 10 / Essentials | |
| Schenker XMG Pro 16 (E25) | |
| Schenker XMG Focus 17 M25 | |
| Gemiddeld Intel Core i9-13900HX, NVIDIA GeForce RTX 5070 Ti Laptop (n=1) | |
| MSI Vector 17 HX AI A2XWIG | |
| Lenovo Legion 5 Pro 16IAX10H | |
| MSI Vector 16 HX AI A2XWHG | |
| Gemiddelde van klas Gaming (8810 - 12600, n=100, laatste 2 jaar) | |
| PCMark 10 / Productivity | |
| Gemiddelde van klas Gaming (6845 - 18766, n=98, laatste 2 jaar) | |
| Lenovo Legion 5 Pro 16IAX10H | |
| Schenker XMG Pro 16 (E25) | |
| MSI Vector 16 HX AI A2XWHG | |
| MSI Vector 17 HX AI A2XWIG | |
| Schenker XMG Focus 17 M25 | |
| Gemiddeld Intel Core i9-13900HX, NVIDIA GeForce RTX 5070 Ti Laptop (n=1) | |
| PCMark 10 / Digital Content Creation | |
| MSI Vector 17 HX AI A2XWIG | |
| Schenker XMG Pro 16 (E25) | |
| Lenovo Legion 5 Pro 16IAX10H | |
| Gemiddelde van klas Gaming (7602 - 19657, n=98, laatste 2 jaar) | |
| Schenker XMG Focus 17 M25 | |
| Gemiddeld Intel Core i9-13900HX, NVIDIA GeForce RTX 5070 Ti Laptop (n=1) | |
| MSI Vector 16 HX AI A2XWHG | |
| CrossMark / Overall | |
| Schenker XMG Focus 17 M25 | |
| Gemiddeld Intel Core i9-13900HX, NVIDIA GeForce RTX 5070 Ti Laptop (n=1) | |
| MSI Vector 17 HX AI A2XWIG | |
| Schenker XMG Pro 16 (E25) | |
| Lenovo Legion 5 Pro 16IAX10H | |
| Gemiddelde van klas Gaming (1366 - 2409, n=98, laatste 2 jaar) | |
| MSI Vector 16 HX AI A2XWHG | |
| CrossMark / Productivity | |
| MSI Vector 17 HX AI A2XWIG | |
| Lenovo Legion 5 Pro 16IAX10H | |
| Schenker XMG Focus 17 M25 | |
| Gemiddeld Intel Core i9-13900HX, NVIDIA GeForce RTX 5070 Ti Laptop (n=1) | |
| Schenker XMG Pro 16 (E25) | |
| Gemiddelde van klas Gaming (1386 - 2254, n=98, laatste 2 jaar) | |
| MSI Vector 16 HX AI A2XWHG | |
| CrossMark / Creativity | |
| Schenker XMG Pro 16 (E25) | |
| Schenker XMG Focus 17 M25 | |
| Gemiddeld Intel Core i9-13900HX, NVIDIA GeForce RTX 5070 Ti Laptop (n=1) | |
| Lenovo Legion 5 Pro 16IAX10H | |
| MSI Vector 17 HX AI A2XWIG | |
| MSI Vector 16 HX AI A2XWHG | |
| Gemiddelde van klas Gaming (1343 - 2729, n=98, laatste 2 jaar) | |
| CrossMark / Responsiveness | |
| Schenker XMG Focus 17 M25 | |
| Gemiddeld Intel Core i9-13900HX, NVIDIA GeForce RTX 5070 Ti Laptop (n=1) | |
| MSI Vector 17 HX AI A2XWIG | |
| Lenovo Legion 5 Pro 16IAX10H | |
| Schenker XMG Pro 16 (E25) | |
| Gemiddelde van klas Gaming (1226 - 2334, n=98, laatste 2 jaar) | |
| MSI Vector 16 HX AI A2XWHG | |
| WebXPRT 3 / Overall | |
| Lenovo Legion 5 Pro 16IAX10H | |
| Schenker XMG Pro 16 (E25) | |
| MSI Vector 17 HX AI A2XWIG | |
| MSI Vector 16 HX AI A2XWHG | |
| Gemiddelde van klas Gaming (242 - 532, n=101, laatste 2 jaar) | |
| Gemiddeld Intel Core i9-13900HX, NVIDIA GeForce RTX 5070 Ti Laptop (n=1) | |
| Schenker XMG Focus 17 M25 | |
| WebXPRT 4 / Overall | |
| Schenker XMG Pro 16 (E25) | |
| MSI Vector 17 HX AI A2XWIG | |
| Lenovo Legion 5 Pro 16IAX10H | |
| MSI Vector 16 HX AI A2XWHG | |
| Schenker XMG Focus 17 M25 | |
| Gemiddeld Intel Core i9-13900HX, NVIDIA GeForce RTX 5070 Ti Laptop (n=1) | |
| Gemiddelde van klas Gaming (176.4 - 354, n=101, laatste 2 jaar) | |
| Mozilla Kraken 1.1 / Total | |
| Schenker XMG Focus 17 M25 | |
| Gemiddeld Intel Core i9-13900HX, NVIDIA GeForce RTX 5070 Ti Laptop (n=1) | |
| Gemiddelde van klas Gaming (391 - 590, n=106, laatste 2 jaar) | |
| MSI Vector 16 HX AI A2XWHG | |
| MSI Vector 17 HX AI A2XWIG | |
| Lenovo Legion 5 Pro 16IAX10H | |
| Schenker XMG Pro 16 (E25) | |
* ... kleiner is beter
| PCMark 10 Score | 7560 punten | |
Help | ||
| AIDA64 / Memory Copy | |
| Schenker XMG Pro 16 (E25) | |
| Schenker XMG Focus 17 M25 | |
| Lenovo Legion 5 Pro 16IAX10H | |
| MSI Vector 17 HX AI A2XWIG | |
| Gemiddeld Intel Core i9-13900HX (67716 - 79193, n=22) | |
| Gemiddelde van klas Gaming (21750 - 129946, n=110, laatste 2 jaar) | |
| MSI Vector 16 HX AI A2XWHG | |
| AIDA64 / Memory Read | |
| Schenker XMG Pro 16 (E25) | |
| Schenker XMG Focus 17 M25 | |
| Lenovo Legion 5 Pro 16IAX10H | |
| MSI Vector 17 HX AI A2XWIG | |
| Gemiddeld Intel Core i9-13900HX (73998 - 88462, n=22) | |
| MSI Vector 16 HX AI A2XWHG | |
| Gemiddelde van klas Gaming (22956 - 118858, n=110, laatste 2 jaar) | |
| AIDA64 / Memory Write | |
| Schenker XMG Pro 16 (E25) | |
| Lenovo Legion 5 Pro 16IAX10H | |
| MSI Vector 17 HX AI A2XWIG | |
| Gemiddelde van klas Gaming (22297 - 135096, n=110, laatste 2 jaar) | |
| Schenker XMG Focus 17 M25 | |
| Gemiddeld Intel Core i9-13900HX (65472 - 77045, n=22) | |
| MSI Vector 16 HX AI A2XWHG | |
| AIDA64 / Memory Latency | |
| MSI Vector 17 HX AI A2XWIG | |
| Lenovo Legion 5 Pro 16IAX10H | |
| MSI Vector 16 HX AI A2XWHG | |
| Gemiddelde van klas Gaming (75.3 - 259, n=110, laatste 2 jaar) | |
| Schenker XMG Pro 16 (E25) | |
| Gemiddeld Intel Core i9-13900HX (75.3 - 91.1, n=22) | |
| Schenker XMG Focus 17 M25 | |
* ... kleiner is beter
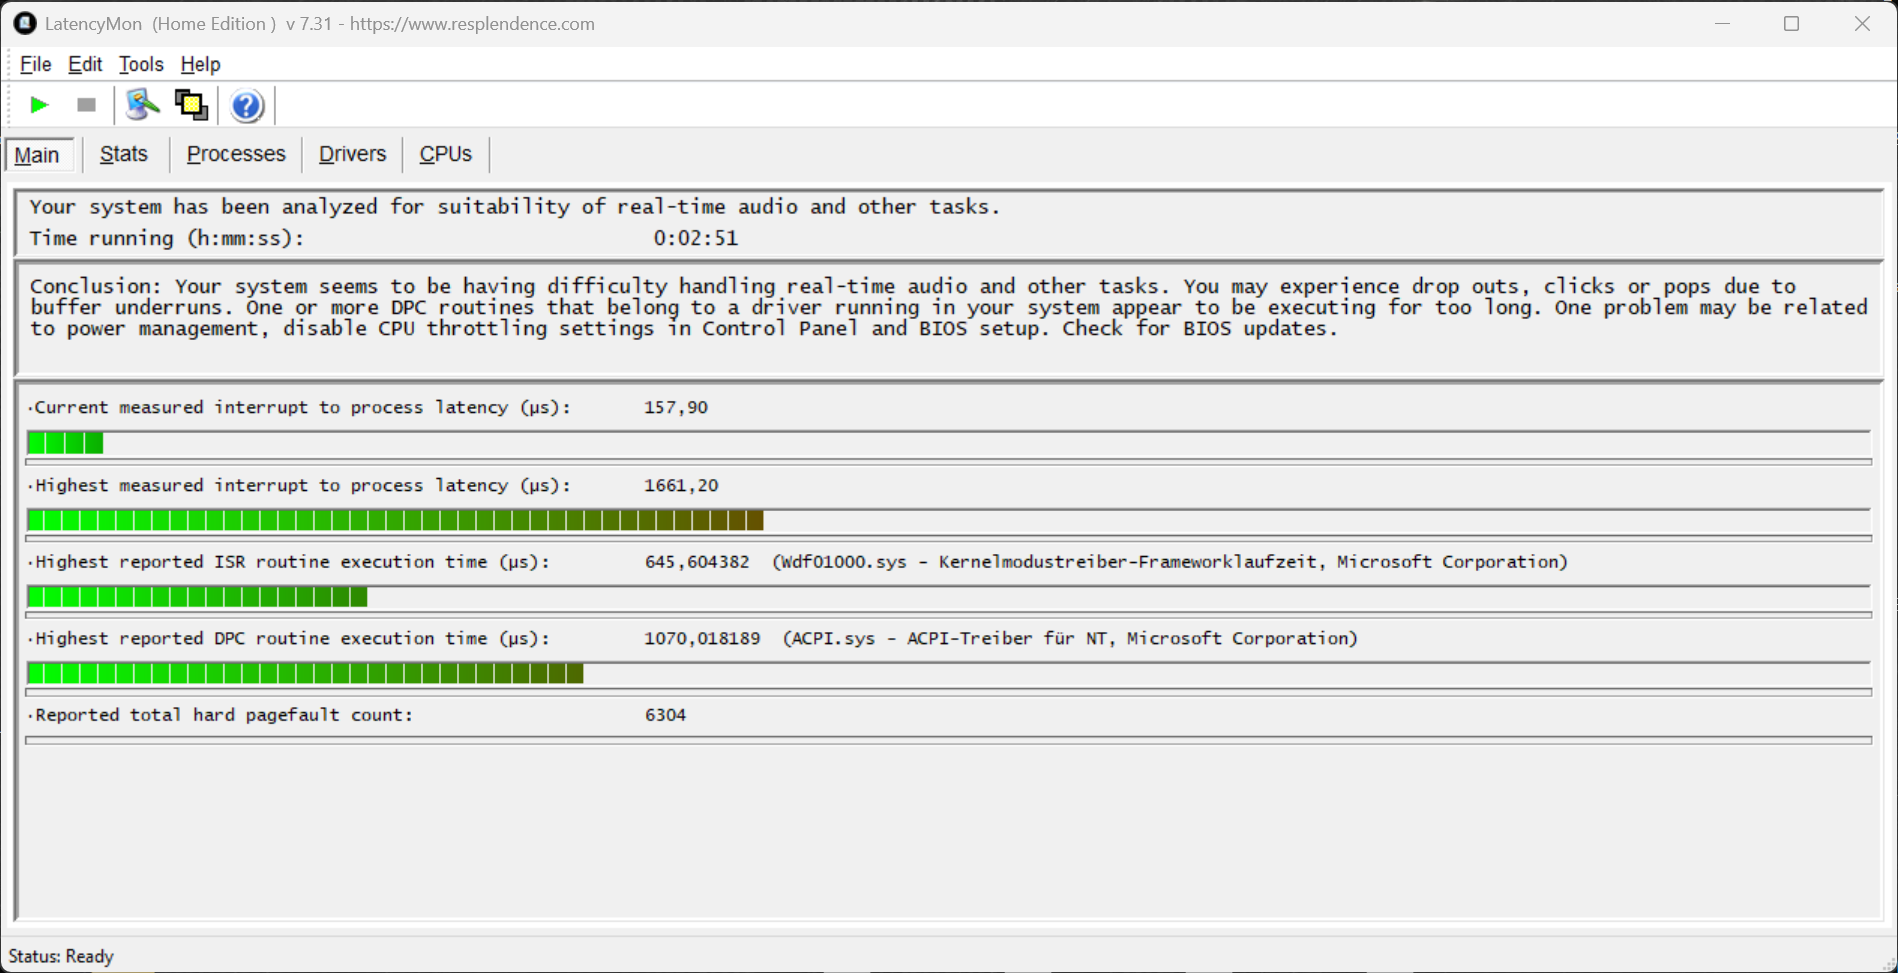
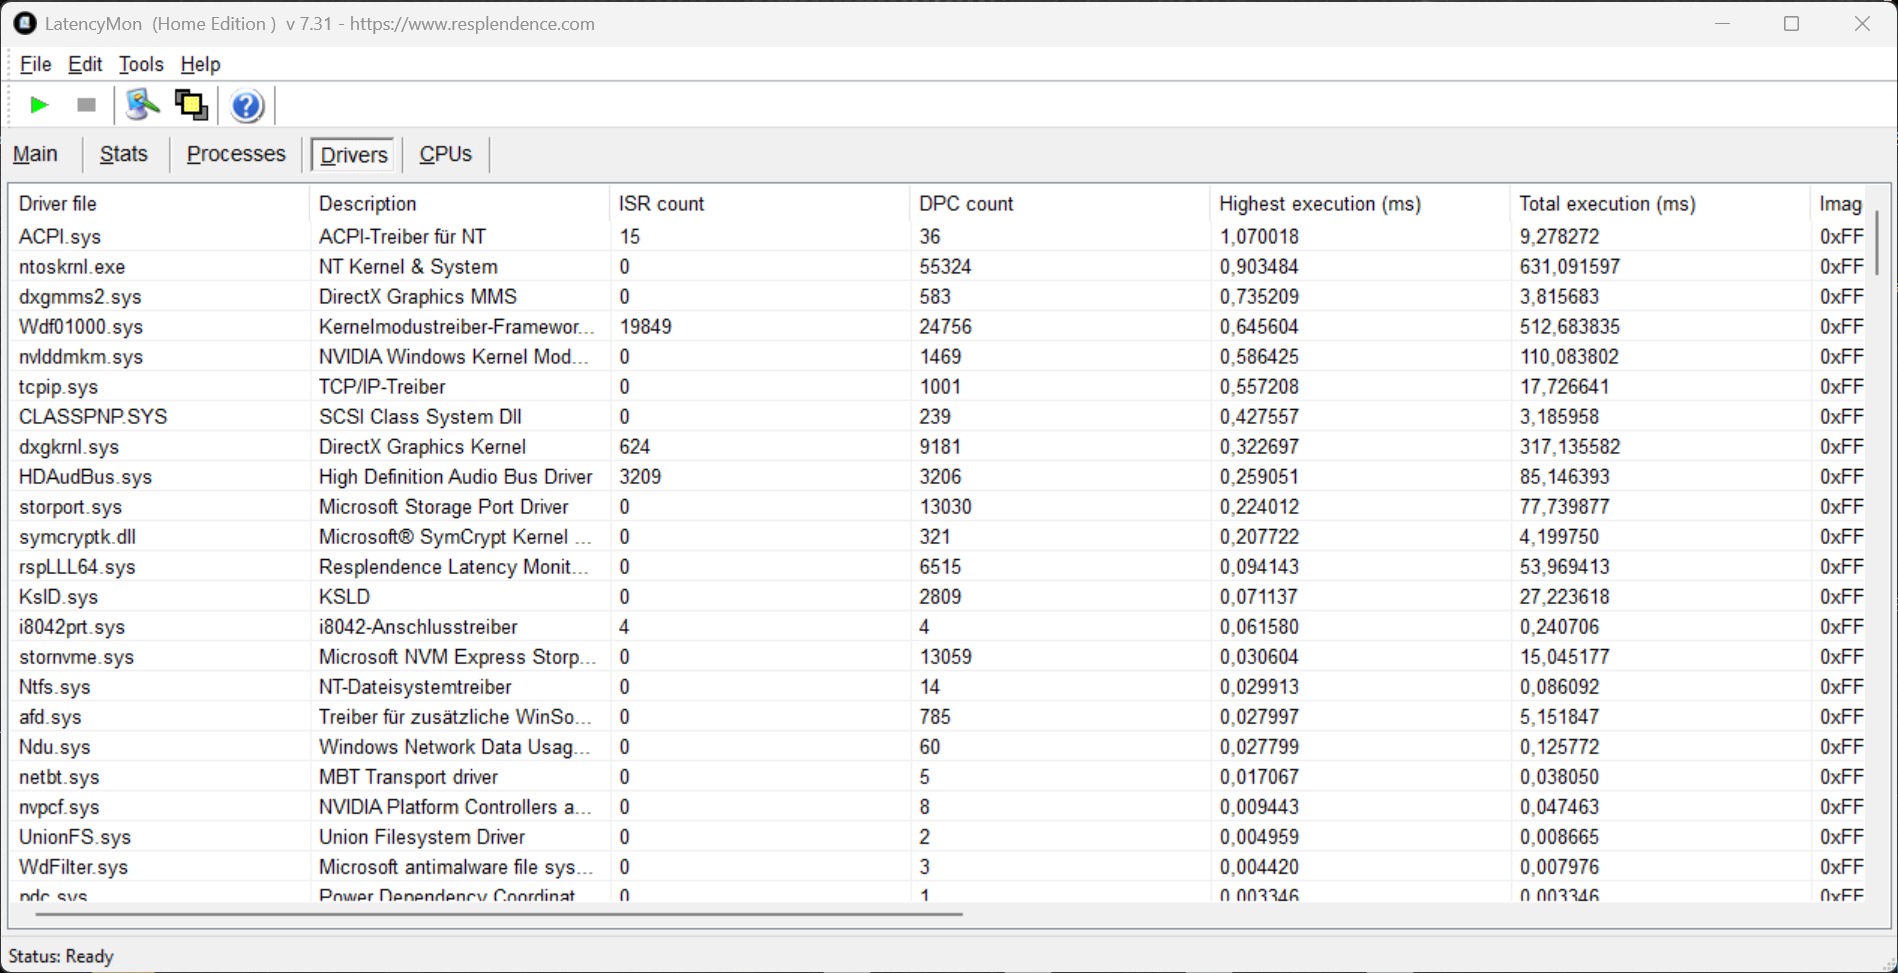
DPC latenties
In onze gestandaardiseerde latentietest (surfen op het web, 4K afspelen van YouTube, CPU-belasting) vertoonde het testapparaat (met de huidige BIOS-versie) lichte beperkingen bij het gebruik van real-time audiotoepassingen.
| DPC Latencies / LatencyMon - interrupt to process latency (max), Web, Youtube, Prime95 | |
| MSI Vector 16 HX AI A2XWHG | |
| Schenker XMG Pro 16 (E25) | |
| Schenker XMG Focus 17 M25 | |
| MSI Vector 17 HX AI A2XWIG | |
| Lenovo Legion 5 Pro 16IAX10H | |
* ... kleiner is beter
Massa-opslag
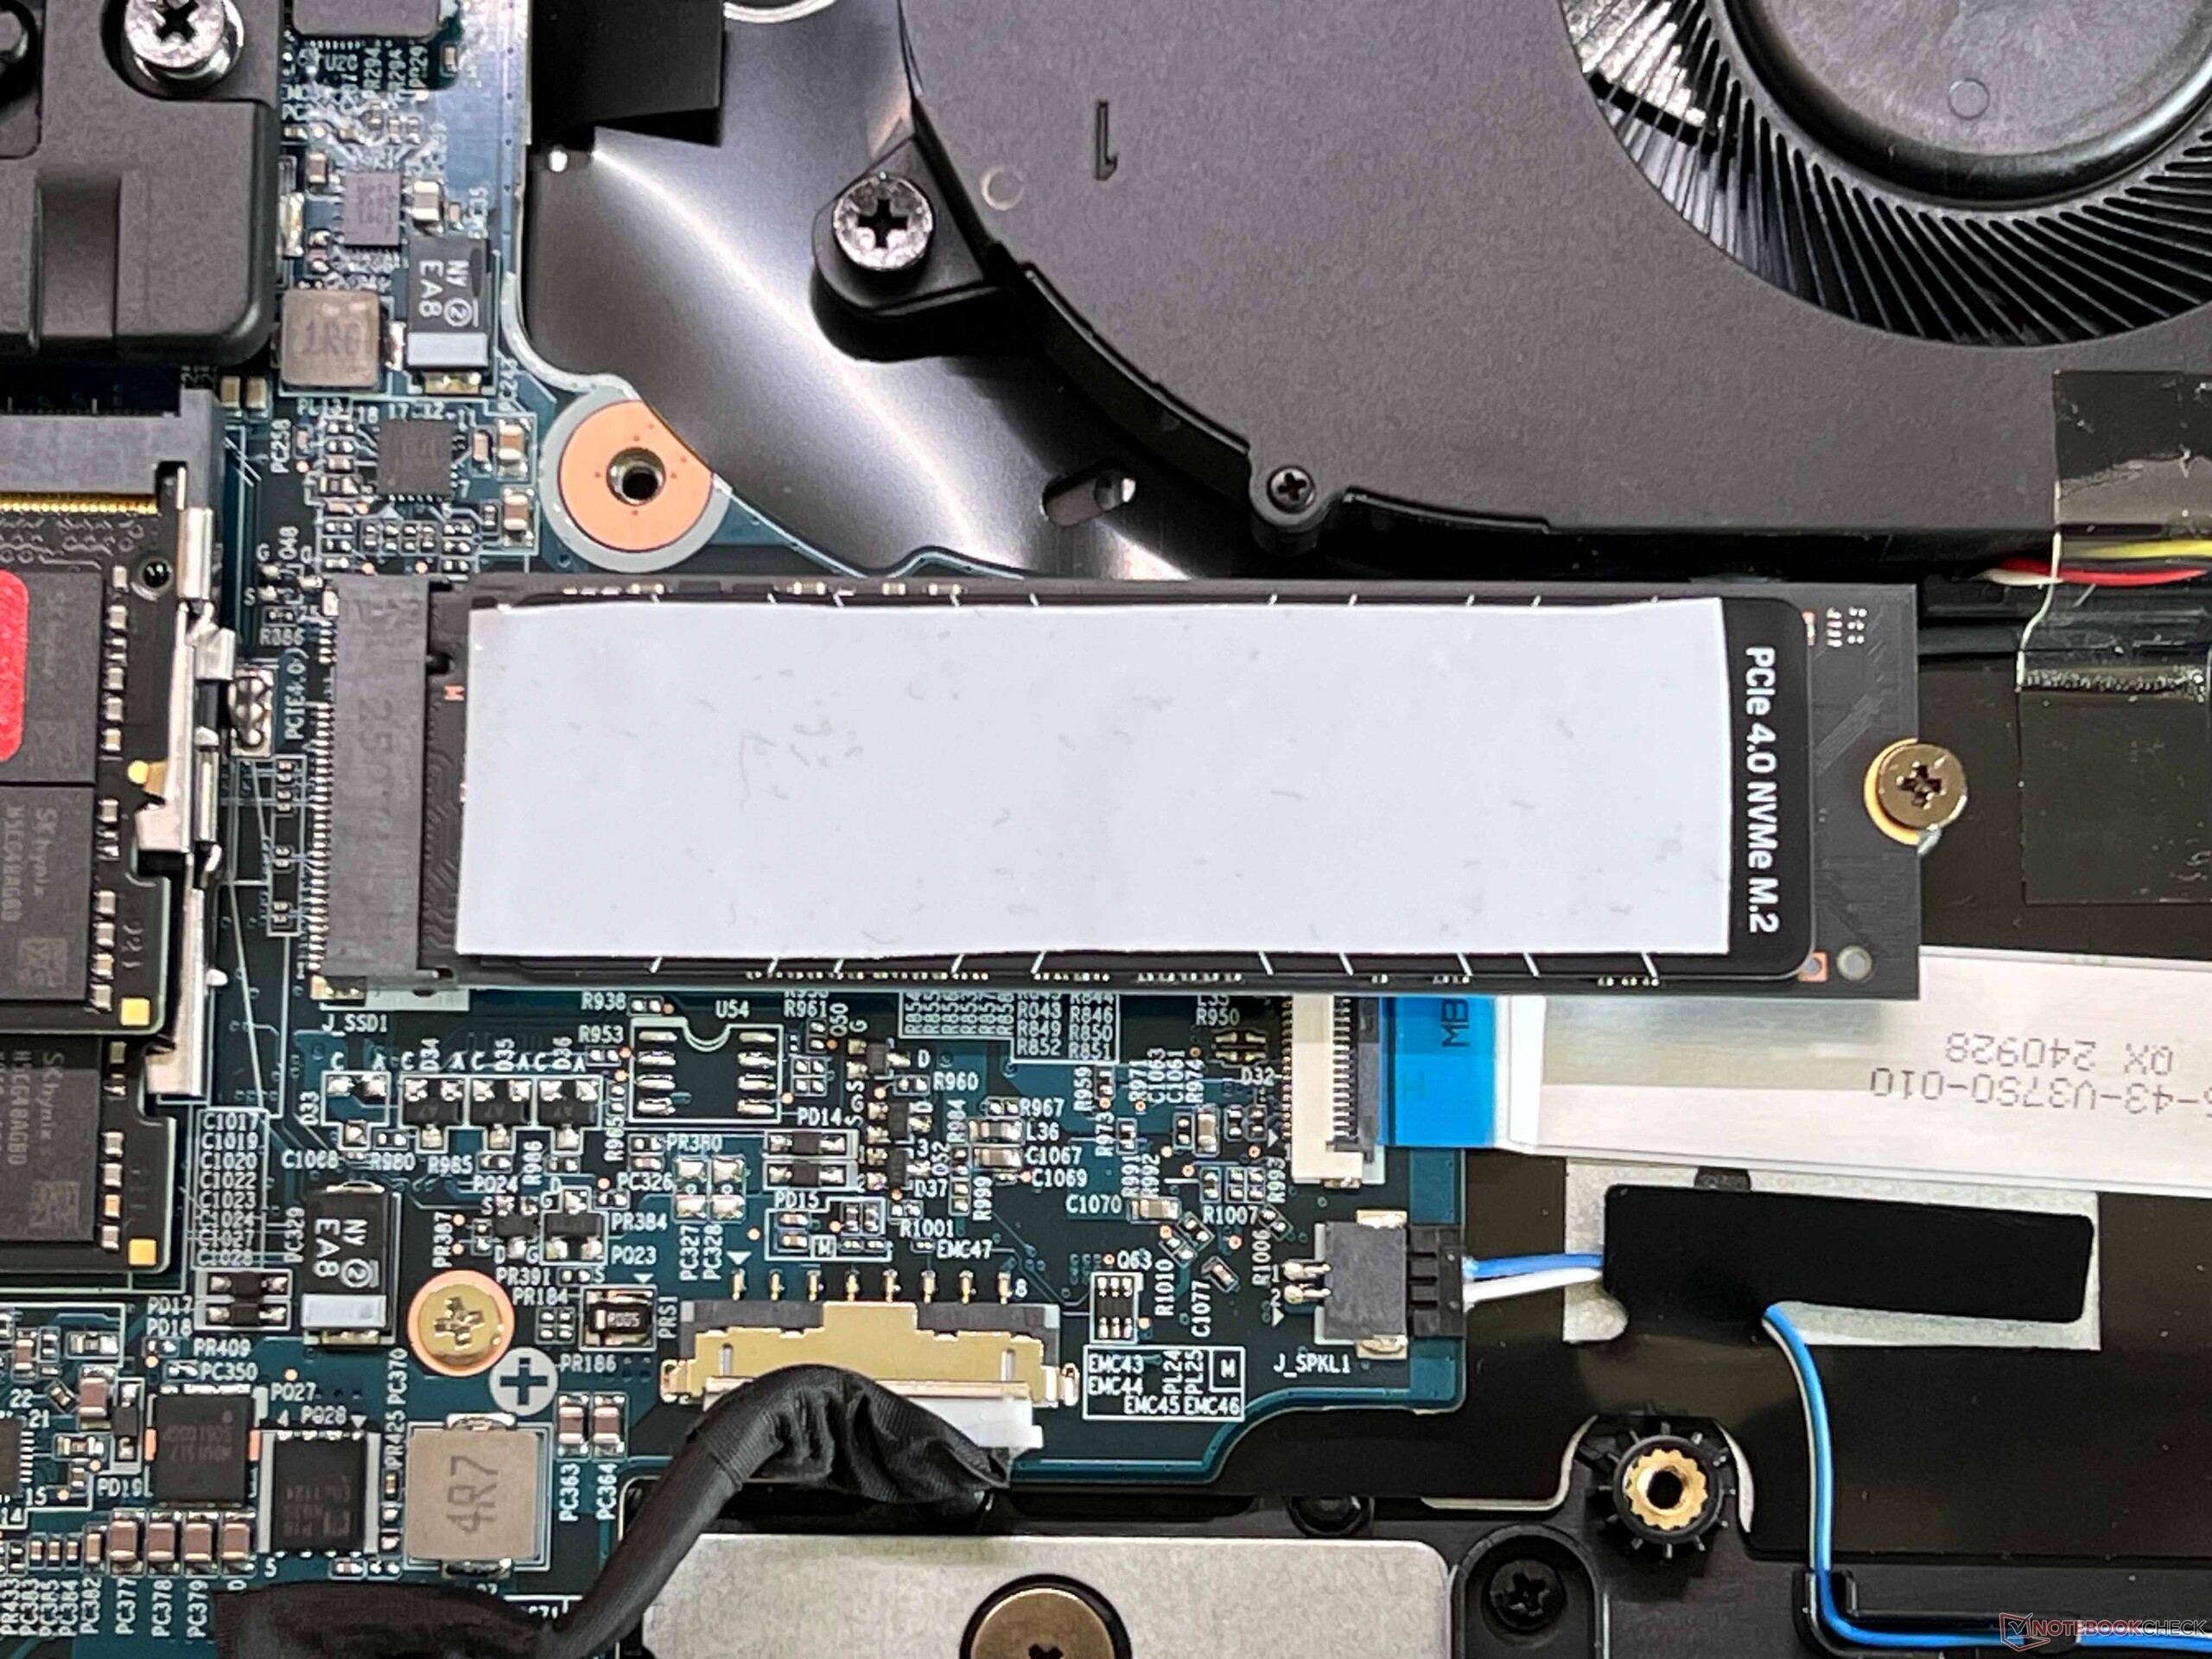
De Focus heeft twee sleuven voor M.2 2280 SSD's (PCIe 4.0), en onze evaluatie-eenheid is uitgerust met een Kingston-schijf van 500 GB (399 GB vrij). De overdrachtsnelheden zijn erg goed en blijven stabiel, zelfs bij langdurige belasting.

* ... kleiner is beter
Sustained Performance Read: DiskSpd Read Loop, Queue Depth 8
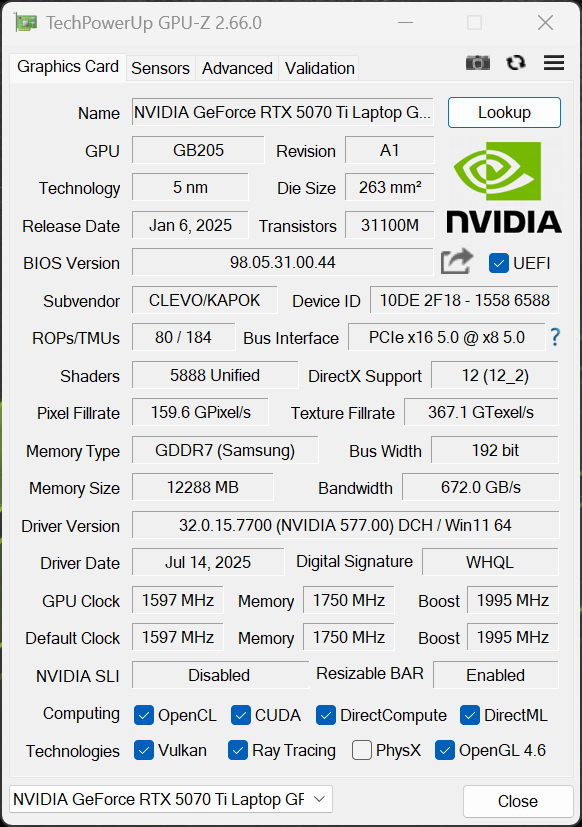
GPU-prestaties
Das Focus 17 is exclusief uitgerust met de nieuwe GeForce RTX 5070 Ti laptop GPU (TGP 140 watt, 12 GB VRAM). De grafische schakeling wordt afgehandeld via Optimus-technologie en er is een multi-threaded switch geïntegreerd. De grafische prestaties in synthetische benchmarks waren uitstekend. Bovendien bleven de GPU-prestaties stabiel onder langdurige belasting.
De gameprestaties zijn ook erg goed, alle titels liggen vloeiend bij een QHD-resolutie. De prestaties waren echter niet helemaal stabiel, omdat de CPU-prestaties na een paar minuten iets terugliepen. Er zijn kleine verschillen afhankelijk van de titel. In onze test met Cyberpunk 2077 daalden de prestaties bijvoorbeeld met ongeveer 5% na ongeveer 5 minuten.
| 3DMark 11 Performance | 43731 punten | |
| 3DMark Fire Strike Score | 33824 punten | |
| 3DMark Time Spy Score | 17276 punten | |
| 3DMark Steel Nomad Score | 3932 punten | |
| 3DMark Steel Nomad Light Score | 17797 punten | |
| 3DMark Steel Nomad Light Unlimited Score | 18318 punten | |
Help | ||
| Blender / v3.3 Classroom OPTIX/RTX | |
| Gemiddelde van klas Gaming (9 - 32, n=112, laatste 2 jaar) | |
| MSI Vector 16 HX AI A2XWHG | |
| Gemiddeld NVIDIA GeForce RTX 5070 Ti Laptop (13 - 19, n=14) | |
| Lenovo Legion 5 Pro 16IAX10H | |
| Schenker XMG Pro 16 (E25) | |
| MSI Vector 17 HX AI A2XWIG | |
| Schenker XMG Focus 17 M25 | |
| Blender / v3.3 Classroom CUDA | |
| Gemiddelde van klas Gaming (15 - 228, n=112, laatste 2 jaar) | |
| Schenker XMG Focus 17 M25 | |
| Gemiddeld NVIDIA GeForce RTX 5070 Ti Laptop (24 - 33, n=14) | |
| Schenker XMG Pro 16 (E25) | |
| MSI Vector 16 HX AI A2XWHG | |
| Lenovo Legion 5 Pro 16IAX10H | |
| MSI Vector 17 HX AI A2XWIG | |
| Blender / v3.3 Classroom CPU | |
| Gemiddelde van klas Gaming (122 - 565, n=108, laatste 2 jaar) | |
| MSI Vector 16 HX AI A2XWHG | |
| Gemiddeld NVIDIA GeForce RTX 5070 Ti Laptop (122 - 361, n=14) | |
| Schenker XMG Focus 17 M25 | |
| MSI Vector 17 HX AI A2XWIG | |
| Lenovo Legion 5 Pro 16IAX10H | |
| Schenker XMG Pro 16 (E25) | |
* ... kleiner is beter
| Performance rating - Percent | |
| MSI Vector 17 HX AI A2XWIG | |
| Lenovo Legion 5 Pro 16IAX10H | |
| Schenker XMG Focus 17 M25 | |
| MSI Vector 16 HX AI A2XWHG -1! | |
| Schenker XMG Pro 16 (E25) | |
| Gemiddelde van klas Gaming | |
| Cyberpunk 2077 - 1920x1080 Ultra Preset (FSR off) | |
| MSI Vector 17 HX AI A2XWIG | |
| Lenovo Legion 5 Pro 16IAX10H | |
| Schenker XMG Pro 16 (E25) | |
| MSI Vector 16 HX AI A2XWHG | |
| Schenker XMG Focus 17 M25 | |
| Gemiddelde van klas Gaming (17.7 - 169.9, n=121, laatste 2 jaar) | |
| Baldur's Gate 3 - 1920x1080 Ultra Preset AA:T | |
| MSI Vector 17 HX AI A2XWIG | |
| Schenker XMG Pro 16 (E25) | |
| Schenker XMG Focus 17 M25 | |
| MSI Vector 16 HX AI A2XWHG | |
| Lenovo Legion 5 Pro 16IAX10H | |
| Gemiddelde van klas Gaming (59.4 - 246, n=107, laatste 2 jaar) | |
| GTA V - 1920x1080 Highest AA:4xMSAA + FX AF:16x | |
| Schenker XMG Pro 16 (E25) | |
| MSI Vector 17 HX AI A2XWIG | |
| Schenker XMG Focus 17 M25 | |
| Lenovo Legion 5 Pro 16IAX10H | |
| MSI Vector 16 HX AI A2XWHG | |
| Gemiddelde van klas Gaming (48.3 - 186.9, n=103, laatste 2 jaar) | |
| Final Fantasy XV Benchmark - 1920x1080 High Quality | |
| MSI Vector 17 HX AI A2XWIG | |
| Lenovo Legion 5 Pro 16IAX10H | |
| MSI Vector 16 HX AI A2XWHG | |
| Schenker XMG Focus 17 M25 | |
| Schenker XMG Pro 16 (E25) | |
| Gemiddelde van klas Gaming (41 - 215, n=104, laatste 2 jaar) | |
| Strange Brigade - 1920x1080 ultra AA:ultra AF:16 | |
| MSI Vector 17 HX AI A2XWIG | |
| Lenovo Legion 5 Pro 16IAX10H | |
| Schenker XMG Focus 17 M25 | |
| Gemiddelde van klas Gaming (76.3 - 456, n=94, laatste 2 jaar) | |
| Schenker XMG Pro 16 (E25) | |
| Dota 2 Reborn - 1920x1080 ultra (3/3) best looking | |
| Schenker XMG Pro 16 (E25) | |
| Lenovo Legion 5 Pro 16IAX10H | |
| MSI Vector 17 HX AI A2XWIG | |
| Schenker XMG Focus 17 M25 | |
| MSI Vector 16 HX AI A2XWHG | |
| Gemiddelde van klas Gaming (84.8 - 248, n=113, laatste 2 jaar) | |
| F1 24 - 2560x1440 Ultra High Preset AA:T AF:16x | |
| Schenker XMG Pro 16 (E25) | |
| Gemiddelde van klas Gaming (29.8 - 106.9, n=60, laatste 2 jaar) | |
| Schenker XMG Focus 17 M25 | |
| Gemiddeld NVIDIA GeForce RTX 5070 Ti Laptop (53.2 - 72.1, n=10) | |
| F1 25 - 2560x1440 Ultra Max Preset AA:T AF:16x | |
| Gemiddeld NVIDIA GeForce RTX 5070 Ti Laptop (18 - 26, n=7) | |
| Gemiddelde van klas Gaming (5 - 37.5, n=24, laatste 2 jaar) | |
| Lenovo Legion 5 Pro 16IAX10H | |
| Assassin's Creed Shadows - 2560x1440 Ultra High | |
| Schenker XMG Focus 17 M25 | |
| Gemiddelde van klas Gaming (22 - 64, n=48, laatste 2 jaar) | |
| Lenovo Legion 5 Pro 16IAX10H | |
| Gemiddeld NVIDIA GeForce RTX 5070 Ti Laptop (40 - 48, n=9) | |
Cyberpunk 2077 ultra FPS diagram
| lage | gem. | hoge | ultra | QHD DLSS | QHD | |
|---|---|---|---|---|---|---|
| GTA V (2015) | 152.9 | 139.1 | ||||
| Dota 2 Reborn (2015) | 223 | 192.9 | 178.8 | 165.4 | ||
| Final Fantasy XV Benchmark (2018) | 223 | 197.6 | 156.8 | 129.5 | ||
| X-Plane 11.11 (2018) | 165 | 142.2 | 124.6 | |||
| Strange Brigade (2018) | 438 | 362 | 328 | 303 | 229 | |
| Baldur's Gate 3 (2023) | 202.6 | 172.8 | 154.2 | 153.9 | 108.6 | |
| Cyberpunk 2077 (2023) | 149.4 | 139.8 | 126.4 | 115.7 | 93.9 | 81 |
| F1 24 (2024) | 247 | 236 | 232 | 98.7 | 98.4 | 66.4 |
| Assassin's Creed Shadows (2025) | 90 | 84 | 72 | 55 | 47 |
Uitstoot & energie
Geluidsmissies
Bij dagelijks gebruik blijven de twee ventilatoren over het algemeen erg stil, zelfs bij gebruik van het snelle energieprofiel, en de ventilatorsnelheid vermindert ook erg snel nadat de belastingsfase is afgelopen. Met 56,2 dB(A) wordt het erg luid tijdens het gamen in de snelste modus, en een hoofdtelefoon wordt aanbevolen. De stille modus is daarentegen erg stil met een maximum van 37 dB(A), en de gamingprestaties zijn nog steeds acceptabel. Er werden geen andere elektronische geluiden gedetecteerd op de evaluatie-eenheid.
Geluidsniveau
| Onbelast |
| 24.8 / 24.8 / 27.7 dB (A) |
| Belasting |
| 51 / 56.2 dB (A) |
 | ||
30 dB stil 40 dB(A) hoorbaar 50 dB(A) luid |
||
min: | ||
| Schenker XMG Focus 17 M25 GeForce RTX 5070 Ti Laptop, i9-13900HX, Kingston Fury Renegade SFYRS500G | MSI Vector 17 HX AI A2XWIG GeForce RTX 5080 Laptop, Ultra 9 275HX, Western Digital PC SN5000S SDEPNSJ-2T00-1032 | Lenovo Legion 5 Pro 16IAX10H GeForce RTX 5070 Ti Laptop, Ultra 9 275HX, Western Digital PC SN8000S SDEPNRK-1T00 | MSI Vector 16 HX AI A2XWHG GeForce RTX 5070 Ti Laptop, Ultra 7 255HX, Micron 2400 MTFDKBA512QFM | Schenker XMG Pro 16 (E25) GeForce RTX 5070 Ti Laptop, Ultra 9 275HX, Samsung 9100 Pro 1 TB | |
|---|---|---|---|---|---|
| Noise | -0% | -2% | -10% | 5% | |
| uit / omgeving * (dB) | 24.8 | 24 3% | 24 3% | 25 -1% | 23.3 6% |
| Idle Minimum * (dB) | 24.8 | 24 3% | 24 3% | 33 -33% | 25 -1% |
| Idle Average * (dB) | 24.8 | 30.82 -24% | 24 3% | 34 -37% | 25 -1% |
| Idle Maximum * (dB) | 27.7 | 31.31 -13% | 30.9 -12% | 38 -37% | 25 10% |
| Load Average * (dB) | 51 | 31.12 39% | 55.9 -10% | 46 10% | 45.5 11% |
| Cyberpunk 2077 ultra * (dB) | 56.2 | 59.24 -5% | 56.72 -1% | 47 16% | 53.3 5% |
| Load Maximum * (dB) | 56.2 | 59.24 -5% | 56.72 -1% | 49 13% | 53.3 5% |
* ... kleiner is beter
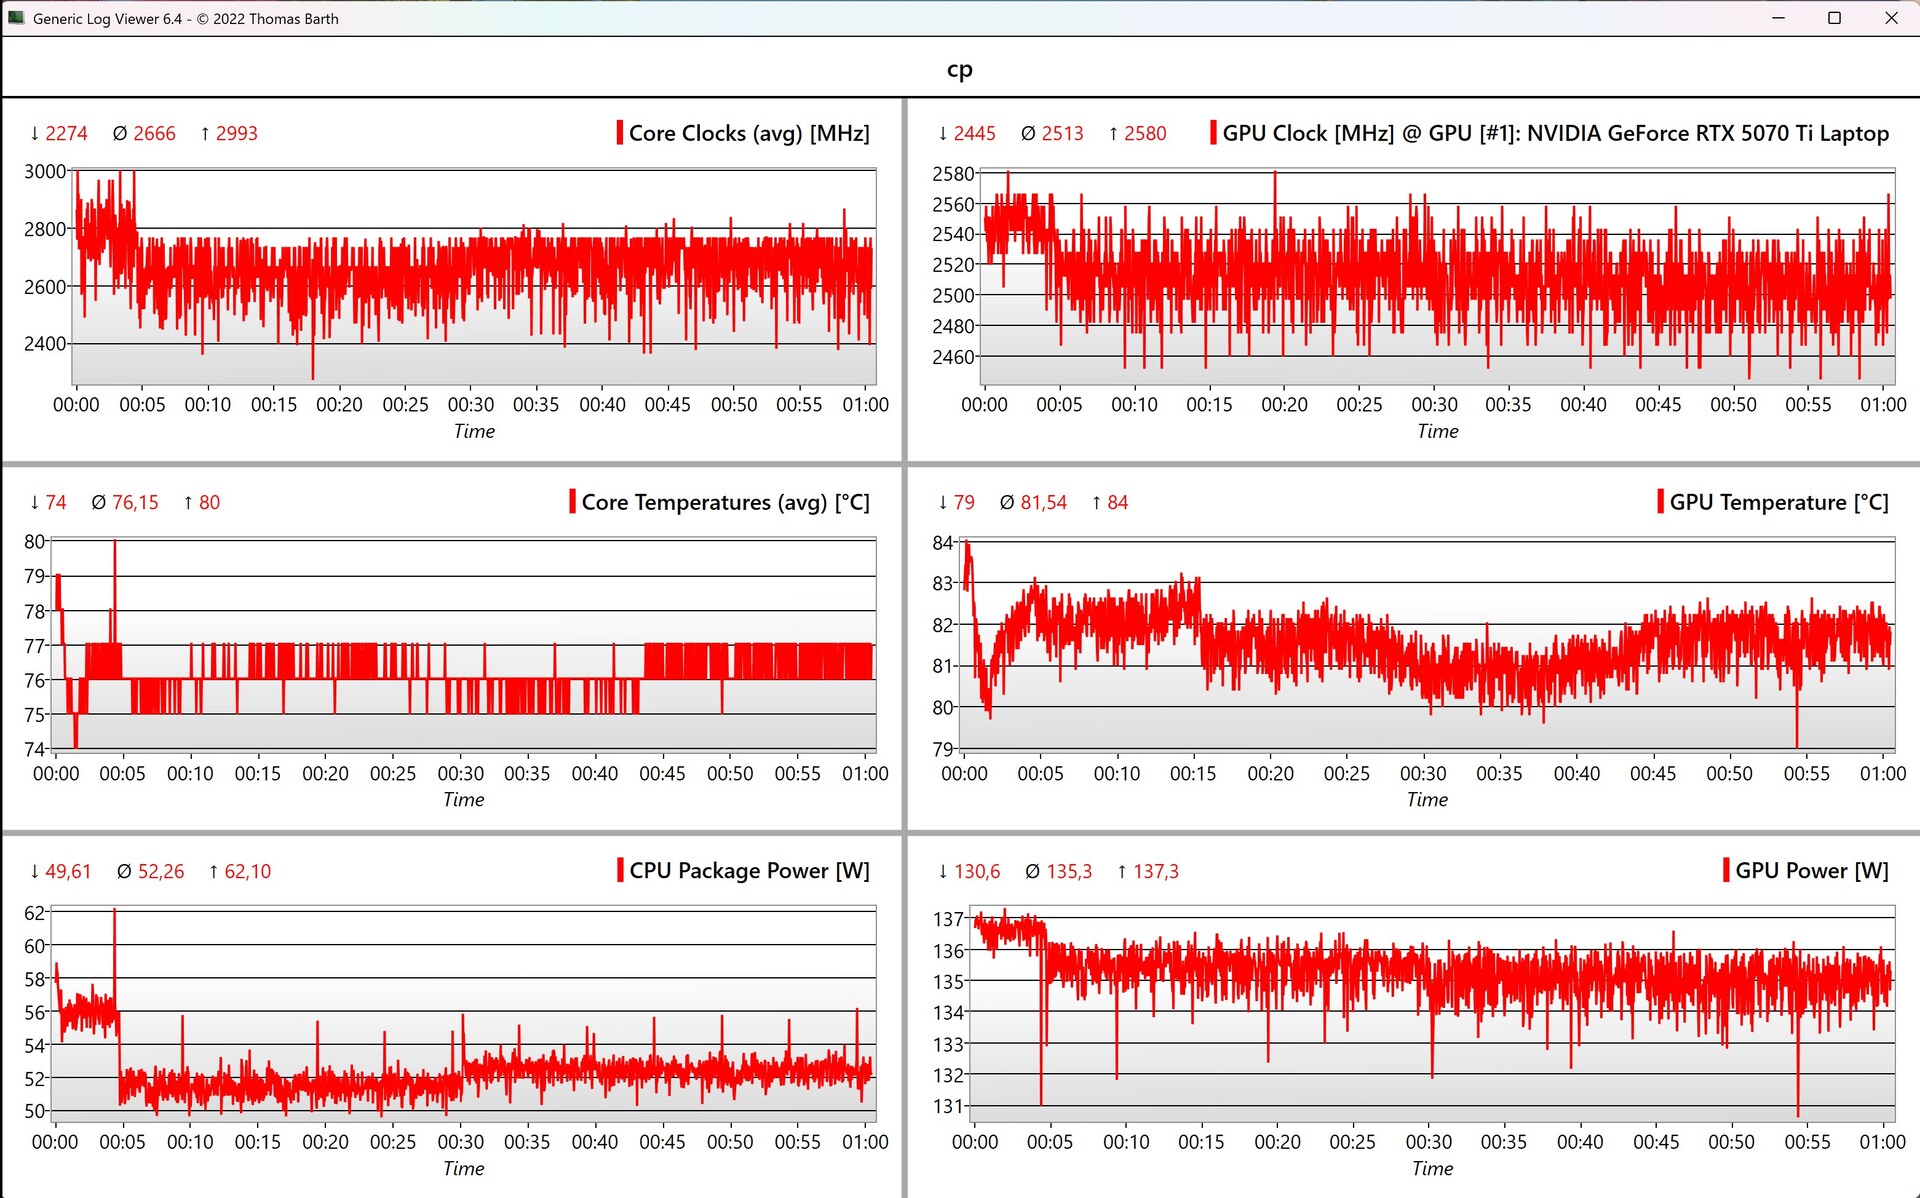
Temperatuur
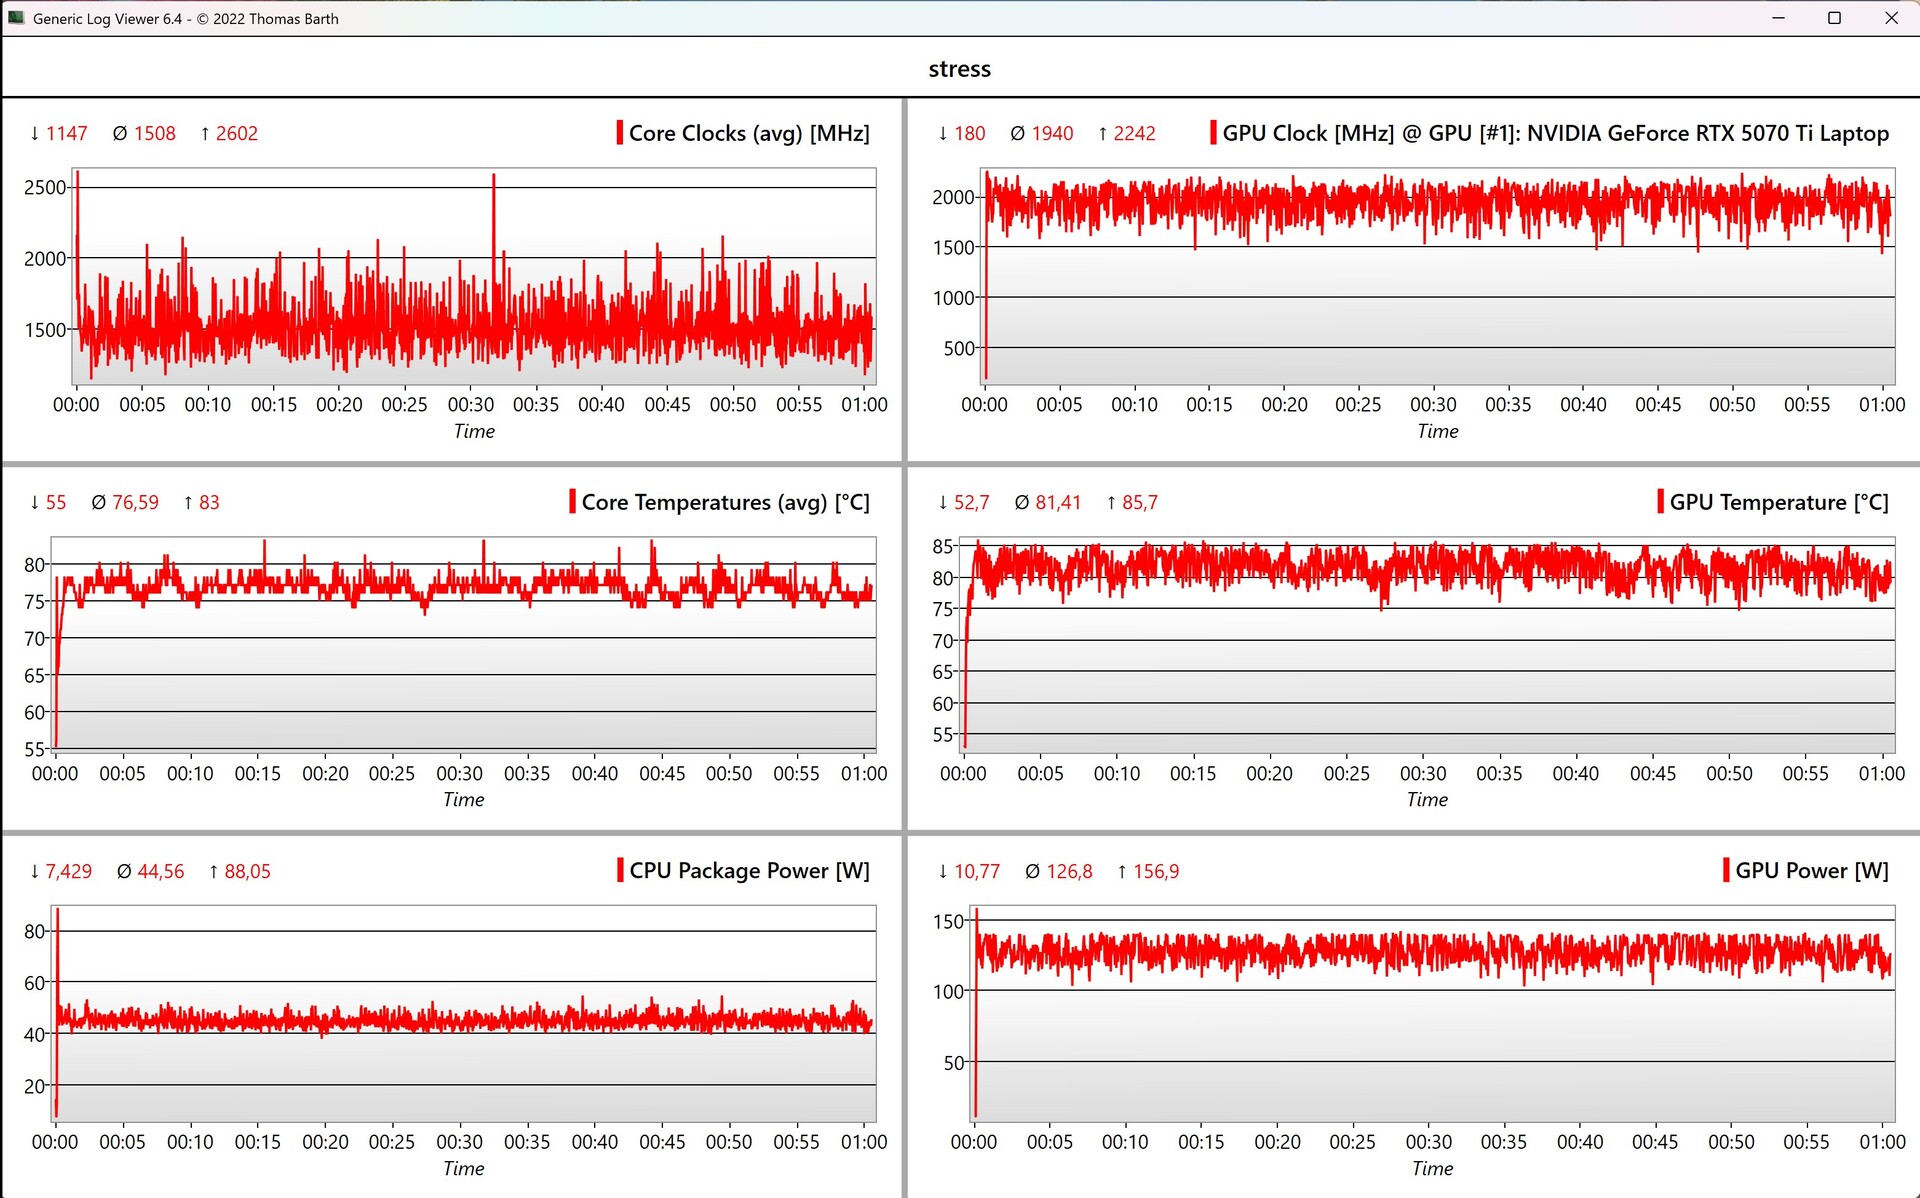
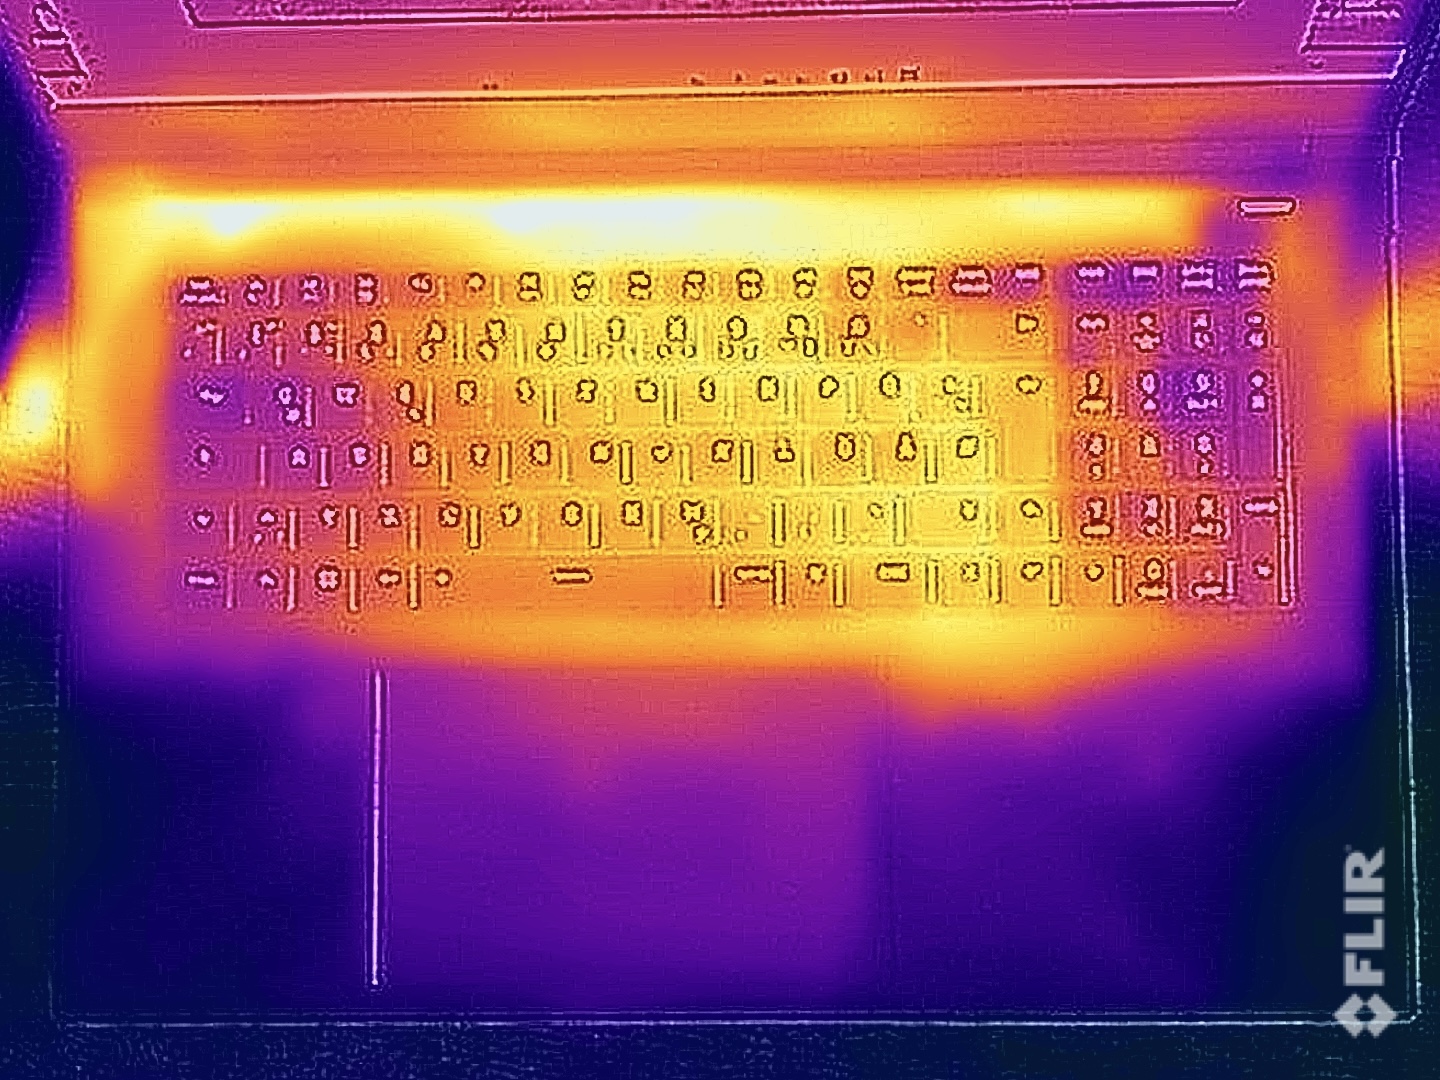
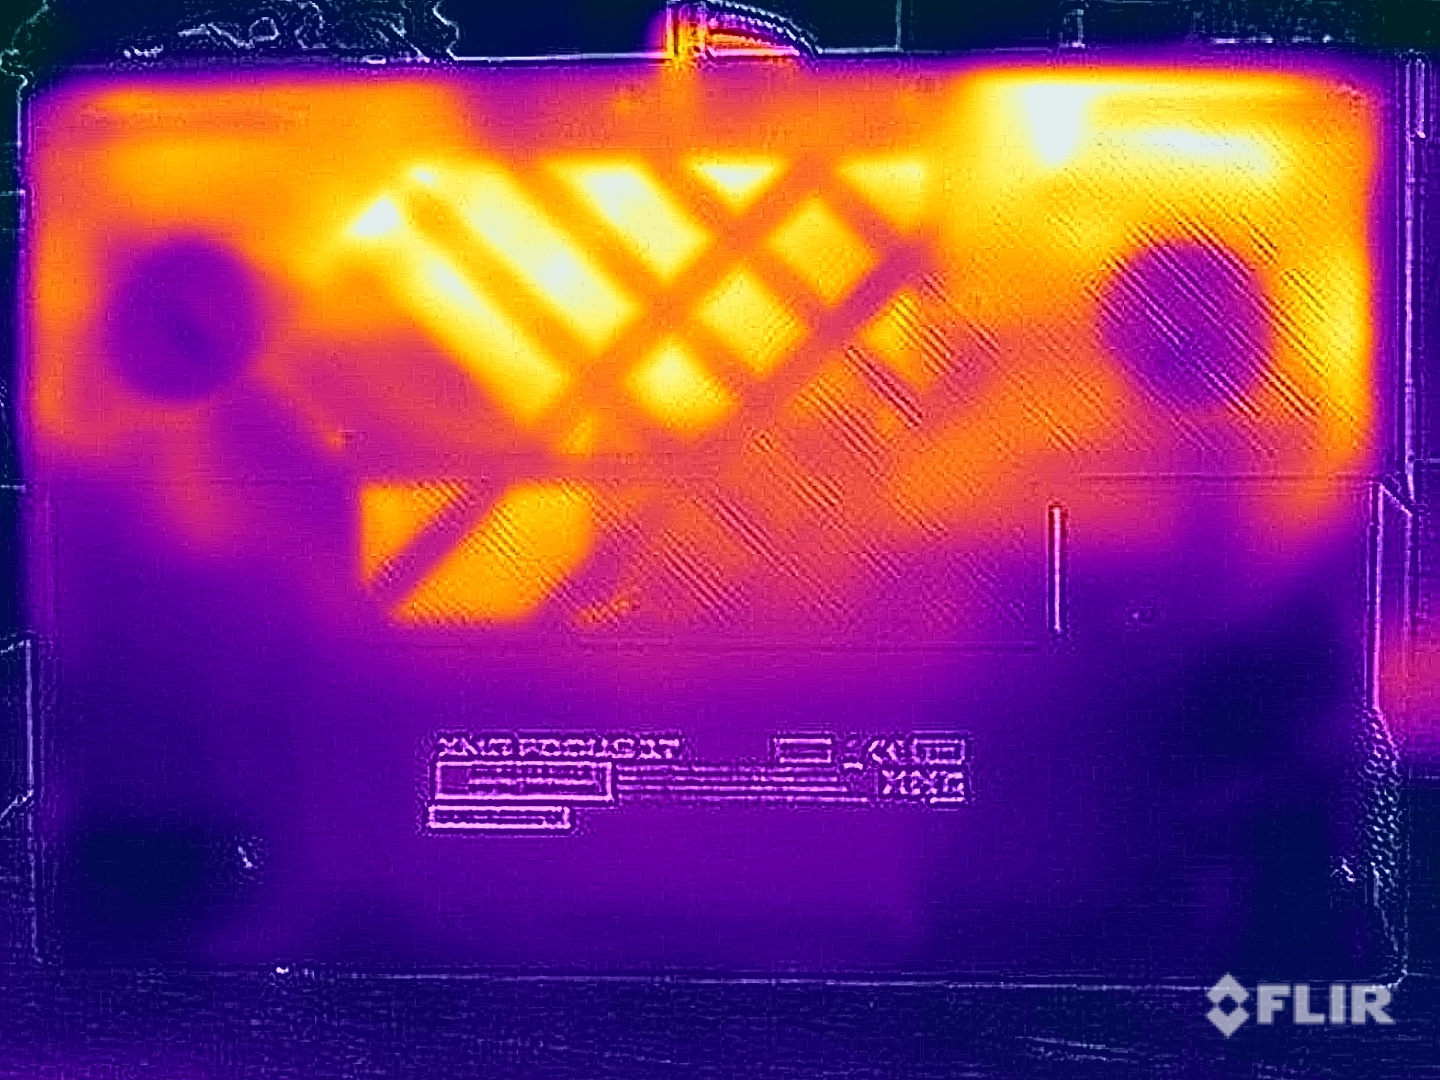
De oppervlaktetemperaturen blijven onproblematisch, en vooral het toetsenbord wordt niet te heet, zelfs niet tijdens het gamen. Het onderpaneel bereikt een maximum van 48°C, maar gezien de afmetingen zult u de Focus 17 waarschijnlijk toch niet op uw schoot leggen. In de stresstest werkte de GPU op ongeveer 130 watt (81°C) en de CPU op 45 watt (77°C).
(±) De maximumtemperatuur aan de bovenzijde bedraagt 41.2 °C / 106 F, vergeleken met het gemiddelde van 40.4 °C / 105 F, variërend van 21.2 tot 68.8 °C voor de klasse Gaming.
(-) De bodem warmt op tot een maximum van 48.8 °C / 120 F, vergeleken met een gemiddelde van 43.2 °C / 110 F
(+) Bij onbelast gebruik bedraagt de gemiddelde temperatuur voor de bovenzijde 26.6 °C / 80 F, vergeleken met het apparaatgemiddelde van 33.9 °C / 93 F.
(±) 3: The average temperature for the upper side is 35.6 °C / 96 F, compared to the average of 33.9 °C / 93 F for the class Gaming.
(+) De palmsteunen en het touchpad zijn met een maximum van ###max## °C / 82.4 F koeler dan de huidtemperatuur en voelen daarom koel aan.
(±) De gemiddelde temperatuur van de handpalmsteun van soortgelijke toestellen bedroeg 28.8 °C / 83.8 F (+0.8 °C / 1.4 F).
| Schenker XMG Focus 17 M25 Intel Core i9-13900HX, NVIDIA GeForce RTX 5070 Ti Laptop | MSI Vector 17 HX AI A2XWIG Intel Core Ultra 9 275HX, NVIDIA GeForce RTX 5080 Laptop | Lenovo Legion 5 Pro 16IAX10H Intel Core Ultra 9 275HX, NVIDIA GeForce RTX 5070 Ti Laptop | MSI Vector 16 HX AI A2XWHG Intel Core Ultra 7 255HX, NVIDIA GeForce RTX 5070 Ti Laptop | Schenker XMG Pro 16 (E25) Intel Core Ultra 9 275HX, NVIDIA GeForce RTX 5070 Ti Laptop | |
|---|---|---|---|---|---|
| Heat | -24% | -24% | -13% | -194% | |
| Maximum Upper Side * (°C) | 41.2 | 53 -29% | 48 -17% | 53 -29% | 43.2 -5% |
| Maximum Bottom * (°C) | 48.8 | 54 -11% | 50 -2% | 52 -7% | 46 6% |
| Idle Upper Side * (°C) | 27.6 | 39 -41% | 38 -38% | 33 -20% | 27.7 -0% |
| Idle Bottom * (°C) | 30.1 | 34 -13% | 42 -40% | 29 4% | 264 -777% |
* ... kleiner is beter
Luidsprekers
De twee stereoluidsprekers maken geen indruk, met een erg dun geluid en een laag maximaal volume.
Schenker XMG Focus 17 M25 audioanalyse
(±) | luidspreker luidheid is gemiddeld maar goed (78.5 dB)
Bas 100 - 315 Hz
(-) | bijna geen lage tonen - gemiddeld 21.9% lager dan de mediaan
(±) | lineariteit van de lage tonen is gemiddeld (13.4% delta ten opzichte van de vorige frequentie)
Midden 400 - 2000 Hz
(+) | evenwichtige middens - slechts 2.8% verwijderd van de mediaan
(±) | lineariteit van de middentonen is gemiddeld (7.3% delta ten opzichte van de vorige frequentie)
Hoog 2 - 16 kHz
(+) | evenwichtige hoogtepunten - slechts 3.9% verwijderd van de mediaan
(+) | de hoge tonen zijn lineair (5.8% delta naar de vorige frequentie)
Algemeen 100 - 16.000 Hz
(±) | lineariteit van het totale geluid is gemiddeld (18.8% verschil met de mediaan)
Vergeleken met dezelfde klasse
» 62% van alle geteste apparaten in deze klasse waren beter, 8% vergelijkbaar, 30% slechter
» De beste had een delta van 6%, het gemiddelde was 18%, de slechtste was 132%
Vergeleken met alle geteste toestellen
» 43% van alle geteste apparaten waren beter, 8% gelijk, 49% slechter
» De beste had een delta van 4%, het gemiddelde was 24%, de slechtste was 134%
MSI Vector 17 HX AI A2XWIG audioanalyse
(±) | luidspreker luidheid is gemiddeld maar goed (80.39 dB)
Bas 100 - 315 Hz
(±) | verminderde zeebaars - gemiddeld 10.4% lager dan de mediaan
(±) | lineariteit van de lage tonen is gemiddeld (7.4% delta ten opzichte van de vorige frequentie)
Midden 400 - 2000 Hz
(±) | hogere middens - gemiddeld 6.2% hoger dan de mediaan
(+) | de middentonen zijn lineair (4.7% delta ten opzichte van de vorige frequentie)
Hoog 2 - 16 kHz
(+) | evenwichtige hoogtepunten - slechts 4.3% verwijderd van de mediaan
(±) | lineariteit van de hoogtepunten is gemiddeld (8.7% delta ten opzichte van de vorige frequentie)
Algemeen 100 - 16.000 Hz
(±) | lineariteit van het totale geluid is gemiddeld (15.6% verschil met de mediaan)
Vergeleken met dezelfde klasse
» 36% van alle geteste apparaten in deze klasse waren beter, 6% vergelijkbaar, 58% slechter
» De beste had een delta van 6%, het gemiddelde was 18%, de slechtste was 132%
Vergeleken met alle geteste toestellen
» 23% van alle geteste apparaten waren beter, 5% gelijk, 72% slechter
» De beste had een delta van 4%, het gemiddelde was 24%, de slechtste was 134%
Lenovo Legion 5 Pro 16IAX10H audioanalyse
(±) | luidspreker luidheid is gemiddeld maar goed (78.2 dB)
Bas 100 - 315 Hz
(-) | bijna geen lage tonen - gemiddeld 21.1% lager dan de mediaan
(±) | lineariteit van de lage tonen is gemiddeld (8% delta ten opzichte van de vorige frequentie)
Midden 400 - 2000 Hz
(±) | hogere middens - gemiddeld 6.3% hoger dan de mediaan
(+) | de middentonen zijn lineair (6.5% delta ten opzichte van de vorige frequentie)
Hoog 2 - 16 kHz
(+) | evenwichtige hoogtepunten - slechts 1.6% verwijderd van de mediaan
(+) | de hoge tonen zijn lineair (4.9% delta naar de vorige frequentie)
Algemeen 100 - 16.000 Hz
(±) | lineariteit van het totale geluid is gemiddeld (18.3% verschil met de mediaan)
Vergeleken met dezelfde klasse
» 58% van alle geteste apparaten in deze klasse waren beter, 9% vergelijkbaar, 33% slechter
» De beste had een delta van 6%, het gemiddelde was 18%, de slechtste was 132%
Vergeleken met alle geteste toestellen
» 40% van alle geteste apparaten waren beter, 8% gelijk, 52% slechter
» De beste had een delta van 4%, het gemiddelde was 24%, de slechtste was 134%
MSI Vector 16 HX AI A2XWHG audioanalyse
(+) | luidsprekers kunnen relatief luid spelen (86 dB)
Bas 100 - 315 Hz
(±) | verminderde zeebaars - gemiddeld 12.3% lager dan de mediaan
(±) | lineariteit van de lage tonen is gemiddeld (8.5% delta ten opzichte van de vorige frequentie)
Midden 400 - 2000 Hz
(±) | hogere middens - gemiddeld 9.9% hoger dan de mediaan
(+) | de middentonen zijn lineair (6.8% delta ten opzichte van de vorige frequentie)
Hoog 2 - 16 kHz
(+) | evenwichtige hoogtepunten - slechts 1.8% verwijderd van de mediaan
(+) | de hoge tonen zijn lineair (2.9% delta naar de vorige frequentie)
Algemeen 100 - 16.000 Hz
(±) | lineariteit van het totale geluid is gemiddeld (15.8% verschil met de mediaan)
Vergeleken met dezelfde klasse
» 37% van alle geteste apparaten in deze klasse waren beter, 7% vergelijkbaar, 56% slechter
» De beste had een delta van 6%, het gemiddelde was 18%, de slechtste was 132%
Vergeleken met alle geteste toestellen
» 24% van alle geteste apparaten waren beter, 5% gelijk, 71% slechter
» De beste had een delta van 4%, het gemiddelde was 24%, de slechtste was 134%
Schenker XMG Pro 16 (E25) audioanalyse
(±) | luidspreker luidheid is gemiddeld maar goed (79.2 dB)
Bas 100 - 315 Hz
(±) | verminderde zeebaars - gemiddeld 14.2% lager dan de mediaan
(±) | lineariteit van de lage tonen is gemiddeld (10.6% delta ten opzichte van de vorige frequentie)
Midden 400 - 2000 Hz
(±) | hogere middens - gemiddeld 8.2% hoger dan de mediaan
(±) | lineariteit van de middentonen is gemiddeld (9.9% delta ten opzichte van de vorige frequentie)
Hoog 2 - 16 kHz
(+) | evenwichtige hoogtepunten - slechts 3.8% verwijderd van de mediaan
(+) | de hoge tonen zijn lineair (5.9% delta naar de vorige frequentie)
Algemeen 100 - 16.000 Hz
(±) | lineariteit van het totale geluid is gemiddeld (18.5% verschil met de mediaan)
Vergeleken met dezelfde klasse
» 60% van alle geteste apparaten in deze klasse waren beter, 8% vergelijkbaar, 32% slechter
» De beste had een delta van 6%, het gemiddelde was 18%, de slechtste was 132%
Vergeleken met alle geteste toestellen
» 41% van alle geteste apparaten waren beter, 8% gelijk, 51% slechter
» De beste had een delta van 4%, het gemiddelde was 24%, de slechtste was 134%
Stroomverbruik
Bij stationair draaien bleef de Focus vrij zuinig met maximaal 18 watt. Onder volledige belasting maten we echter tot 290 watt, wat vervolgens rond de 245 watt bleef hangen. Tijdens het gamen werd zelfs 255 watt gemeten. Dit is enigszins problematisch, omdat het pakket slechts een 230 watt voeding bevat. Hoewel de batterij niet leegloopt onder belasting, zou een voeding van 280 watt nog steeds een betere keuze zijn geweest.
| Uit / Standby | |
| Inactief | |
| Belasting |
|
Key:
min: | |
| Schenker XMG Focus 17 M25 GeForce RTX 5070 Ti Laptop, i9-13900HX, Kingston Fury Renegade SFYRS500G | MSI Vector 17 HX AI A2XWIG GeForce RTX 5080 Laptop, Ultra 9 275HX, Western Digital PC SN5000S SDEPNSJ-2T00-1032 | Lenovo Legion 5 Pro 16IAX10H GeForce RTX 5070 Ti Laptop, Ultra 9 275HX, Western Digital PC SN8000S SDEPNRK-1T00 | MSI Vector 16 HX AI A2XWHG GeForce RTX 5070 Ti Laptop, Ultra 7 255HX, Micron 2400 MTFDKBA512QFM | Schenker XMG Pro 16 (E25) GeForce RTX 5070 Ti Laptop, Ultra 9 275HX, Samsung 9100 Pro 1 TB | |
|---|---|---|---|---|---|
| Power Consumption | -0% | -9% | -1% | 2% | |
| Idle Minimum * (Watt) | 12 | 10 17% | 14 -17% | 7.1 41% | 11.7 2% |
| Idle Average * (Watt) | 17.5 | 15.4 12% | 14.3 18% | 15.9 9% | 16.6 5% |
| Idle Maximum * (Watt) | 18.1 | 18.7 -3% | 20.1 -11% | 29.5 -63% | 17.1 6% |
| Load Average * (Watt) | 121.1 | 89.7 26% | 177 -46% | 124 -2% | 122.4 -1% |
| Cyberpunk 2077 ultra * (Watt) | 255 | 308 -21% | 255 -0% | 222 13% | 245 4% |
| Cyberpunk 2077 ultra external monitor * (Watt) | 244 | 300 -23% | 255 -5% | 217 11% | 241 1% |
| Load Maximum * (Watt) | 292.1 | 321 -10% | 294 -1% | 336 -15% | 291.5 -0% |
* ... kleiner is beter
Power consumption Cyberpunk / stress test
Power consumption with an external monitor
Levensduur batterij
De batterijlevensduur met de 73 Wh batterij kan alleen als gemiddeld worden omschreven. In onze Wi-Fi-test bij 150 cd/m² (35% van de maximale helderheid) hebben we iets minder dan 6 uur gemeten, en bij volledige helderheid hebben we 4,5 uur gemeten.
Notebookcheck algemene beoordeling
Schenker XMG Focus 17 M25
- 04-08-2025 v8
Andreas Osthoff
 Total Sustainability Score:
 Mogelijke alternatieven vergeleken
Transparantie
De selectie van te beoordelen apparaten wordt gemaakt door onze redactie. Het testexemplaar werd ten behoeve van deze beoordeling door de fabrikant of detailhandelaar in bruikleen aan de auteur verstrekt. De kredietverstrekker had geen invloed op deze recensie, noch ontving de fabrikant vóór publicatie een exemplaar van deze recensie. Er bestond geen verplichting om deze recensie te publiceren. Als onafhankelijk mediabedrijf is Notebookcheck niet onderworpen aan het gezag van fabrikanten, detailhandelaren of uitgevers.
[transparency_disclaimer]Dit is hoe Notebookcheck test
Elk jaar beoordeelt Notebookcheck onafhankelijk honderden laptops en smartphones met behulp van gestandaardiseerde procedures om ervoor te zorgen dat alle resultaten vergelijkbaar zijn. We hebben onze testmethoden al zo'n 20 jaar voortdurend ontwikkeld en daarbij de industriestandaard bepaald. In onze testlaboratoria wordt gebruik gemaakt van hoogwaardige meetapparatuur door ervaren technici en redacteuren. Deze tests omvatten een validatieproces in meerdere fasen. Ons complexe beoordelingssysteem is gebaseerd op honderden goed onderbouwde metingen en benchmarks, waardoor de objectiviteit behouden blijft. Meer informatie over onze testmethoden kunt u hier vinden.

