 Deutsch
 English
 Español
 Français
 Italiano
 Nederlands
 Polski
 Português
 Русский
 Türkçe
 Svenska
 Chinese
 Magyar
Kort testrapport HP ProBook 470 G5 (i5-8250U, 930MX, SSD, FHD) Laptop
| SD Card Reader | |
| average JPG Copy Test (av. of 3 runs) | |
| HP ProBook 470 G5 (Toshiba Exceria Pro SDXC 64 GB UHS-II) | |
| HP ProBook 470 G4 (Toshiba Exceria Pro SDXC 64 GB UHS-II) | |
| Acer Aspire E5-774G-78NA | |
| Lenovo V320-17IKB 81AH0002GE (Toshiba Exceria Pro SDXC 64 GB UHS-II) | |
| HP 17-bs103ng (Toshiba Exceria Pro SDXC 64 GB UHS-II) | |
| maximum AS SSD Seq Read Test (1GB) | |
| HP ProBook 470 G5 (Toshiba Exceria Pro SDXC 64 GB UHS-II) | |
| HP ProBook 470 G4 (Toshiba Exceria Pro SDXC 64 GB UHS-II) | |
| Acer Aspire E5-774G-78NA | |
| Lenovo V320-17IKB 81AH0002GE (Toshiba Exceria Pro SDXC 64 GB UHS-II) | |
| HP 17-bs103ng (Toshiba Exceria Pro SDXC 64 GB UHS-II) | |
| Networking | |
| iperf3 transmit AX12 | |
| HP ProBook 470 G5 | |
| Lenovo V320-17IKB 81AH0002GE | |
| HP 17-bs103ng | |
| iperf3 receive AX12 | |
| HP ProBook 470 G5 | |
| Lenovo V320-17IKB 81AH0002GE | |
| HP 17-bs103ng | |
| |||||||||||||||||||||||||
Helderheidsverdeling: 87 %
Helderheid in Batterij-modus: 400 cd/m²
Contrast: 635:1 (Zwart: 0.63 cd/m²)
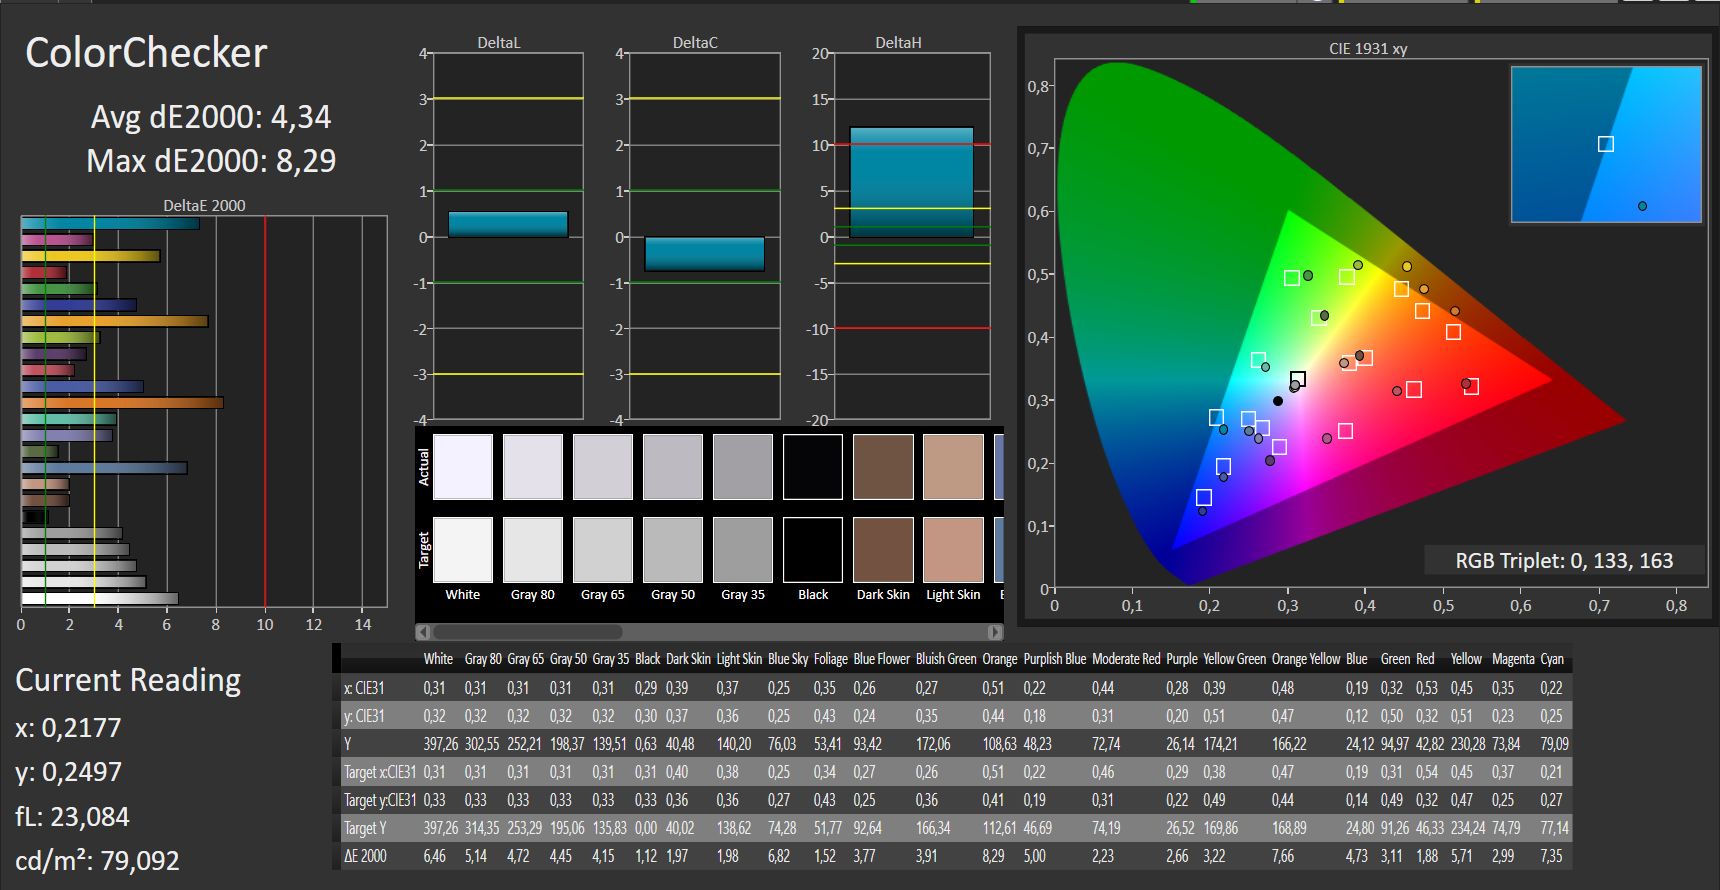
ΔE Color 4.34 | 0.5-29.43 Ø5
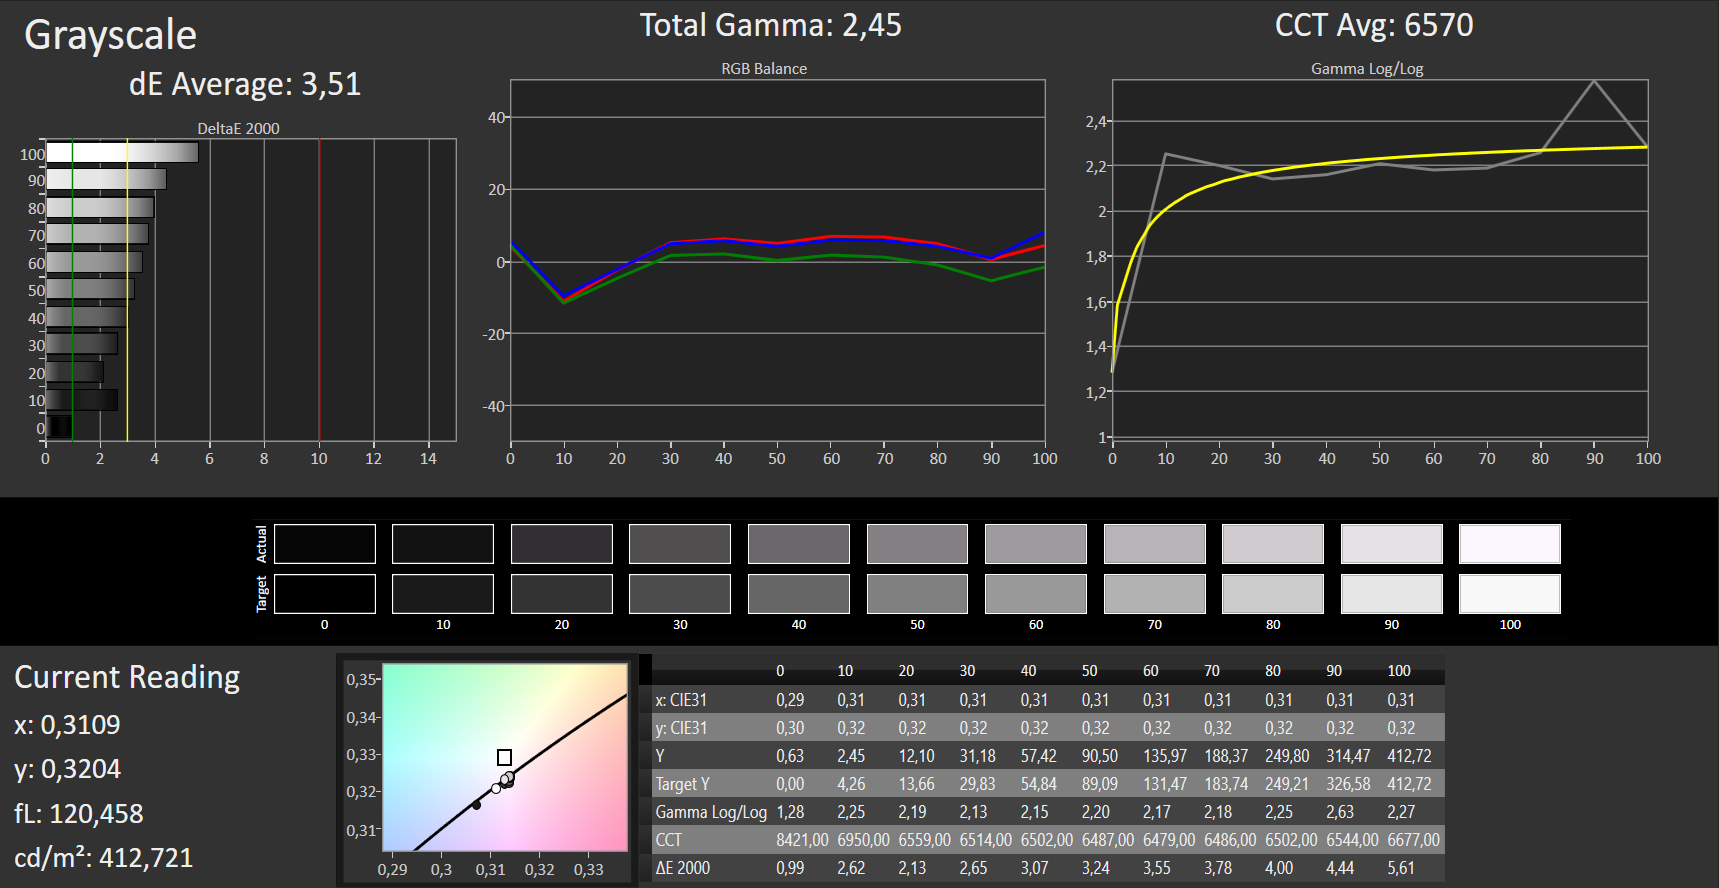
ΔE Greyscale 3.51 | 0.57-98 Ø5.3
84% sRGB (Argyll 1.6.3 3D)
55% AdobeRGB 1998 (Argyll 1.6.3 3D)
61.8% AdobeRGB 1998 (Argyll 2.2.0 3D)
84.4% sRGB (Argyll 2.2.0 3D)
66.1% Display P3 (Argyll 2.2.0 3D)
Gamma: 2.45
| HP ProBook 470 G5 IPS, 1920x1080, 17.30 | HP ProBook 470 G4 LED IPS, 1920x1080, 17.30 | Lenovo V320-17IKB 81AH0002GE IPS, 1920x1080, 17.30 | HP 17-bs103ng TN LED, 1600x900, 17.30 | Acer Aspire E5-774G-78NA TN LED, 1920x1080, 17.30 | |
|---|---|---|---|---|---|
| Display | 4% | 0% | -17% | 11% | |
| Display P3 Coverage | 66.1 | 64.1 -3% | 66.5 1% | 51.2 -23% | 72.3 9% |
| sRGB Coverage | 84.4 | 92 9% | 84.5 0% | 73.8 -13% | 94.8 12% |
| AdobeRGB 1998 Coverage | 61.8 | 65.7 6% | 61.8 0% | 52.8 -15% | 69.3 12% |
| Response Times | -8% | 9% | 16% | 1% | |
| Response Time Grey 50% / Grey 80% * | 36 ? | 44 ? -22% | 35 ? 3% | 45 ? -25% | 43 ? -19% |
| Response Time Black / White * | 28 ? | 26 ? 7% | 24 ? 14% | 12 ? 57% | 22 ? 21% |
| PWM Frequency | 119000 ? | 1000 ? | |||
| Screen | 22% | 3% | -61% | -24% | |
| Brightness middle | 400 | 361 -10% | 412 3% | 234 -41% | 320 -20% |
| Brightness | 374 | 322 -14% | 377 1% | 202 -46% | 302 -19% |
| Brightness Distribution | 87 | 84 -3% | 83 -5% | 74 -15% | 86 -1% |
| Black Level * | 0.63 | 0.24 62% | 0.39 38% | 0.48 24% | 0.4 37% |
| Contrast | 635 | 1504 137% | 1056 66% | 488 -23% | 800 26% |
| Colorchecker dE 2000 * | 4.34 | 3.4 22% | 5.04 -16% | 10.28 -137% | 7.78 -79% |
| Colorchecker dE 2000 max. * | 8.29 | 6.6 20% | 8.84 -7% | 18.5 -123% | 12.74 -54% |
| Greyscale dE 2000 * | 3.51 | 4 -14% | 5.28 -50% | 12.78 -264% | 8.87 -153% |
| Gamma | 2.45 90% | 2.17 101% | 2.44 90% | 2.5 88% | 2.27 97% |
| CCT | 6570 99% | 6879 94% | 6900 94% | 13604 48% | 8979 72% |
| Color Space (Percent of AdobeRGB 1998) | 55 | 59.6 8% | 55 0% | 59 7% | 62 13% |
| Color Space (Percent of sRGB) | 84 | 91.6 9% | 84 0% | 92 10% | 95 13% |
| Totaal Gemiddelde (Programma / Instellingen) | 6% /
14% | 4% /
3% | -21% /
-42% | -4% /
-13% |
* ... kleiner is beter
Screen Flickering / PWM (Pulse-Width Modulation)
| Screen flickering / PWM niet waargenomen | ||
Ter vergelijking: 53 % van alle geteste toestellen maakten geen gebruik van PWM om de schermhelderheid te verlagen. Als het wel werd gebruikt, werd een gemiddelde van 17908 (minimum: 5 - maximum: 3846000) Hz waargenomen. | ||
Responstijd Scherm
| ↔ Responstijd Zwart naar Wit | ||
|---|---|---|
| 28 ms ... stijging ↗ en daling ↘ gecombineerd | ↗ 16 ms stijging | 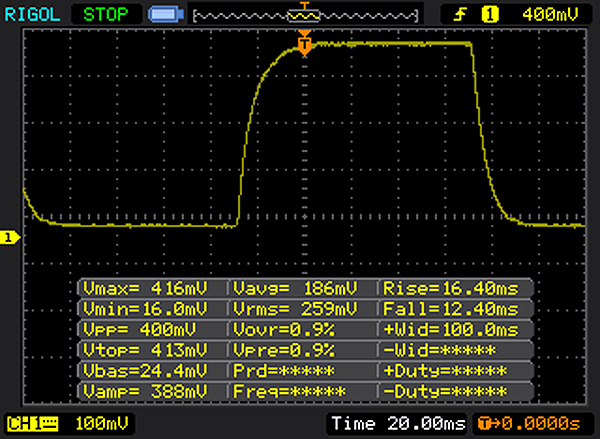 |
| ↘ 12 ms daling | ||
| Het scherm vertoonde relatief trage responstijden in onze tests en is misschien te traag voor games. Ter vergelijking: alle testtoestellen variëren van 0.1 (minimum) tot 240 (maximum) ms. » 67 % van alle toestellen zijn beter. Dit betekent dat de gemeten responstijd slechter is dan het gemiddelde (21.5 ms) van alle geteste toestellen. | ||
| ↔ Responstijd 50% Grijs naar 80% Grijs | ||
| 36 ms ... stijging ↗ en daling ↘ gecombineerd | ↗ 18 ms stijging | 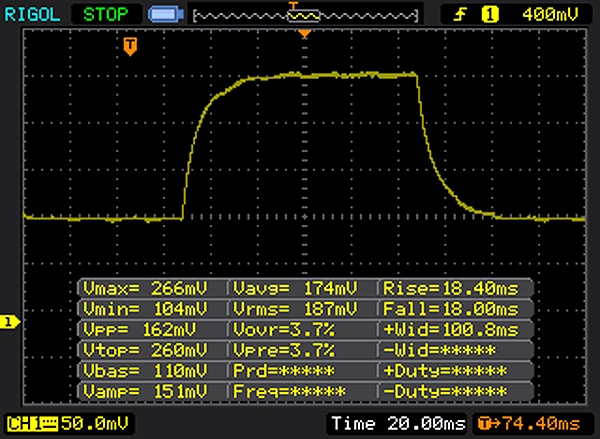 |
| ↘ 18 ms daling | ||
| Het scherm vertoonde trage responstijden in onze tests en is misschien te traag voor games. Ter vergelijking: alle testtoestellen variëren van 0.2 (minimum) tot 636 (maximum) ms. » 44 % van alle toestellen zijn beter. Dit betekent dat de gemeten responstijd vergelijkbaar is met het gemiddelde (33.7 ms) van alle geteste toestellen. | ||
| Cinebench R10 | |
| Rendering Multiple CPUs 32Bit | |
| MSI GS63VR 7RG-005 | |
| HP ProBook 470 G5 | |
| Acer Aspire 7 A715-71G-53TU | |
| Lenovo Legion Y520-15IKBN 80WK0042GE | |
| HP 17-bs103ng | |
| HP ProBook 470 G4 | |
| Lenovo V320-17IKB 81AH0002GE | |
| Acer Aspire E5-774G-78NA | |
| Rendering Single 32Bit | |
| MSI GS63VR 7RG-005 | |
| HP ProBook 470 G4 | |
| Acer Aspire 7 A715-71G-53TU | |
| HP ProBook 470 G5 | |
| HP 17-bs103ng | |
| Lenovo Legion Y520-15IKBN 80WK0042GE | |
| Lenovo V320-17IKB 81AH0002GE | |
| Acer Aspire E5-774G-78NA | |
| Geekbench 3 | |
| 32 Bit Multi-Core Score | |
| MSI GS63VR 7RG-005 | |
| HP 17-bs103ng | |
| HP ProBook 470 G5 | |
| Lenovo Legion Y520-15IKBN 80WK0042GE | |
| Acer Aspire E5-774G-78NA | |
| Lenovo V320-17IKB 81AH0002GE | |
| 32 Bit Single-Core Score | |
| MSI GS63VR 7RG-005 | |
| Acer Aspire E5-774G-78NA | |
| HP 17-bs103ng | |
| HP ProBook 470 G5 | |
| Lenovo V320-17IKB 81AH0002GE | |
| Lenovo Legion Y520-15IKBN 80WK0042GE | |
| Geekbench 4.0 | |
| 64 Bit Multi-Core Score | |
| MSI GS63VR 7RG-005 | |
| HP 17-bs103ng | |
| HP ProBook 470 G5 | |
| Lenovo Legion Y520-15IKBN 80WK0042GE | |
| Lenovo V320-17IKB 81AH0002GE | |
| 64 Bit Single-Core Score | |
| MSI GS63VR 7RG-005 | |
| Lenovo Legion Y520-15IKBN 80WK0042GE | |
| HP ProBook 470 G5 | |
| HP 17-bs103ng | |
| Lenovo V320-17IKB 81AH0002GE | |
| Geekbench 4.4 | |
| 64 Bit Multi-Core Score | |
| MSI GS63VR 7RG-005 | |
| HP 17-bs103ng | |
| HP ProBook 470 G5 | |
| Lenovo Legion Y520-15IKBN 80WK0042GE | |
| Lenovo V320-17IKB 81AH0002GE | |
| 64 Bit Single-Core Score | |
| MSI GS63VR 7RG-005 | |
| HP ProBook 470 G5 | |
| HP 17-bs103ng | |
| Lenovo Legion Y520-15IKBN 80WK0042GE | |
| Lenovo V320-17IKB 81AH0002GE | |
| JetStream 1.1 - Total Score | |
| MSI GS63VR 7RG-005 (Edge 41) | |
| HP 17-bs103ng (Edge 41) | |
| Acer Aspire 7 A715-71G-53TU (EDGE: 41.16299.15.0) | |
| Lenovo Legion Y520-15IKBN 80WK0042GE (Edge 40) | |
| HP ProBook 470 G5 (Edge 41) | |
| Acer Aspire E5-774G-78NA (Edge 38.14393.0.0) | |
| Lenovo V320-17IKB 81AH0002GE (Edge 40) | |
| Octane V2 - Total Score | |
| MSI GS63VR 7RG-005 (Edge 41) | |
| HP ProBook 470 G4 | |
| Acer Aspire 7 A715-71G-53TU (EDGE: 41.16299.15.0) | |
| HP ProBook 470 G5 (Edge 41) | |
| Lenovo Legion Y520-15IKBN 80WK0042GE (Edge 40) | |
| Acer Aspire E5-774G-78NA (Edge 38.14393.0.0) | |
| Lenovo V320-17IKB 81AH0002GE (Edge 40) | |
| Mozilla Kraken 1.1 - Total | |
| Lenovo V320-17IKB 81AH0002GE (Edge 40) | |
| Acer Aspire E5-774G-78NA (Edge 38.14393.0.0) | |
| Lenovo Legion Y520-15IKBN 80WK0042GE (Edge 40) | |
| HP ProBook 470 G5 (Edge 41) | |
| Acer Aspire 7 A715-71G-53TU (EDGE: 41.16299.15.0) | |
| MSI GS63VR 7RG-005 (Edge 41) | |
* ... kleiner is beter
| PCMark 7 Score | 5862 punten | |
| PCMark 8 Home Score Accelerated v2 | 3844 punten | |
| PCMark 8 Creative Score Accelerated v2 | 4888 punten | |
| PCMark 8 Work Score Accelerated v2 | 4922 punten | |
| PCMark 10 Score | 3372 punten | |
Help | ||
| PCMark 8 | |
| Home Score Accelerated v2 | |
| HP ProBook 470 G5 | |
| HP 17-bs103ng | |
| Lenovo V320-17IKB 81AH0002GE | |
| Acer Aspire E5-774G-78NA | |
| HP ProBook 470 G4 | |
| Work Score Accelerated v2 | |
| HP ProBook 470 G5 | |
| HP ProBook 470 G4 | |
| HP 17-bs103ng | |
| Lenovo V320-17IKB 81AH0002GE | |
| Acer Aspire E5-774G-78NA | |

| HP ProBook 470 G5 Intel SSD 600p SSDPEKKW256G7 | HP ProBook 470 G4 SanDisk Z400s SD8SNAT-256G | Lenovo V320-17IKB 81AH0002GE SK Hynix HFS256G3BTND | HP 17-bs103ng Seagate Mobile HDD 1TB ST1000LM035 | Acer Aspire E5-774G-78NA Lite-On CV1-8B256 | SCHENKER XMG Core 15 Samsung SSD 960 Evo 250GB m.2 NVMe | |
|---|---|---|---|---|---|---|
| CrystalDiskMark 3.0 | -46% | -40% | -95% | -33% | 47% | |
| Read Seq | 1113 | 472 -58% | 473.7 -57% | 73 -93% | 520 -53% | 1338 20% |
| Write Seq | 592 | 323 -45% | 260.8 -56% | 80.1 -86% | 332.8 -44% | 1188 101% |
| Read 512 | 831 | 337 -59% | 29.93 -96% | 382.8 -54% | 780 -6% | |
| Write 512 | 596 | 263.3 -56% | 72.3 -88% | 357.7 -40% | 1006 69% | |
| Read 4k | 32.12 | 16.9 -47% | 29.41 -8% | 0.399 -99% | 32.31 1% | 58.3 82% |
| Write 4k | 111.3 | 81.4 -27% | 73.3 -34% | 0.502 -100% | 85.1 -24% | 134 20% |
| Read 4k QD32 | 289.3 | 148 -49% | 298.3 3% | 0.707 -100% | 277.7 -4% | 577 99% |
| Write 4k QD32 | 520 | 254 -51% | 242.5 -53% | 0.704 -100% | 269.8 -48% | 481.9 -7% |
| 3DMark 06 Standard Score | 13529 punten | |
| 3DMark 11 Performance | 2568 punten | |
| 3DMark Ice Storm Standard Score | 71571 punten | |
| 3DMark Cloud Gate Standard Score | 8611 punten | |
| 3DMark Fire Strike Score | 1491 punten | |
| 3DMark Fire Strike Extreme Score | 718 punten | |
| 3DMark Time Spy Score | 564 punten | |
Help | ||
| 3DMark 11 - 1280x720 Performance GPU | |
| Acer Aspire E5-774G-78NA | |
| HP ProBook 470 G5 | |
| HP 17-bs103ng | |
| HP ProBook 470 G4 | |
| Lenovo Ideapad 110-17IKB 80VK0001GE | |
| Lenovo V320-17IKB 81AH0002GE | |
| HP 17-y044ng | |
| 3DMark | |
| 1280x720 Cloud Gate Standard Graphics | |
| Acer Aspire E5-774G-78NA | |
| HP ProBook 470 G4 | |
| HP ProBook 470 G5 | |
| Lenovo V320-17IKB 81AH0002GE | |
| HP 17-bs103ng | |
| 1920x1080 Fire Strike Graphics | |
| Acer Aspire E5-774G-78NA | |
| HP ProBook 470 G5 | |
| HP ProBook 470 G4 | |
| HP 17-bs103ng | |
| Lenovo V320-17IKB 81AH0002GE | |
| lage | gem. | hoge | ultra | |
| StarCraft 2 (2010) | 300.2 | 83.3 | 45.9 | 24.7 |
| Diablo III (2012) | 139.2 | 94.6 | 80 | 47.1 |
| Tomb Raider (2013) | 136 | 65.4 | 36.4 | 17.7 |
| BioShock Infinite (2013) | 93.7 | 53.1 | 43.9 | 14.6 |
| Sims 4 (2014) | 186 | 81.2 | 40.3 | 30.4 |
| Dragon Age: Inquisition (2014) | 55.2 | 35.8 | 12.1 | 8.2 |
| Battlefield Hardline (2015) | 83.1 | 57.4 | 19.4 | 11.8 |
| The Witcher 3 (2015) | 30.5 | 18.5 | 10 | 6 |
| Dota 2 Reborn (2015) | 91 | 74 | 35.5 | 33.2 |
| World of Warships (2015) | 122 | 85.5 | 38.7 | 24.4 |
| Overwatch (2016) | 74.2 | 52.2 | 23.3 | 14.8 |
| Mirror's Edge Catalyst (2016) | 42.1 | 25.6 | 11.3 | 8.7 |
| Farming Simulator 17 (2016) | 133.8 | 85.1 | 34.6 | 23.8 |
| For Honor (2017) | 43.4 | 14.2 | 13.6 | 10.4 |
| Ghost Recon Wildlands (2017) | 26.4 | 10.8 | 9.7 | 3.1 |
| Prey (2017) | 56 | 21.2 | 17.6 | 14.9 |
| Rocket League (2017) | 89.6 | 30.9 | 21.3 | |
| Team Fortress 2 (2017) | 105 | 100 | 75 | 41 |
| Playerunknown's Battlegrounds (PUBG) (2017) | 41.4 | 16.7 | 14.7 | 9.1 |
| F1 2017 (2017) | 45 | 21 | 16 | 13 |
| FIFA 18 (2017) | 124 | 65.2 | 52 | 49.9 |
| Middle-earth: Shadow of War (2017) | 30 | 12 | 9 | 7 |
| ELEX (2017) | 27.1 | 12.8 | 10.2 | 7.4 |
| Destiny 2 (2017) | 30 | 13.1 | 10.8 | 7.9 |
| Assassin´s Creed Origins (2017) | 23 | 10 | 9 | 7 |
| Call of Duty WWII (2017) | 60 | 36.3 | 16.9 | 11.7 |
| Need for Speed Payback (2017) | 30.9 | 15.3 | 12.5 | 12 |
| Star Wars Battlefront 2 (2017) | 43 | 16.2 | 13.6 | 10 |
| BioShock Infinite - 1366x768 High Preset | |
| Acer Aspire 5 A517-51G-80L | |
| Acer Aspire E5-774G-78NA | |
| HP ProBook 470 G5 | |
| HP 17-bs103ng | |
| Lenovo V320-17IKB 81AH0002GE | |
| HP 17-y044ng | |
| Lenovo Ideapad 110-17IKB 80VK0001GE | |
| Tomb Raider - 1366x768 Normal Preset AA:FX AF:4x | |
| Acer Aspire E5-774G-78NA | |
| HP ProBook 470 G5 | |
| HP 17-bs103ng | |
| Lenovo V320-17IKB 81AH0002GE | |
| Lenovo Ideapad 110-17IKB 80VK0001GE | |
| The Witcher 3 - 1024x768 Low Graphics & Postprocessing | |
| Acer Aspire E5-774G-78NA | |
| HP ProBook 470 G5 | |
| HP ProBook 470 G4 | |
Geluidsniveau
| Onbelast |
| 30.5 / 30.5 / 30.5 dB (A) |
| Belasting |
| 33 / 38 dB (A) |
 | ||
30 dB stil 40 dB(A) hoorbaar 50 dB(A) luid |
||
min: | ||
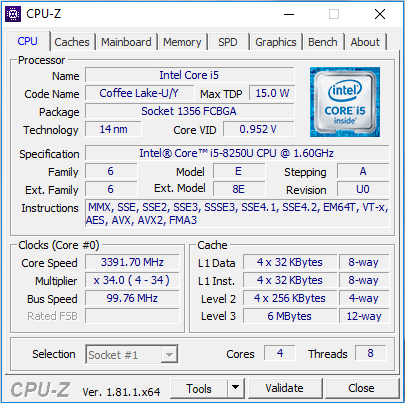
| HP ProBook 470 G5 i5-8250U, GeForce 930MX | HP ProBook 470 G4 i7-7500U, GeForce 930MX | Lenovo V320-17IKB 81AH0002GE i5-7200U, HD Graphics 620 | HP 17-bs103ng i5-8250U, Radeon 530 | Acer Aspire E5-774G-78NA 6500U, GeForce 940MX | |
|---|---|---|---|---|---|
| Noise | -6% | 0% | -2% | -7% | |
| uit / omgeving * | 30.5 | 29.7 3% | 30 2% | 30.4 -0% | 31.2 -2% |
| Idle Minimum * | 30.5 | 29.7 3% | 30.5 -0% | 32.6 -7% | 33.2 -9% |
| Idle Average * | 30.5 | 31.7 -4% | 30.5 -0% | 32.6 -7% | 33.2 -9% |
| Idle Maximum * | 30.5 | 31.7 -4% | 30.5 -0% | 32.6 -7% | 33.7 -10% |
| Load Average * | 33 | 37.8 -15% | 35 -6% | 32.8 1% | 36 -9% |
| Load Maximum * | 38 | 45.9 -21% | 35.8 6% | 34.2 10% | 40 -5% |
* ... kleiner is beter
(+) De maximumtemperatuur aan de bovenzijde bedraagt 38.4 °C / 101 F, vergeleken met het gemiddelde van 34.2 °C / 94 F, variërend van 21.2 tot 62.5 °C voor de klasse Office.
(±) De bodem warmt op tot een maximum van 40.1 °C / 104 F, vergeleken met een gemiddelde van 36.7 °C / 98 F
(+) Bij onbelast gebruik bedraagt de gemiddelde temperatuur voor de bovenzijde 24.4 °C / 76 F, vergeleken met het apparaatgemiddelde van 29.5 °C / 85 F.
(+) De palmsteunen en het touchpad zijn met een maximum van ###max## °C / 79.3 F koeler dan de huidtemperatuur en voelen daarom koel aan.
(±) De gemiddelde temperatuur van de handpalmsteun van soortgelijke toestellen bedroeg 27.7 °C / 81.9 F (+1.4 °C / 2.6 F).
| HP ProBook 470 G5 i5-8250U, GeForce 930MX | HP ProBook 470 G4 i7-7500U, GeForce 930MX | Lenovo V320-17IKB 81AH0002GE i5-7200U, HD Graphics 620 | HP 17-bs103ng i5-8250U, Radeon 530 | Acer Aspire E5-774G-78NA 6500U, GeForce 940MX | |
|---|---|---|---|---|---|
| Heat | -16% | -6% | 7% | -8% | |
| Maximum Upper Side * | 38.4 | 40 -4% | 37.3 3% | 30 22% | 37.1 3% |
| Maximum Bottom * | 40.1 | 46 -15% | 37 8% | 28.3 29% | 48 -20% |
| Idle Upper Side * | 25.4 | 29.9 -18% | 28.7 -13% | 27.2 -7% | 26.1 -3% |
| Idle Bottom * | 24.9 | 31.2 -25% | 30.1 -21% | 29 -16% | 27.6 -11% |
* ... kleiner is beter
HP ProBook 470 G5 audioanalyse
(-) | niet erg luide luidsprekers (71.7 dB)
Bas 100 - 315 Hz
(-) | bijna geen lage tonen - gemiddeld 25.6% lager dan de mediaan
(±) | lineariteit van de lage tonen is gemiddeld (8.8% delta ten opzichte van de vorige frequentie)
Mids 400 - 2000 Hz
(+) | evenwichtige middens - slechts 3.6% verwijderd van de mediaan
(±) | lineariteit van de middentonen is gemiddeld (7.5% delta ten opzichte van de vorige frequentie)
Hoog 2 - 16 kHz
(+) | evenwichtige hoogtepunten - slechts 4% verwijderd van de mediaan
(+) | de hoge tonen zijn lineair (4.1% delta naar de vorige frequentie)
Algemeen 100 - 16.000 Hz
(±) | lineariteit van het totale geluid is gemiddeld (22.2% verschil met de mediaan)
Vergeleken met dezelfde klasse
» 53% van alle geteste apparaten in deze klasse waren beter, 10% vergelijkbaar, 37% slechter
» De beste had een delta van 7%, het gemiddelde was 22%, de slechtste was 53%
Vergeleken met alle geteste toestellen
» 59% van alle geteste apparaten waren beter, 7% gelijk, 34% slechter
» De beste had een delta van 4%, het gemiddelde was 25%, de slechtste was 134%
Apple MacBook 12 (Early 2016) 1.1 GHz audioanalyse
(+) | luidsprekers kunnen relatief luid spelen (83.6 dB)
Bas 100 - 315 Hz
(±) | verminderde zeebaars - gemiddeld 11.3% lager dan de mediaan
(±) | lineariteit van de lage tonen is gemiddeld (14.2% delta ten opzichte van de vorige frequentie)
Mids 400 - 2000 Hz
(+) | evenwichtige middens - slechts 2.4% verwijderd van de mediaan
(+) | de middentonen zijn lineair (5.5% delta ten opzichte van de vorige frequentie)
Hoog 2 - 16 kHz
(+) | evenwichtige hoogtepunten - slechts 2% verwijderd van de mediaan
(+) | de hoge tonen zijn lineair (4.5% delta naar de vorige frequentie)
Algemeen 100 - 16.000 Hz
(+) | het totale geluid is lineair (10.2% verschil met de mediaan)
Vergeleken met dezelfde klasse
» 5% van alle geteste apparaten in deze klasse waren beter, 2% vergelijkbaar, 93% slechter
» De beste had een delta van 5%, het gemiddelde was 19%, de slechtste was 53%
Vergeleken met alle geteste toestellen
» 3% van alle geteste apparaten waren beter, 1% gelijk, 96% slechter
» De beste had een delta van 4%, het gemiddelde was 25%, de slechtste was 134%
| Uit / Standby | |
| Inactief | |
| Belasting |
|
| HP ProBook 470 G5 i5-8250U, GeForce 930MX | HP ProBook 470 G4 i7-7500U, GeForce 930MX | Lenovo V320-17IKB 81AH0002GE i5-7200U, HD Graphics 620 | HP 17-bs103ng i5-8250U, Radeon 530 | Acer Aspire E5-774G-78NA 6500U, GeForce 940MX | |
|---|---|---|---|---|---|
| Power Consumption | -3% | 12% | 32% | -38% | |
| Idle Minimum * | 3.4 | 4.3 -26% | 3.8 -12% | 3.5 -3% | 8.2 -141% |
| Idle Average * | 9.6 | 8.8 8% | 9.6 -0% | 6.4 33% | 12.6 -31% |
| Idle Maximum * | 11.8 | 9.4 20% | 10.4 12% | 6.9 42% | 13 -10% |
| Load Average * | 43 | 51.2 -19% | 35.4 18% | 28.1 35% | 51 -19% |
| Load Maximum * | 61 | 60.5 1% | 34 44% | 28.2 54% | 54.6 10% |
* ... kleiner is beter
| HP ProBook 470 G5 i5-8250U, GeForce 930MX, 48 Wh | HP ProBook 470 G4 i7-7500U, GeForce 930MX, 48 Wh | Lenovo V320-17IKB 81AH0002GE i5-7200U, HD Graphics 620, 35 Wh | HP 17-bs103ng i5-8250U, Radeon 530, 41.6 Wh | Acer Aspire E5-774G-78NA 6500U, GeForce 940MX, 41 Wh | |
|---|---|---|---|---|---|
| Batterijduur | -2% | -38% | -29% | -41% | |
| Reader / Idle | 1123 | 871 -22% | 759 -32% | 702 -37% | |
| H.264 | 457 | 526 15% | 285 -38% | 299 -35% | |
| WiFi v1.3 | 485 | 438 -10% | 302 -38% | 346 -29% | 322 -34% |
| Load | 140 | 152 9% | 78 -44% | 60 -57% |
Pro
Contra
Voor het volledige, Engelse testrapport, klik hier.
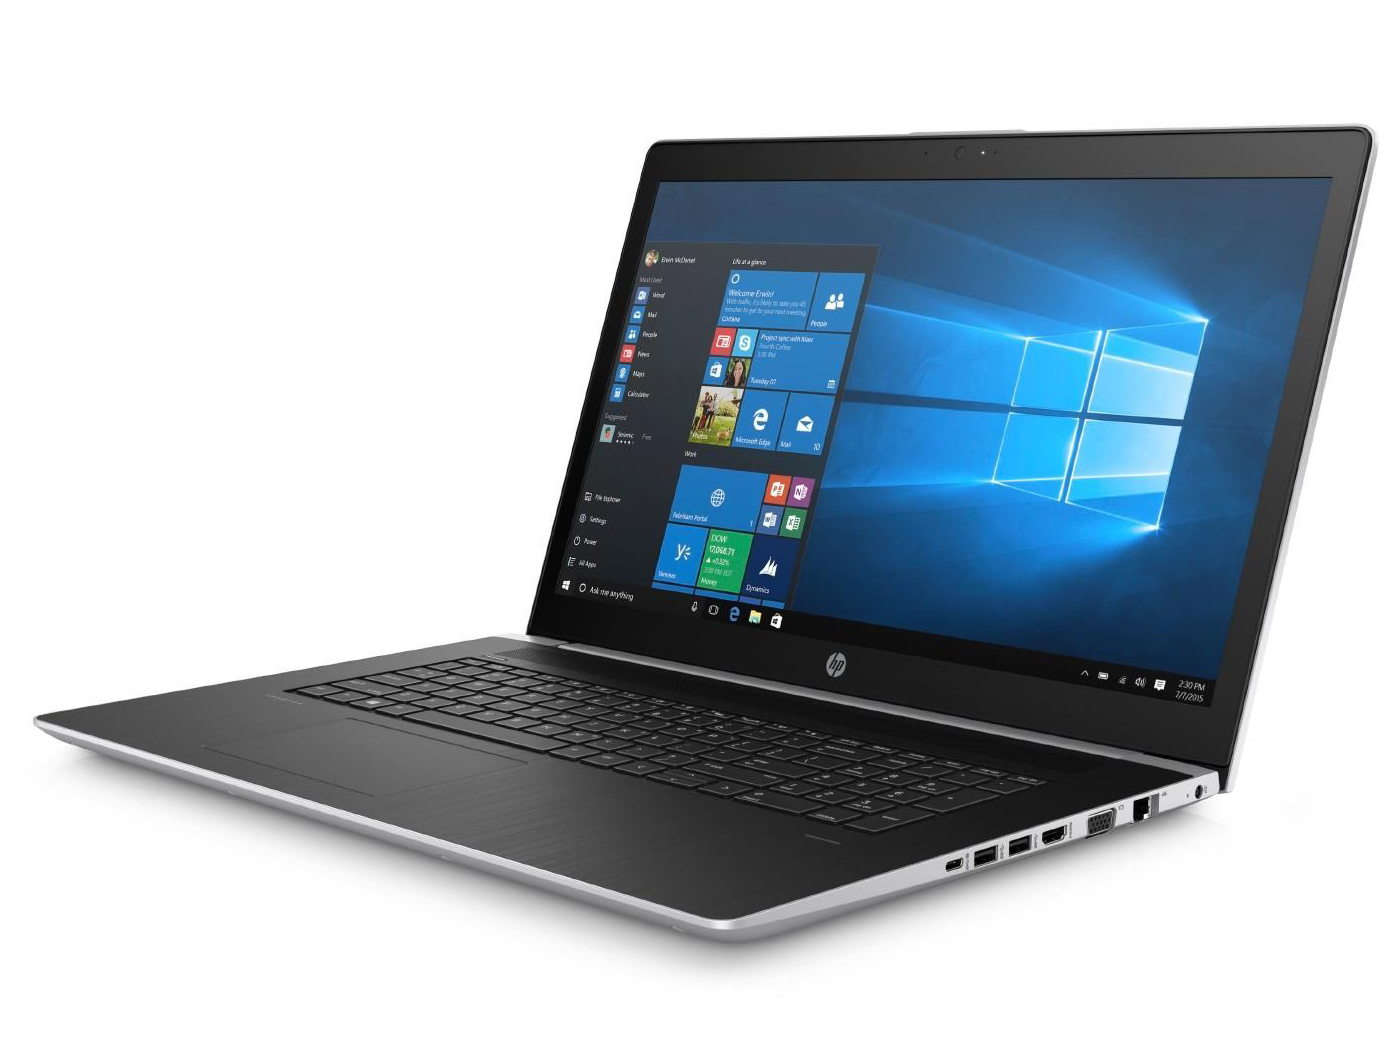
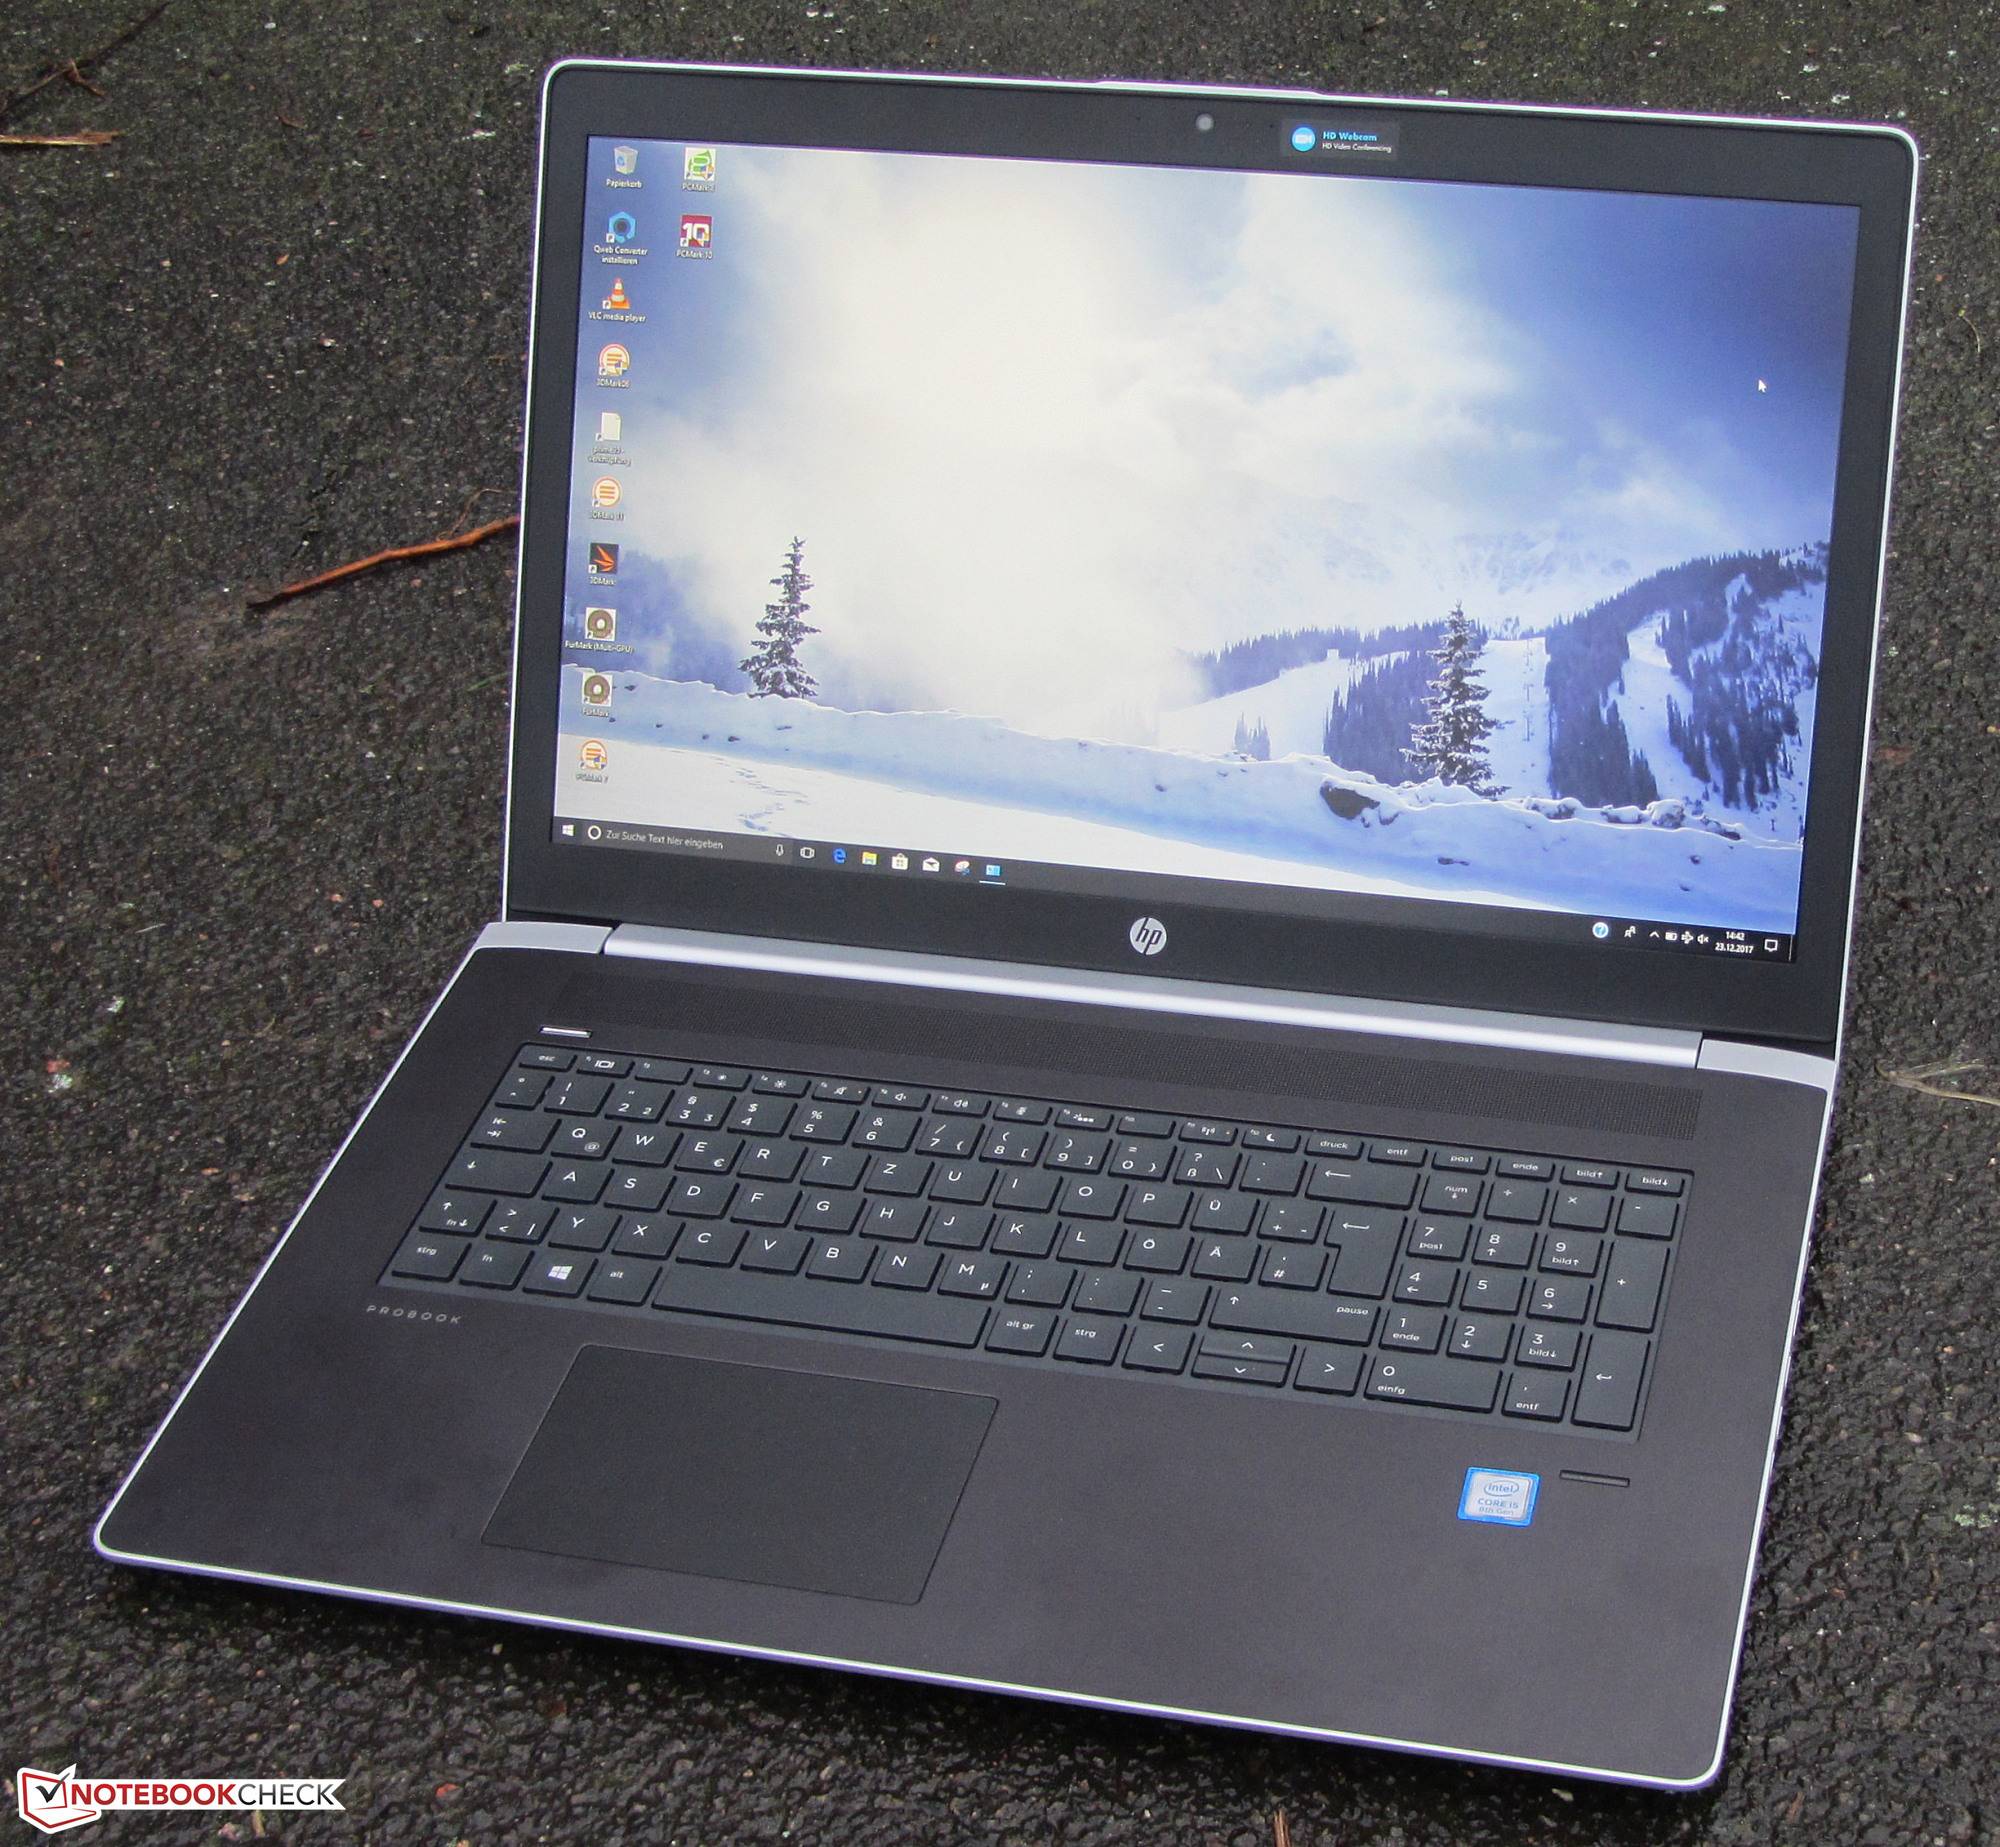
De Probook 470 G5 is alweer de 6e generatie van HP’s 17,3 inch zakelijke notebook (het eerste model stond bekend als de Probook 470 G0). Zoals verwacht zullen sommige modificaties die HP heeft doorgevoerd – zoals het weglaten van een optische drive en aparte functietoetsen – niet in goede aarde vallen bij bepaalde gebruikers.
De Probook 470 G5 is een veelzijdige 17,3 inch zakelijke notebook met ruimte voor verbetering.
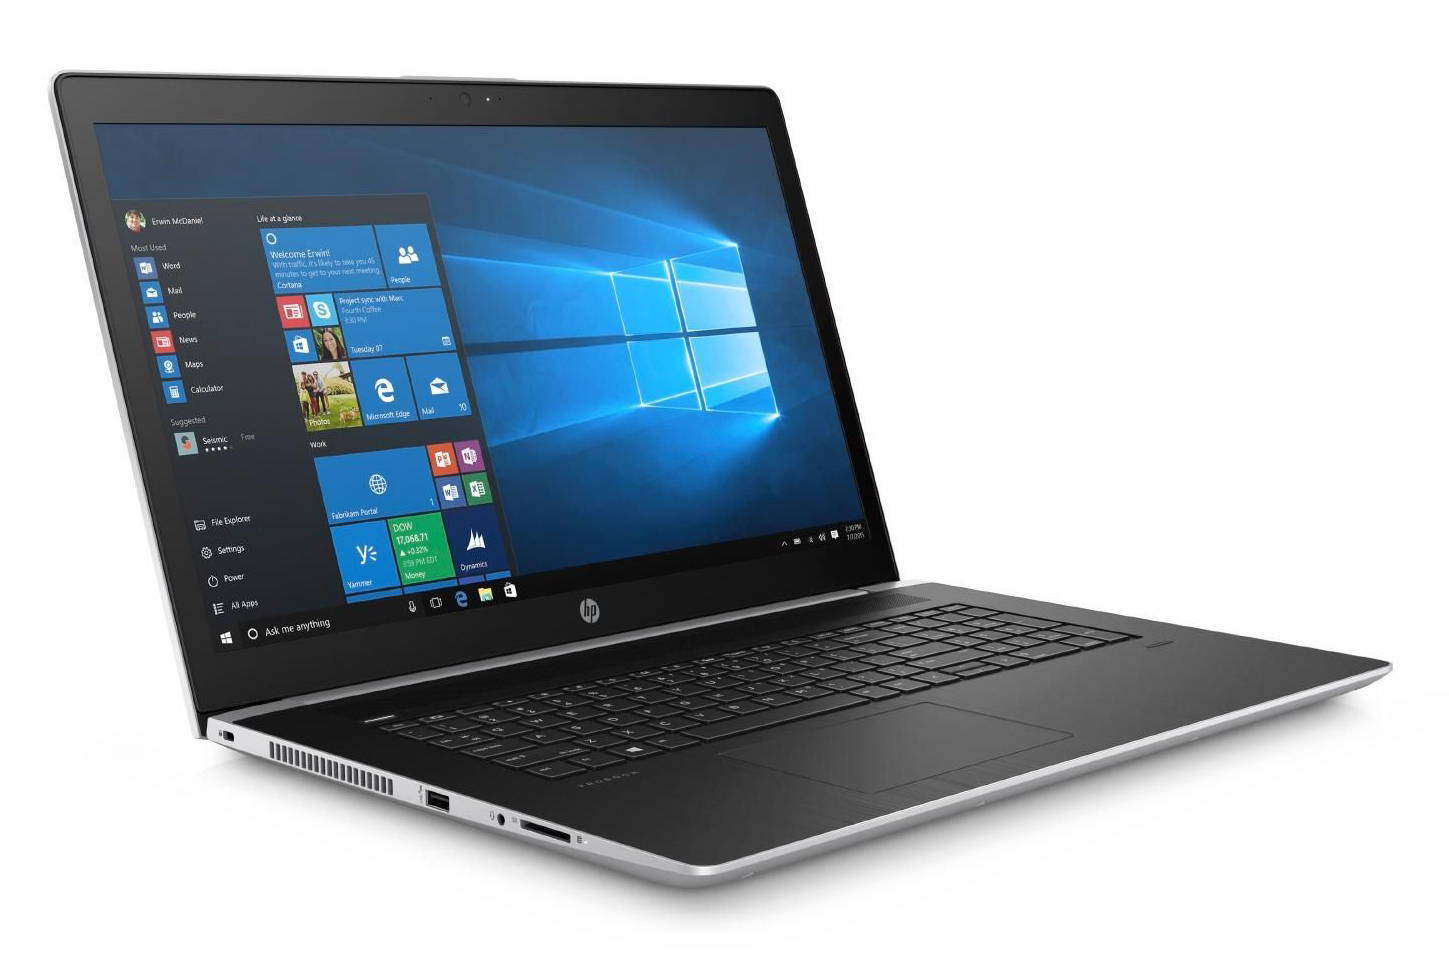
De notebook is ontworpen voor zowel zakelijk als persoonlijk gebruik. Dankzij de ULV quad-core processor is er altijd voldoende rekenkracht beschikbaar en de met de GeForce 930MX GPU is zelfs bescheiden gamen een mogelijkheid. We hadden echter graag een sterkere grafische kaart gezien. De Probook blijft ongeacht de belasting tenminste wel koel.
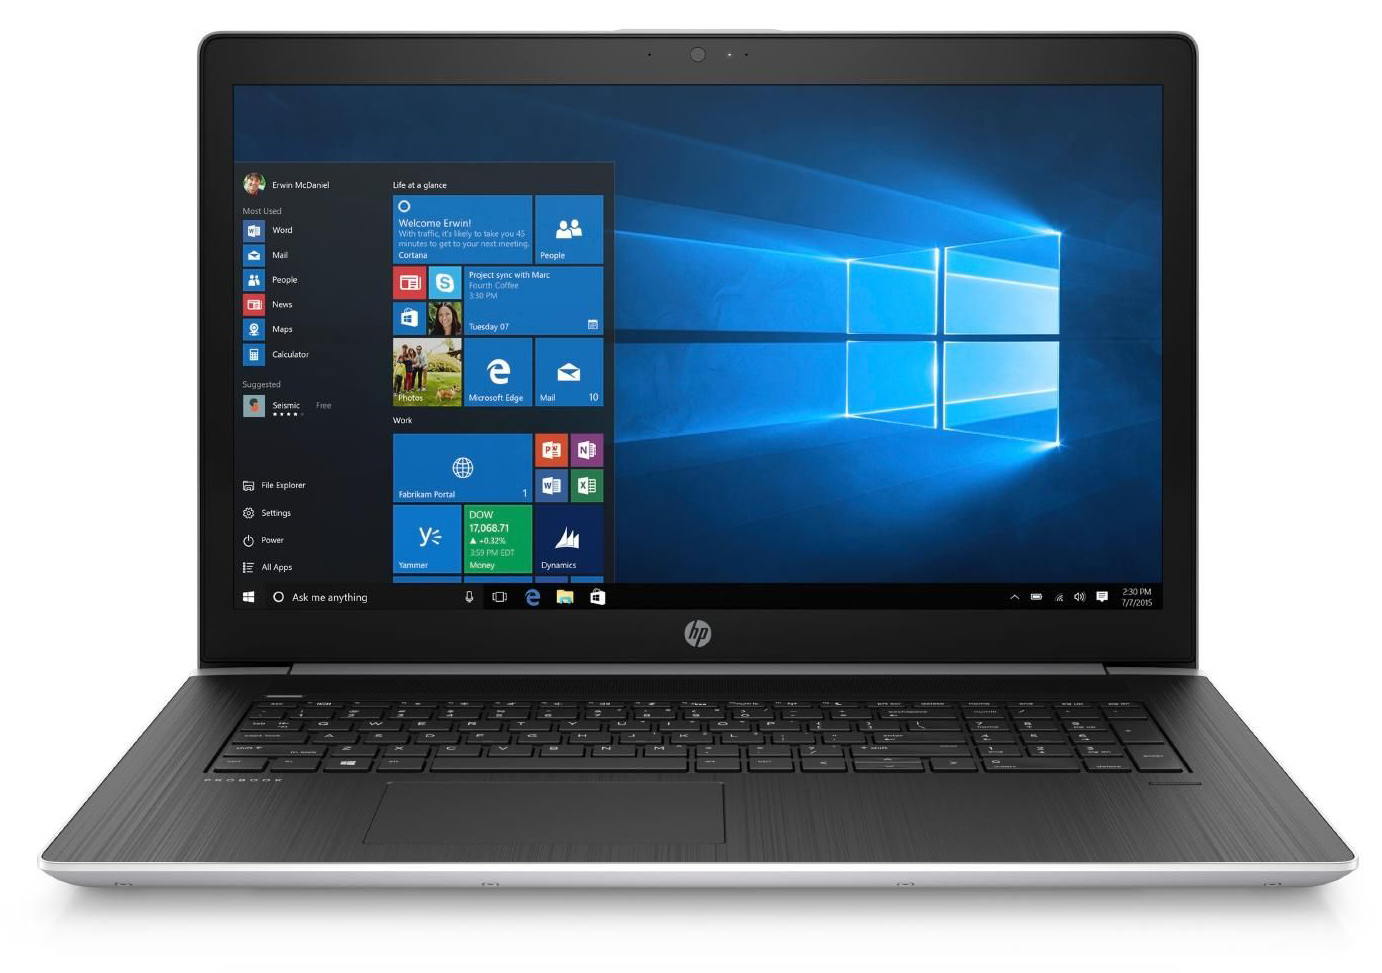
Systeemprestaties zijn in orde dankzij de snelle NVMe SSD en het verwisselen van het opslagstation is een fluitje van een cent dankzij het toegewezen onderhoudspaneel. Het heldere IPS FHD beeldscherm heeft brede kijkhoeken, maar het contrast is aan de lage kant.
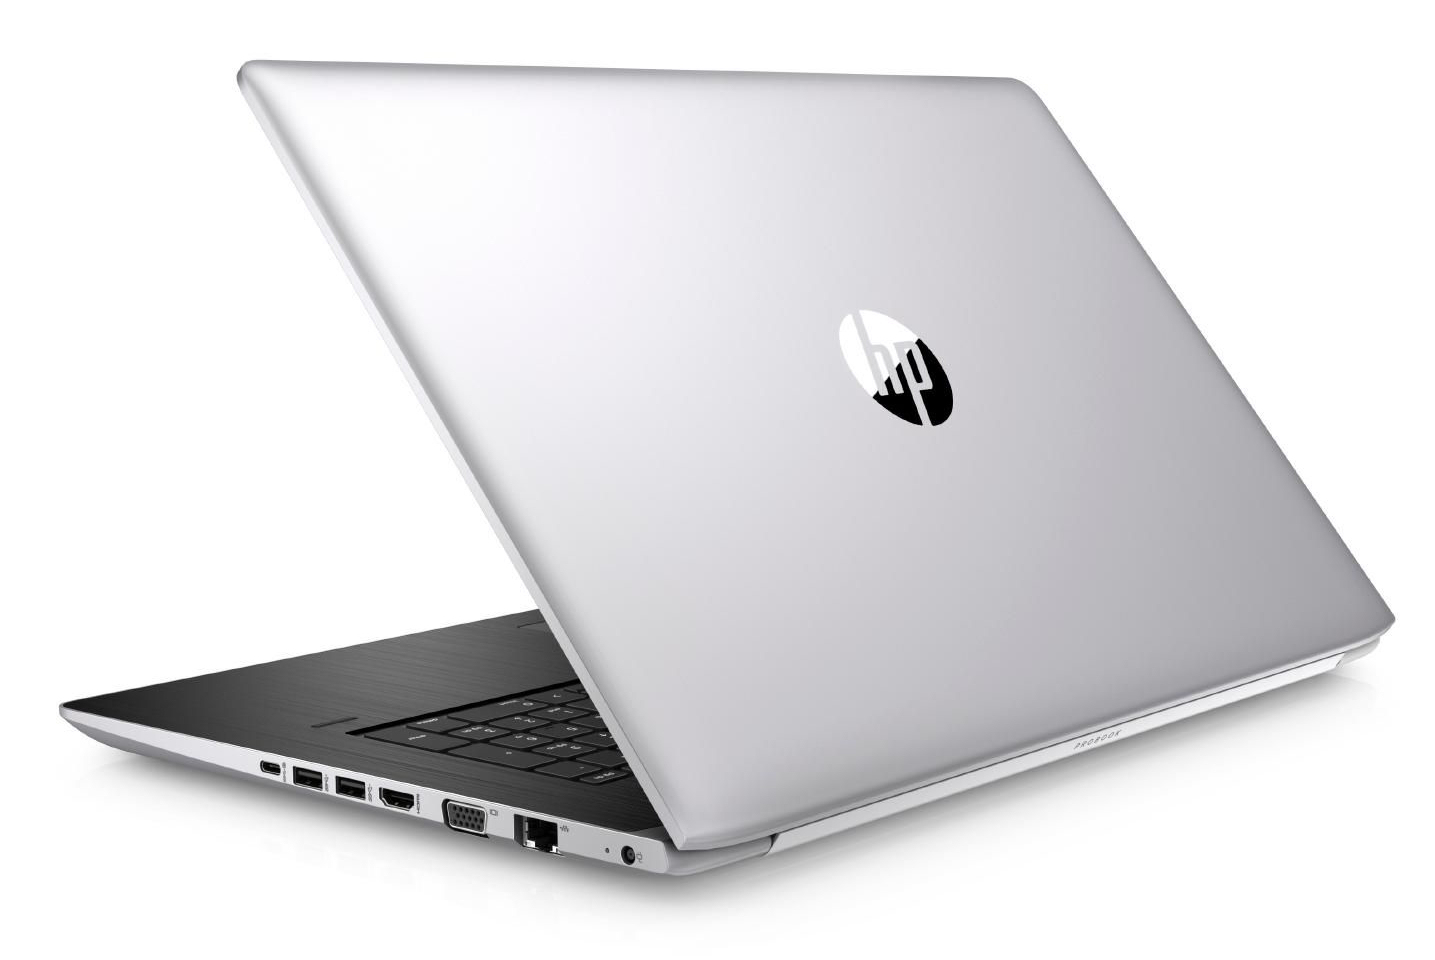
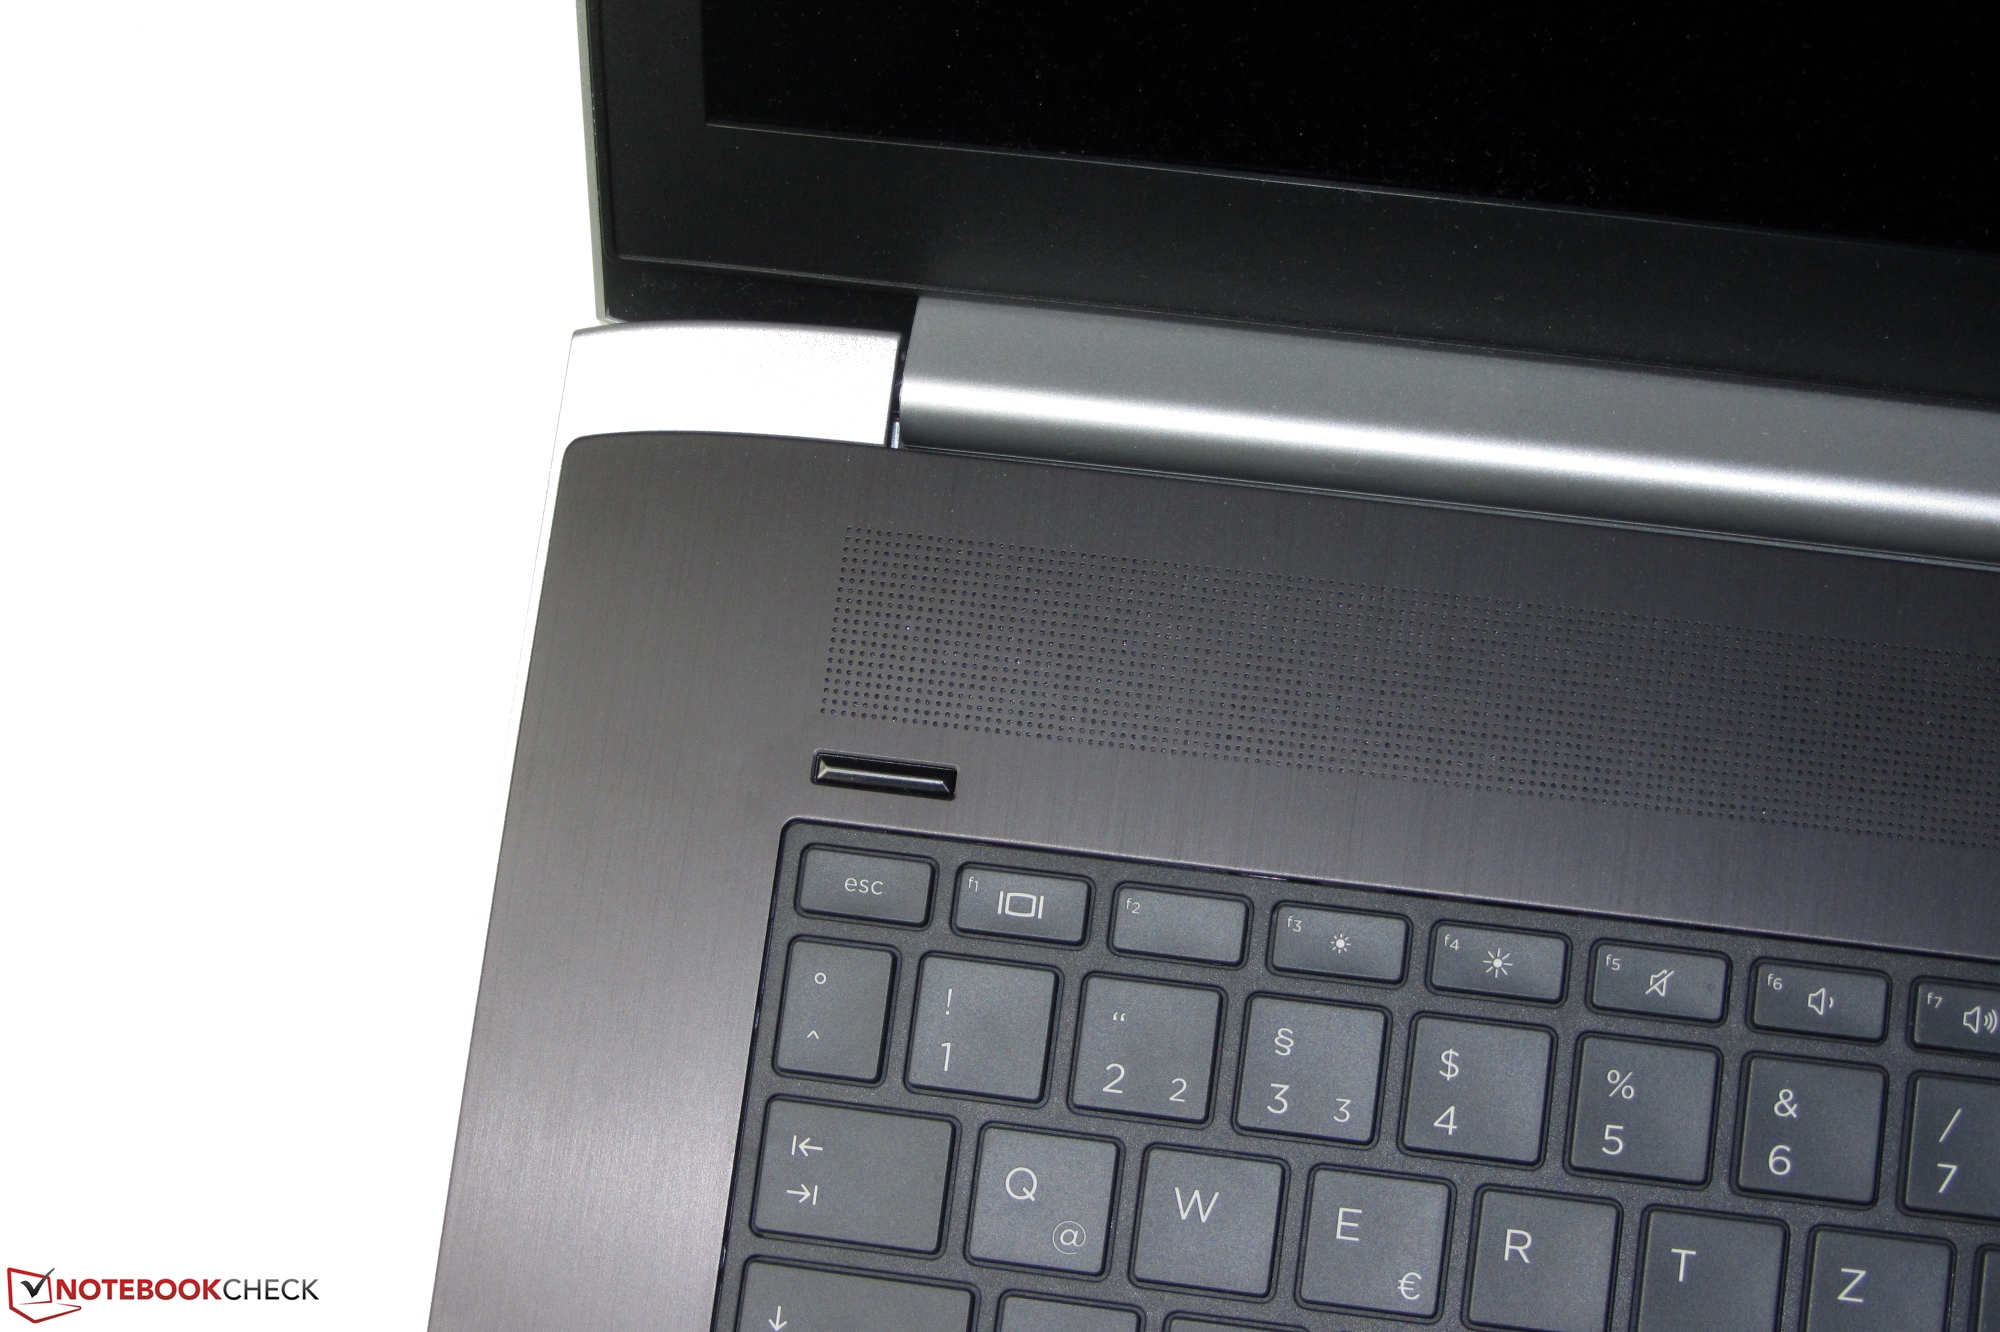
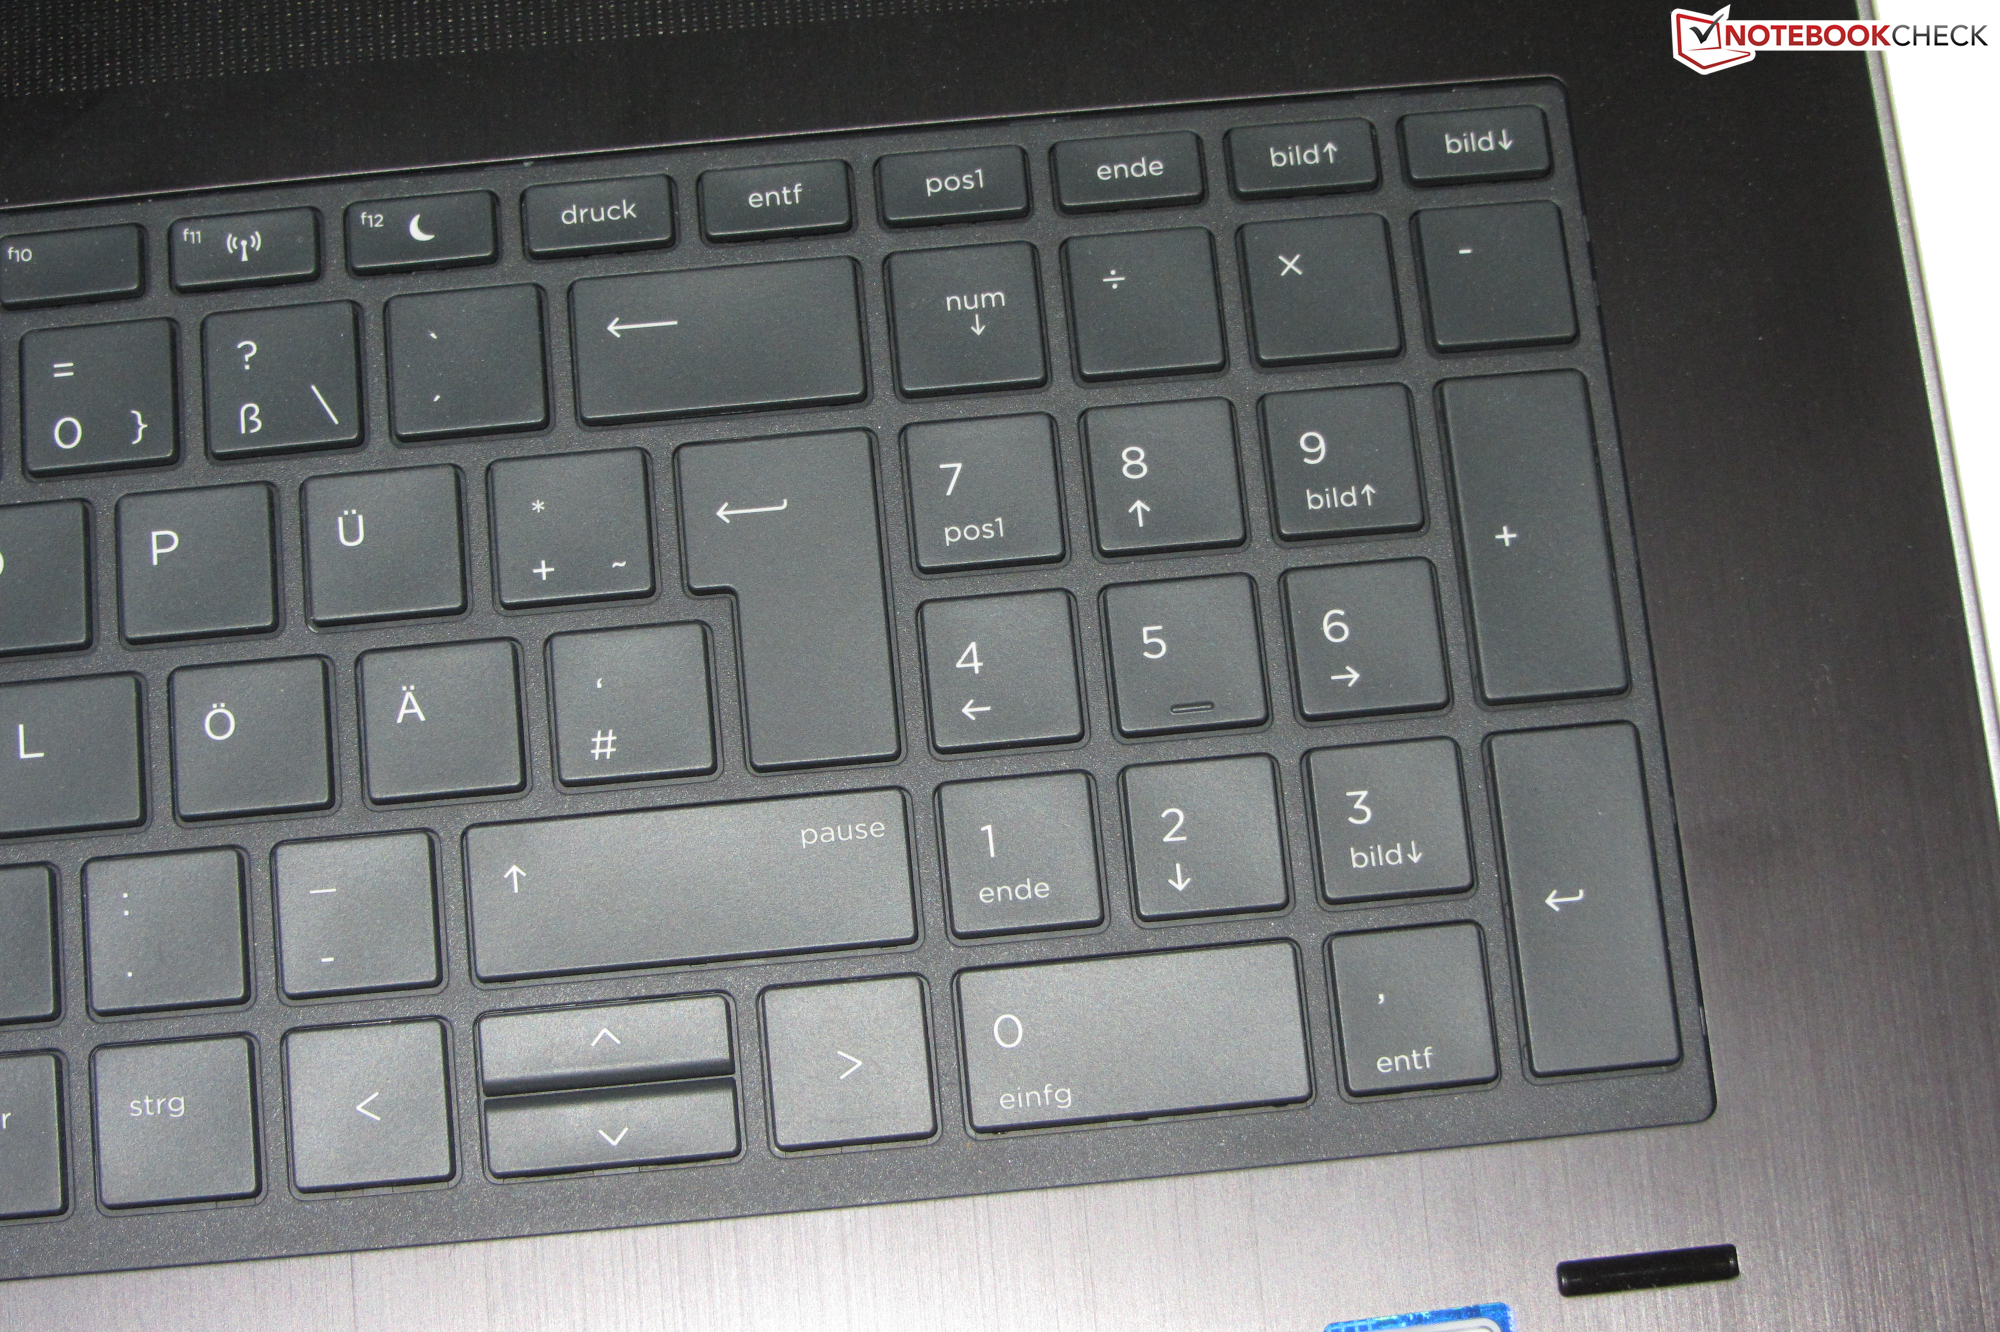
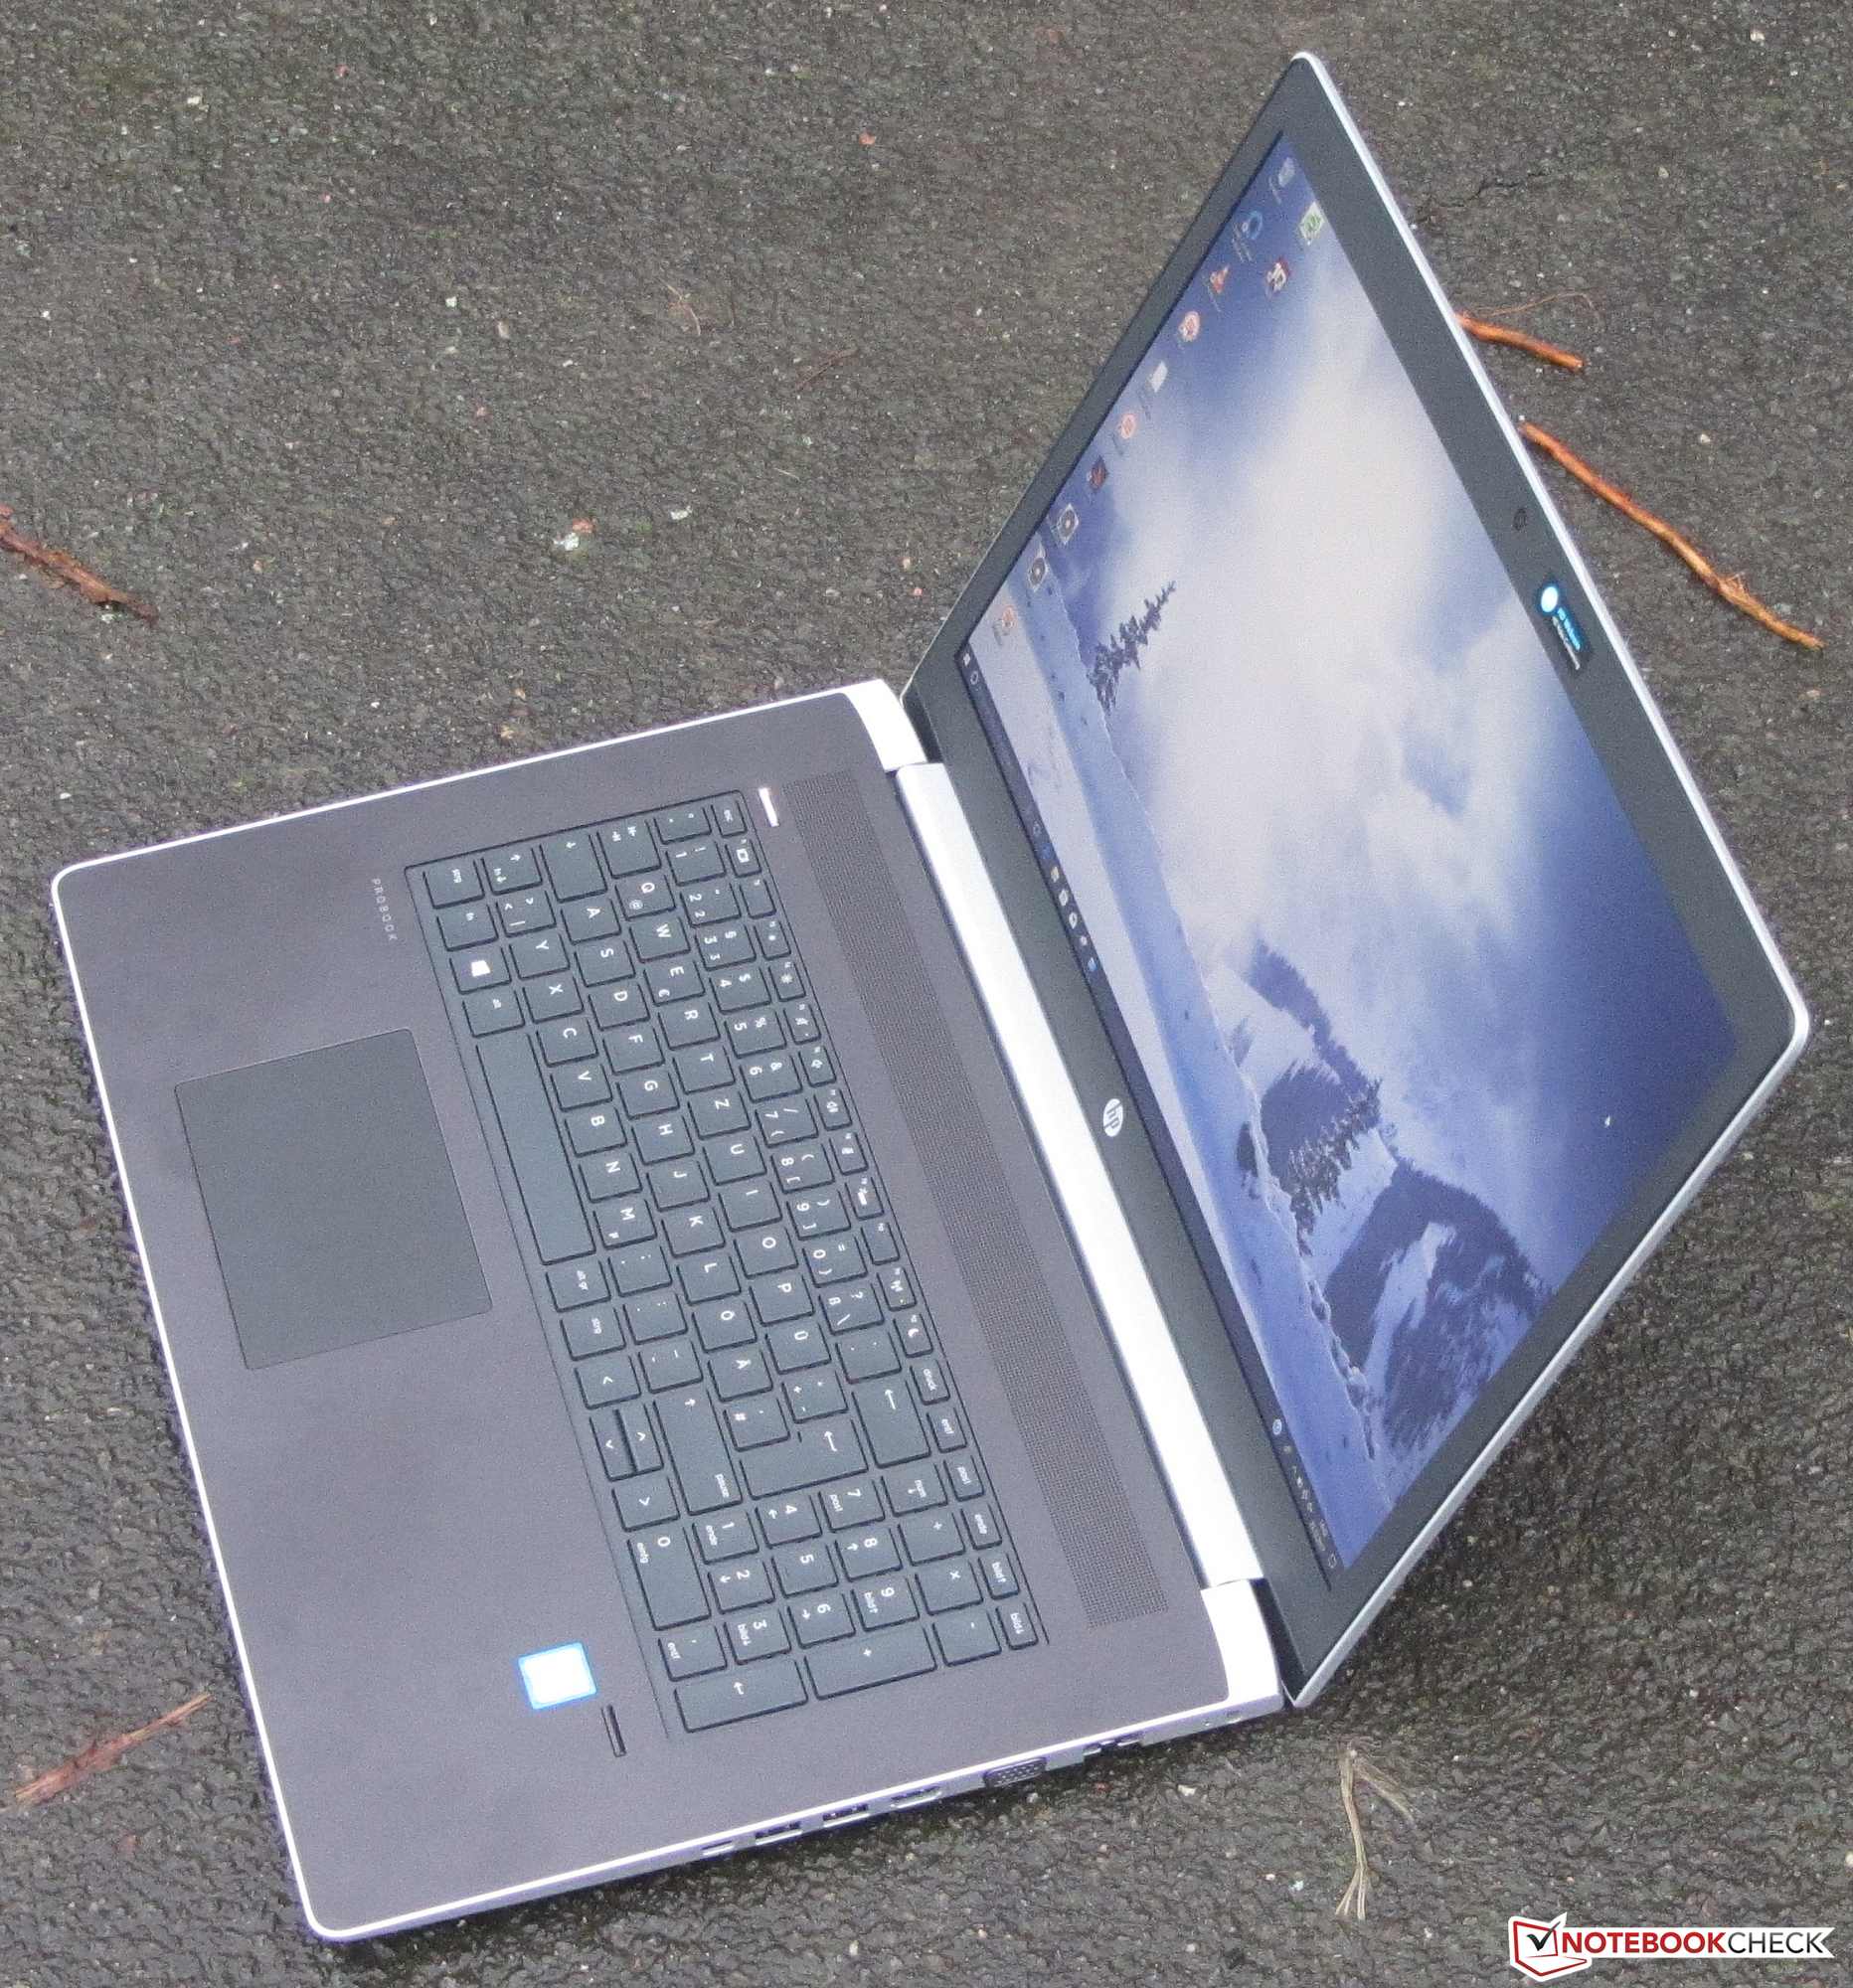
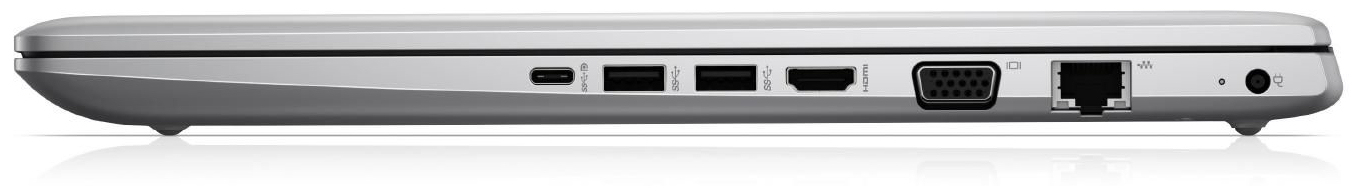
Looptijden zijn uitstekend, wat de mobiliteit van het apparaat aanzienlijk vergroot. Net zoals de voorgangers bevat de Probook 470 G5 een geweldig toetsenbord met tweetrapsverlichting. We hadden een langere garantie verwacht dan de 12 maanden geleverd bij dit specifieke model. Ook zou een Thundebolt 3 poort in plaats van een USB 3.1 Gen 1 poort geen overbodige luxe zijn geweest. Daarmee zou het apparaat nog veelzijdiger en vooral toekomstbestendiger worden.
HP ProBook 470 G5
-
01-01-2018 v6(old)
Sascha Mölck
Pricecompare
