 Deutsch
 English
 Español
 Français
 Italiano
 Nederlands
 Polski
 Português
 Русский
 Türkçe
 Svenska
 Chinese
 Magyar
Kort testrapport MSI GE72VR 6RF Apache Pro Notebook


| SD Card Reader | |
| average JPG Copy Test (av. of 3 runs) | |
| Acer Predator 17 G9-793-77LG | |
| Aorus X7 v6 | |
| HP Omen 17-w110ng | |
| Asus GL702VM-GC102D | |
| Medion Erazer X7849 MD 60292 | |
| MSI GS73VR 6RF | |
| MSI GE72VR-6RF16H21 | |
| maximum AS SSD Seq Read Test (1GB) | |
| Acer Predator 17 G9-793-77LG | |
| HP Omen 17-w110ng | |
| Aorus X7 v6 | |
| Medion Erazer X7849 MD 60292 | |
| Asus GL702VM-GC102D | |
| MSI GS73VR 6RF | |
| MSI GE72VR-6RF16H21 | |
| Networking | |
| iperf3 transmit AX12 | |
| Aorus X7 v6 | |
| HP Omen 17-w110ng | |
| MSI GE72VR-6RF16H21 | |
| iperf3 receive AX12 | |
| HP Omen 17-w110ng | |
| Aorus X7 v6 | |
| MSI GE72VR-6RF16H21 | |
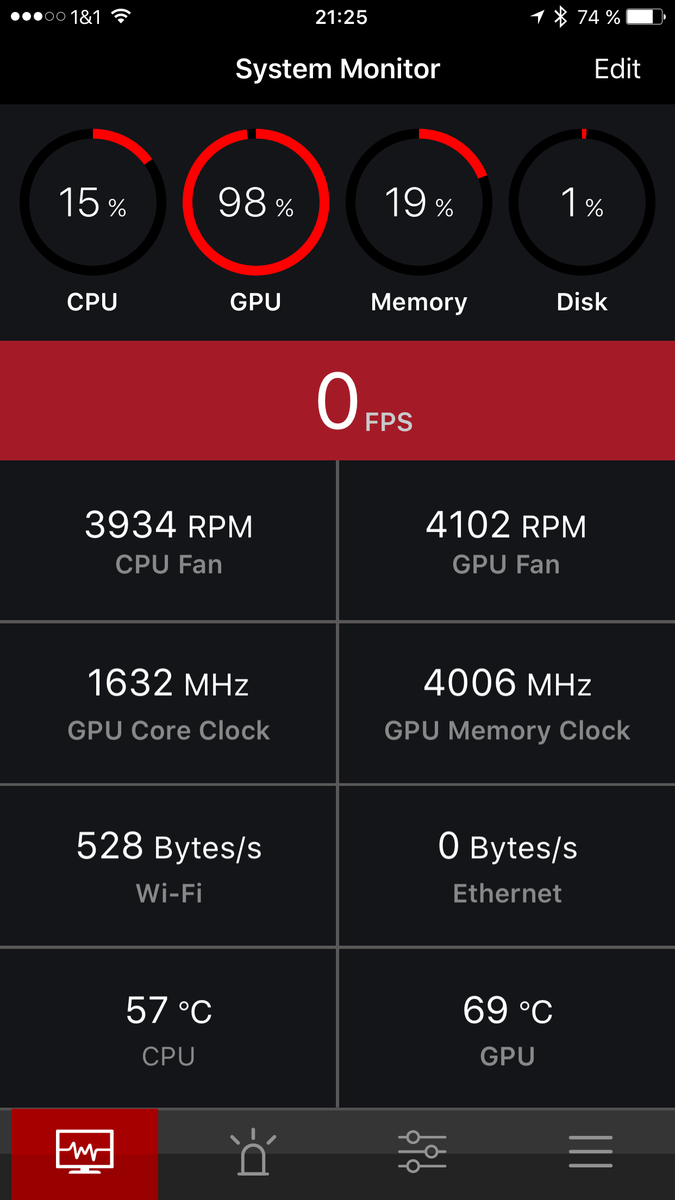
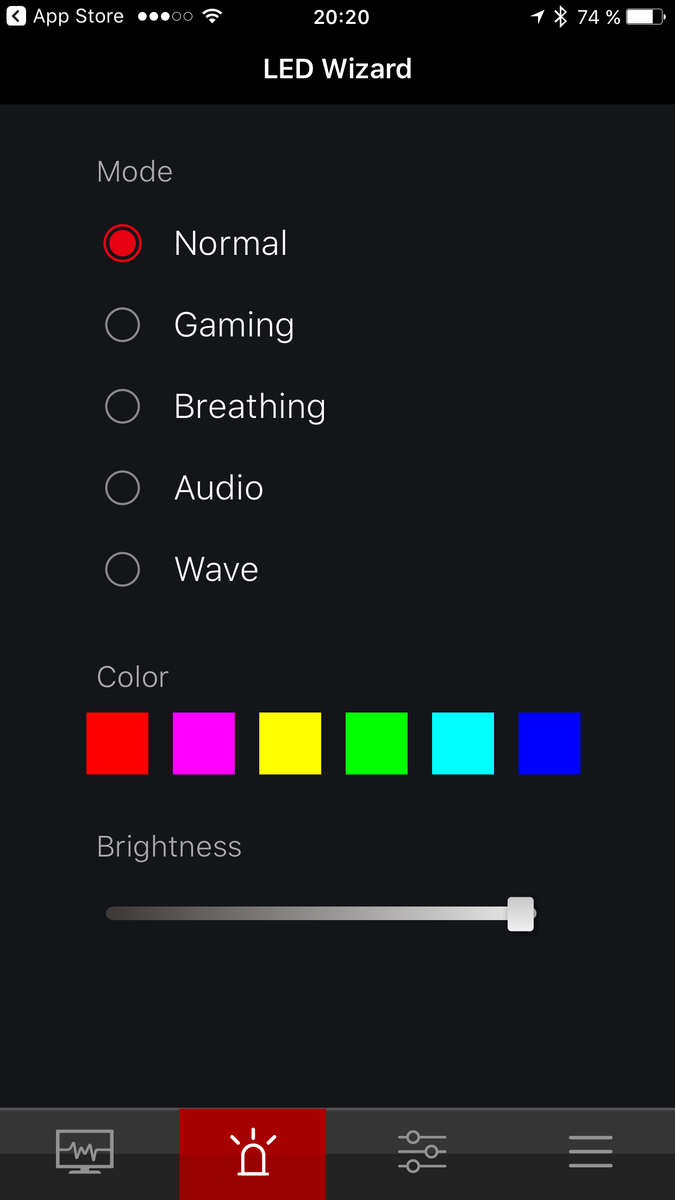
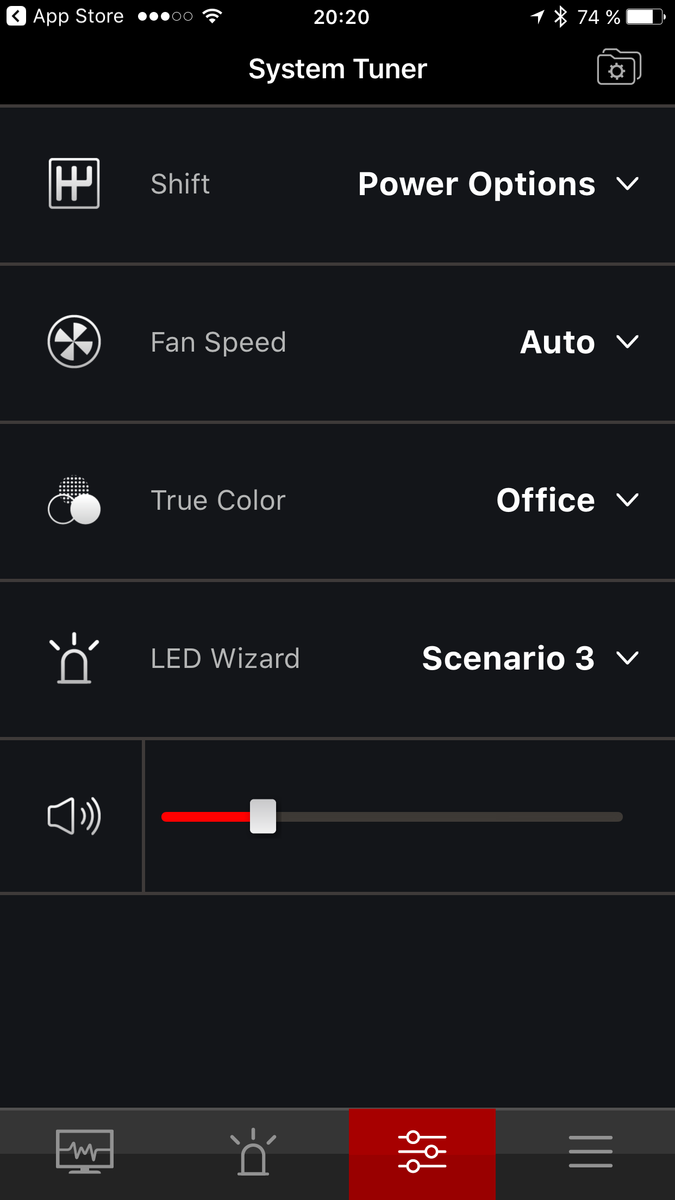
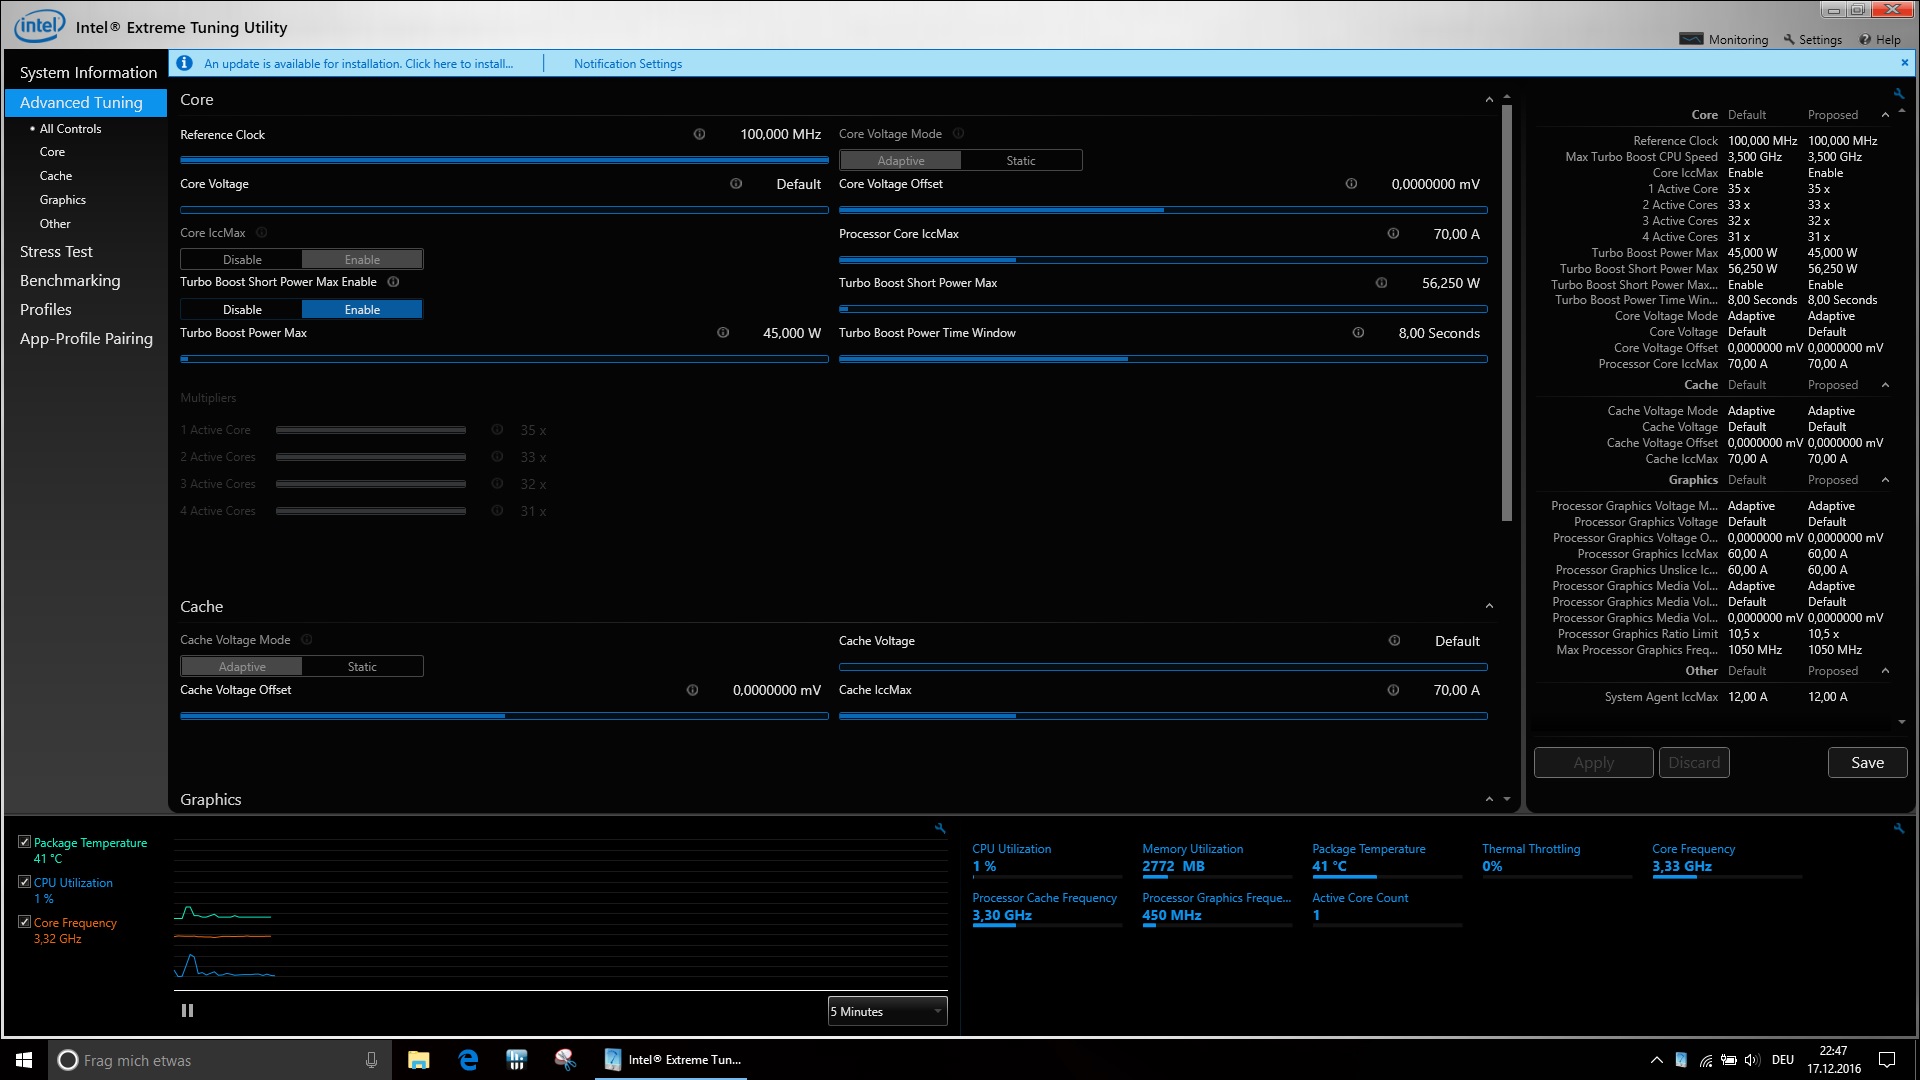
MSI Dragon Center
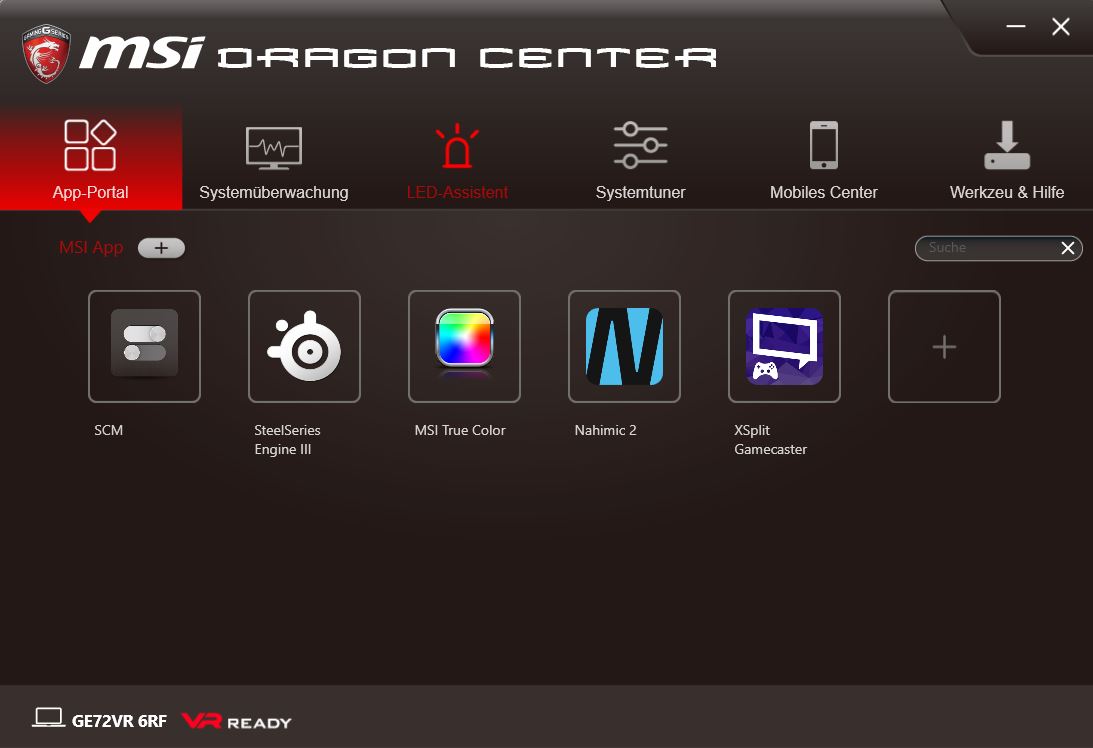

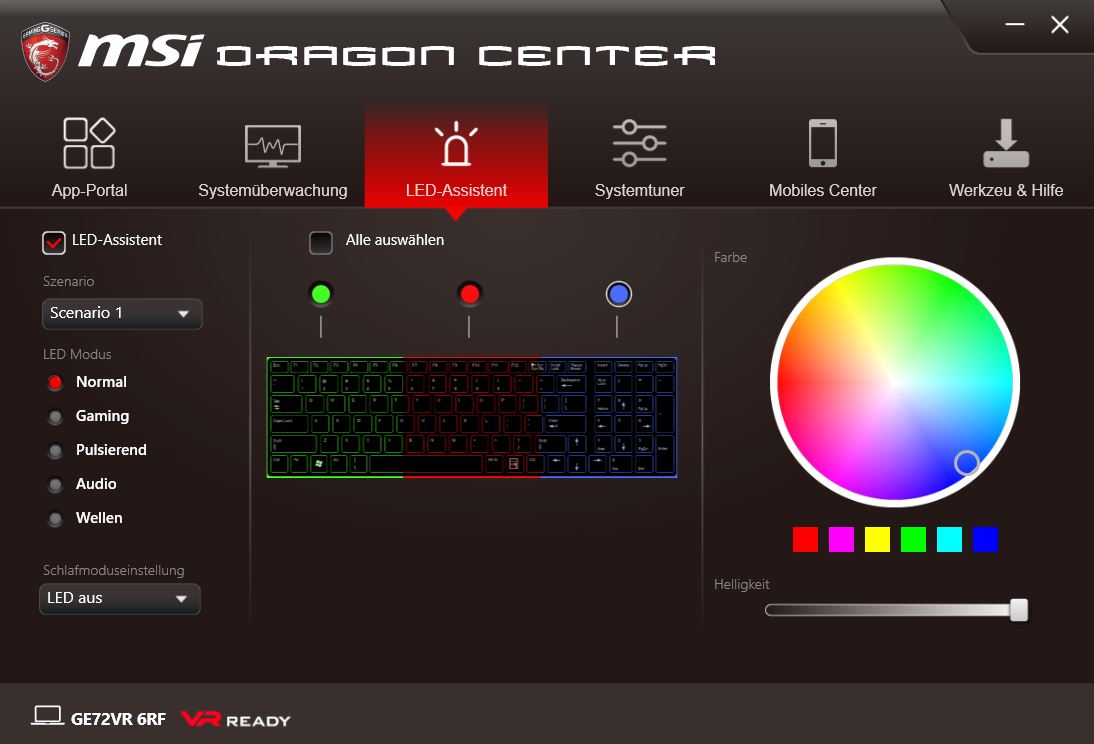
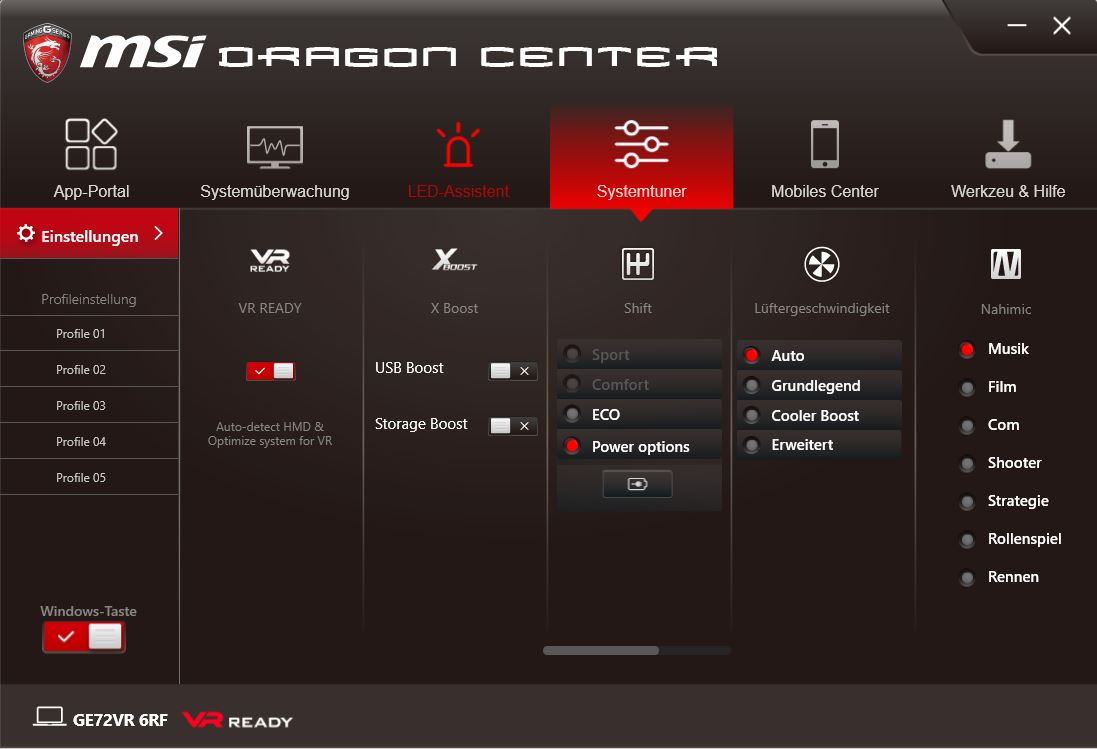

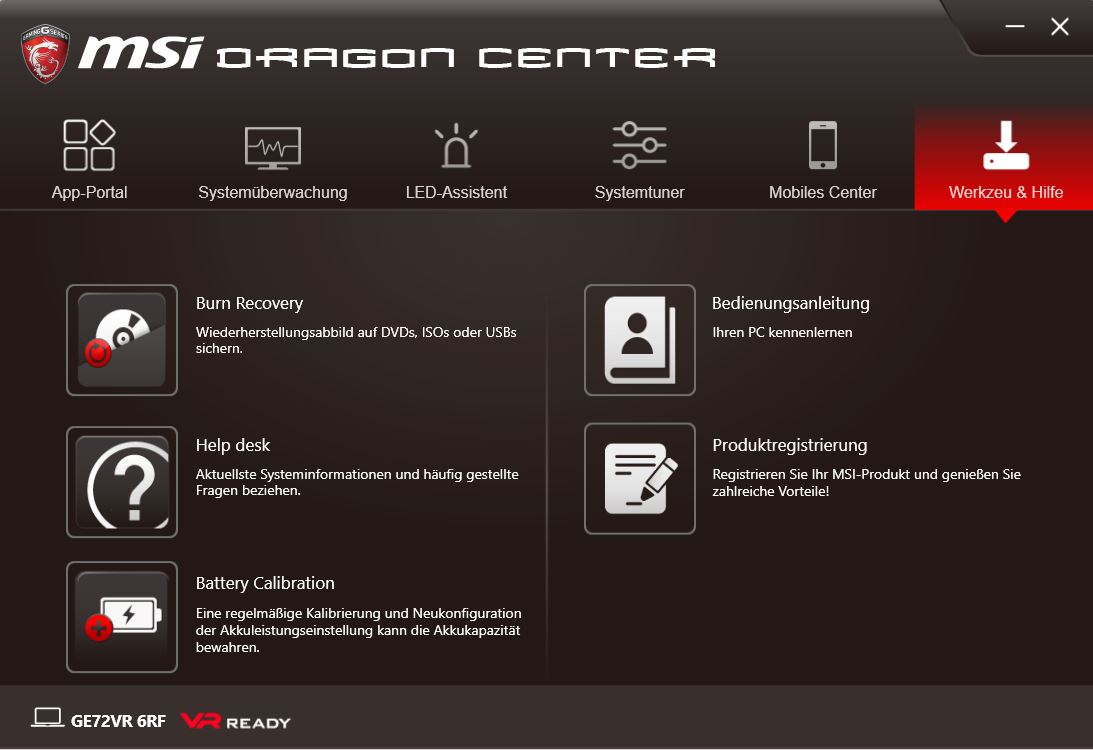
MSI Dragon Dashboard

| |||||||||||||||||||||||||
Helderheidsverdeling: 86 %
Helderheid in Batterij-modus: 270 cd/m²
Contrast: 1038:1 (Zwart: 0.26 cd/m²)
ΔE Color 3.33 | 0.5-29.43 Ø5
ΔE Greyscale 3.46 | 0.57-98 Ø5.3
100% sRGB (Argyll 1.6.3 3D)
75% AdobeRGB 1998 (Argyll 1.6.3 3D)
83.9% AdobeRGB 1998 (Argyll 2.2.0 3D)
99.8% sRGB (Argyll 2.2.0 3D)
90.2% Display P3 (Argyll 2.2.0 3D)
Gamma: 2.13
| MSI GE72VR-6RF16H21 N173HHE-G32 (CMN1747), 1920x1080 | Asus GL702VM-GC102D LG Philips LP173WF4-SPF3, 1920x1080 | MSI GS73VR 6RF 1920x1080 | Medion Erazer X7849 MD 60292 LP173WF4-SPD1, 1920x1080 | HP Omen 17-w110ng LG Philips LGD046E, 1920x1080 | Acer Predator 17 G9-793-77LG AU Optronics B173ZAN01.0 (AUO109B), 3840x2160 | Aorus X7 v6 B173QTN01.0 (AUO1096), 2560x1440 | |
|---|---|---|---|---|---|---|---|
| Display | -24% | 0% | -23% | 5% | -25% | ||
| Display P3 Coverage | 90.2 | 65.1 -28% | 90 0% | 66.6 -26% | 86.9 -4% | 60.9 -32% | |
| sRGB Coverage | 99.8 | 83.5 -16% | 99.9 0% | 84.1 -16% | 100 0% | 84.2 -16% | |
| AdobeRGB 1998 Coverage | 83.9 | 61.1 -27% | 83.6 0% | 61.5 -27% | 99.4 18% | 61.2 -27% | |
| Response Times | -112% | -10% | -96% | -116% | -116% | -18% | |
| Response Time Grey 50% / Grey 80% * | 28 ? | 38 ? -36% | 28 ? -0% | 29 ? -4% | 37 ? -32% | 37 ? -32% | 31 ? -11% |
| Response Time Black / White * | 8 ? | 23 ? -188% | 9.6 ? -20% | 23 ? -188% | 24 ? -200% | 24 ? -200% | 10 ? -25% |
| PWM Frequency | |||||||
| Screen | -42% | 8% | -24% | -7% | 6% | -44% | |
| Brightness middle | 270 | 326 21% | 337.2 25% | 390 44% | 362 34% | 336 24% | 343 27% |
| Brightness | 254 | 312 23% | 315 24% | 355 40% | 342 35% | 320 26% | 312 23% |
| Brightness Distribution | 86 | 91 6% | 86 0% | 79 -8% | 87 1% | 88 2% | 80 -7% |
| Black Level * | 0.26 | 0.5 -92% | 0.308 -18% | 0.39 -50% | 0.31 -19% | 0.25 4% | 0.5 -92% |
| Contrast | 1038 | 652 -37% | 1095 5% | 1000 -4% | 1168 13% | 1344 29% | 686 -34% |
| Colorchecker dE 2000 * | 3.33 | 6.3 -89% | 2.96 11% | 5.9 -77% | 4.5 -35% | 3.61 -8% | 7.33 -120% |
| Colorchecker dE 2000 max. * | 6.07 | 11.69 -93% | 5.45 10% | 9.89 -63% | 9.31 -53% | 6.02 1% | 10.79 -78% |
| Greyscale dE 2000 * | 3.46 | 7.37 -113% | 2.57 26% | 6.17 -78% | 3.48 -1% | 4.78 -38% | 7.6 -120% |
| Gamma | 2.13 103% | 2.37 93% | 2.25 98% | 2.24 98% | 2.23 99% | 2.32 95% | 2.19 100% |
| CCT | 7419 88% | 7116 91% | 7114 91% | 6955 93% | 6144 106% | 6185 105% | 9024 72% |
| Color Space (Percent of AdobeRGB 1998) | 75 | 55 -27% | 74.3 -1% | 55 -27% | 55 -27% | 88 17% | 55 -27% |
| Color Space (Percent of sRGB) | 100 | 83 -17% | 100 0% | 84 -16% | 84 -16% | 100 0% | 84 -16% |
| Totaal Gemiddelde (Programma / Instellingen) | -59% /
-48% | -1% /
4% | -60% /
-36% | -49% /
-25% | -35% /
-11% | -29% /
-37% |
* ... kleiner is beter
Responstijd Scherm
| ↔ Responstijd Zwart naar Wit | ||
|---|---|---|
| 8 ms ... stijging ↗ en daling ↘ gecombineerd | ↗ 5 ms stijging | 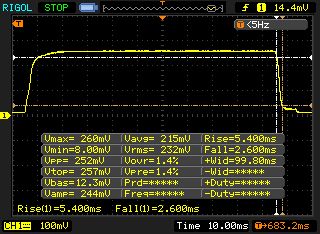 |
| ↘ 3 ms daling | ||
| Het scherm vertoonde snelle responstijden in onze tests en zou geschikt moeten zijn voor games. Ter vergelijking: alle testtoestellen variëren van 0.1 (minimum) tot 240 (maximum) ms. » 17 % van alle toestellen zijn beter. Dit betekent dat de gemeten responstijd beter is dan het gemiddelde (21.5 ms) van alle geteste toestellen. | ||
| ↔ Responstijd 50% Grijs naar 80% Grijs | ||
| 28 ms ... stijging ↗ en daling ↘ gecombineerd | ↗ 12 ms stijging | 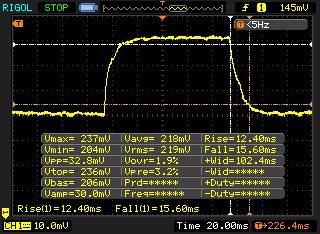 |
| ↘ 16 ms daling | ||
| Het scherm vertoonde relatief trage responstijden in onze tests en is misschien te traag voor games. Ter vergelijking: alle testtoestellen variëren van 0.2 (minimum) tot 636 (maximum) ms. » 32 % van alle toestellen zijn beter. Dit betekent dat de gemeten responstijd beter is dan het gemiddelde (33.7 ms) van alle geteste toestellen. | ||
Screen Flickering / PWM (Pulse-Width Modulation)
| Screen flickering / PWM niet waargenomen | 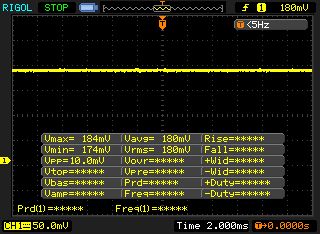 | ||
Ter vergelijking: 53 % van alle geteste toestellen maakten geen gebruik van PWM om de schermhelderheid te verlagen. Als het wel werd gebruikt, werd een gemiddelde van 17903 (minimum: 5 - maximum: 3846000) Hz waargenomen. | |||


| Cinebench R11.5 | |
| CPU Single 64Bit | |
| Aorus X7 v6 | |
| HP Omen 17-w110ng | |
| MSI GE72VR-6RF16H21 | |
| MSI GS73VR 6RF | |
| Asus GL702VM-GC102D | |
| CPU Multi 64Bit | |
| Aorus X7 v6 | |
| HP Omen 17-w110ng | |
| Asus GL702VM-GC102D | |
| MSI GS73VR 6RF | |
| MSI GE72VR-6RF16H21 | |
| Cinebench R10 | |
| Rendering Single CPUs 64Bit | |
| HP Omen 17-w110ng | |
| MSI GE72VR-6RF16H21 | |
| Rendering Multiple CPUs 64Bit | |
| HP Omen 17-w110ng | |
| MSI GE72VR-6RF16H21 | |
| JetStream 1.1 - Total Score | |
| HP Omen 17-w110ng | |
| Medion Erazer X7849 MD 60292 | |
| Asus GL702VM-GC102D | |
| MSI GS73VR 6RF | |
| MSI GE72VR-6RF16H21 | |
| Octane V2 - Total Score | |
| Medion Erazer X7849 MD 60292 | |
| HP Omen 17-w110ng | |
| Asus GL702VM-GC102D | |
| MSI GS73VR 6RF | |
| MSI GE72VR-6RF16H21 | |
| Mozilla Kraken 1.1 - Total | |
| MSI GE72VR-6RF16H21 | |
| Asus GL702VM-GC102D | |
| HP Omen 17-w110ng | |
| Medion Erazer X7849 MD 60292 | |
* ... kleiner is beter
| PCMark 7 - Score | |
| Aorus X7 v6 | |
| MSI GE72VR-6RF16H21 | |
| HP Omen 17-w110ng | |
| Asus GL702VM-GC102D | |
| PCMark 8 | |
| Home Score Accelerated v2 | |
| HP Omen 17-w110ng | |
| Asus GL702VM-GC102D | |
| Medion Erazer X7849 MD 60292 | |
| Medion Erazer X7849 MD 60292 | |
| Acer Predator 17 G9-793-77LG | |
| MSI GS73VR 6RF | |
| MSI GE72VR-6RF16H21 | |
| Creative Score Accelerated v2 | |
| HP Omen 17-w110ng | |
| Asus GL702VM-GC102D | |
| MSI GS73VR 6RF | |
| MSI GE72VR-6RF16H21 | |
| Acer Predator 17 G9-793-77LG | |
| Work Score Accelerated v2 | |
| HP Omen 17-w110ng | |
| Medion Erazer X7849 MD 60292 | |
| MSI GE72VR-6RF16H21 | |
| Asus GL702VM-GC102D | |
| MSI GS73VR 6RF | |
| Storage Score v2 | |
| HP Omen 17-w110ng | |
| Medion Erazer X7849 MD 60292 | |
| MSI GE72VR-6RF16H21 | |
| MSI GS73VR 6RF | |
| PCMark Vantage Result | 20205 punten | |
| PCMark 7 Score | 5809 punten | |
| PCMark 8 Home Score Accelerated v2 | 3985 punten | |
| PCMark 8 Creative Score Accelerated v2 | 4933 punten | |
| PCMark 8 Work Score Accelerated v2 | 4831 punten | |
Help | ||
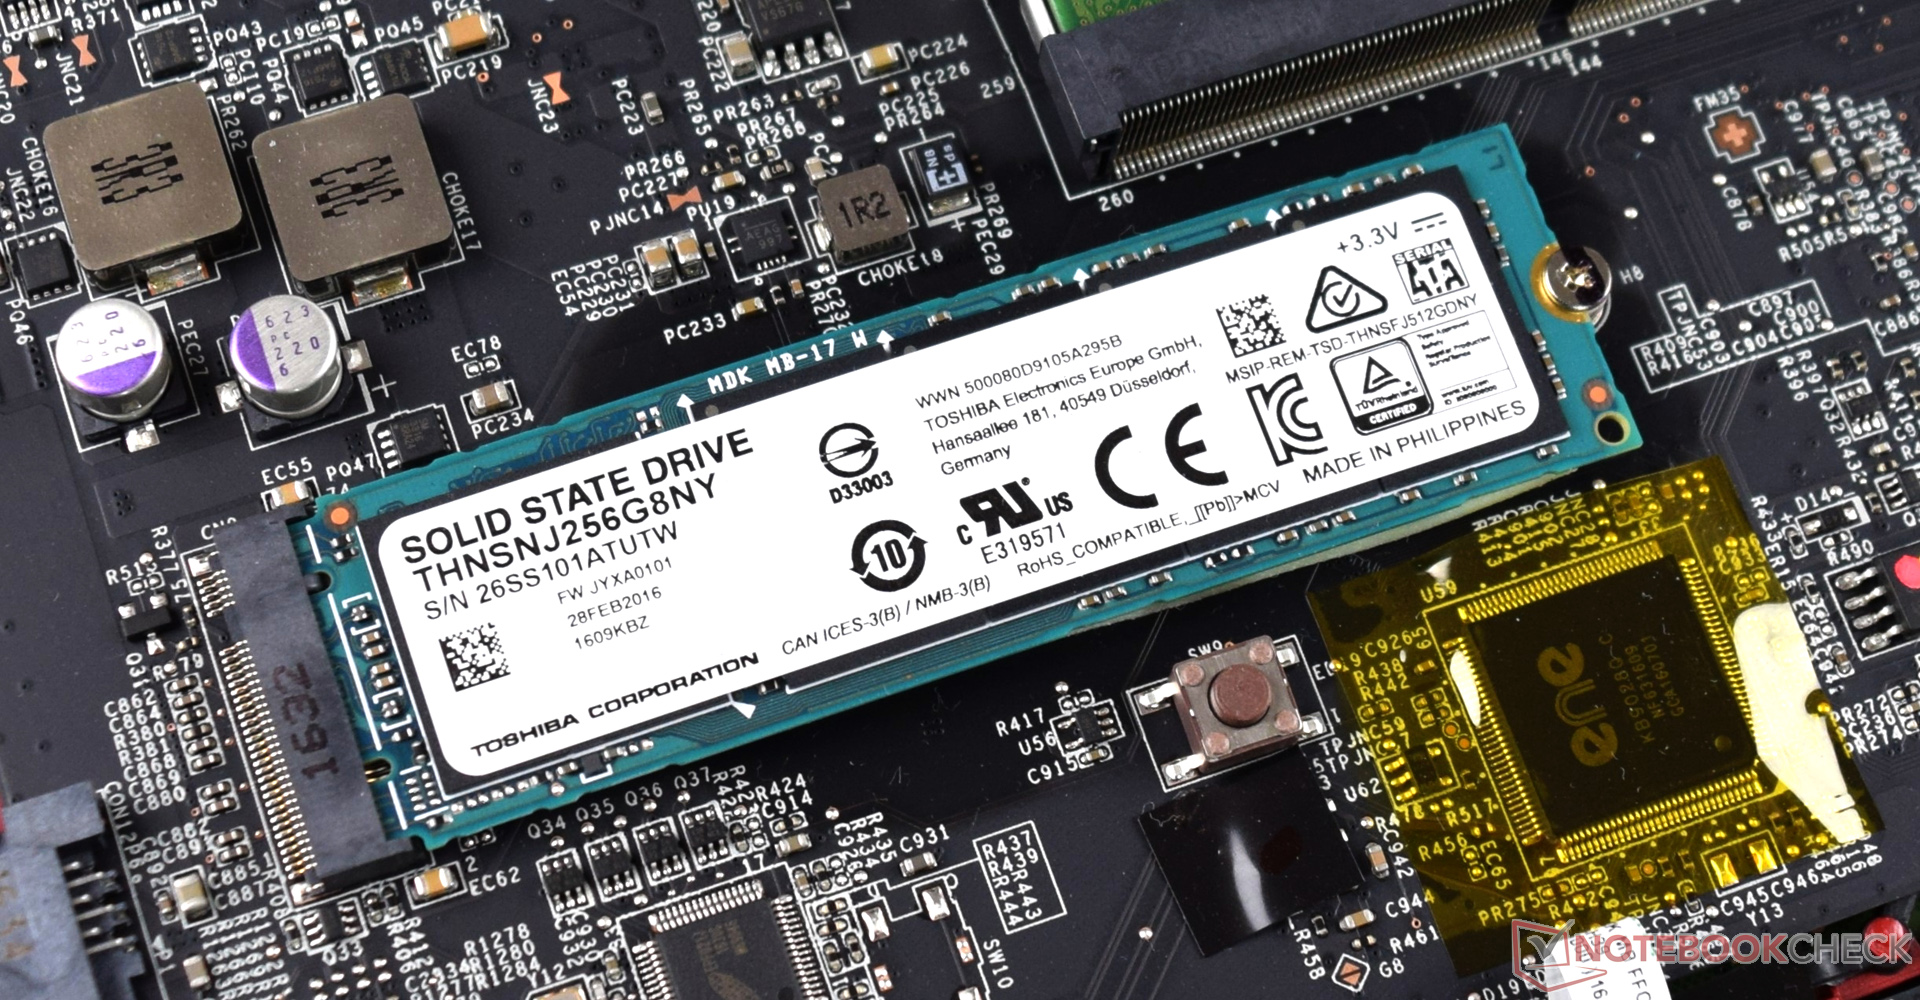
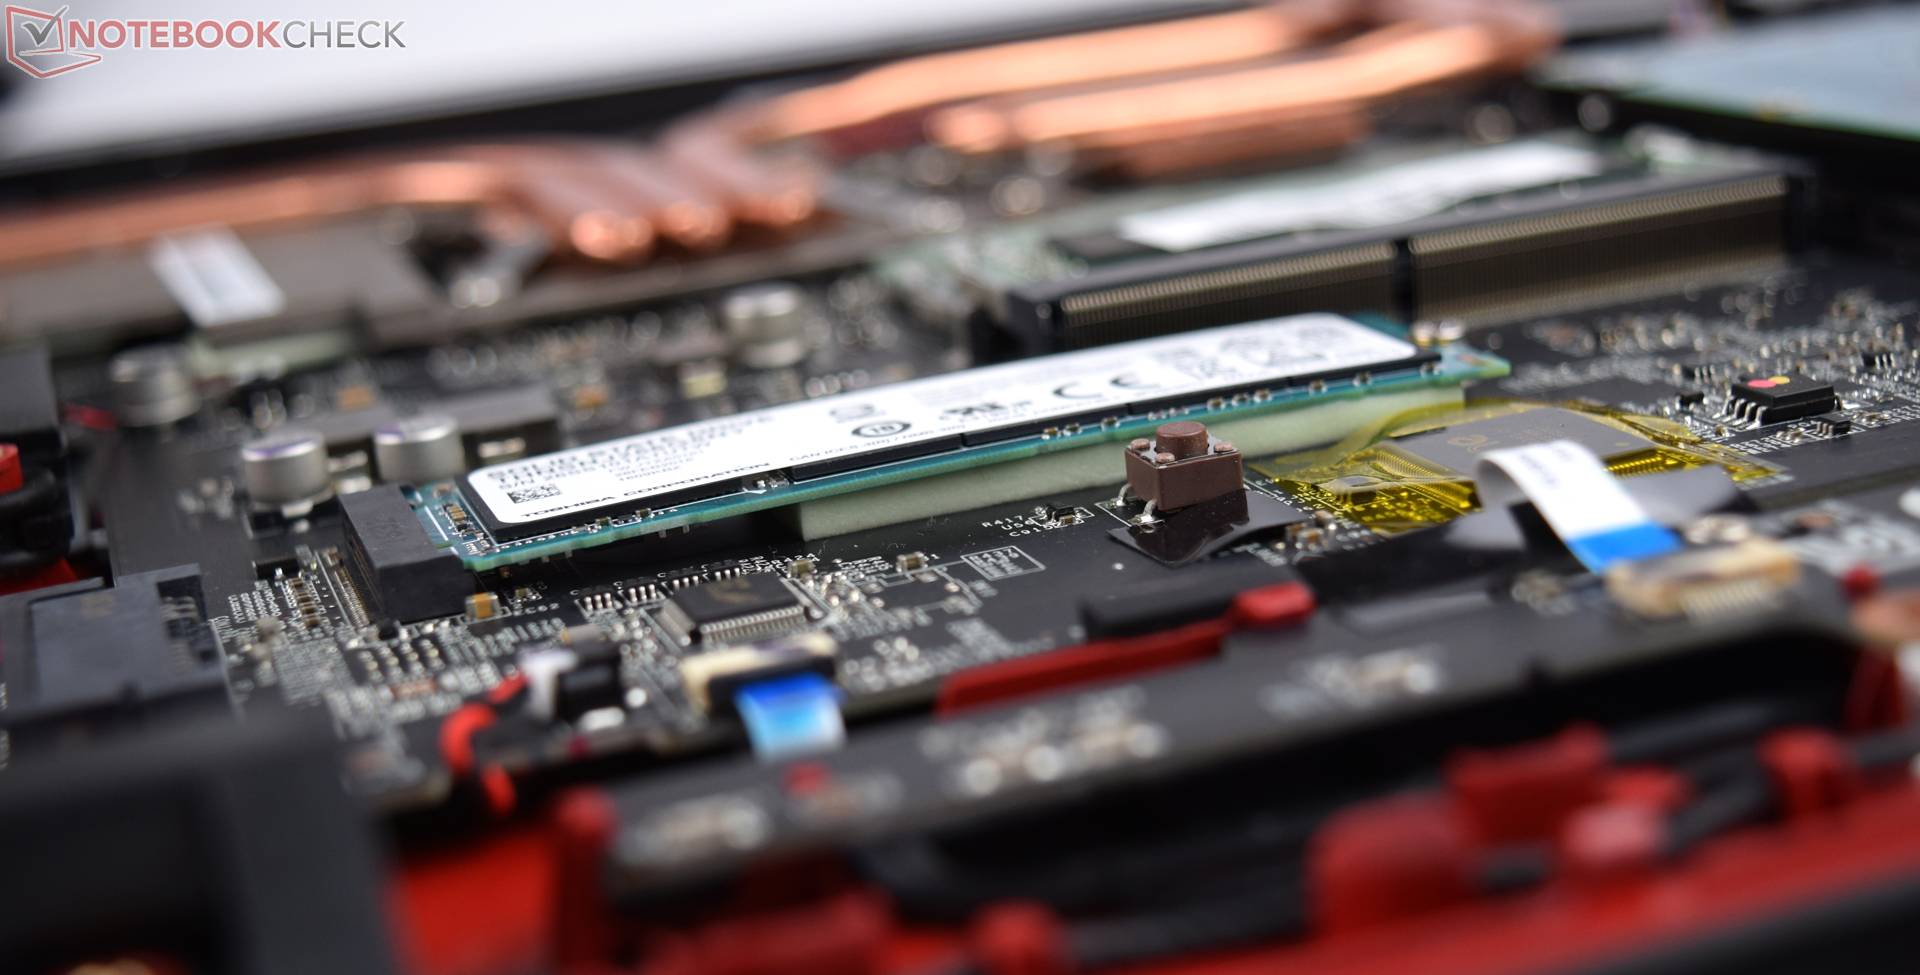
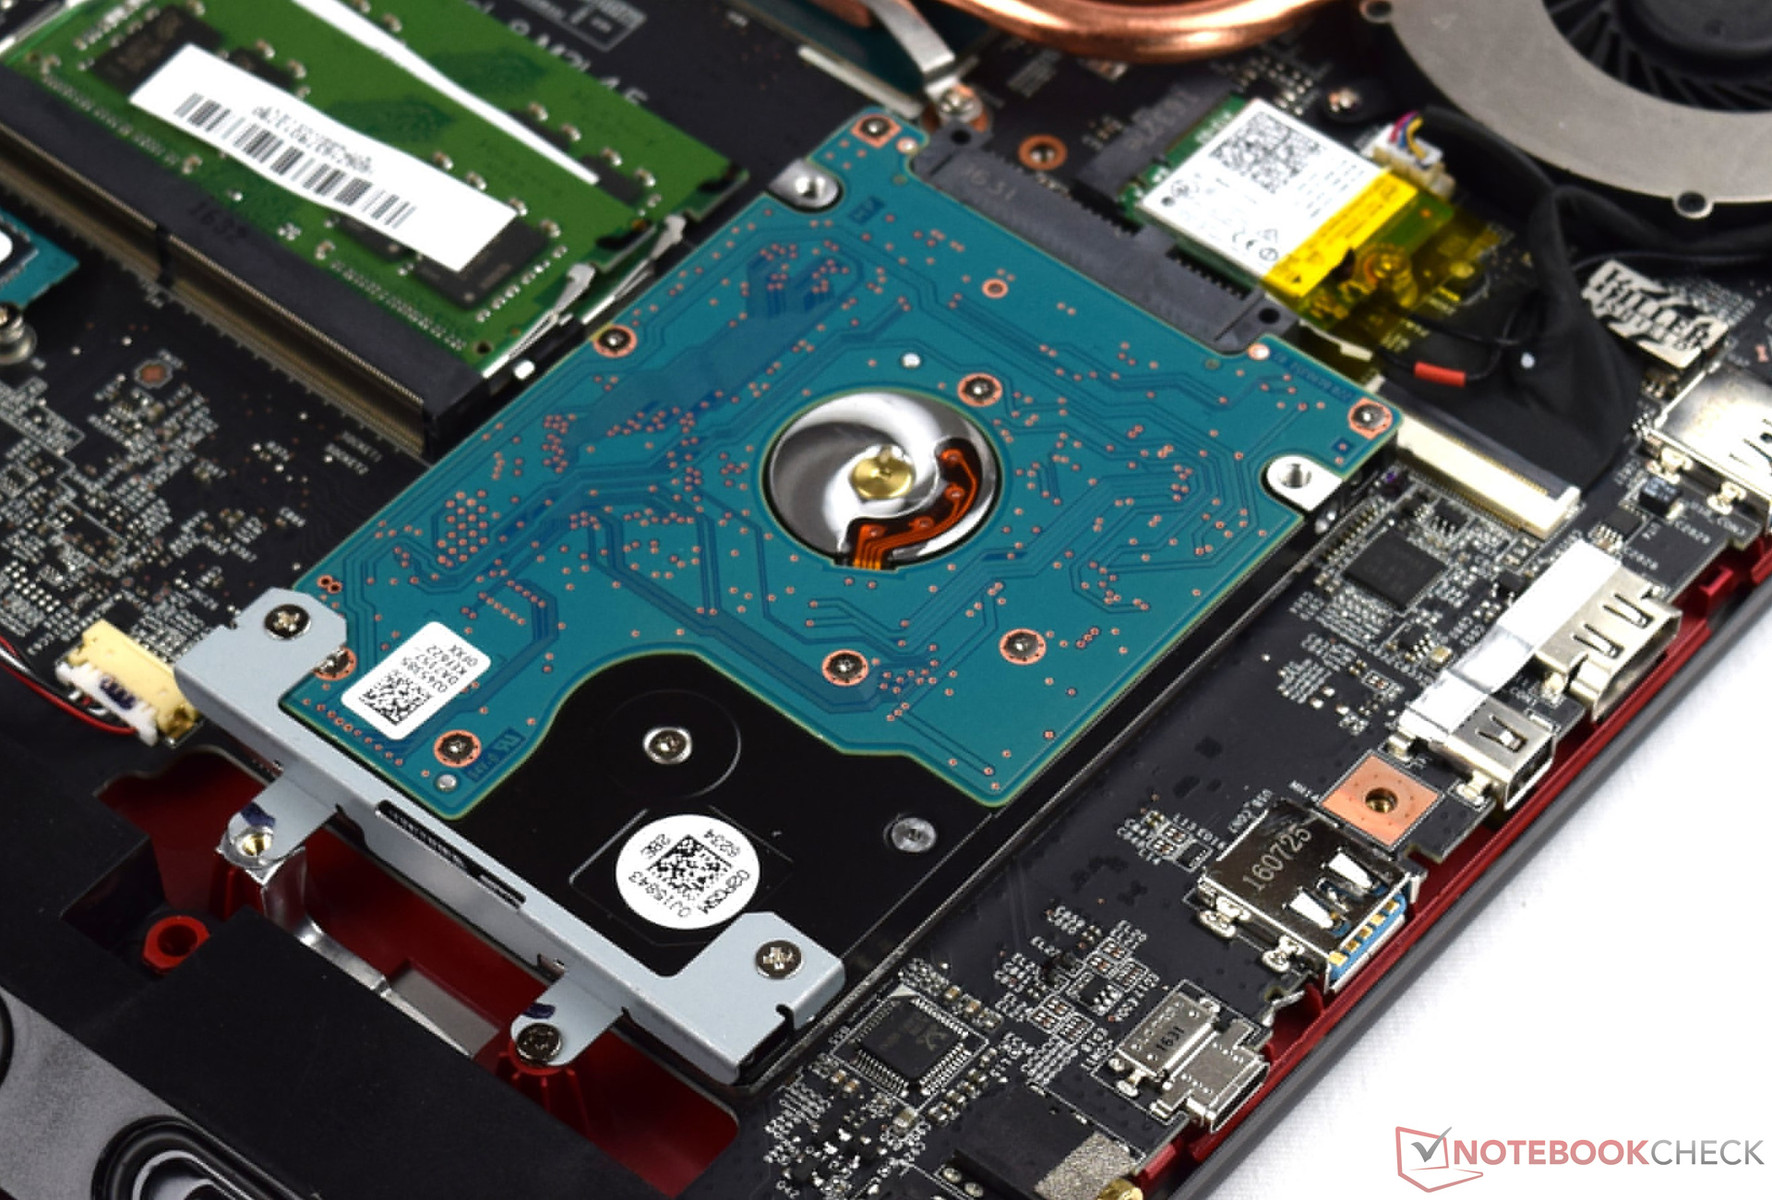


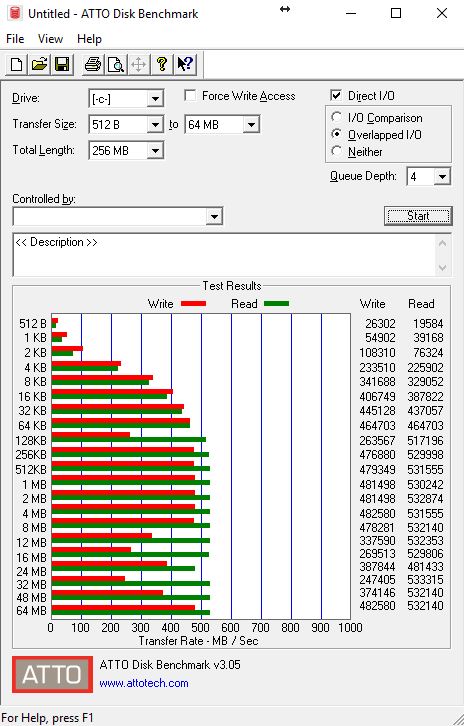
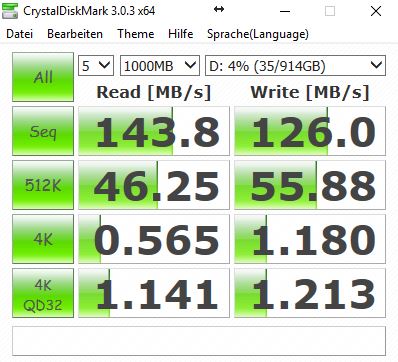
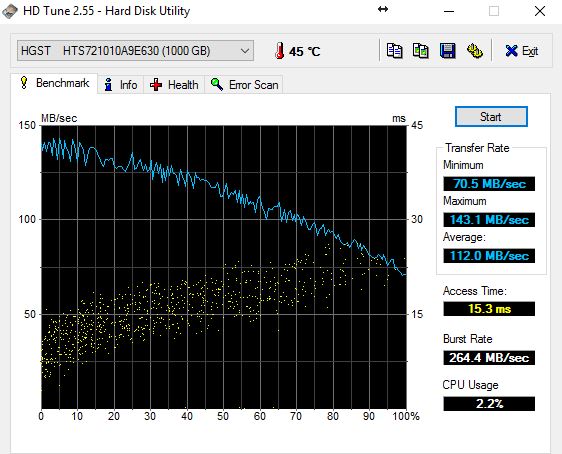
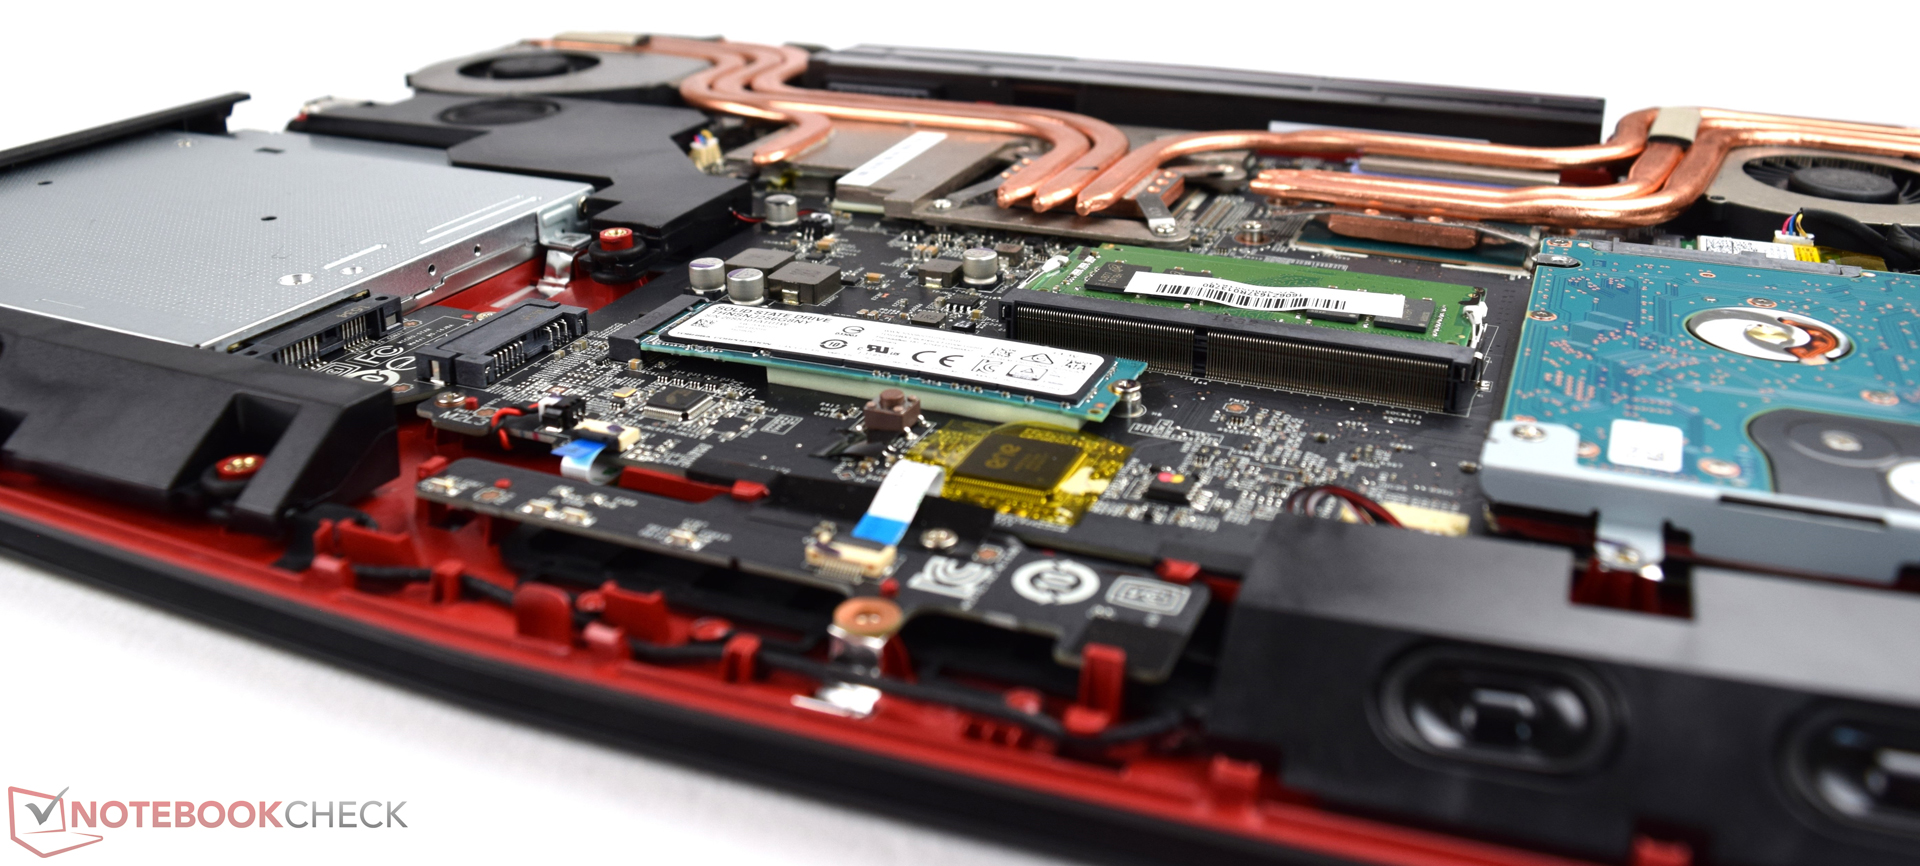
| MSI GE72VR-6RF16H21 Toshiba HG6 THNSNJ256G8NY | Asus GL702VM-GC102D HGST Travelstar 7K1000 HTS721010A9E630 | MSI GS73VR 6RF SanDisk SD8SN8U1T001122 | Medion Erazer X7849 MD 60292 Samsung SSD PM871 MZNLN512HCJH | HP Omen 17-w110ng Samsung PM951 NVMe MZVLV256 | Aorus X7 v6 Toshiba NVMe THNSN5512GPU7 | |
|---|---|---|---|---|---|---|
| CrystalDiskMark 3.0 | -86% | -18% | 35% | 65% | 197% | |
| Read Seq | 510 | 134.6 -74% | 334.3 -34% | 513 1% | 1156 127% | 1499 194% |
| Write Seq | 274.6 | 130.6 -52% | 319 16% | 483.7 76% | 294.9 7% | 1411 414% |
| Read 512 | 427.2 | 44.85 -90% | 242.3 -43% | 452.4 6% | 616 44% | 966 126% |
| Write 512 | 247.2 | 63.3 -74% | 254.4 3% | 404.2 64% | 294.7 19% | 1103 346% |
| Read 4k | 21.23 | 0.602 -97% | 20.3 -4% | 37.48 77% | 42.7 101% | 44.33 109% |
| Write 4k | 86.8 | 1.146 -99% | 42.51 -51% | 91.4 5% | 153.3 77% | 155.5 79% |
| Read 4k QD32 | 335.4 | 1.106 -100% | 251.6 -25% | 364.4 9% | 600 79% | 696 108% |
| Write 4k QD32 | 178.1 | 1.186 -99% | 167.1 -6% | 250.9 41% | 295.3 66% | 531 198% |


| 3DMark 11 - 1280x720 Performance GPU | |
| Aorus X7 v6 | |
| Acer Predator 17 G9-793-77LG | |
| Medion Erazer X7849 MD 60292 | |
| HP Omen 17-w110ng | |
| MSI GE72VR-6RF16H21 | |
| MSI GS73VR 6RF | |
| Asus GL702VM-GC102D | |
| 3DMark - 1920x1080 Fire Strike Graphics | |
| Aorus X7 v6 | |
| Medion Erazer X7849 MD 60292 | |
| HP Omen 17-w110ng | |
| Acer Predator 17 G9-793-77LG | |
| MSI GE72VR-6RF16H21 | |
| MSI GS73VR 6RF | |
| Asus GL702VM-GC102D | |
| 3DMark 03 Standard | 87152 punten | |
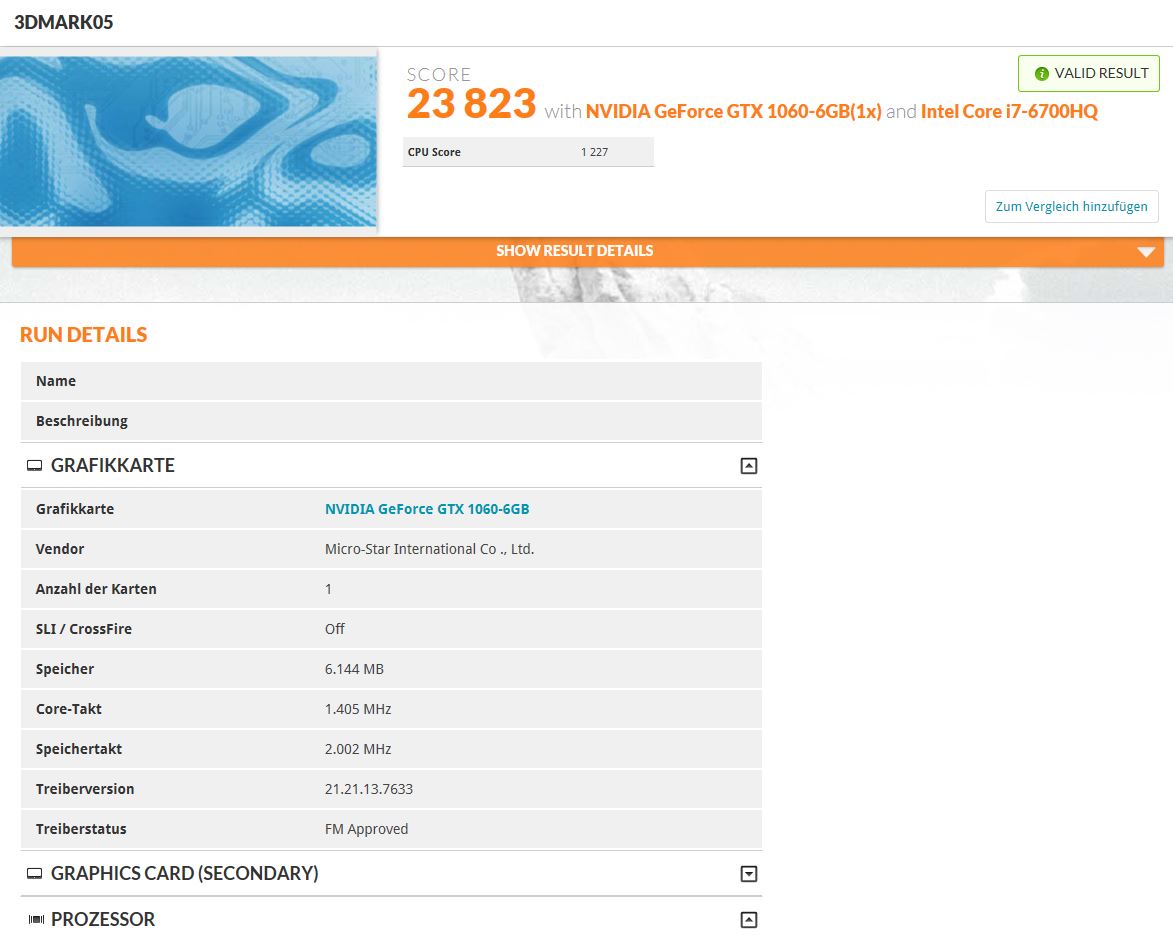
| 3DMark 05 Standard | 23823 punten | |
| 3DMark 06 Standard Score | 25697 punten | |
| 3DMark Vantage P Result | 33893 punten | |
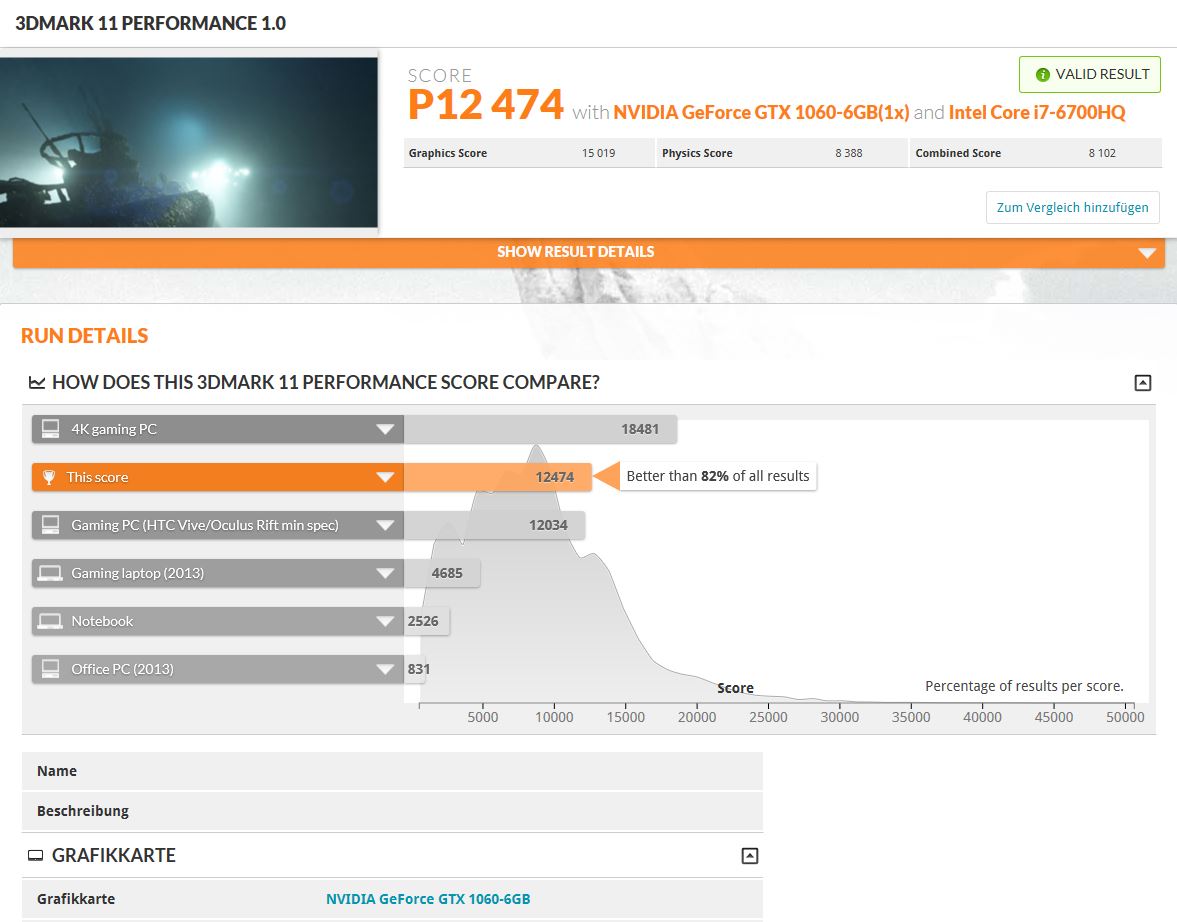
| 3DMark 11 Performance | 12474 punten | |
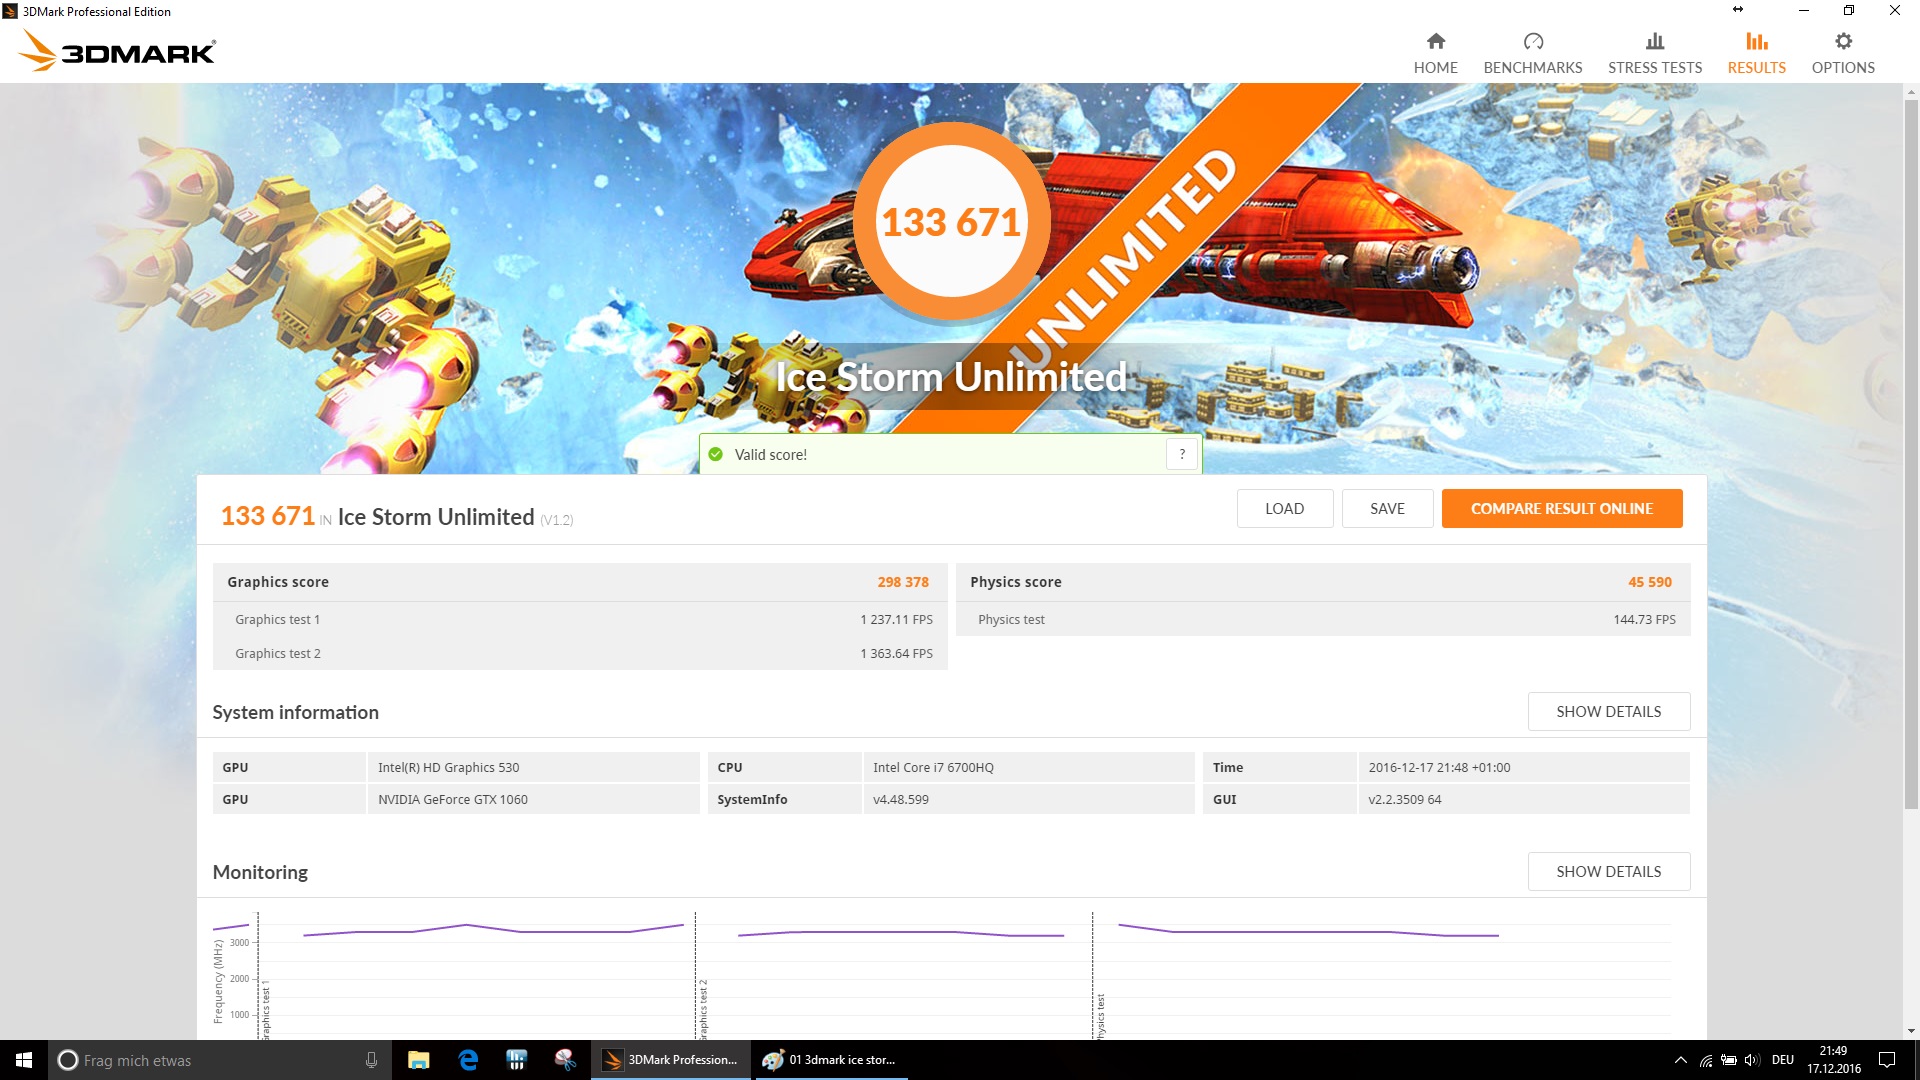
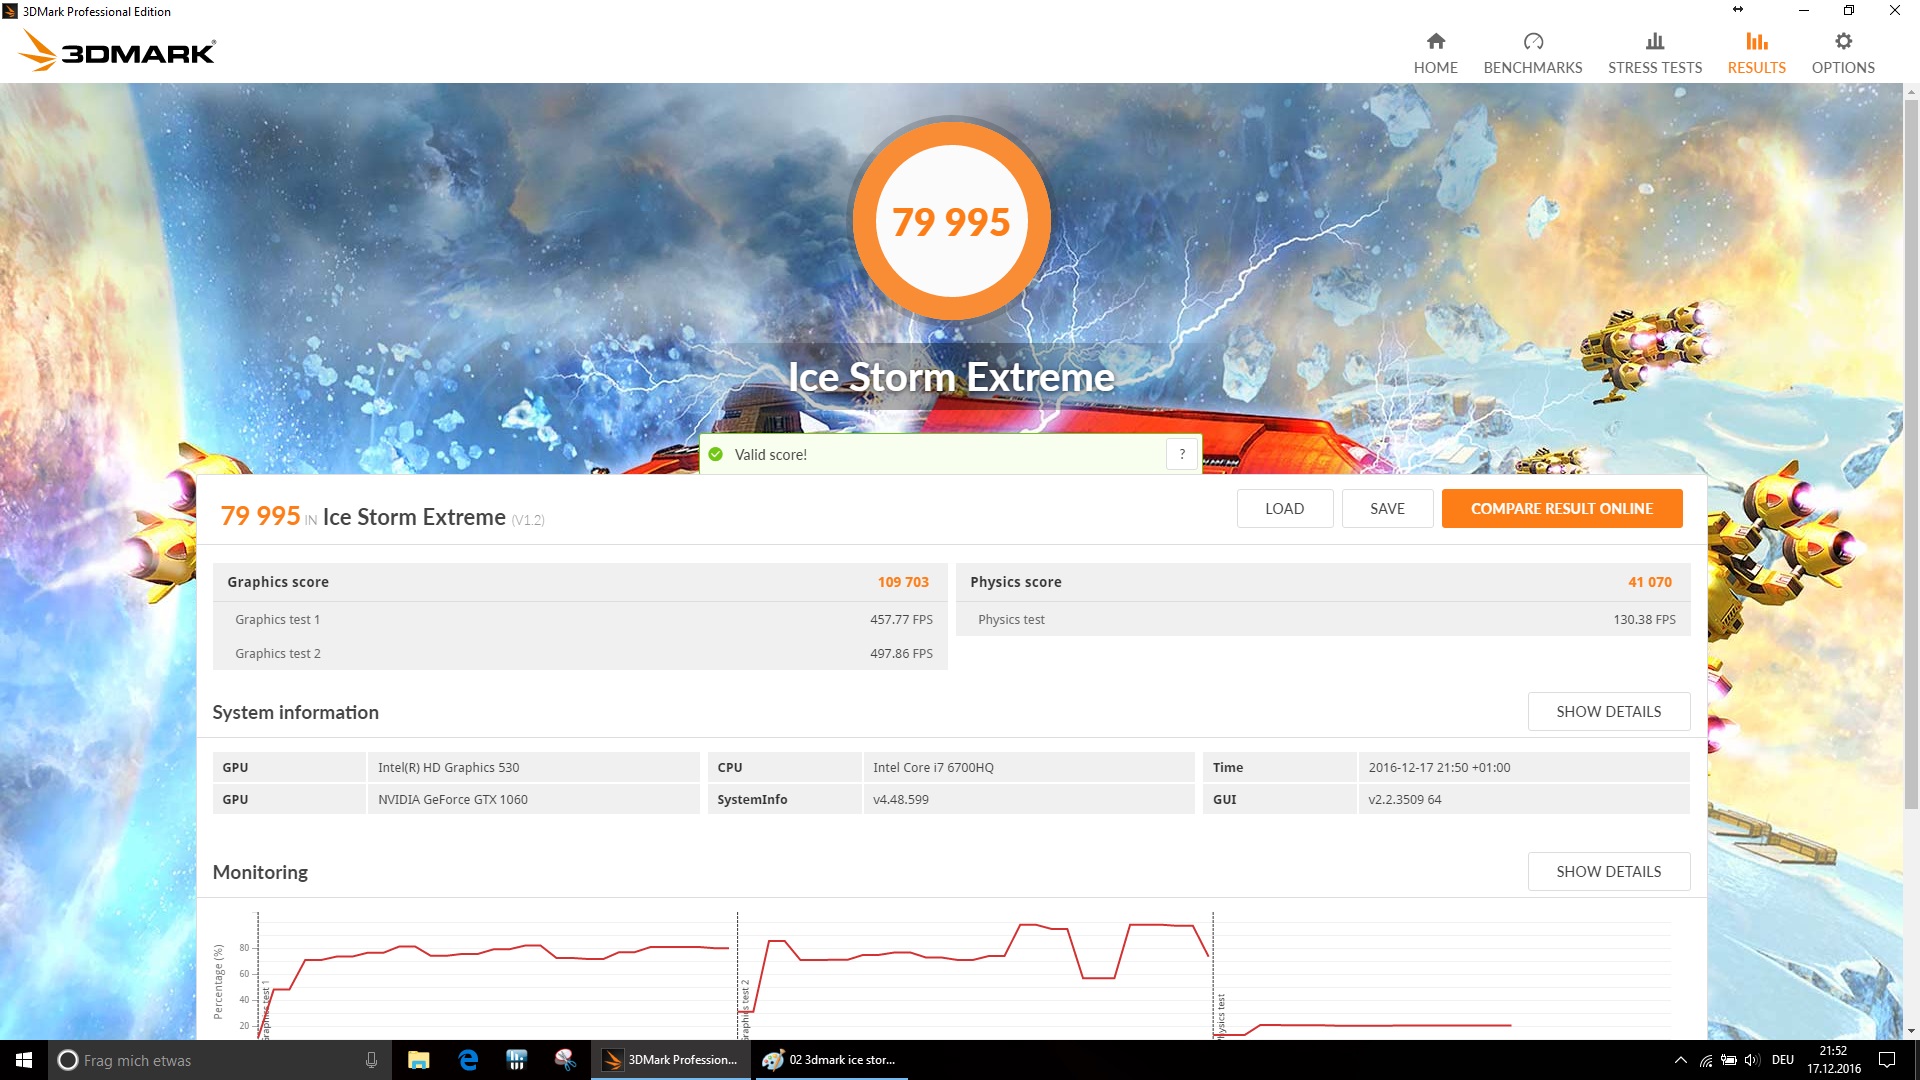
| 3DMark Ice Storm Standard Score | 81901 punten | |
| 3DMark Cloud Gate Standard Score | 22892 punten | |
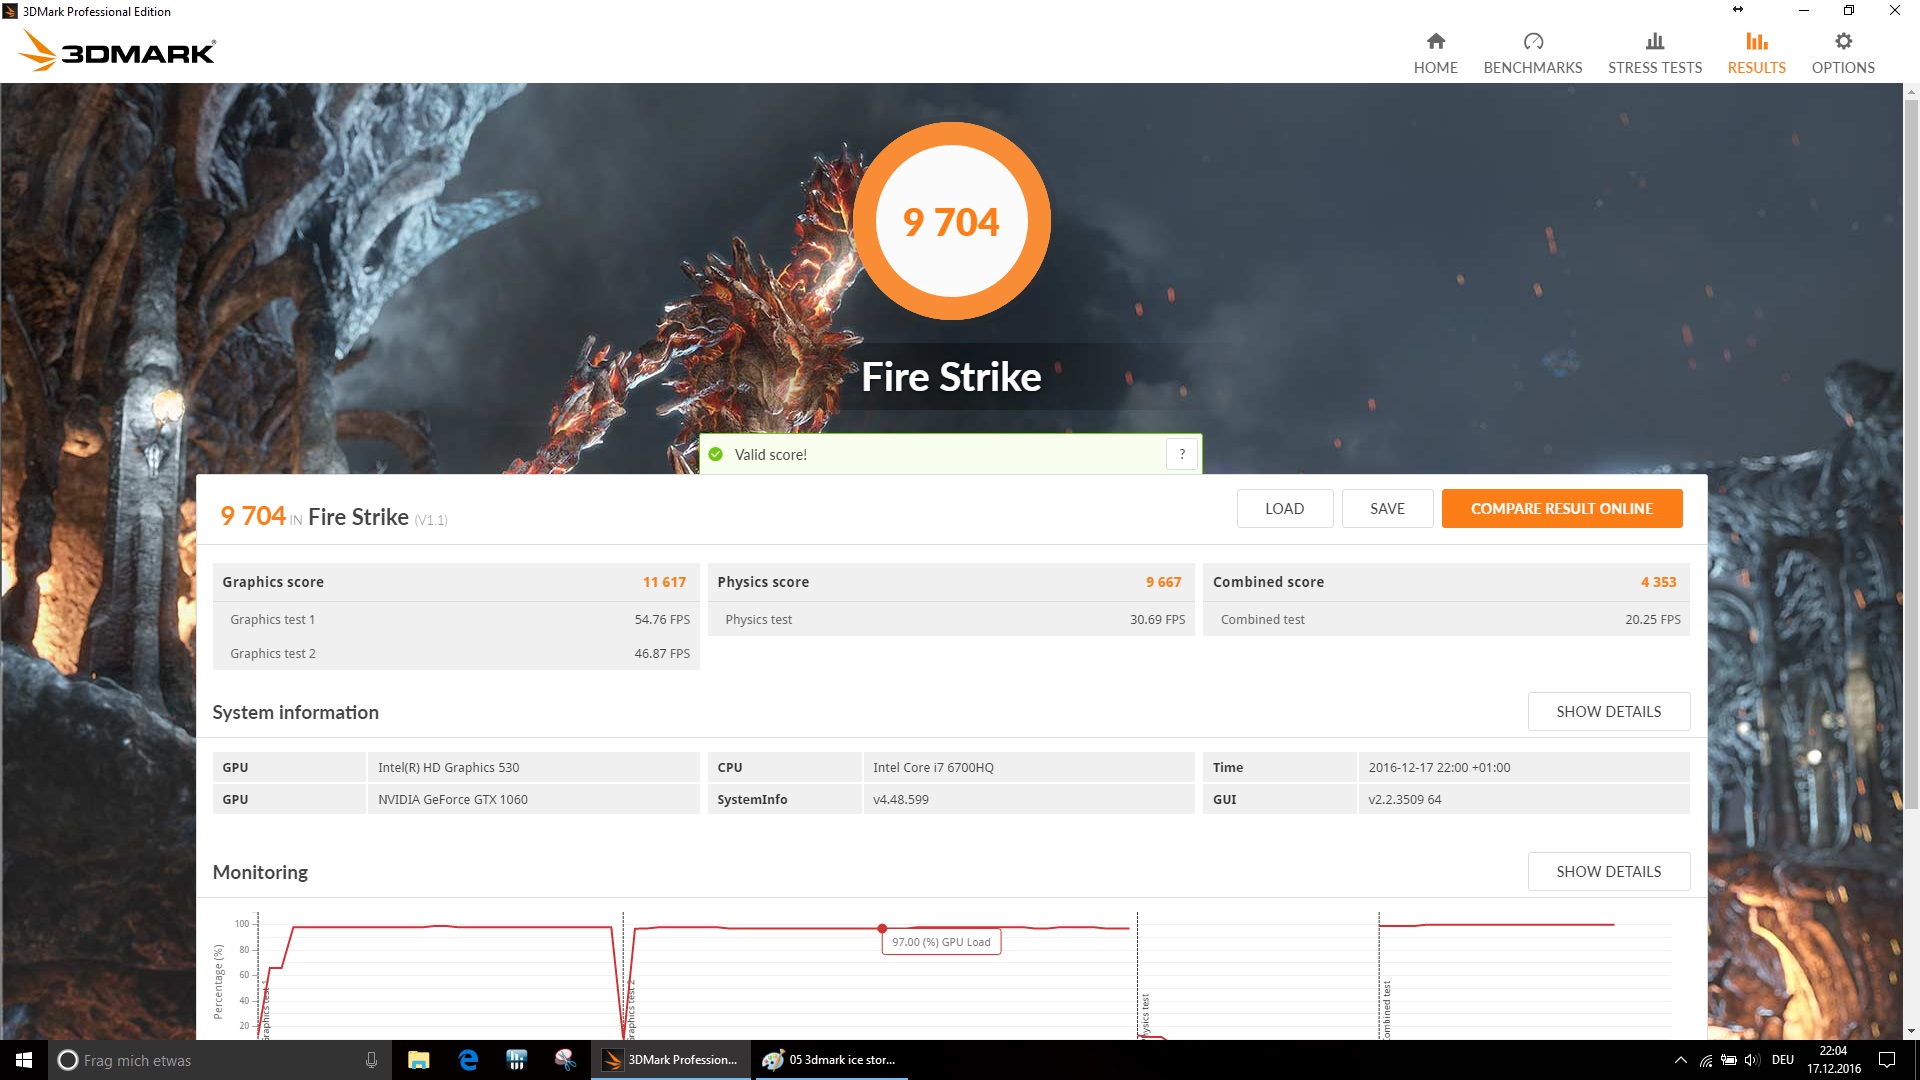
| 3DMark Fire Strike Score | 9704 punten | |
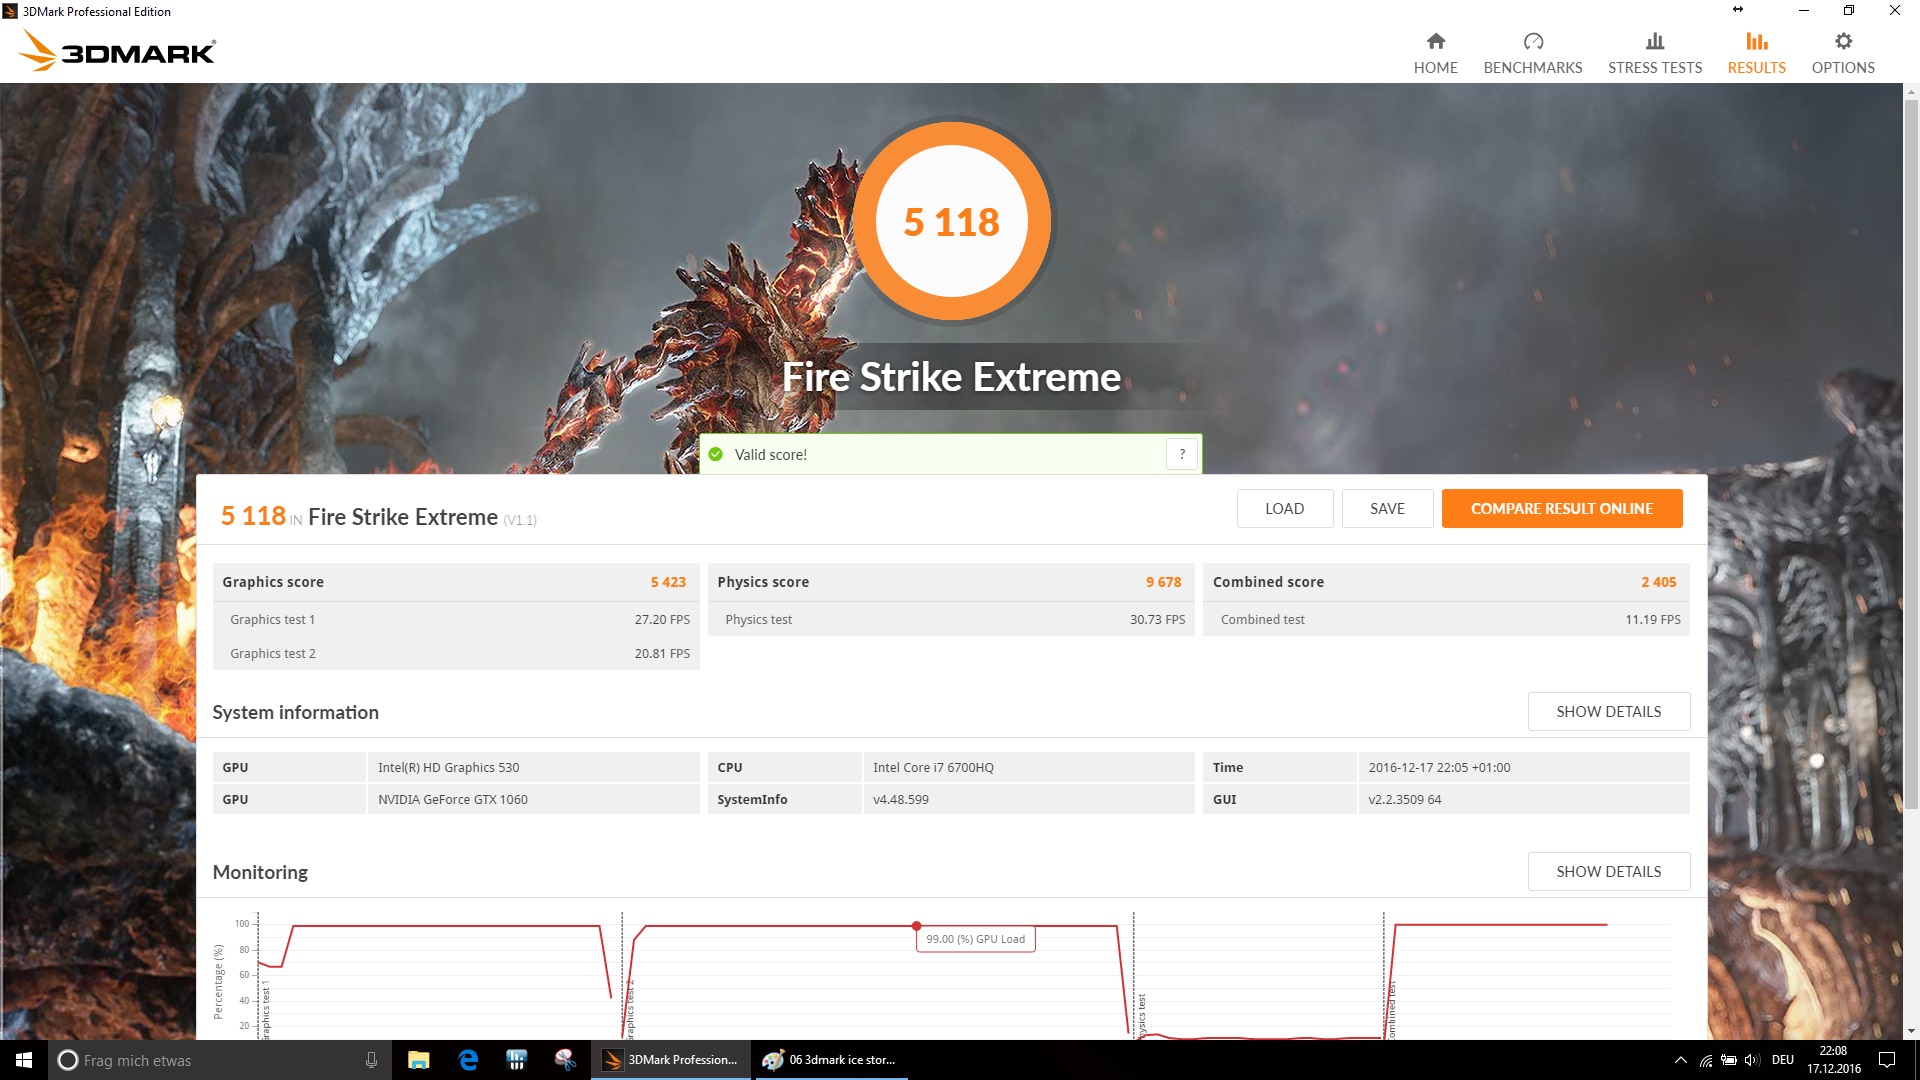
| 3DMark Fire Strike Extreme Score | 5118 punten | |
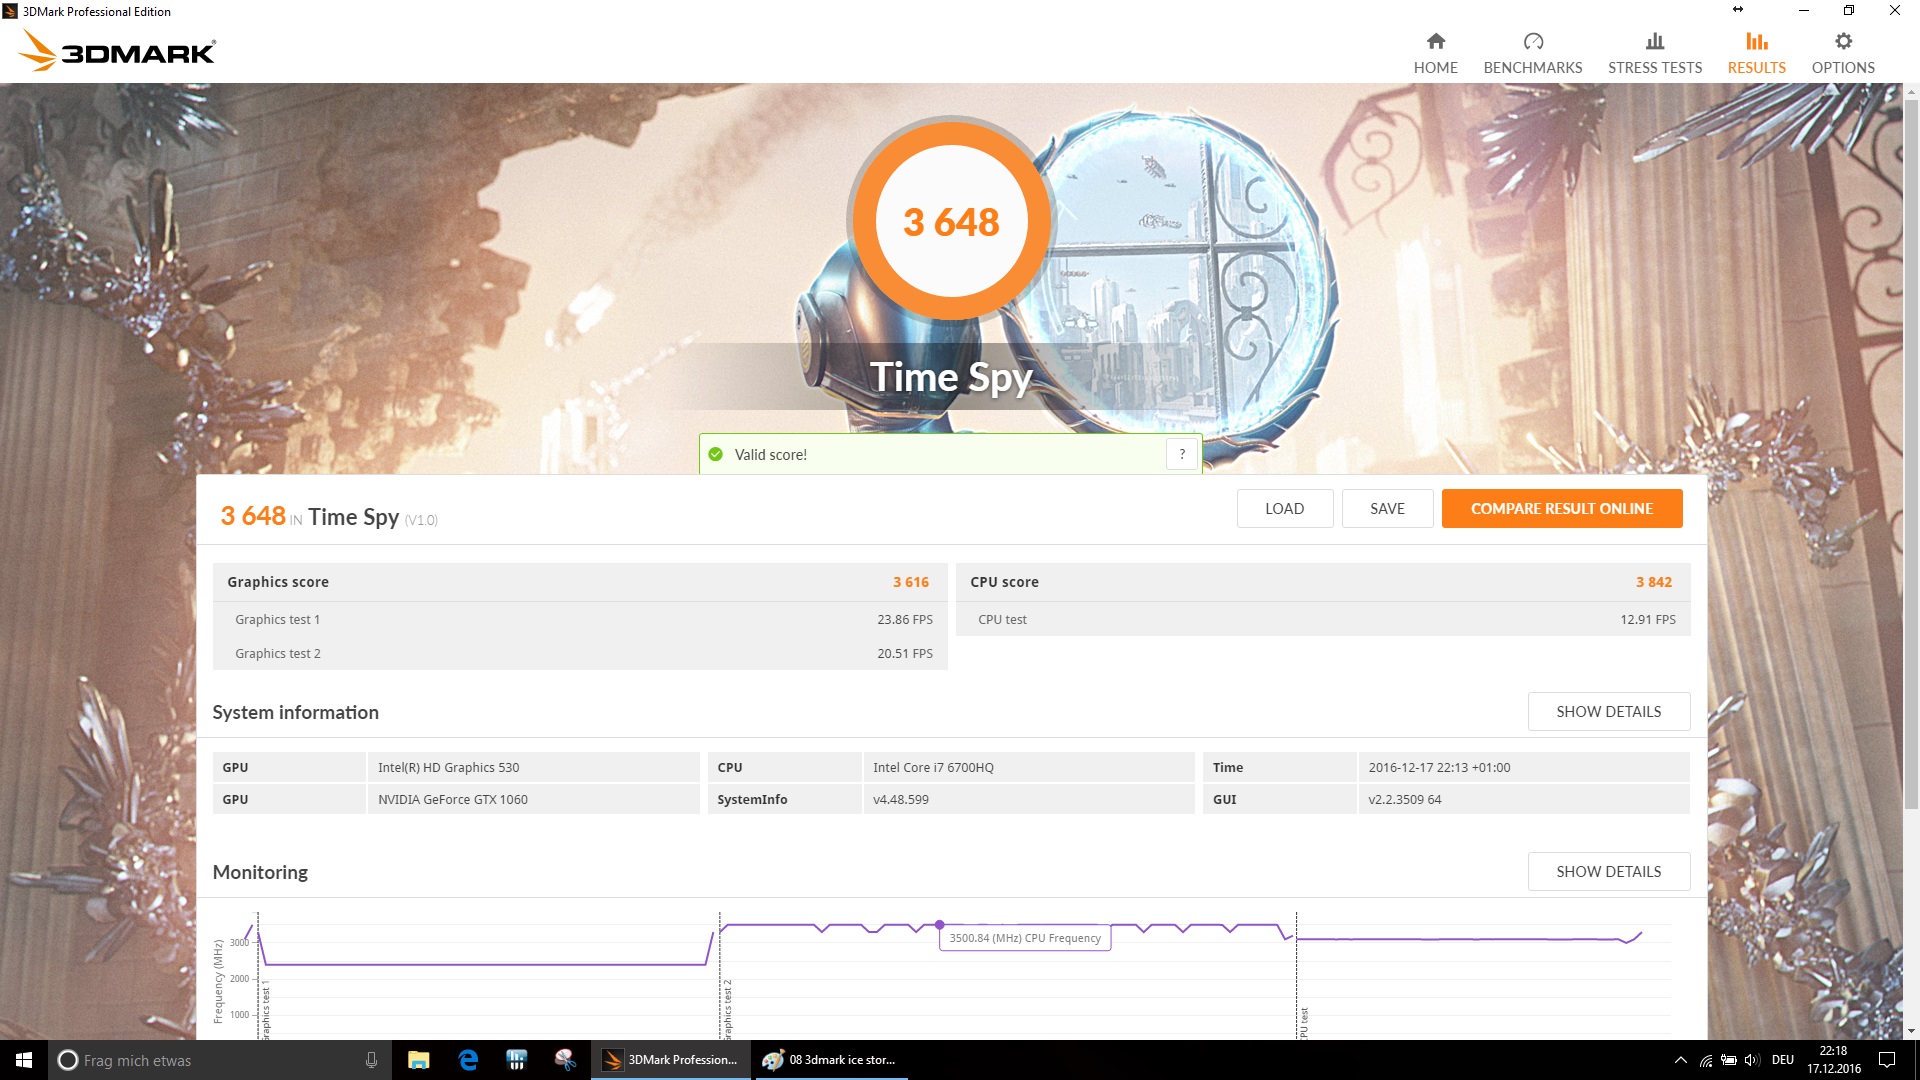
| 3DMark Time Spy Score | 3648 punten | |
Help | ||
| Rise of the Tomb Raider | |
| 1920x1080 High Preset AA:FX AF:4x | |
| Aorus X7 v6 | |
| Acer Predator 17 G9-793-77LG | |
| HP Omen 17-w110ng | |
| Medion Erazer X7849 MD 60292 | |
| MSI GS73VR 6RF | |
| MSI GE72VR-6RF16H21 | |
| 1920x1080 Very High Preset AA:FX AF:16x | |
| Aorus X7 v6 | |
| HP Omen 17-w110ng | |
| Acer Predator 17 G9-793-77LG | |
| Medion Erazer X7849 MD 60292 | |
| MSI GS73VR 6RF | |
| MSI GE72VR-6RF16H21 | |
| Deus Ex Mankind Divided | |
| 1920x1080 High Preset AF:4x | |
| Aorus X7 v6 | |
| Medion Erazer X7849 MD 60292 | |
| MSI GE72VR-6RF16H21 | |
| Asus GL702VM-GC102D | |
| 1920x1080 Ultra Preset AA:2xMS AF:8x | |
| Aorus X7 v6 | |
| Medion Erazer X7849 MD 60292 | |
| MSI GE72VR-6RF16H21 | |
| Asus GL702VM-GC102D | |
| BioShock Infinite | |
| 1366x768 High Preset | |
| Asus GL702VM-GC102D | |
| HP Omen 17-w110ng | |
| MSI GE72VR-6RF16H21 | |
| MSI GS73VR 6RF | |
| 1920x1080 Ultra Preset, DX11 (DDOF) | |
| HP Omen 17-w110ng | |
| MSI GS73VR 6RF | |
| Asus GL702VM-GC102D | |
| MSI GE72VR-6RF16H21 | |
| The Witcher 3 | |
| 1920x1080 High Graphics & Postprocessing (Nvidia HairWorks Off) | |
| Acer Predator 17 G9-793-77LG | |
| HP Omen 17-w110ng | |
| MSI GE72VR-6RF16H21 | |
| 1920x1080 Ultra Graphics & Postprocessing (HBAO+) | |
| Acer Predator 17 G9-793-77LG | |
| HP Omen 17-w110ng | |
| MSI GE72VR-6RF16H21 | |
| lage | gem. | hoge | ultra | 4K | |
| BioShock Infinite (2013) | 181.3 | 175.9 | 159.5 | 98 | |
| The Witcher 3 (2015) | 177 | 135.9 | 66.2 | 37.2 | 24.7 |
| Rise of the Tomb Raider (2016) | 180 | 132.4 | 71.3 | 58.8 | 23.7 |
| Deus Ex Mankind Divided (2016) | 113.9 | 100.3 | 57.1 | 30.1 |

Geluidsniveau
| Onbelast |
| 34 / 35 / 36 dB (A) |
| DVD |
| 41 / dB (A) |
| Belasting |
| 40 / 51 dB (A) |
 | ||
30 dB stil 40 dB(A) hoorbaar 50 dB(A) luid |
||
min: | ||
| MSI GE72VR-6RF16H21 6700HQ, GeForce GTX 1060 Mobile | Asus GL702VM-GC102D 6700HQ, GeForce GTX 1060 Mobile | MSI GS73VR 6RF 6700HQ, GeForce GTX 1060 Mobile | Medion Erazer X7849 MD 60292 6820HK, GeForce GTX 1070 Mobile | HP Omen 17-w110ng 6700HQ, GeForce GTX 1070 Mobile | Acer Predator 17 G9-793-77LG 6700HQ, GeForce GTX 1070 Mobile | Aorus X7 v6 6820HK, GeForce GTX 1070 Mobile | |
|---|---|---|---|---|---|---|---|
| Noise | 7% | 2% | 0% | -1% | -2% | -3% | |
| uit / omgeving * | 31 | 30.5 2% | 28.4 8% | 31.2 -1% | 30 3% | 31 -0% | 30 3% |
| Idle Minimum * | 34 | 31.4 8% | 31.9 6% | 31.2 8% | 33 3% | 33 3% | 33 3% |
| Idle Average * | 35 | 31.4 10% | 32 9% | 32.6 7% | 34 3% | 34 3% | 35 -0% |
| Idle Maximum * | 36 | 31.5 12% | 34 6% | 34.75 3% | 35 3% | 40 -11% | 40 -11% |
| Load Average * | 40 | 40.9 -2% | 47 -18% | 47.8 -20% | 45 -13% | 44 -10% | 43 -8% |
| Load Maximum * | 51 | 46.2 9% | 49.4 3% | 49.7 3% | 52 -2% | 50 2% | 54 -6% |
* ... kleiner is beter
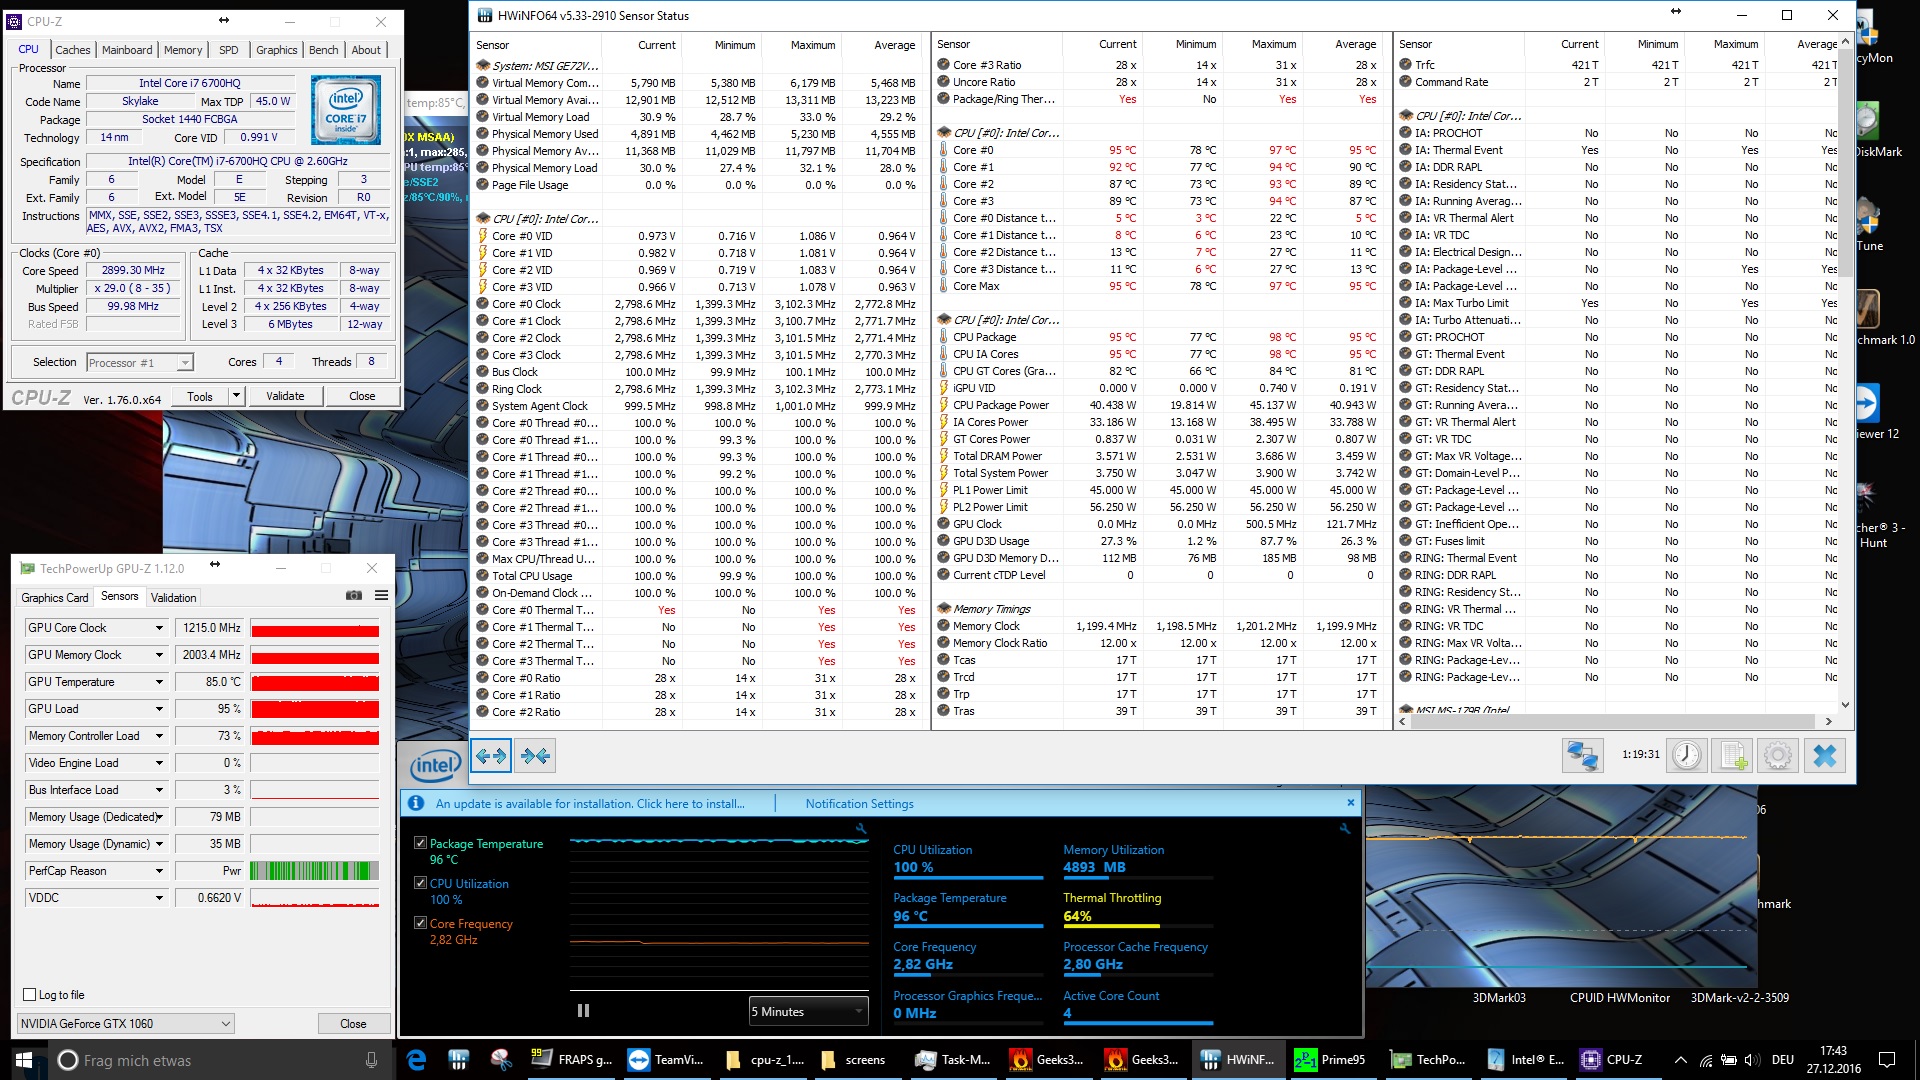
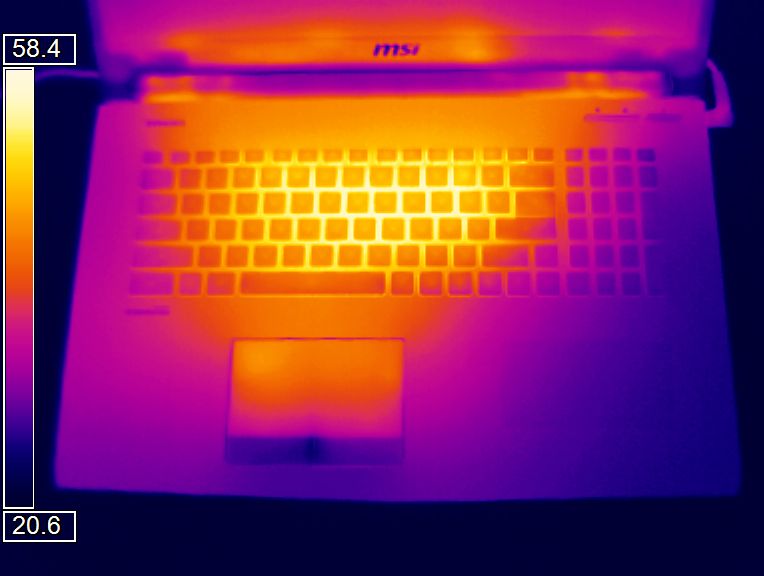

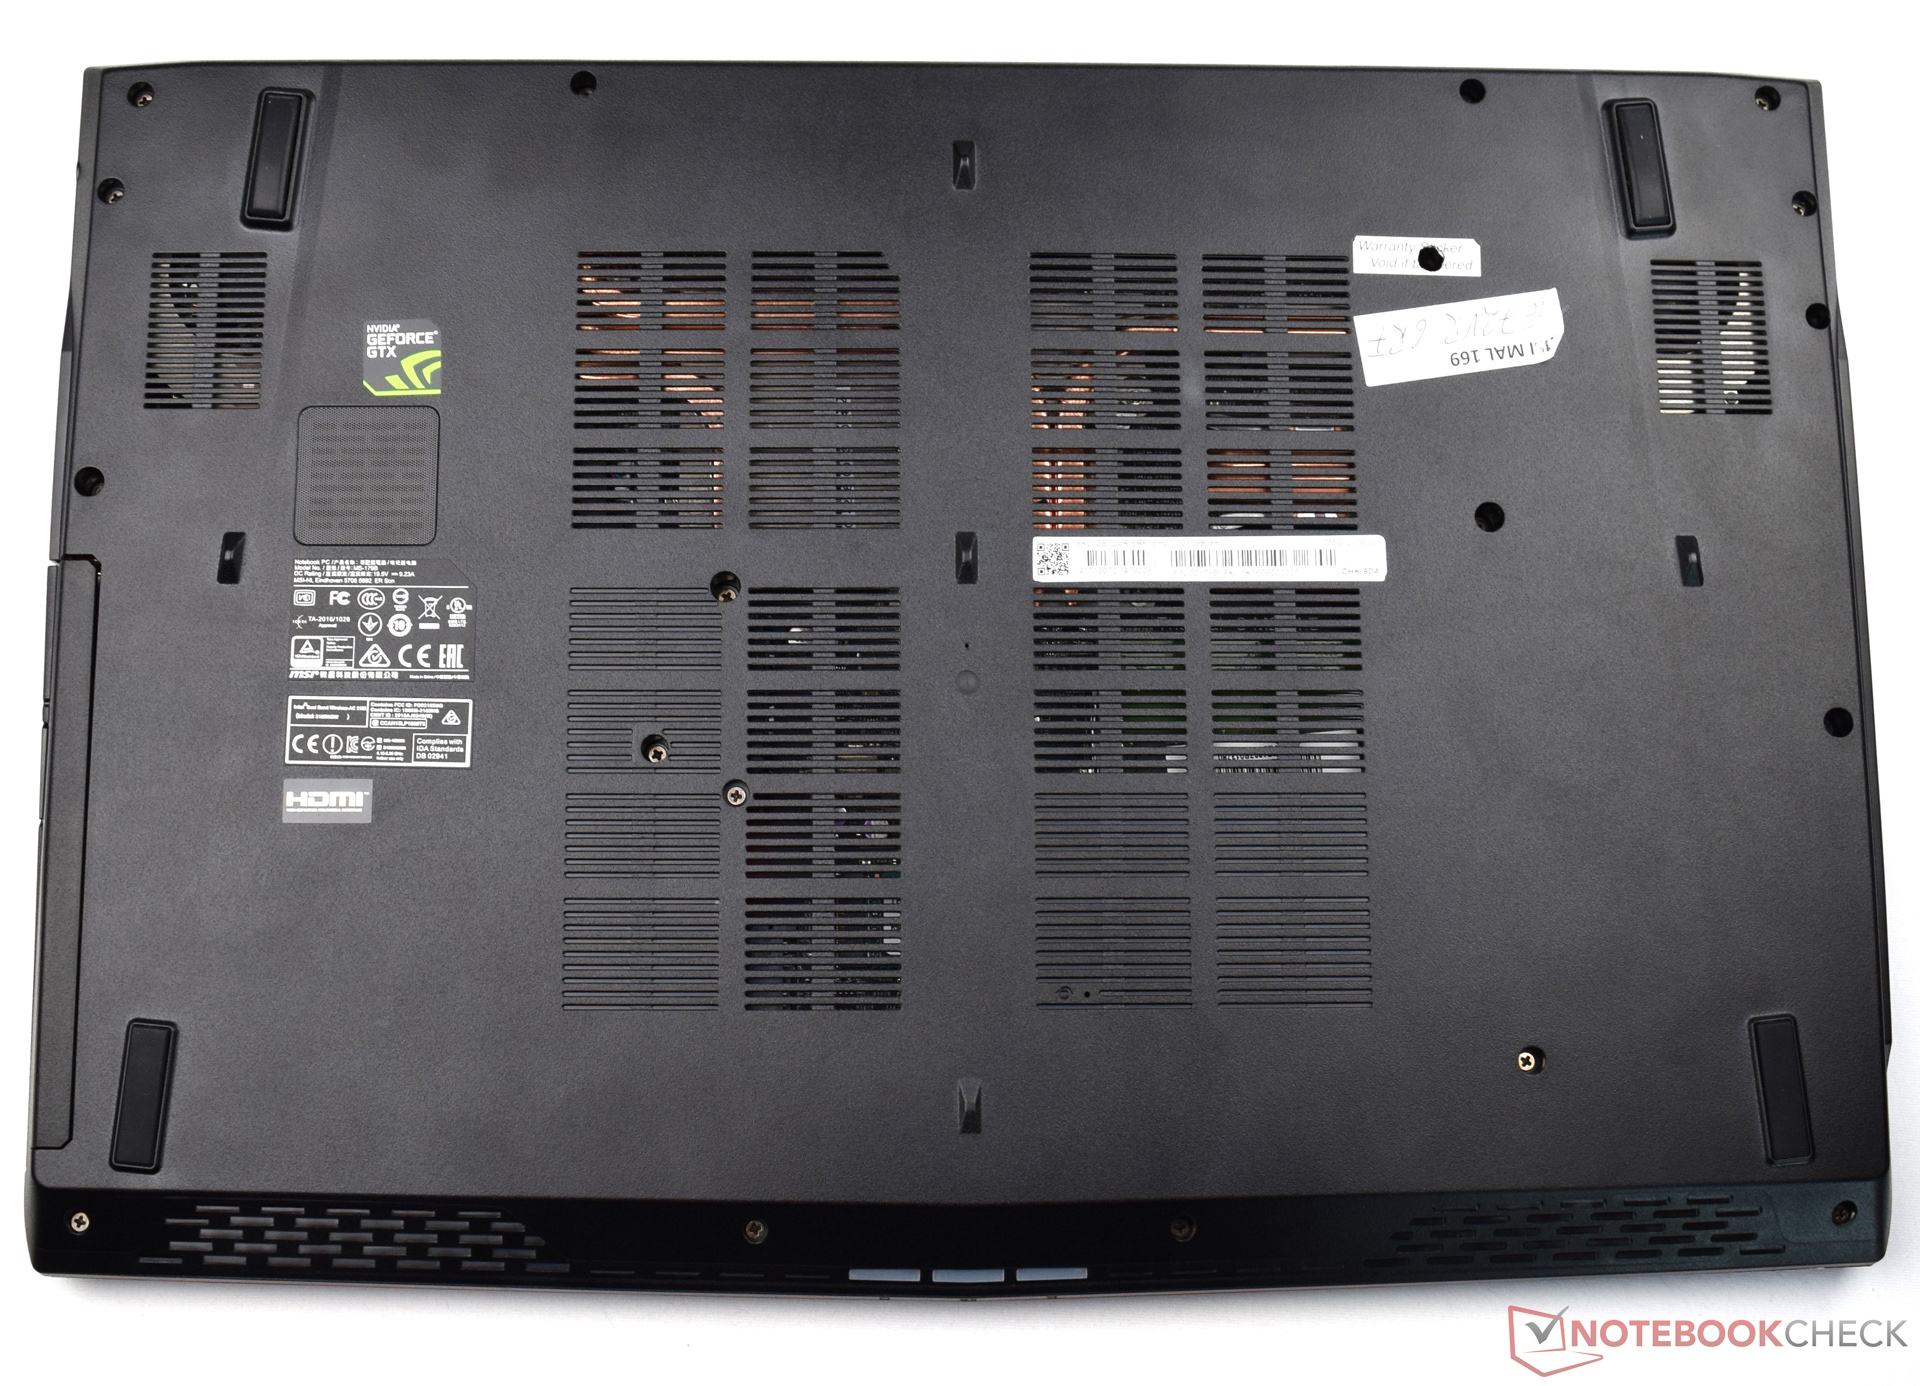
(-) De maximumtemperatuur aan de bovenzijde bedraagt 48.8 °C / 120 F, vergeleken met het gemiddelde van 40.4 °C / 105 F, variërend van 21.2 tot 68.8 °C voor de klasse Gaming.
(-) De bodem warmt op tot een maximum van 48.2 °C / 119 F, vergeleken met een gemiddelde van 43.2 °C / 110 F
(+) Bij onbelast gebruik bedraagt de gemiddelde temperatuur voor de bovenzijde 24.5 °C / 76 F, vergeleken met het apparaatgemiddelde van 33.8 °C / 93 F.
(-) De palmsteunen en het touchpad kunnen zeer heet aanvoelen met een maximum van ###max## °C / 106.9 F.
(-) De gemiddelde temperatuur van de handpalmsteun van soortgelijke toestellen bedroeg 28.9 °C / 84 F (-12.7 °C / -22.9 F).
| MSI GE72VR-6RF16H21 6700HQ, GeForce GTX 1060 Mobile | Asus GL702VM-GC102D 6700HQ, GeForce GTX 1060 Mobile | MSI GS73VR 6RF 6700HQ, GeForce GTX 1060 Mobile | Medion Erazer X7849 MD 60292 6820HK, GeForce GTX 1070 Mobile | HP Omen 17-w110ng 6700HQ, GeForce GTX 1070 Mobile | Acer Predator 17 G9-793-77LG 6700HQ, GeForce GTX 1070 Mobile | Aorus X7 v6 6820HK, GeForce GTX 1070 Mobile | |
|---|---|---|---|---|---|---|---|
| Heat | -5% | -4% | -2% | 1% | 4% | 0% | |
| Maximum Upper Side * | 48.8 | 53.1 -9% | 50.8 -4% | 53.3 -9% | 45 8% | 42.6 13% | 47.5 3% |
| Maximum Bottom * | 48.2 | 44.9 7% | 60 -24% | 50 -4% | 54.3 -13% | 44.9 7% | 54.5 -13% |
| Idle Upper Side * | 30.1 | 32.9 -9% | 27.4 9% | 30.3 -1% | 29.6 2% | 33.1 -10% | 28.6 5% |
| Idle Bottom * | 30.4 | 33.4 -10% | 28.8 5% | 28 8% | 28.6 6% | 28.9 5% | 28.8 5% |
* ... kleiner is beter
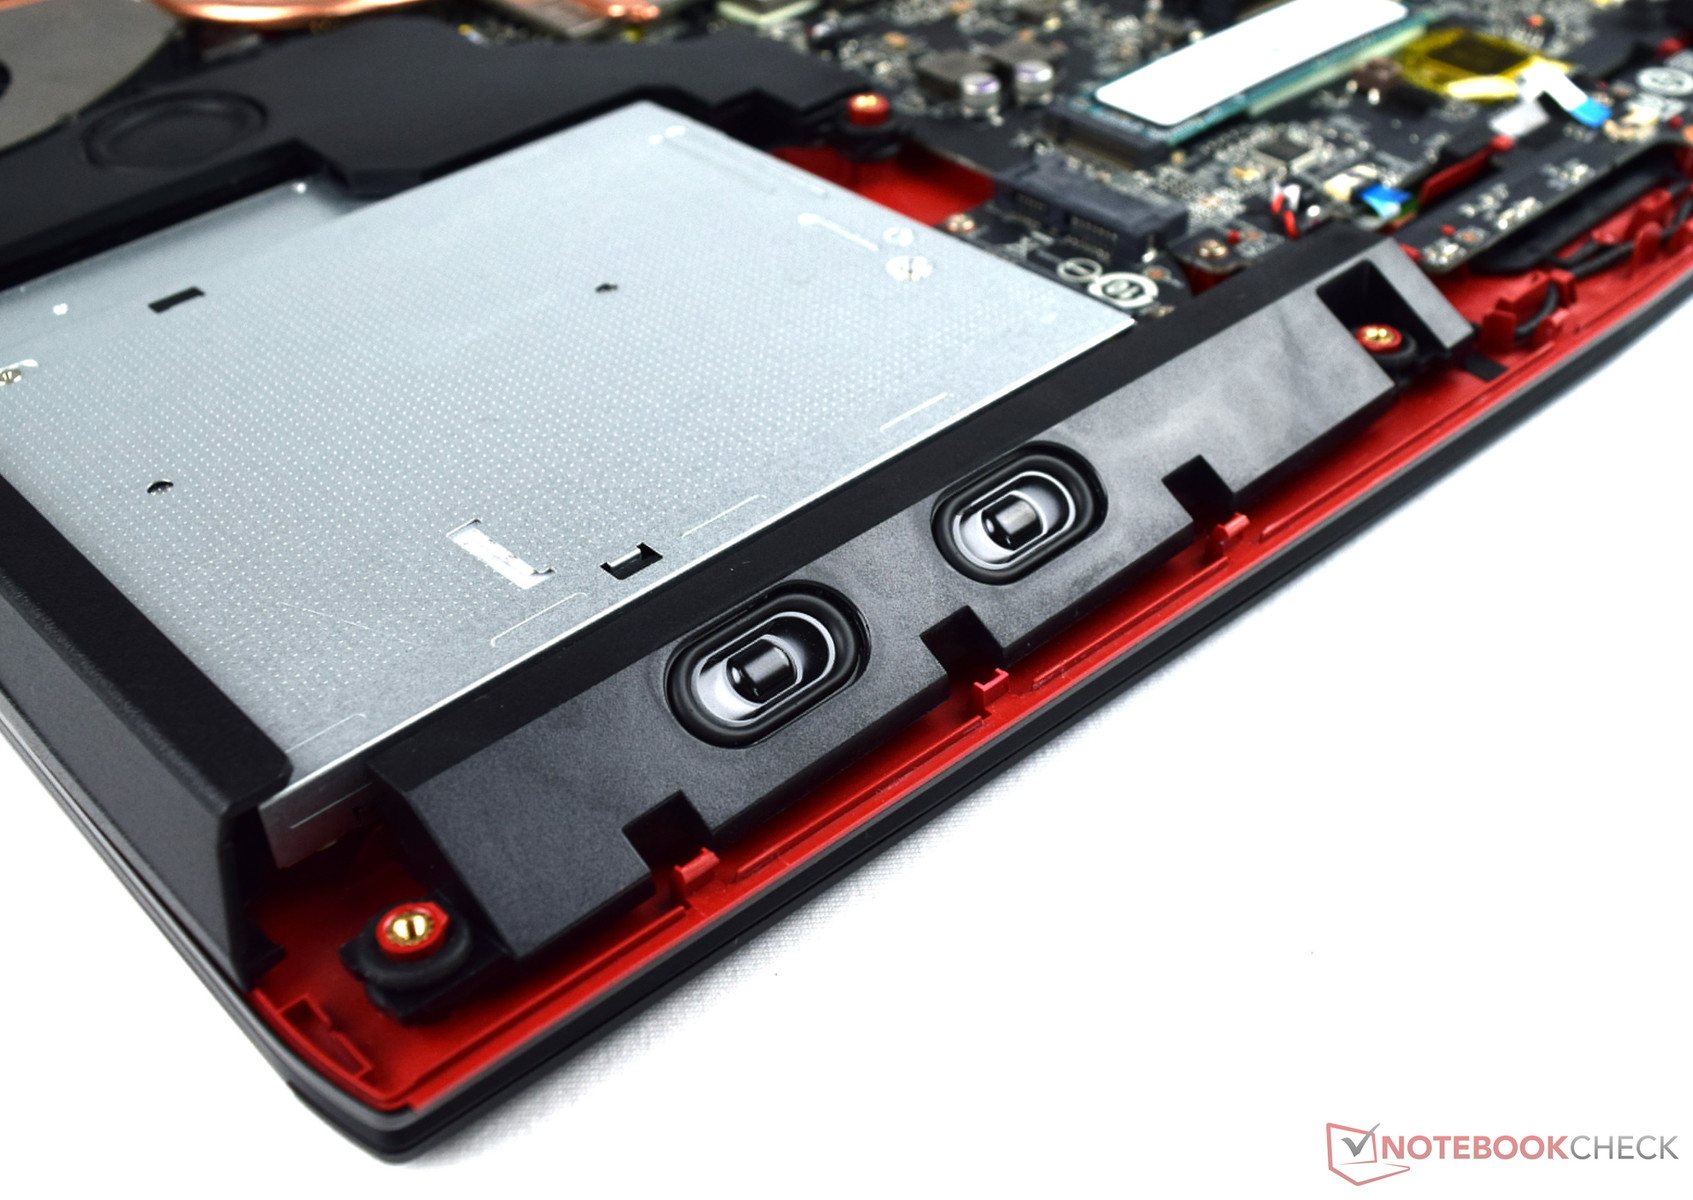
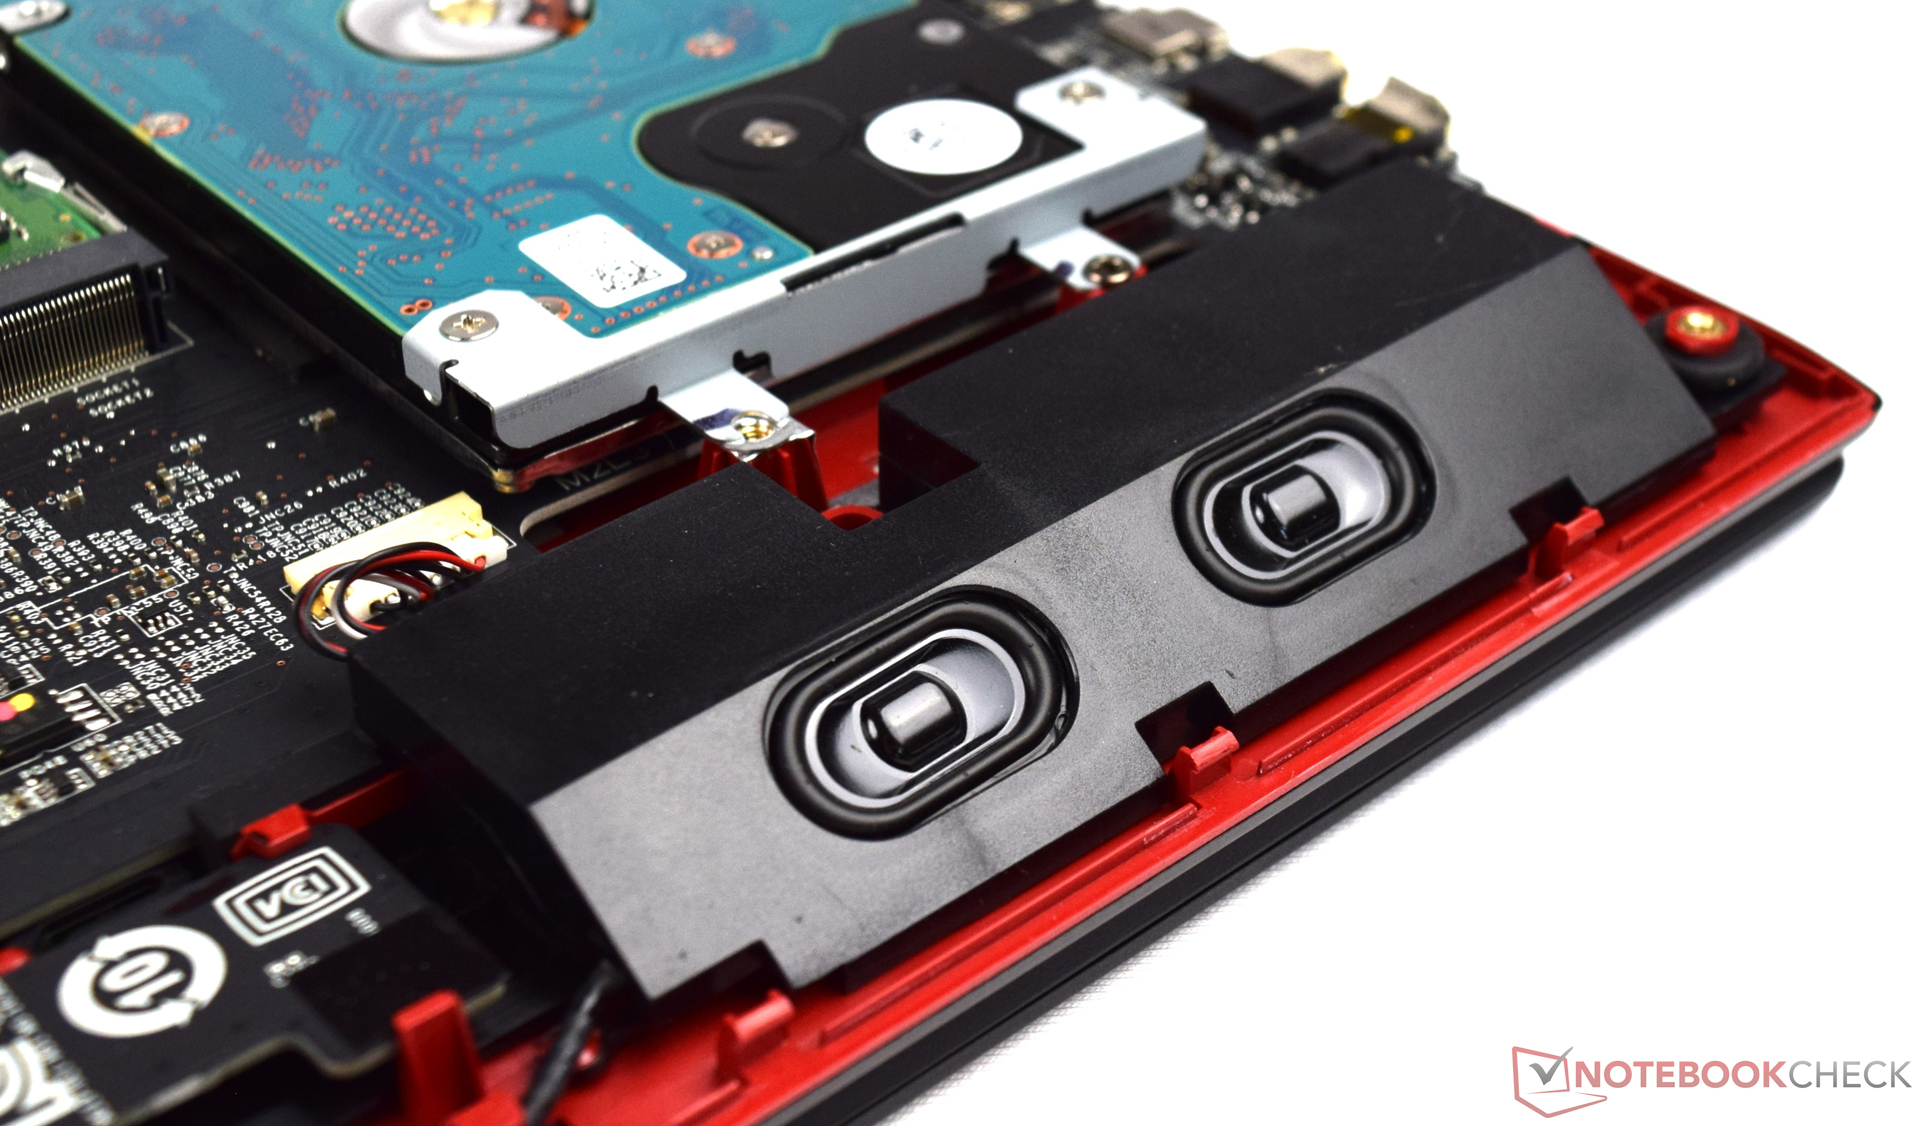

MSI GE72VR-6RF16H21 audioanalyse
(+) | luidsprekers kunnen relatief luid spelen (92 dB)
Bas 100 - 315 Hz
(±) | verminderde zeebaars - gemiddeld 14.4% lager dan de mediaan
(±) | lineariteit van de lage tonen is gemiddeld (9.3% delta ten opzichte van de vorige frequentie)
Mids 400 - 2000 Hz
(+) | evenwichtige middens - slechts 2.6% verwijderd van de mediaan
(+) | de middentonen zijn lineair (3.3% delta ten opzichte van de vorige frequentie)
Hoog 2 - 16 kHz
(+) | evenwichtige hoogtepunten - slechts 3.1% verwijderd van de mediaan
(+) | de hoge tonen zijn lineair (6.5% delta naar de vorige frequentie)
Algemeen 100 - 16.000 Hz
(+) | het totale geluid is lineair (12.2% verschil met de mediaan)
Vergeleken met dezelfde klasse
» 11% van alle geteste apparaten in deze klasse waren beter, 4% vergelijkbaar, 85% slechter
» De beste had een delta van 6%, het gemiddelde was 18%, de slechtste was 132%
Vergeleken met alle geteste toestellen
» 7% van alle geteste apparaten waren beter, 2% gelijk, 91% slechter
» De beste had een delta van 4%, het gemiddelde was 25%, de slechtste was 134%
HP Omen 17-w110ng audioanalyse
(+) | luidsprekers kunnen relatief luid spelen (85 dB)
Bas 100 - 315 Hz
(-) | bijna geen lage tonen - gemiddeld 22.3% lager dan de mediaan
(±) | lineariteit van de lage tonen is gemiddeld (13.2% delta ten opzichte van de vorige frequentie)
Mids 400 - 2000 Hz
(+) | evenwichtige middens - slechts 2.7% verwijderd van de mediaan
(+) | de middentonen zijn lineair (4.9% delta ten opzichte van de vorige frequentie)
Hoog 2 - 16 kHz
(±) | higher highs - on average 5.9% higher than median
(+) | de hoge tonen zijn lineair (5.3% delta naar de vorige frequentie)
Algemeen 100 - 16.000 Hz
(±) | lineariteit van het totale geluid is gemiddeld (18.5% verschil met de mediaan)
Vergeleken met dezelfde klasse
» 57% van alle geteste apparaten in deze klasse waren beter, 9% vergelijkbaar, 35% slechter
» De beste had een delta van 6%, het gemiddelde was 18%, de slechtste was 132%
Vergeleken met alle geteste toestellen
» 36% van alle geteste apparaten waren beter, 8% gelijk, 56% slechter
» De beste had een delta van 4%, het gemiddelde was 25%, de slechtste was 134%
| Uit / Standby | |
| Inactief | |
| Belasting |
|
| MSI GE72VR-6RF16H21 6700HQ, GeForce GTX 1060 Mobile | Asus GL702VM-GC102D 6700HQ, GeForce GTX 1060 Mobile | MSI GS73VR 6RF 6700HQ, GeForce GTX 1060 Mobile | Medion Erazer X7849 MD 60292 6820HK, GeForce GTX 1070 Mobile | HP Omen 17-w110ng 6700HQ, GeForce GTX 1070 Mobile | Acer Predator 17 G9-793-77LG 6700HQ, GeForce GTX 1070 Mobile | Aorus X7 v6 6820HK, GeForce GTX 1070 Mobile | |
|---|---|---|---|---|---|---|---|
| Power Consumption | 0% | -40% | -10% | -22% | -60% | -62% | |
| Idle Minimum * | 13 | 15.6 -20% | 22.6 -74% | 14 -8% | 19 -46% | 25 -92% | 29 -123% |
| Idle Average * | 20 | 20.2 -1% | 32.7 -64% | 20 -0% | 25 -25% | 35 -75% | 31 -55% |
| Idle Maximum * | 26 | 21.4 18% | 32.8 -26% | 23.8 8% | 31 -19% | 46 -77% | 38 -46% |
| Load Average * | 83 | 90 -8% | 114.7 -38% | 103 -24% | 90 -8% | 103 -24% | 111 -34% |
| Load Maximum * | 169 | 147 13% | 167.9 1% | 212 -25% | 193 -14% | 223 -32% | 253 -50% |
* ... kleiner is beter

| MSI GE72VR-6RF16H21 51 Wh | Asus GL702VM-GC102D 76 Wh | MSI GS73VR 6RF 65 Wh | Medion Erazer X7849 MD 60292 60 Wh | HP Omen 17-w110ng 95 Wh | Acer Predator 17 G9-793-77LG 88 Wh | Aorus X7 v6 94 Wh | |
|---|---|---|---|---|---|---|---|
| Batterijduur | 90% | 65% | -3% | 112% | 69% | 28% | |
| Reader / Idle | 196 | 353 80% | 353 80% | 163 -17% | 432 120% | 278 42% | |
| H.264 | 140 | 262 87% | 233 66% | ||||
| WiFi v1.3 | 142 | 250 76% | 213 50% | 91 -36% | 247 74% | 200 41% | 182 28% |
| Load | 40 | 87 118% | 66 65% | 57 43% | 115 188% | 89 123% |
Pro
Contra

Dit is de verkorte versie van het originele artikel. Het volledige, Engelse testrapport vind je hier.
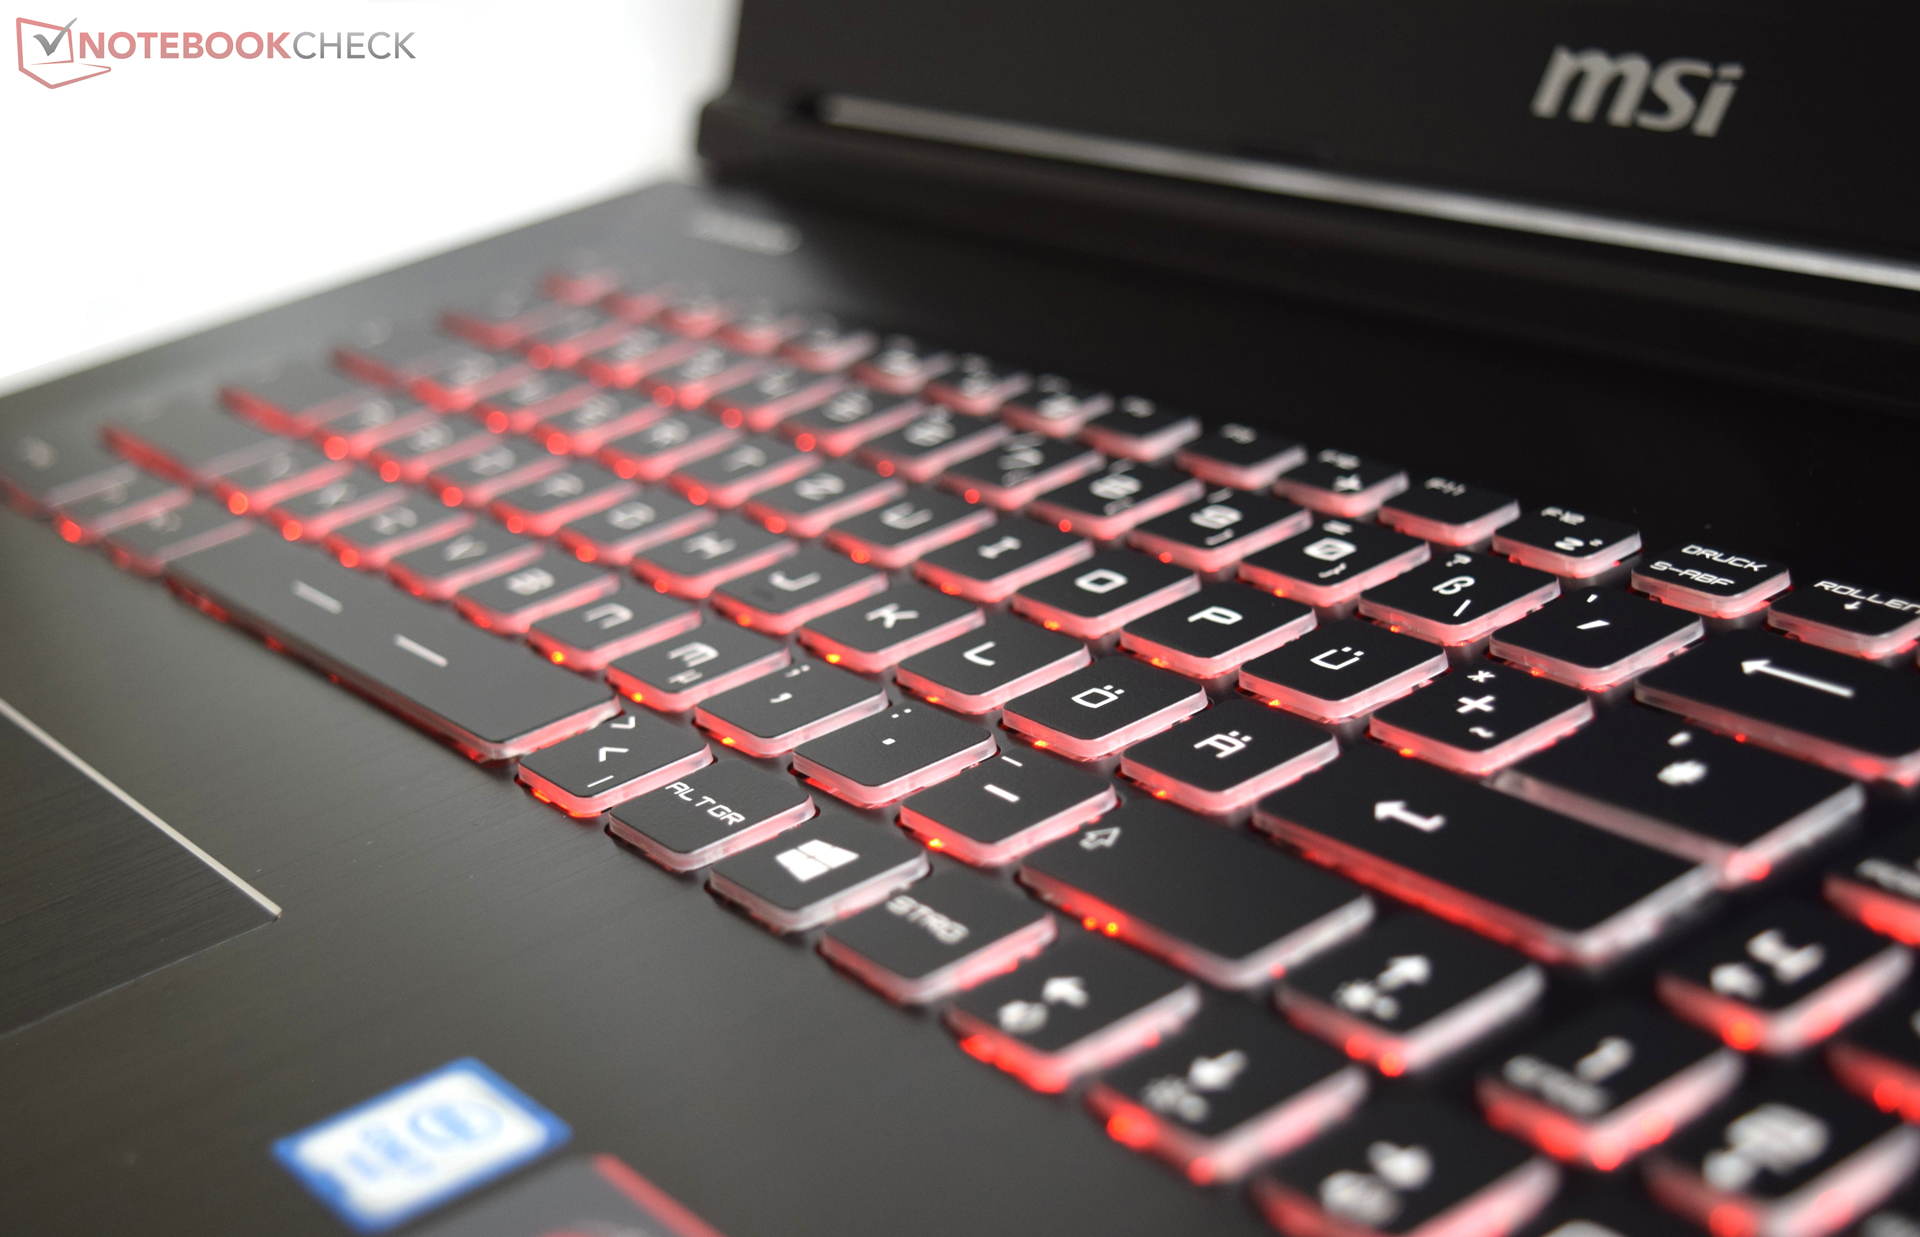
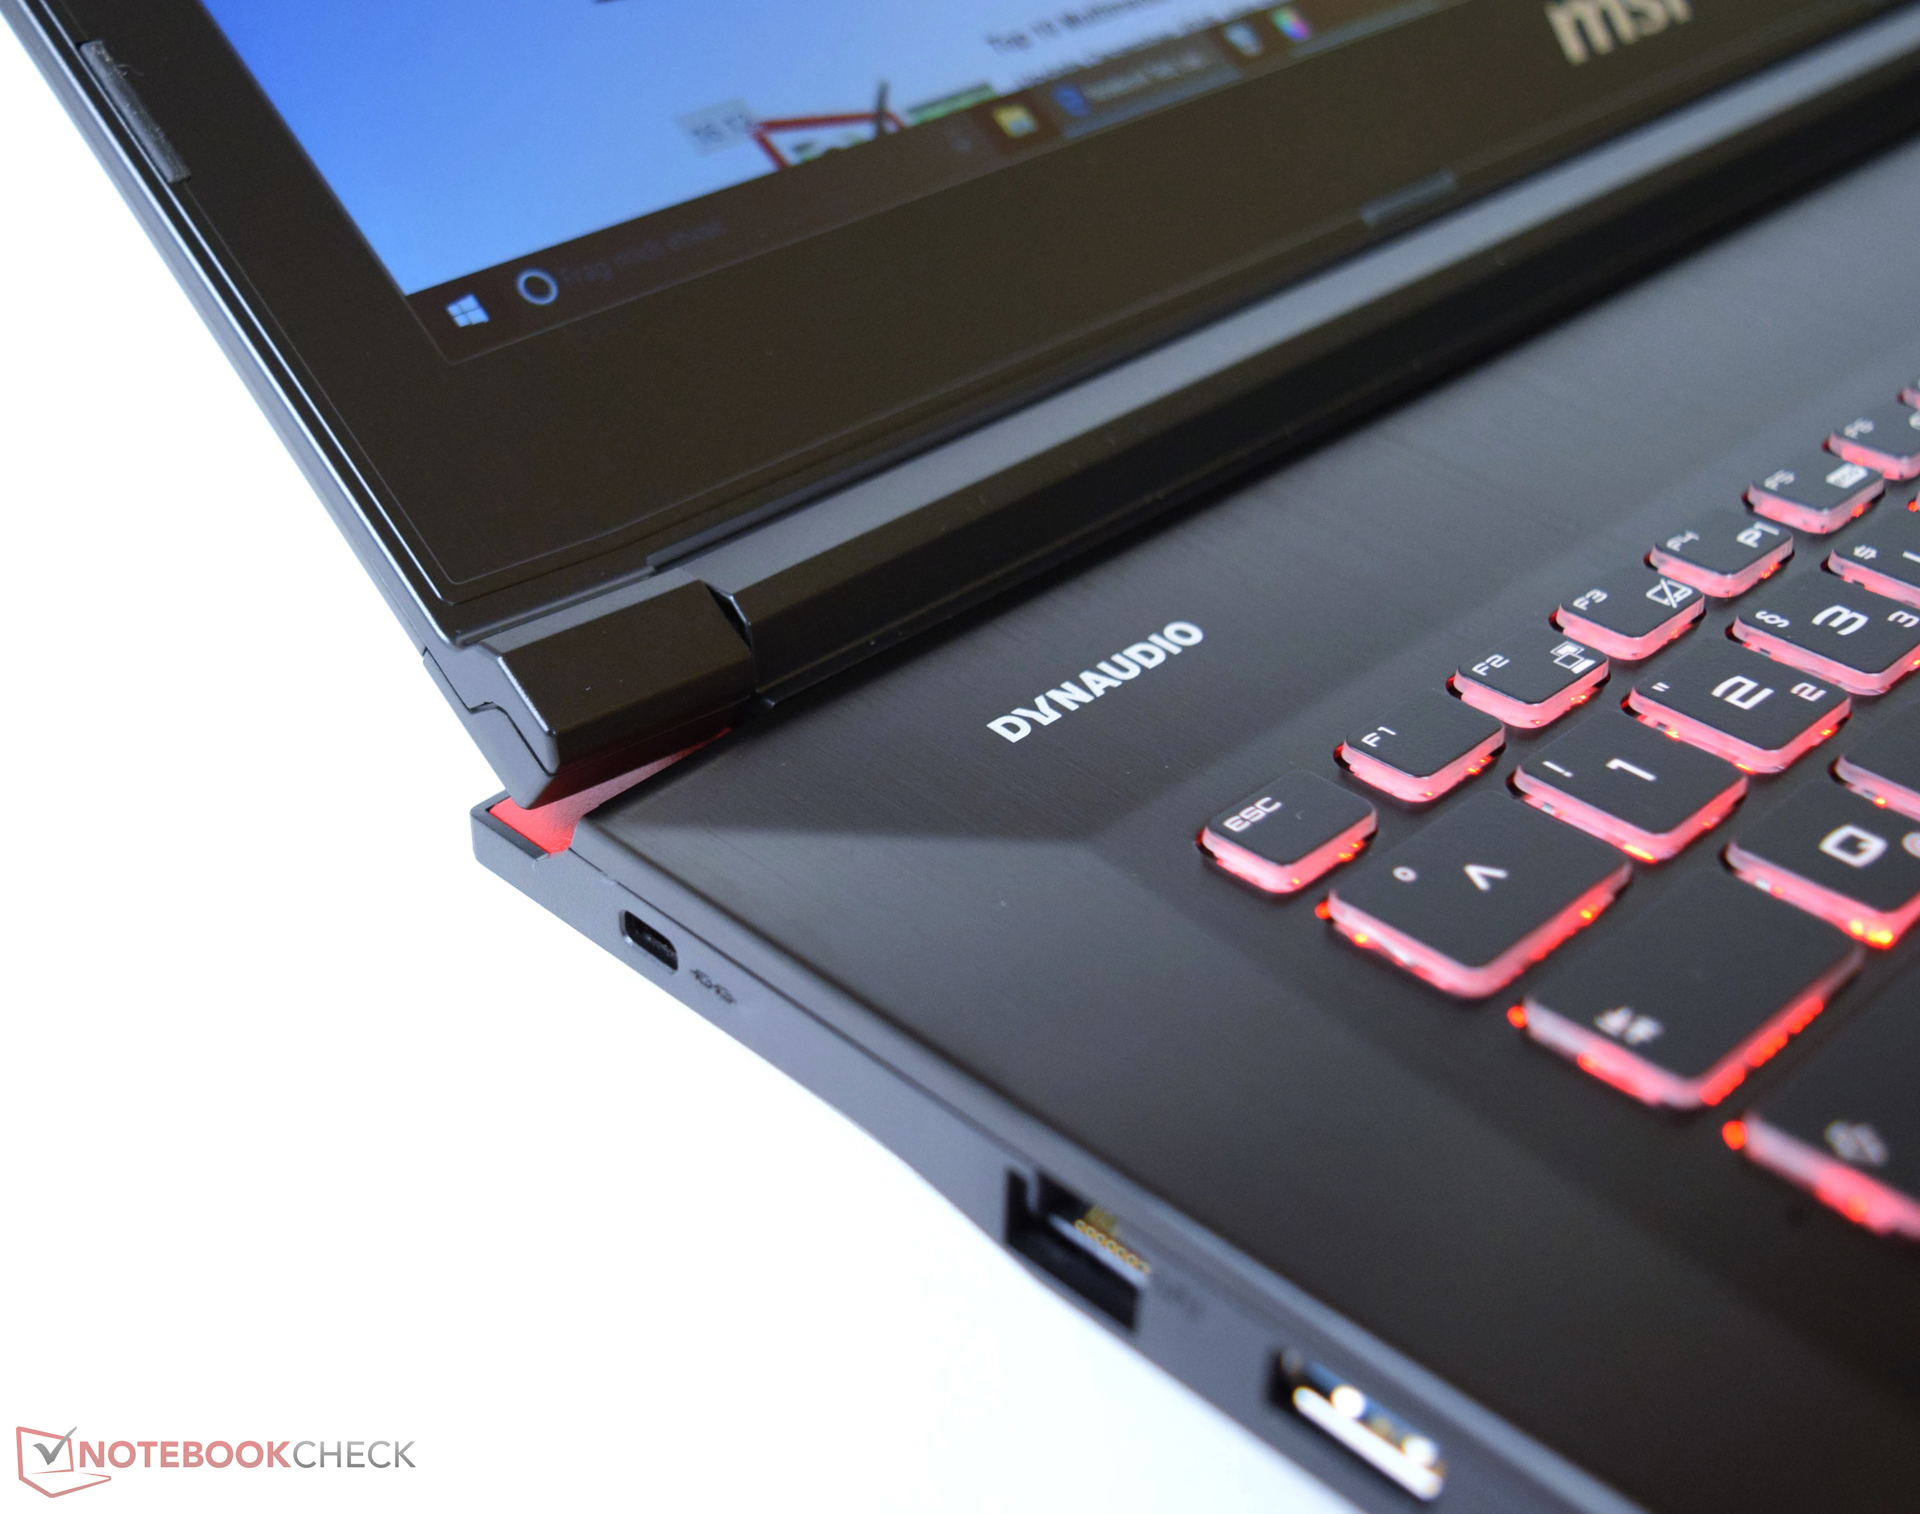
MSI biedt veel goede high-end modellen. Niet iedereen is echter bereidt om 2.000 EUR uit te geven aan een laptop. Met de GE72VR richt de fabrikant zich op de bovenste regionen van de middenklasse en vraagt 1.750 EUR voor de geteste configuratie. Ons testmodel wint het echter niet qua prijs/prestatie-verhouding, omdat de HP Omen (Pascal) in dezelfde prijsklasse valt en beschikt over een aanzienlijk snellere GPU, een GeForce GTX 1070. De 17-inch laptop scoort met name veel punten met zijn elegante en slanke ontwerp en goede bouwkwaliteit. Ook het 120 Hz beeldscherm moet je niet negeren, daar het een unieke eigenschap is en ondanks de TN-technologie erg goed presteert. Extra's zoals het verlichte toetsenbord en de Dragon Center software van MSI zijn goed en wat ons betreft blijvers.
De kopers van de GE72VR krijgen een solide game notebook met voldoende prestaties voor huidige games. Details en leuke extra's maken het pakket compleet. Daarnaast zullen gamers in hun sas zijn met het 120 Hz paneel.
Naast alle positieve indrukken zijn er ook enkele punten van kritiek. Het ietwat kleine oppervlakte van het touchpad maakt multi-touch (bijv. zoomen) moeilijker. Ook zijn we kritisch over de slechte batterijlevensduur. Misschien zal de fabrikant voor toekomstige versies overwegen om de batterijcapaciteit te verhogen en zo het notebook veelzijdiger te maken.
MSI GE72VR-6RF16H21
-
29-12-2016 v6(old)
Sebastian Bade