 Deutsch
 English
 Español
 Français
 Italiano
 Nederlands
 Polski
 Português
 Русский
 Türkçe
 Svenska
 Chinese
 Magyar
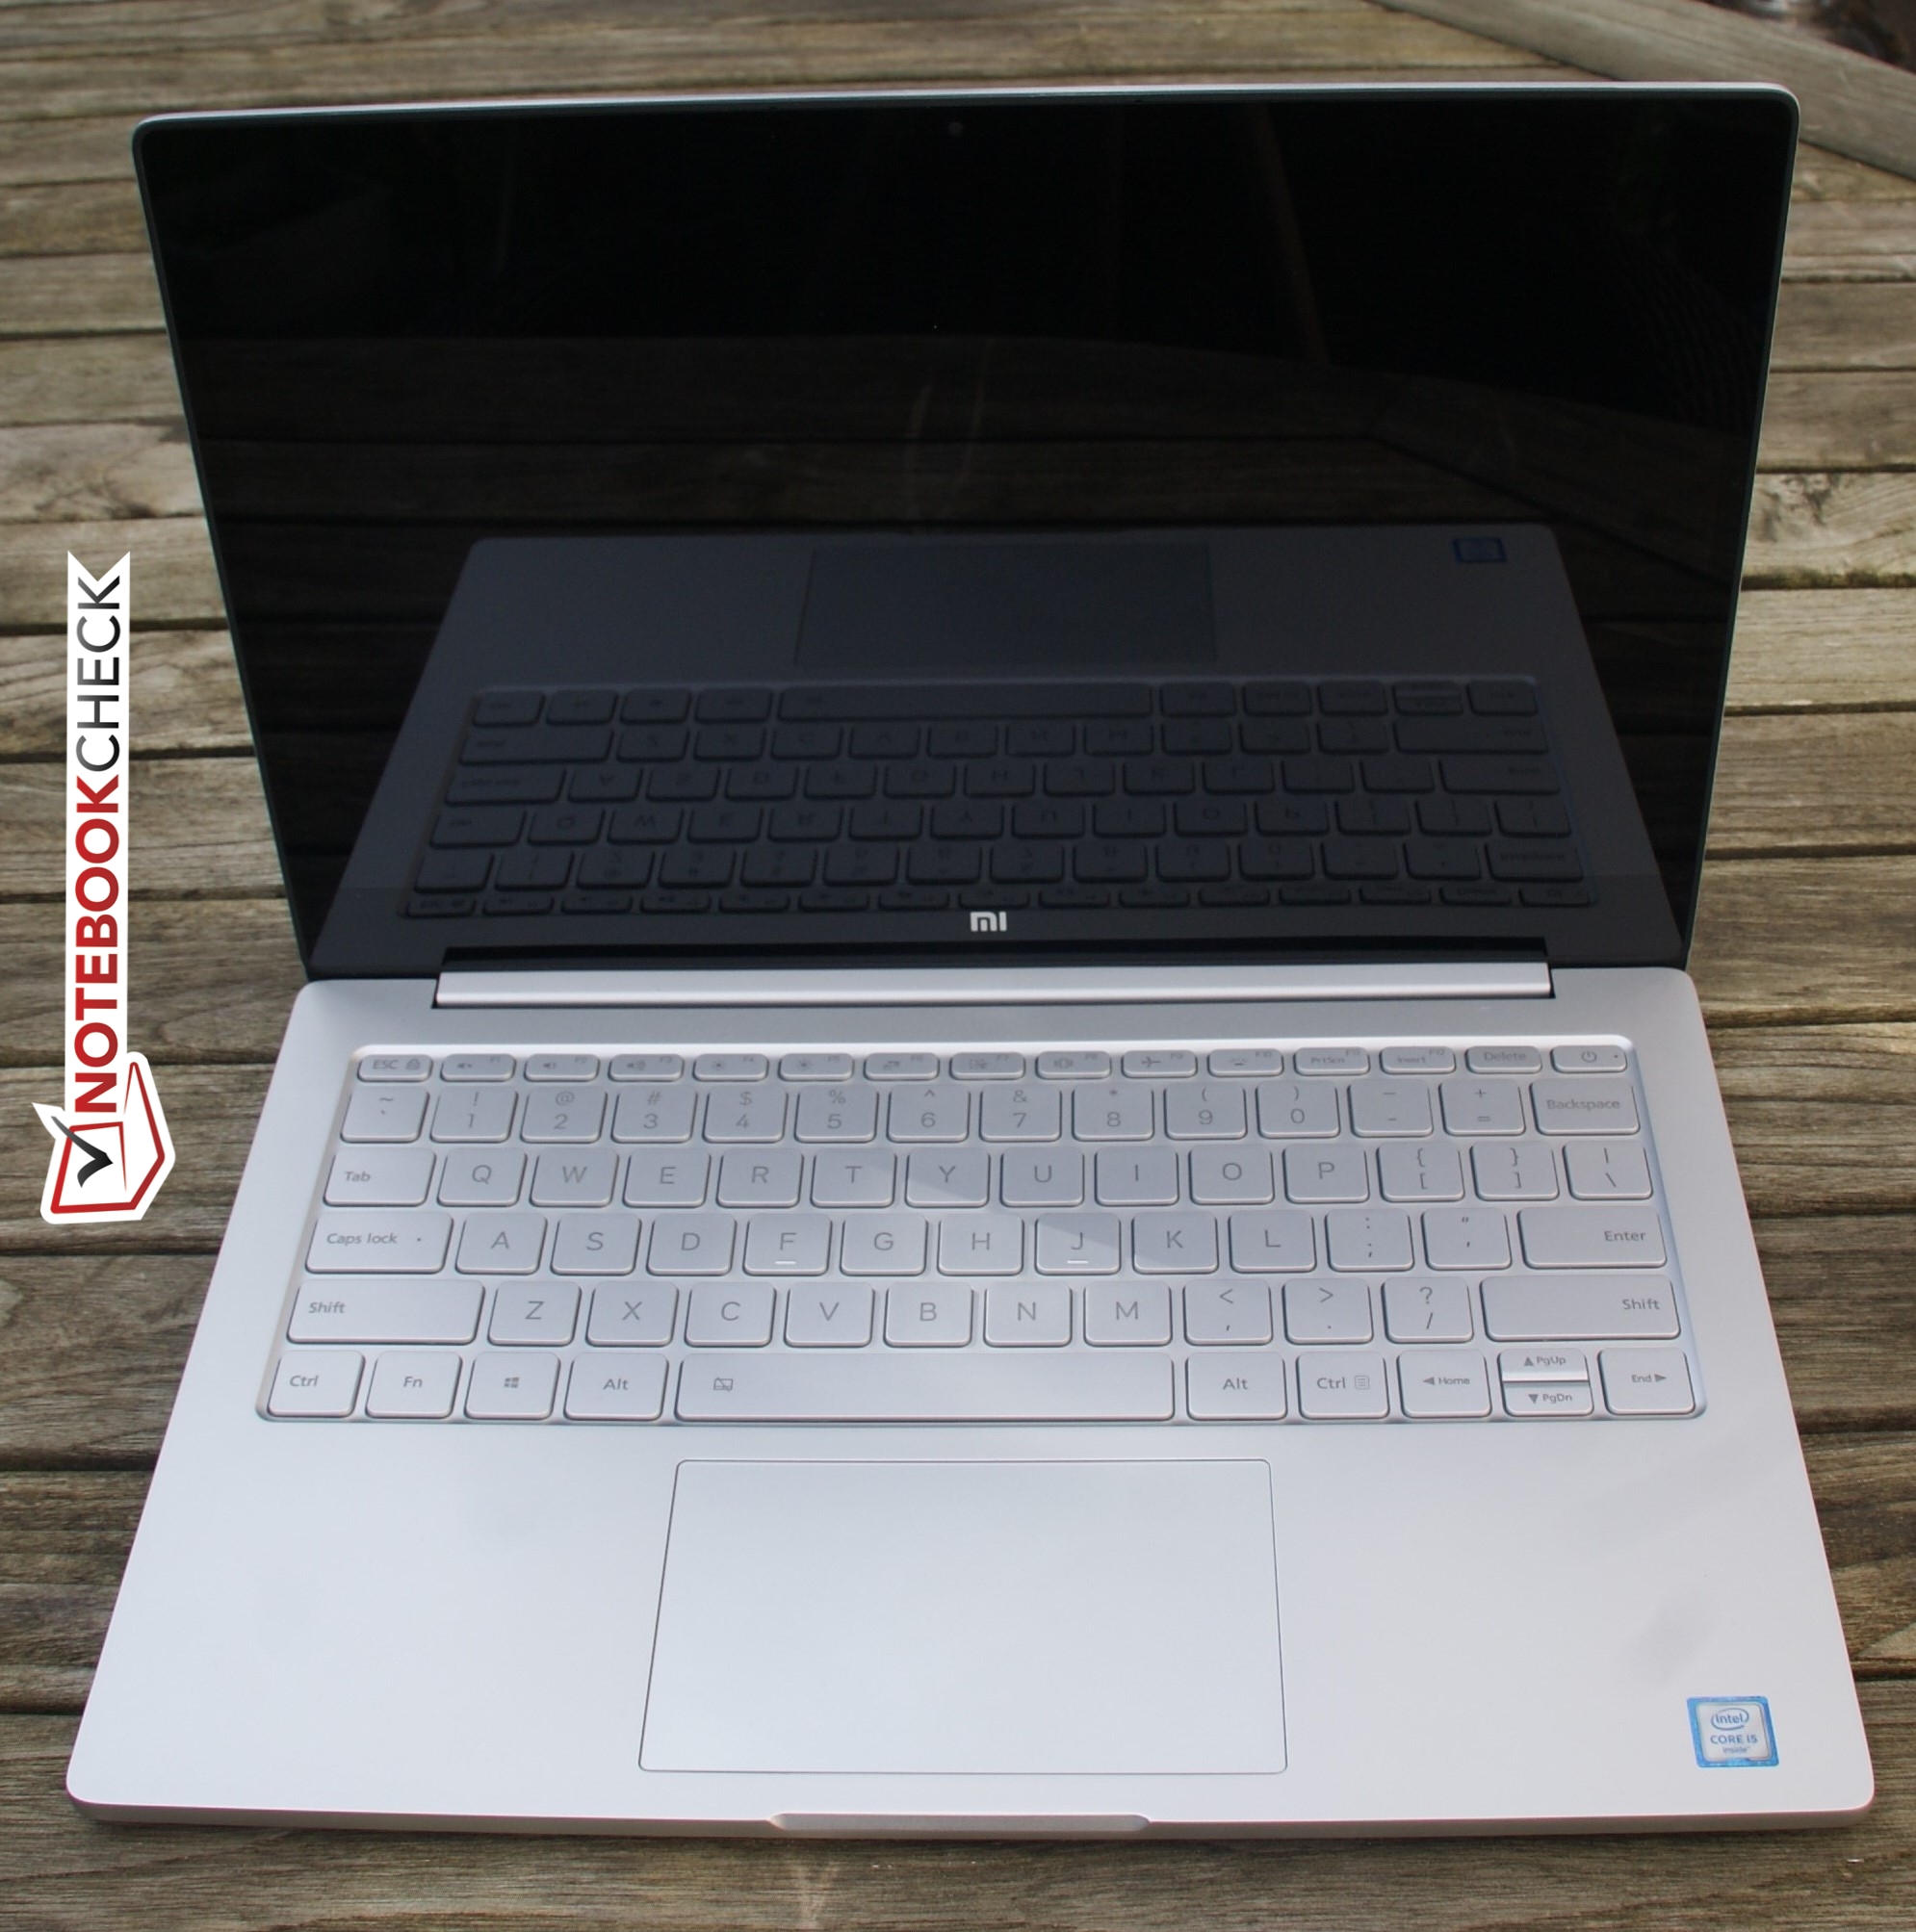
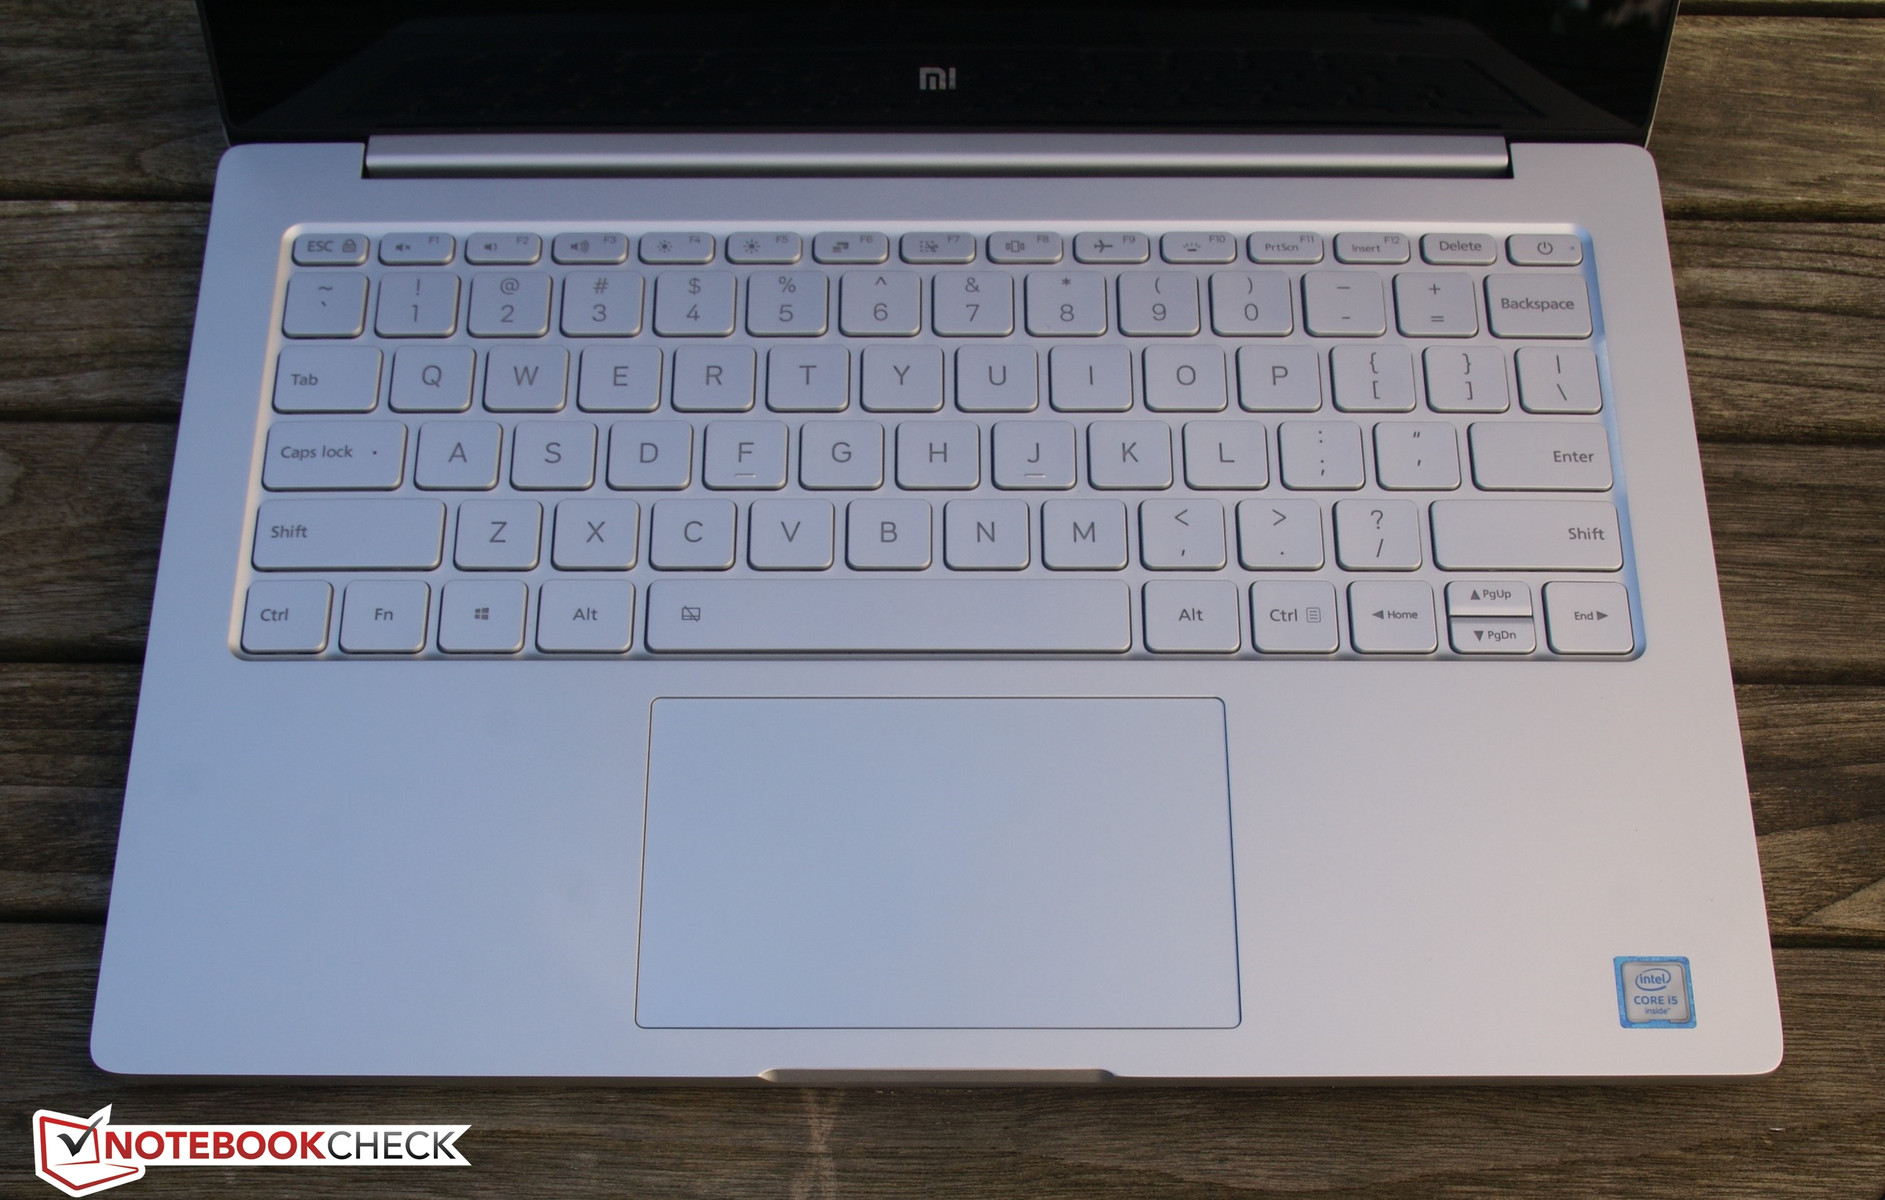
Xiaomi Mi Air (13.3-inch) Notebook Review
| Networking | |
| iperf Server (receive) TCP 1 m | |
| Xiaomi Mi Notebook Air 13.3 2016 | |
| Acer TravelMate X3 X349-M-7261 (jseb) | |
| Medion Akoya S3409-MD60234 (jseb) | |
| iperf Client (transmit) TCP 1 m | |
| Acer TravelMate X3 X349-M-7261 (jseb) | |
| Xiaomi Mi Notebook Air 13.3 2016 | |
| Medion Akoya S3409-MD60234 (jseb) | |
| |||||||||||||||||||||||||
Helderheidsverdeling: 80 %
Helderheid in Batterij-modus: 347 cd/m²
Contrast: 1285:1 (Zwart: 0.27 cd/m²)
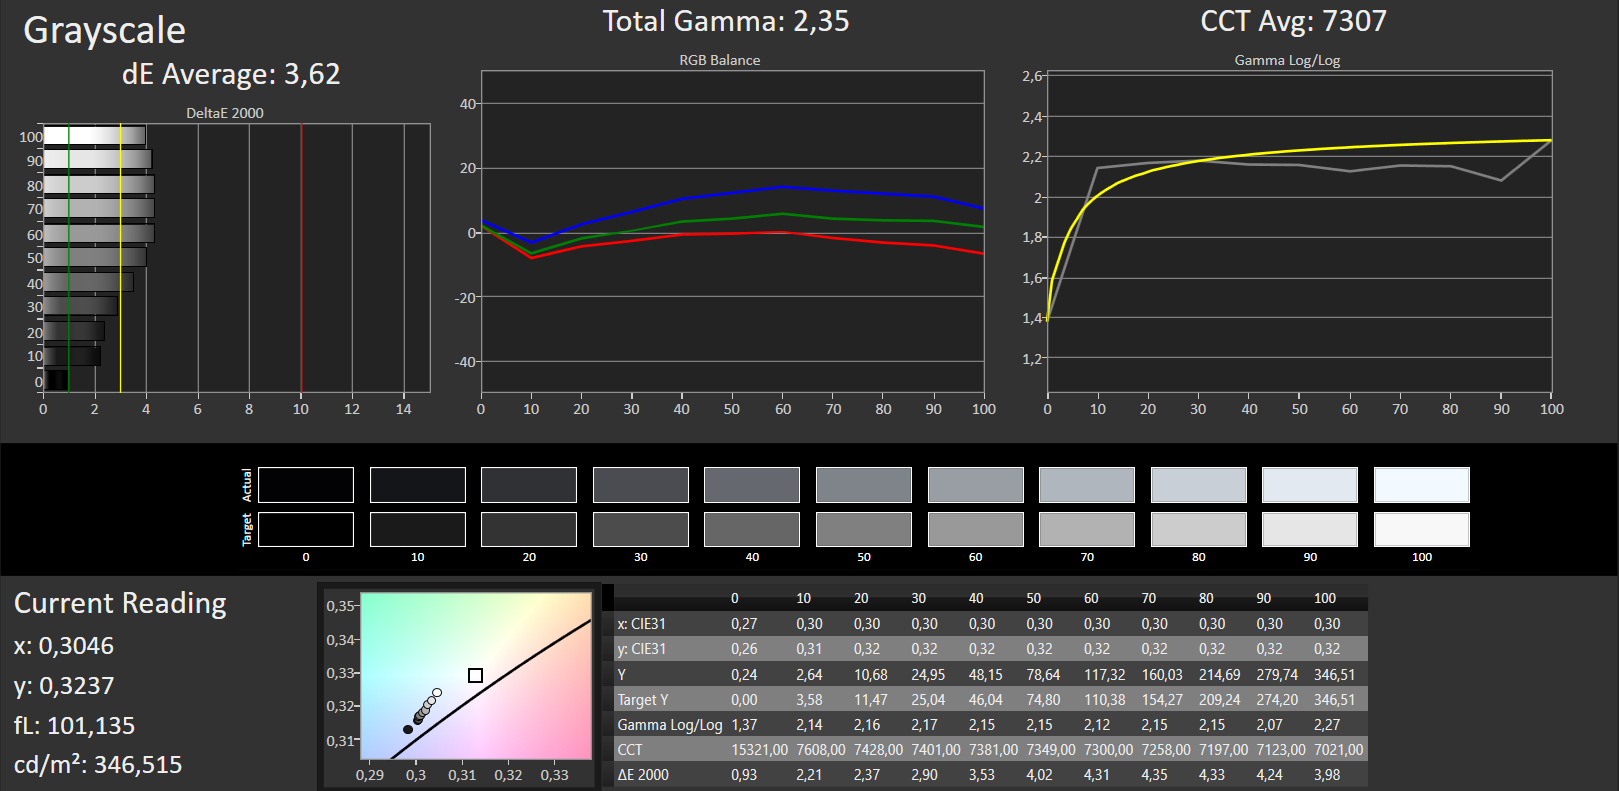
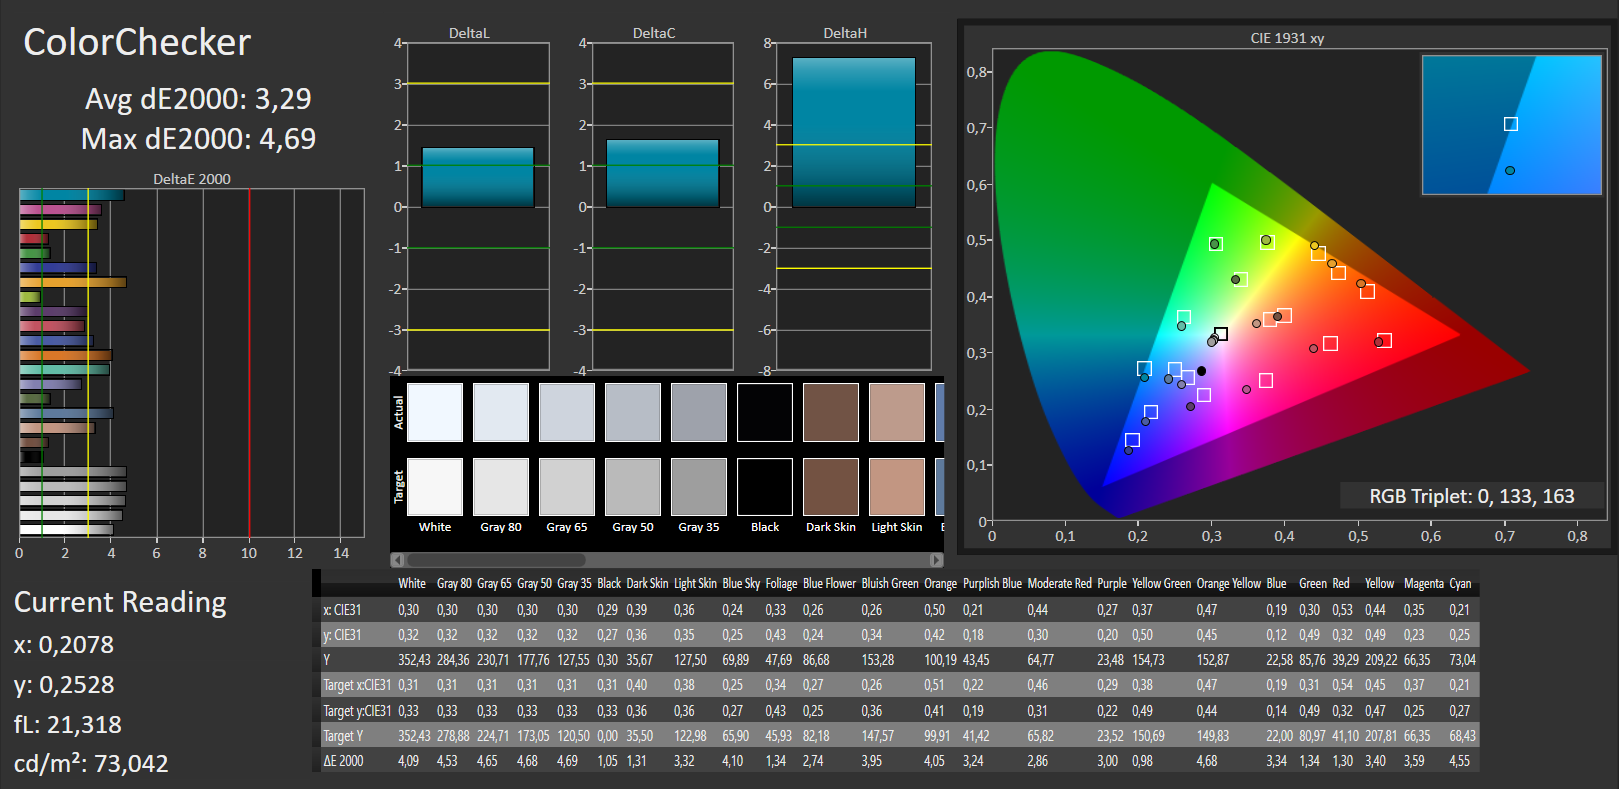
ΔE Color 3.29 | 0.5-29.43 Ø5
ΔE Greyscale 3.62 | 0.57-98 Ø5.3
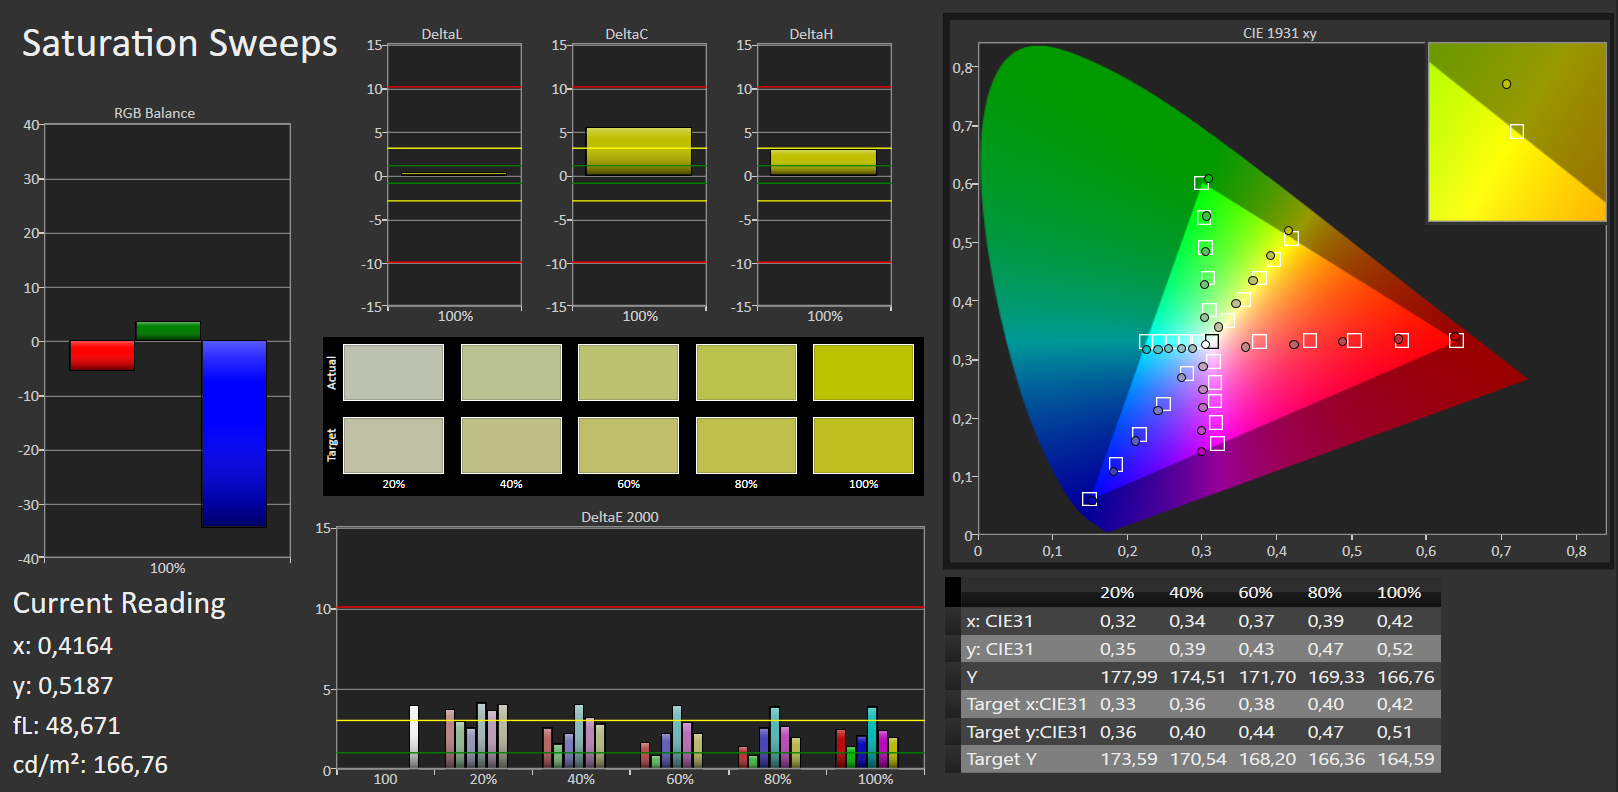
95% sRGB (Argyll 1.6.3 3D)
62% AdobeRGB 1998 (Argyll 1.6.3 3D)
67.8% AdobeRGB 1998 (Argyll 2.2.0 3D)
95.5% sRGB (Argyll 2.2.0 3D)
66% Display P3 (Argyll 2.2.0 3D)
Gamma: 2.23
| Xiaomi Mi Notebook Air 13.3 2016 Samsung LTN133HL09-M01, , 1920x1080, 13.30 | Dell XPS 13 2016 9350 (FHD, i7-6560U) Sharp SHP1449 LQ133M1, , 1920x1080, 13.30 | Dell XPS 13 9360 QHD+ i5 Sharp SHP144A, , 3200x1800, 13.30 | Apple MacBook Air 13 inch 2015-03 Apple APP9CF0, , 1440x900, 13.30 | Apple MacBook Pro Retina 13 inch 2015-03 APPA02A, , 2560x1600, 13.30 | Lenovo IdeaPad 710S-13ISK 80SW0031US Sharp SHP 1447 / LQ133M1JW15, , 1920x1080, 13.30 | |
|---|---|---|---|---|---|---|
| Display | -16% | -3% | -38% | 0% | 1% | |
| Display P3 Coverage | 66 | 54.8 -17% | 64.6 -2% | 40.1 -39% | 65.9 0% | 65.9 0% |
| sRGB Coverage | 95.5 | 82.3 -14% | 91.6 -4% | 59.8 -37% | 97 2% | 97 2% |
| AdobeRGB 1998 Coverage | 67.8 | 56.6 -17% | 66.5 -2% | 41.51 -39% | 67.4 -1% | 68 0% |
| Response Times | 11% | 11% | 87% | |||
| Response Time Grey 50% / Grey 80% * | 49 ? | 42.8 ? 13% | 31 ? 37% | 56 ? -14% | ||
| Response Time Black / White * | 27 ? | 24.8 ? 8% | 31.2 ? -16% | 44 ? -63% | ||
| PWM Frequency | 50 ? | 219.3 ? 339% | ||||
| Screen | 1% | -4% | -25% | 8% | -37% | |
| Brightness middle | 347 | 385 11% | 444 28% | 329 -5% | 361 4% | 349 1% |
| Brightness | 334 | 350 5% | 393 18% | 310 -7% | 342 2% | 339 1% |
| Brightness Distribution | 80 | 86 8% | 82 3% | 82 3% | 81 1% | 88 10% |
| Black Level * | 0.27 | 0.17 37% | 0.33 -22% | 0.405 -50% | 0.361 -34% | 0.393 -46% |
| Contrast | 1285 | 2265 76% | 1345 5% | 812 -37% | 1000 -22% | 888 -31% |
| Colorchecker dE 2000 * | 3.29 | 4.17 -27% | 4 -22% | 3.96 -20% | 1.82 45% | 6.85 -108% |
| Colorchecker dE 2000 max. * | 4.69 | 7.61 -62% | 7.7 -64% | 7.51 -60% | 3.26 30% | 10.27 -119% |
| Greyscale dE 2000 * | 3.62 | 5.39 -49% | 2.83 22% | 3.51 3% | 1.8 50% | 6.43 -78% |
| Gamma | 2.23 99% | 2.12 104% | 2.05 107% | 3.83 57% | 2.49 88% | 1.83 120% |
| CCT | 7307 89% | 7404 88% | 6963 93% | 6711 97% | 6417 101% | 7820 83% |
| Color Space (Percent of AdobeRGB 1998) | 62 | 62.7 1% | 59.3 -4% | 38.4 -38% | 61.9 0% | 61.9 0% |
| Color Space (Percent of sRGB) | 95 | 99.8 5% | 91.4 -4% | 59.8 -37% | 96.9 2% | 97.3 2% |
| Totaal Gemiddelde (Programma / Instellingen) | -1% /
-1% | 1% /
-2% | -32% /
-28% | 4% /
6% | 17% /
-7% |
* ... kleiner is beter
Responstijd Scherm
| ↔ Responstijd Zwart naar Wit | ||
|---|---|---|
| 27 ms ... stijging ↗ en daling ↘ gecombineerd | ↗ 8 ms stijging | 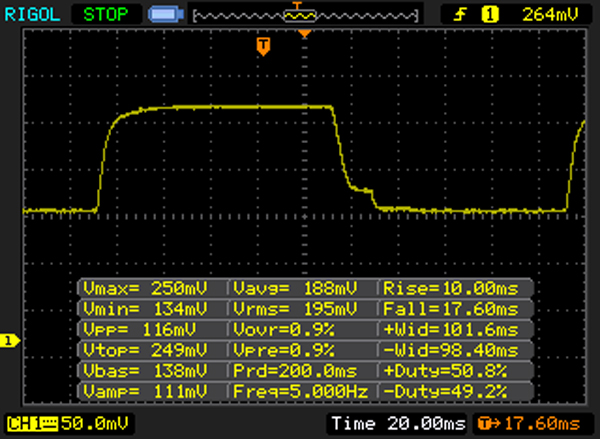 |
| ↘ 19 ms daling | ||
| Het scherm vertoonde relatief trage responstijden in onze tests en is misschien te traag voor games. Ter vergelijking: alle testtoestellen variëren van 0.1 (minimum) tot 240 (maximum) ms. » 63 % van alle toestellen zijn beter. Dit betekent dat de gemeten responstijd slechter is dan het gemiddelde (21.5 ms) van alle geteste toestellen. | ||
| ↔ Responstijd 50% Grijs naar 80% Grijs | ||
| 49 ms ... stijging ↗ en daling ↘ gecombineerd | ↗ 20 ms stijging | 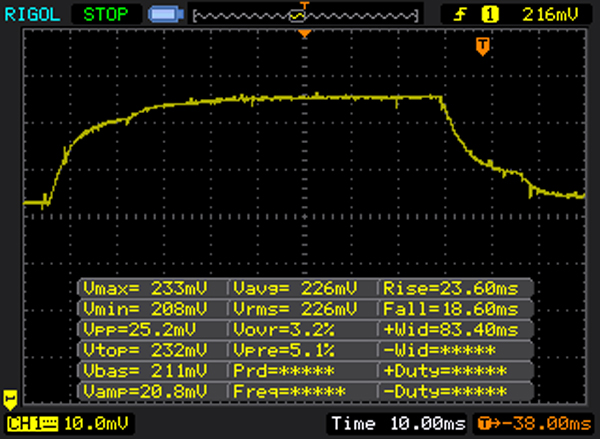 |
| ↘ 29 ms daling | ||
| Het scherm vertoonde trage responstijden in onze tests en is misschien te traag voor games. Ter vergelijking: alle testtoestellen variëren van 0.2 (minimum) tot 636 (maximum) ms. » 83 % van alle toestellen zijn beter. Dit betekent dat de gemeten responstijd slechter is dan het gemiddelde (33.7 ms) van alle geteste toestellen. | ||
Screen Flickering / PWM (Pulse-Width Modulation)
| Screen flickering / PWM waargenomen | 50 Hz | ≤ 30 % helderheid instelling | 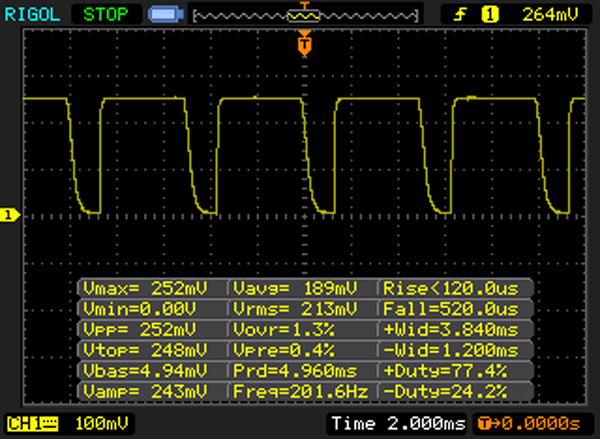 |
Het backlight van het scherm flikkert aan 50 Hz (hoogstwaarschijnlijk met PWM - Pulse-Width Modulation) aan een helderheid van 30 % en lager. Boven deze helderheid zou er geen flickering / PWM mogen optreden. De frequentie van 50 Hz is erg laag en kan dus aanleiding geven tot geïrriteerde ogen en hoofdpijn bij langer gebruik. Ter vergelijking: 53 % van alle geteste toestellen maakten geen gebruik van PWM om de schermhelderheid te verlagen. Als het wel werd gebruikt, werd een gemiddelde van 17924 (minimum: 5 - maximum: 3846000) Hz waargenomen. | |||
| Cinebench R15 | |
| CPU Single 64Bit | |
| Lenovo ThinkPad T460s 20FA003FPB | |
| Xiaomi Mi Notebook Air 13.3 2016 | |
| Dell XPS 13-9350 | |
| Lenovo ThinkPad T460s-20F9003SGE | |
| Apple MacBook Air 13 inch 2015-03 | |
| Lenovo IdeaPad 710S-13ISK 80SW0031US | |
| CPU Multi 64Bit | |
| Lenovo ThinkPad T460s 20FA003FPB | |
| Apple MacBook Air 13 inch 2015-03 | |
| Xiaomi Mi Notebook Air 13.3 2016 | |
| Lenovo ThinkPad T460s-20F9003SGE | |
| Dell XPS 13-9350 | |
| Lenovo IdeaPad 710S-13ISK 80SW0031US | |
| PCMark 8 | |
| Home Score Accelerated v2 | |
| Apple MacBook Air 13 inch 2015-03 | |
| Lenovo IdeaPad 710S-13ISK 80SW0031US | |
| Xiaomi Mi Notebook Air 13.3 2016 | |
| Lenovo ThinkPad T460s-20F9003SGE | |
| Lenovo Yoga 900-13ISK 80MK | |
| Dell XPS 13 9360 QHD+ i5 | |
| Work Score Accelerated v2 | |
| Apple MacBook Air 13 inch 2015-03 | |
| Lenovo IdeaPad 710S-13ISK 80SW0031US | |
| Xiaomi Mi Notebook Air 13.3 2016 | |
| Lenovo ThinkPad T460s-20F9003SGE | |
| Lenovo Yoga 900-13ISK 80MK | |
| PCMark 8 Home Score Accelerated v2 | 3144 punten | |
| PCMark 8 Work Score Accelerated v2 | 4274 punten | |
Help | ||
| Xiaomi Mi Notebook Air 13.3 2016 Samsung PM951 NVMe MZVLV256 | Dell XPS 13 9360 QHD+ i5 Toshiba NVMe THNSN5256GPUK | Lenovo Yoga 900-13ISK 80MK Samsung SSD PM871 MZNLN512HCJH | Lenovo ThinkPad T460s-20F9003SGE Samsung CM871 MZ7LF192HCGS | Lenovo IdeaPad 710S-13ISK 80SW0031US Samsung MZNLN128HCGR-000L2 | |
|---|---|---|---|---|---|
| CrystalDiskMark 3.0 | -4% | -28% | -74% | -38% | |
| Read Seq | 1209 | 1168 -3% | 514 -57% | 446.5 -63% | 524 -57% |
| Write Seq | 314 | 329 5% | 459.5 46% | 171.1 -46% | 157.5 -50% |
| Read 512 | 1015 | 413.4 | 259.2 | 398.9 | |
| Write 512 | 307 | 424.5 | 167.2 | 157.7 | |
| Read 4k | 43.4 | 33 -24% | 36.34 -16% | 5.78 -87% | 36.57 -16% |
| Write 4k | 153.4 | 132 -14% | 100.1 -35% | 35.47 -77% | 99.4 -35% |
| Read 4k QD32 | 487.6 | 525 8% | 313.8 -36% | 94.9 -81% | 397.5 -18% |
| Write 4k QD32 | 312.2 | 325 4% | 96.8 -69% | 36.43 -88% | 157 -50% |

| 3DMark 11 Performance | 2578 punten | |
| 3DMark Cloud Gate Standard Score | 7168 punten | |
| 3DMark Fire Strike Score | 1832 punten | |
Help | ||
| BioShock Infinite | |
| 1920x1080 Ultra Preset, DX11 (DDOF) | |
| Xiaomi Mi Notebook Air 13.3 2016 | |
| Dell Inspiron 17 7778 | |
| Lenovo Yoga 710-14ISK | |
| 1366x768 High Preset | |
| Xiaomi Mi Notebook Air 13.3 2016 | |
| Dell Inspiron 17 7778 | |
| Lenovo Yoga 710-14ISK | |
| 1366x768 Medium Preset | |
| Xiaomi Mi Notebook Air 13.3 2016 | |
| Dell Inspiron 17 7778 | |
| Lenovo Yoga 710-14ISK | |
| 1280x720 Very Low Preset | |
| Dell Inspiron 17 7778 | |
| Xiaomi Mi Notebook Air 13.3 2016 | |
| Lenovo Yoga 710-14ISK | |
| lage | gem. | hoge | ultra | |
| Civilization 5 (2010) | 70.9 | 20.7 | ||
| BioShock Infinite (2013) | 106.5 | 65.6 | 57.1 | 19.82 |
| Company of Heroes 2 (2013) | 37.1 | 29.3 | 16.46 | |
| Total War: Rome II (2013) | 82.7 | 64.8 | 56 | 14.1 |
| Rise of the Tomb Raider (2016) | 35.7 | 23.2 | 13.2 | |
| Ashes of the Singularity (2016) | 23.5 | |||
| Doom (2016) | 26.75 | 11.97 |
Geluidsniveau
| Onbelast |
| 31.15 / 31.15 / 31.15 dB (A) |
| HDD |
| 31.15 dB (A) |
| Belasting |
| 38.2 / 41.7 dB (A) |
 | ||
30 dB stil 40 dB(A) hoorbaar 50 dB(A) luid |
||
min: | ||
(-) De maximumtemperatuur aan de bovenzijde bedraagt 51 °C / 124 F, vergeleken met het gemiddelde van 35.9 °C / 97 F, variërend van 21.4 tot 59 °C voor de klasse Subnotebook.
(-) De bodem warmt op tot een maximum van 47 °C / 117 F, vergeleken met een gemiddelde van 39.4 °C / 103 F
(+) Bij onbelast gebruik bedraagt de gemiddelde temperatuur voor de bovenzijde 23.8 °C / 75 F, vergeleken met het apparaatgemiddelde van 30.7 °C / 87 F.
(+) De palmsteunen en het touchpad zijn met een maximum van ###max## °C / 85.8 F koeler dan de huidtemperatuur en voelen daarom koel aan.
(±) De gemiddelde temperatuur van de handpalmsteun van soortgelijke toestellen bedroeg 28.3 °C / 82.9 F (-1.6 °C / -2.9 F).
| Uit / Standby | |
| Inactief | |
| Belasting |
|
| Xiaomi Mi Notebook Air 13.3 2016 6200U, GeForce 940MX, Samsung PM951 NVMe MZVLV256, IPS, 1920x1080, 13.30 | Dell XPS 13 9360 QHD+ i5 i5-7200U, HD Graphics 620, Toshiba NVMe THNSN5256GPUK, , 3200x1800, 13.30 | Lenovo IdeaPad 710S-13ISK 6560U, Iris Graphics 540, Samsung PM951 NVMe MZVLV256, IPS, 1920x1080, 13.30 | Microsoft Surface Book Core i7 6600U, Maxwell GPU (940M, GDDR5), Samsung MZFLV512 NVMe, IPS, 3000x2000, 13.50 | Apple MacBook Pro Retina 13 inch 2015-03 5257U, Iris Graphics 6100, Apple SSD SM0128G, IPS-Panel, 2560x1600, 13.30 | Lenovo ThinkPad T460s-20F9003SGE 6200U, HD Graphics 520, Samsung CM871 MZ7LF192HCGS, IPS, 1920x1080, 14.00 | |
|---|---|---|---|---|---|---|
| Power Consumption | 19% | 5% | -29% | -9% | 15% | |
| Idle Minimum * | 4 | 3.7 7% | 3.3 17% | 4.5 -13% | 2.8 30% | 3.7 7% |
| Idle Average * | 6.6 | 6.1 8% | 7.4 -12% | 9.8 -48% | 7.8 -18% | 6.8 -3% |
| Idle Maximum * | 7.4 | 6.5 12% | 8.2 -11% | 12.2 -65% | 8.1 -9% | 7.3 1% |
| Load Average * | 41.7 | 29.5 29% | 36.5 12% | 46 -10% | 52.4 -26% | 26.3 37% |
| Load Maximum * | 52.4 | 33 37% | 43.7 17% | 56 -7% | 62.8 -20% | 34.6 34% |
* ... kleiner is beter
| Xiaomi Mi Notebook Air 13.3 2016 6200U, GeForce 940MX, 40 Wh | Lenovo IdeaPad 710S-13ISK 6560U, Iris Graphics 540, 46 Wh | Lenovo Yoga 900-13ISK 80MK 6500U, HD Graphics 520, 66 Wh | Lenovo ThinkPad T460s-20F9003SGE 6200U, HD Graphics 520, 49 Wh | Dell XPS 13 9360 QHD+ i5 i5-7200U, HD Graphics 620, 60 Wh | Apple MacBook Air 13 inch 2015-03 5650U, HD Graphics 6000, 54 Wh | |
|---|---|---|---|---|---|---|
| Batterijduur | 11% | 25% | 24% | 43% | 65% | |
| Reader / Idle | 718 | 810 13% | 844 18% | 915 27% | 1572 119% | |
| H.264 | 423 | 486 15% | 534 26% | 547 29% | ||
| WiFi v1.3 | 389 | 418 7% | 403 4% | 395 2% | 526 35% | 620 59% |
| Load | 83 | 89 7% | 128 54% | 116 40% | 137 65% | 97 17% |
Pro
Contra

Dit is de verkorte versie van het originele artikel. Het volledige, Engelse testrapport vind je hier.
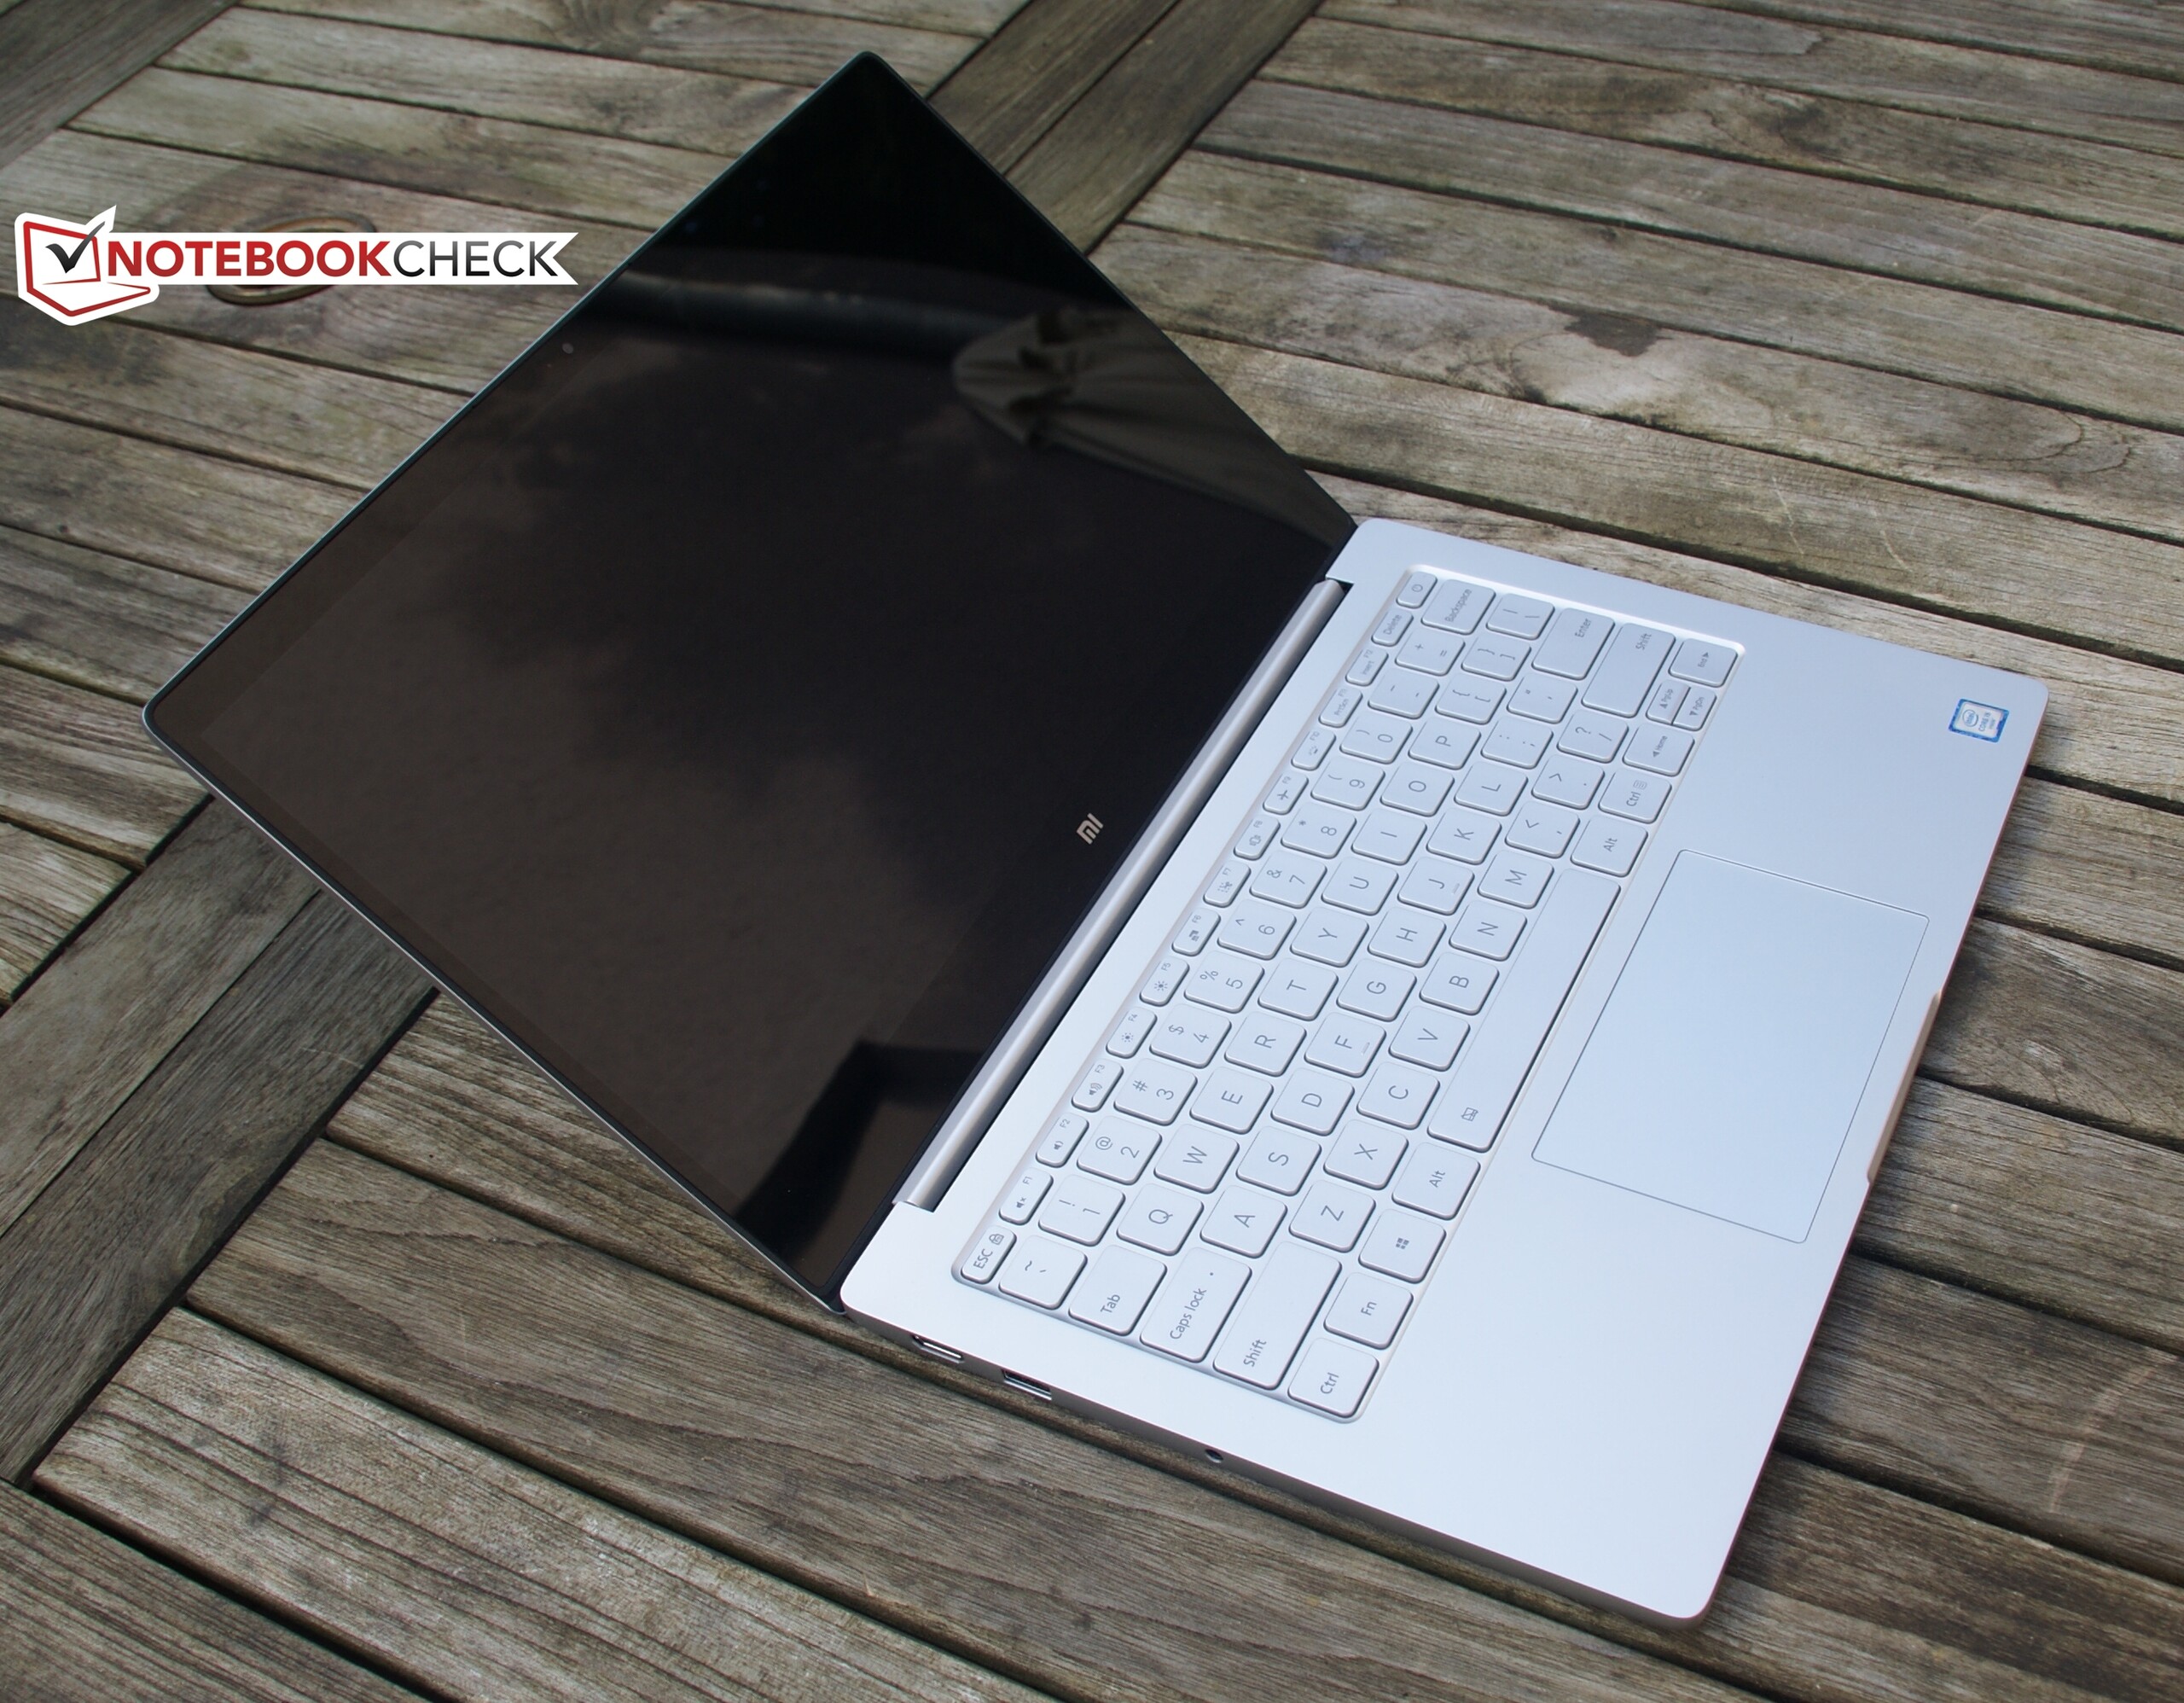
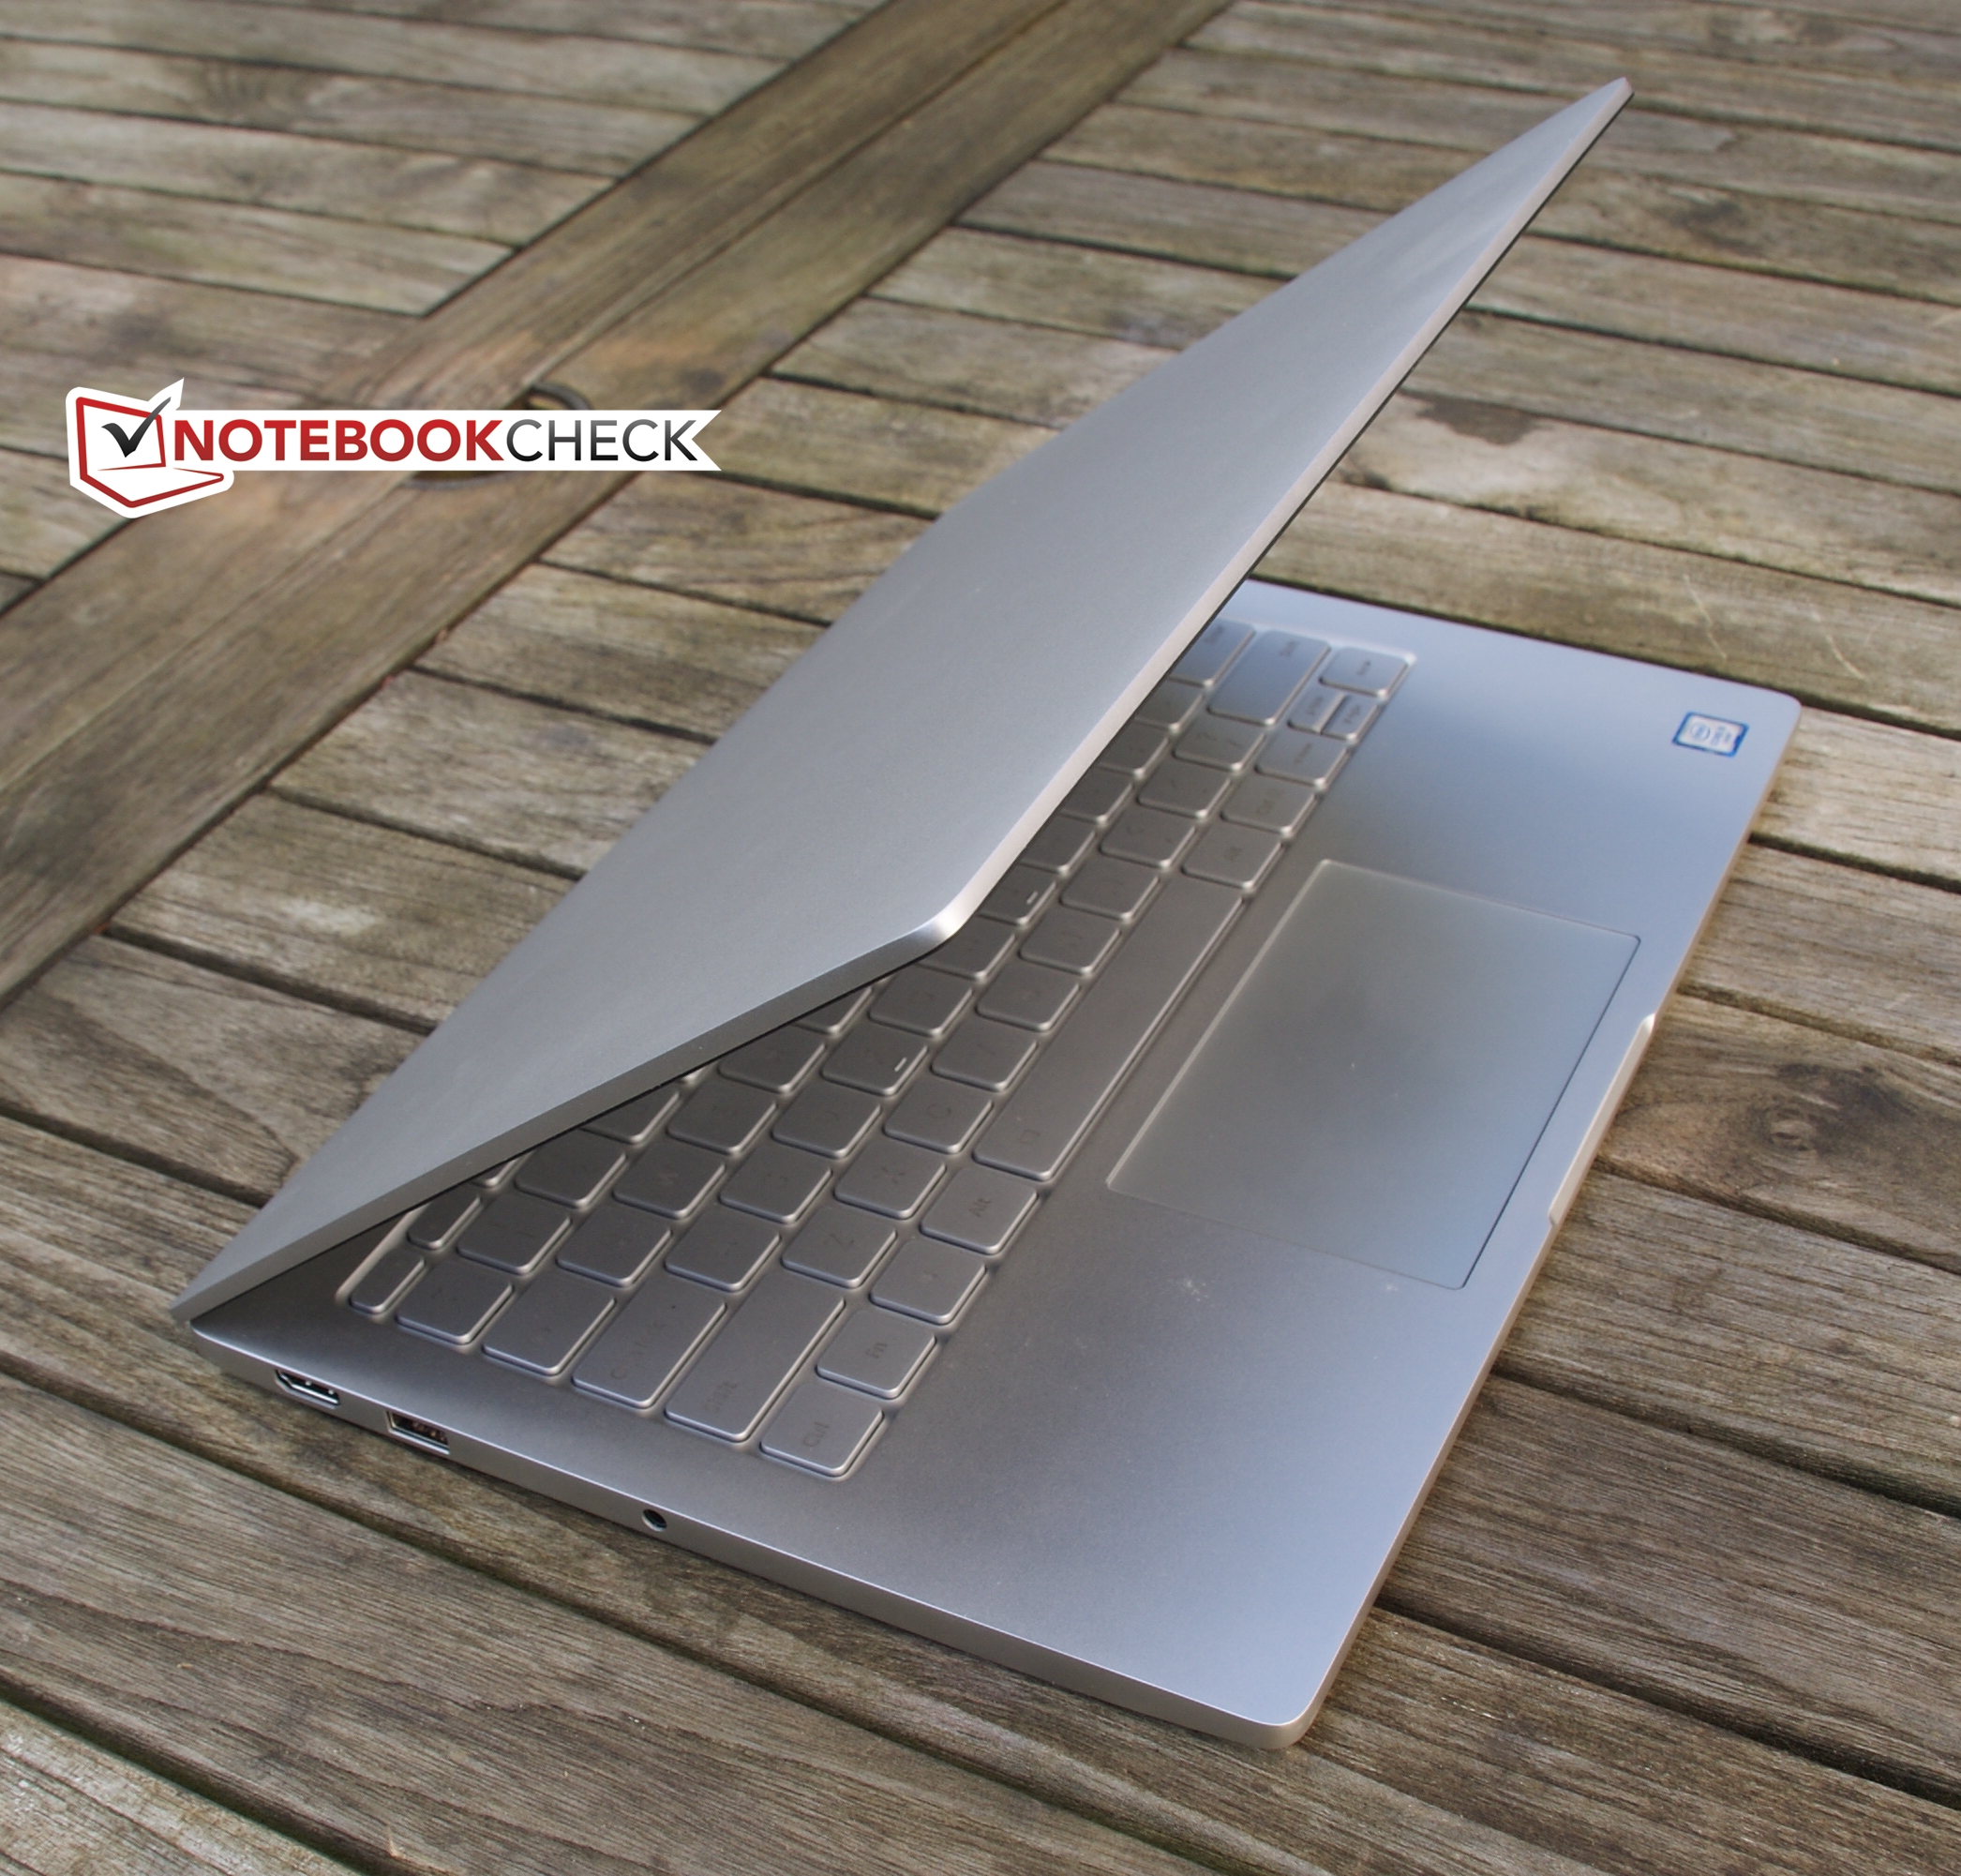
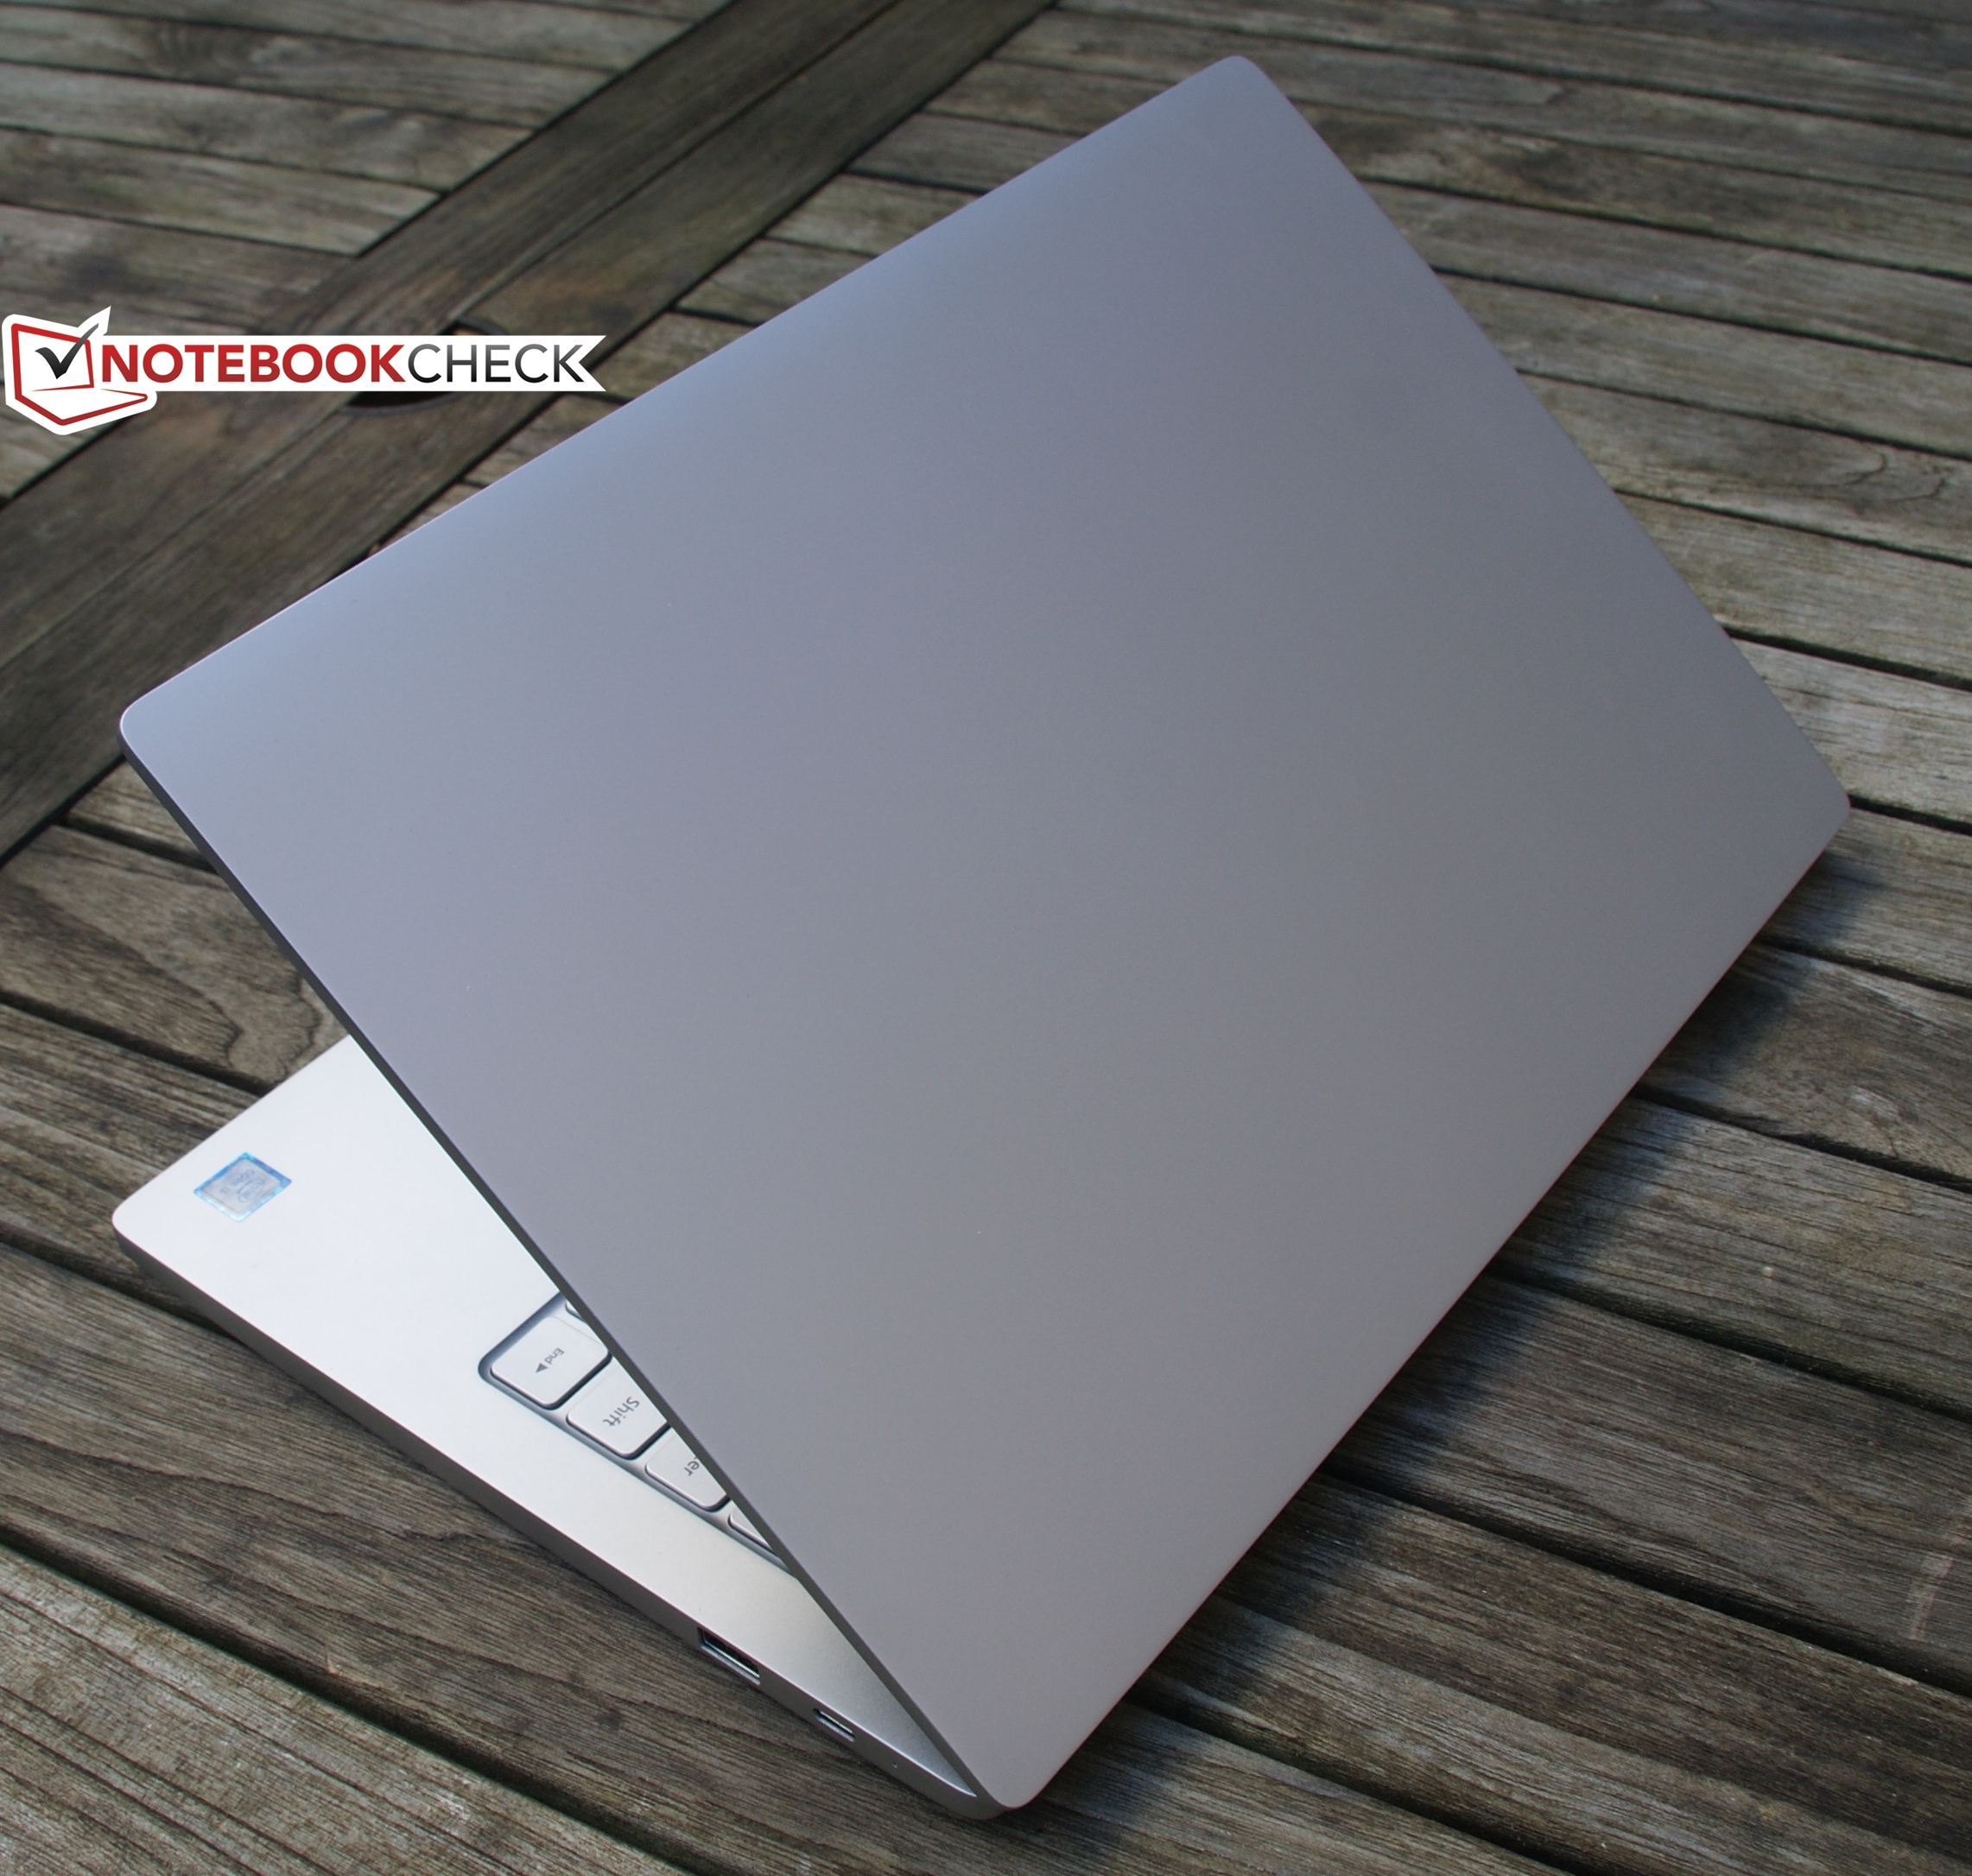
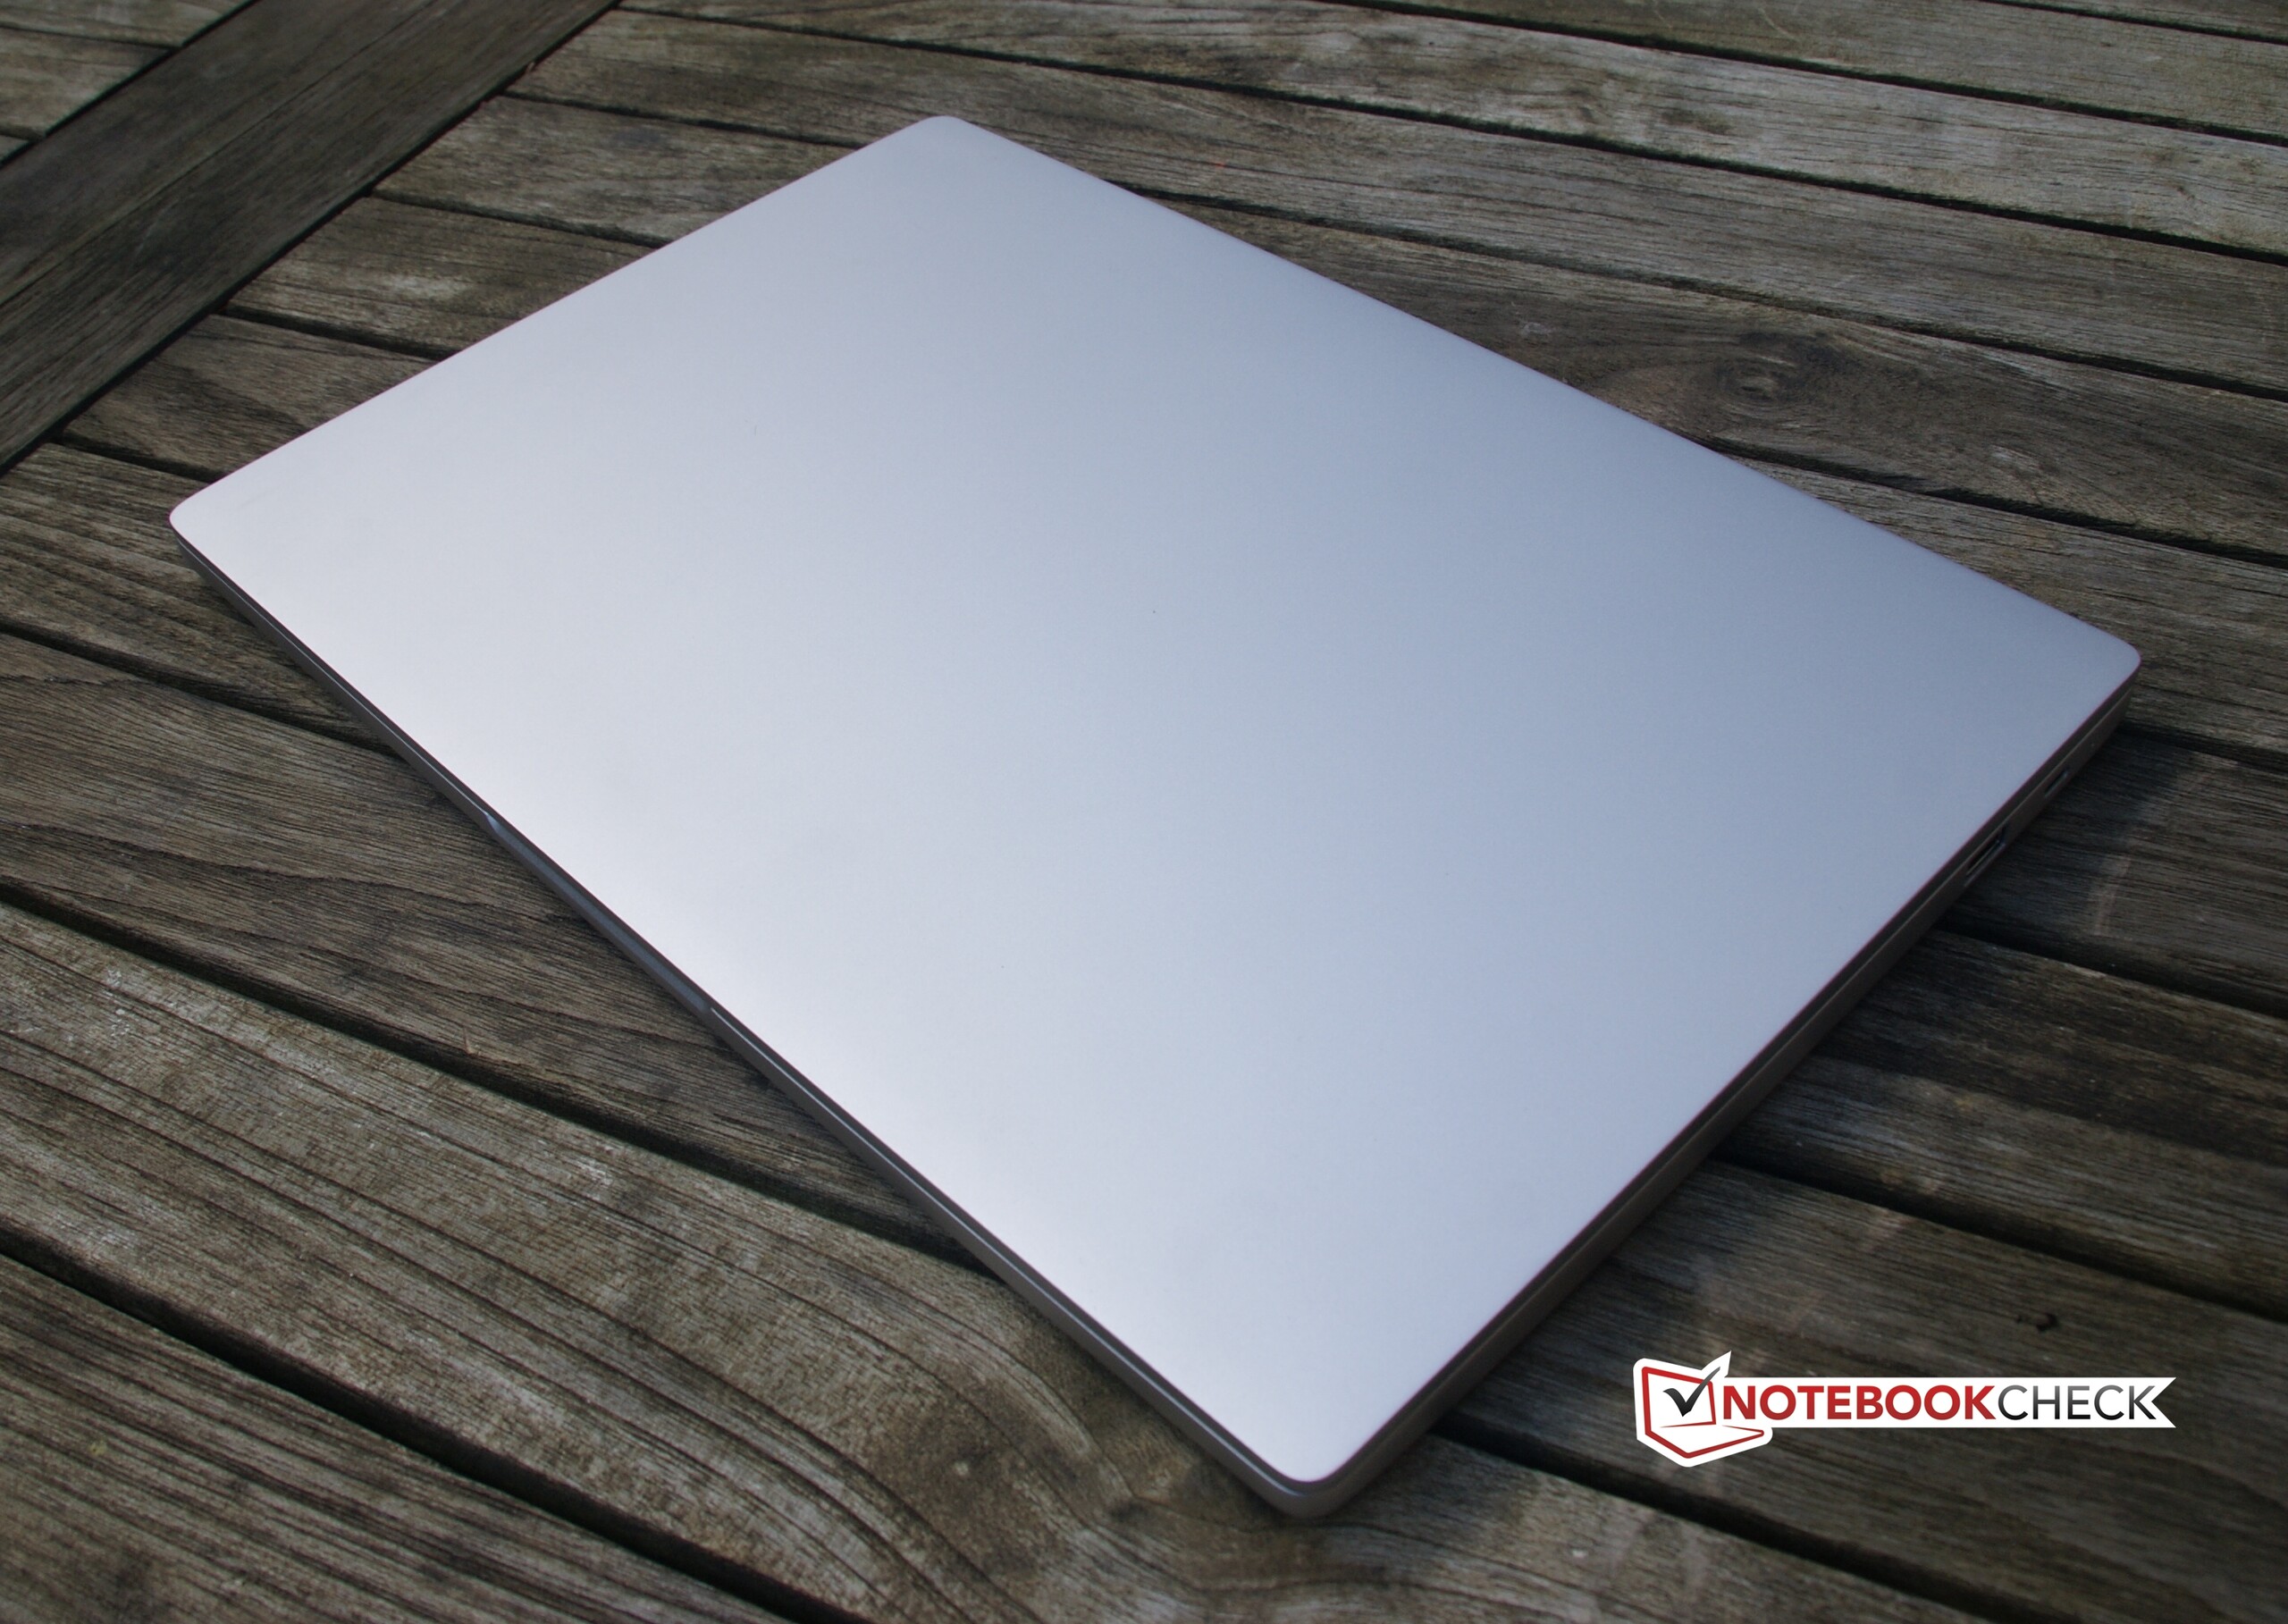
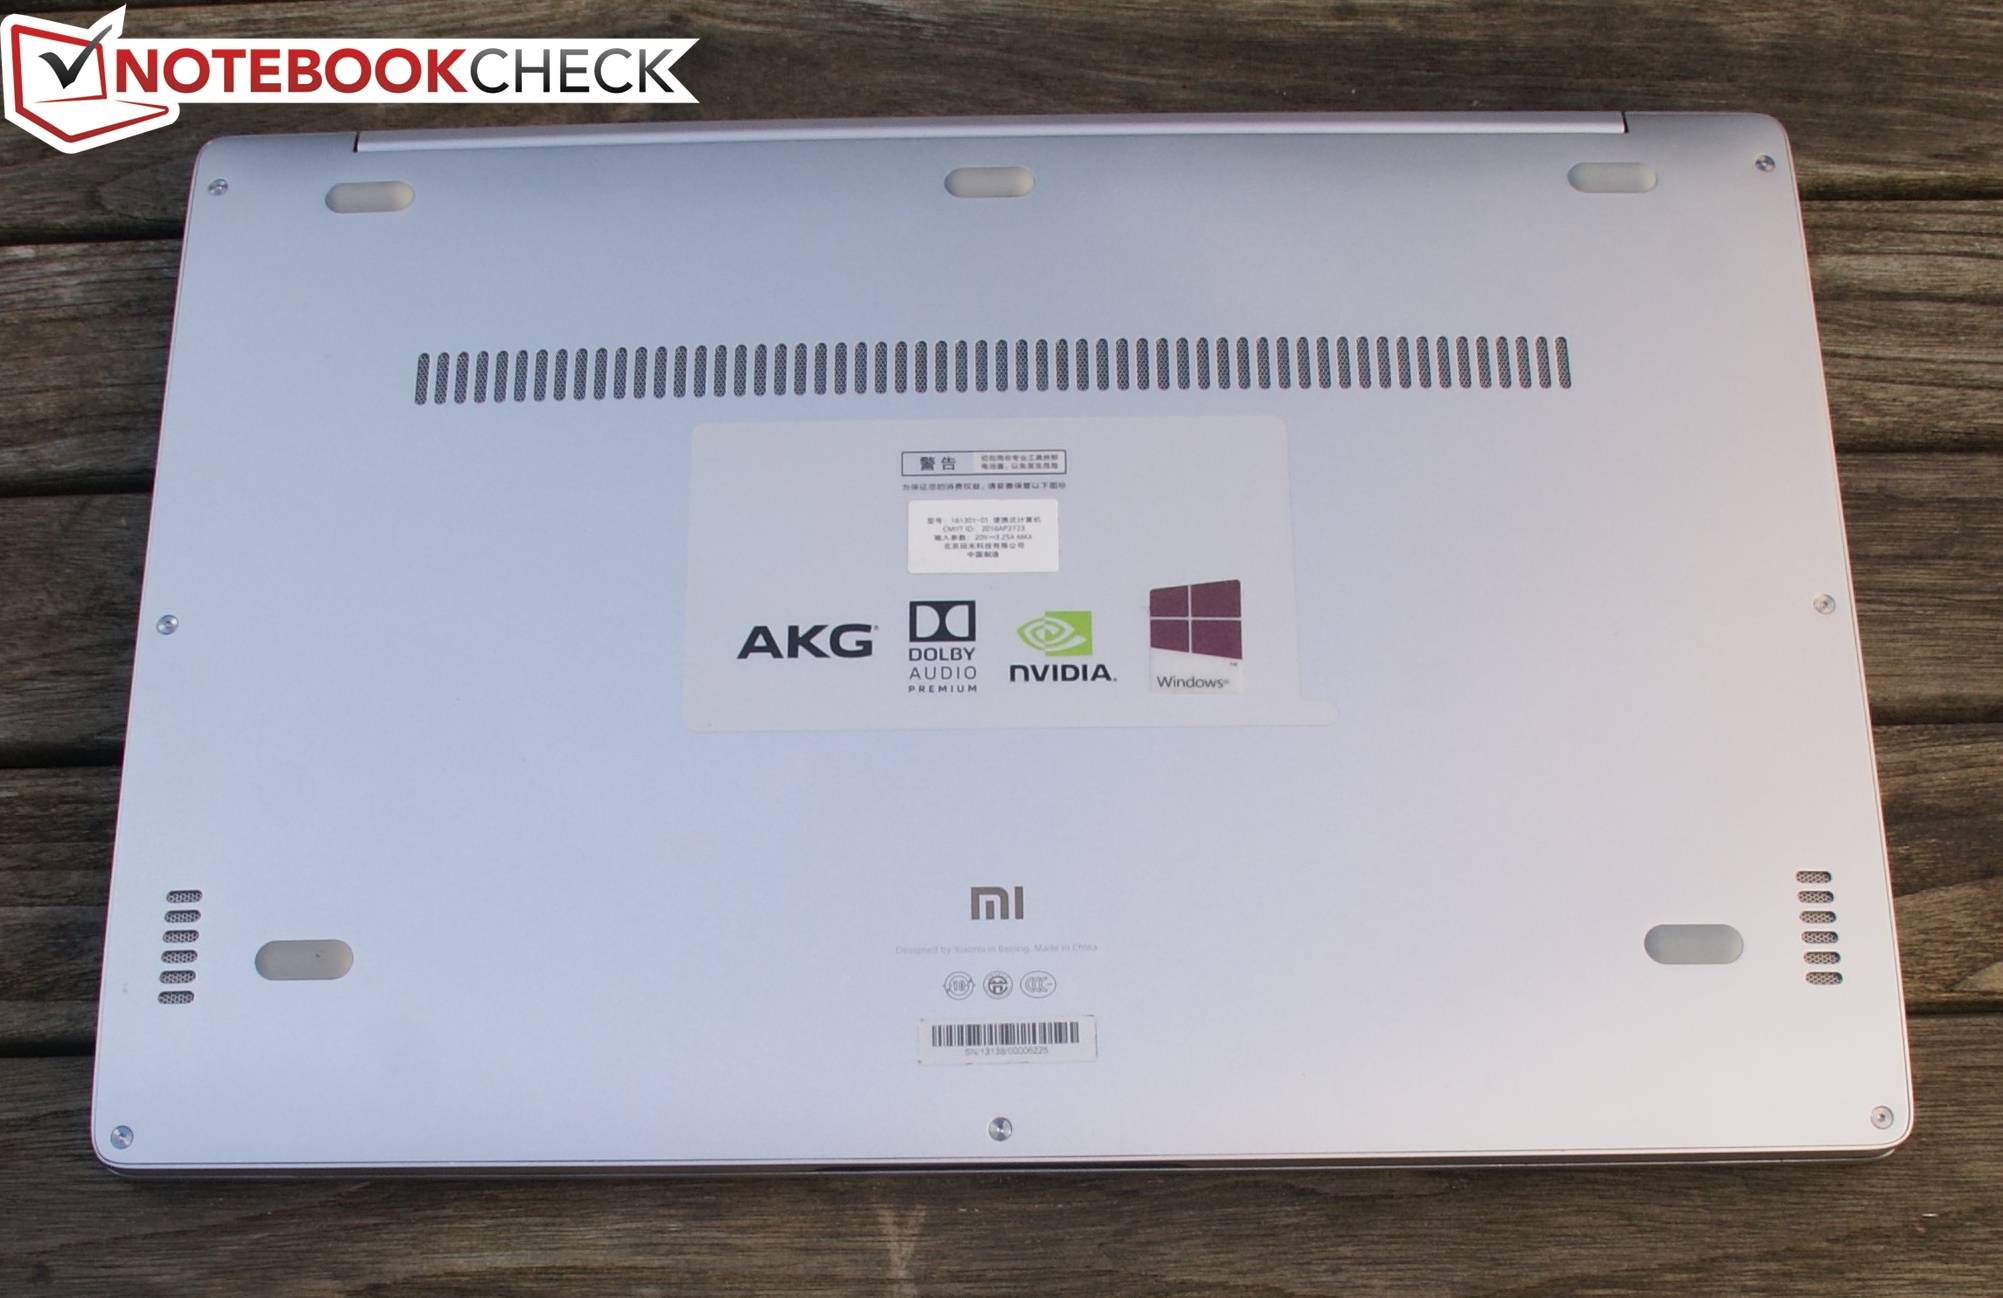
De Mi Notebook Air betekent een succesvol debuut voor Xiaomi. Het voornaamste is dat de fabrikant alle grote valkuilen weet te vermijden. Pluspunten zijn het erg goede scherm, de hoogwaardige unibody-behuizing, prima koeling (hetzij met één beperking), prima invoerapparatuur en het feit dat de laptop over genoeg rekenkracht beschikt wanneer nodig - een discrete grafische kaart van Nvidia is in dit marktsegment al een verkoopargument op zich.
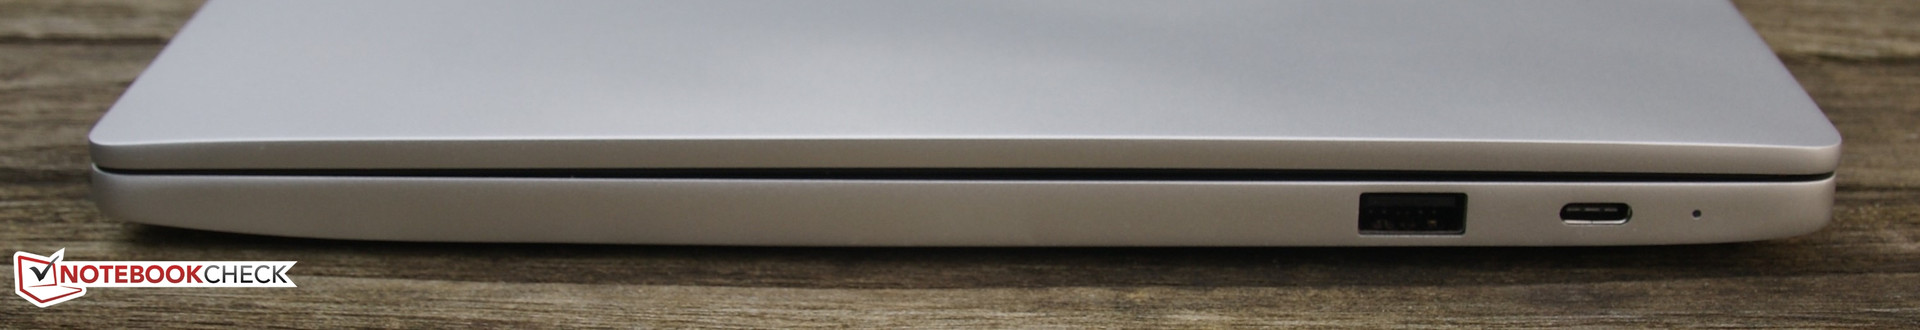
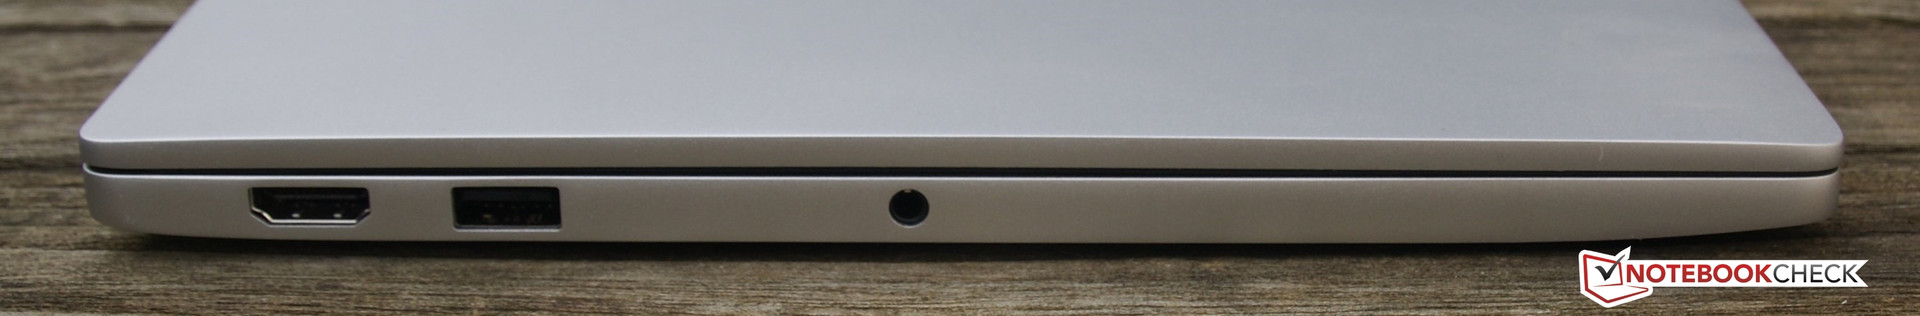
De negatieve punten zijn vooral in de details te vinden: het toestel mist een SD-kaartlezer, het scherm is helaas glanzend en de behuizing wordt redelijk warm onder bij gebruik. De grootste teleurstelling is de batterij: de Mi Notebook Air heeft een op zijn best matige batterijduur. Andere fabrikanten doen het op dit vlak een stuk beter; een voorbeeld hiervan Dell met zijn XPS 13. Daarnaast doen vooruitziende kopers er misschien goed aan hun blik te richten op Kaby Lake Ultrabooks als de HP Spectre x360 en Lenovo Yoga 910 die binnenkort verkrijgbaar worden. In feite gaat het hier wel om convertibles, wat niet naar iedereens zin zal zijn. Ze zijn ook groter en zwaarder dan de XPS en Mi Notebook Air.
Xiaomi's debuut brengt het er prima vanaf; de fabrikant wist elke grote valkuil te vermijden. Het enige dat een groter succes in de weg zou kunnen staan is het feit dat het toestel geïmporteerd moet worden.
Het grootste voordeel van de Mi Notebook Air is misschien wel zijn prijs. Alle zojuist vernoemde concurrenten zijn veel duurder. De Lenovo IdeaPad 710S heeft een vergelijkbare prijs en kan ook een interessante optie zijn.
Zouden we de Mi Notebook Air aanbevelen? Ja, al dienen we hier aan te geven dat hij niet officieel verkrijgbaar is in Nederland/België. Een gevolg hiervan is het Amerikaanse toetsenbord (geen AZERTY mogelijk), het onbestaande CE-label en de moeilijk afdwingbare garantie. Meer informatie kan je vinden in ons artikel over CE-labeling en Import (Duits). Indien Xiaomi de Mi Notebook Air ook in Europa verkrijgbaar zou maken, zou dit het succes van het toestel zeker ten goede komen.
Xiaomi Mi Notebook Air 13.3 2016
-
15-10-2016 v5.1(old)
Benjamin Herzig