 Deutsch
 English
 Español
 Français
 Italiano
 Nederlands
 Polski
 Português
 Русский
 Türkçe
 Svenska
 Chinese
 Magyar
Kort testrapport MSI GS30 Notebook
| |||||||||||||||||||||||||
Helderheidsverdeling: 88 %
Helderheid in Batterij-modus: 273 cd/m²
Contrast: 718:1 (Zwart: 0.38 cd/m²)
ΔE Color 4.86 | 0.5-29.43 Ø5
ΔE Greyscale 4.56 | 0.57-98 Ø5.3
56% AdobeRGB 1998 (Argyll 1.6.3 3D)
62.5% AdobeRGB 1998 (Argyll 2.2.0 3D)
85.5% sRGB (Argyll 2.2.0 3D)
65.9% Display P3 (Argyll 2.2.0 3D)
Gamma: 2.23
| MSI GS30 Shadow BOEhydis HN133WU3-102 (BOE05E3) | SCHENKER S413 AUO B140HAN01 | Alienware 13 9T7WM_133HL (SDC4C48) | SCHENKER XMG A305 CMN N133HSE-EA1 (CMN1343) | SCHENKER XMG C405 AU Optronics B140HAN01.1 (AUO113ED) | Razer Blade 14 2015 | |
|---|---|---|---|---|---|---|
| Display | 2% | -1% | 4% | 12% | ||
| Display P3 Coverage | 65.9 | 64.7 -2% | 61.8 -6% | 66.8 1% | 70.3 7% | |
| sRGB Coverage | 85.5 | 88.5 4% | 88.3 3% | 89.6 5% | 97.1 14% | |
| AdobeRGB 1998 Coverage | 62.5 | 64.6 3% | 63.4 1% | 65.6 5% | 71.1 14% | |
| Response Times | ||||||
| Response Time Grey 50% / Grey 80% * | 38 ? | |||||
| Response Time Black / White * | 28 ? | |||||
| PWM Frequency | ||||||
| Screen | -1% | -1% | 1% | 2% | 6% | |
| Brightness middle | 273 | 262 -4% | 319 17% | 315 15% | 280 3% | 318.4 17% |
| Brightness | 258 | 268 4% | 295 14% | 310 20% | 267 3% | 311 21% |
| Brightness Distribution | 88 | 88 0% | 83 -6% | 86 -2% | 85 -3% | 78 -11% |
| Black Level * | 0.38 | 0.59 -55% | 0.32 16% | 0.35 8% | 0.32 16% | 0.416 -9% |
| Contrast | 718 | 444 -38% | 997 39% | 900 25% | 875 22% | 765 7% |
| Colorchecker dE 2000 * | 4.86 | 3.4 30% | 5.83 -20% | 5.63 -16% | 4.75 2% | 3.67 24% |
| Greyscale dE 2000 * | 4.56 | 2.5 45% | 7.63 -67% | 6.71 -47% | 5.91 -30% | 5.41 -19% |
| Gamma | 2.23 99% | 2.62 84% | 2.57 86% | 2.53 87% | 2.52 87% | 2.26 97% |
| CCT | 7292 89% | 6723 97% | 7195 90% | 5920 110% | 5742 113% | 7118 91% |
| Color Space (Percent of AdobeRGB 1998) | 56 | 60 7% | 57 2% | 57 2% | 59 5% | 64.64 15% |
| Totaal Gemiddelde (Programma / Instellingen) | 1% /
-1% | -1% /
-1% | 1% /
1% | 3% /
3% | 9% /
7% |
* ... kleiner is beter
| Cinebench R11.5 | |
| CPU Single 64Bit (sorteer op waarde) | |
| MSI GS30 Shadow | |
| SCHENKER S413 | |
| Alienware 13 | |
| SCHENKER XMG A305 | |
| SCHENKER XMG C405 | |
| Razer Blade 14 2015 | |
| MSI GamingDock | |
| CPU Multi 64Bit (sorteer op waarde) | |
| MSI GS30 Shadow | |
| SCHENKER S413 | |
| Alienware 13 | |
| SCHENKER XMG A305 | |
| SCHENKER XMG C405 | |
| Razer Blade 14 2015 | |
| MSI GamingDock | |
| Cinebench R15 | |
| CPU Single 64Bit (sorteer op waarde) | |
| MSI GS30 Shadow | |
| SCHENKER S413 | |
| Alienware 13 | |
| SCHENKER XMG A305 | |
| SCHENKER XMG C405 | |
| Razer Blade 14 2015 | |
| MSI GamingDock | |
| CPU Multi 64Bit (sorteer op waarde) | |
| MSI GS30 Shadow | |
| SCHENKER S413 | |
| Alienware 13 | |
| SCHENKER XMG A305 | |
| SCHENKER XMG C405 | |
| Razer Blade 14 2015 | |
| MSI GamingDock | |
| PCMark 7 Score | 6510 punten | |
| PCMark 8 Home Score Accelerated v2 | 4087 punten | |
| PCMark 8 Creative Score Accelerated v2 | 5165 punten | |
| PCMark 8 Work Score Accelerated v2 | 4916 punten | |
Help | ||
| PCMark 7 - Score (sorteer op waarde) | |
| MSI GS30 Shadow | |
| SCHENKER S413 | |
| Alienware 13 | |
| SCHENKER XMG A305 | |
| Razer Blade 14 2015 | |
| PCMark 8 | |
| Work Score Accelerated v2 (sorteer op waarde) | |
| MSI GS30 Shadow | |
| Alienware 13 | |
| SCHENKER XMG C405 | |
| Razer Blade 14 2015 | |
| Creative Score Accelerated v2 (sorteer op waarde) | |
| MSI GS30 Shadow | |
| Alienware 13 | |
| SCHENKER XMG C405 | |
| Razer Blade 14 2015 | |
| Home Score Accelerated v2 (sorteer op waarde) | |
| MSI GS30 Shadow | |
| Alienware 13 | |
| SCHENKER XMG C405 | |
| Razer Blade 14 2015 | |

| 3DMark 11 Performance | 2156 punten | |
| 3DMark Ice Storm Standard Score | 84120 punten | |
| 3DMark Cloud Gate Standard Score | 9626 punten | |
| 3DMark Fire Strike Score | 1281 punten | |
Help | ||
| 3DMark 11 - 1280x720 Performance GPU (sorteer op waarde) | |
| MSI GS30 Shadow | |
| SCHENKER S413 | |
| Alienware 13 | |
| SCHENKER XMG A305 | |
| SCHENKER XMG C405 | |
| Razer Blade 14 2015 | |
| MSI GamingDock | |
| 3DMark | |
| 1920x1080 Fire Strike Graphics (sorteer op waarde) | |
| MSI GS30 Shadow | |
| SCHENKER S413 | |
| Alienware 13 | |
| SCHENKER XMG A305 | |
| SCHENKER XMG C405 | |
| Razer Blade 14 2015 | |
| MSI GamingDock | |
| 1280x720 Sky Diver Graphics (sorteer op waarde) | |
| MSI GS30 Shadow | |
| Alienware 13 | |
| SCHENKER XMG A305 | |
| SCHENKER XMG C405 | |
| MSI GamingDock | |
| 1280x720 Cloud Gate Standard Graphics (sorteer op waarde) | |
| MSI GS30 Shadow | |
| SCHENKER S413 | |
| Alienware 13 | |
| SCHENKER XMG A305 | |
| SCHENKER XMG C405 | |
| Razer Blade 14 2015 | |
| MSI GamingDock | |
| 1280x720 Ice Storm Standard Graphics (sorteer op waarde) | |
| MSI GS30 Shadow | |
| SCHENKER S413 | |
| Alienware 13 | |
| SCHENKER XMG A305 | |
| SCHENKER XMG C405 | |
| Razer Blade 14 2015 | |
| MSI GamingDock | |
| Unigine Heaven 4.0 - Extreme Preset DX11 (sorteer op waarde) | |
| MSI GS30 Shadow | |
| MSI GamingDock | |
| lage | gem. | hoge | ultra | |
| Crysis 3 (2013) | 45.9 | 27.9 | 18.4 | 6.9 |
| Watch Dogs (2014) | 33.8 | 21.4 | 5.7 | 0 () |
| Sims 4 (2014) | 194.9 | 68.4 | 32.7 | 22.1 |
| Fifa 15 (2014) | 87.9 | 59.9 | 37 | |
| Far Cry 4 (2014) | 26.5 | 19.8 | 9.4 | 7 |
| Dragon Age: Inquisition (2014) | 39.3 | 26.3 | 9.7 | 5.5 |
| Battlefield Hardline (2015) | 47.8 | 34.1 | 15 | 8.6 |
| GTA V (2015) | 48.7 | 38.4 | 7.8 | 2.9 |
| GTA V | |
| 3840x2160 High/On (Advanced Graphics Off) AA:FX AF:8x (sorteer op waarde) | |
| MSI GamingDock | |
| 1920x1080 Highest Settings possible AA:4xMSAA + FX AF:16x (sorteer op waarde) | |
| MSI GS30 Shadow | |
| MSI GamingDock | |
| 1920x1080 High/On (Advanced Graphics Off) AA:2xMSAA + FX AF:8x (sorteer op waarde) | |
| MSI GS30 Shadow | |
| MSI GamingDock | |
| 1366x768 Normal/Off AF:4x (sorteer op waarde) | |
| MSI GS30 Shadow | |
| MSI GamingDock | |
| 1024x768 Lowest Settings possible (sorteer op waarde) | |
| MSI GS30 Shadow | |
| MSI GamingDock | |
| Battlefield Hardline | |
| 1920x1080 Ultra Graphics Quality (DX11) AA:4x MS (sorteer op waarde) | |
| MSI GS30 Shadow | |
| SCHENKER XMG A305 | |
| SCHENKER XMG C405 | |
| MSI GamingDock | |
| 1920x1080 High Graphics Quality (DX11) (sorteer op waarde) | |
| MSI GS30 Shadow | |
| SCHENKER XMG A305 | |
| SCHENKER XMG C405 | |
| MSI GamingDock | |
| 1366x768 Medium Graphics Quality (DX11) (sorteer op waarde) | |
| MSI GS30 Shadow | |
| SCHENKER XMG A305 | |
| SCHENKER XMG C405 | |
| MSI GamingDock | |
| 1024x768 Low Graphics Quality (DX11) (sorteer op waarde) | |
| MSI GS30 Shadow | |
| SCHENKER XMG A305 | |
| SCHENKER XMG C405 | |
| MSI GamingDock | |
| Dragon Age: Inquisition | |
| 1920x1080 Ultra Graphics Quality AA:2x MS (sorteer op waarde) | |
| MSI GS30 Shadow | |
| Alienware 13 | |
| MSI GamingDock | |
| 1920x1080 High Graphics Quality (sorteer op waarde) | |
| MSI GS30 Shadow | |
| Alienware 13 | |
| MSI GamingDock | |
| 1366x768 Medium Graphics Quality (sorteer op waarde) | |
| MSI GS30 Shadow | |
| Alienware 13 | |
| MSI GamingDock | |
| 1024x768 Low Graphics Quality (sorteer op waarde) | |
| MSI GS30 Shadow | |
| Alienware 13 | |
| MSI GamingDock | |
| Far Cry 4 | |
| 1920x1080 Ultra Graphics Quality AA:SM (sorteer op waarde) | |
| MSI GS30 Shadow | |
| Alienware 13 | |
| SCHENKER XMG A305 | |
| MSI GamingDock | |
| 1920x1080 High Graphics Quality AA:SM (sorteer op waarde) | |
| MSI GS30 Shadow | |
| Alienware 13 | |
| SCHENKER XMG A305 | |
| MSI GamingDock | |
| 1366x768 Medium Graphics Quality (sorteer op waarde) | |
| MSI GS30 Shadow | |
| Alienware 13 | |
| SCHENKER XMG A305 | |
| MSI GamingDock | |
| 1024x768 Low Graphics Quality (sorteer op waarde) | |
| MSI GS30 Shadow | |
| Alienware 13 | |
| SCHENKER XMG A305 | |
| MSI GamingDock | |
| Fifa 15 | |
| 3840x2160 High Preset (sorteer op waarde) | |
| MSI GamingDock | |
| 1920x1080 High Preset AA:4x MS (sorteer op waarde) | |
| MSI GS30 Shadow | |
| Alienware 13 | |
| SCHENKER XMG A305 | |
| MSI GamingDock | |
| 1366x768 High Preset AA:2x MS (sorteer op waarde) | |
| MSI GS30 Shadow | |
| Alienware 13 | |
| SCHENKER XMG A305 | |
| MSI GamingDock | |
| 1280x720 Low Preset (sorteer op waarde) | |
| MSI GS30 Shadow | |
| Alienware 13 | |
| SCHENKER XMG A305 | |
| MSI GamingDock | |
| Sims 4 | |
| 1920x1080 Ultra Preset (sorteer op waarde) | |
| MSI GS30 Shadow | |
| Alienware 13 | |
| SCHENKER XMG A305 | |
| MSI GamingDock | |
| 1920x1080 High Preset (sorteer op waarde) | |
| MSI GS30 Shadow | |
| Alienware 13 | |
| SCHENKER XMG A305 | |
| MSI GamingDock | |
| 1366x768 Medium Preset (sorteer op waarde) | |
| MSI GS30 Shadow | |
| Alienware 13 | |
| SCHENKER XMG A305 | |
| MSI GamingDock | |
| 1024x768 Low Preset (sorteer op waarde) | |
| MSI GS30 Shadow | |
| Alienware 13 | |
| SCHENKER XMG A305 | |
| MSI GamingDock | |
| Watch Dogs | |
| 1920x1080 Ultra Overall Quality, Ultra Textures AA:4x MS (sorteer op waarde) | |
| MSI GS30 Shadow | |
| SCHENKER XMG A305 | |
| MSI GamingDock | |
| 1920x1080 High Overall Quality, High Textures AA:2x MS (sorteer op waarde) | |
| MSI GS30 Shadow | |
| SCHENKER XMG A305 | |
| MSI GamingDock | |
| 1366x768 Medium Overall Quality, Medium Textures (sorteer op waarde) | |
| MSI GS30 Shadow | |
| SCHENKER XMG A305 | |
| MSI GamingDock | |
| 1024x768 Low Overall Quality, Medium Textures (sorteer op waarde) | |
| MSI GS30 Shadow | |
| SCHENKER XMG A305 | |
| MSI GamingDock | |
| Crysis 3 | |
| 1920x1080 Very High Preset AA:2xSM AF:16x (sorteer op waarde) | |
| MSI GS30 Shadow | |
| SCHENKER S413 | |
| MSI GamingDock | |
| 1366x768 High Preset AA:FX AF:16x (sorteer op waarde) | |
| MSI GS30 Shadow | |
| SCHENKER S413 | |
| MSI GamingDock | |
| 1366x768 Medium Preset AF:16x (sorteer op waarde) | |
| MSI GS30 Shadow | |
| SCHENKER S413 | |
| MSI GamingDock | |
| 1024x768 Low Preset (sorteer op waarde) | |
| MSI GS30 Shadow | |
| SCHENKER S413 | |
| MSI GamingDock | |
Geluidsniveau
| Onbelast |
| 29.4 / 36.2 / 42 dB (A) |
| Belasting |
| 52.8 / 53.6 dB (A) |
 | ||
30 dB stil 40 dB(A) hoorbaar 50 dB(A) luid |
||
min: | ||
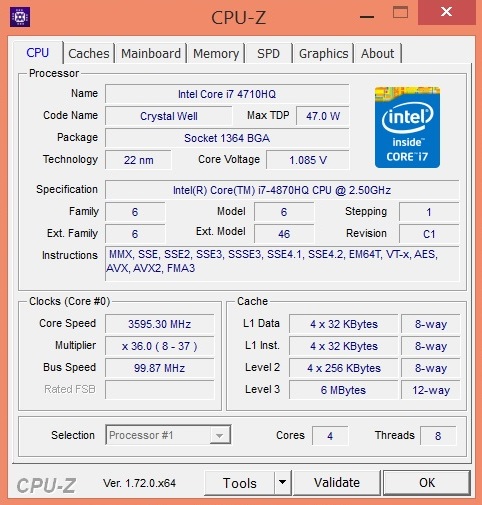
| MSI GS30 Shadow Iris Pro Graphics 5200, 4870HQ | SCHENKER S413 Iris Pro Graphics 5200, 4750HQ | Alienware 13 GeForce GTX 860M, 4210U | SCHENKER XMG A305 GeForce GTX 960M, 4710MQ | SCHENKER XMG C405 GeForce GTX 965M, 4720HQ | Razer Blade 14 2015 GeForce GTX 970M, 4720HQ | |
|---|---|---|---|---|---|---|
| Noise | 12% | 17% | 10% | 2% | 11% | |
| Idle Minimum * | 29.4 | 30.1 -2% | 29.2 1% | 29.4 -0% | 29.2 1% | 29.7 -1% |
| Idle Average * | 36.2 | 30.7 15% | 29.4 19% | 30.1 17% | 34.6 4% | 29.9 17% |
| Idle Maximum * | 42 | 33.3 21% | 29.8 29% | 30.8 27% | 38.8 8% | 30 29% |
| Load Average * | 52.8 | 46.4 12% | 37.6 29% | 49.2 7% | 54 -2% | 42.1 20% |
| Load Maximum * | 53.6 | 46.7 13% | 50.8 5% | 53.8 -0% | 54.4 -1% | 59 -10% |
* ... kleiner is beter
(-) De maximumtemperatuur aan de bovenzijde bedraagt 49.8 °C / 122 F, vergeleken met het gemiddelde van 40.4 °C / 105 F, variërend van 21.2 tot 68.8 °C voor de klasse Gaming.
(-) De bodem warmt op tot een maximum van 52.5 °C / 127 F, vergeleken met een gemiddelde van 43.2 °C / 110 F
(±) Bij onbelast gebruik bedraagt de gemiddelde temperatuur voor de bovenzijde 33 °C / 91 F, vergeleken met het apparaatgemiddelde van 33.8 °C / 93 F.
(+) De handpalmsteunen en het touchpad bereiken maximaal de huidtemperatuur (32.6 °C / 90.7 F) en zijn dus niet heet.
(-) De gemiddelde temperatuur van de handpalmsteun van soortgelijke toestellen bedroeg 28.9 °C / 84 F (-3.7 °C / -6.7 F).
| MSI GS30 Shadow Iris Pro Graphics 5200, 4870HQ | SCHENKER S413 Iris Pro Graphics 5200, 4750HQ | Alienware 13 GeForce GTX 860M, 4210U | SCHENKER XMG A305 GeForce GTX 960M, 4710MQ | SCHENKER XMG C405 GeForce GTX 965M, 4720HQ | Razer Blade 14 2015 GeForce GTX 970M, 4720HQ | |
|---|---|---|---|---|---|---|
| Heat | 4% | 8% | 3% | -10% | 9% | |
| Maximum Upper Side * | 49.8 | 41.9 16% | 44.5 11% | 46.2 7% | 47.8 4% | 51.6 -4% |
| Maximum Bottom * | 52.5 | 54.6 -4% | 60.2 -15% | 47.7 9% | 60.4 -15% | 51.2 2% |
| Idle Upper Side * | 35.2 | 34.2 3% | 29.4 16% | 35 1% | 37.7 -7% | 29.2 17% |
| Idle Bottom * | 36.8 | 36.7 -0% | 29.6 20% | 38.2 -4% | 44.8 -22% | 28.8 22% |
* ... kleiner is beter
| Uit / Standby | |
| Inactief | |
| Belasting |
|
| MSI GS30 Shadow Iris Pro Graphics 5200, 4870HQ | SCHENKER S413 Iris Pro Graphics 5200, 4750HQ | Alienware 13 GeForce GTX 860M, 4210U | SCHENKER XMG A305 GeForce GTX 960M, 4710MQ | SCHENKER XMG C405 GeForce GTX 965M, 4720HQ | Razer Blade 14 2015 GeForce GTX 970M, 4720HQ | |
|---|---|---|---|---|---|---|
| Power Consumption | -13% | 19% | -49% | -86% | ||
| Idle Minimum * | 7.5 | 10.1 -35% | 5.1 32% | 11.4 -52% | 15.8 -111% | |
| Idle Average * | 11.6 | 14.9 -28% | 7.3 37% | 16.3 -41% | 22.8 -97% | |
| Idle Maximum * | 21.2 | 15.4 27% | 11.2 47% | 22.6 -7% | 27.3 -29% | |
| Load Average * | 65.4 | 73 -12% | 51.5 21% | 92.4 -41% | 106.8 -63% | |
| Load Maximum * | 66.4 | 78.3 -18% | 92.9 -40% | 136 -105% | 152 -129% |
* ... kleiner is beter
| MSI GS30 Shadow Iris Pro Graphics 5200, 4870HQ | SCHENKER S413 Iris Pro Graphics 5200, 4750HQ | Alienware 13 GeForce GTX 860M, 4210U | SCHENKER XMG A305 GeForce GTX 960M, 4710MQ | SCHENKER XMG C405 GeForce GTX 965M, 4720HQ | Razer Blade 14 2015 GeForce GTX 970M, 4720HQ | |
|---|---|---|---|---|---|---|
| Batterijduur | 47% | 98% | 65% | 16% | ||
| Reader / Idle | 403 | 357 -11% | 723 79% | 420 4% | 380 -6% | |
| H.264 | 166 | 324 95% | 266 60% | |||
| WiFi | 210 | 257 22% | 292 39% | |||
| Load | 48 | 110 129% | 134 179% | 111 131% | 66 38% | |
| WiFi v1.3 | 236 | 222 |
Pro
Contra
Dit is een verkorte versie van het originele artikel. Het volledige Engelse testrapport vind je hier.
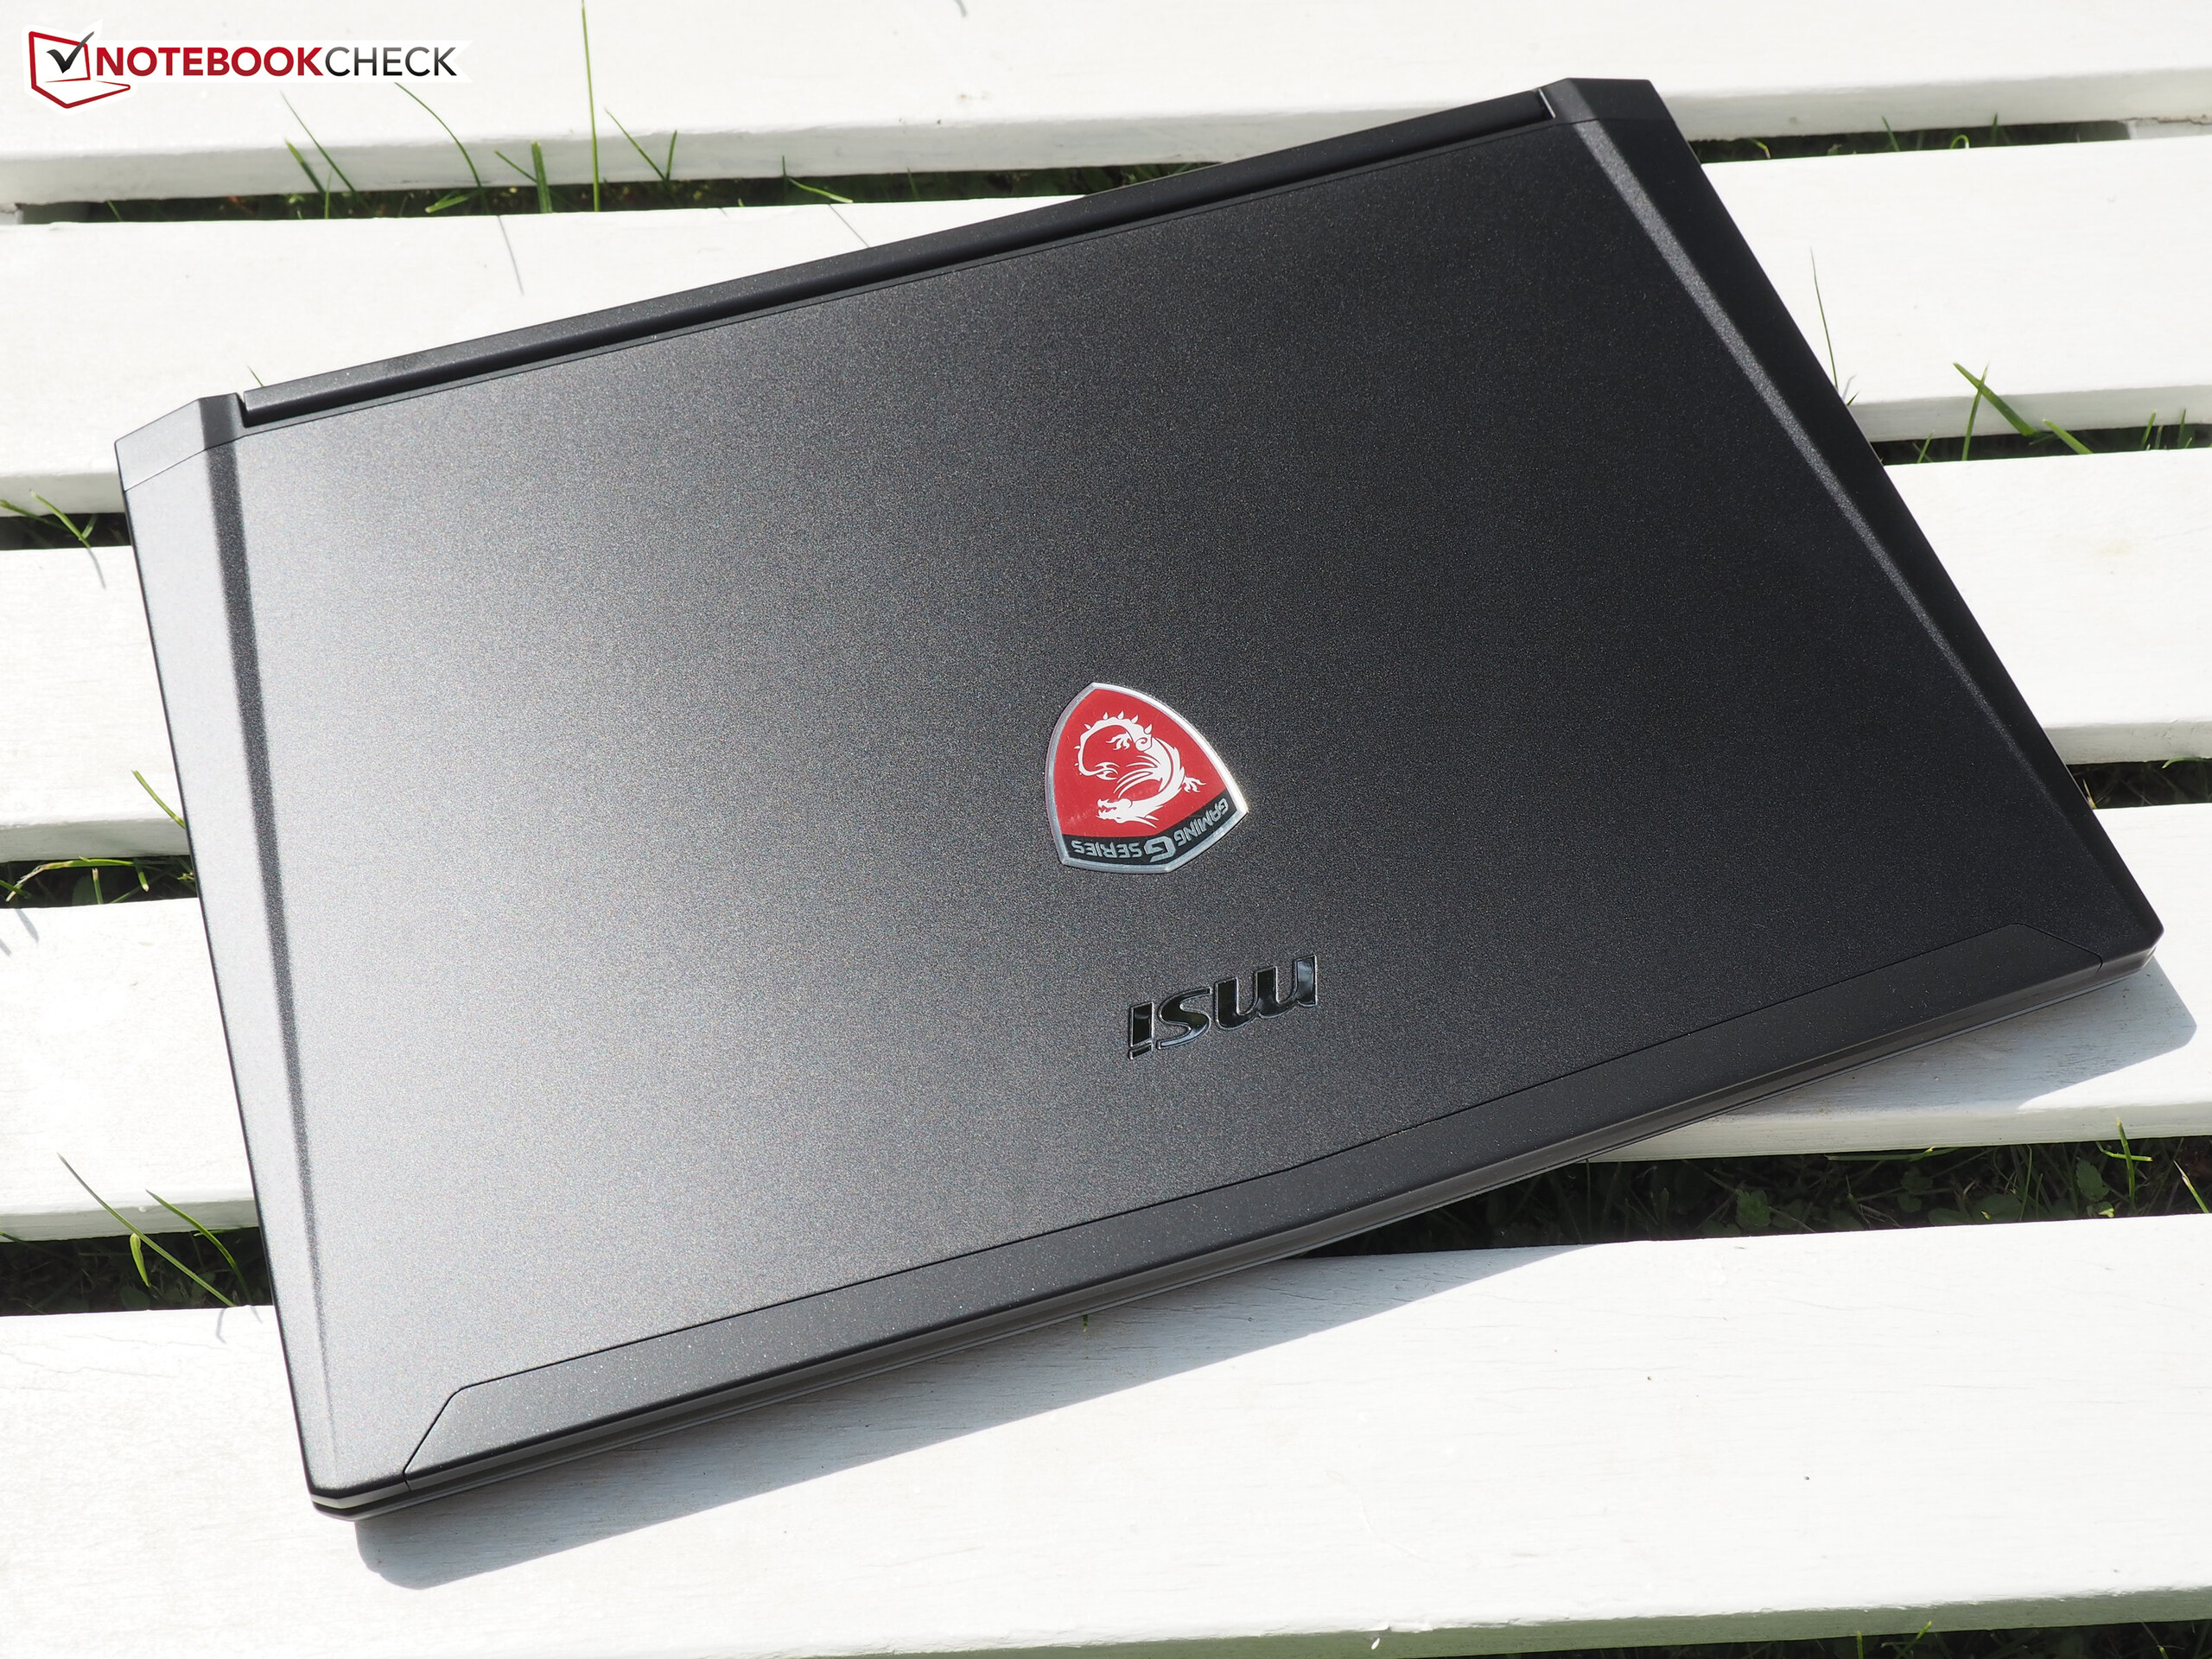
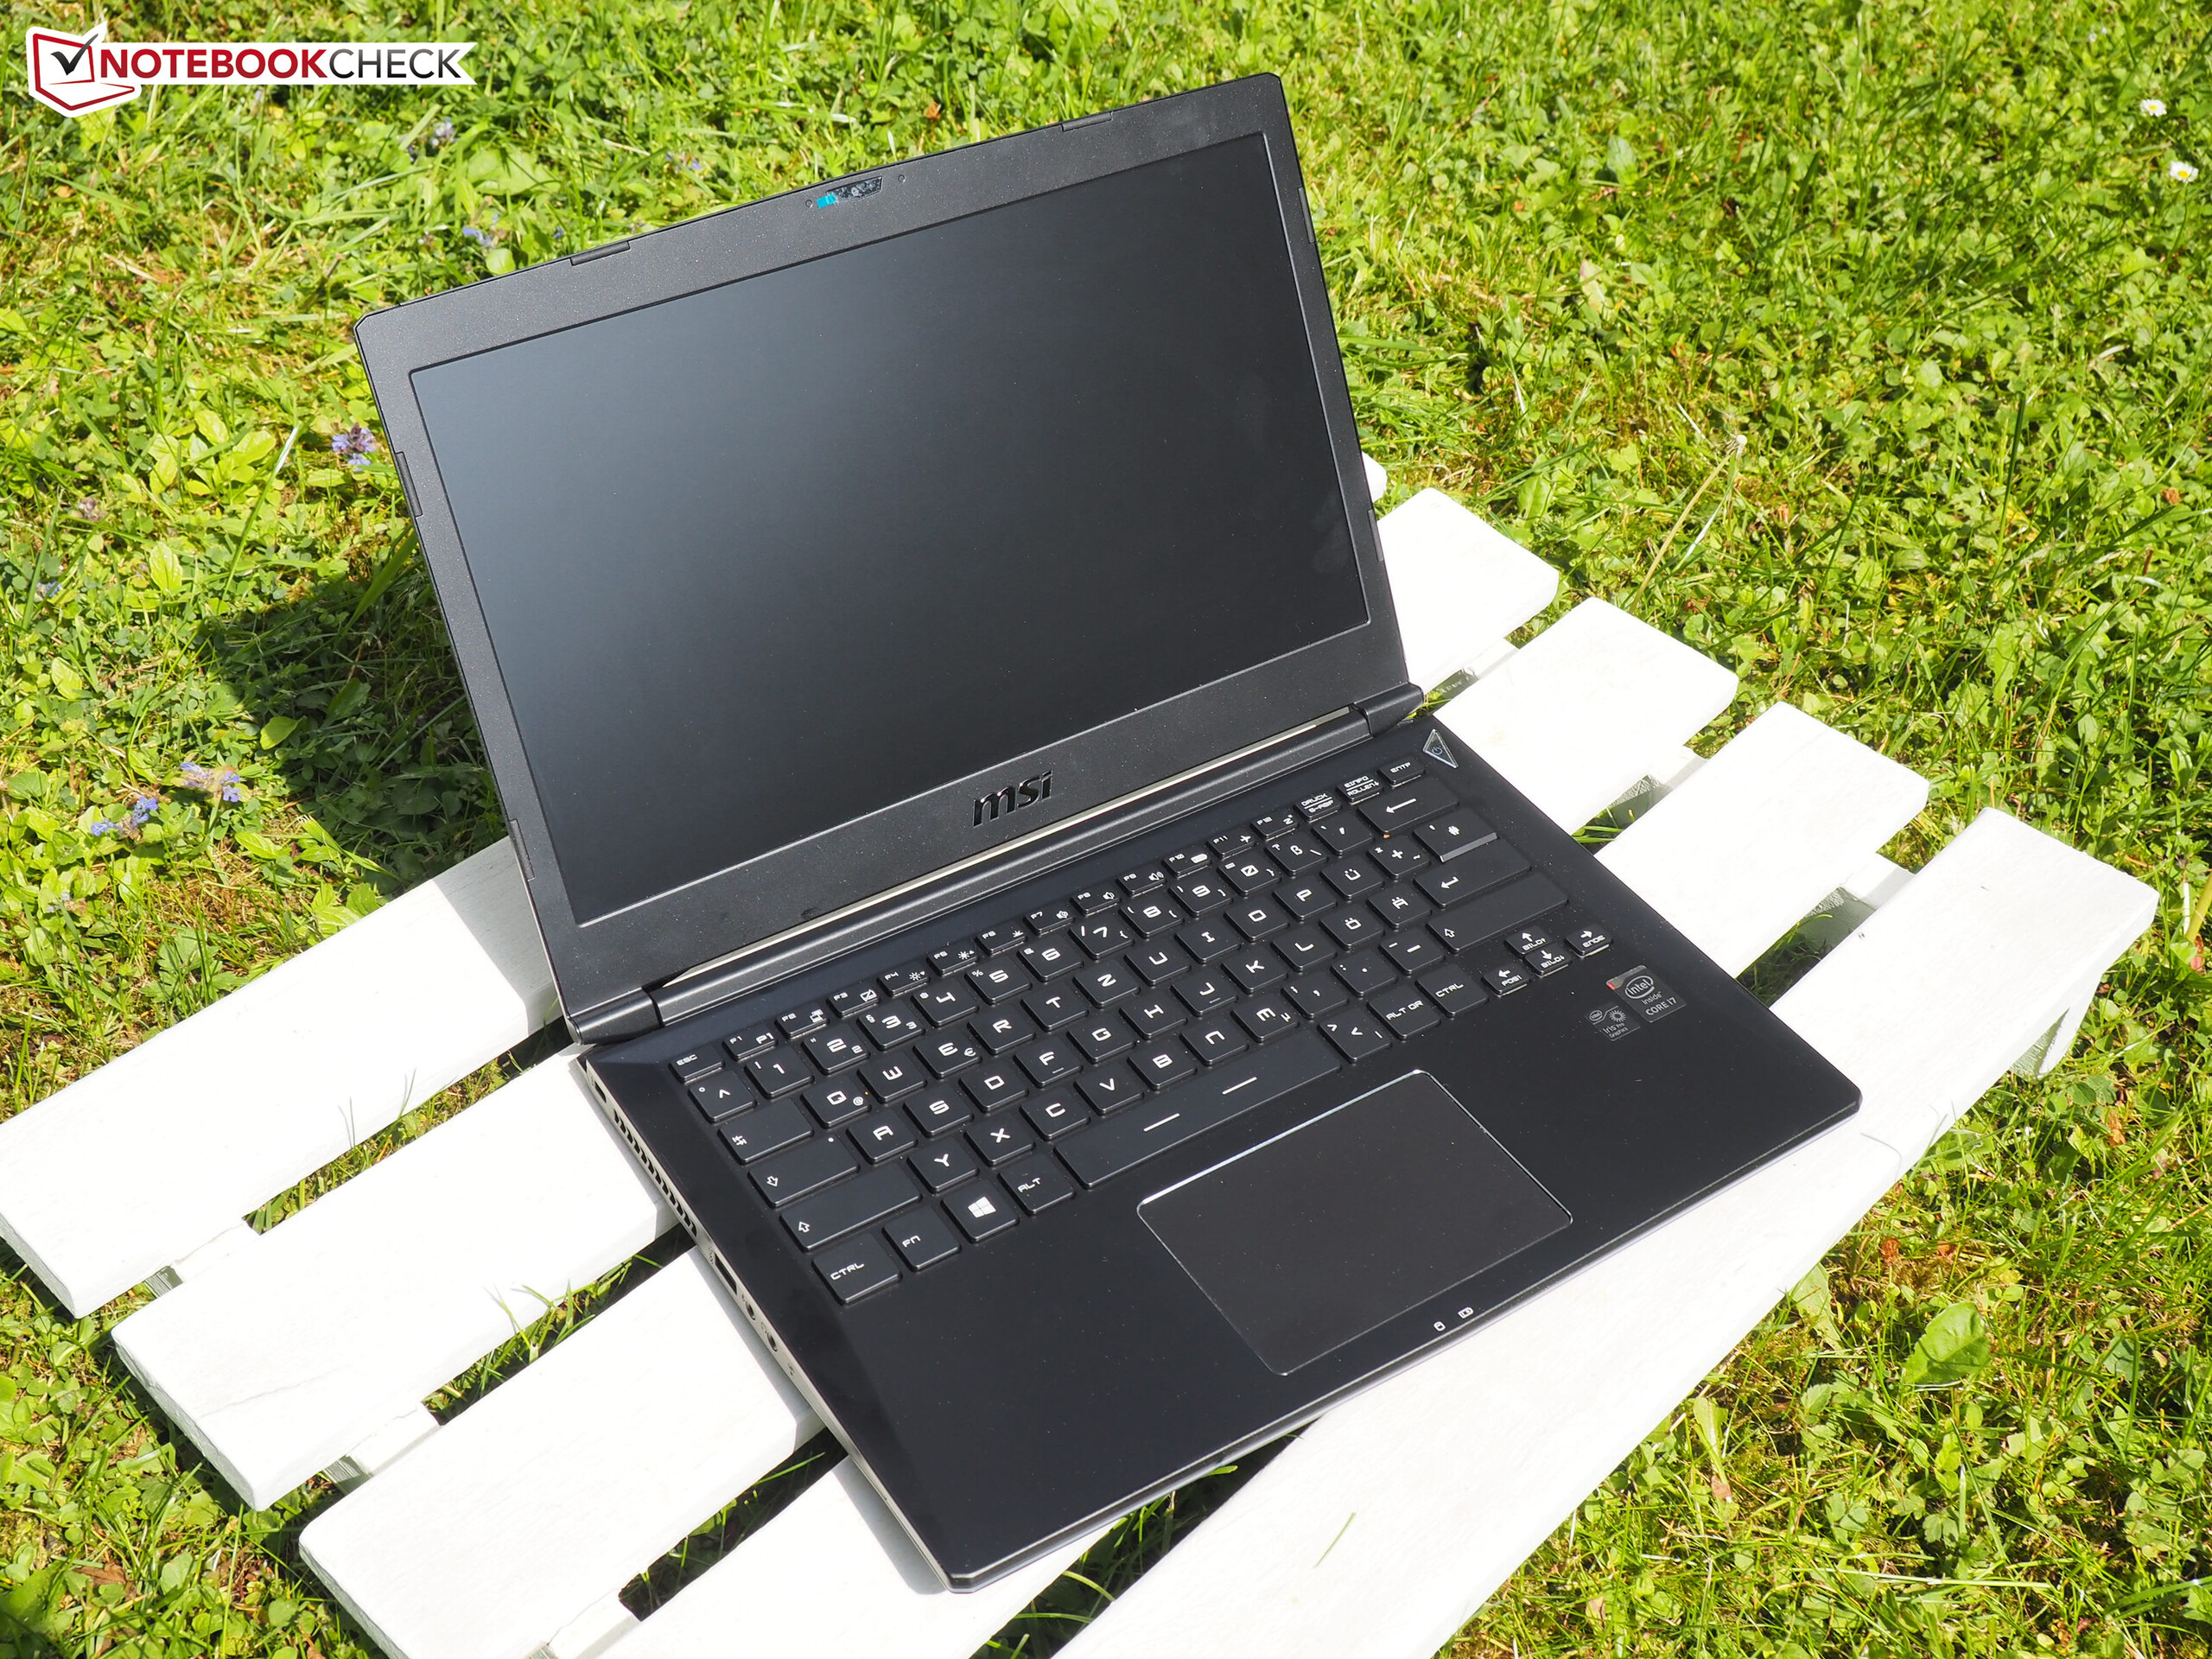
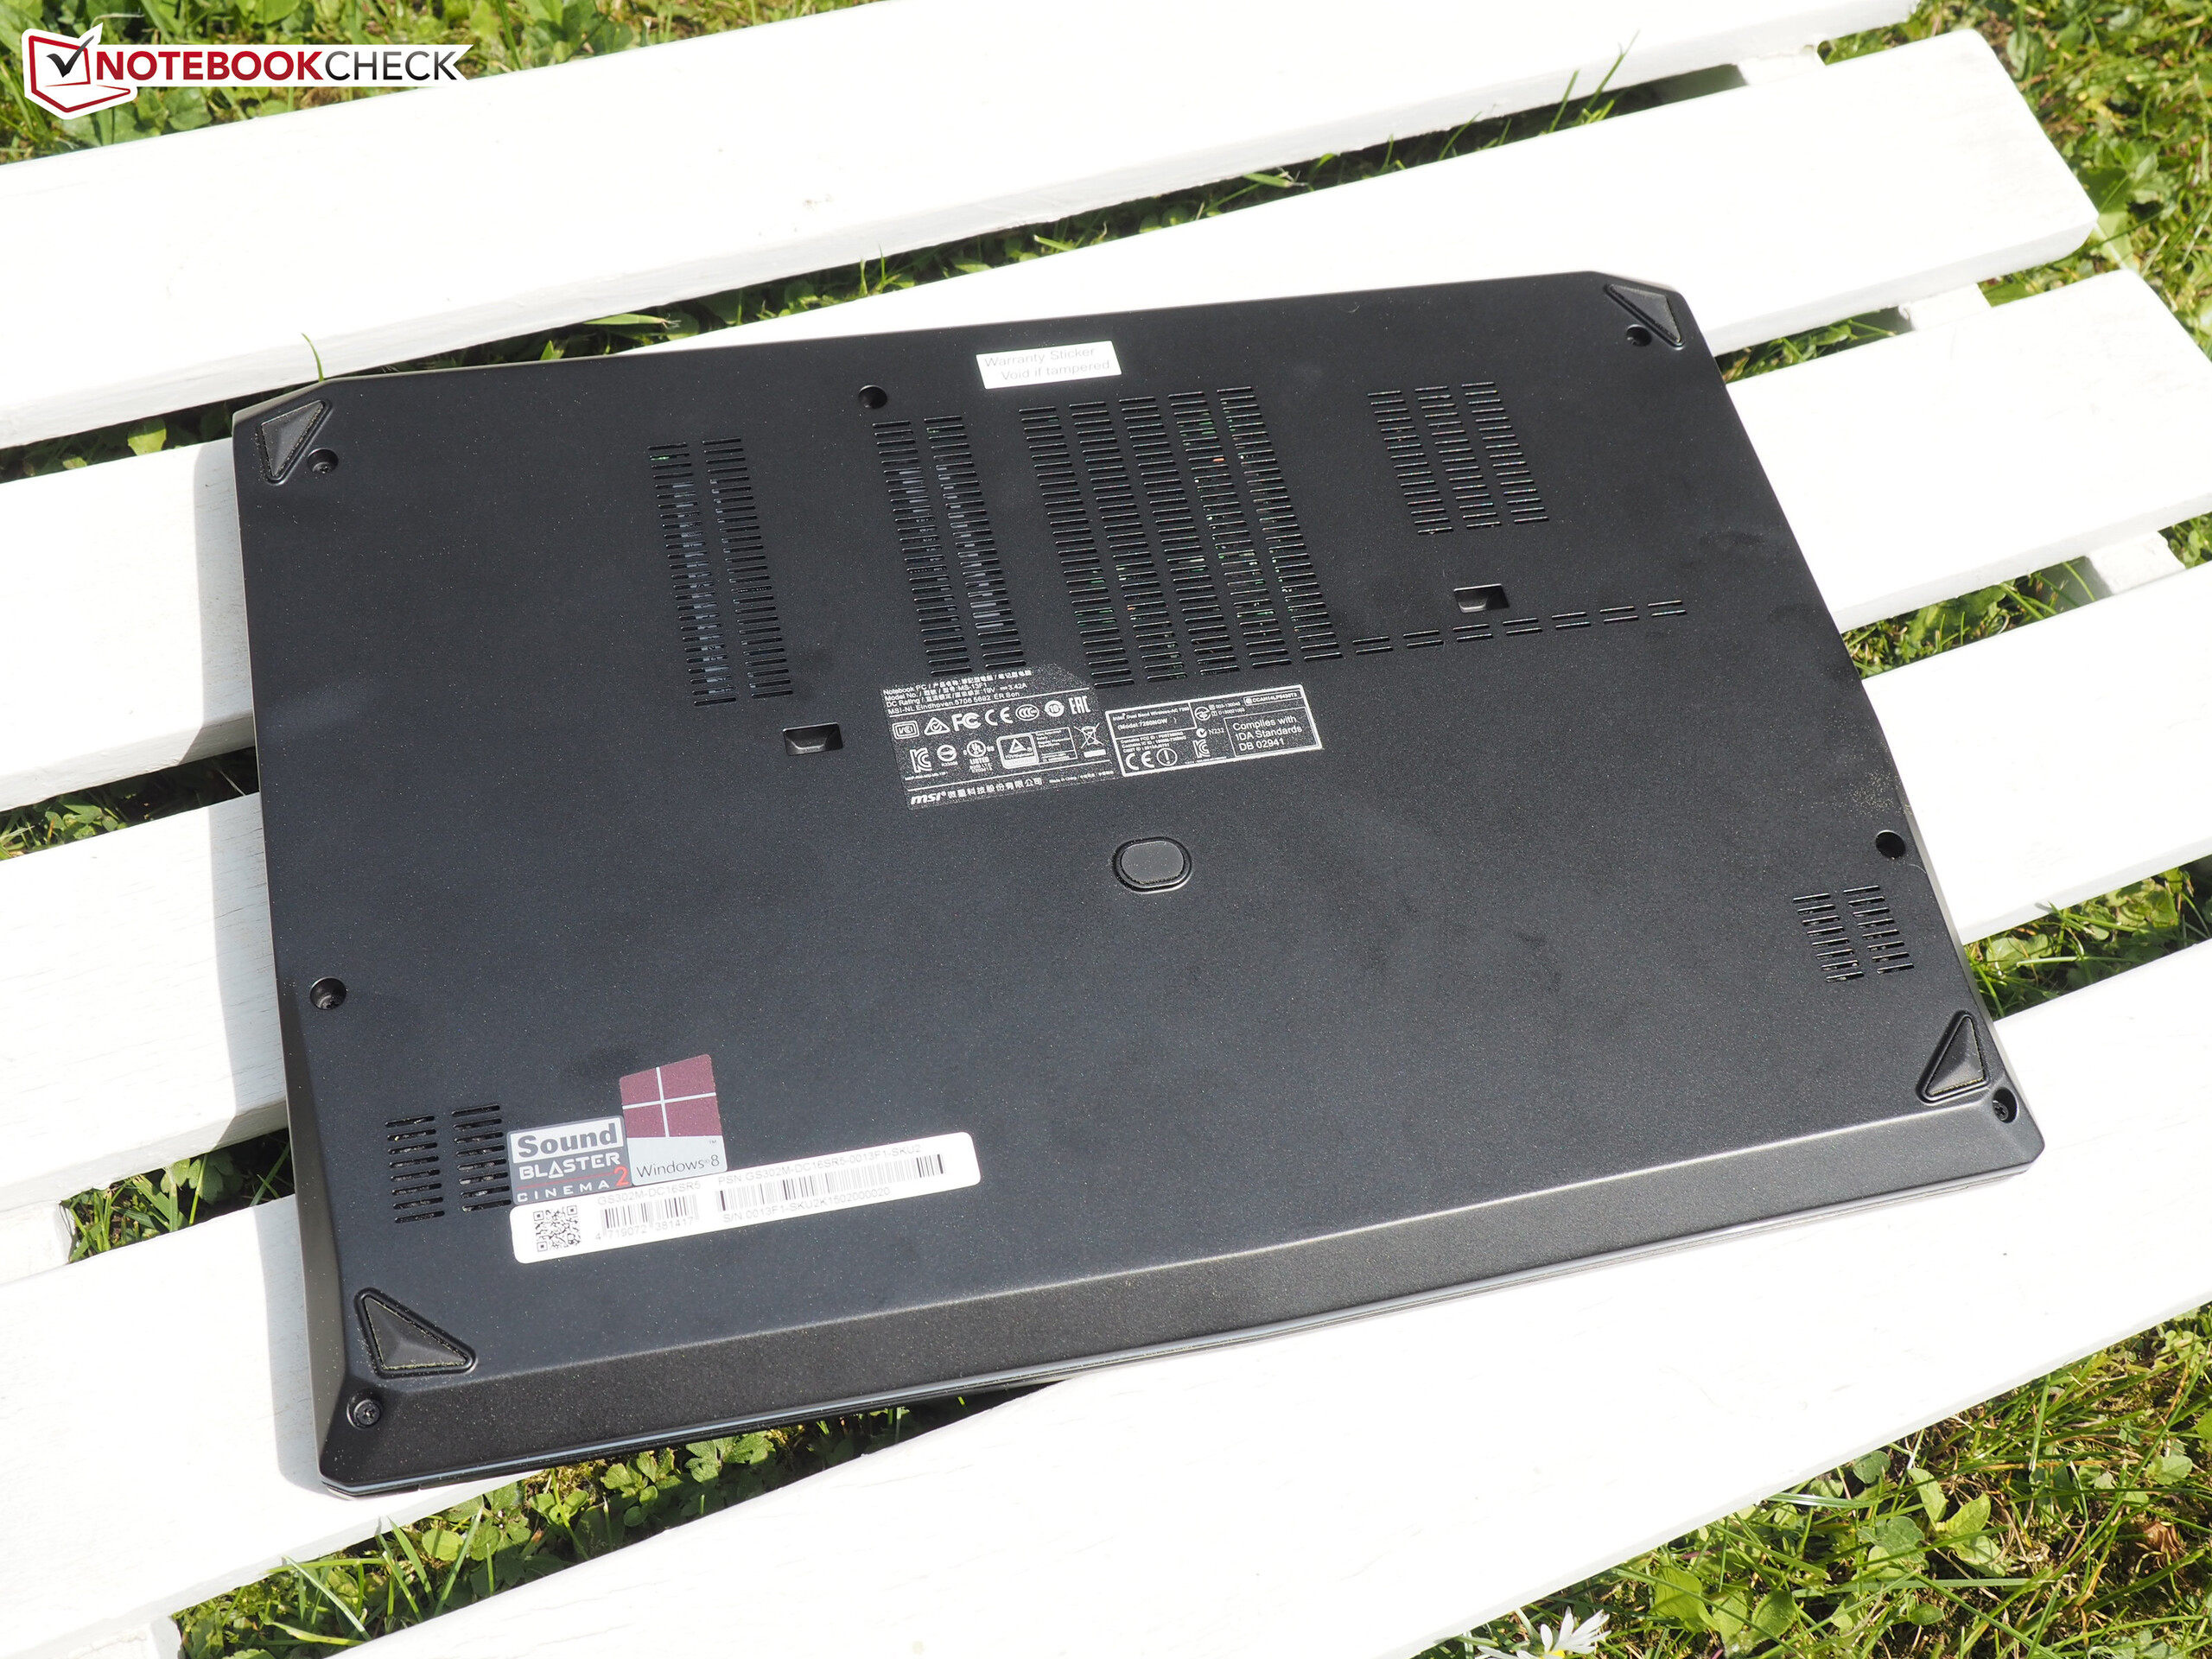
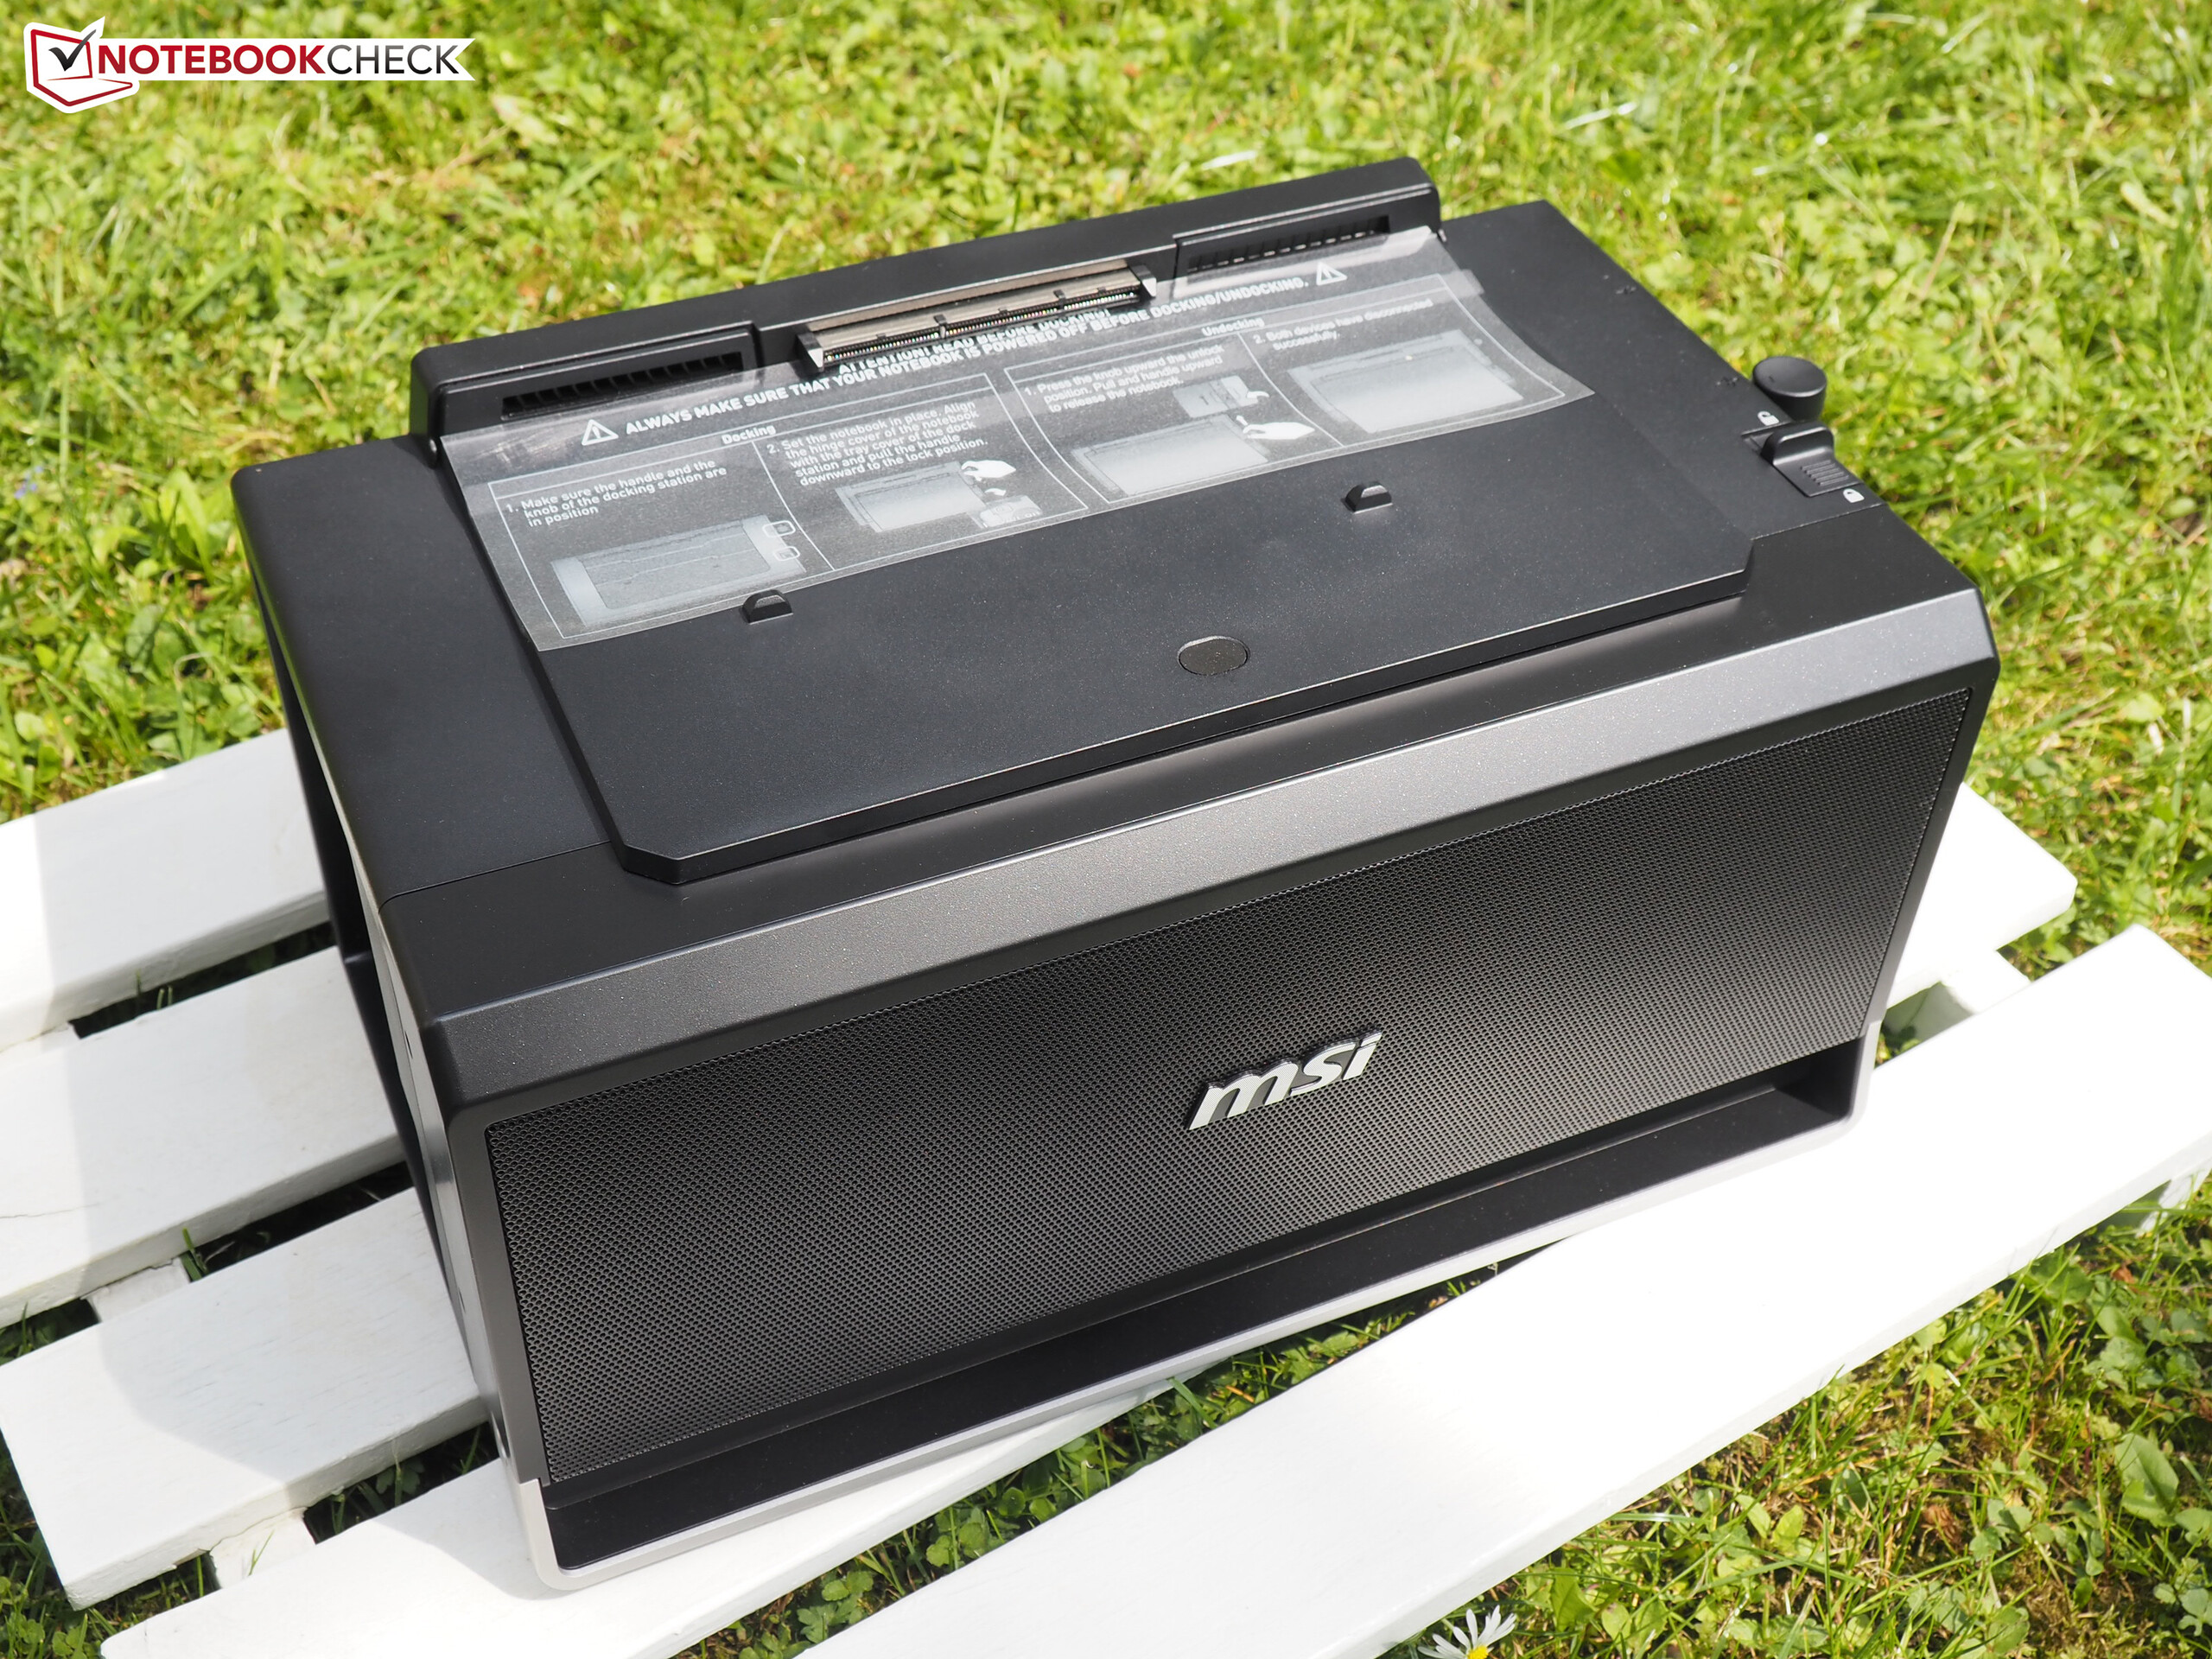
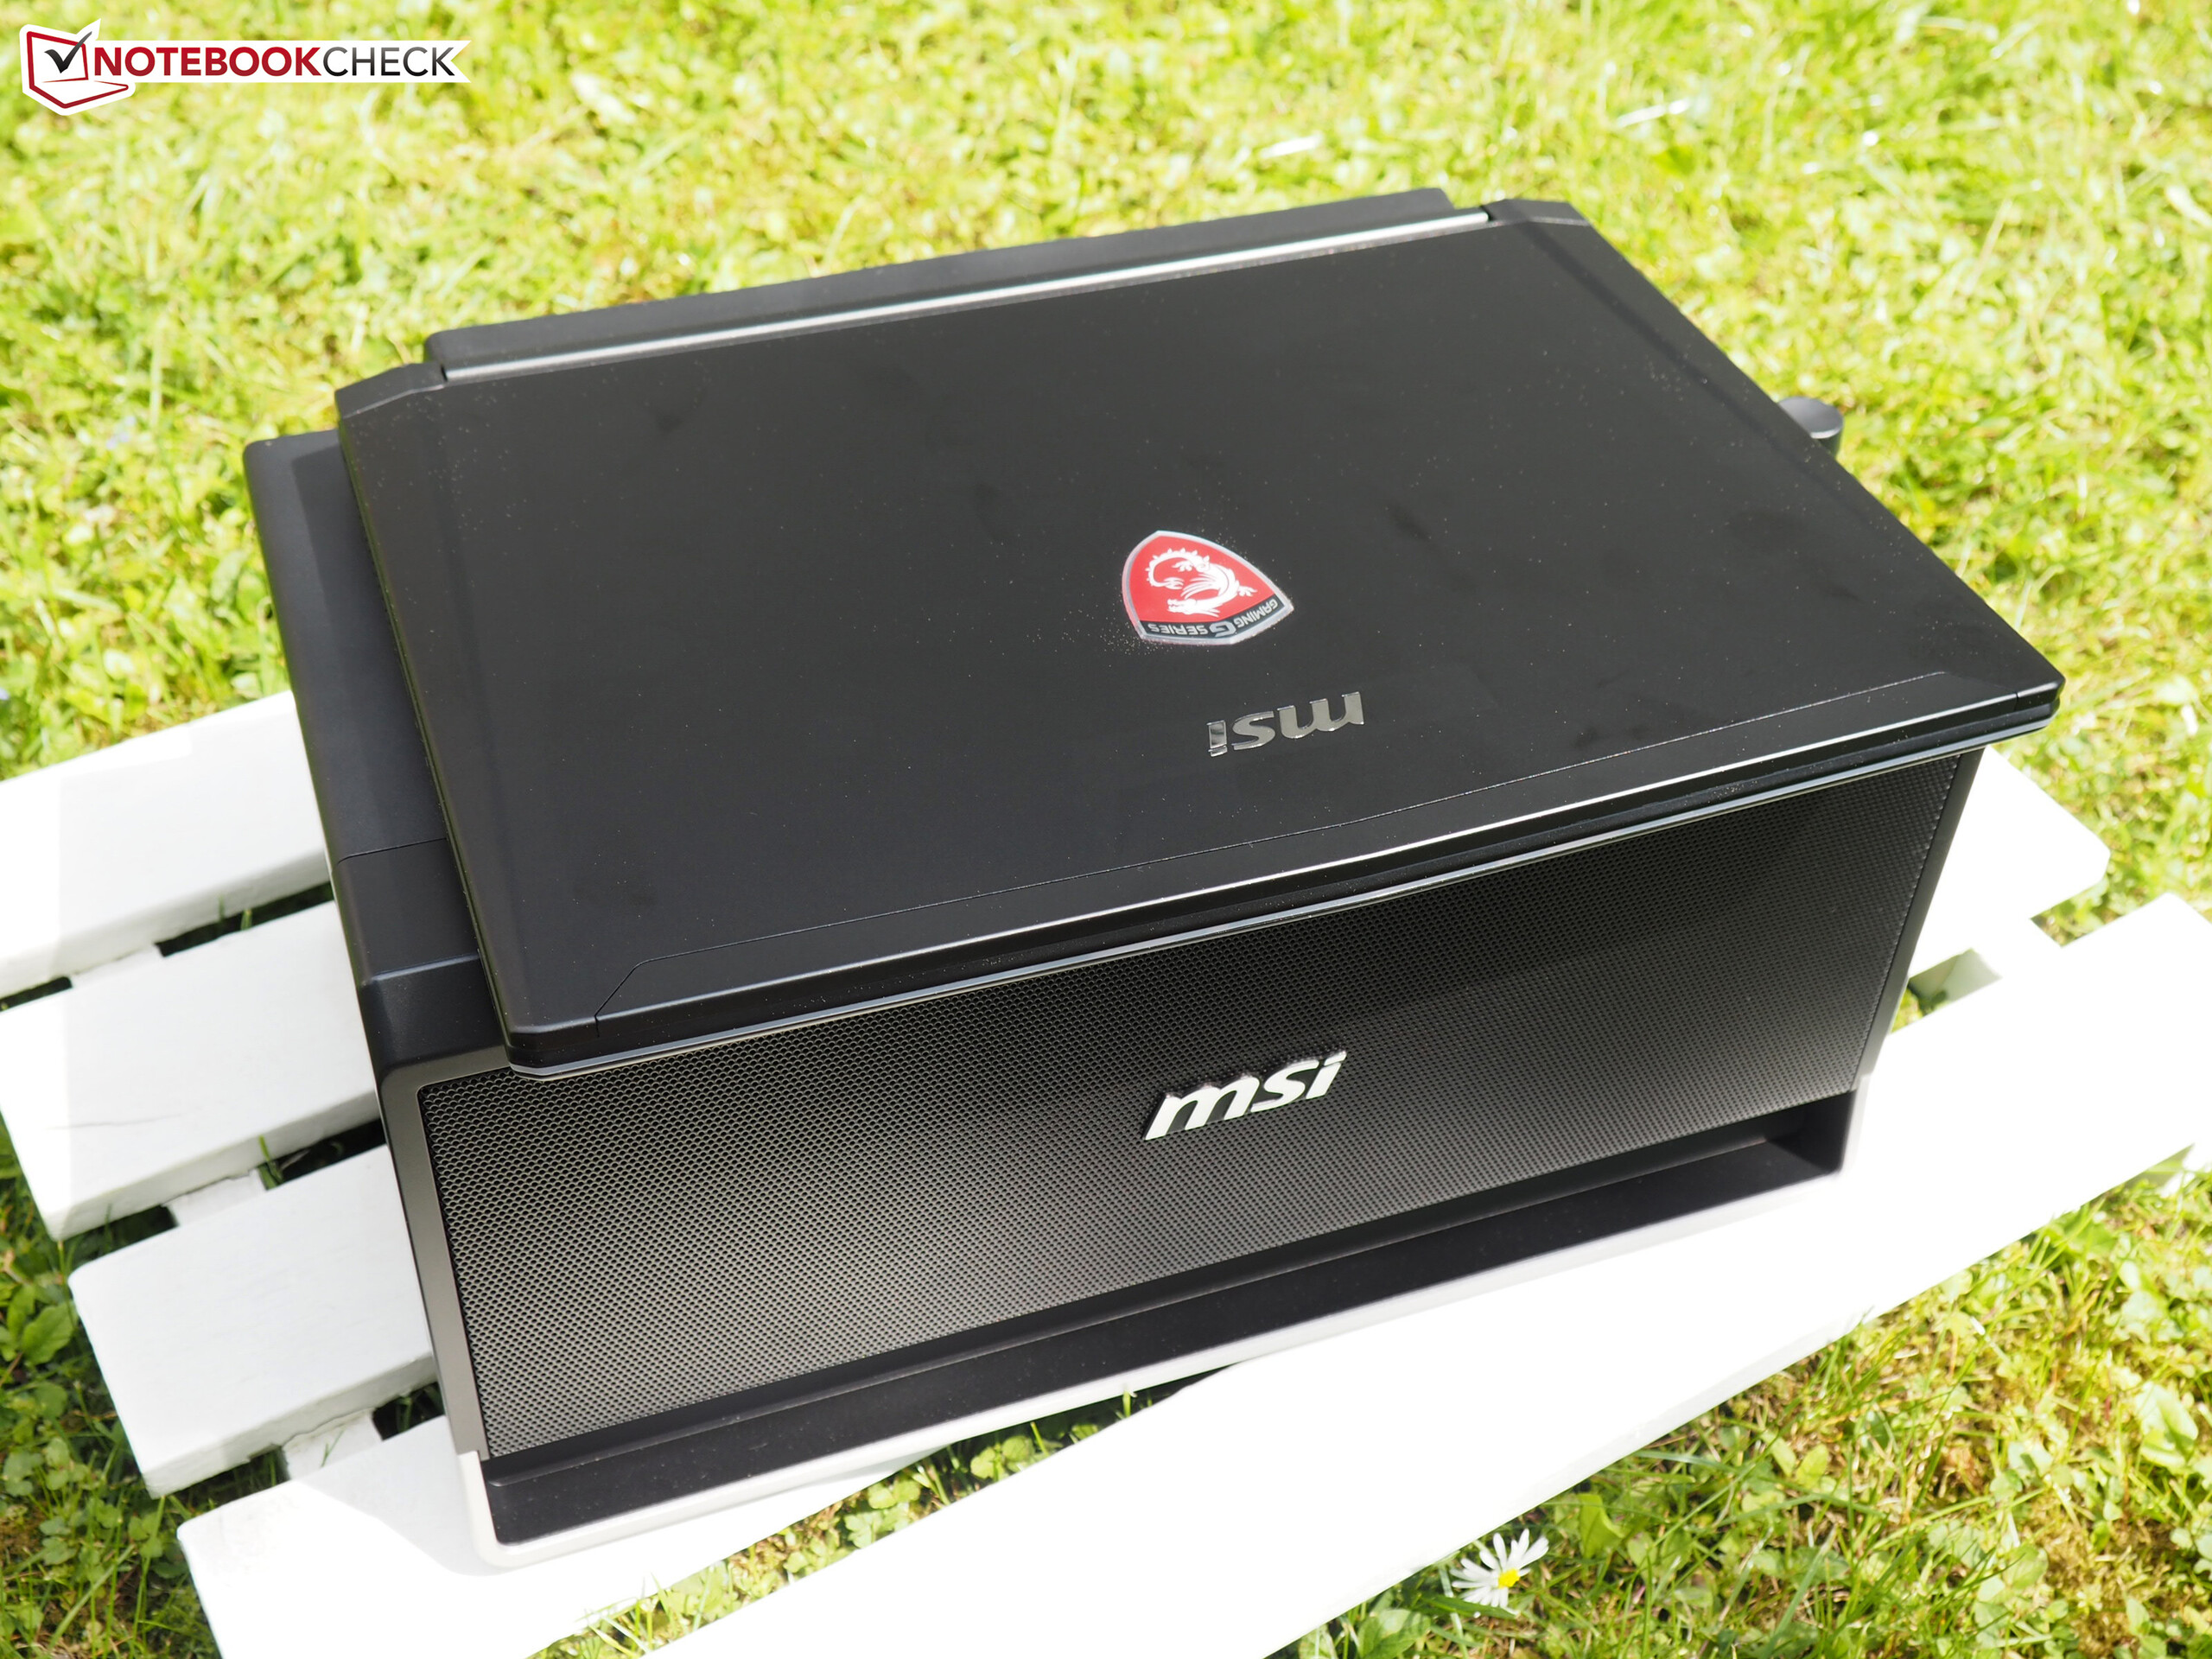
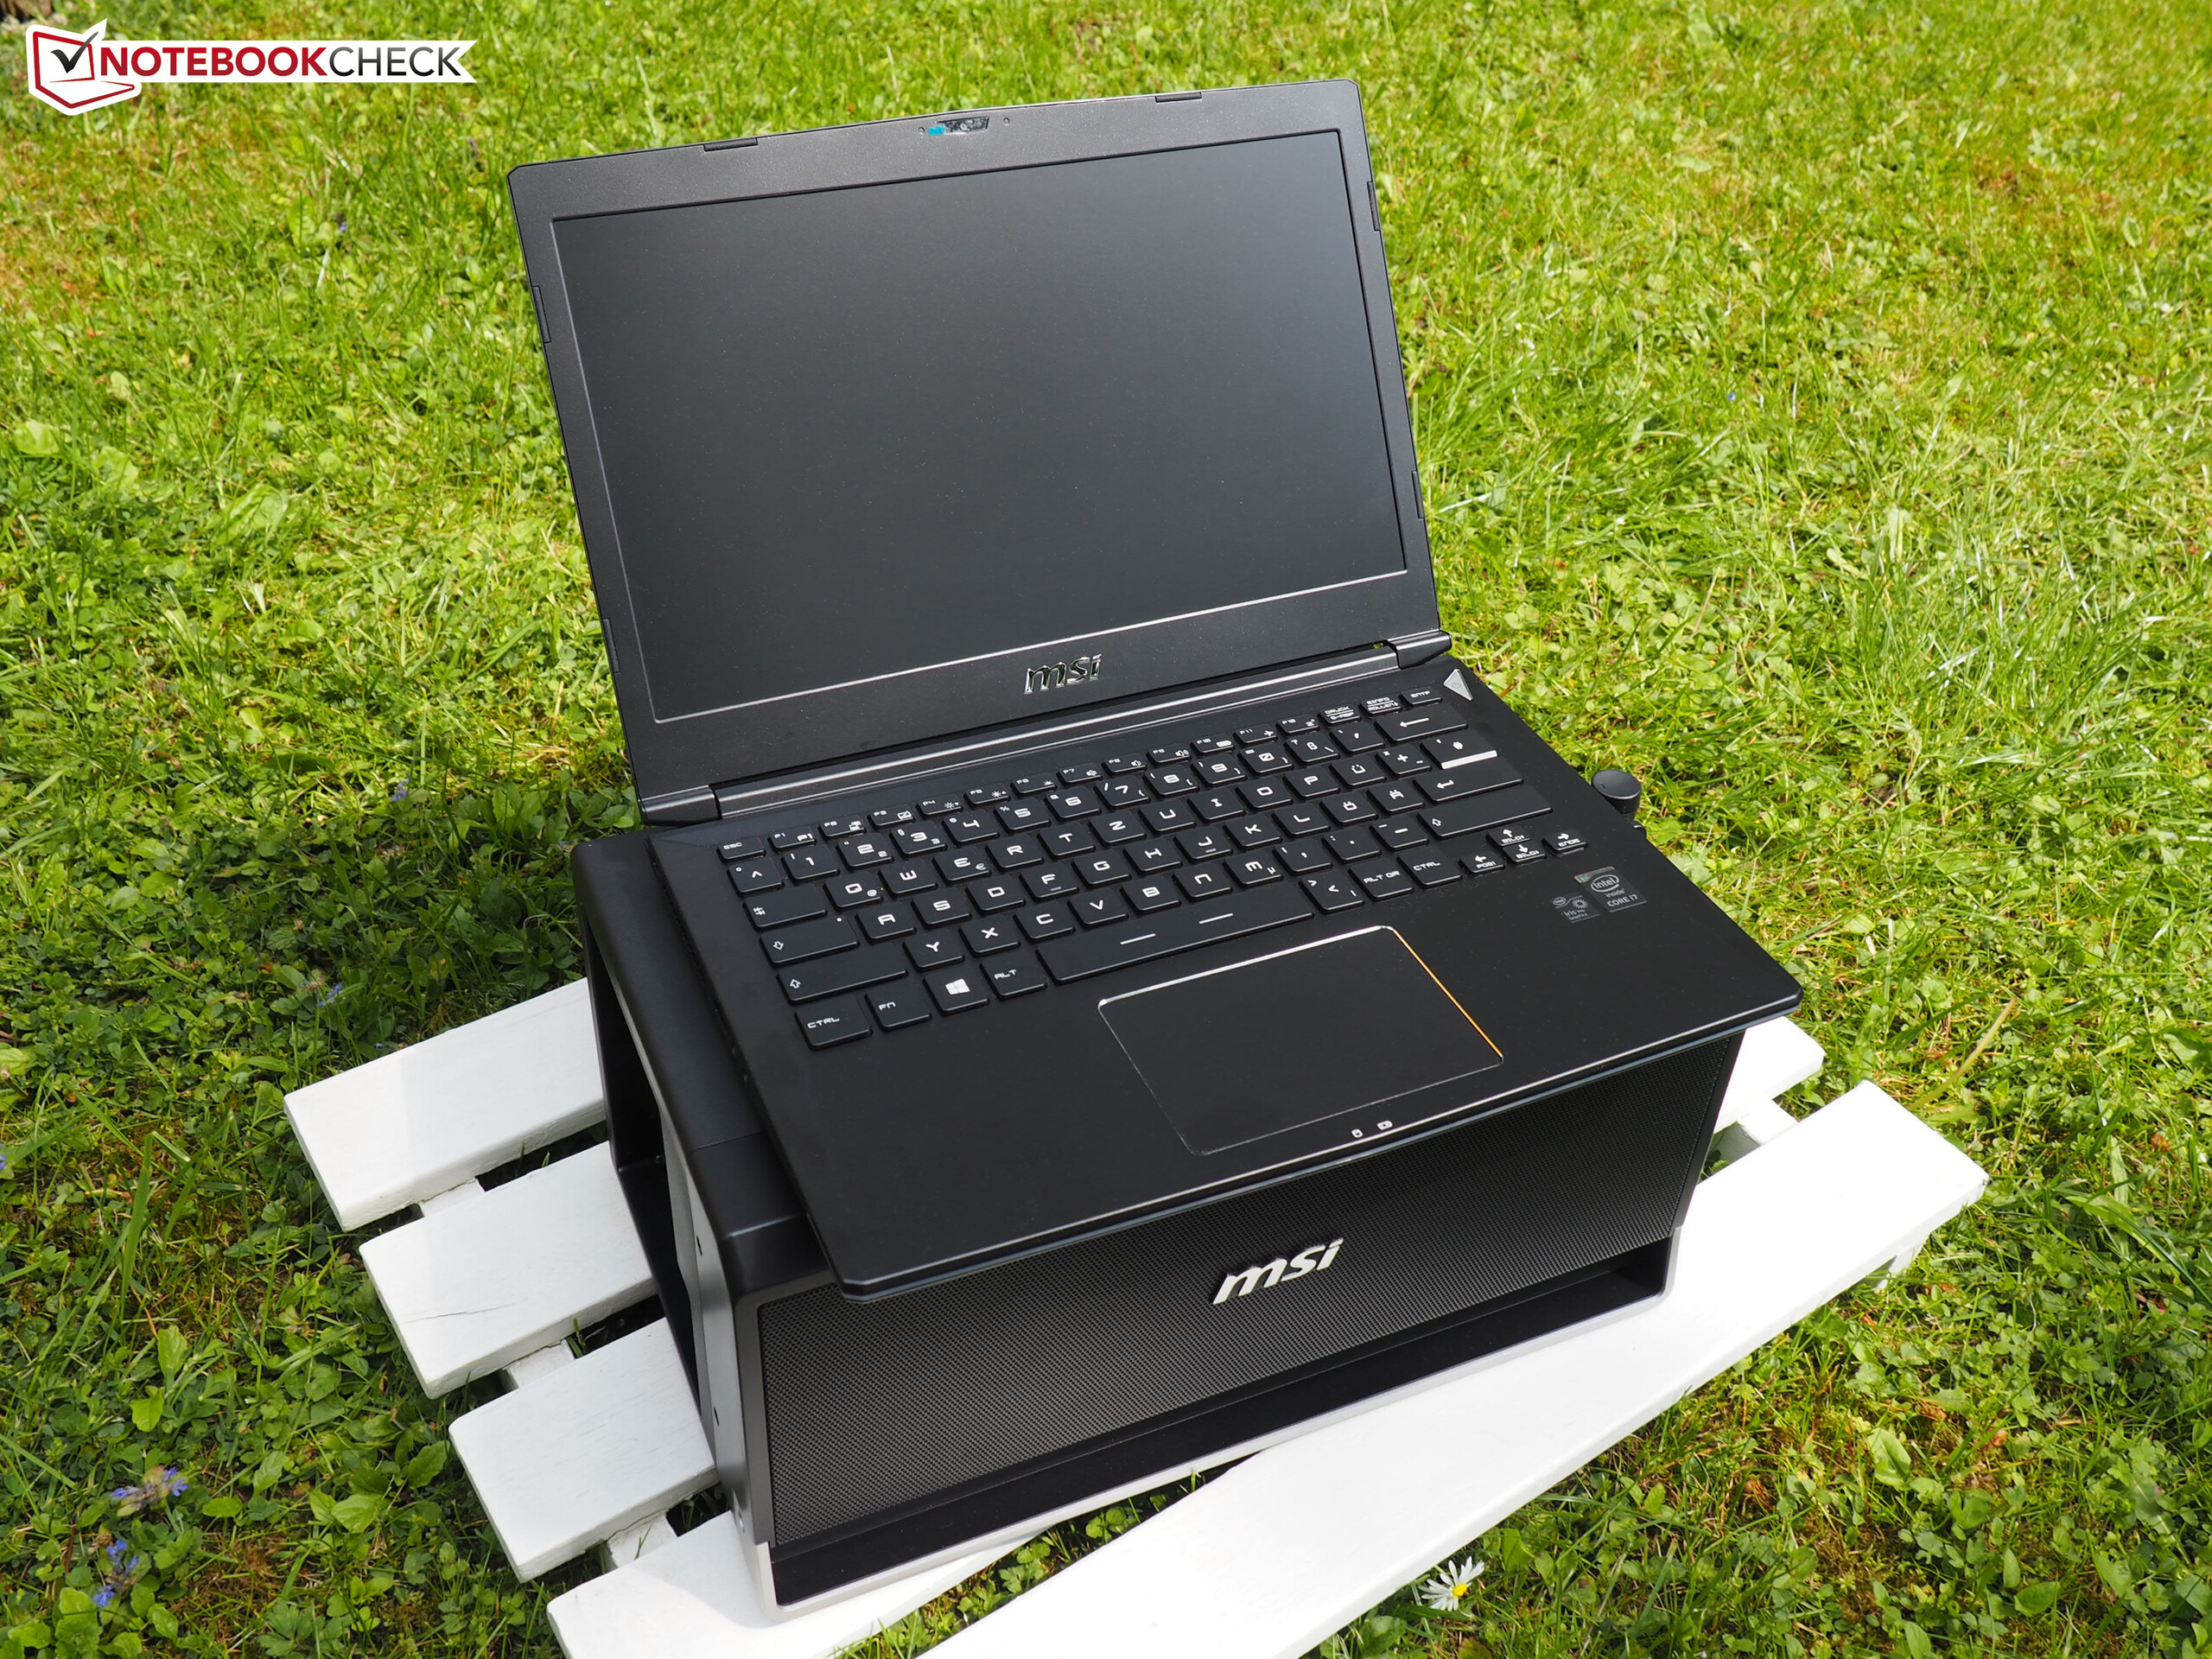
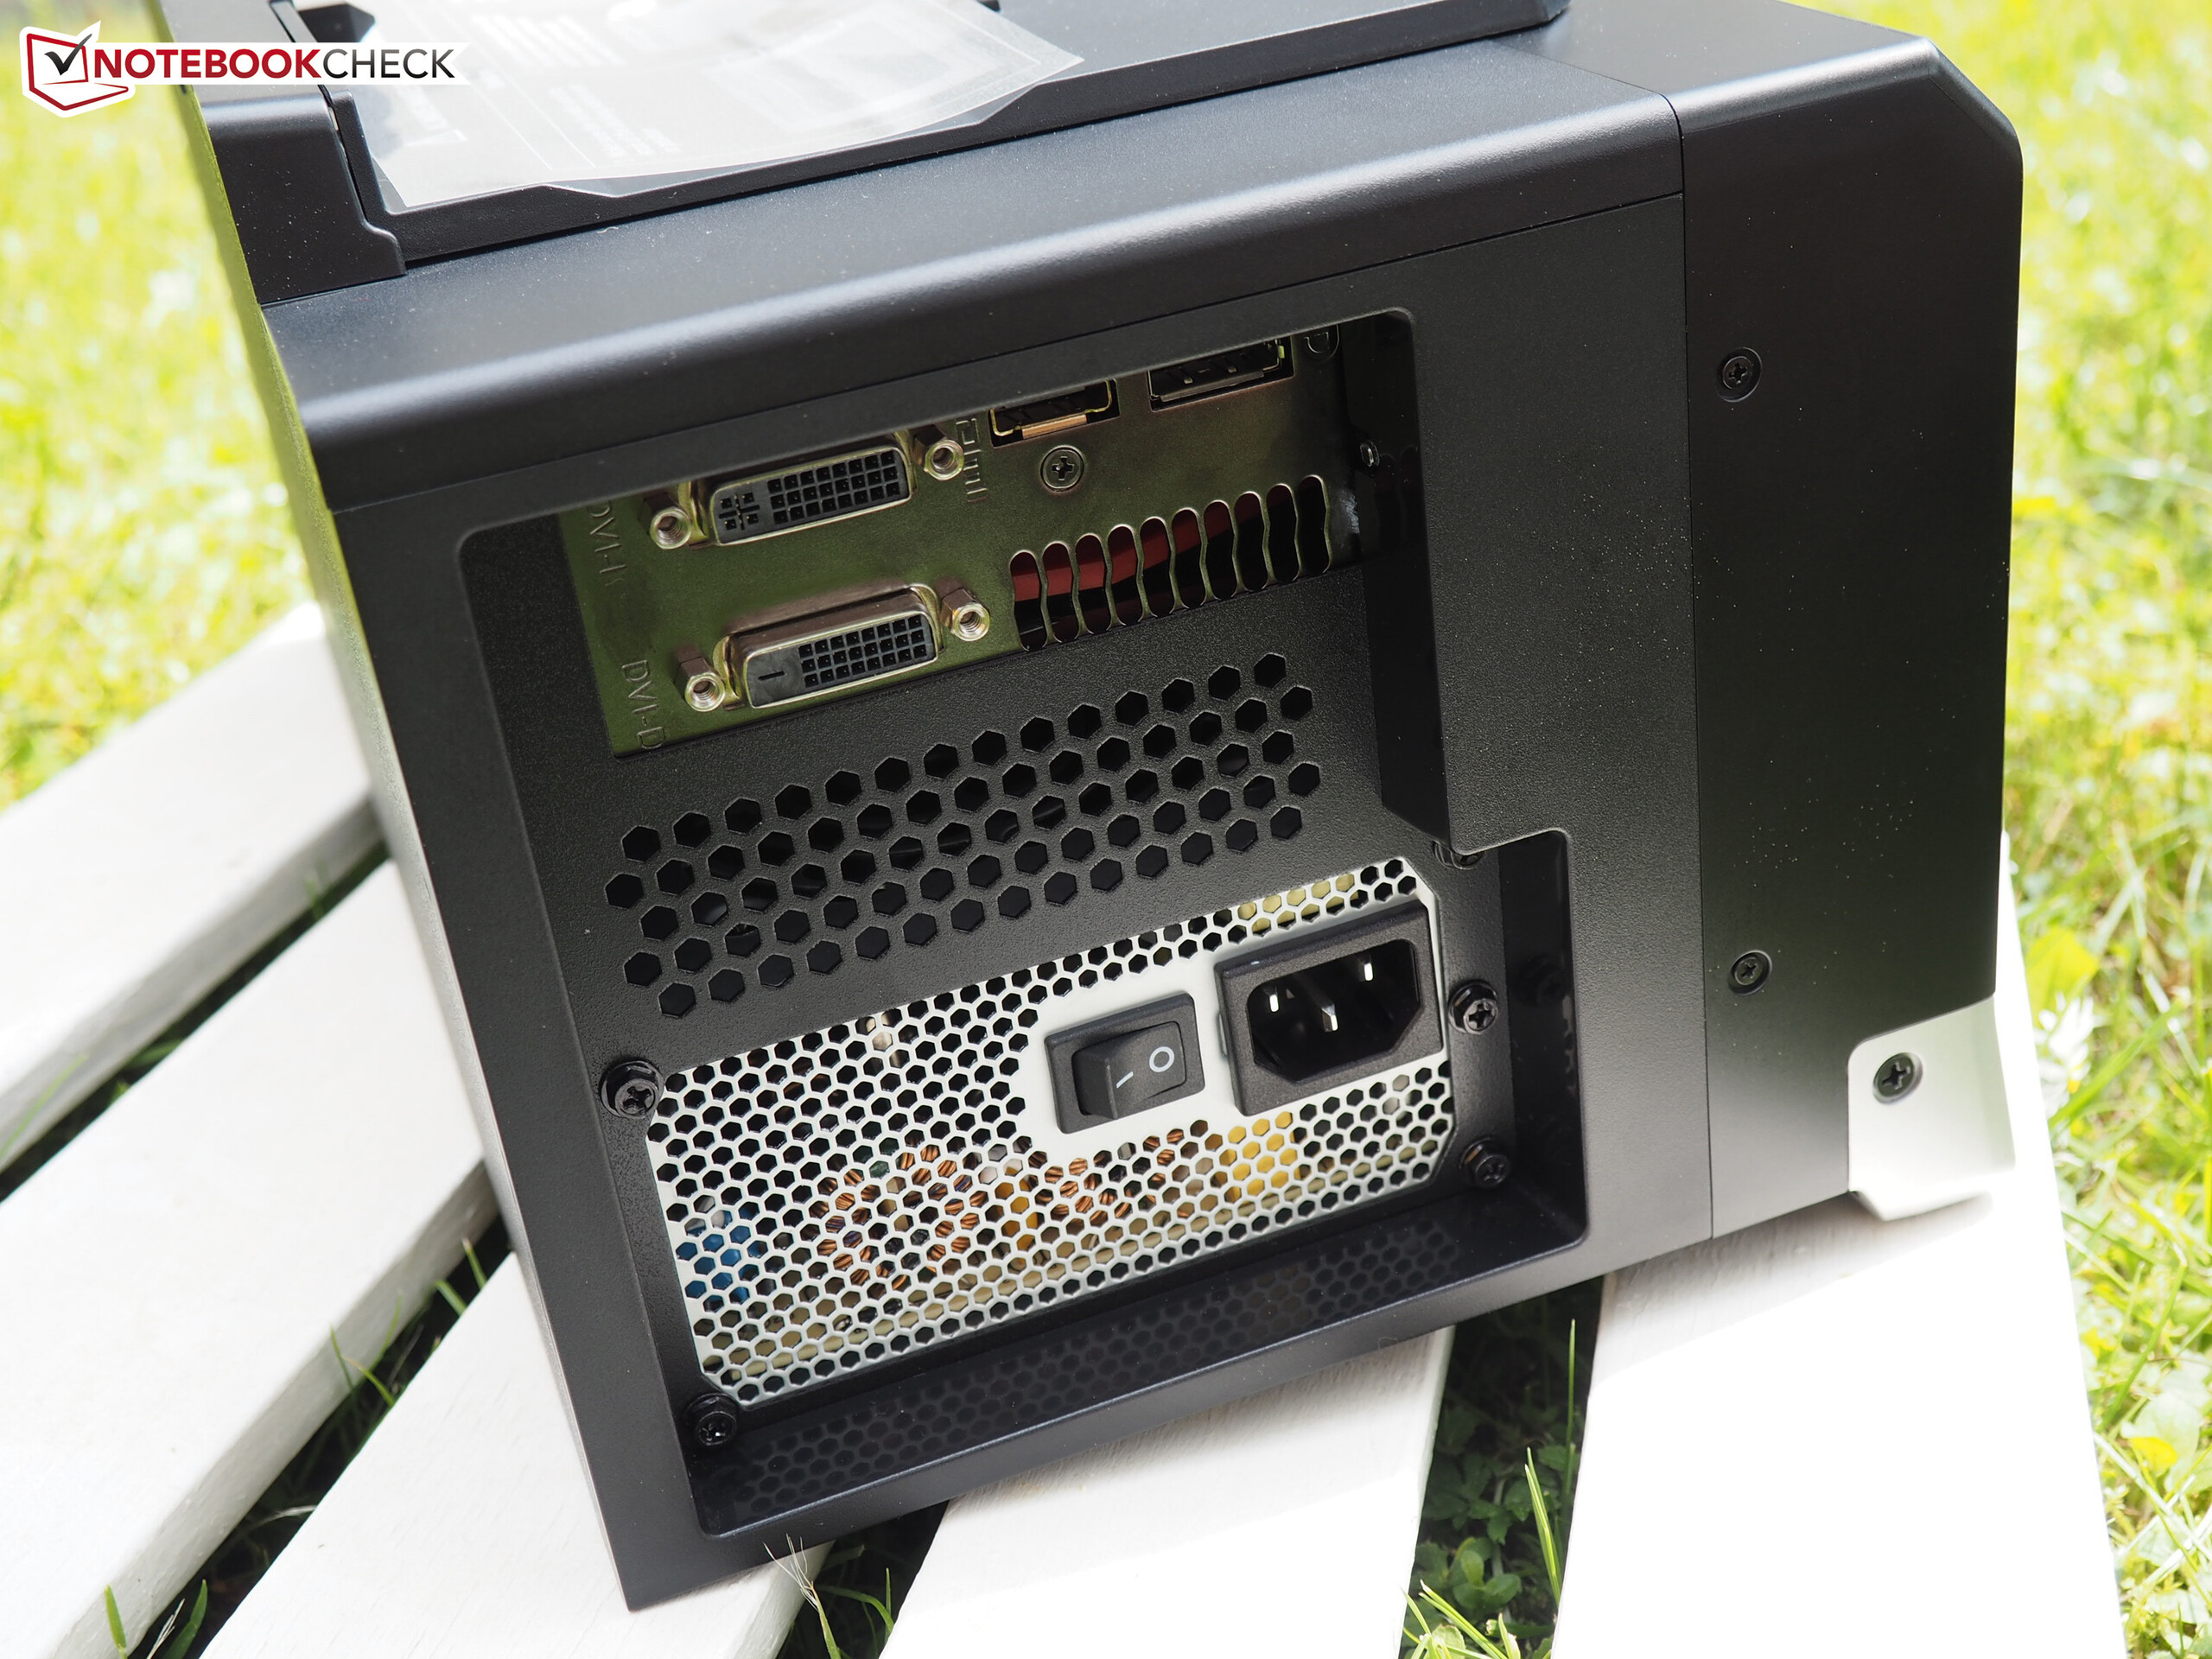
Buiten Alienware is MSI een van de weinige gaming bedrijven die de moed heeft om een notebook met een optionele graphics amplifier uit te brengen. Het riskante concept is echter aardig goed uitgevoerd. Door de heethoofdige Core i7-4870HQ kan de notebook tijdens inactiviteit al aardig luidruchtig zijn en dat schrikt sommige potentiële kopers misschien af. Dan hebben we nog niet vermeld dat de Turbo functionaliteit bij zwaardere systeembelasting nauwelijks wordt benut. Verder zijn de stevigheid van de behuizing, batterijduur, het ClickPad en de connectiviteit ook niet geweldig.
Op andere vlakken levert MSI wel goed werk af. Zowel het design, beeldscherm en docking station zijn aspecten waar de GS30 punten mee scoort. De desktop GPU maakt van de 13 inch notebook tevens een krachtig gaming platform, die de nieuwste games ook met hoge instellingen en resolutie vloeiend kan weergeven.
Het is voor ons lastig om een systeem als deze in een categorie te plaatsen. Eigenlijk moet de GS30 door de geïntegreerde Iris Pro 5200 als een subnotebook worden gezien, maar dat doet geen recht aan het totaalconcept. Uiteindelijk besluiten we hem daarom in de categorie gaming notebooks te plaatsen, want je hoeft de grafische kaart of het docking station immers niet apart aan te schaffen.
Met de benchmarkresultaten van de GeForce GTX 970 zouden de gaming prestaties 100% in plaats van 84% (Iris Pro 5200) zijn en de totale score zou met 3% toenemen. Deze 3% hebben we handmatig in onze beoordelingstabel toegevoegd. Zonder het GamingDock zou de score in plaats van 82% slechts 79% zijn.
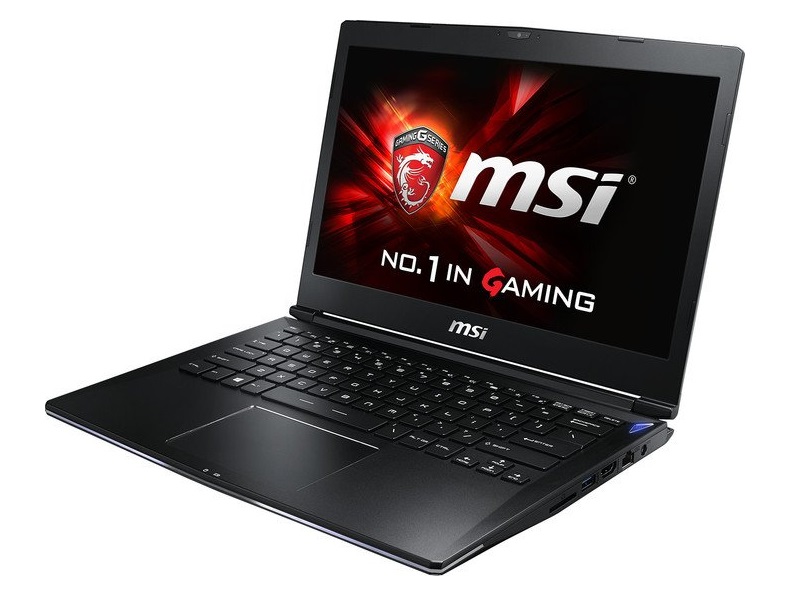
MSI GS30 Shadow
-
17-05-2015 v4(old)
Florian Glaser