 Deutsch
 English
 Español
 Français
 Italiano
 Nederlands
 Polski
 Português
 Русский
 Türkçe
 Svenska
 Chinese
 Magyar
Kort testrapport Lenovo ThinkPad X380 Yoga (i5-8250U, FHD) Convertible
| SD Card Reader | |
| average JPG Copy Test (av. of 3 runs) | |
| Lenovo ThinkPad X1 Yoga 2018-20LD0015US | |
| Dell Latitude 7390 2-in-1 (Toshiba Exceria Pro M501 UHS-II) | |
| Microsoft Surface Book 2 (Toshiba Exceria Pro SDXC 64 GB UHS-II) | |
| HP Spectre x360 13-ae048ng (Toshiba Exceria Pro M501 microSDXC 64GB) | |
| Gemiddelde van klas Convertible (17.7 - 209, n=35, laatste 2 jaar) | |
| Lenovo ThinkPad X380 Yoga-20LH000LUS (Toshiba Exceria Pro M501 UHS-II) | |
| Lenovo ThinkPad X380 Yoga 20LJS02W00 (Toshiba Exceria Pro SDXC 64 GB UHS-II) | |
| maximum AS SSD Seq Read Test (1GB) | |
| Microsoft Surface Book 2 (Toshiba Exceria Pro SDXC 64 GB UHS-II) | |
| Dell Latitude 7390 2-in-1 (Toshiba Exceria Pro M501 UHS-II) | |
| Lenovo ThinkPad X1 Yoga 2018-20LD0015US | |
| HP Spectre x360 13-ae048ng (Toshiba Exceria Pro M501 microSDXC 64GB) | |
| Gemiddelde van klas Convertible (22.6 - 263, n=34, laatste 2 jaar) | |
| Lenovo ThinkPad X380 Yoga 20LJS02W00 (Toshiba Exceria Pro SDXC 64 GB UHS-II) | |
| Lenovo ThinkPad X380 Yoga-20LH000LUS (Toshiba Exceria Pro M501 UHS-II) | |
| |||||||||||||||||||||||||
Helderheidsverdeling: 91 %
Helderheid in Batterij-modus: 336.3 cd/m²
Contrast: 989:1 (Zwart: 0.34 cd/m²)
ΔE Color 5.77 | 0.5-29.43 Ø5, calibrated: 1.46
ΔE Greyscale 7.8 | 0.57-98 Ø5.3
96% sRGB (Argyll 1.6.3 3D)
61% AdobeRGB 1998 (Argyll 1.6.3 3D)
67.2% AdobeRGB 1998 (Argyll 2.2.0 3D)
95.8% sRGB (Argyll 2.2.0 3D)
65.4% Display P3 (Argyll 2.2.0 3D)
Gamma: 1.99
| Lenovo ThinkPad X380 Yoga-20LH000LUS Lenovo LEN4094, IPS, 13.30, 1920x1080 | Lenovo ThinkPad X380 Yoga 20LJS02W00 Lenovo M133NWF4 R3, IPS, 13.30, 1920x1080 | Lenovo ThinkPad X1 Yoga 2018-20LD0015US Lenovo LEN40A9, IPS, 14.00, 1920x1080 | HP Spectre x360 13-ae048ng Chi Mei (CMN1376), IPS, 13.30, 1920x1080 | Dell Latitude 7390 2-in-1 AUO462D, IPS, 13.30, 1920x1080 | Microsoft Surface Book 2 Panasonic MEI96A2 , IPS, 13.50, 3000x2000 | |
|---|---|---|---|---|---|---|
| Display | 1% | -8% | 4% | -7% | 2% | |
| Display P3 Coverage | 65.4 | 65.9 1% | 60.9 -7% | 68.1 4% | 62.5 -4% | 67.9 4% |
| sRGB Coverage | 95.8 | 95.8 0% | 86.4 -10% | 99.5 4% | 86.1 -10% | 95.7 0% |
| AdobeRGB 1998 Coverage | 67.2 | 67.8 1% | 61.9 -8% | 70.2 4% | 62.9 -6% | 69.4 3% |
| Response Times | -3% | 6% | 842% | -7% | -11% | |
| Response Time Grey 50% / Grey 80% * | 44 ? | 50 ? -14% | 40.4 ? 8% | 36 ? 18% | 48.8 ? -11% | 52.8 ? -20% |
| Response Time Black / White * | 29.6 ? | 29 ? 2% | 28.8 ? 3% | 27 ? 9% | 30.4 ? -3% | 30 ? -1% |
| PWM Frequency | 962 ? | 1000 ? 4% | 25000 ? 2499% | |||
| Screen | 14% | -6% | 15% | -10% | 37% | |
| Brightness middle | 336.3 | 314 -7% | 267.2 -21% | 311 -8% | 318.2 -5% | 385 14% |
| Brightness | 322 | 302 -6% | 239 -26% | 278 -14% | 312 -3% | 372 16% |
| Brightness Distribution | 91 | 84 -8% | 75 -18% | 82 -10% | 83 -9% | 89 -2% |
| Black Level * | 0.34 | 0.16 53% | 0.27 21% | 0.2 41% | 0.3 12% | 0.21 38% |
| Contrast | 989 | 1963 98% | 990 0% | 1555 57% | 1061 7% | 1833 85% |
| Colorchecker dE 2000 * | 5.77 | 5.73 1% | 3.5 39% | 3.98 31% | 4.25 26% | 1.6 72% |
| Colorchecker dE 2000 max. * | 10.59 | 10.43 2% | 6.4 40% | 8.48 20% | 9.49 10% | 4.5 58% |
| Colorchecker dE 2000 calibrated * | 1.46 | 3.81 -161% | 4.38 -200% | |||
| Greyscale dE 2000 * | 7.8 | 7.39 5% | 1.3 83% | 5.57 29% | 2.1 73% | 1.5 81% |
| Gamma | 1.99 111% | 2.14 103% | 2.146 103% | 2.51 88% | 2.311 95% | 2.22 99% |
| CCT | 6408 101% | 6351 102% | 6523 100% | 7810 83% | 6588 99% | 6502 100% |
| Color Space (Percent of AdobeRGB 1998) | 61 | 61 0% | 56 -8% | 64 5% | 56 -8% | 64 5% |
| Color Space (Percent of sRGB) | 96 | 96 0% | 86 -10% | 99 3% | 85 -11% | 95.9 0% |
| Totaal Gemiddelde (Programma / Instellingen) | 4% /
8% | -3% /
-5% | 287% /
168% | -8% /
-9% | 9% /
24% |
* ... kleiner is beter
Responstijd Scherm
| ↔ Responstijd Zwart naar Wit | ||
|---|---|---|
| 29.6 ms ... stijging ↗ en daling ↘ gecombineerd | ↗ 15.6 ms stijging | 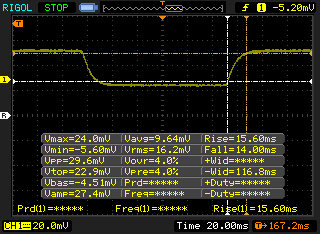 |
| ↘ 14 ms daling | ||
| Het scherm vertoonde relatief trage responstijden in onze tests en is misschien te traag voor games. Ter vergelijking: alle testtoestellen variëren van 0.1 (minimum) tot 240 (maximum) ms. » 76 % van alle toestellen zijn beter. Dit betekent dat de gemeten responstijd slechter is dan het gemiddelde (21.5 ms) van alle geteste toestellen. | ||
| ↔ Responstijd 50% Grijs naar 80% Grijs | ||
| 44 ms ... stijging ↗ en daling ↘ gecombineerd | ↗ 21.2 ms stijging | 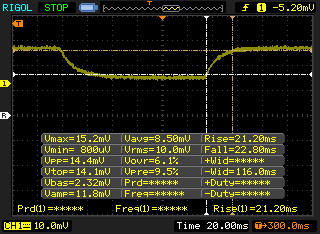 |
| ↘ 22.8 ms daling | ||
| Het scherm vertoonde trage responstijden in onze tests en is misschien te traag voor games. Ter vergelijking: alle testtoestellen variëren van 0.2 (minimum) tot 636 (maximum) ms. » 69 % van alle toestellen zijn beter. Dit betekent dat de gemeten responstijd slechter is dan het gemiddelde (33.7 ms) van alle geteste toestellen. | ||
Screen Flickering / PWM (Pulse-Width Modulation)
| Screen flickering / PWM waargenomen | 962 Hz | ≤ 99 % helderheid instelling | 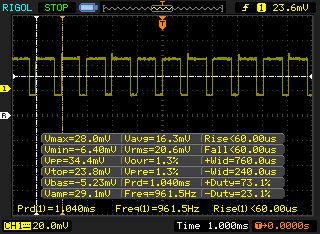 |
Het backlight van het scherm flikkert aan 962 Hz (hoogstwaarschijnlijk met PWM - Pulse-Width Modulation) aan een helderheid van 99 % en lager. Boven deze helderheid zou er geen flickering / PWM mogen optreden. De frequentie van 962 Hz is redelijk hoog en de meeste mensen die gevoelig zijn aan flickering zouden dit dus niet mogen waarnemen of geïrriteerde ogen krijgen. Ter vergelijking: 53 % van alle geteste toestellen maakten geen gebruik van PWM om de schermhelderheid te verlagen. Als het wel werd gebruikt, werd een gemiddelde van 17900 (minimum: 5 - maximum: 3846000) Hz waargenomen. | |||
| Cinebench R15 | |
| CPU Single 64Bit | |
| Gemiddelde van klas Convertible (68.6 - 287, n=65, laatste 2 jaar) | |
| Dell Latitude 5490 | |
| HP EliteBook x360 1020 G2 | |
| Lenovo ThinkPad X380 Yoga 20LJS02W00 | |
| Dell Latitude 5290 2-in-1 | |
| Lenovo ThinkPad 13 20J1005TPB | |
| Gemiddeld Intel Core i5-8250U (81 - 147, n=97) | |
| Microsoft Surface Pro (2017) i5 | |
| Acer Aspire 3 A315-51-30YA | |
| Lenovo Ideapad 720S-13ARR | |
| Lenovo ThinkPad X380 Yoga-20LH000LUS | |
| Dell Inspiron 15 5575-98MH4 | |
| CPU Multi 64Bit | |
| Gemiddelde van klas Convertible (110.1 - 2889, n=67, laatste 2 jaar) | |
| Dell Latitude 5490 | |
| Gemiddeld Intel Core i5-8250U (320 - 730, n=101) | |
| Dell Latitude 5290 2-in-1 | |
| Lenovo Ideapad 720S-13ARR | |
| Lenovo ThinkPad X380 Yoga-20LH000LUS | |
| Lenovo ThinkPad X380 Yoga 20LJS02W00 | |
| HP EliteBook x360 1020 G2 | |
| Lenovo ThinkPad 13 20J1005TPB | |
| Acer Aspire 3 A315-51-30YA | |
| Microsoft Surface Pro (2017) i5 | |
| Dell Inspiron 15 5575-98MH4 | |
* ... kleiner is beter
| PCMark 8 Home Score Accelerated v2 | 3760 punten | |
| PCMark 8 Work Score Accelerated v2 | 4781 punten | |
| PCMark 10 Score | 3538 punten | |
Help | ||
| Lenovo ThinkPad X380 Yoga-20LH000LUS Samsung SSD PM981 MZVLB512HAJQ | Lenovo ThinkPad X380 Yoga 20LJS02W00 Samsung SSD PM981 MZVLB512HAJQ | Lenovo ThinkPad X1 Yoga 2018-20LD0015US Samsung SSD PM981 MZVLB512HAJQ | HP Spectre x360 13-ae048ng Toshiba NVMe THNSN51T02DUK | Dell Latitude 7390 2-in-1 SK hynix PC401 NVMe 500 GB | Gemiddeld Samsung SSD PM981 MZVLB512HAJQ | |
|---|---|---|---|---|---|---|
| AS SSD | -7% | 11% | -596% | -25% | 6% | |
| Copy Game MB/s | 962 | 607 | 856 | 473.6 | 1057 ? | |
| Copy Program MB/s | 343 | 233.5 | 281.8 | 223.5 | 454 ? | |
| Copy ISO MB/s | 1770 | 917 | 1205 | 1377 | 1755 ? | |
| Score Total | 3487 | 2543 -27% | 3594 3% | 455 -87% | 2057 -41% | 3966 ? 14% |
| Score Write | 1099 | 1165 6% | 1359 24% | 42 -96% | 781 -29% | 1780 ? 62% |
| Score Read | 1619 | 896 -45% | 1487 -8% | 305 -81% | 877 -46% | 1451 ? -10% |
| Access Time Write * | 0.04 | 0.032 20% | 0.037 7% | 2.391 -5878% | 0.052 -30% | 0.08337 ? -108% |
| Access Time Read * | 0.04 | 0.039 2% | 0.043 -8% | 0.044 -10% | 0.045 -13% | 0.05092 ? -27% |
| 4K-64 Write | 907 | 926 2% | 1072 18% | 2.09 -100% | 606 -33% | 1504 ? 66% |
| 4K-64 Read | 1350 | 735 -46% | 1216 -10% | 115.6 -91% | 643 -52% | 1203 ? -11% |
| 4K Write | 91.3 | 111.6 22% | 102.3 12% | 1.73 -98% | 103.4 13% | 112 ? 23% |
| 4K Read | 43.1 | 51.5 19% | 49.11 14% | 31.73 -26% | 42.12 -2% | 50.5 ? 17% |
| Seq Write | 1044 | 1272 22% | 1840 76% | 377.1 -64% | 711 -32% | 1637 ? 57% |
| Seq Read | 2260 | 1099 -51% | 2218 -2% | 1574 -30% | 1911 -15% | 1976 ? -13% |
* ... kleiner is beter

| 3DMark 06 Standard Score | 10245 punten | |
| 3DMark 11 Performance | 1790 punten | |
| 3DMark Cloud Gate Standard Score | 7672 punten | |
| 3DMark Fire Strike Score | 1030 punten | |
Help | ||
Geluidsniveau
| Onbelast |
| 28 / 28 / 29.1 dB (A) |
| Belasting |
| 34.5 / 36.4 dB (A) |
 | ||
30 dB stil 40 dB(A) hoorbaar 50 dB(A) luid |
||
min: | ||
| Lenovo ThinkPad X380 Yoga-20LH000LUS UHD Graphics 620, i5-8250U, Samsung SSD PM981 MZVLB512HAJQ | Lenovo ThinkPad X380 Yoga 20LJS02W00 UHD Graphics 620, i5-8550U, Samsung SSD PM981 MZVLB512HAJQ | Lenovo ThinkPad X1 Yoga 2018-20LD0015US UHD Graphics 620, i5-8250U, Samsung SSD PM981 MZVLB512HAJQ | HP Spectre x360 13-ae048ng UHD Graphics 620, i5-8550U, Toshiba NVMe THNSN51T02DUK | Dell Latitude 7390 2-in-1 UHD Graphics 620, i7-8650U, SK hynix PC401 NVMe 500 GB | Microsoft Surface Book 2 GeForce GTX 1050 Mobile, i7-8650U, Samsung PM961 MZVLW256HEHP | |
|---|---|---|---|---|---|---|
| Noise | -5% | -0% | -3% | -1% | -7% | |
| uit / omgeving * | 28 | 30.4 -9% | 27.8 1% | 30.13 -8% | 28.2 -1% | 29.4 -5% |
| Idle Minimum * | 28 | 30.4 -9% | 27.8 1% | 30.13 -8% | 28.2 -1% | 29.4 -5% |
| Idle Average * | 28 | 30.4 -9% | 27.8 1% | 30 -7% | 28.2 -1% | 29.4 -5% |
| Idle Maximum * | 29.1 | 30.4 -4% | 27.8 4% | 30.13 -4% | 28.2 3% | 29.4 -1% |
| Load Average * | 34.5 | 34.2 1% | 33.9 2% | 33.4 3% | 32 7% | 31.4 9% |
| Load Maximum * | 36.4 | 35.2 3% | 39.9 -10% | 33 9% | 41.6 -14% | 49 -35% |
| Witcher 3 ultra * | 49 |
* ... kleiner is beter
(±) De maximumtemperatuur aan de bovenzijde bedraagt 40.4 °C / 105 F, vergeleken met het gemiddelde van 35.3 °C / 96 F, variërend van 19.6 tot 55.7 °C voor de klasse Convertible.
(-) De bodem warmt op tot een maximum van 51 °C / 124 F, vergeleken met een gemiddelde van 36.8 °C / 98 F
(+) Bij onbelast gebruik bedraagt de gemiddelde temperatuur voor de bovenzijde 27.2 °C / 81 F, vergeleken met het apparaatgemiddelde van 30.2 °C / 86 F.
(+) De palmsteunen en het touchpad zijn met een maximum van ###max## °C / 88.5 F koeler dan de huidtemperatuur en voelen daarom koel aan.
(-) De gemiddelde temperatuur van de handpalmsteun van soortgelijke toestellen bedroeg 28.1 °C / 82.6 F (-3.3 °C / -5.9 F).
Lenovo ThinkPad X380 Yoga-20LH000LUS audioanalyse
(-) | niet erg luide luidsprekers (68.1 dB)
Bas 100 - 315 Hz
(-) | bijna geen lage tonen - gemiddeld 19.2% lager dan de mediaan
(±) | lineariteit van de lage tonen is gemiddeld (12.2% delta ten opzichte van de vorige frequentie)
Mids 400 - 2000 Hz
(±) | hogere middens - gemiddeld 6.7% hoger dan de mediaan
(±) | lineariteit van de middentonen is gemiddeld (11.5% delta ten opzichte van de vorige frequentie)
Hoog 2 - 16 kHz
(±) | higher highs - on average 5.4% higher than median
(±) | lineariteit van de hoogtepunten is gemiddeld (9.8% delta ten opzichte van de vorige frequentie)
Algemeen 100 - 16.000 Hz
(-) | het totale geluid is niet lineair (35.9% verschil met de mediaan)
Vergeleken met dezelfde klasse
» 94% van alle geteste apparaten in deze klasse waren beter, 1% vergelijkbaar, 5% slechter
» De beste had een delta van 6%, het gemiddelde was 21%, de slechtste was 57%
Vergeleken met alle geteste toestellen
» 93% van alle geteste apparaten waren beter, 1% gelijk, 7% slechter
» De beste had een delta van 4%, het gemiddelde was 25%, de slechtste was 134%
Apple MacBook 12 (Early 2016) 1.1 GHz audioanalyse
(+) | luidsprekers kunnen relatief luid spelen (83.6 dB)
Bas 100 - 315 Hz
(±) | verminderde zeebaars - gemiddeld 11.3% lager dan de mediaan
(±) | lineariteit van de lage tonen is gemiddeld (14.2% delta ten opzichte van de vorige frequentie)
Mids 400 - 2000 Hz
(+) | evenwichtige middens - slechts 2.4% verwijderd van de mediaan
(+) | de middentonen zijn lineair (5.5% delta ten opzichte van de vorige frequentie)
Hoog 2 - 16 kHz
(+) | evenwichtige hoogtepunten - slechts 2% verwijderd van de mediaan
(+) | de hoge tonen zijn lineair (4.5% delta naar de vorige frequentie)
Algemeen 100 - 16.000 Hz
(+) | het totale geluid is lineair (10.2% verschil met de mediaan)
Vergeleken met dezelfde klasse
» 5% van alle geteste apparaten in deze klasse waren beter, 2% vergelijkbaar, 93% slechter
» De beste had een delta van 5%, het gemiddelde was 19%, de slechtste was 53%
Vergeleken met alle geteste toestellen
» 3% van alle geteste apparaten waren beter, 1% gelijk, 96% slechter
» De beste had een delta van 4%, het gemiddelde was 25%, de slechtste was 134%
| Uit / Standby | |
| Inactief | |
| Belasting |
|
| Lenovo ThinkPad X380 Yoga-20LH000LUS i5-8250U, UHD Graphics 620, Samsung SSD PM981 MZVLB512HAJQ, IPS, 1920x1080, 13.30 | Lenovo ThinkPad X1 Yoga 2018-20LD0015US i5-8250U, UHD Graphics 620, Samsung SSD PM981 MZVLB512HAJQ, IPS, 1920x1080, 14.00 | HP Spectre x360 13-ae048ng i5-8550U, UHD Graphics 620, Toshiba NVMe THNSN51T02DUK, IPS, 1920x1080, 13.30 | Dell Latitude 7390 2-in-1 i7-8650U, UHD Graphics 620, SK hynix PC401 NVMe 500 GB, IPS, 1920x1080, 13.30 | Microsoft Surface Book 2 i7-8650U, GeForce GTX 1050 Mobile, Samsung PM961 MZVLW256HEHP, IPS, 3000x2000, 13.50 | Lenovo ThinkPad X380 Yoga 20LJS02W00 i5-8550U, UHD Graphics 620, Samsung SSD PM981 MZVLB512HAJQ, IPS, 1920x1080, 13.30 | |
|---|---|---|---|---|---|---|
| Power Consumption | -0% | 12% | 20% | -82% | 12% | |
| Idle Minimum * | 3.7 | 3 19% | 3.2 14% | 2.6 30% | 4.7 -27% | 4 -8% |
| Idle Average * | 6.9 | 5.4 22% | 6 13% | 5.7 17% | 10.6 -54% | 4.9 29% |
| Idle Maximum * | 11.3 | 7.5 34% | 9.2 19% | 6 47% | 12.3 -9% | 6.9 39% |
| Load Average * | 34.2 | 40.1 -17% | 29.5 14% | 29.2 15% | 81 -137% | 36 -5% |
| Load Maximum * | 35.6 | 57.1 -60% | 35.6 -0% | 38.8 -9% | 100.3 -182% | 34.4 3% |
| Witcher 3 ultra * | 97 |
* ... kleiner is beter
| Lenovo ThinkPad X380 Yoga-20LH000LUS i5-8250U, UHD Graphics 620, 51 Wh | Lenovo ThinkPad X380 Yoga 20LJS02W00 i5-8550U, UHD Graphics 620, 51 Wh | Lenovo ThinkPad X1 Yoga 2018-20LD0015US i5-8250U, UHD Graphics 620, 54 Wh | HP Spectre x360 13-ae048ng i5-8550U, UHD Graphics 620, 60 Wh | Dell Latitude 7390 2-in-1 i7-8650U, UHD Graphics 620, 60 Wh | Microsoft Surface Book 2 i7-8650U, GeForce GTX 1050 Mobile, 75 Wh | |
|---|---|---|---|---|---|---|
| Batterijduur | -6% | 1% | 5% | -4% | 20% | |
| Reader / Idle | 1330 | 1250 -6% | 1218 -8% | 1469 10% | ||
| WiFi v1.3 | 561 | 511 -9% | 651 16% | 527 -6% | 553 -1% | 663 18% |
| Load | 144 | 138 -4% | 135 -6% | 166 15% | 135 -6% | 190 32% |
| Witcher 3 ultra | 230 |
Pro
Contra
Dit is de verkorte versie van het originele artikel. Het volledige, Engelse testrapport vind je hier.
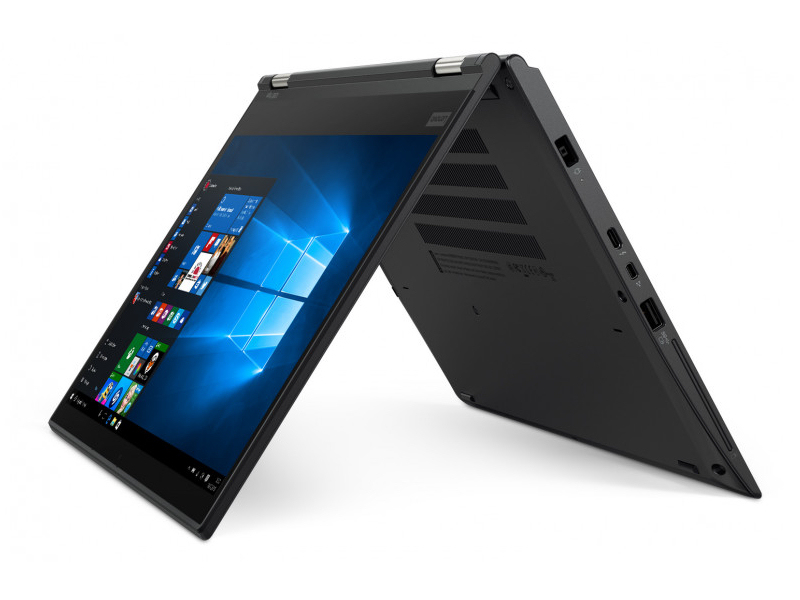
Lenovo's X380 Yoga presteerde sterk in ons initiële testrapport, maar vertoonde ook wat tekortkomingen. Hoewel de Core i7-8550U op papier een 18% hogere kloksnelheid heeft dan de Core i5-8250U, bleek dit in de praktijk wat te veel voor de X380 Yoga. De 8250U is in de meeste situaties waarschijnlijk een betere CPU voor het veelzijdige toestel. De Yoga blinkt op bijna alle vlakken uit, behalve als het gaat over CPU-prestaties. De behuizing is stevig, de selectie aan poorten is uitstekend en de duurzame scharnieren en toetsenbord maken het de tablet comfortabel en eenvoudig in gebruik.
Als kantoortoestel is de X380 uitstekend. Lenovo's ThinkPad Yoga-serie was lange tijd de voorkeurskeuze voor professionals op zoek naar een goedgebouwde convertible. De concurrentie is echter aan een inhaalmanoeuvre begonnen en steekt Lenovo in sommige opzichten reeds de loef af. HP's Spectre x360 13 is een mooi toestel dat niet zo sterk te lijden heeft onder throttling als de X380 Yoga. Dell's Latitude 7390 heeft genoeg ruimte voor twee opslagtoestellen en is erg compact. De Surface Book 2 van Microsoft is dan weer erg krachtig voor een convertible en verplettert de concurrentie in grafisch veeleisende taken.
Toch heeft elk van deze toestellen zijn eigen tekortkomingen. De Spectre x360 heeft een beperkte selectie aan poorten, de Latitude 7390 heeft een ondermaats scherm met sterke reflecties en de Surface Book 2 is erg duur. De X380 Yoga is een evenwichtige machine met een redelijke prijs en is gewoonweg erg plezierig in gebruik.
De X380 Yoga, vooral de variant met de Core i5-8250U is misschien wel de beste compacte convertible voor zakelijke gebruikers. Hoewel er een aantal minpunten zijn, combineert het toestel een behuizing van hoge kwaliteit met een uitstekende selectie aan poorten, geweldige batterijduur en een mooi scherm met accurate kleuren. Andere convertibles blinken op enkele specifieke vlakken uit, maar de X380 Yoga presteert overal sterk en laat nergens echt grote steken vallen.
Lenovo ThinkPad X380 Yoga-20LH000LUS
-
18-07-2018 v6(old)
Sam Medley
Pricecompare
