 Deutsch
 English
 Español
 Français
 Italiano
 Nederlands
 Polski
 Português
 Русский
 Türkçe
 Svenska
 Chinese
 Magyar
Kort testrapport HP Spectre x360 13 w023dx Convertible
| Networking | |
| iperf Server (receive) TCP 1 m 512KB | |
| MSI GT72VR 6RD-063US | |
| HP Spectre x360 13-w023dx | |
| HP 250 G5 Y1V08UT | |
| iperf Client (transmit) TCP 1 m 512KB | |
| MSI GT72VR 6RD-063US | |
| HP Spectre x360 13-w023dx | |
| HP 250 G5 Y1V08UT | |
| |||||||||||||||||||||||||
Helderheidsverdeling: 90 %
Helderheid in Batterij-modus: 334.6 cd/m²
Contrast: 996:1 (Zwart: 0.336 cd/m²)
ΔE Color 6.21 | 0.5-29.43 Ø5
ΔE Greyscale 7.71 | 0.57-98 Ø5.3
90% sRGB (Argyll 1.6.3 3D)
58.6% AdobeRGB 1998 (Argyll 1.6.3 3D)
65.8% AdobeRGB 1998 (Argyll 2.2.0 3D)
90.4% sRGB (Argyll 2.2.0 3D)
65.4% Display P3 (Argyll 2.2.0 3D)
Gamma: 2.36
| HP Spectre x360 13-w023dx Chi Mei CMN1367, IPS, 13.30, 1920x1080 | Dell XPS 13 9360 QHD+ i5 Sharp SHP144A, , 13.30, 3200x1800 | HP Spectre 13 IPS UWVA, 13.30, 1920x1080 | Lenovo Yoga 900-13ISK 80MK IPS, 13.30, 3200x1800 | Asus Zenbook UX360UA-C4159T AU Optronics AOU272D / B133HAN02.7, IPS, 13.30, 1920x1080 | Acer Aspire S 13 S5-371-71QZ AUO B133HAN04.1, IPS, 13.30, 1920x1080 | |
|---|---|---|---|---|---|---|
| Display | 0% | 3% | -2% | 1% | ||
| Display P3 Coverage | 65.4 | 64.6 -1% | 65.6 0% | 63.2 -3% | 64.8 -1% | |
| sRGB Coverage | 90.4 | 91.6 1% | 94.7 5% | 88.7 -2% | 93.1 3% | |
| AdobeRGB 1998 Coverage | 65.8 | 66.5 1% | 67.5 3% | 64.9 -1% | 66 0% | |
| Response Times | -2% | -36% | 2% | 23% | -29% | |
| Response Time Grey 50% / Grey 80% * | 33.2 ? | 31 ? 7% | 50.8 ? -53% | 38.8 ? -17% | 29 ? 13% | 50 ? -51% |
| Response Time Black / White * | 28 ? | 31.2 ? -11% | 33.2 ? -19% | 22.4 ? 20% | 19 ? 32% | 29.6 ? -6% |
| PWM Frequency | 1316 | 50 ? | ||||
| Screen | 22% | 27% | -11% | 10% | 10% | |
| Brightness middle | 334.6 | 444 33% | 300.5 -10% | 319.8 -4% | 344 3% | 375 12% |
| Brightness | 319 | 393 23% | 305 -4% | 302 -5% | 326 2% | 358 12% |
| Brightness Distribution | 90 | 82 -9% | 76 -16% | 88 -2% | 86 -4% | 87 -3% |
| Black Level * | 0.336 | 0.33 2% | 0.184 45% | 0.835 -149% | 0.27 20% | 0.39 -16% |
| Contrast | 996 | 1345 35% | 1633 64% | 383 -62% | 1274 28% | 962 -3% |
| Colorchecker dE 2000 * | 6.21 | 4 36% | 2.64 57% | 2.68 57% | 5.53 11% | 4.6 26% |
| Colorchecker dE 2000 max. * | 12 | 7.7 36% | 5.06 58% | 10.01 17% | 8.8 27% | |
| Greyscale dE 2000 * | 7.71 | 2.83 63% | 2.8 64% | 2.35 70% | 6.67 13% | 4 48% |
| Gamma | 2.36 93% | 2.05 107% | 2.16 102% | 2.09 105% | 2.43 91% | 2.34 94% |
| CCT | 6458 101% | 6963 93% | 6999 93% | 6975 93% | 7012 93% | 7304 89% |
| Color Space (Percent of AdobeRGB 1998) | 58.6 | 59.3 1% | 60.9 4% | 57 -3% | 60 2% | 57.9 -1% |
| Color Space (Percent of sRGB) | 90 | 91.4 2% | 94.3 5% | 88 -2% | 93 3% | 88.7 -1% |
| Totaal Gemiddelde (Programma / Instellingen) | 7% /
15% | -2% /
14% | -4% /
-7% | 11% /
9% | -10% /
4% |
* ... kleiner is beter
Responstijd Scherm
| ↔ Responstijd Zwart naar Wit | ||
|---|---|---|
| 28 ms ... stijging ↗ en daling ↘ gecombineerd | ↗ 5.6 ms stijging | 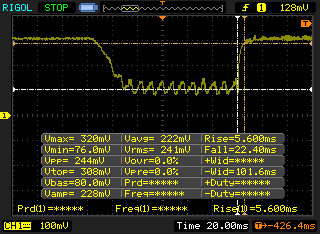 |
| ↘ 22.4 ms daling | ||
| Het scherm vertoonde relatief trage responstijden in onze tests en is misschien te traag voor games. Ter vergelijking: alle testtoestellen variëren van 0.1 (minimum) tot 240 (maximum) ms. » 67 % van alle toestellen zijn beter. Dit betekent dat de gemeten responstijd slechter is dan het gemiddelde (21.5 ms) van alle geteste toestellen. | ||
| ↔ Responstijd 50% Grijs naar 80% Grijs | ||
| 33.2 ms ... stijging ↗ en daling ↘ gecombineerd | ↗ 16 ms stijging | 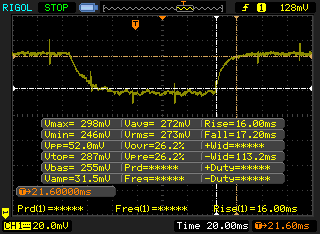 |
| ↘ 17.2 ms daling | ||
| Het scherm vertoonde trage responstijden in onze tests en is misschien te traag voor games. Ter vergelijking: alle testtoestellen variëren van 0.2 (minimum) tot 636 (maximum) ms. » 39 % van alle toestellen zijn beter. Dit betekent dat de gemeten responstijd vergelijkbaar is met het gemiddelde (33.7 ms) van alle geteste toestellen. | ||
Screen Flickering / PWM (Pulse-Width Modulation)
| Screen flickering / PWM niet waargenomen | 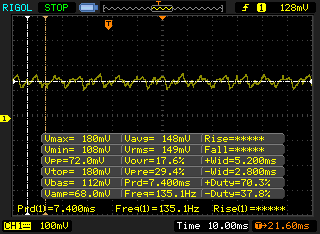 | ||
Ter vergelijking: 53 % van alle geteste toestellen maakten geen gebruik van PWM om de schermhelderheid te verlagen. Als het wel werd gebruikt, werd een gemiddelde van 17924 (minimum: 5 - maximum: 3846000) Hz waargenomen. | |||
| Cinebench R15 | |
| CPU Single 64Bit | |
| Toshiba Satellite S70-B-106 | |
| Toshiba Portege Z30t-B1320W10 | |
| Asus Zenbook UX510UW-CN044T | |
| Lenovo ThinkPad T440s 20AQ006BGE | |
| HP Spectre x360 13-w023dx | |
| Lenovo Ideapad 510-15ISK | |
| HP 250 G4 T6P08ES | |
| Lenovo IdeaPad Z40-59422614 | |
| CPU Multi 64Bit | |
| Toshiba Satellite S70-B-106 | |
| Asus Zenbook UX510UW-CN044T | |
| HP Spectre x360 13-w023dx | |
| Toshiba Portege Z30t-B1320W10 | |
| Lenovo Ideapad 510-15ISK | |
| Lenovo ThinkPad T440s 20AQ006BGE | |
| HP 250 G4 T6P08ES | |
| Lenovo IdeaPad Z40-59422614 | |
| Cinebench R11.5 | |
| CPU Single 64Bit | |
| HP Spectre x360 13-w023dx | |
| Toshiba Portege Z30t-B1320W10 | |
| Toshiba Satellite S70-B-106 | |
| Asus Zenbook UX510UW-CN044T | |
| Lenovo ThinkPad T440s 20AQ006BGE | |
| HP 250 G4 T6P08ES | |
| Lenovo IdeaPad Z40-59422614 | |
| CPU Multi 64Bit | |
| Toshiba Satellite S70-B-106 | |
| Asus Zenbook UX510UW-CN044T | |
| HP Spectre x360 13-w023dx | |
| Toshiba Portege Z30t-B1320W10 | |
| Lenovo ThinkPad T440s 20AQ006BGE | |
| HP 250 G4 T6P08ES | |
| Lenovo IdeaPad Z40-59422614 | |
| Cinebench R10 | |
| Rendering Multiple CPUs 32Bit | |
| HP Spectre x360 13-w023dx | |
| Asus Zenbook UX510UW-CN044T | |
| Toshiba Portege Z30t-B1320W10 | |
| Lenovo ThinkPad T440s 20AQ006BGE | |
| HP 250 G4 T6P08ES | |
| Lenovo IdeaPad Z40-59422614 | |
| Rendering Single 32Bit | |
| HP Spectre x360 13-w023dx | |
| Toshiba Portege Z30t-B1320W10 | |
| Asus Zenbook UX510UW-CN044T | |
| Lenovo ThinkPad T440s 20AQ006BGE | |
| HP 250 G4 T6P08ES | |
| Lenovo IdeaPad Z40-59422614 | |
| wPrime 2.10 - 1024m | |
| Lenovo IdeaPad Z40-59422614 | |
| HP Spectre x360 13-w023dx | |
| Toshiba Portege Z30t-B1320W10 | |
| Super Pi Mod 1.5 XS 32M - 32M | |
| Lenovo IdeaPad Z40-59422614 | |
| Toshiba Portege Z30t-B1320W10 | |
| HP Spectre x360 13-w023dx | |
* ... kleiner is beter
| PCMark 8 | |
| Home Score Accelerated v2 | |
| HP Spectre x360 13-w023dx | |
| HP Spectre 13 | |
| Asus Zenbook UX360UA-C4159T | |
| Lenovo Yoga 900-13ISK 80MK | |
| Dell XPS 13 9360 QHD+ i5 | |
| Work Score Accelerated v2 | |
| HP Spectre x360 13-w023dx | |
| HP Spectre 13 | |
| Asus Zenbook UX360UA-C4159T | |
| Lenovo Yoga 900-13ISK 80MK | |
| Creative Score Accelerated v2 | |
| HP Spectre x360 13-w023dx | |
| HP Spectre 13 | |
| Lenovo Yoga 900-13ISK 80MK | |
| PCMark 8 Home Score Accelerated v2 | 3795 punten | |
| PCMark 8 Creative Score Accelerated v2 | 4699 punten | |
| PCMark 8 Work Score Accelerated v2 | 4910 punten | |
Help | ||
| HP Spectre x360 13-w023dx Samsung PM951 NVMe MZVLV512 | Dell XPS 13 9360 QHD+ i5 Toshiba NVMe THNSN5256GPUK | Lenovo Yoga 900-13ISK 80MK Samsung SSD PM871 MZNLN512HCJH | Asus Zenbook UX360UA-C4159T SK Hynix Canvas SC300 512GB M.2 (HFS512G39MND) | Acer Aspire S 13 S5-371-71QZ LiteOn CV1-8B512 | |
|---|---|---|---|---|---|
| CrystalDiskMark 3.0 | -12% | -38% | -41% | -41% | |
| Read Seq | 1376 | 1168 -15% | 514 -63% | 452.1 -67% | 502 -64% |
| Write Seq | 571 | 329 -42% | 459.5 -20% | 421.3 -26% | 418.9 -27% |
| Read 512 | 679 | 1015 49% | 413.4 -39% | 288.6 -57% | 341.3 -50% |
| Write 512 | 571 | 307 -46% | 424.5 -26% | 310.7 -46% | 389.7 -32% |
| Read 4k | 42.66 | 33 -23% | 36.34 -15% | 28.52 -33% | 29.69 -30% |
| Write 4k | 137.9 | 132 -4% | 100.1 -27% | 72.1 -48% | 86.8 -37% |
| Read 4k QD32 | 535 | 525 -2% | 313.8 -41% | 389.6 -27% | 301.3 -44% |
| Write 4k QD32 | 361.2 | 325 -10% | 96.8 -73% | 285.3 -21% | 211.2 -42% |

| 3DMark | |
| 1280x720 Cloud Gate Standard Graphics | |
| Acer Aspire E5-574-53YZ | |
| HP Spectre x360 13-w023dx | |
| Acer TravelMate P257-M-56AX | |
| HP ProBook 640 G2-T9X60ET | |
| HP EliteBook 840 G3 T8X41EA | |
| Toshiba Portege Z30t-B1320W10 | |
| Sony Vaio SVF14N13CXB | |
| 1920x1080 Fire Strike Graphics | |
| Acer Aspire E5-574-53YZ | |
| HP Spectre x360 13-w023dx | |
| HP ProBook 640 G2-T9X60ET | |
| HP EliteBook 840 G3 T8X41EA | |
| Toshiba Portege Z30t-B1320W10 | |
| Sony Vaio SVF14N13CXB | |
| 3DMark 11 | |
| 1280x720 Performance GPU | |
| Acer Aspire E5-574-53YZ | |
| HP Spectre x360 13-w023dx | |
| HP ProBook 640 G2-T9X60ET | |
| HP EliteBook 840 G3 T8X41EA | |
| Acer TravelMate P257-M-56AX | |
| Toshiba Portege Z30t-B1320W10 | |
| Sony Vaio SVF14N13CXB | |
| 1280x720 Performance Combined | |
| Acer Aspire E5-574-53YZ | |
| HP Spectre x360 13-w023dx | |
| Acer TravelMate P257-M-56AX | |
| HP EliteBook 840 G3 T8X41EA | |
| HP ProBook 640 G2-T9X60ET | |
| Toshiba Portege Z30t-B1320W10 | |
| Sony Vaio SVF14N13CXB | |
| 3DMark 11 Performance | 1715 punten | |
| 3DMark Ice Storm Standard Score | 61863 punten | |
| 3DMark Cloud Gate Standard Score | 6111 punten | |
| 3DMark Fire Strike Score | 889 punten | |
| 3DMark Fire Strike Extreme Score | 395 punten | |
Help | ||
| BioShock Infinite | |
| 1280x720 Very Low Preset | |
| Acer TravelMate P278-MG-76L2 | |
| Acer Aspire E5-574-53YZ | |
| HP Spectre x360 13-w023dx | |
| Lenovo ThinkPad Yoga 12 20DK002EPB | |
| HP ProBook 650 G2 V1A44ET | |
| Samsung ATIV Book 9 2014 (NP930X5J-K02DE) | |
| Fujitsu Lifebook T904 | |
| 1366x768 Medium Preset | |
| Acer TravelMate P278-MG-76L2 | |
| Acer Aspire E5-574-53YZ | |
| HP Spectre x360 13-w023dx | |
| Lenovo ThinkPad Yoga 12 20DK002EPB | |
| HP ProBook 650 G2 V1A44ET | |
| Samsung ATIV Book 9 2014 (NP930X5J-K02DE) | |
| Fujitsu Lifebook T904 | |
| 1366x768 High Preset | |
| Acer TravelMate P278-MG-76L2 | |
| Acer Aspire E5-574-53YZ | |
| HP Spectre x360 13-w023dx | |
| Lenovo ThinkPad Yoga 12 20DK002EPB | |
| HP ProBook 650 G2 V1A44ET | |
| lage | gem. | hoge | ultra | |
| BioShock Infinite (2013) | 53.5 | 30.6 | 26.1 | 8.3 |
| Metro: Last Light (2013) | 27.9 | 23.6 | 15 | 7.2 |
| Rise of the Tomb Raider (2016) | 20.8 | 12.6 | ||
| Overwatch (2016) | 48 | 34.1 | 19.9 |
Geluidsniveau
| Onbelast |
| 29.1 / 29.1 / 31.2 dB (A) |
| Belasting |
| 37.3 / 39.6 dB (A) |
 | ||
30 dB stil 40 dB(A) hoorbaar 50 dB(A) luid |
||
min: | ||
| HP Spectre x360 13-w023dx HD Graphics 620, i7-7500U, Samsung PM951 NVMe MZVLV512 | Dell XPS 13 9360 QHD+ i5 HD Graphics 620, i5-7200U, Toshiba NVMe THNSN5256GPUK | HP Spectre 13 HD Graphics 520, 6500U, Samsung PM951 NVMe MZVLV256 | Lenovo Yoga 900-13ISK 80MK HD Graphics 520, 6500U, Samsung SSD PM871 MZNLN512HCJH | Asus Zenbook UX360UA-C4159T HD Graphics 520, 6500U, SK Hynix Canvas SC300 512GB M.2 (HFS512G39MND) | Acer Aspire S 13 S5-371-71QZ HD Graphics 520, 6500U, LiteOn CV1-8B512 | |
|---|---|---|---|---|---|---|
| Noise | 0% | -2% | 3% | -2% | -1% | |
| uit / omgeving * | 29.1 | 30.3 -4% | 28.5 2% | 30.5 -5% | 31.2 -7% | |
| Idle Minimum * | 29.1 | 30.6 -5% | 28.5 2% | 29.7 -2% | 30.5 -5% | 31.2 -7% |
| Idle Average * | 29.1 | 30.6 -5% | 30.9 -6% | 29.8 -2% | 32.1 -10% | 31.2 -7% |
| Idle Maximum * | 31.2 | 32.2 -3% | 31.6 -1% | 30 4% | 32.3 -4% | 31.5 -1% |
| Load Average * | 37.3 | 32.2 14% | 38.8 -4% | 32 14% | 36.1 3% | 35.7 4% |
| Load Maximum * | 39.6 | 38.5 3% | 41.4 -5% | 38.5 3% | 36.1 9% | 35.8 10% |
* ... kleiner is beter
(-) De maximumtemperatuur aan de bovenzijde bedraagt 48.2 °C / 119 F, vergeleken met het gemiddelde van 35.3 °C / 96 F, variërend van 19.6 tot 55.7 °C voor de klasse Convertible.
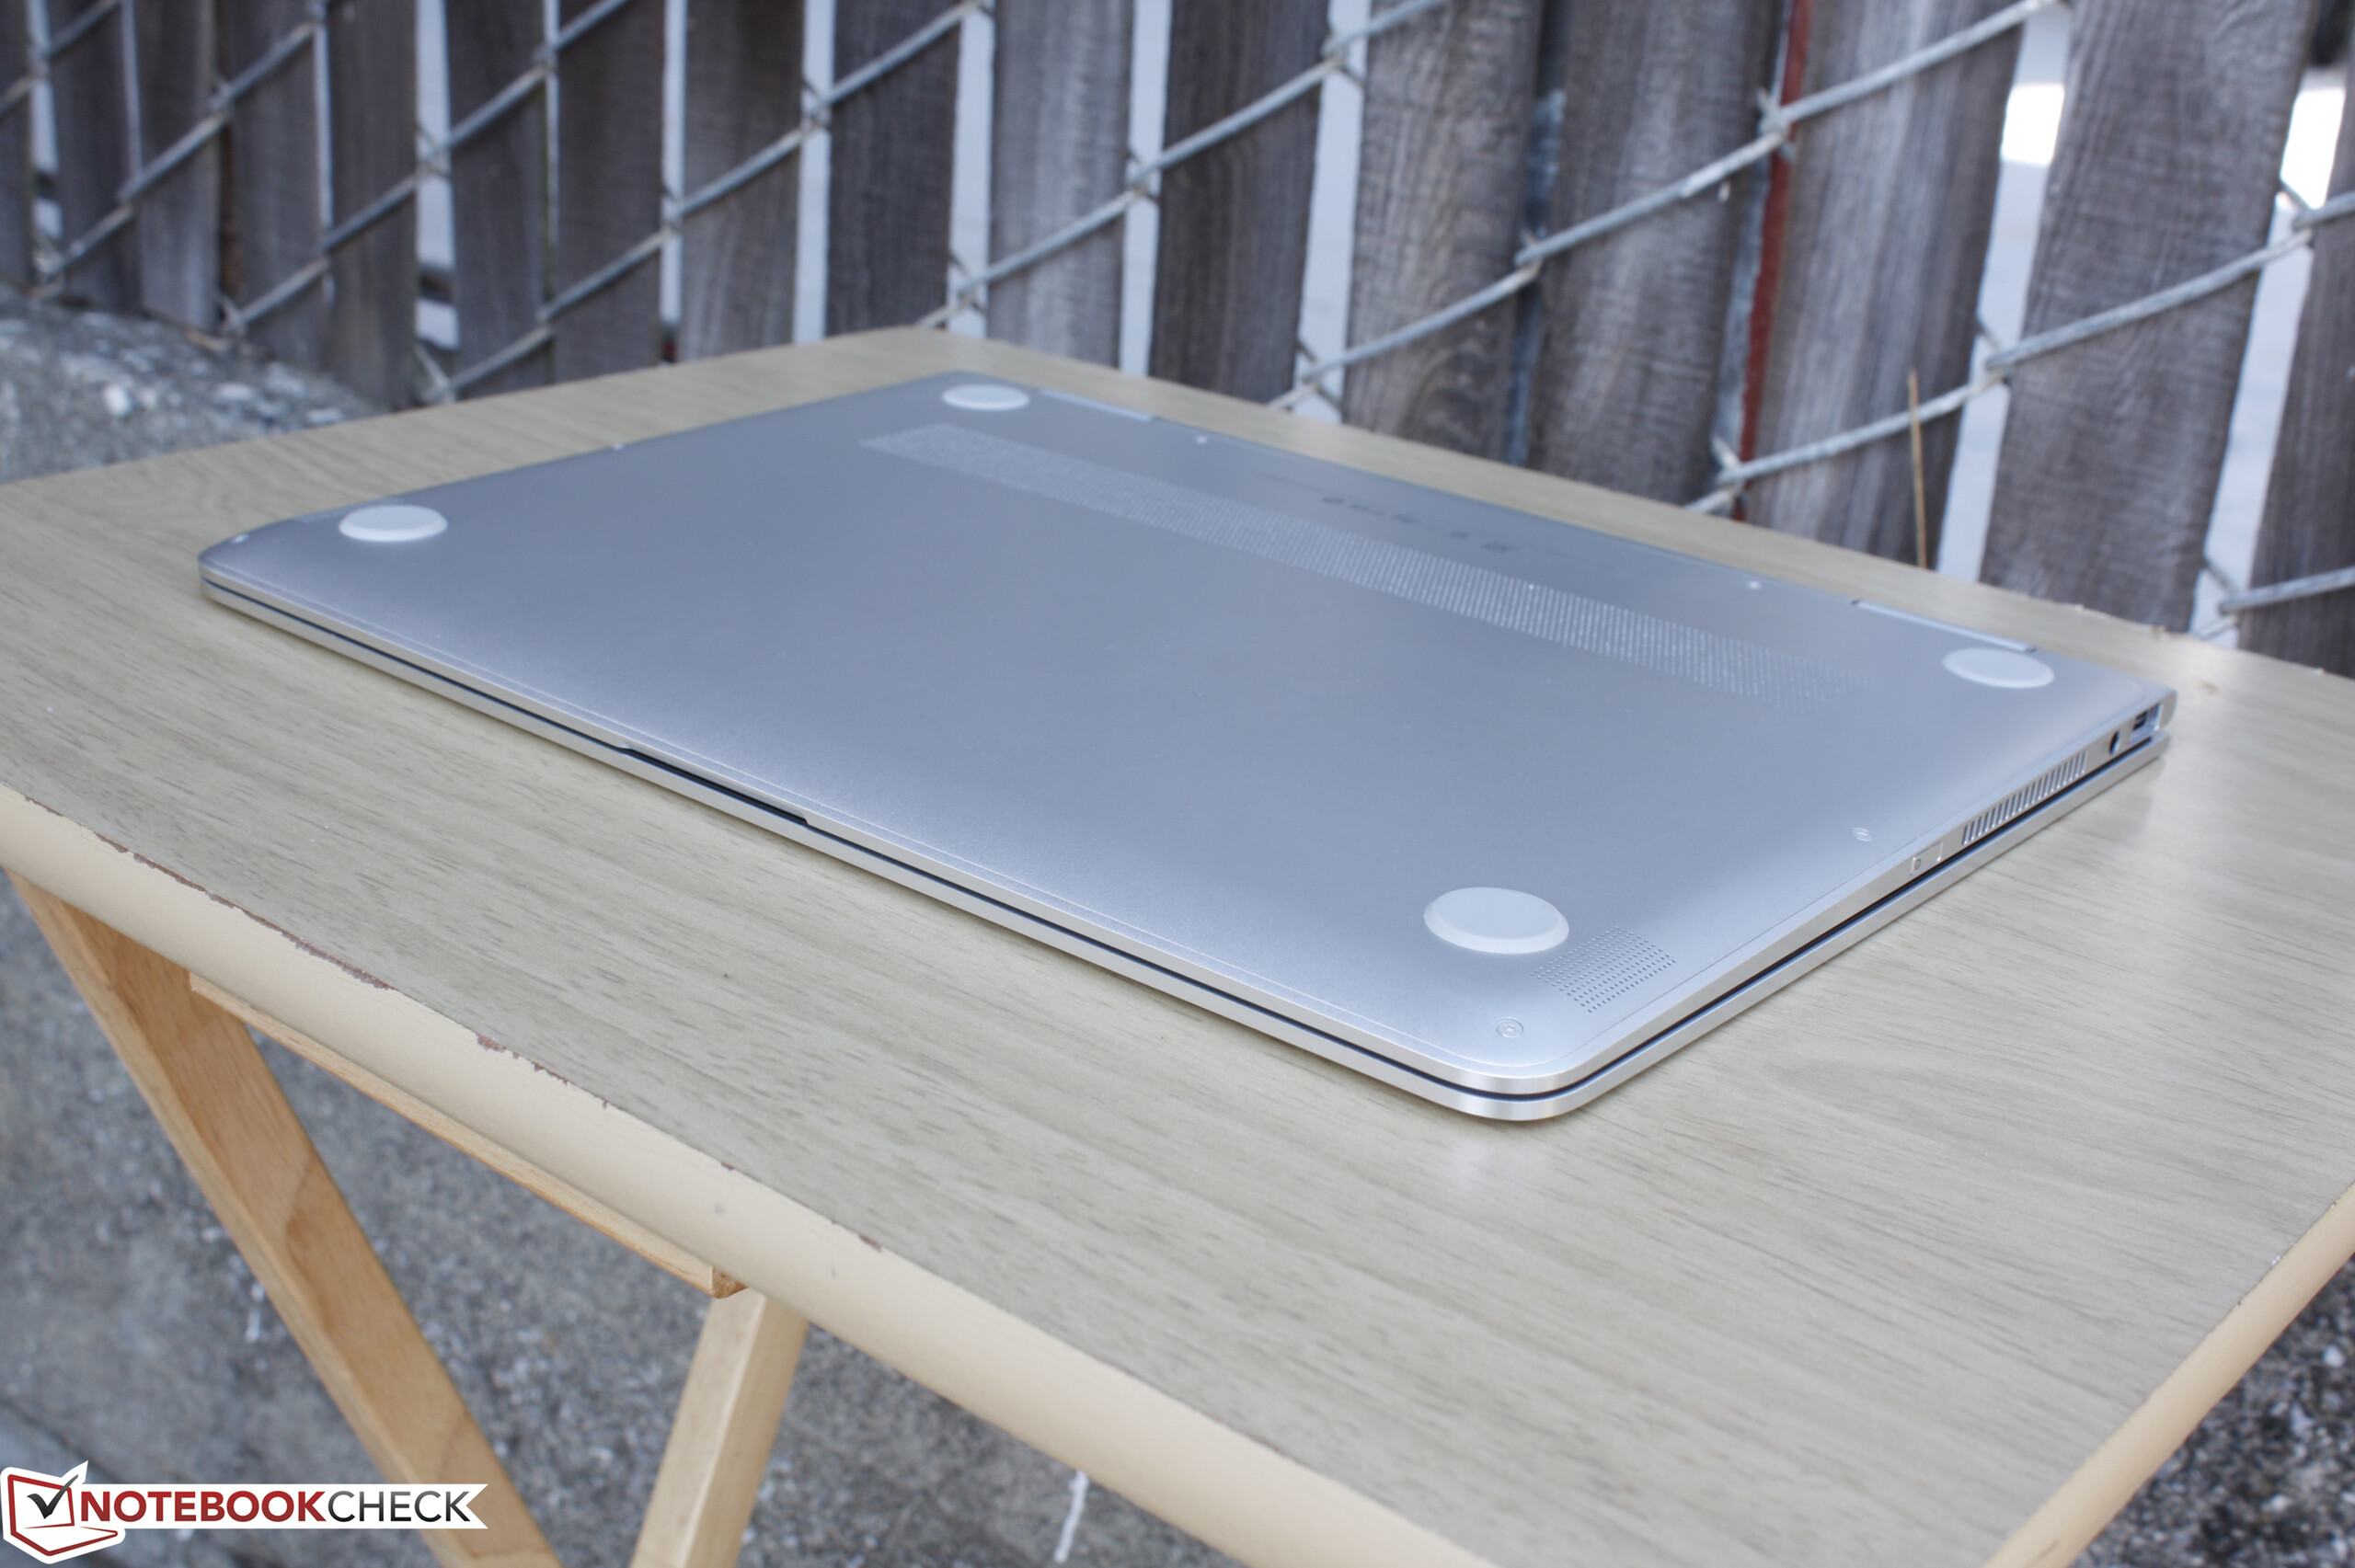
(-) De bodem warmt op tot een maximum van 46 °C / 115 F, vergeleken met een gemiddelde van 36.8 °C / 98 F
(+) Bij onbelast gebruik bedraagt de gemiddelde temperatuur voor de bovenzijde 22.4 °C / 72 F, vergeleken met het apparaatgemiddelde van 30.2 °C / 86 F.
(+) De handpalmsteunen en het touchpad bereiken maximaal de huidtemperatuur (33 °C / 91.4 F) en zijn dus niet heet.
(-) De gemiddelde temperatuur van de handpalmsteun van soortgelijke toestellen bedroeg 28.1 °C / 82.6 F (-4.9 °C / -8.8 F).
HP Spectre x360 13-w023dx audioanalyse
(±) | luidspreker luidheid is gemiddeld maar goed (76.2 dB)
Bas 100 - 315 Hz
(-) | bijna geen lage tonen - gemiddeld 17% lager dan de mediaan
(±) | lineariteit van de lage tonen is gemiddeld (12.7% delta ten opzichte van de vorige frequentie)
Mids 400 - 2000 Hz
(+) | evenwichtige middens - slechts 3.7% verwijderd van de mediaan
(+) | de middentonen zijn lineair (6.3% delta ten opzichte van de vorige frequentie)
Hoog 2 - 16 kHz
(+) | evenwichtige hoogtepunten - slechts 2.4% verwijderd van de mediaan
(±) | lineariteit van de hoogtepunten is gemiddeld (7.2% delta ten opzichte van de vorige frequentie)
Algemeen 100 - 16.000 Hz
(±) | lineariteit van het totale geluid is gemiddeld (21.9% verschil met de mediaan)
Vergeleken met dezelfde klasse
» 59% van alle geteste apparaten in deze klasse waren beter, 7% vergelijkbaar, 34% slechter
» De beste had een delta van 6%, het gemiddelde was 21%, de slechtste was 57%
Vergeleken met alle geteste toestellen
» 58% van alle geteste apparaten waren beter, 7% gelijk, 35% slechter
» De beste had een delta van 4%, het gemiddelde was 25%, de slechtste was 134%
Apple MacBook 12 (Early 2016) 1.1 GHz audioanalyse
(+) | luidsprekers kunnen relatief luid spelen (83.6 dB)
Bas 100 - 315 Hz
(±) | verminderde zeebaars - gemiddeld 11.3% lager dan de mediaan
(±) | lineariteit van de lage tonen is gemiddeld (14.2% delta ten opzichte van de vorige frequentie)
Mids 400 - 2000 Hz
(+) | evenwichtige middens - slechts 2.4% verwijderd van de mediaan
(+) | de middentonen zijn lineair (5.5% delta ten opzichte van de vorige frequentie)
Hoog 2 - 16 kHz
(+) | evenwichtige hoogtepunten - slechts 2% verwijderd van de mediaan
(+) | de hoge tonen zijn lineair (4.5% delta naar de vorige frequentie)
Algemeen 100 - 16.000 Hz
(+) | het totale geluid is lineair (10.2% verschil met de mediaan)
Vergeleken met dezelfde klasse
» 5% van alle geteste apparaten in deze klasse waren beter, 2% vergelijkbaar, 93% slechter
» De beste had een delta van 5%, het gemiddelde was 19%, de slechtste was 53%
Vergeleken met alle geteste toestellen
» 3% van alle geteste apparaten waren beter, 1% gelijk, 96% slechter
» De beste had een delta van 4%, het gemiddelde was 25%, de slechtste was 134%
| Uit / Standby | |
| Inactief | |
| Belasting |
|
| HP Spectre x360 13-w023dx i7-7500U, HD Graphics 620, Samsung PM951 NVMe MZVLV512, IPS, 1920x1080, 13.30 | Dell XPS 13 9360 QHD+ i5 i5-7200U, HD Graphics 620, Toshiba NVMe THNSN5256GPUK, , 3200x1800, 13.30 | HP Spectre 13 6500U, HD Graphics 520, Samsung PM951 NVMe MZVLV256, IPS UWVA, 1920x1080, 13.30 | Asus Zenbook UX360UA-C4159T 6500U, HD Graphics 520, SK Hynix Canvas SC300 512GB M.2 (HFS512G39MND), IPS, 1920x1080, 13.30 | Acer Aspire S 13 S5-371-71QZ 6500U, HD Graphics 520, LiteOn CV1-8B512, IPS, 1920x1080, 13.30 | |
|---|---|---|---|---|---|
| Power Consumption | 13% | -37% | -7% | 6% | |
| Idle Minimum * | 5.5 | 3.7 33% | 8.6 -56% | 6.9 -25% | 4.1 25% |
| Idle Average * | 6.7 | 6.1 9% | 11 -64% | 7.9 -18% | 6.7 -0% |
| Idle Maximum * | 7.1 | 6.5 8% | 11.3 -59% | 8.3 -17% | 7.4 -4% |
| Load Average * | 33.1 | 29.5 11% | 33.8 -2% | 30.1 9% | 32.4 2% |
| Load Maximum * | 35.2 | 33 6% | 36.2 -3% | 29.6 16% | 32.4 8% |
* ... kleiner is beter
| HP Spectre x360 13-w023dx i7-7500U, HD Graphics 620, 57.8 Wh | Dell XPS 13 9360 QHD+ i5 i5-7200U, HD Graphics 620, 60 Wh | HP Spectre 13 6500U, HD Graphics 520, 38 Wh | Lenovo Yoga 900-13ISK 80MK 6500U, HD Graphics 520, 66 Wh | Asus Zenbook UX360UA-C4159T 6500U, HD Graphics 520, 57 Wh | Acer Aspire S 13 S5-371-71QZ 6500U, HD Graphics 520, 45 Wh | |
|---|---|---|---|---|---|---|
| Batterijduur | 4% | -39% | -18% | 13% | -17% | |
| Reader / Idle | 1233 | 715 -42% | 844 -32% | 1165 -6% | 1028 -17% | |
| WiFi v1.3 | 558 | 526 -6% | 338 -39% | 403 -28% | 581 4% | 472 -15% |
| Load | 121 | 137 13% | 78 -36% | 128 6% | 169 40% | 99 -18% |
Pro
Contra
Dit is de verkorte versie van het originele artikel. Het volledige, Engelse testrapport vind je hier.
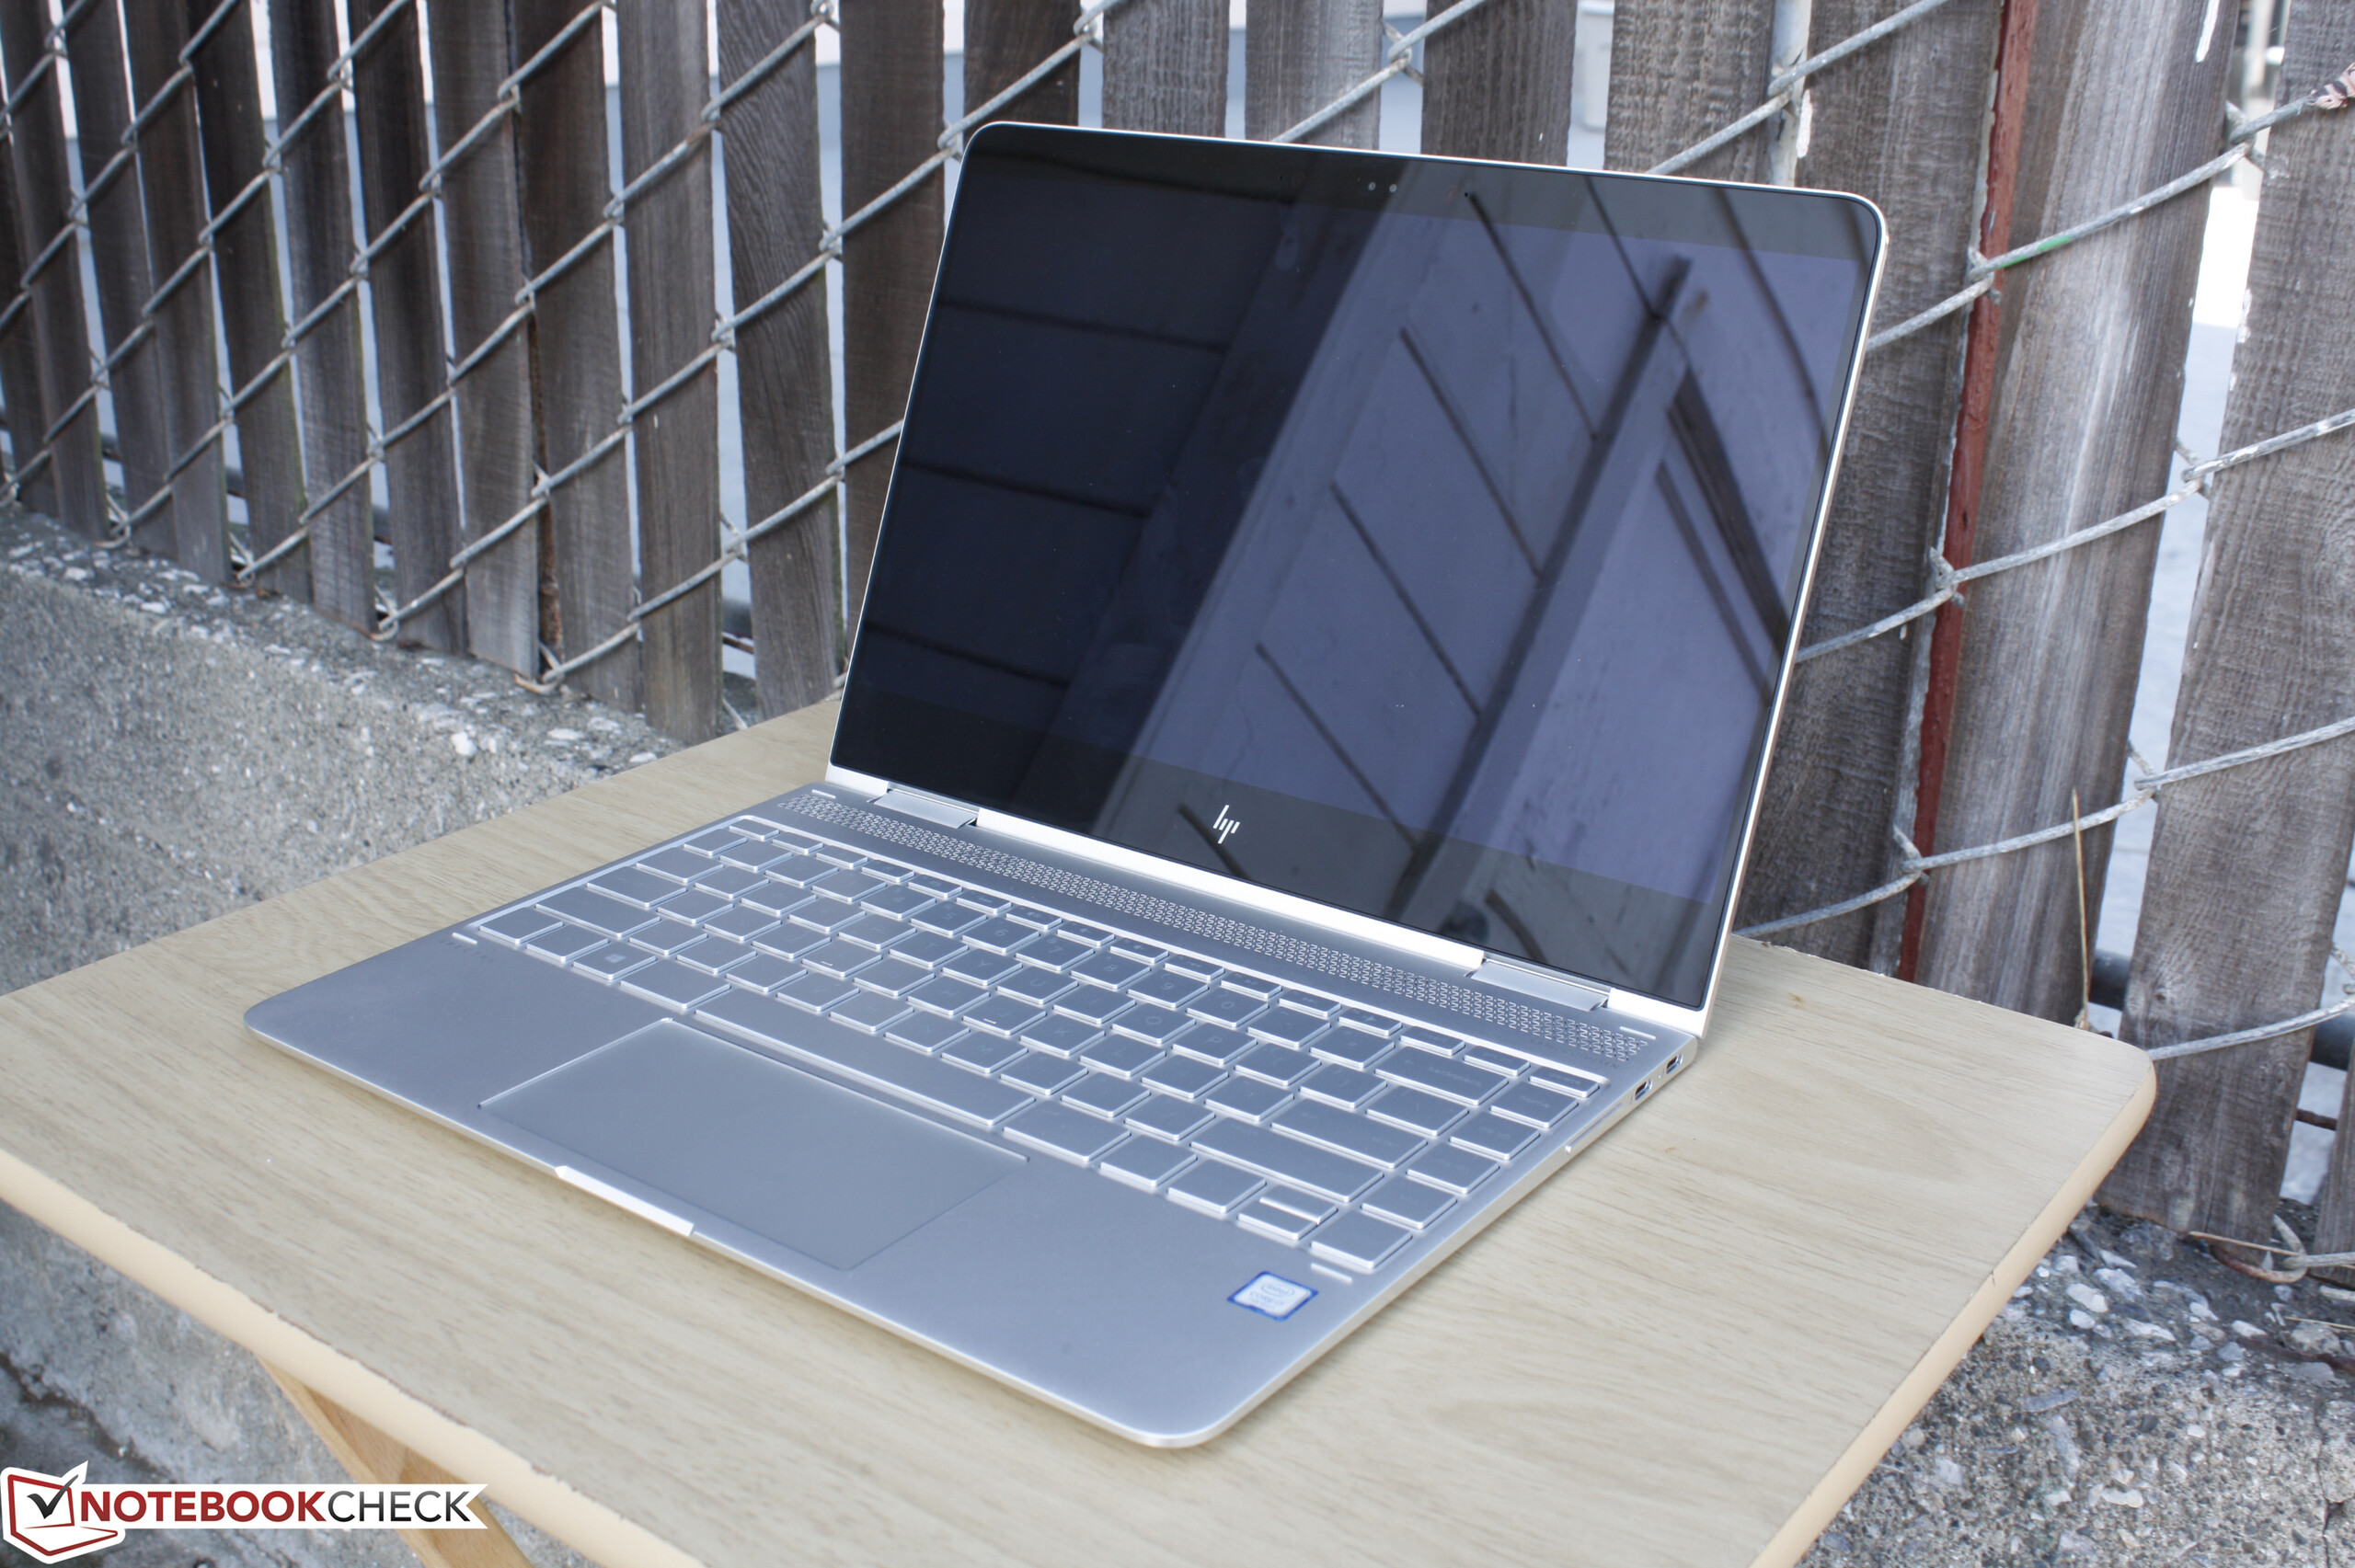
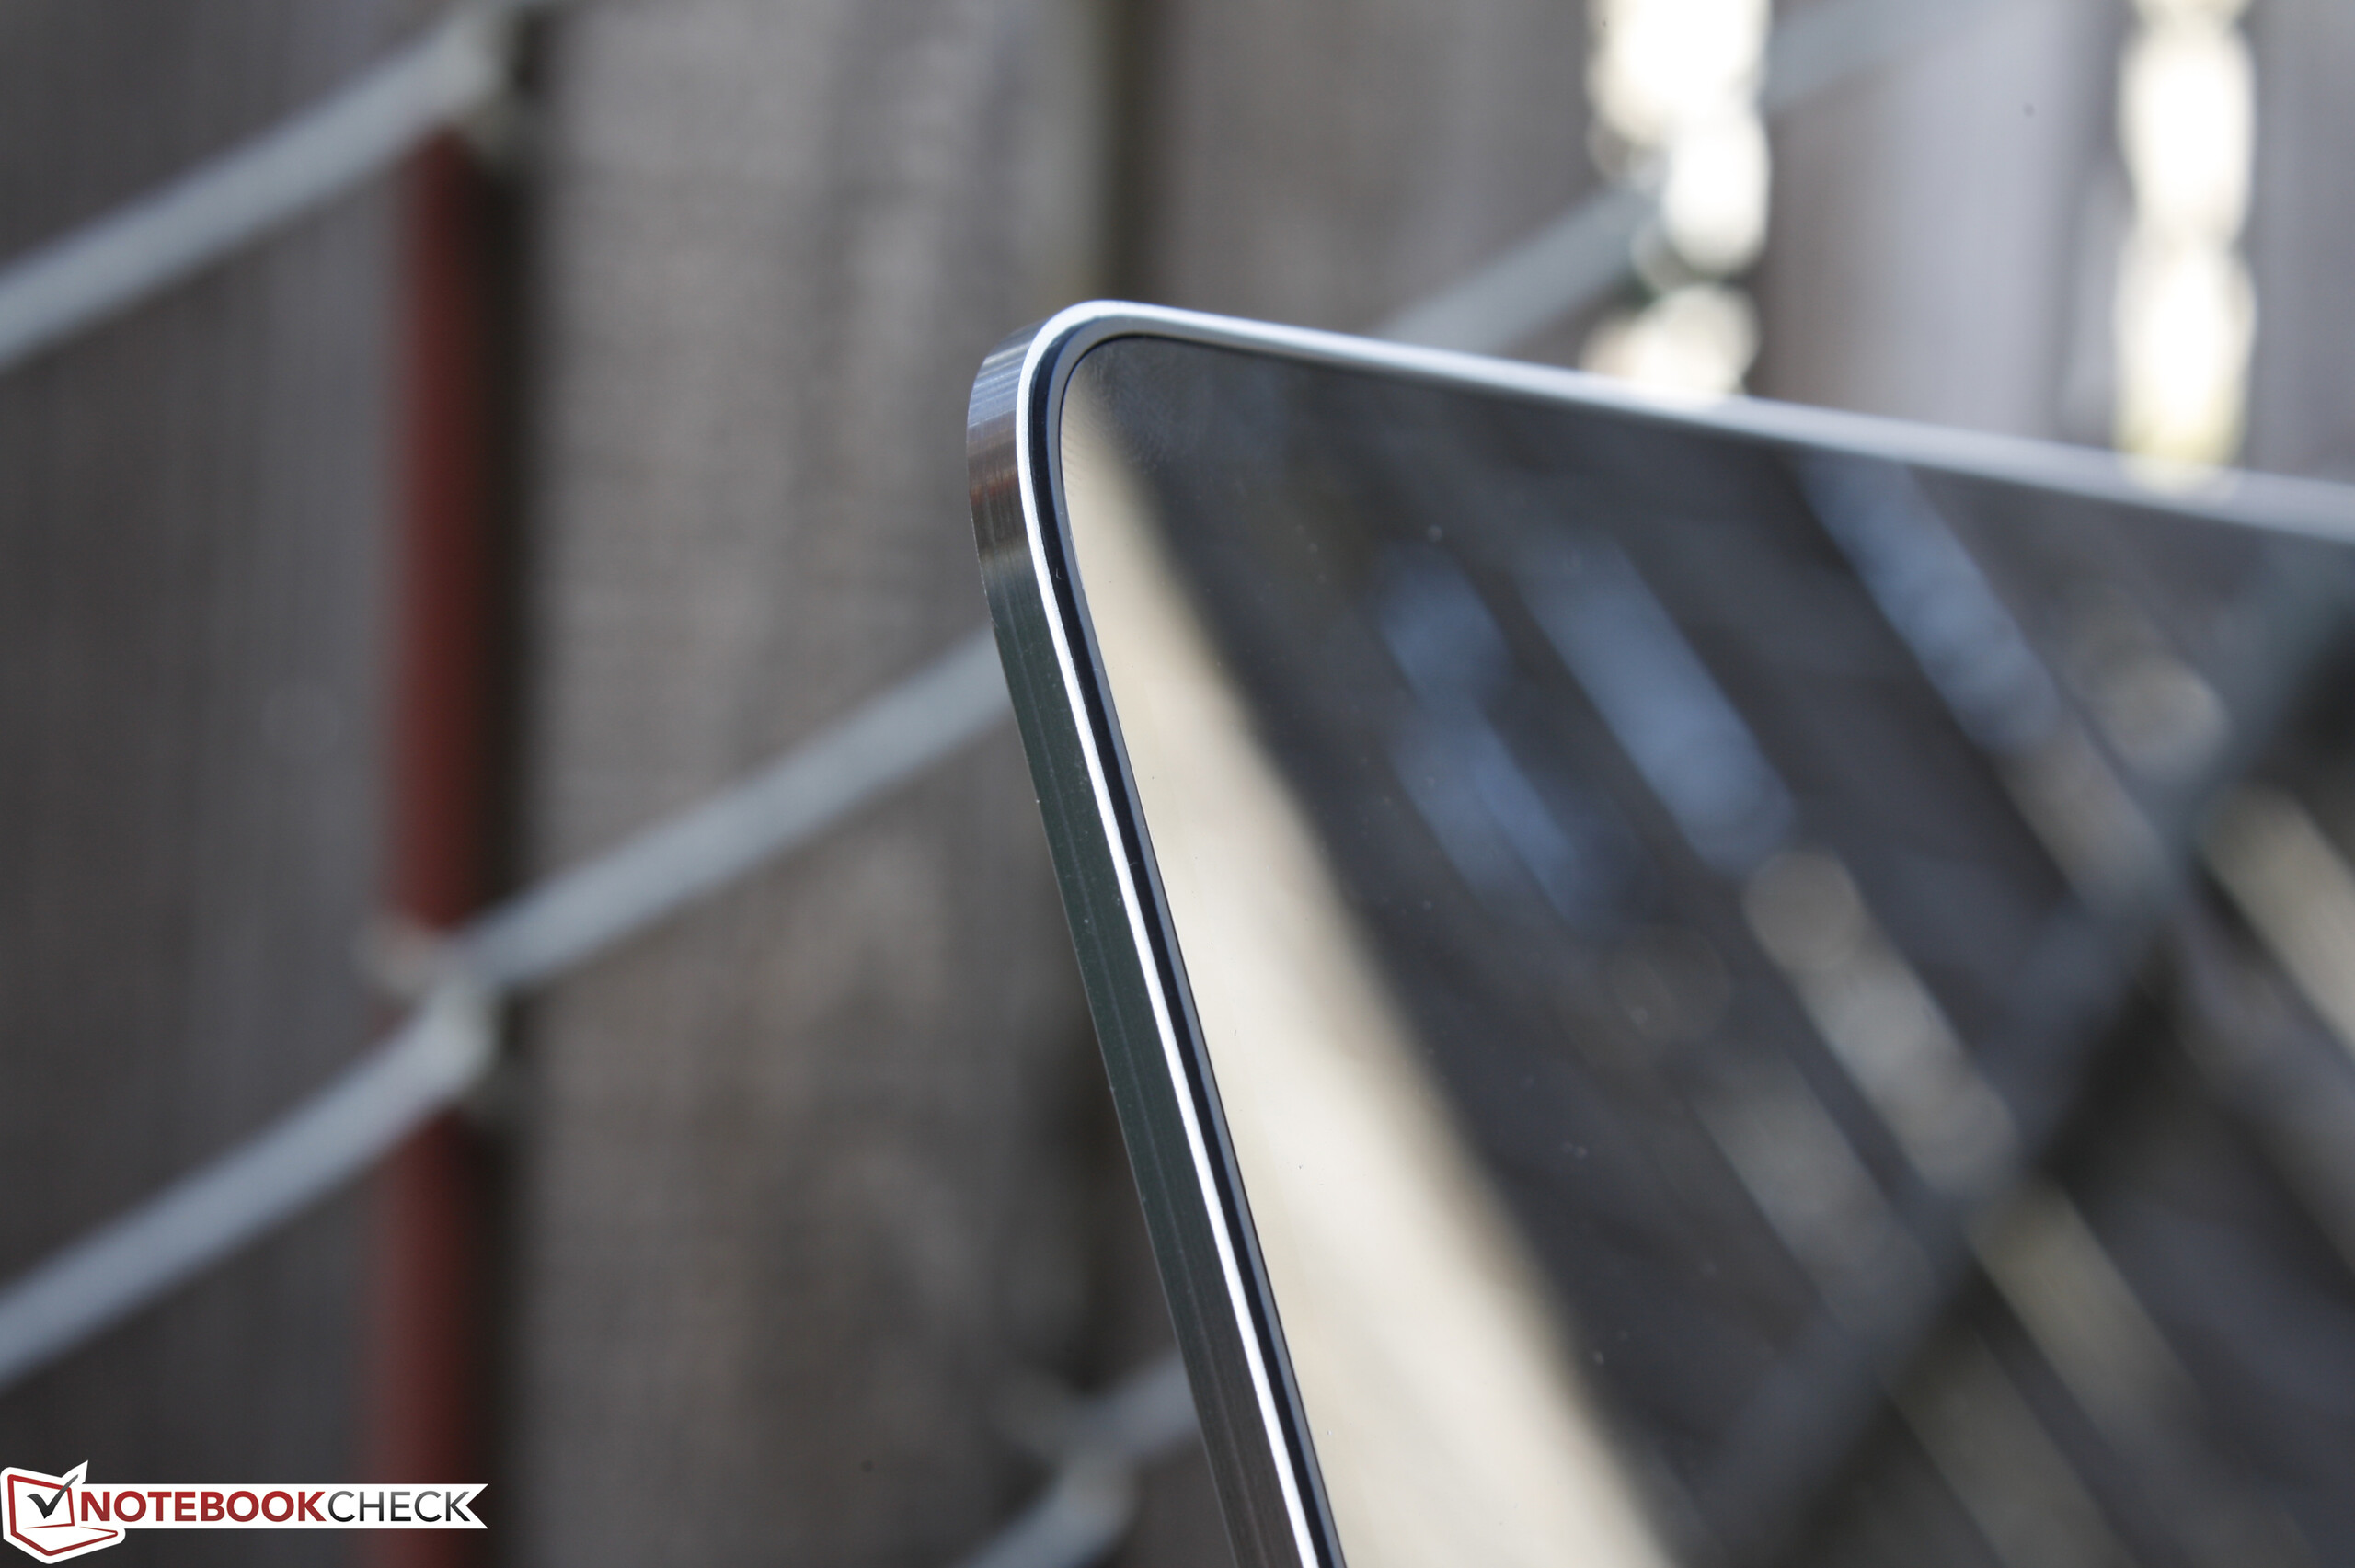
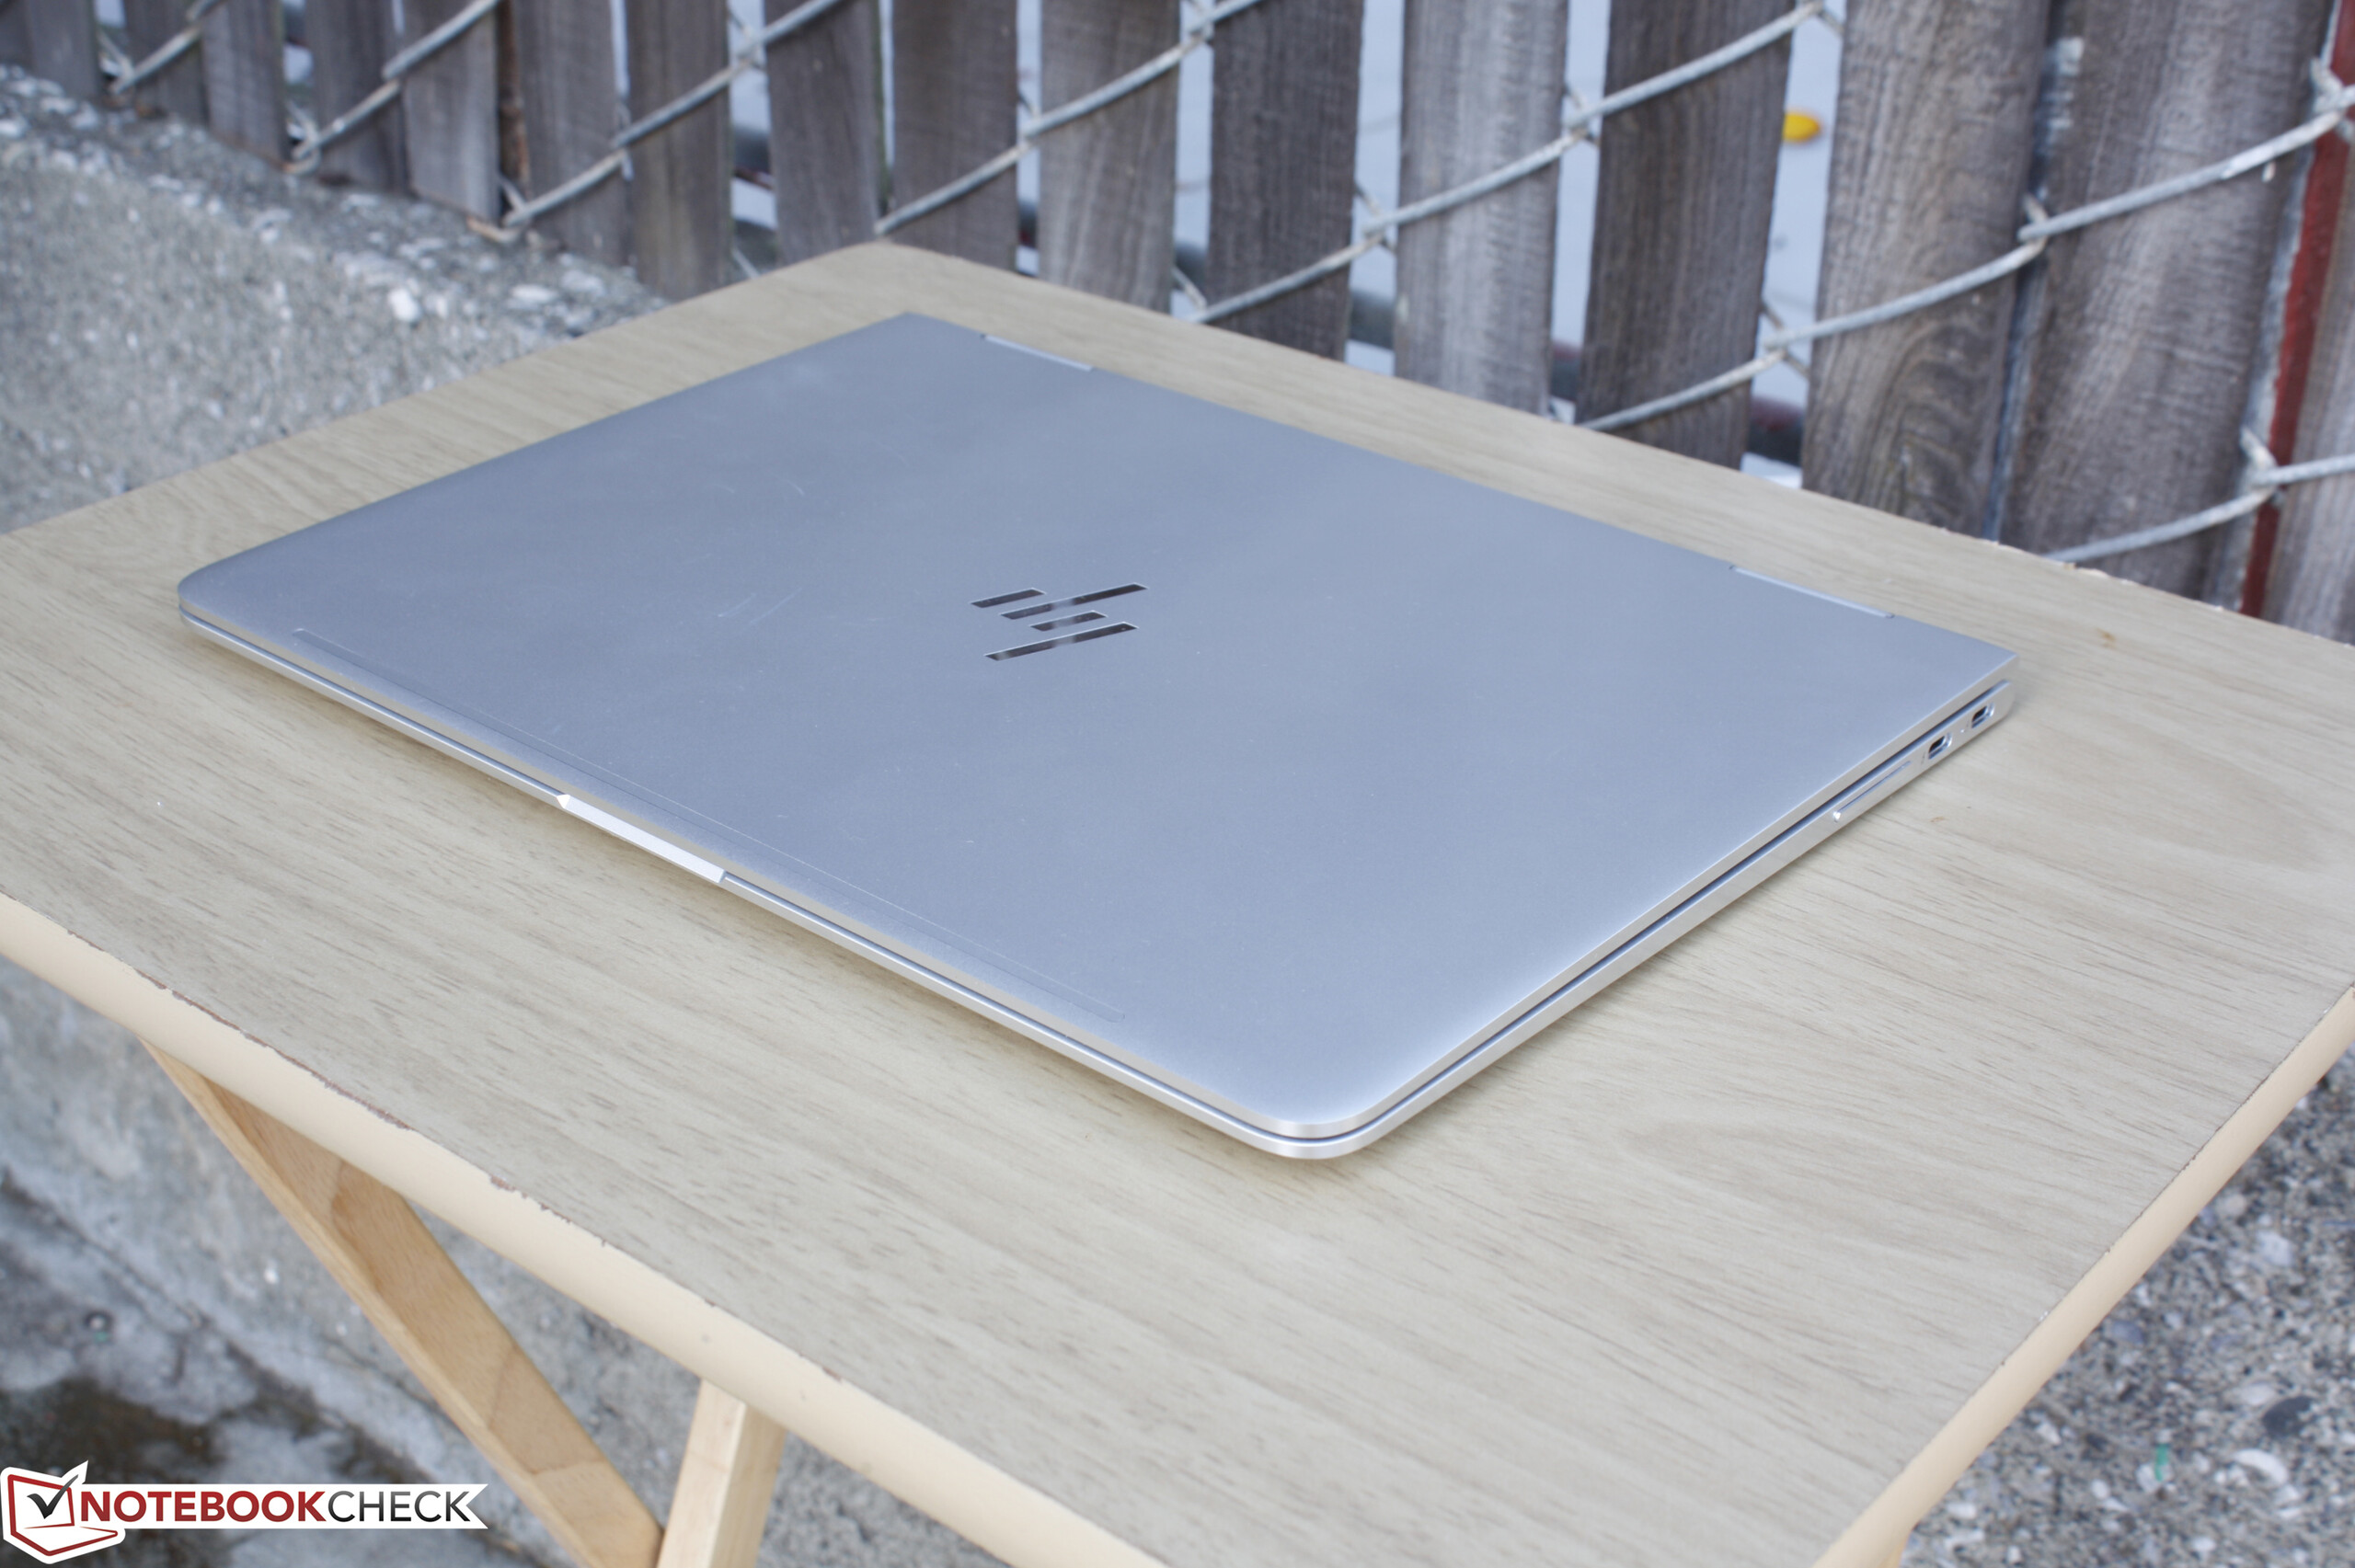
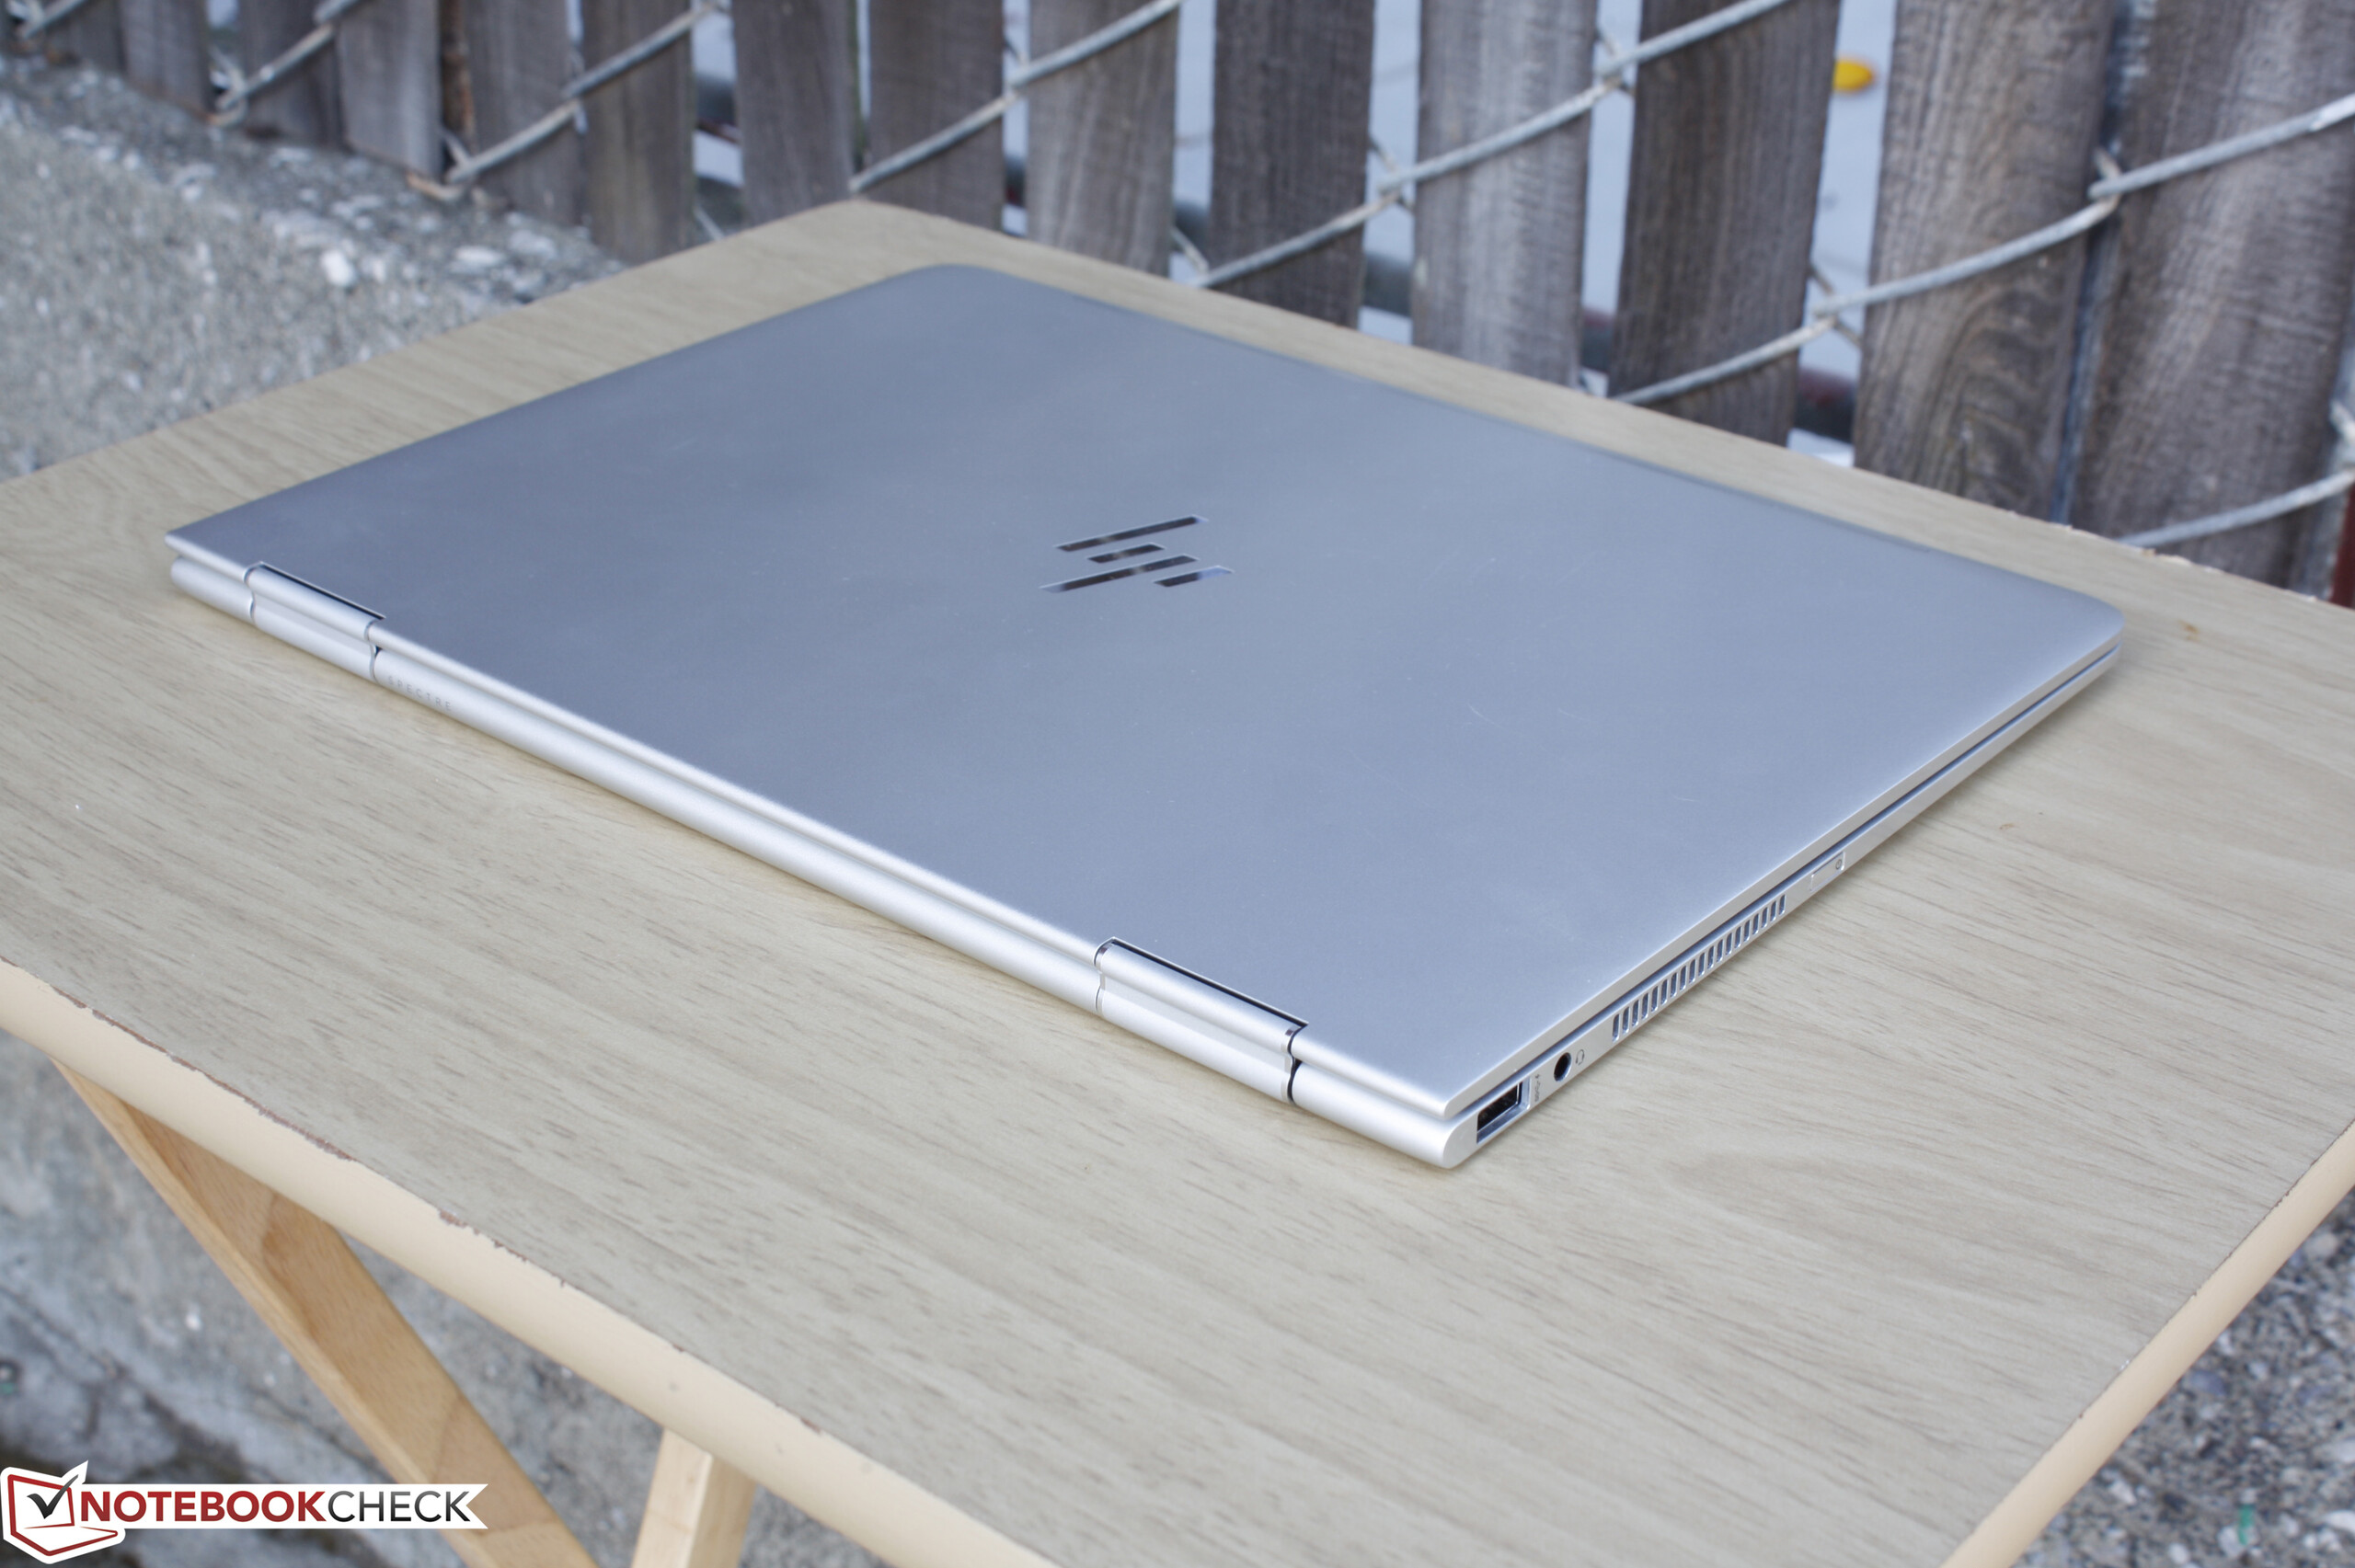
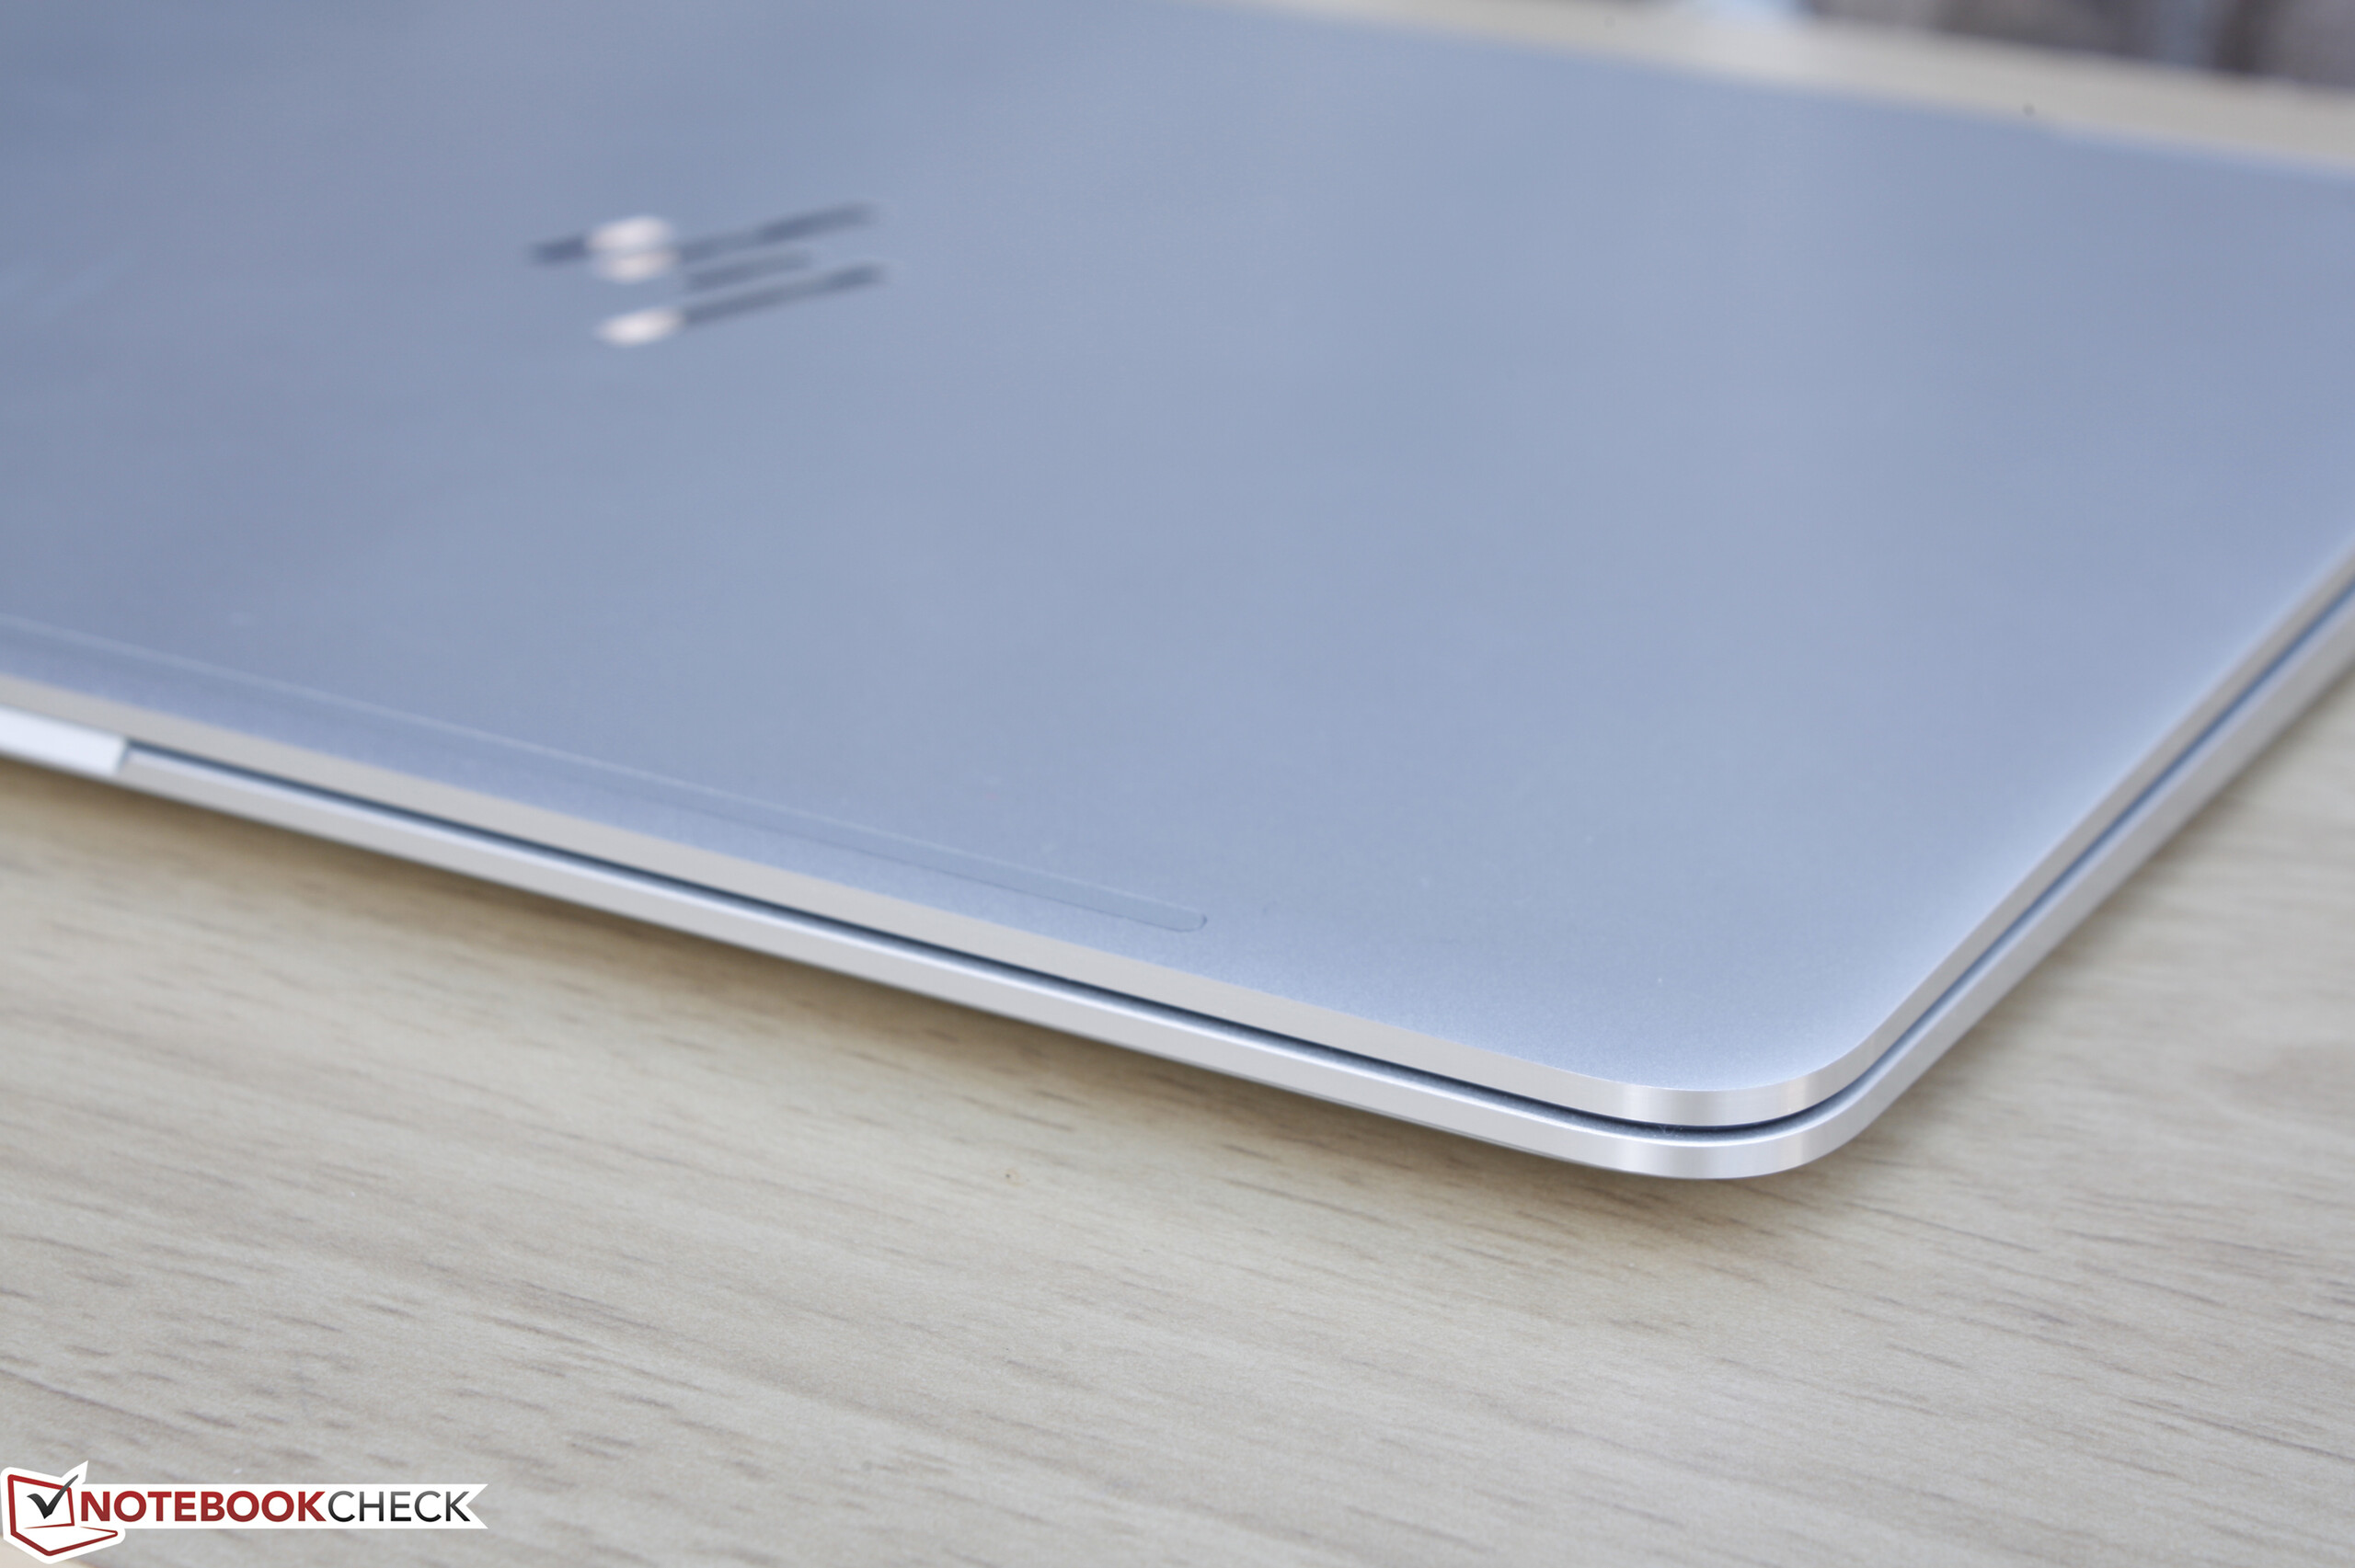
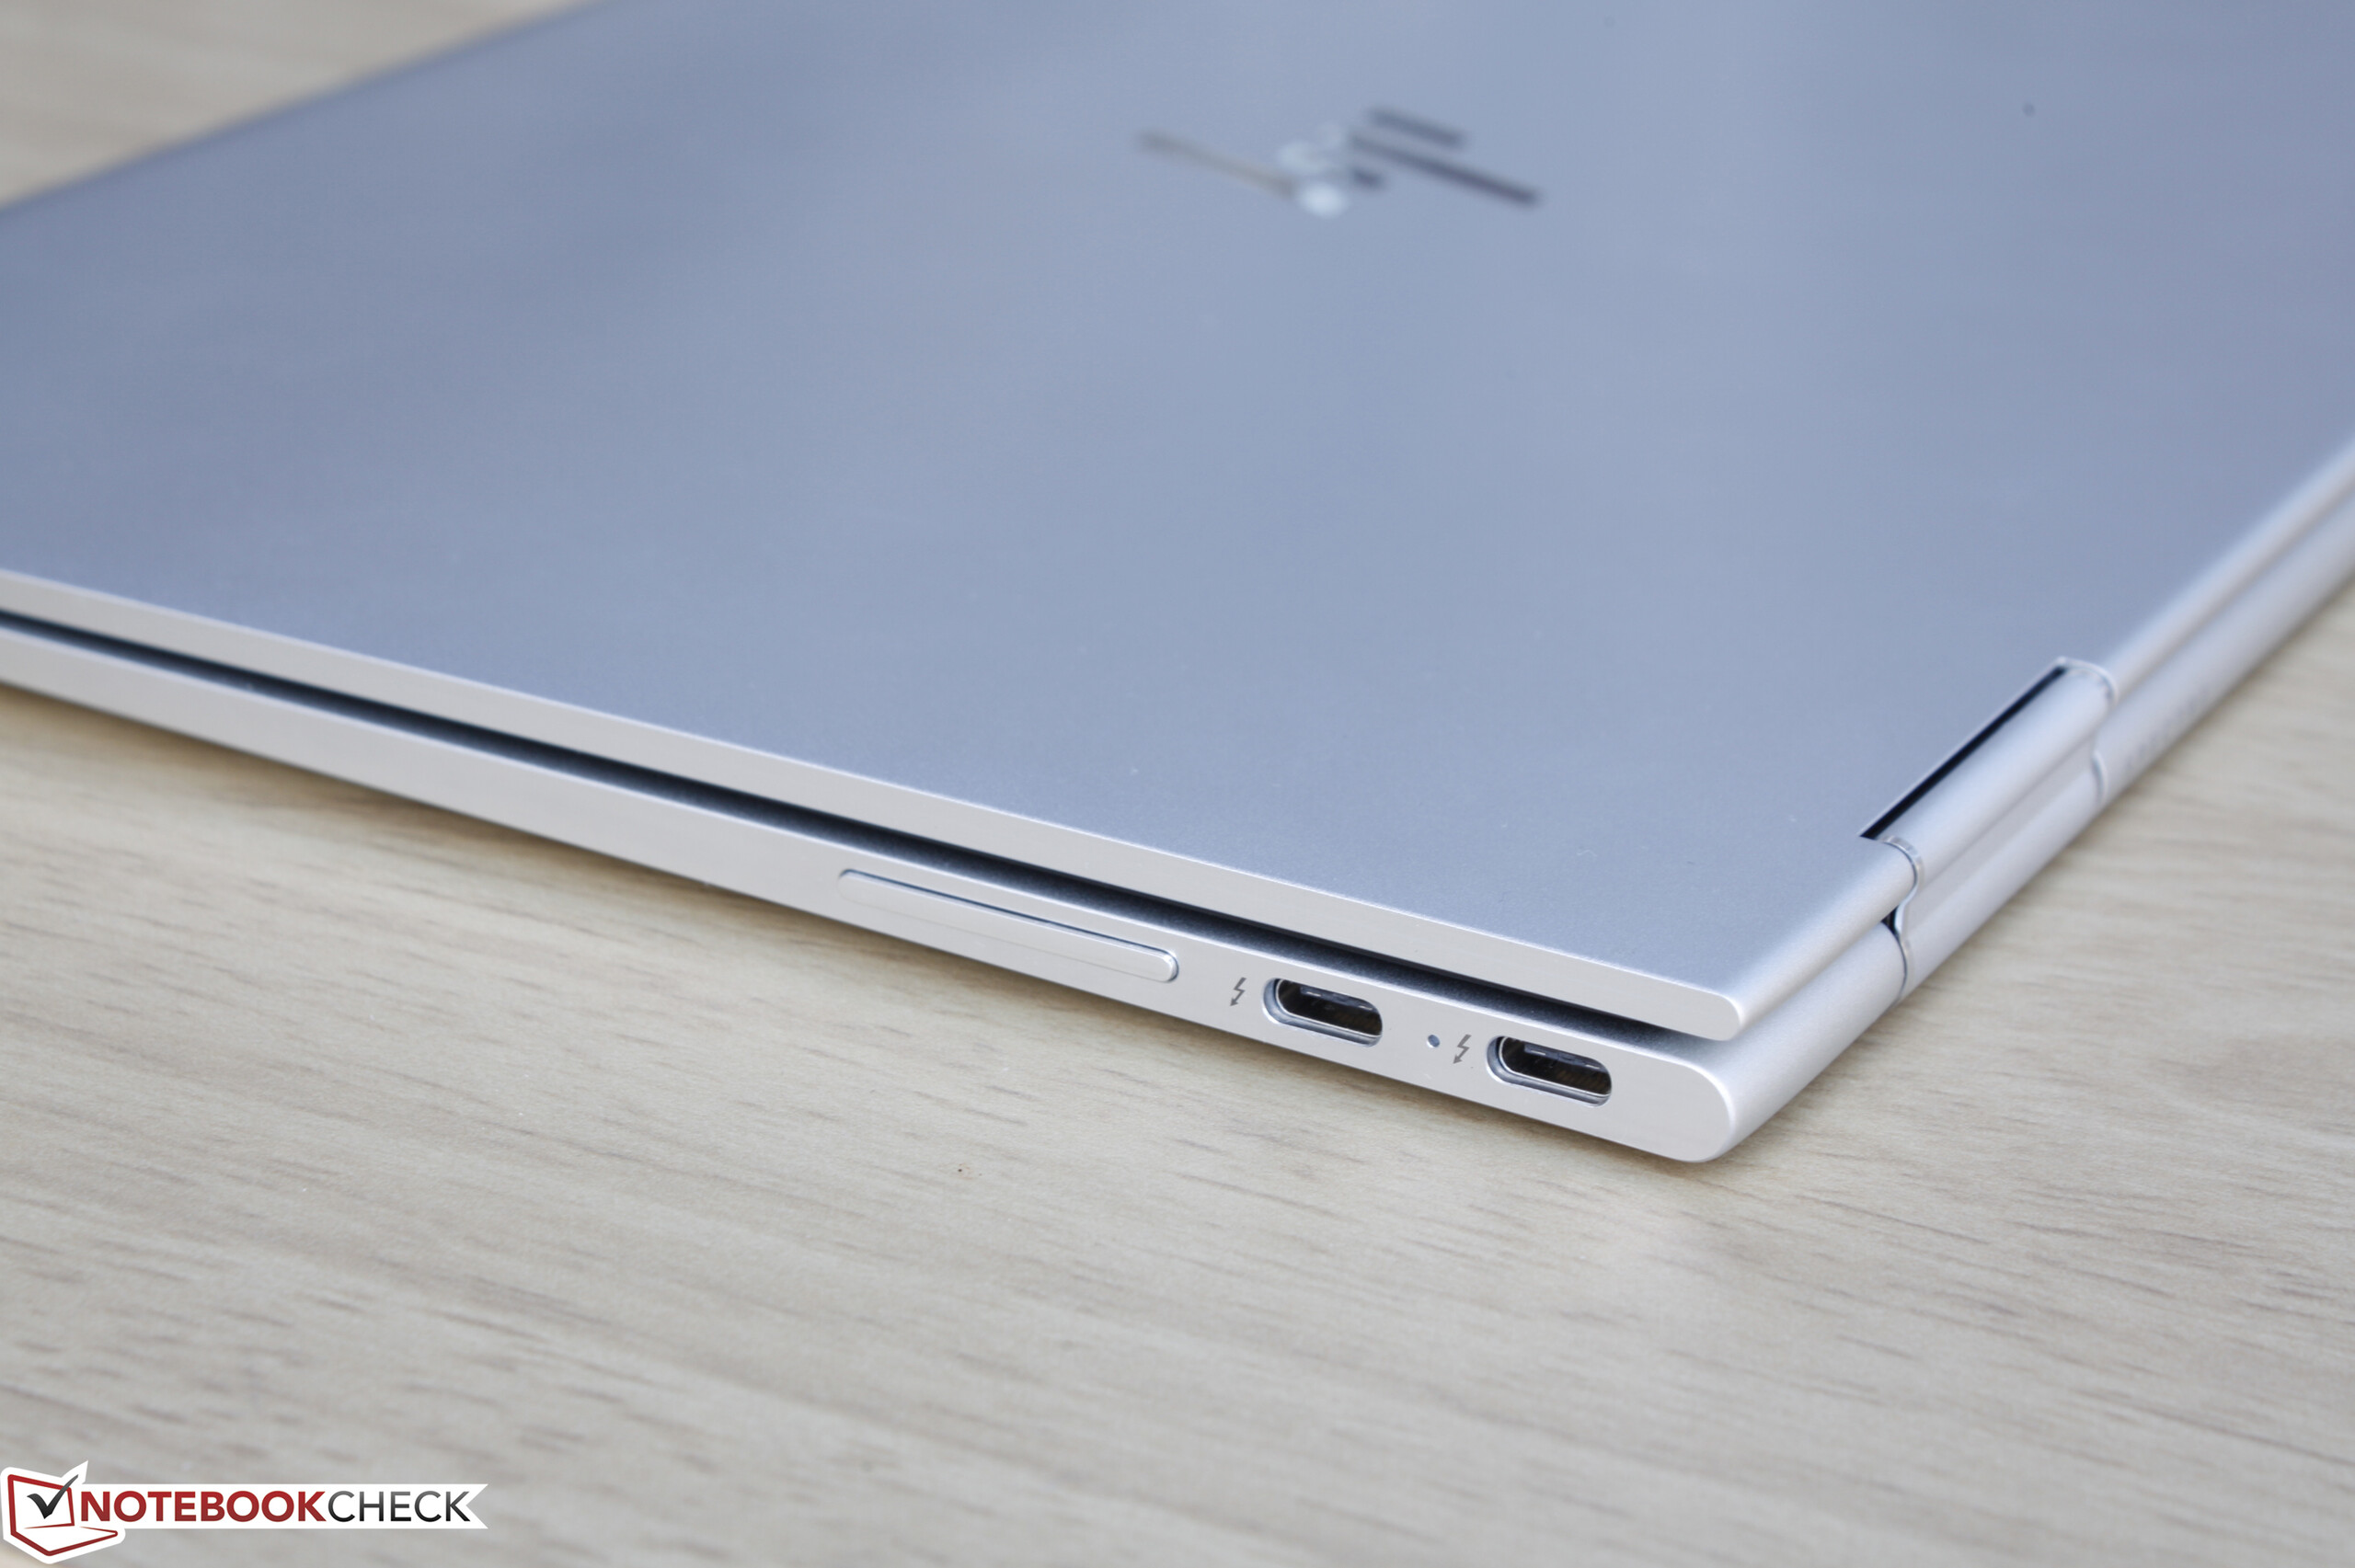
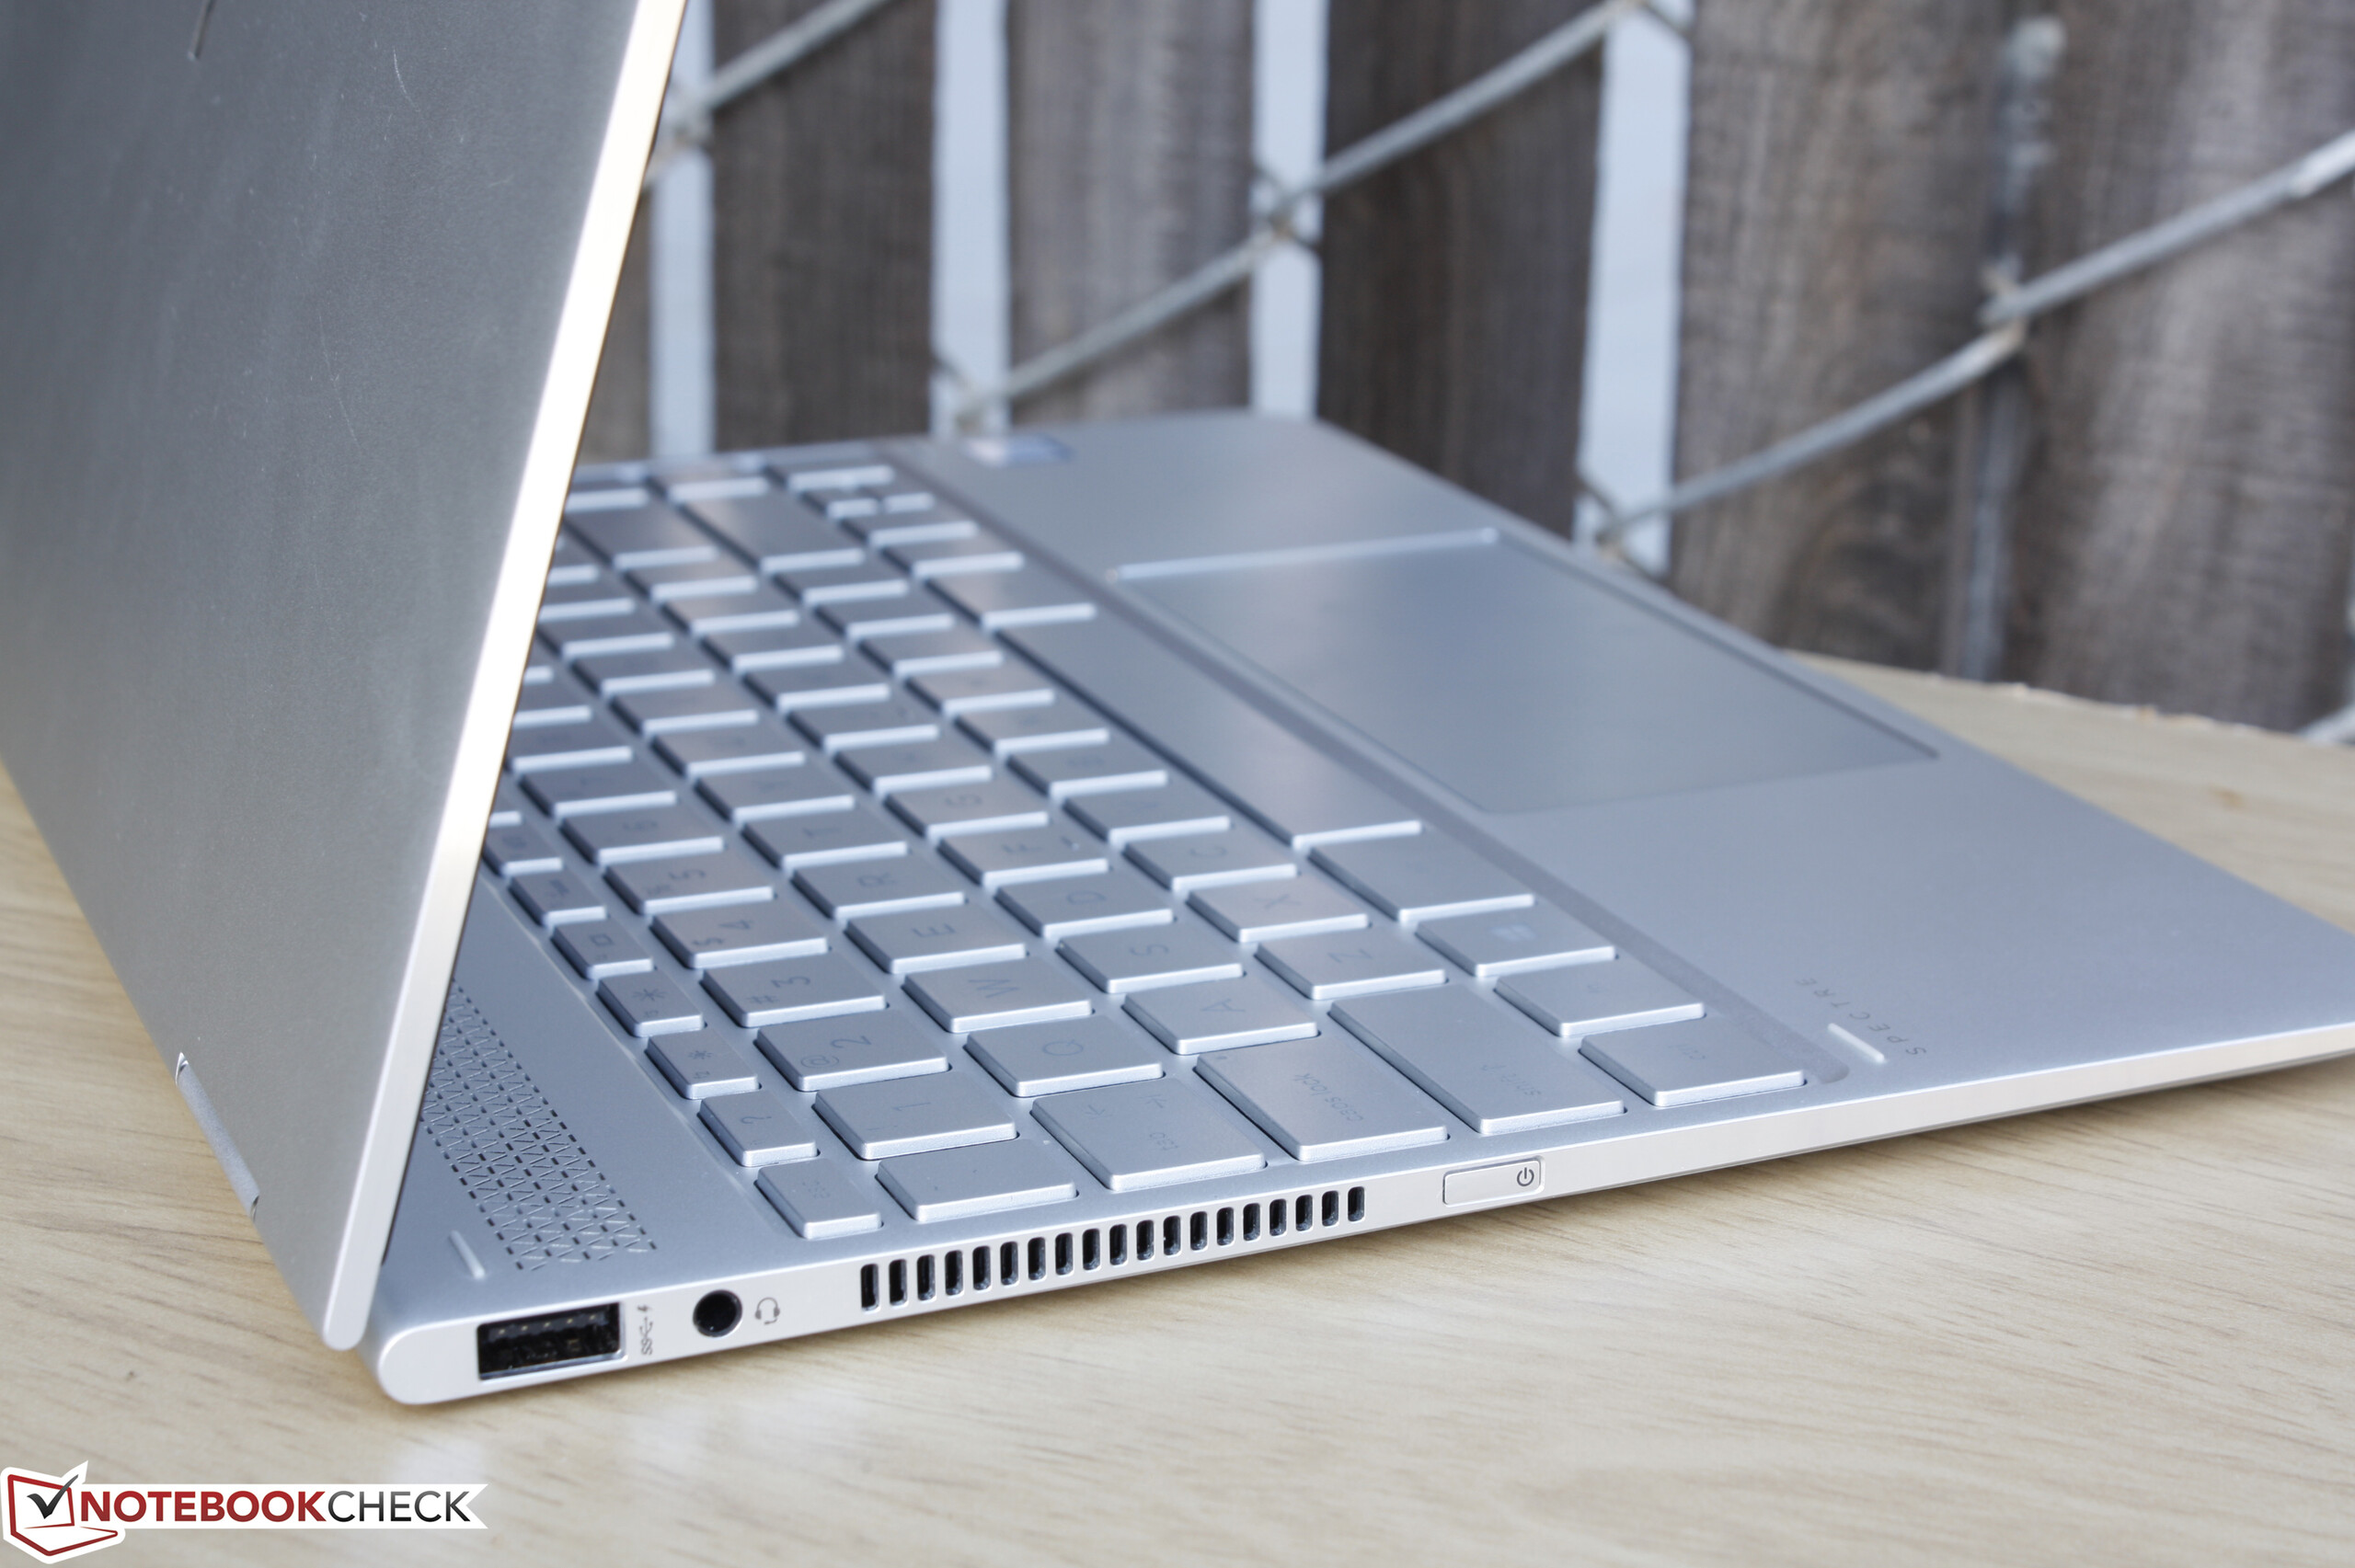
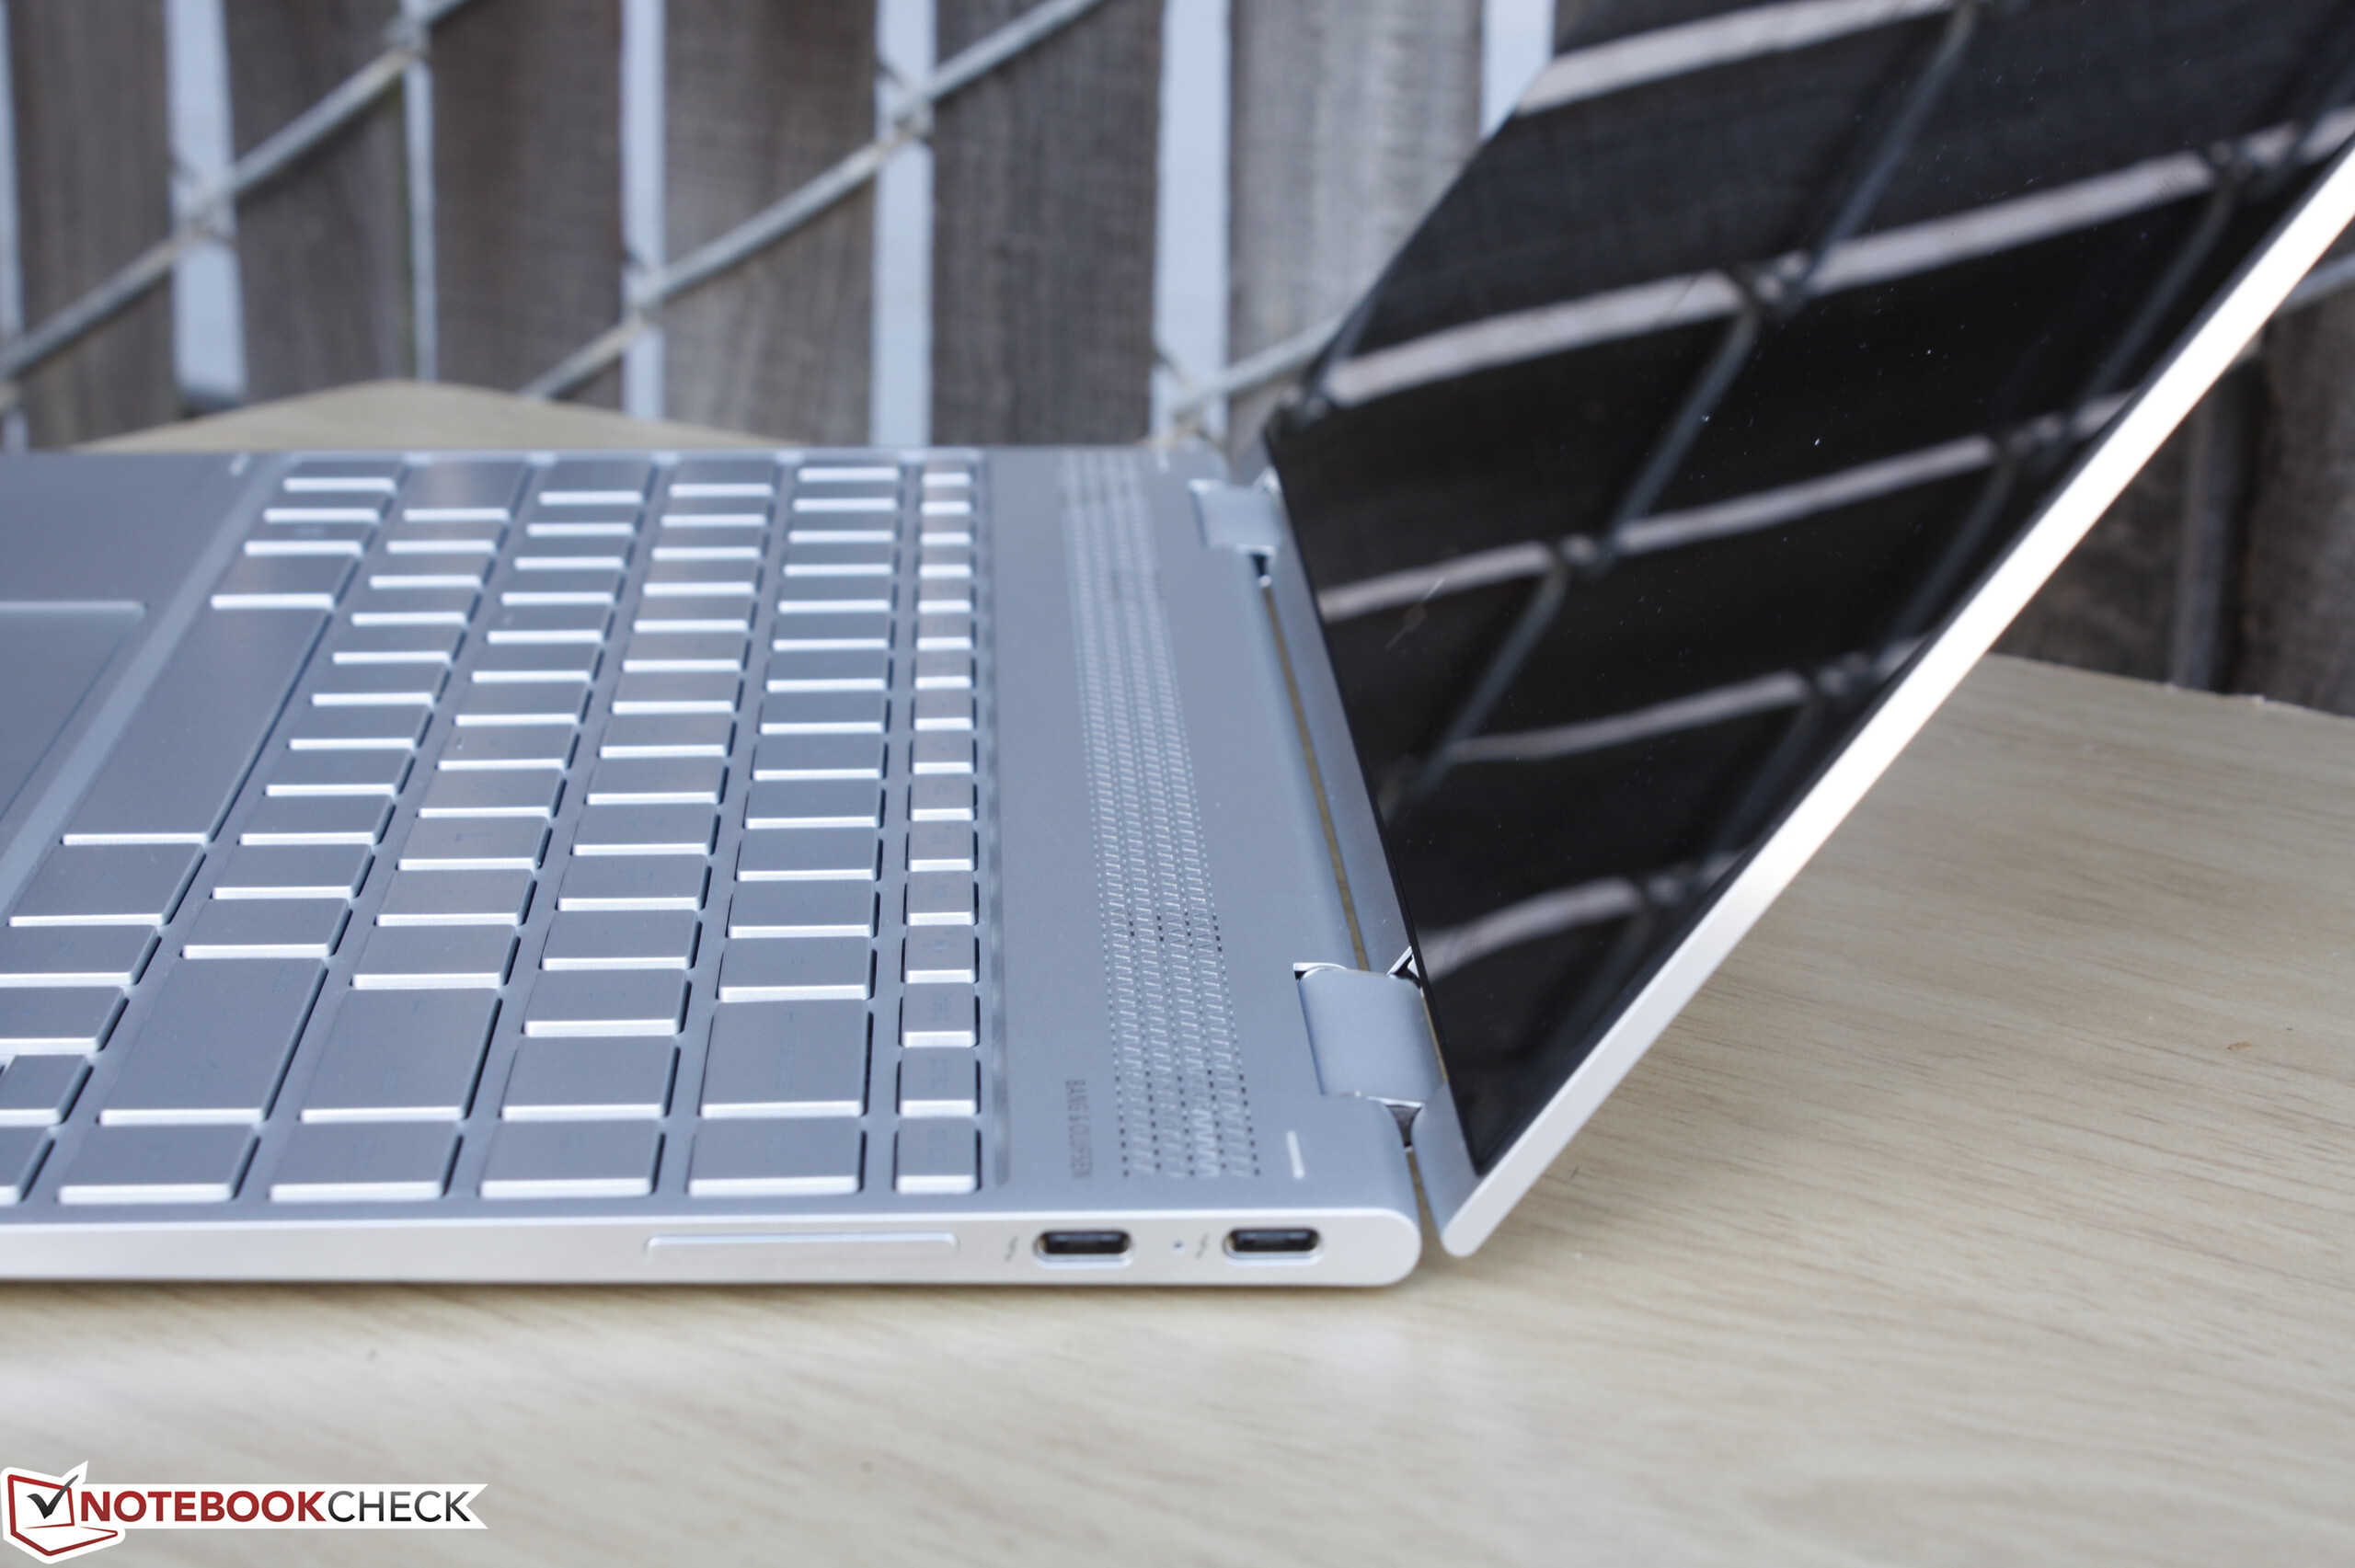
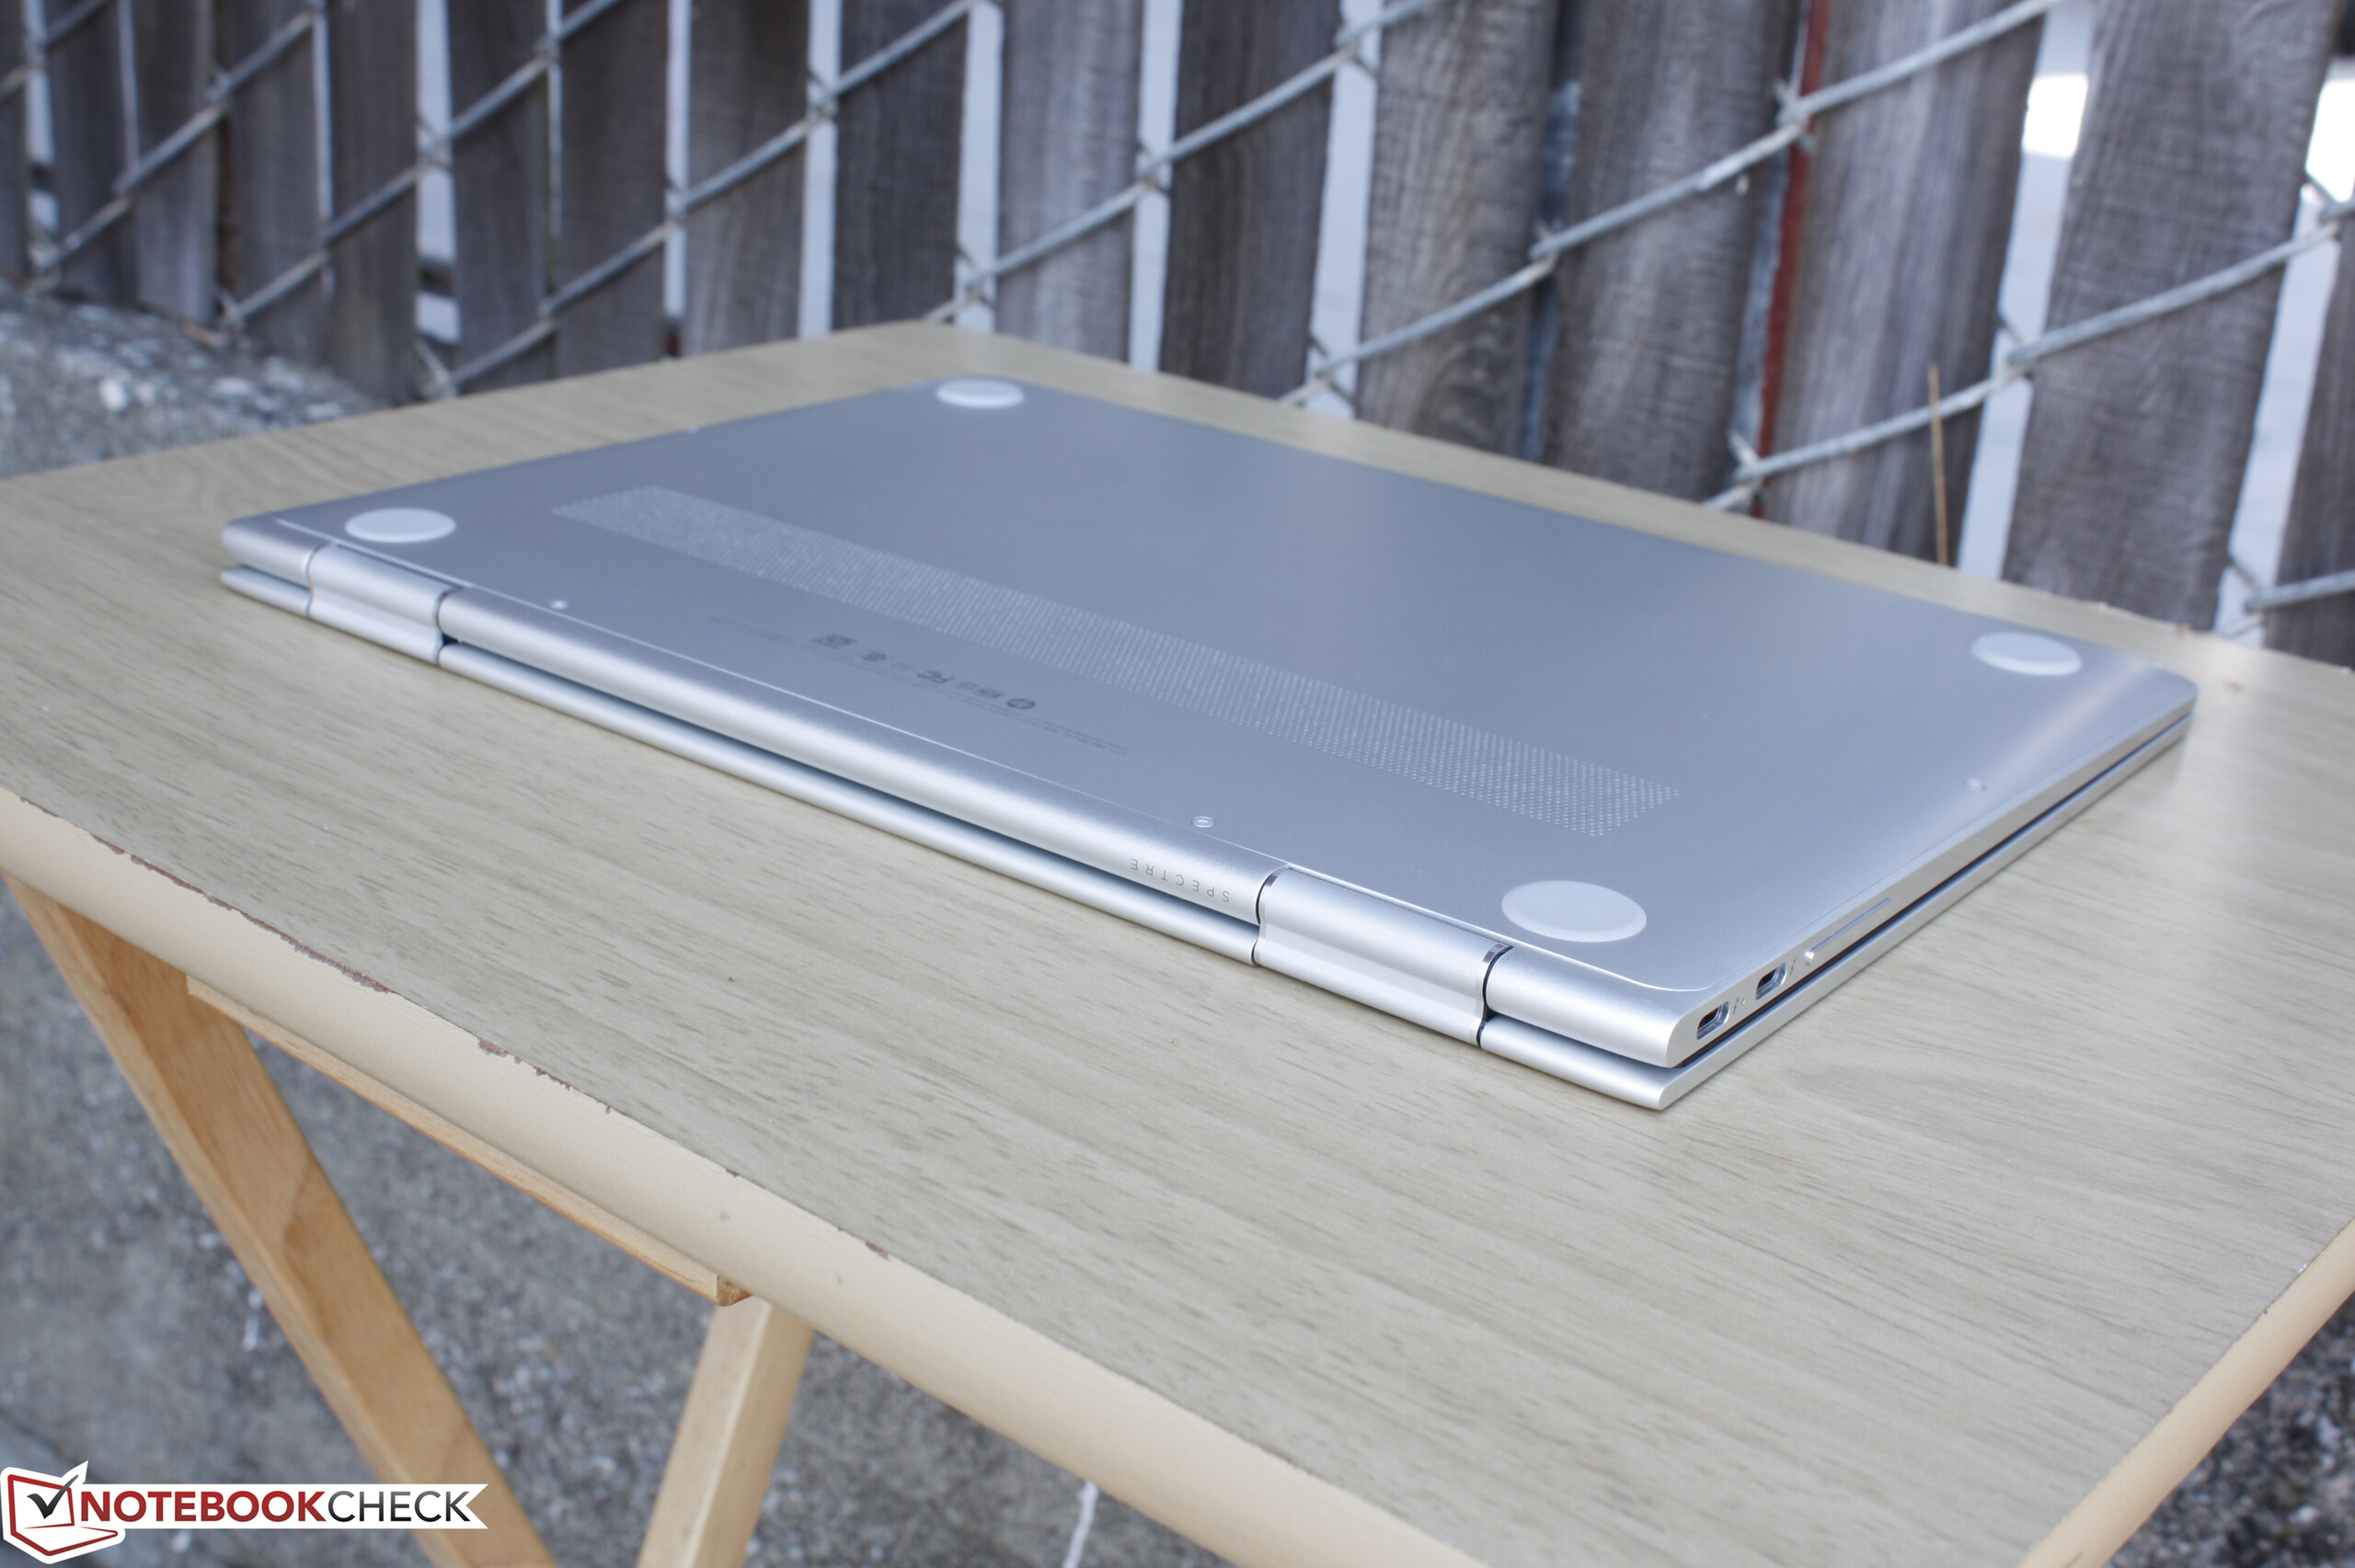
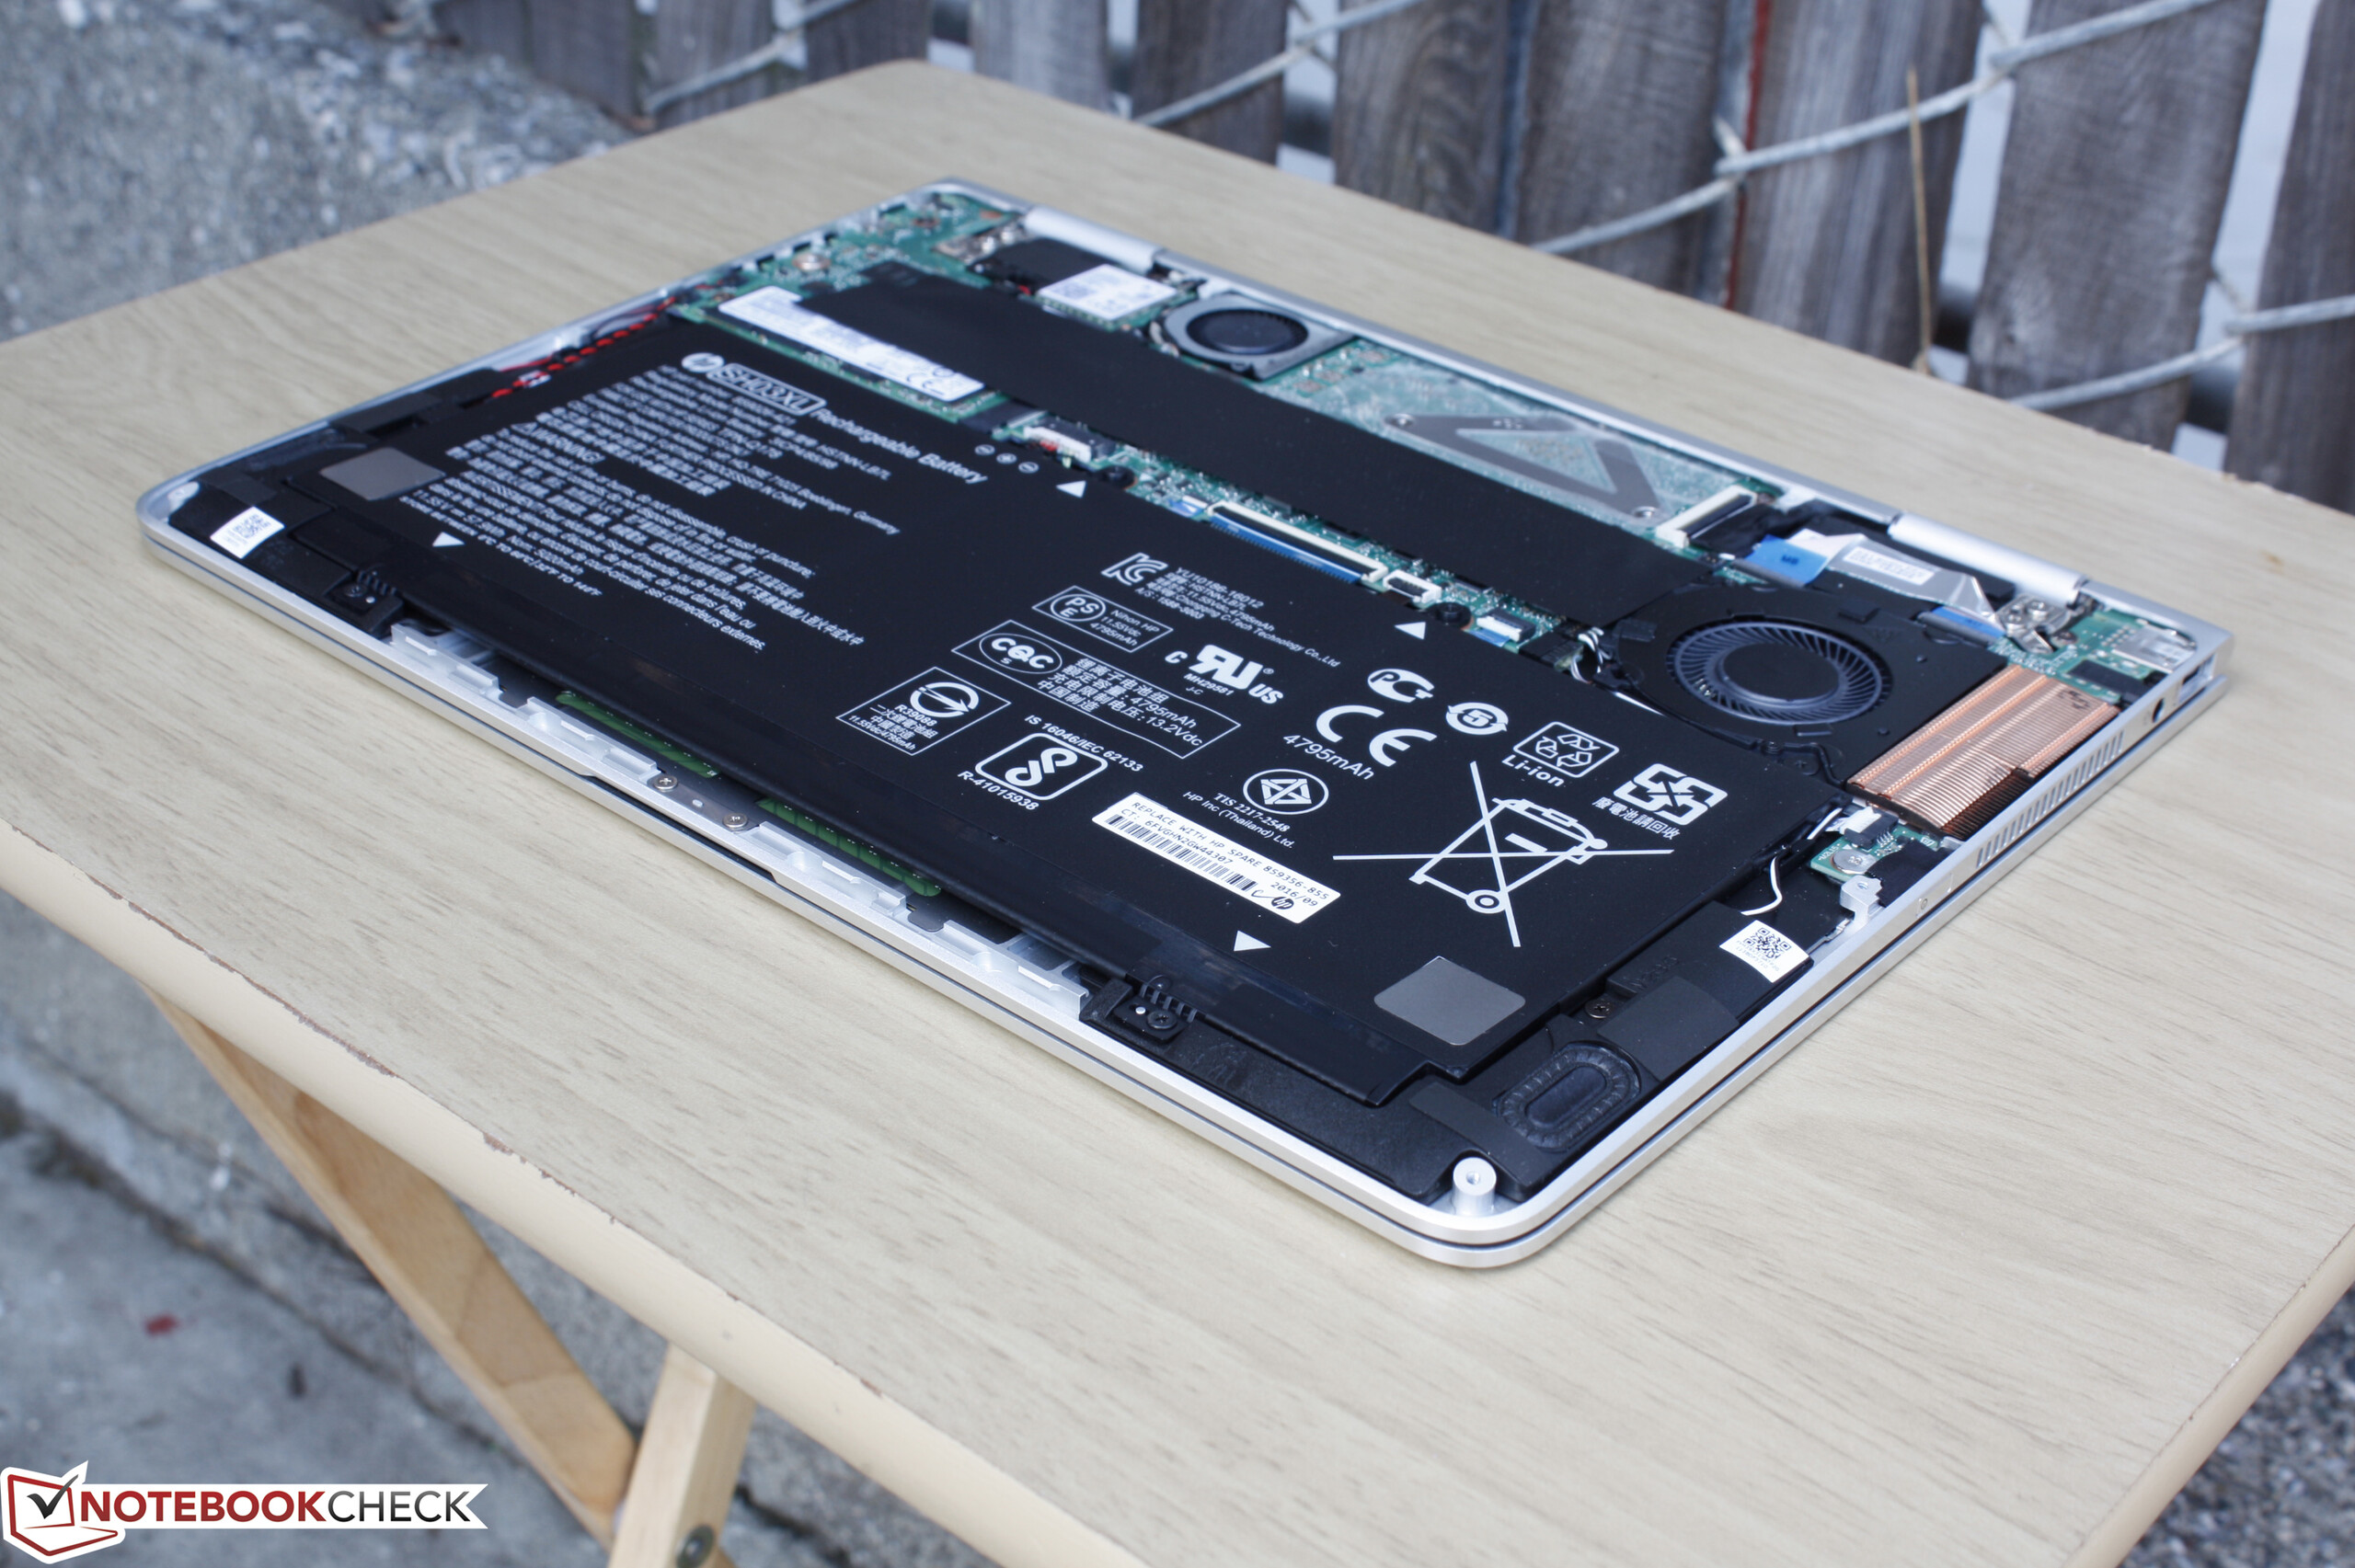
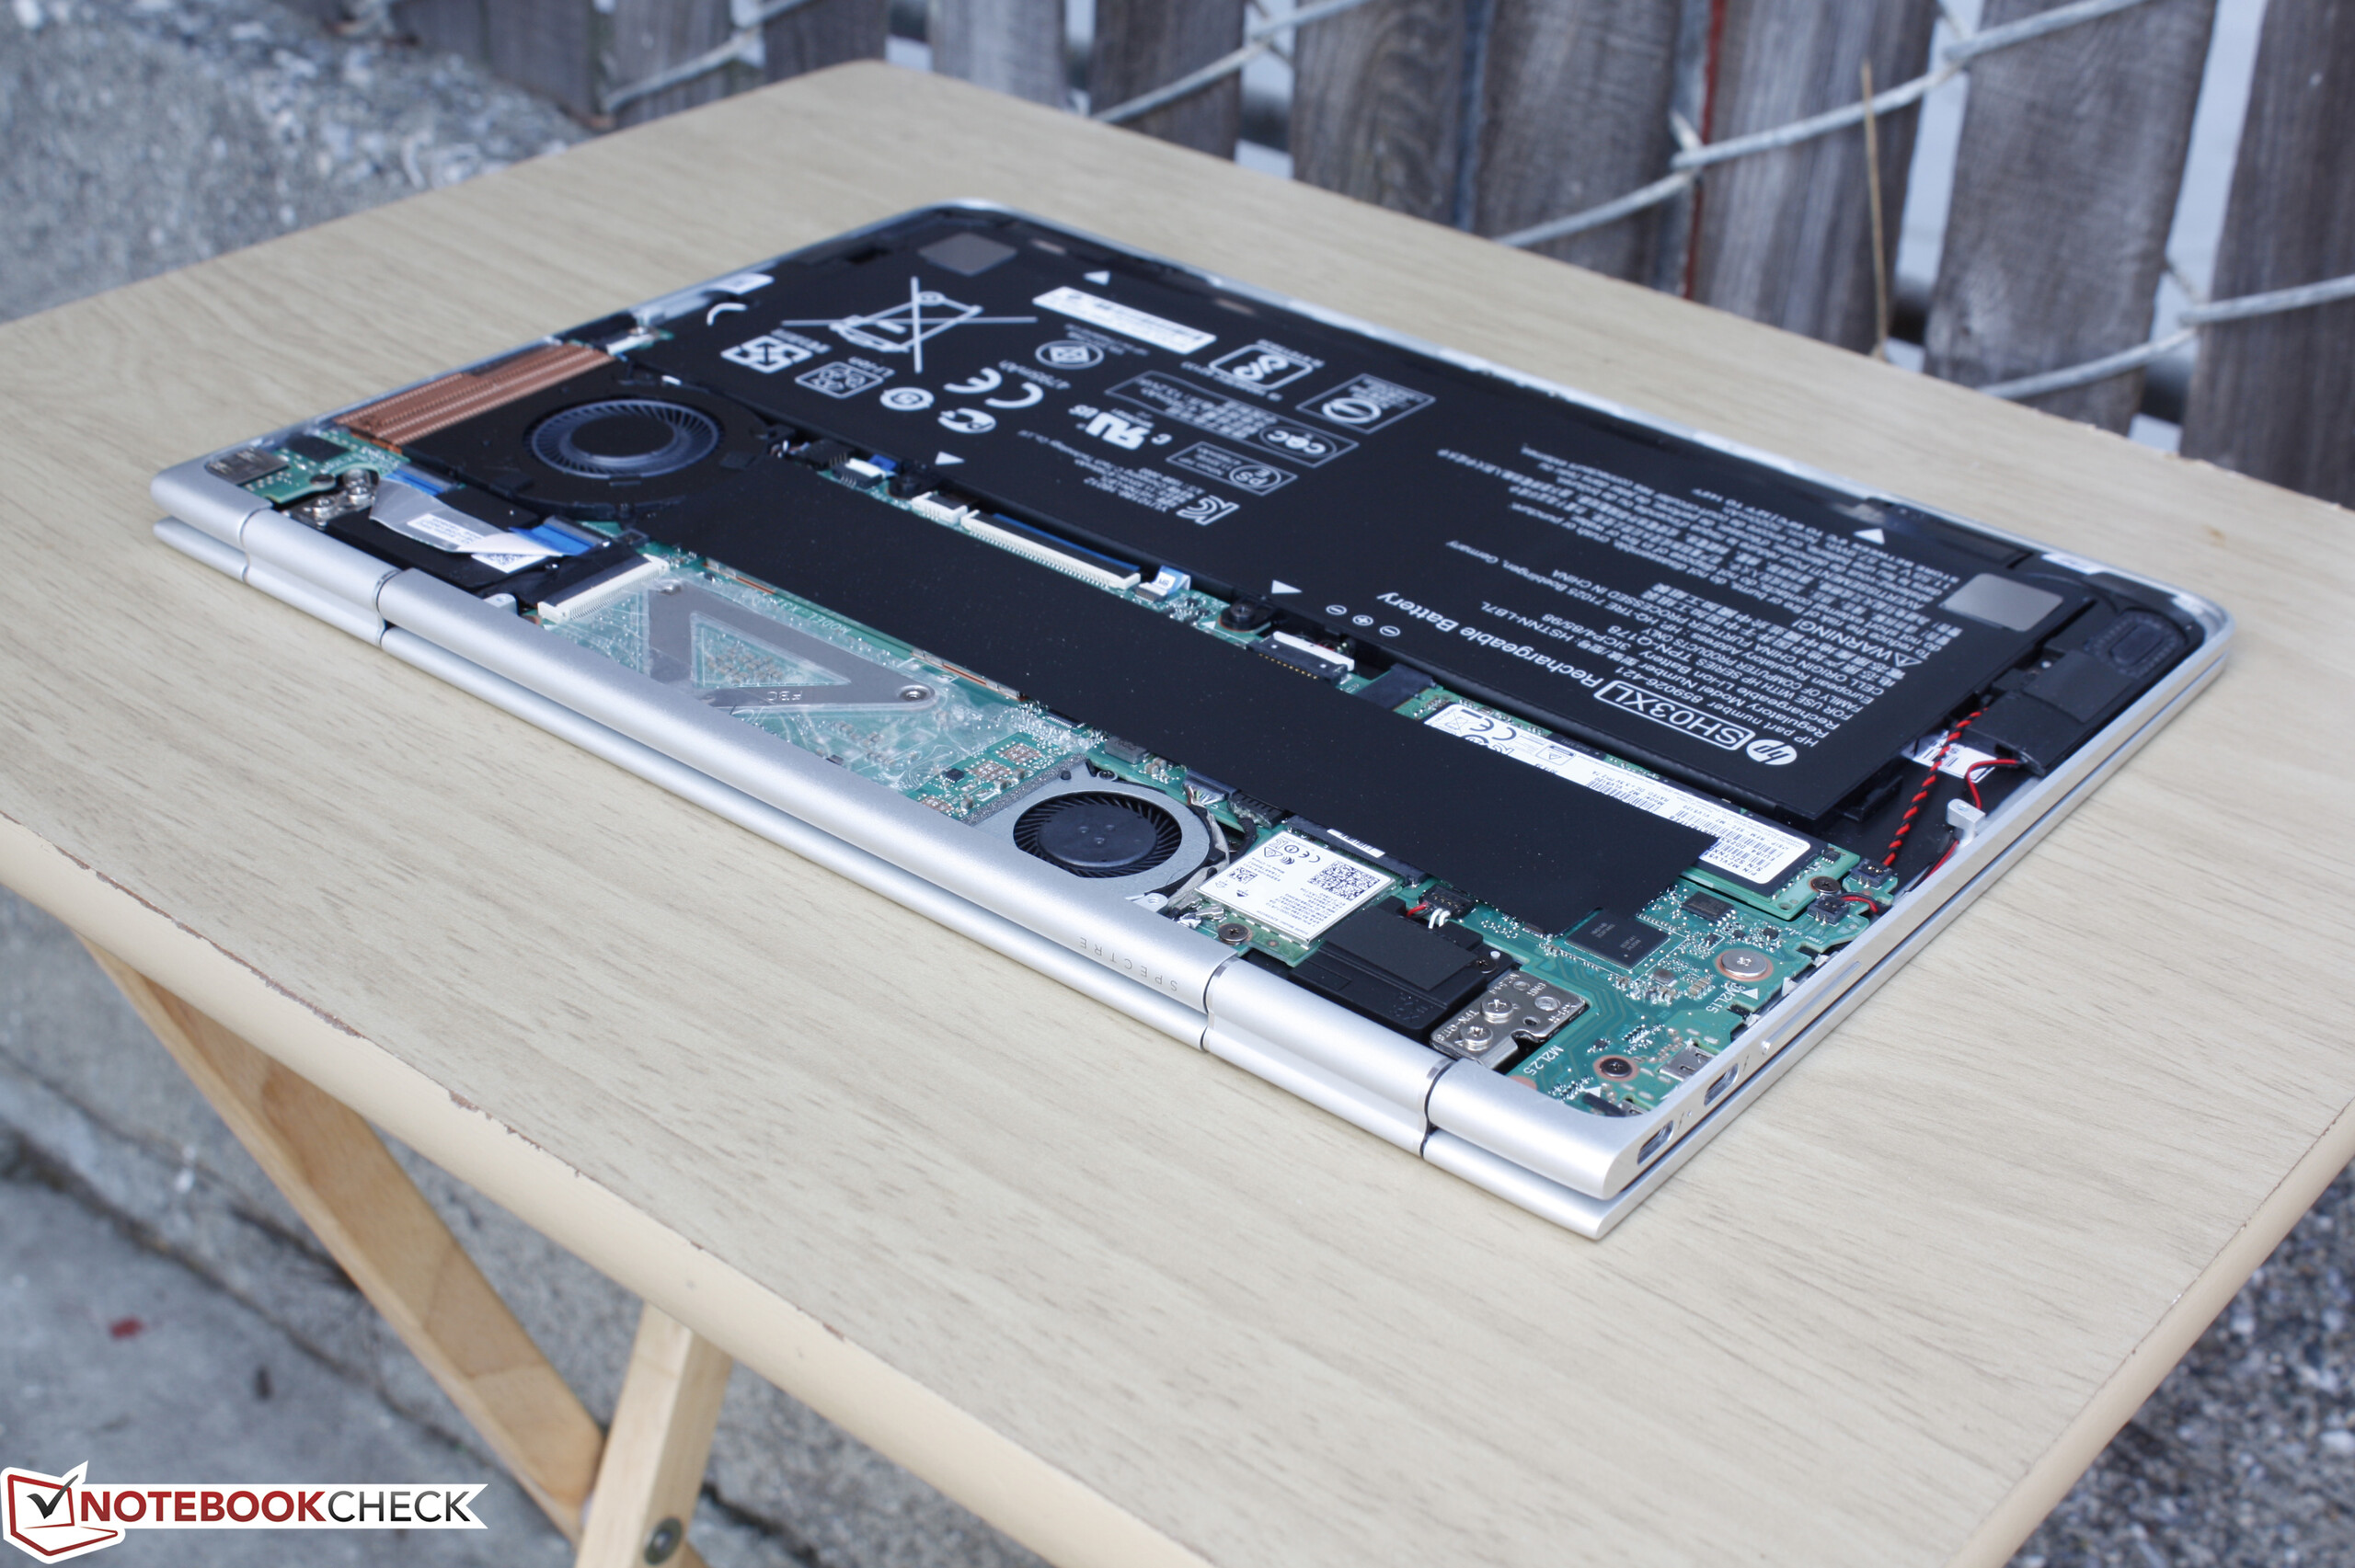
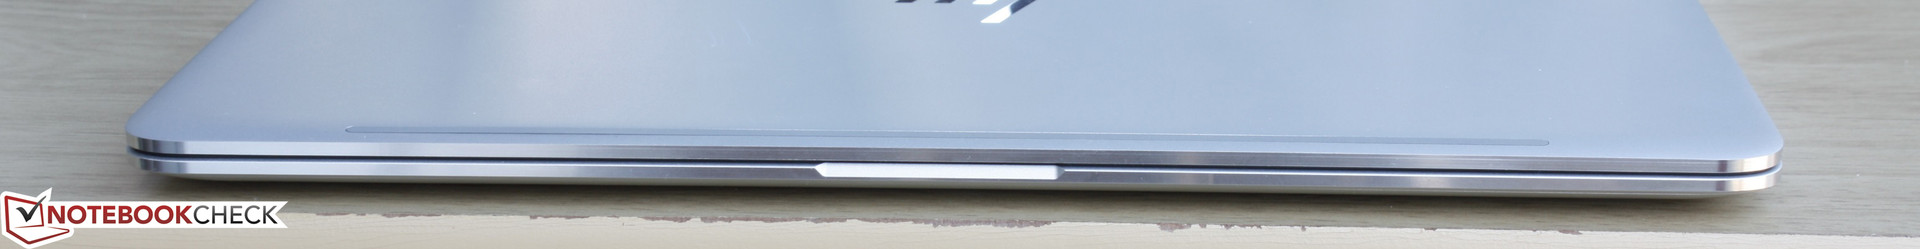
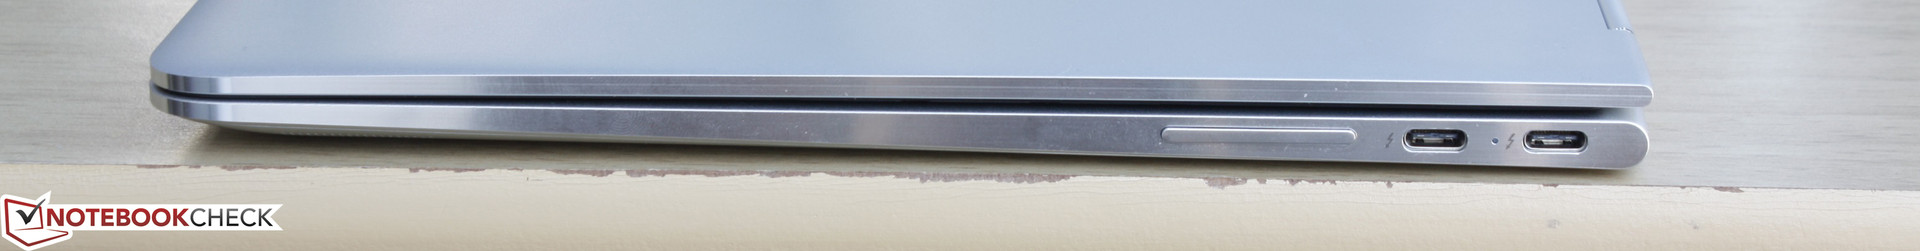
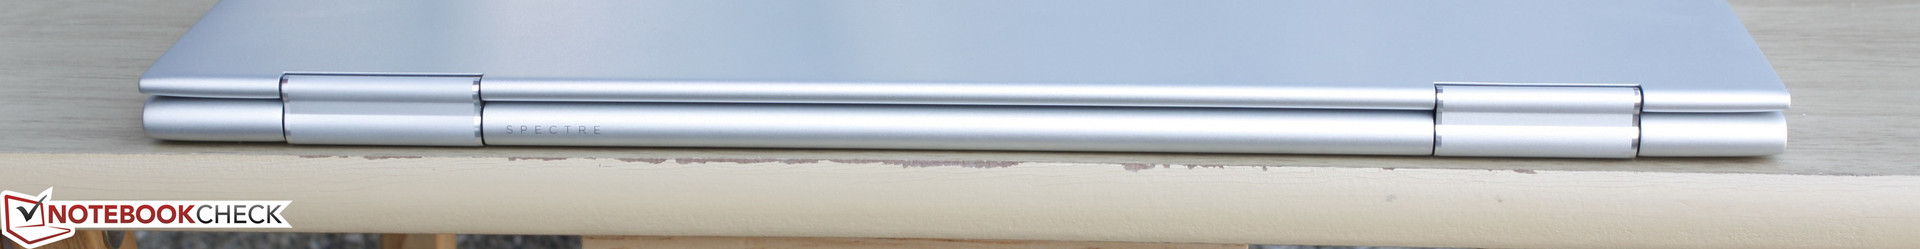
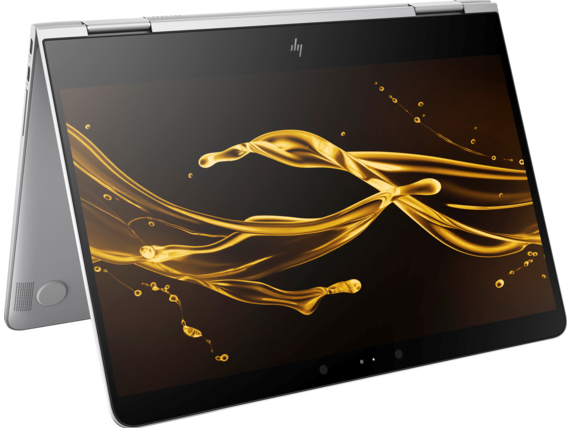
De Spectre x360 13 is de beste Spectre 2-in-1 tot nu toe. Onze grootste klacht met de vorige Spectre convertibles was hun lompheid in vergelijking met de concurrentie. De nieuwe Spectre heeft onder meer door de dunne beeldschermranden zowel het formaat als het gewicht enorm kunnen verkleinen, zonder drastische consequenties voor de bouwkwaliteit of stevigheid. Sterker nog, het nieuwe ontwerp is de beste vernieuwing in de Spectre x360 13, meer nog dan de upgrade naar Kaby Lake. Andere voordelen van de vernieuwing zijn langere batterijlevensduur, NVMe SSD, betere prestaties van de geïntegreerde GPU en 2x Thunderbolt 3-poorten.
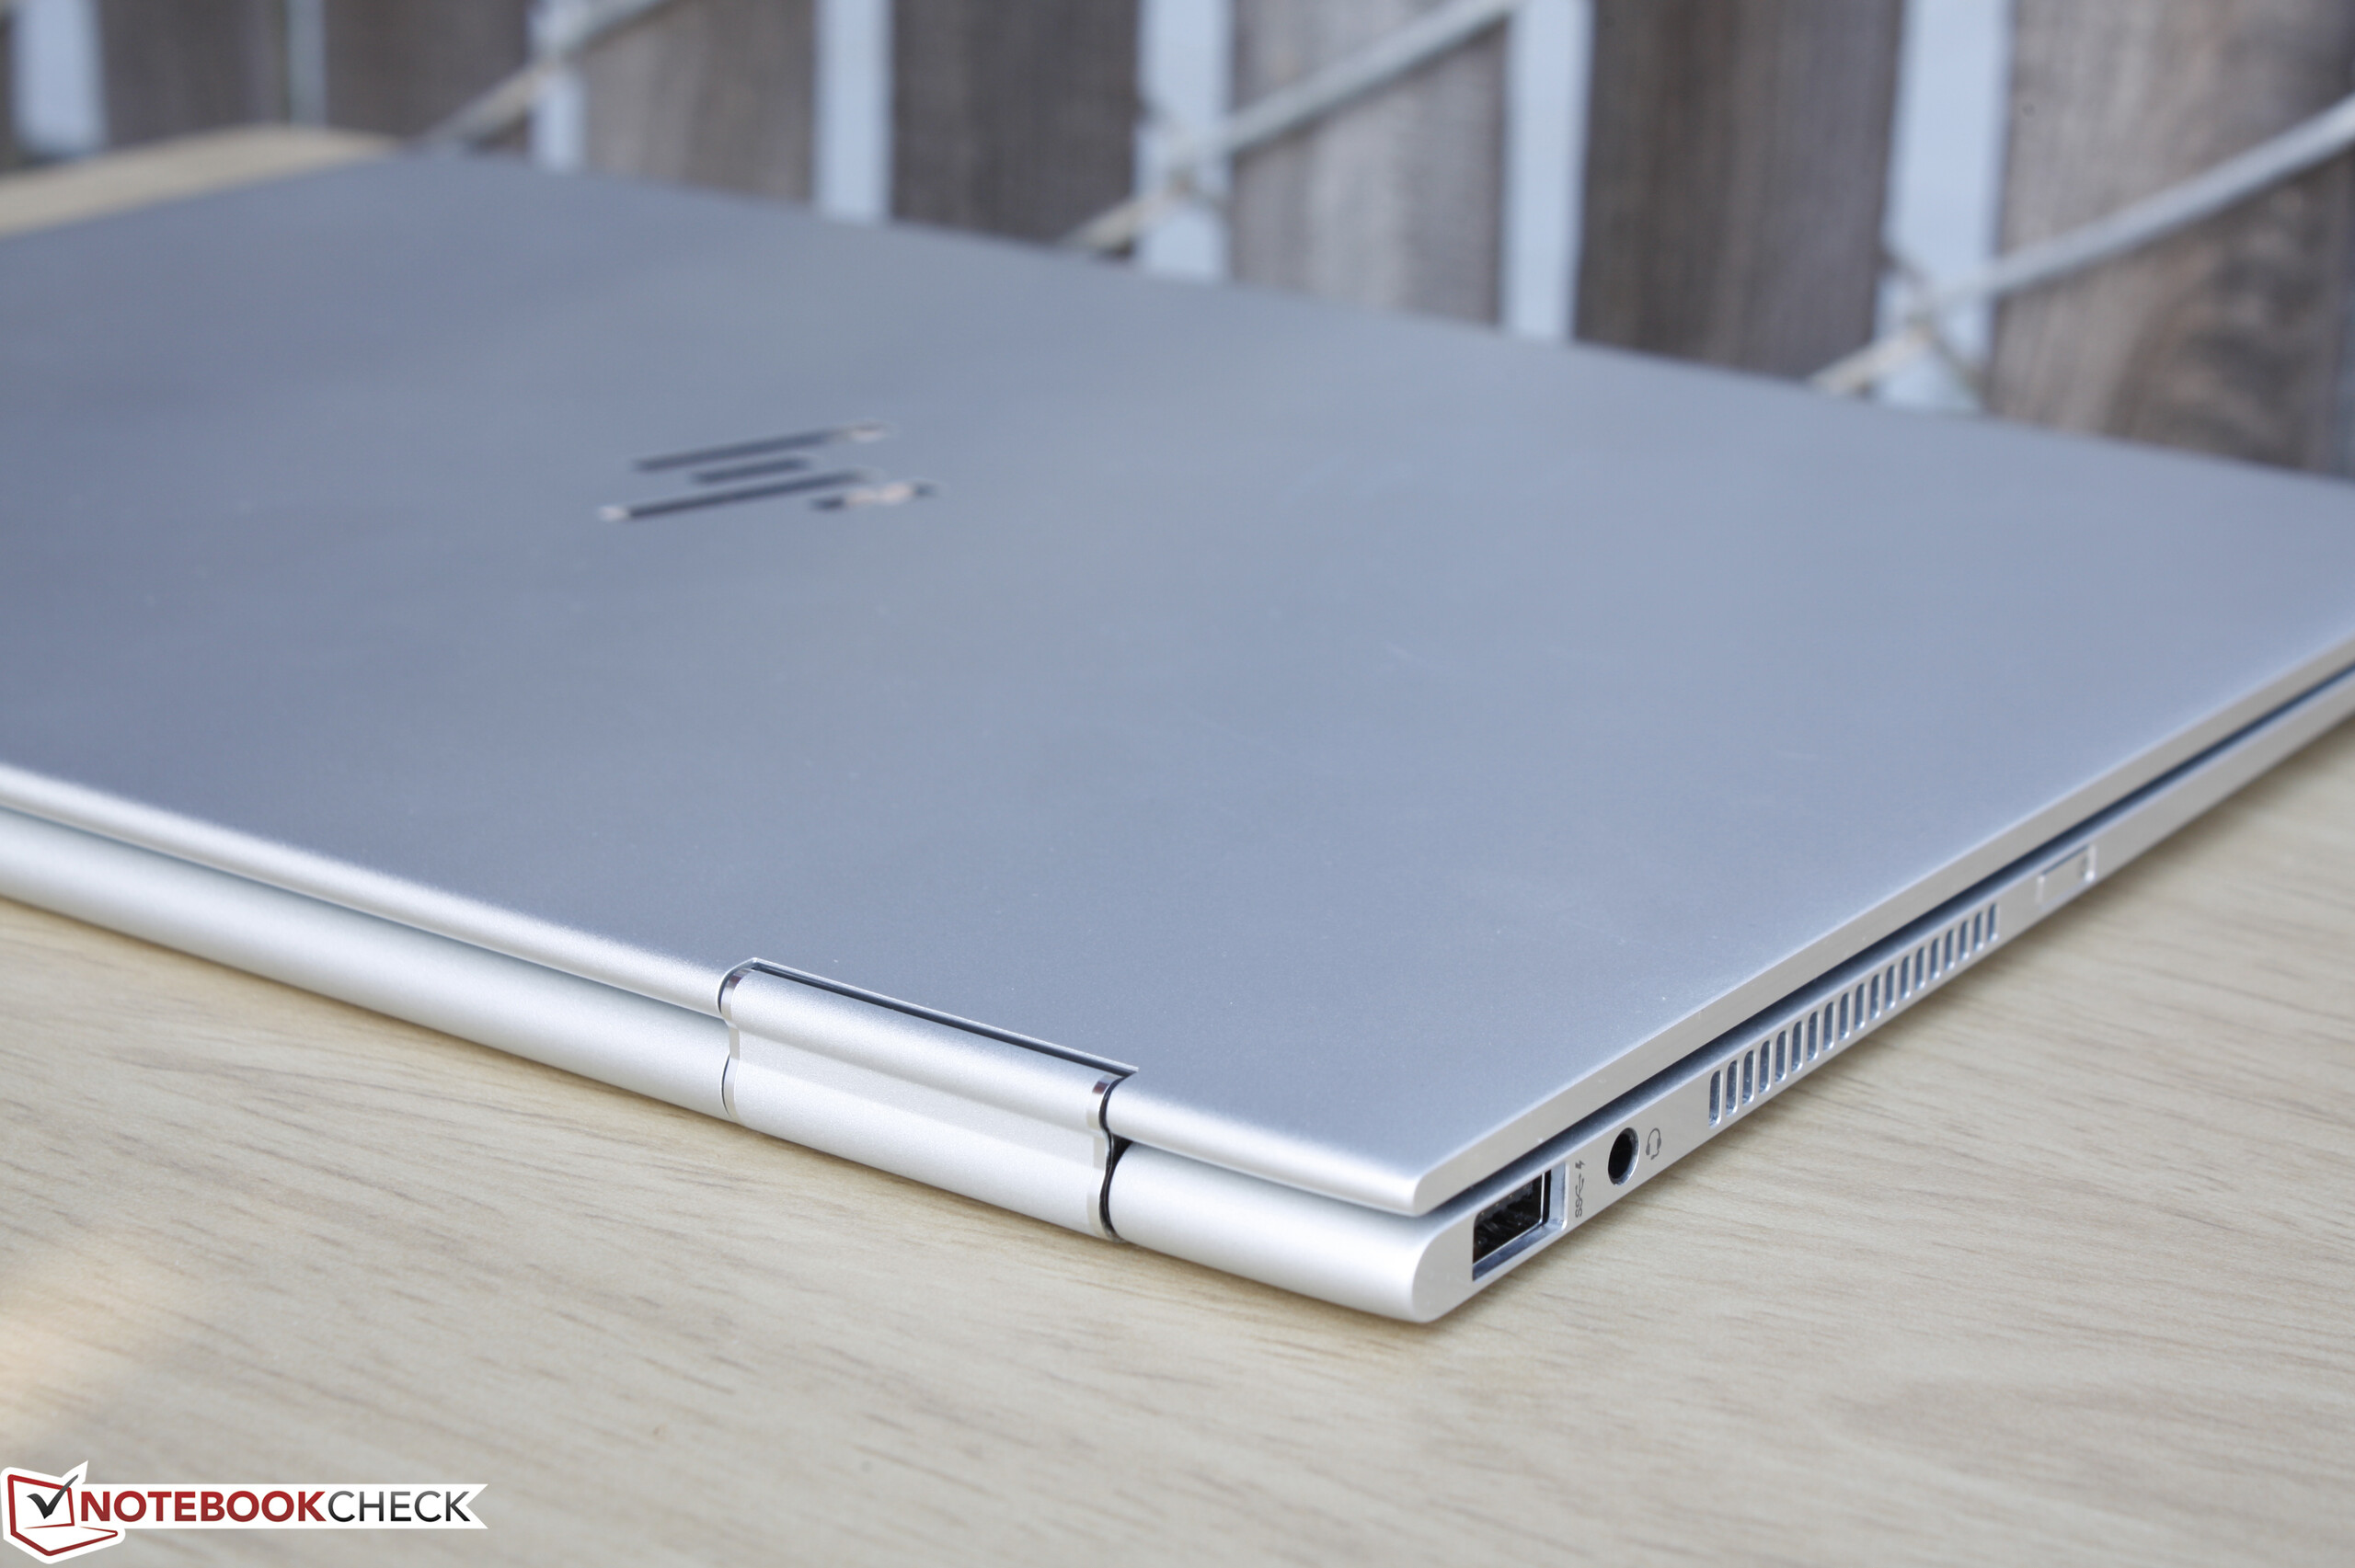
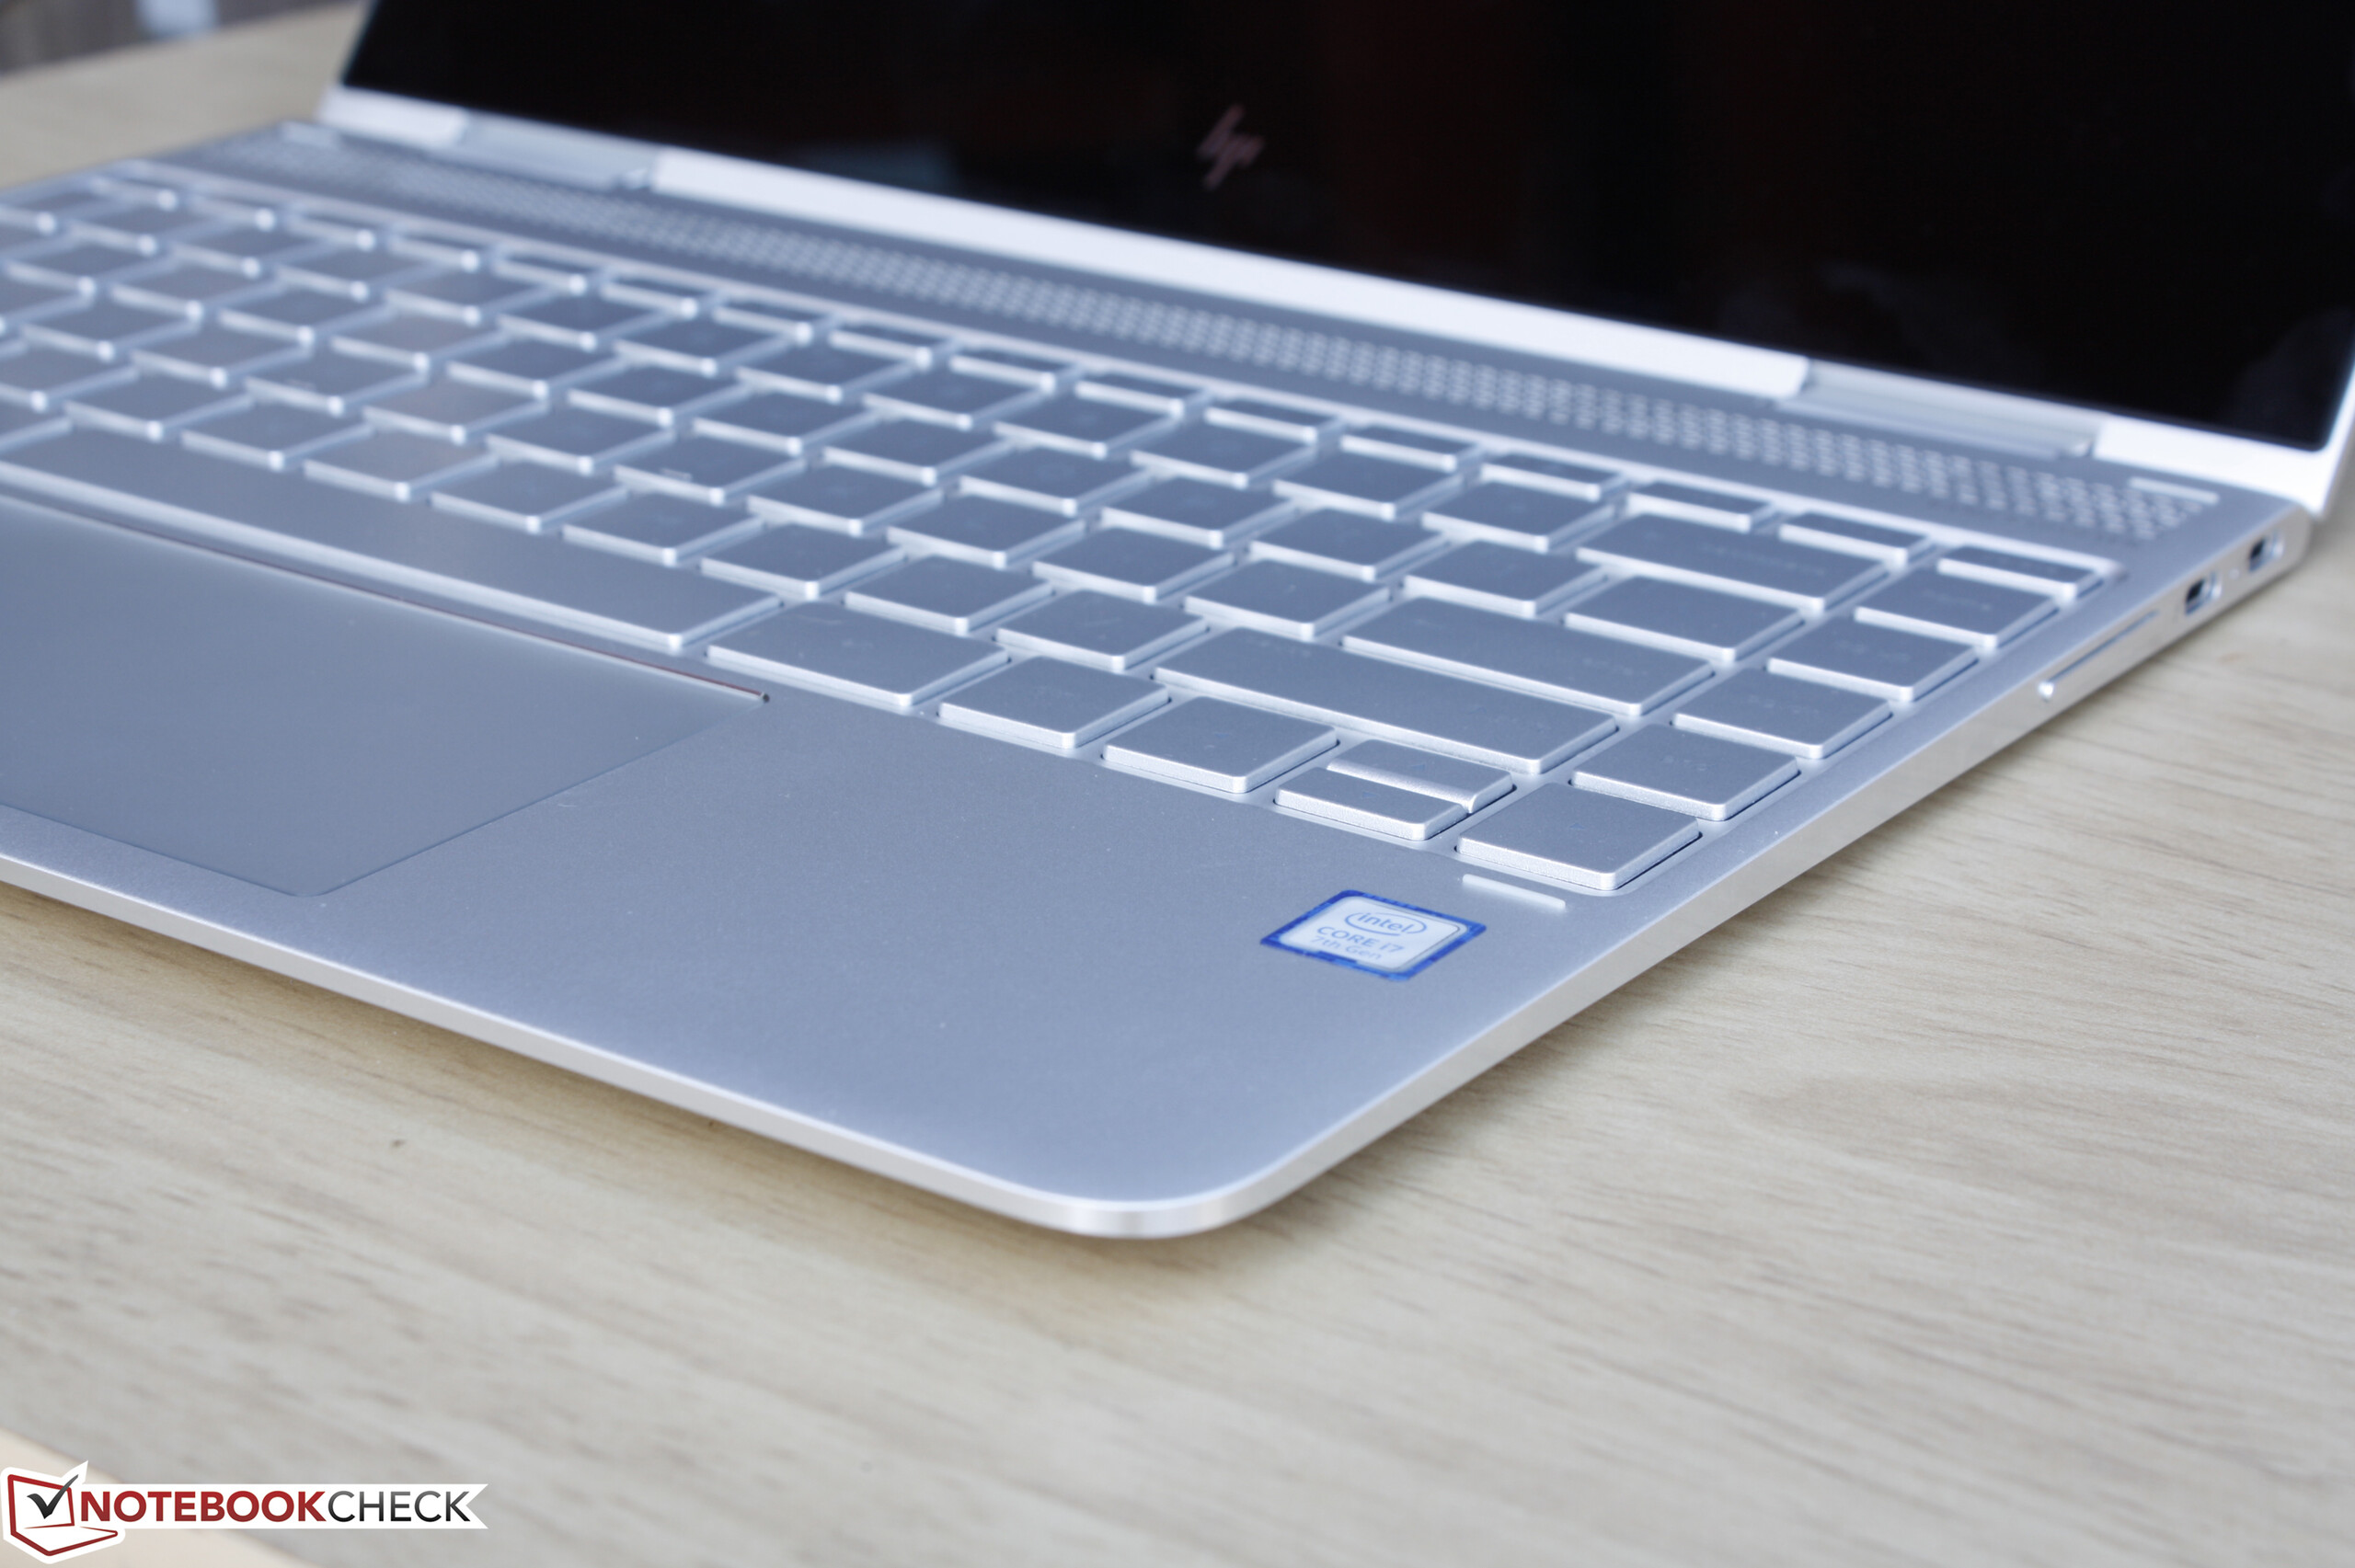
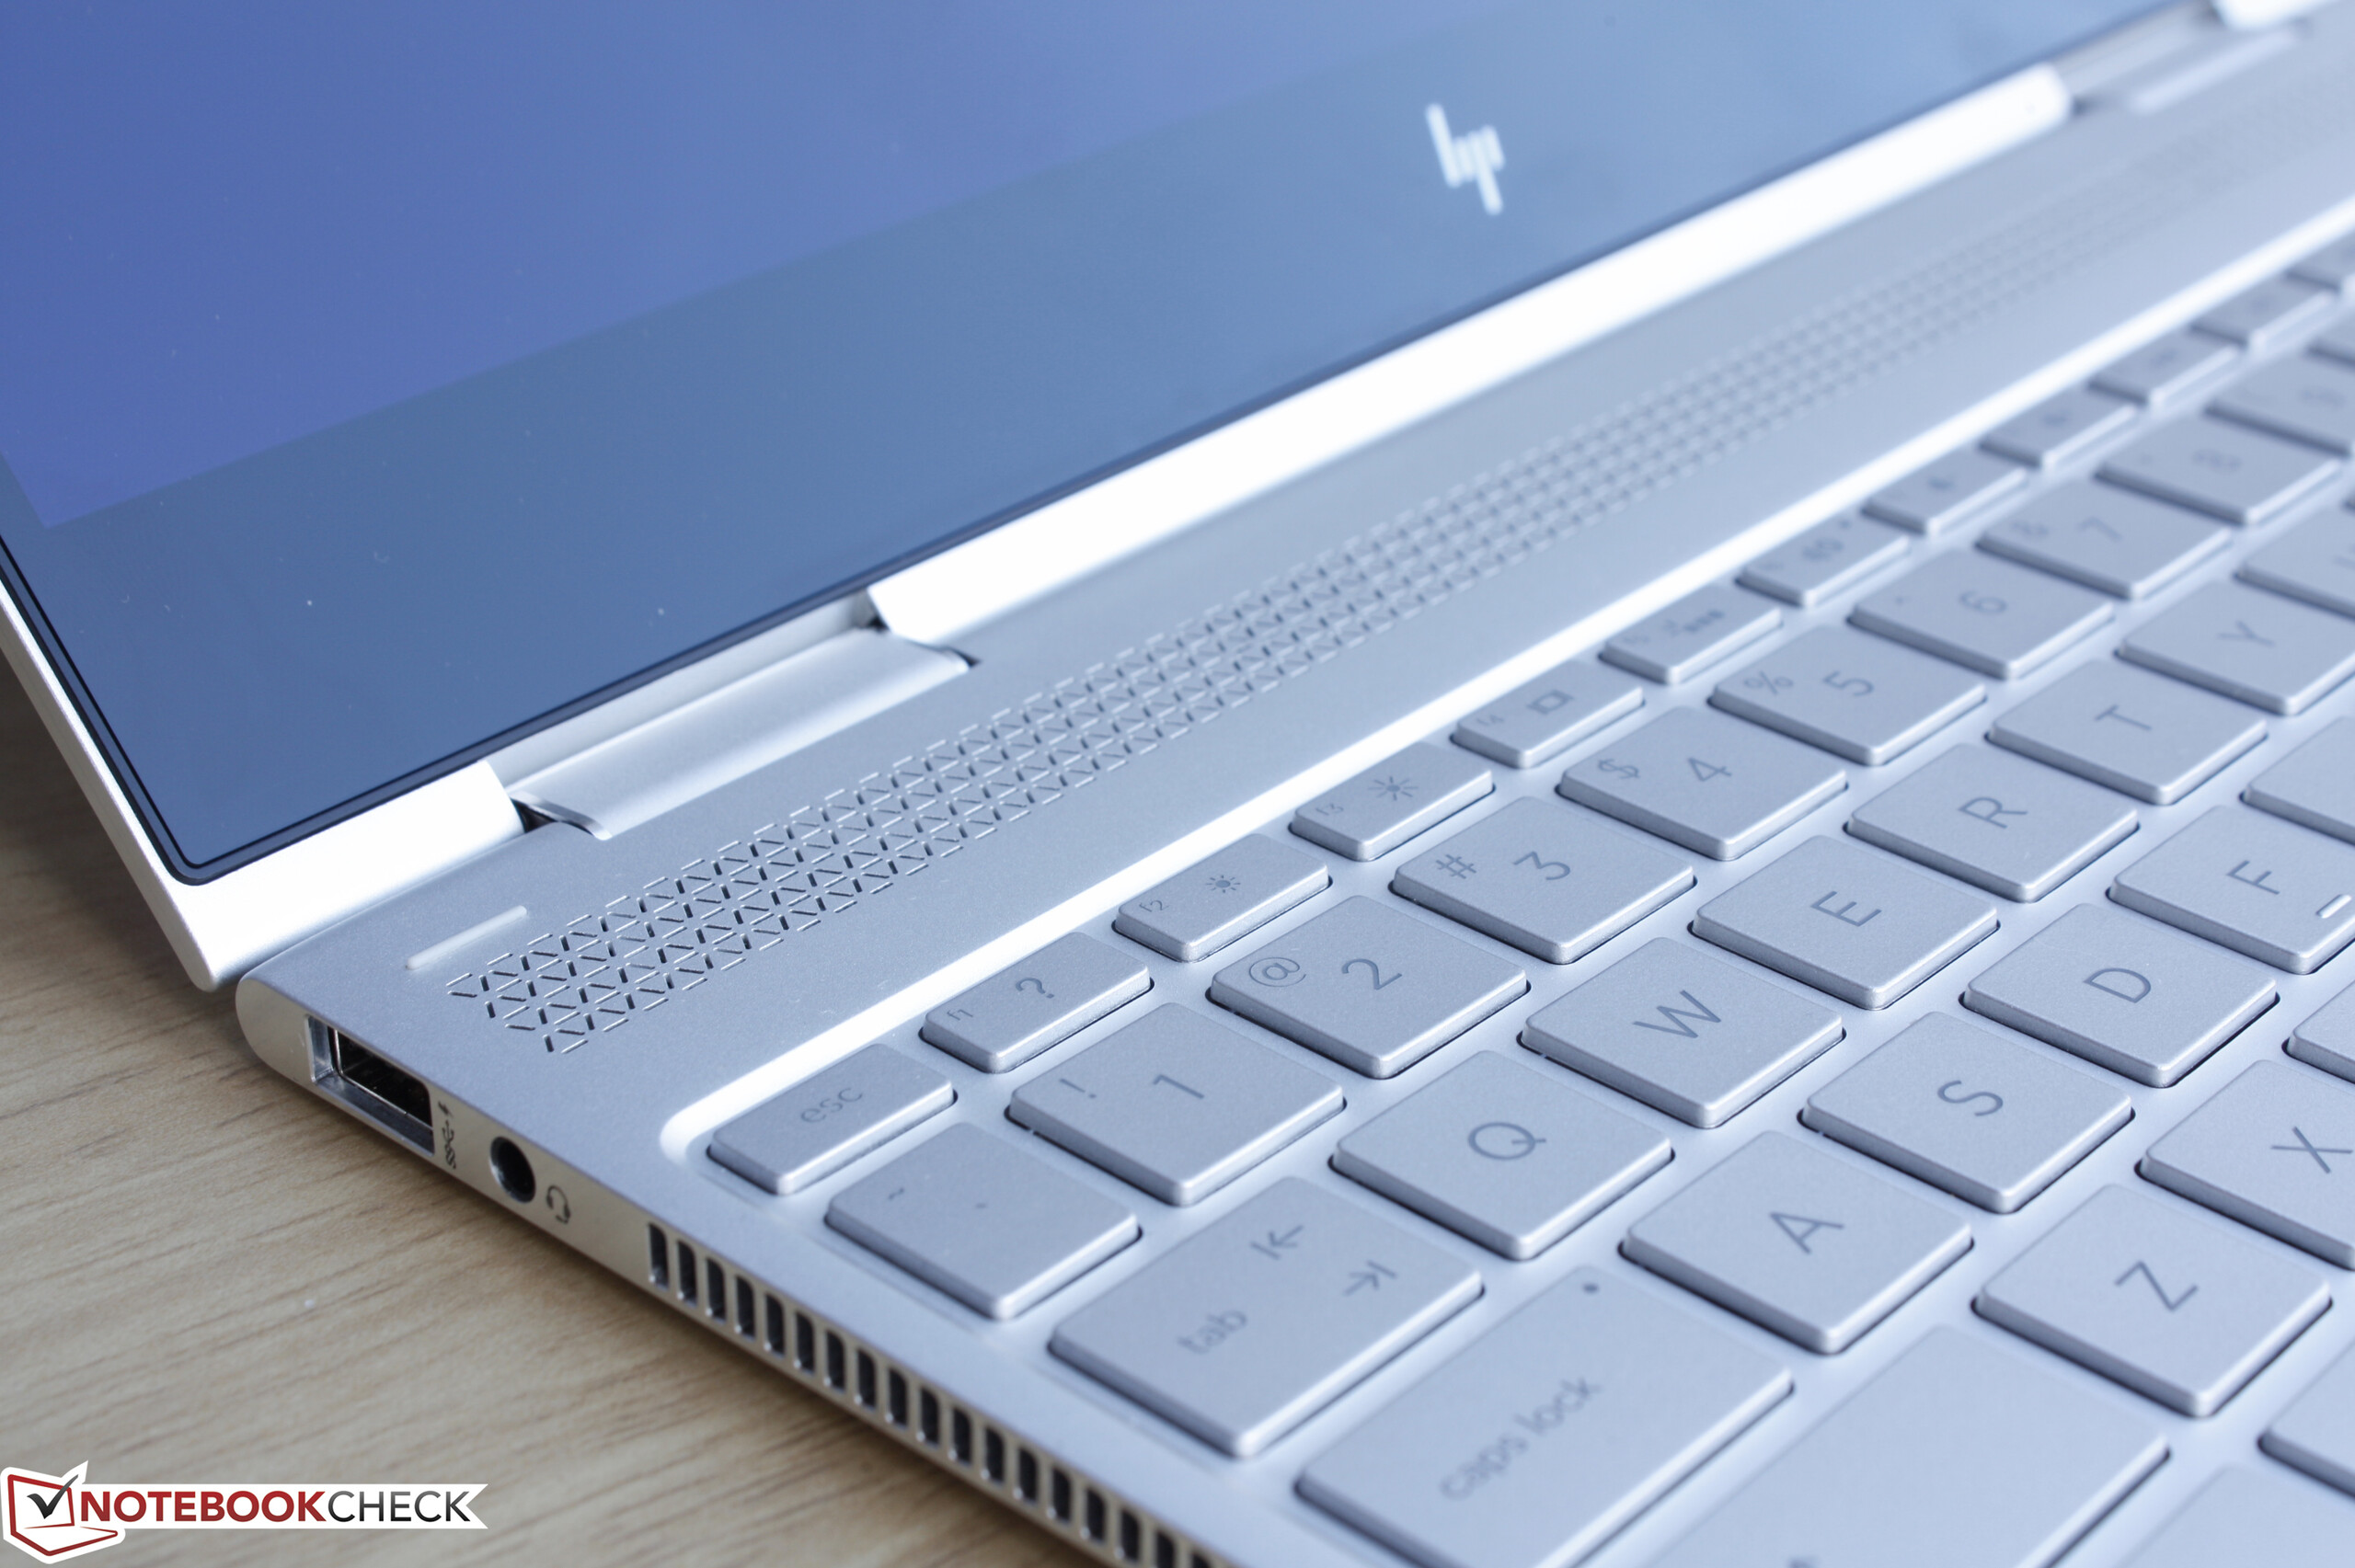
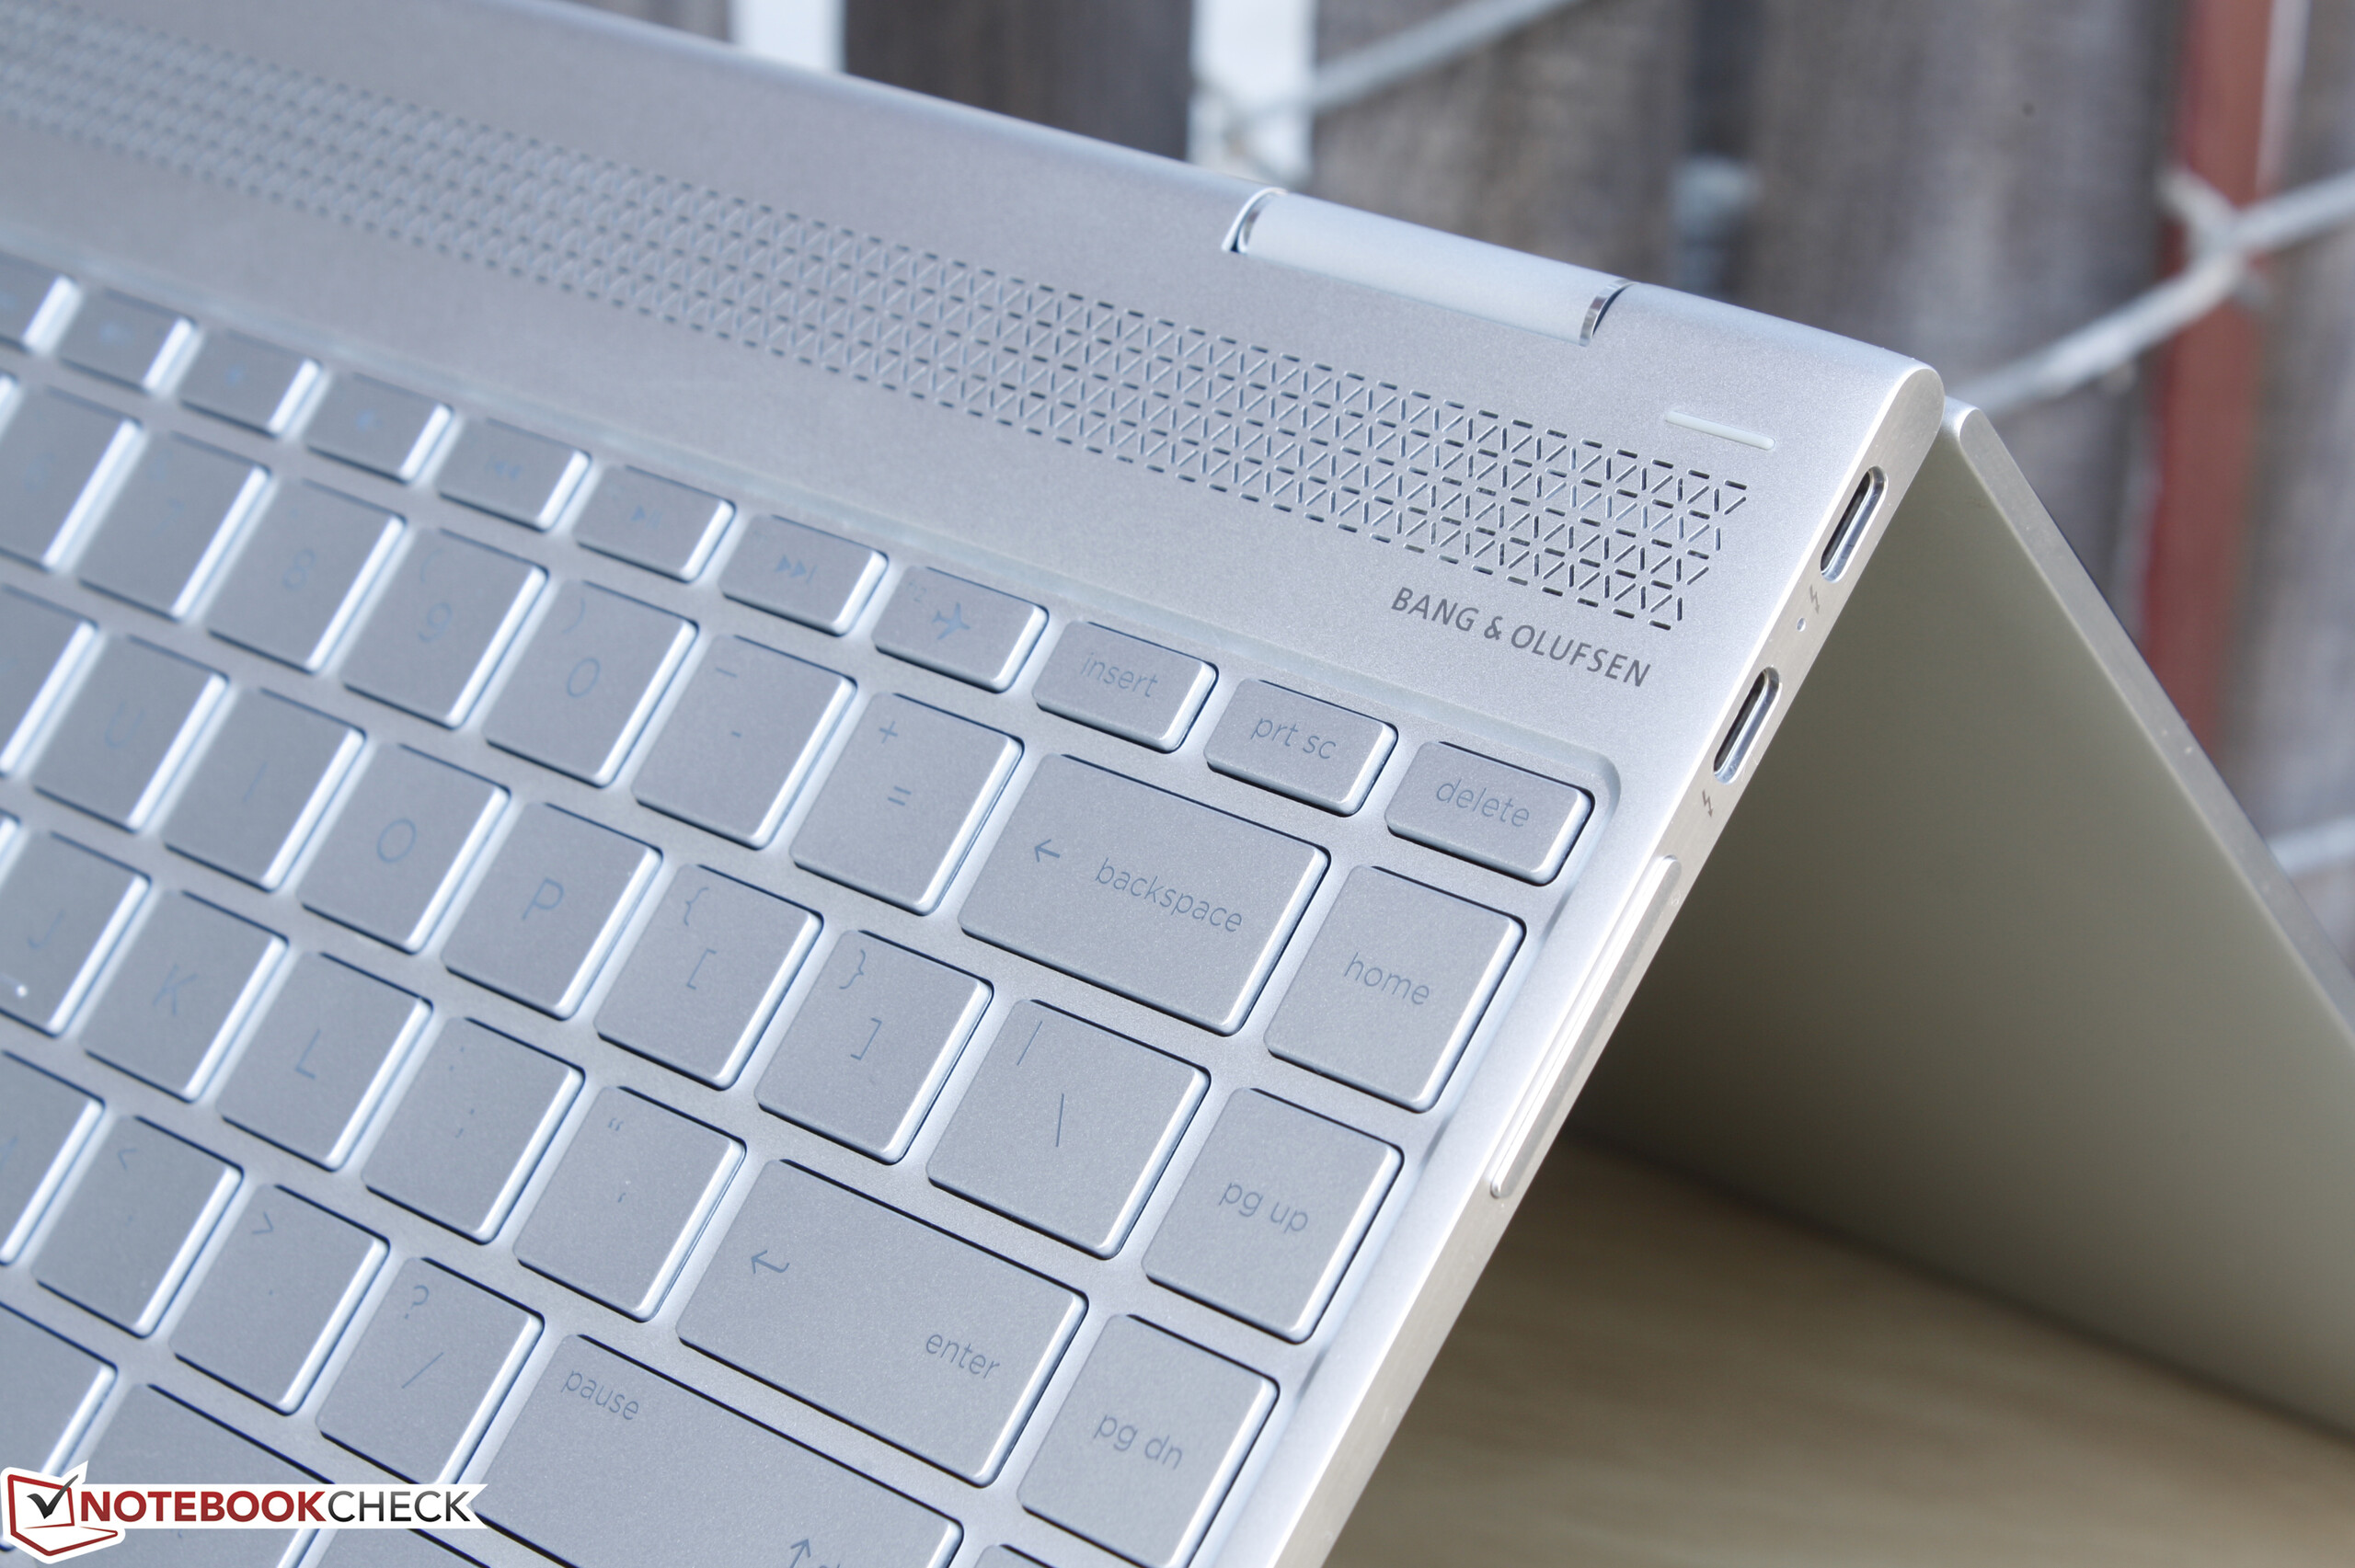
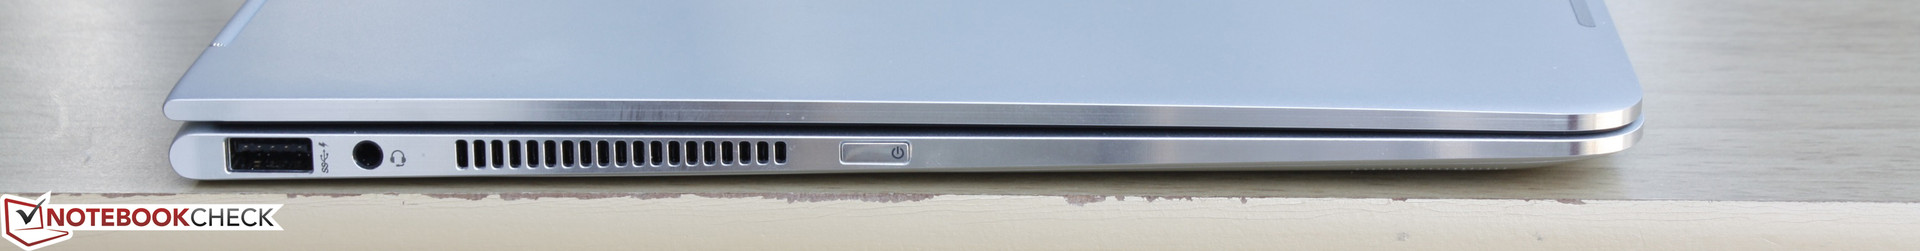
De extreme draagbaarheid en veelzijdigheid van de HP convertible gaat ten koste van functionaliteiten zoals een SD-kaartlezer. Er is zelfs geen MicroSD-kaartlezer of een ondersteuning voor HDMI/VGA middels een dongle, wat erg gewaardeerd was geweest. Het toetsenbord, hoewel voldoende, delft het onderspit qua feedback en aanslagdiepte in vergelijking met de XPS 13 of Lenovo ThinkPad Yoga-series. HP heeft een filosofie van eenvoud aangehouden met de nieuwe Spectre en we denken dat dit goed uitpakt, zeker gezien de convertible ook Ultrabook en MacBook Air gebruikers probeert te charmeren. We zijn razend benieuwd of de fabrikant de dunne beeldschermranden ook gaat toepassen in de bestaande Spectre x360 15-serie.
De Spectre x360 13 is krachtig genoeg om een multimedia notebook te zijn, terwijl het lichtgewicht en draagbaar genoeg is om dienst te doen als Windows tablet. Het nieuwe kleinere ontwerp laat dit convertible het beste van beide werelden bieden, meer nog dan de huidige concurrenten.
HP Spectre x360 13-w023dx
-
20-10-2016 v5.1(old)
Allen Ngo
Pricecompare
