 Deutsch
 English
 Español
 Français
 Italiano
 Nederlands
 Polski
 Português
 Русский
 Türkçe
 Svenska
 Chinese
 Magyar
Kort testrapport HP Pavilion 15 UHD T9Y85AV Notebook


| SD Card Reader | |
| average JPG Copy Test (av. of 3 runs) | |
| Dell XPS 13 2016 9350 (FHD, i7-6560U) | |
| HP Pavilion 15-bk001ng x360 | |
| Apple MacBook Pro Retina 13 inch 2013-10 | |
| HP Pavilion 15 UHD T9Y85AV | |
| maximum AS SSD Seq Read Test (1GB) | |
| Dell XPS 13 2016 9350 (FHD, i7-6560U) | |
| HP Pavilion 15 UHD T9Y85AV | |
| HP Pavilion 15-bk001ng x360 | |
| Networking | |
| iperf Server (receive) TCP 1 m | |
| Apple MacBook 12 (Early 2016) 1.1 GHz | |
| Asus ZenPad 8.0 Z380M-6B026A | |
| iperf Client (transmit) TCP 1 m | |
| Apple MacBook 12 (Early 2016) 1.1 GHz | |
| Asus ZenPad 8.0 Z380M-6B026A | |
| |||||||||||||||||||||||||
Helderheidsverdeling: 87 %
Helderheid in Batterij-modus: 336.2 cd/m²
Contrast: 534:1 (Zwart: 0.629 cd/m²)
ΔE Color 3.32 | 0.5-29.43 Ø5
ΔE Greyscale 2.88 | 0.57-98 Ø5.3
85.5% sRGB (Argyll 1.6.3 3D)
55.3% AdobeRGB 1998 (Argyll 1.6.3 3D)
61.8% AdobeRGB 1998 (Argyll 2.2.0 3D)
85.8% sRGB (Argyll 2.2.0 3D)
60% Display P3 (Argyll 2.2.0 3D)
Gamma: 2.34
| HP Pavilion 15 UHD T9Y85AV SDC5958, IPS, 15.60, 3840x2160 | HP Pavilion 15-ak003ng Samsung SDC5544, IPS, 15.60, 1920x1080 | MSI GL62-6QFi781H11 CMN N156HGE-EAL (CMN15D2), TN LED, 15.60, 1920x1080 | Asus ZenBook Pro UX501VW-DS71T IPS, 15.60, 3840x2160 | HP Omen 15-ax007ng LGD0519, IPS, 15.60, 1920x1080 | |
|---|---|---|---|---|---|
| Display | -27% | 32% | 6% | -16% | |
| Display P3 Coverage | 60 | 43.03 -28% | 85.8 43% | 64.3 7% | 59.9 0% 40.34 -33% |
| sRGB Coverage | 85.8 | 64.7 -25% | 99.8 16% | 89.9 5% | 85.9 0% 60.3 -30% |
| AdobeRGB 1998 Coverage | 61.8 | 44.47 -28% | 84.1 36% | 65.4 6% | 61.6 0% 41.73 -32% |
| Response Times | -12% | -5% | -5% | -27% | |
| Response Time Grey 50% / Grey 80% * | 39.6 ? | 48 ? -21% | 43 ? -9% | 43.2 ? -9% | 55 ? -39% |
| Response Time Black / White * | 27.2 ? | 28 ? -3% | 23 ? 15% | 27.2 ? -0% | 31 ? -14% |
| PWM Frequency | 1282 ? | 1000 ? -22% | |||
| Screen | 4% | -63% | -22% | -29% | |
| Brightness middle | 336.2 | 254 -24% | 216 -36% | 252.9 -25% | 214 -36% |
| Brightness | 323 | 241 -25% | 202 -37% | 250 -23% | 203 -37% |
| Brightness Distribution | 87 | 78 -10% | 83 -5% | 89 2% | 79 -9% |
| Black Level * | 0.629 | 0.27 57% | 0.48 24% | 0.5 21% | 0.28 55% |
| Contrast | 534 | 941 76% | 450 -16% | 506 -5% | 764 43% |
| Colorchecker dE 2000 * | 3.32 | 3.54 -7% | 9.98 -201% | 5.22 -57% | 6.04 -82% |
| Colorchecker dE 2000 max. * | 7.4 | 17.12 -131% | 8.33 -13% | 12 -62% | |
| Greyscale dE 2000 * | 2.88 | 2.29 20% | 10.91 -279% | 6.74 -134% | 5.91 -105% |
| Gamma | 2.34 94% | 2.5 88% | 2.31 95% | 2.45 90% | 2.44 90% |
| CCT | 6279 104% | 6698 97% | 13185 49% | 6026 108% | 7362 88% |
| Color Space (Percent of AdobeRGB 1998) | 55.3 | 41 -26% | 75 36% | 58.4 6% | 38 -31% |
| Color Space (Percent of sRGB) | 85.5 | 64 -25% | 100 17% | 89.7 5% | 60 -30% |
| Totaal Gemiddelde (Programma / Instellingen) | -12% /
-5% | -12% /
-34% | -7% /
-14% | -24% /
-25% |
* ... kleiner is beter
Responstijd Scherm
| ↔ Responstijd Zwart naar Wit | ||
|---|---|---|
| 27.2 ms ... stijging ↗ en daling ↘ gecombineerd | ↗ 7.6 ms stijging | 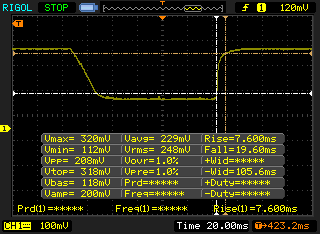 |
| ↘ 19.6 ms daling | ||
| Het scherm vertoonde relatief trage responstijden in onze tests en is misschien te traag voor games. Ter vergelijking: alle testtoestellen variëren van 0.1 (minimum) tot 240 (maximum) ms. » 65 % van alle toestellen zijn beter. Dit betekent dat de gemeten responstijd slechter is dan het gemiddelde (21.5 ms) van alle geteste toestellen. | ||
| ↔ Responstijd 50% Grijs naar 80% Grijs | ||
| 39.6 ms ... stijging ↗ en daling ↘ gecombineerd | ↗ 18.4 ms stijging | 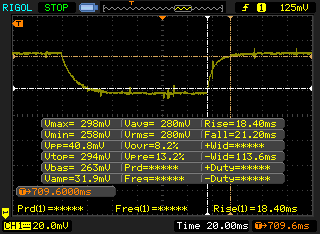 |
| ↘ 21.2 ms daling | ||
| Het scherm vertoonde trage responstijden in onze tests en is misschien te traag voor games. Ter vergelijking: alle testtoestellen variëren van 0.2 (minimum) tot 636 (maximum) ms. » 55 % van alle toestellen zijn beter. Dit betekent dat de gemeten responstijd slechter is dan het gemiddelde (33.7 ms) van alle geteste toestellen. | ||
Screen Flickering / PWM (Pulse-Width Modulation)
| Screen flickering / PWM waargenomen | 1282 Hz | ≤ 59 % helderheid instelling | 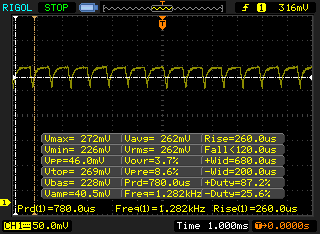 |
Het backlight van het scherm flikkert aan 1282 Hz (hoogstwaarschijnlijk met PWM - Pulse-Width Modulation) aan een helderheid van 59 % en lager. Boven deze helderheid zou er geen flickering / PWM mogen optreden. De frequentie van 1282 Hz is redelijk hoog en de meeste mensen die gevoelig zijn aan flickering zouden dit dus niet mogen waarnemen of geïrriteerde ogen krijgen. Ter vergelijking: 53 % van alle geteste toestellen maakten geen gebruik van PWM om de schermhelderheid te verlagen. Als het wel werd gebruikt, werd een gemiddelde van 17900 (minimum: 5 - maximum: 3846000) Hz waargenomen. | |||
| Cinebench R10 | |
| Rendering Multiple CPUs 32Bit (sorteer op waarde) | |
| HP Pavilion 15 UHD T9Y85AV | |
| DogHouse Systems Mobius SS | |
| Asus G701VO-CS74K | |
| MSI PX60 QD-034US | |
| Lenovo IdeaPad Y50 | |
| HP Spectre 13 | |
| Rendering Single 32Bit (sorteer op waarde) | |
| HP Pavilion 15 UHD T9Y85AV | |
| DogHouse Systems Mobius SS | |
| Asus G701VO-CS74K | |
| MSI PX60 QD-034US | |
| Lenovo IdeaPad Y50 | |
| HP Spectre 13 | |
| wPrime 2.10 - 1024m (sorteer op waarde) | |
| HP Pavilion 15 UHD T9Y85AV | |
| DogHouse Systems Mobius SS | |
| Asus G701VO-CS74K | |
| MSI PX60 QD-034US | |
| Lenovo IdeaPad Y50 | |
| HP Spectre 13 | |
| Super Pi Mod 1.5 XS 32M - 32M (sorteer op waarde) | |
| HP Pavilion 15 UHD T9Y85AV | |
| DogHouse Systems Mobius SS | |
| Asus G701VO-CS74K | |
| MSI PX60 QD-034US | |
| Lenovo IdeaPad Y50 | |
| HP Spectre 13 | |
* ... kleiner is beter
| PCMark 8 | |
| Home Score Accelerated v2 (sorteer op waarde) | |
| HP Pavilion 15 UHD T9Y85AV | |
| HP Omen 15-ax007ng | |
| MSI GL62-6QFi781H11 | |
| HP Pavilion 15-ak003ng | |
| Asus ZenBook Pro UX501VW-DS71T | |
| Work Score Accelerated v2 (sorteer op waarde) | |
| HP Pavilion 15 UHD T9Y85AV | |
| HP Omen 15-ax007ng | |
| MSI GL62-6QFi781H11 | |
| HP Pavilion 15-ak003ng | |
| Asus ZenBook Pro UX501VW-DS71T | |
| Creative Score Accelerated v2 (sorteer op waarde) | |
| HP Pavilion 15 UHD T9Y85AV | |
| HP Omen 15-ax007ng | |
| MSI GL62-6QFi781H11 | |
| HP Pavilion 15-ak003ng | |
| Asus ZenBook Pro UX501VW-DS71T | |
| PCMark 8 Home Score Accelerated v2 | 3101 punten | |
| PCMark 8 Creative Score Accelerated v2 | 4648 punten | |
| PCMark 8 Work Score Accelerated v2 | 3717 punten | |
Help | ||
| HP Pavilion 15 UHD T9Y85AV SanDisk Z400s SD8SNAT-128G | HP Pavilion 15-ak003ng Samsung CM871 MZNLF128HCHP | MSI GL62-6QFi781H11 Toshiba HG6 THNSNJ128G8NY | Asus ZenBook Pro UX501VW-DS71T Samsung SM951 MZVPV512HDGL m.2 PCI-e | HP Omen 15-ax007ng Adata IM2S3138E-128GM-B | |
|---|---|---|---|---|---|
| CrystalDiskMark 3.0 | -38% | 51% | 321% | 17% | |
| Read Seq | 484.6 | 465.8 -4% | 530 9% | 1633 237% | 475.7 -2% |
| Write Seq | 185.2 | 120.2 -35% | 442.7 139% | 1579 753% | 169.2 -9% |
| Read 512 | 307.6 | 314.1 2% | 409.1 33% | 1068 247% | 327.6 7% |
| Write 512 | 180 | 75.9 -58% | 417.3 132% | 1570 772% | 169.6 -6% |
| Read 4k | 22.08 | 18.49 -16% | 21.81 -1% | 50.4 128% | 33.14 50% |
| Write 4k | 77.7 | 21.18 -73% | 93 20% | 128.6 66% | 81.4 5% |
| Read 4k QD32 | 143.7 | 94.8 -34% | 257 79% | 534 272% | 276.8 93% |
| Write 4k QD32 | 177.6 | 21.66 -88% | 168.3 -5% | 344 94% | 168 -5% |

| 3DMark 11 | |
| 1280x720 Performance GPU (sorteer op waarde) | |
| HP Pavilion 15 UHD T9Y85AV | |
| Asus Strix GL502VY-DS71 | |
| Asus Strix GL502VT-DS74 | |
| HP Omen 15-ax007ng | |
| MSI GL62-6QFi781H11 | |
| HP Envy 17-n107ng | |
| Dell Inspiron 17 7778 | |
| 1280x720 Performance Combined (sorteer op waarde) | |
| HP Pavilion 15 UHD T9Y85AV | |
| Asus Strix GL502VY-DS71 | |
| Asus Strix GL502VT-DS74 | |
| HP Omen 15-ax007ng | |
| MSI GL62-6QFi781H11 | |
| HP Envy 17-n107ng | |
| Dell Inspiron 17 7778 | |
| 3DMark | |
| 1280x720 Cloud Gate Standard Graphics (sorteer op waarde) | |
| HP Pavilion 15 UHD T9Y85AV | |
| Asus Strix GL502VY-DS71 | |
| Asus Strix GL502VT-DS74 | |
| HP Omen 15-ax007ng | |
| MSI GL62-6QFi781H11 | |
| HP Envy 17-n107ng | |
| Dell Inspiron 17 7778 | |
| 1920x1080 Fire Strike Graphics (sorteer op waarde) | |
| HP Pavilion 15 UHD T9Y85AV | |
| Asus Strix GL502VY-DS71 | |
| Asus Strix GL502VT-DS74 | |
| HP Omen 15-ax007ng | |
| MSI GL62-6QFi781H11 | |
| HP Envy 17-n107ng | |
| Dell Inspiron 17 7778 | |
| Fire Strike Extreme Graphics (sorteer op waarde) | |
| HP Pavilion 15 UHD T9Y85AV | |
| Asus Strix GL502VY-DS71 | |
| Asus Strix GL502VT-DS74 | |
| 3840x2160 Fire Strike Ultra Graphics (sorteer op waarde) | |
| HP Pavilion 15 UHD T9Y85AV | |
| Asus Strix GL502VY-DS71 | |
| 3DMark 11 Performance | 5775 punten | |
| 3DMark Ice Storm Standard Score | 37758 punten | |
| 3DMark Cloud Gate Standard Score | 16612 punten | |
| 3DMark Fire Strike Score | 3954 punten | |
| 3DMark Fire Strike Extreme Score | 1990 punten | |
Help | ||
| lage | gem. | hoge | ultra | 4K | |
| Sleeping Dogs (2012) | 91.2 | 24.1 | |||
| BioShock Infinite (2013) | 110 | 45.8 | |||
| Metro: Last Light (2013) | 58.4 | 31.4 | |||
| Thief (2014) | 55 | 28.2 | |||
| Batman: Arkham Knight (2015) | 34 | 22 | |||
| Metal Gear Solid V (2015) | 45.9 | 32.1 | 14.5 | ||
| Fallout 4 (2015) | 29.9 | 24.1 | |||
| Rise of the Tomb Raider (2016) | 29.6 | 23.5 | |||
| Overwatch (2016) | 66.8 | 40.2 | 19.8 |
| Rise of the Tomb Raider - 1920x1080 Very High Preset AA:FX AF:16x | |
| Asus Strix GL502VY-DS71 | |
| Asus Strix GL502VT-DS74 | |
| HP Omen 15-ax007ng | |
| HP Pavilion 15 UHD T9Y85AV | |
| Dell XPS 15 9550 i7 FHD | |
| Medion Erazer P6661 MD 99873 | |
| BioShock Infinite - 1920x1080 Ultra Preset, DX11 (DDOF) | |
| Asus Strix GL502VY-DS71 | |
| Asus Strix GL502VT-DS74 | |
| HP Pavilion 15 UHD T9Y85AV | |
| Dell XPS 15 9550 i7 FHD | |
| Medion Erazer P6661 MD 99873 | |
| Sleeping Dogs - 1920x1080 Extreme Preset AA:Extreme | |
| Asus Strix GL502VY-DS71 | |
| Asus Strix GL502VT-DS74 | |
| HP Pavilion 15 UHD T9Y85AV | |
| Dell XPS 15 9550 i7 FHD | |
| Metro: Last Light - 1920x1080 Very High (DX11) AF:16x | |
| Asus Strix GL502VT-DS74 | |
| HP Pavilion 15 UHD T9Y85AV | |
| Dell XPS 15 9550 i7 FHD | |
| Medion Erazer P6661 MD 99873 | |
| Thief - 1920x1080 Very High Preset AA:FXAA & High SS AF:8x | |
| Asus Strix GL502VY-DS71 | |
| Asus Strix GL502VT-DS74 | |
| HP Pavilion 15 UHD T9Y85AV | |
| Dell XPS 15 9550 i7 FHD | |
| Medion Erazer P6661 MD 99873 | |
| Batman: Arkham Knight - 1920x1080 High / On AA:SM AF:16x | |
| Asus Strix GL502VT-DS74 | |
| Medion Erazer P6661 MD 99873 | |
| HP Pavilion 15 UHD T9Y85AV | |
| Dell XPS 15 9550 i7 FHD | |
| Metal Gear Solid V - 1920x1080 Extra High / On | |
| Asus Strix GL502VT-DS74 | |
| Asus Strix GL502VY-DS71 | |
| Dell XPS 15 9550 i7 FHD | |
| HP Pavilion 15 UHD T9Y85AV | |
| Fallout 4 - 1920x1080 Ultra Preset AA:T AF:16x | |
| Asus Strix GL502VY-DS71 | |
| Asus Strix GL502VT-DS74 | |
| Dell XPS 15 9550 i7 FHD | |
| HP Pavilion 15 UHD T9Y85AV | |
| Overwatch - 1920x1080 Epic (Render Scale 100 %) AA:SM AF:16x | |
| Asus Strix GL502VY-DS71 | |
| HP Omen 15-ax007ng | |
| HP Pavilion 15 UHD T9Y85AV | |
Geluidsniveau
| Onbelast |
| 32.3 / 32.4 / 32.4 dB (A) |
| Belasting |
| 40.5 / 50.3 dB (A) |
 | ||
30 dB stil 40 dB(A) hoorbaar 50 dB(A) luid |
||
min: | ||
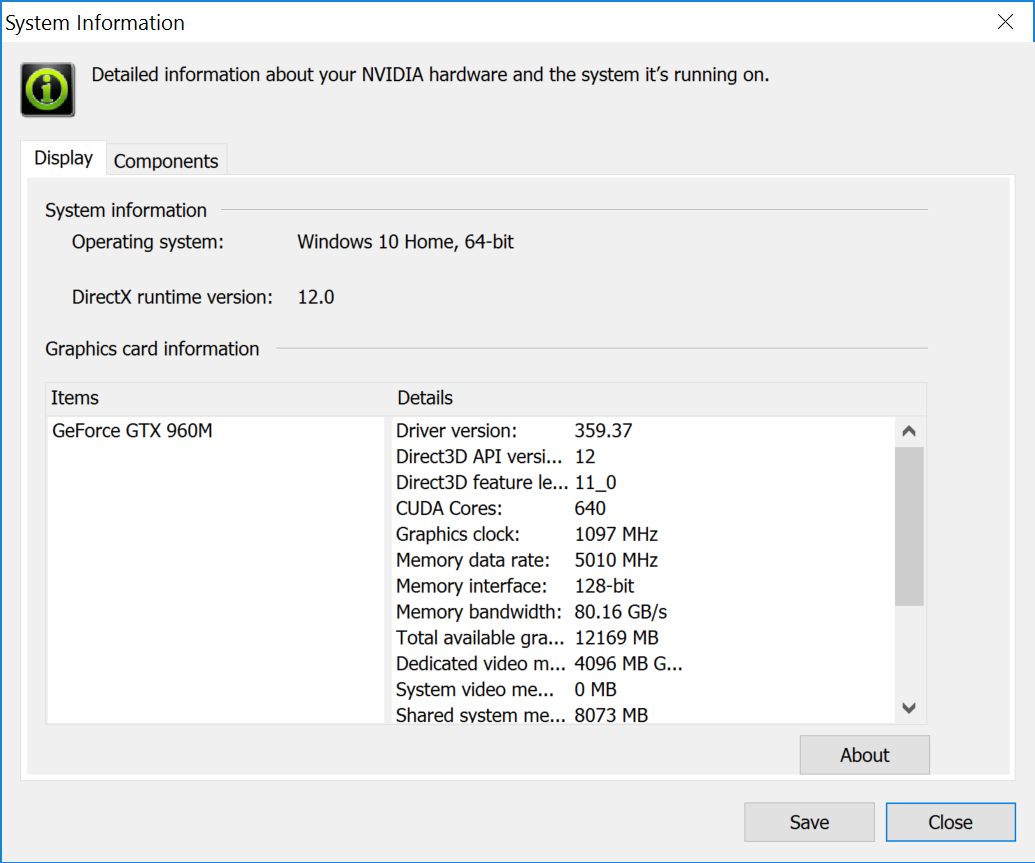
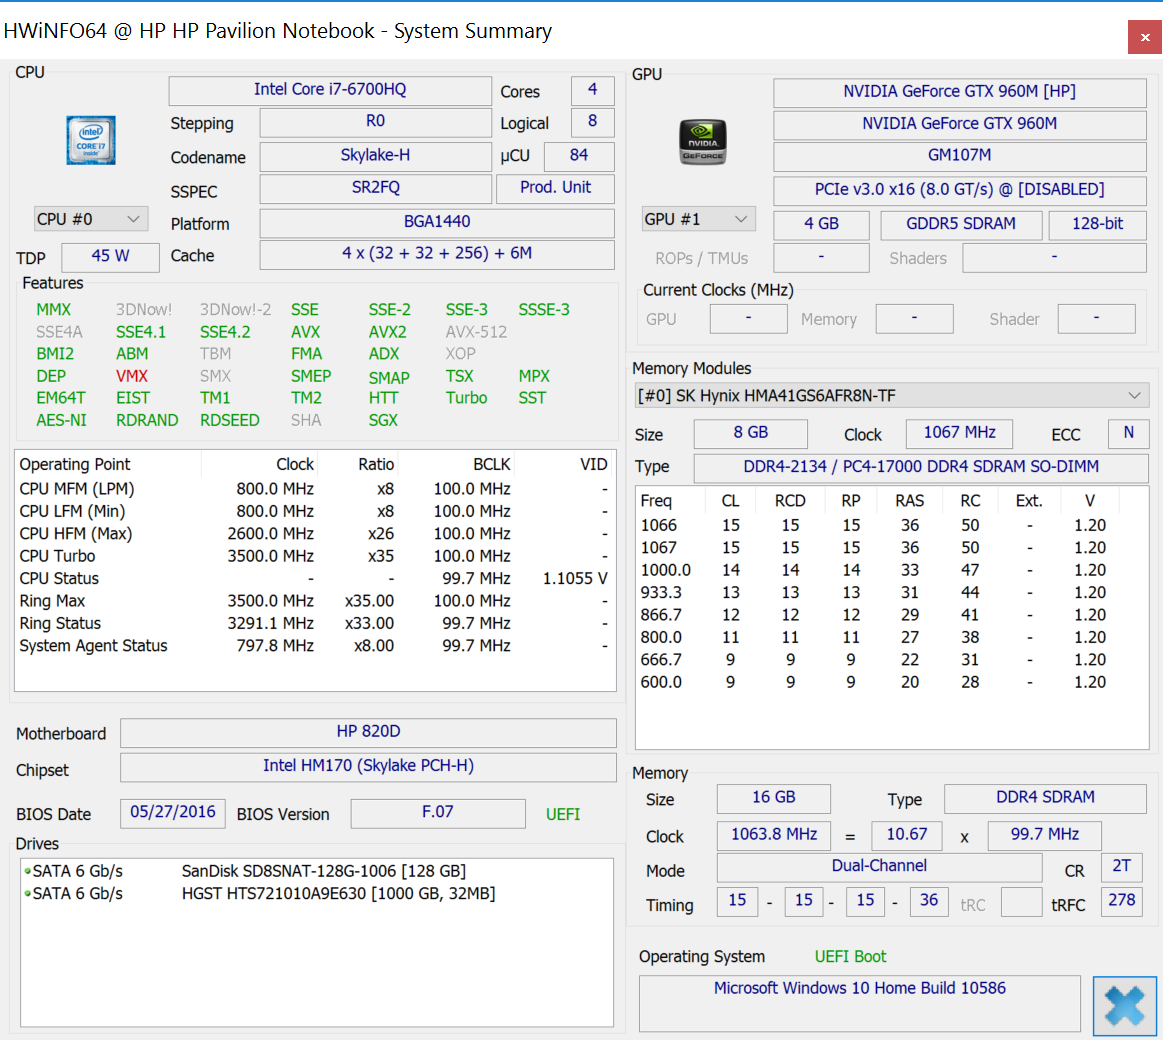
| HP Pavilion 15 UHD T9Y85AV GeForce GTX 960M, 6700HQ, SanDisk Z400s SD8SNAT-128G | HP Pavilion 15-ak003ng GeForce GTX 950M, 6700HQ, Samsung CM871 MZNLF128HCHP | MSI GL62-6QFi781H11 GeForce GTX 960M, 6700HQ, Toshiba HG6 THNSNJ128G8NY | Asus ZenBook Pro UX501VW-DS71T GeForce GTX 960M, 6700HQ, Samsung SM951 MZVPV512HDGL m.2 PCI-e | HP Omen 15-ax007ng GeForce GTX 965M, 6700HQ, Adata IM2S3138E-128GM-B | |
|---|---|---|---|---|---|
| Noise | -7% | -5% | 8% | -3% | |
| uit / omgeving * | 29.5 | 30 -2% | 30 -2% | ||
| Idle Minimum * | 32.3 | 34 -5% | 35 -8% | 28.9 11% | 32 1% |
| Idle Average * | 32.4 | 35 -8% | 36 -11% | 28.9 11% | 33 -2% |
| Idle Maximum * | 32.4 | 36 -11% | 37 -14% | 30.2 7% | 36 -11% |
| Load Average * | 40.5 | 44 -9% | 41 -1% | 41.8 -3% | 43 -6% |
| Load Maximum * | 50.3 | 51 -1% | 46 9% | 43.9 13% | 49 3% |
* ... kleiner is beter
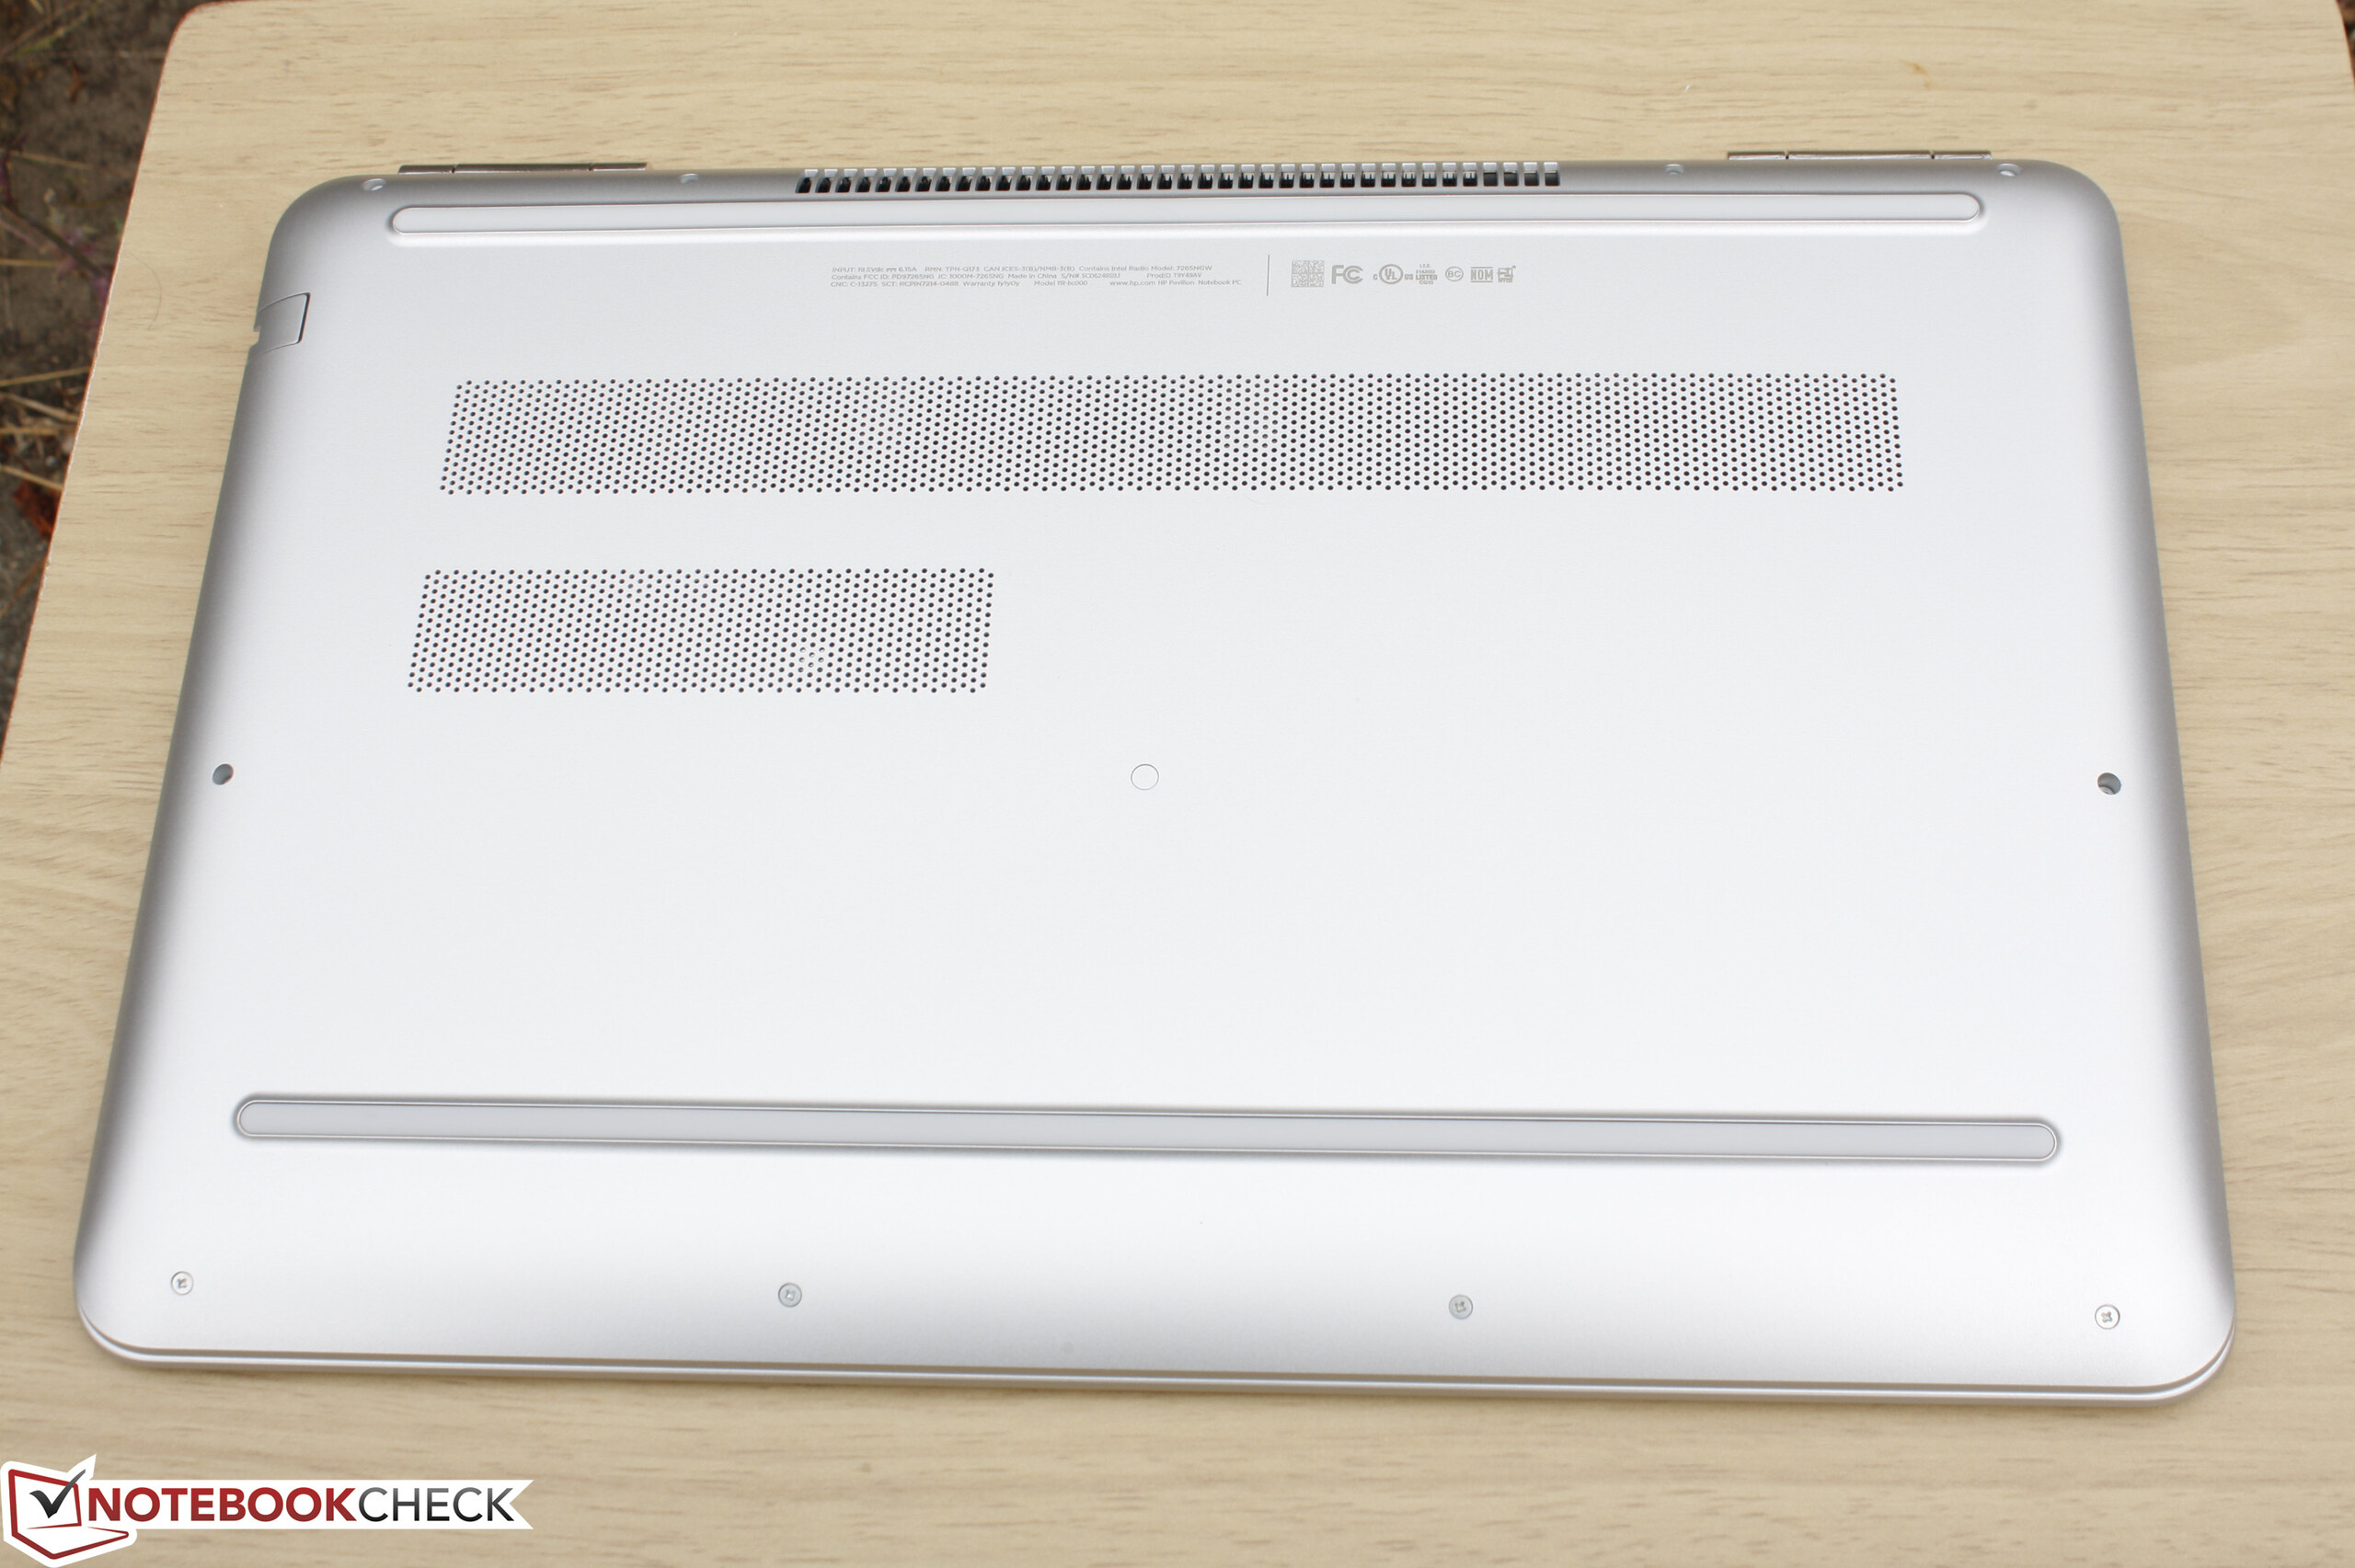
(±) De maximumtemperatuur aan de bovenzijde bedraagt 41 °C / 106 F, vergeleken met het gemiddelde van 40.4 °C / 105 F, variërend van 21.2 tot 68.8 °C voor de klasse Gaming.
(±) De bodem warmt op tot een maximum van 42.6 °C / 109 F, vergeleken met een gemiddelde van 43.2 °C / 110 F
(+) Bij onbelast gebruik bedraagt de gemiddelde temperatuur voor de bovenzijde 23.7 °C / 75 F, vergeleken met het apparaatgemiddelde van 33.8 °C / 93 F.
(±) De palmsteunen en het touchpad kunnen zeer heet aanvoelen met een maximum van ###max## °C / 99 F.
(-) De gemiddelde temperatuur van de handpalmsteun van soortgelijke toestellen bedroeg 28.9 °C / 84 F (-8.3 °C / -15 F).
HP Pavilion 15 UHD T9Y85AV audioanalyse
(-) | niet erg luide luidsprekers (64 dB)
Analysis not possible as minimum curve is missing or too high
Apple MacBook 12 (Early 2016) 1.1 GHz audioanalyse
(+) | luidsprekers kunnen relatief luid spelen (83.6 dB)
Bas 100 - 315 Hz
(±) | verminderde zeebaars - gemiddeld 11.3% lager dan de mediaan
(±) | lineariteit van de lage tonen is gemiddeld (14.2% delta ten opzichte van de vorige frequentie)
Mids 400 - 2000 Hz
(+) | evenwichtige middens - slechts 2.4% verwijderd van de mediaan
(+) | de middentonen zijn lineair (5.5% delta ten opzichte van de vorige frequentie)
Hoog 2 - 16 kHz
(+) | evenwichtige hoogtepunten - slechts 2% verwijderd van de mediaan
(+) | de hoge tonen zijn lineair (4.5% delta naar de vorige frequentie)
Algemeen 100 - 16.000 Hz
(+) | het totale geluid is lineair (10.2% verschil met de mediaan)
Vergeleken met dezelfde klasse
» 5% van alle geteste apparaten in deze klasse waren beter, 2% vergelijkbaar, 93% slechter
» De beste had een delta van 5%, het gemiddelde was 19%, de slechtste was 53%
Vergeleken met alle geteste toestellen
» 3% van alle geteste apparaten waren beter, 1% gelijk, 96% slechter
» De beste had een delta van 4%, het gemiddelde was 25%, de slechtste was 134%
SCHENKER F516 Flex audioanalyse
(-) | niet erg luide luidsprekers (69 dB)
Analysis not possible as minimum curve is missing or too high
| Uit / Standby | |
| Inactief | |
| Belasting |
|
| HP Pavilion 15 UHD T9Y85AV 6700HQ, GeForce GTX 960M, SanDisk Z400s SD8SNAT-128G, IPS, 3840x2160, 15.60 | HP Pavilion 15-ak003ng 6700HQ, GeForce GTX 950M, Samsung CM871 MZNLF128HCHP, IPS, 1920x1080, 15.60 | MSI GL62-6QFi781H11 6700HQ, GeForce GTX 960M, Toshiba HG6 THNSNJ128G8NY, TN LED, 1920x1080, 15.60 | Asus Zenbook Pro UX501JW-FI218H 4720HQ, GeForce GTX 960M, SanDisk SD7SN3Q128G1002, IPS, 3840x2160, 15.60 | HP Omen 15-ax007ng 6700HQ, GeForce GTX 965M, Adata IM2S3138E-128GM-B, IPS, 1920x1080, 15.60 | |
|---|---|---|---|---|---|
| Power Consumption | 14% | -8% | -24% | 4% | |
| Idle Minimum * | 8.3 | 7 16% | 10 -20% | 15.6 -88% | 7 16% |
| Idle Average * | 14.8 | 11 26% | 14 5% | 20.5 -39% | 11 26% |
| Idle Maximum * | 16.8 | 17 -1% | 19 -13% | 21.2 -26% | 19 -13% |
| Load Average * | 71 | 69 3% | 82 -15% | 75.8 -7% | 79 -11% |
| Load Maximum * | 119.2 | 89 25% | 118 1% | 72.9 39% | 119 -0% |
* ... kleiner is beter
| HP Pavilion 15 UHD T9Y85AV 6700HQ, GeForce GTX 960M, 61.5 Wh | HP Pavilion 15-ak003ng 6700HQ, GeForce GTX 950M, 48 Wh | MSI GL62-6QFi781H11 6700HQ, GeForce GTX 960M, 41.4 Wh | Asus ZenBook Pro UX501VW-DS71T 6700HQ, GeForce GTX 960M, 96 Wh | HP Omen 15-ax007ng 6700HQ, GeForce GTX 965M, 61.5 Wh | |
|---|---|---|---|---|---|
| Batterijduur | -2% | -33% | 35% | -2% | |
| Reader / Idle | 510 | 572 12% | 339 -34% | 689 35% | 467 -8% |
| WiFi v1.3 | 264 | 304 15% | 158 -40% | 379 44% | 272 3% |
| Load | 93 | 62 -33% | 71 -24% | 117 26% | 93 0% |
Pro
Contra

Voor het volledige, Engelse testrapport, klik hier
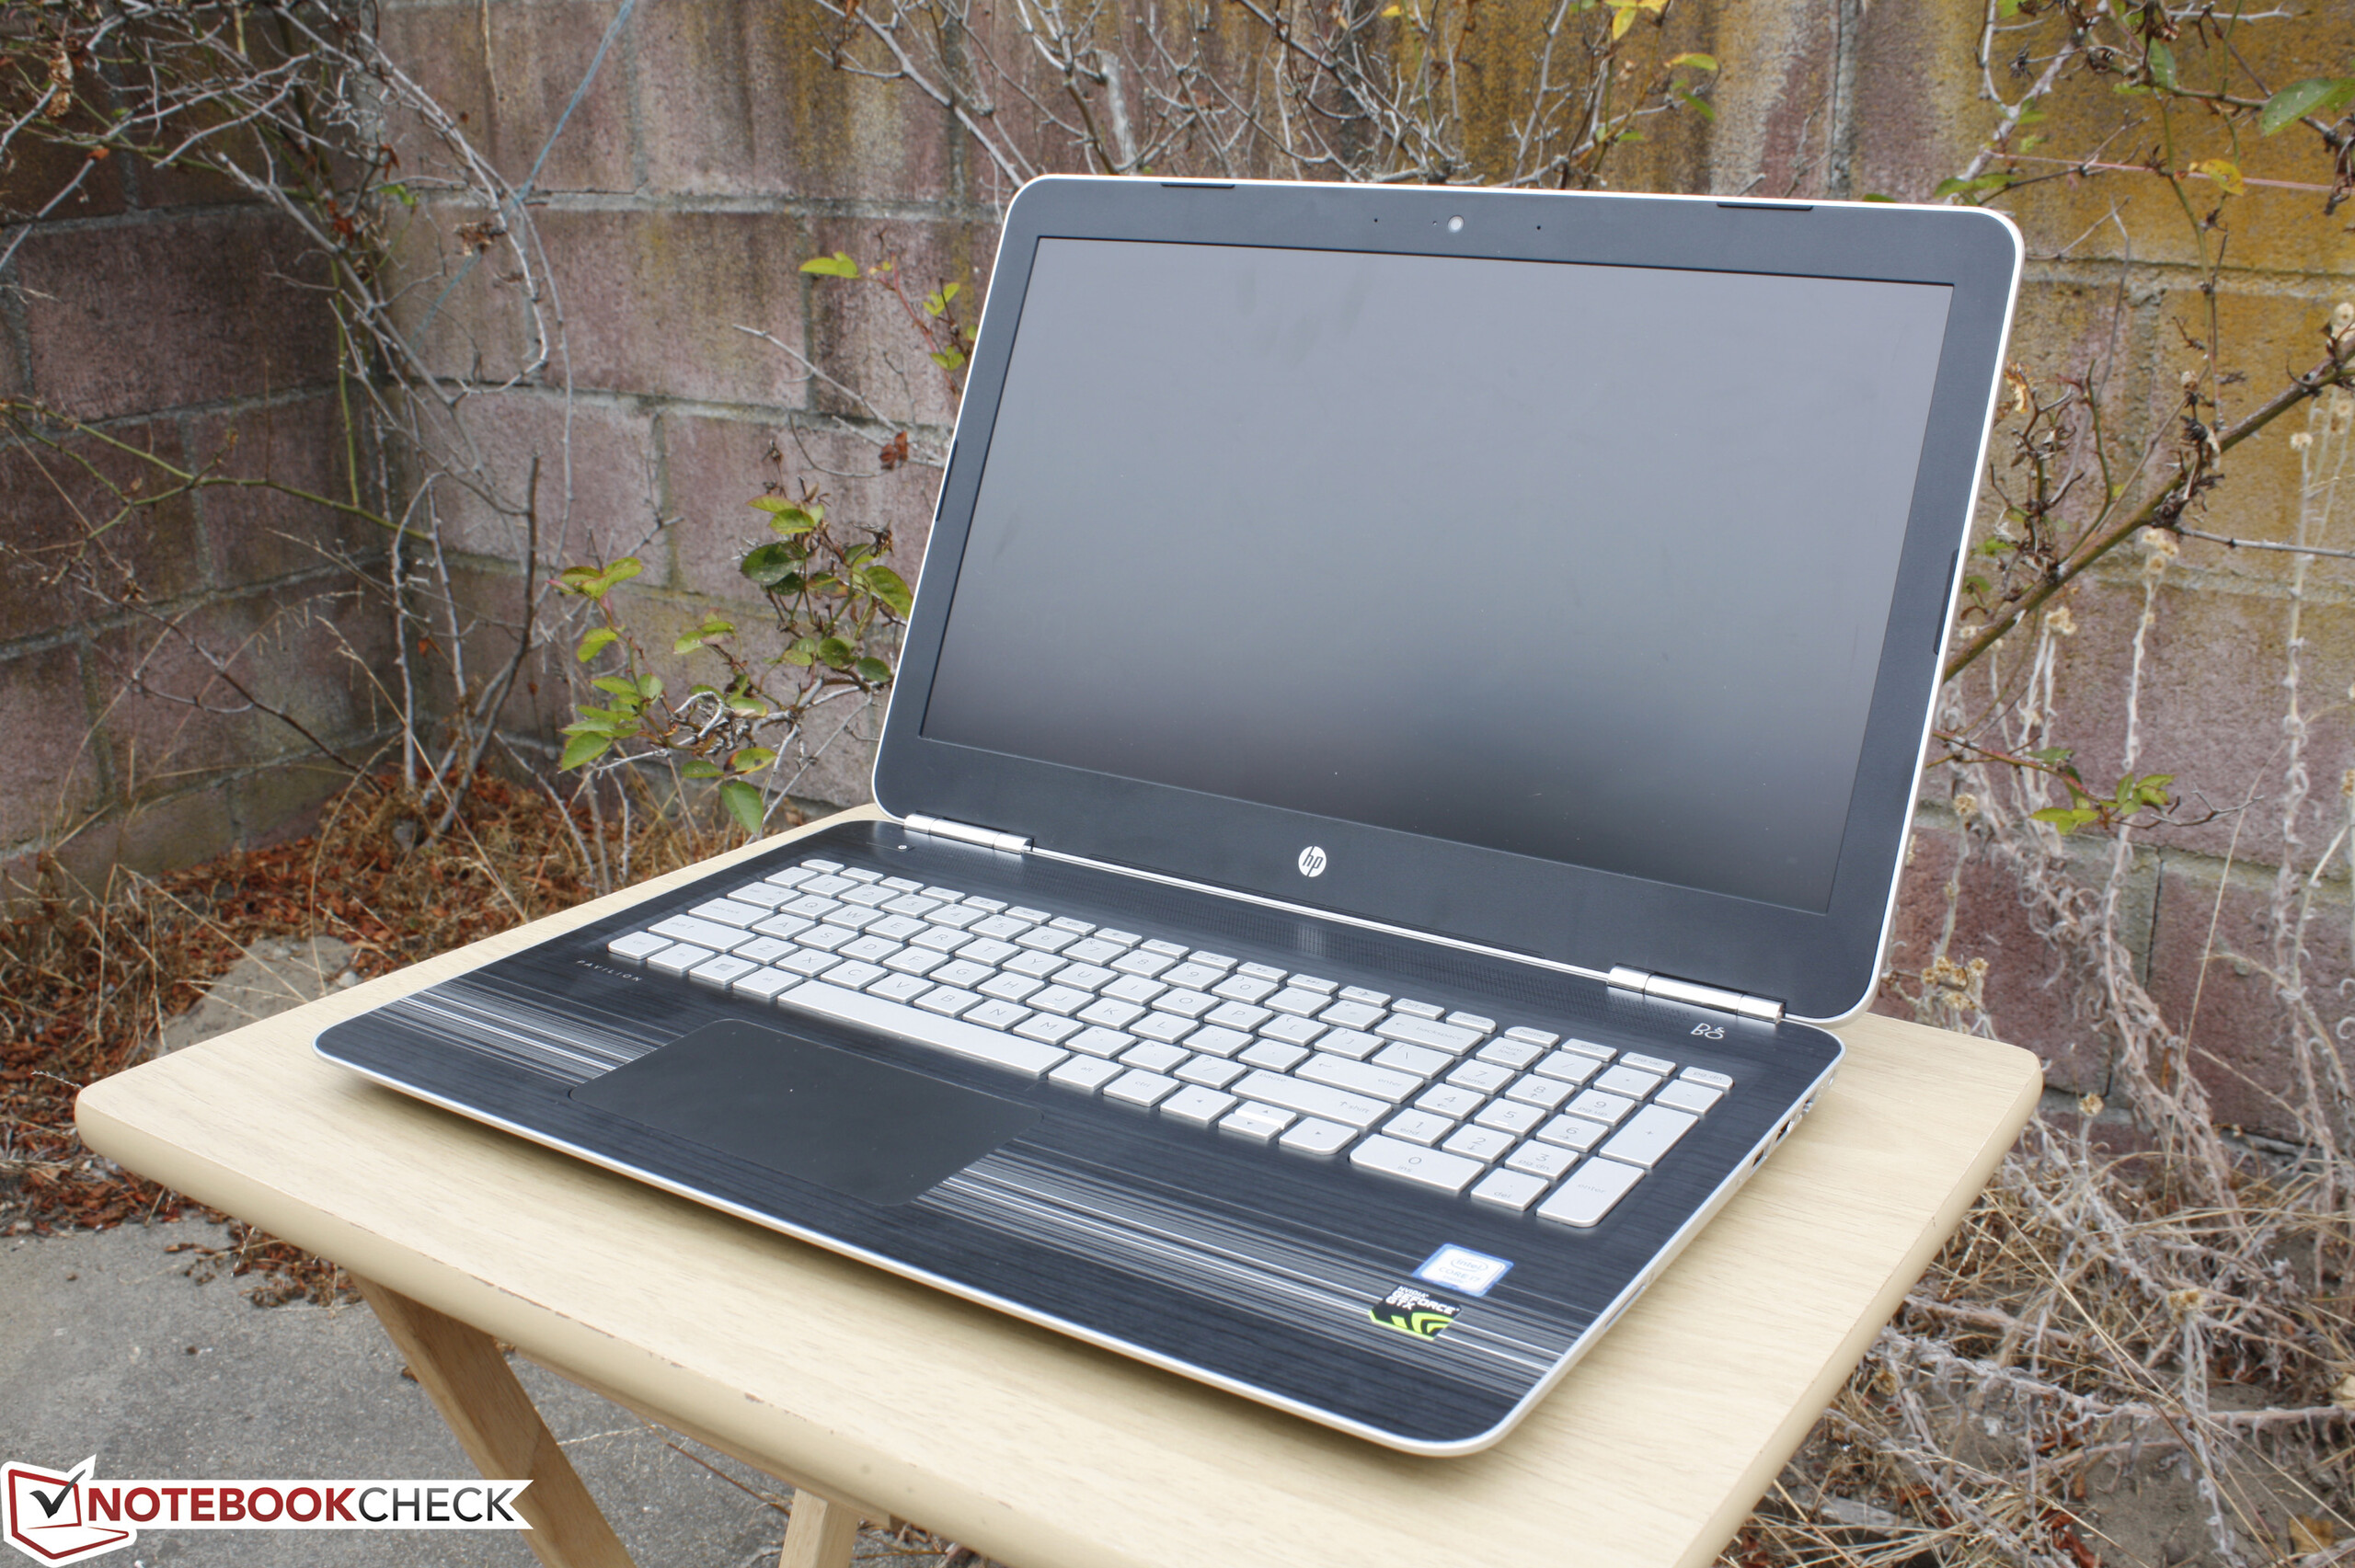
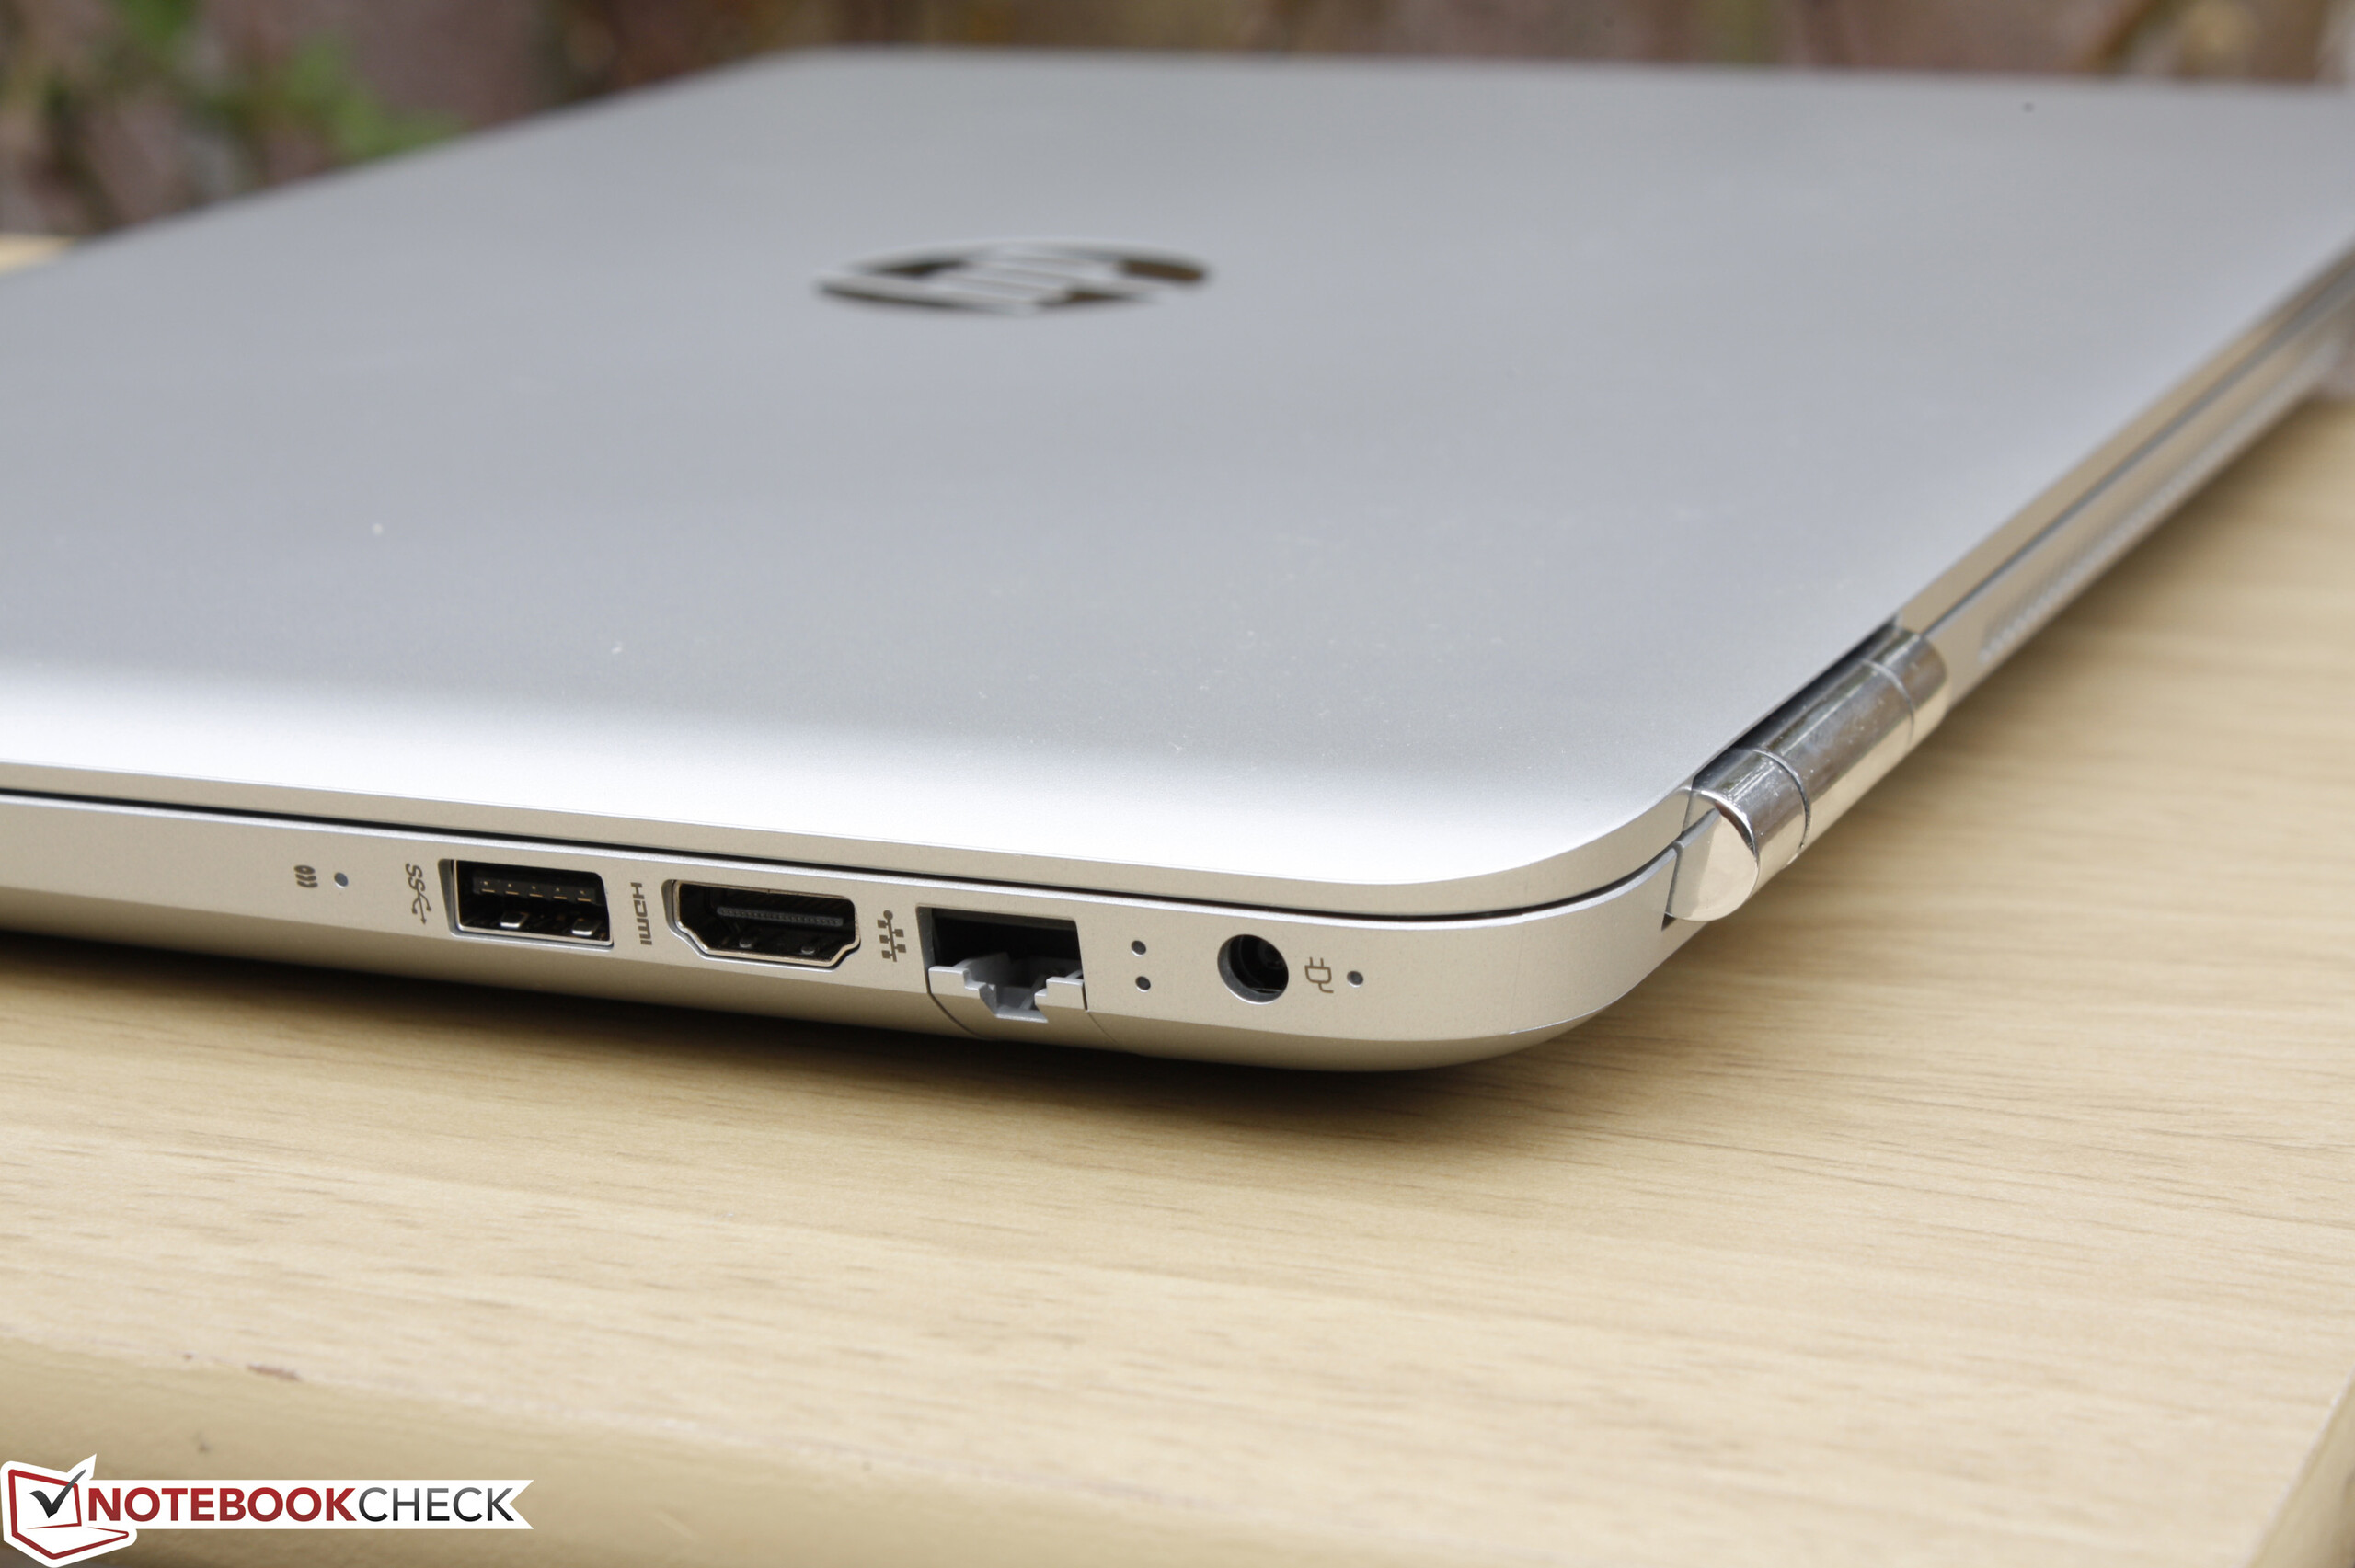
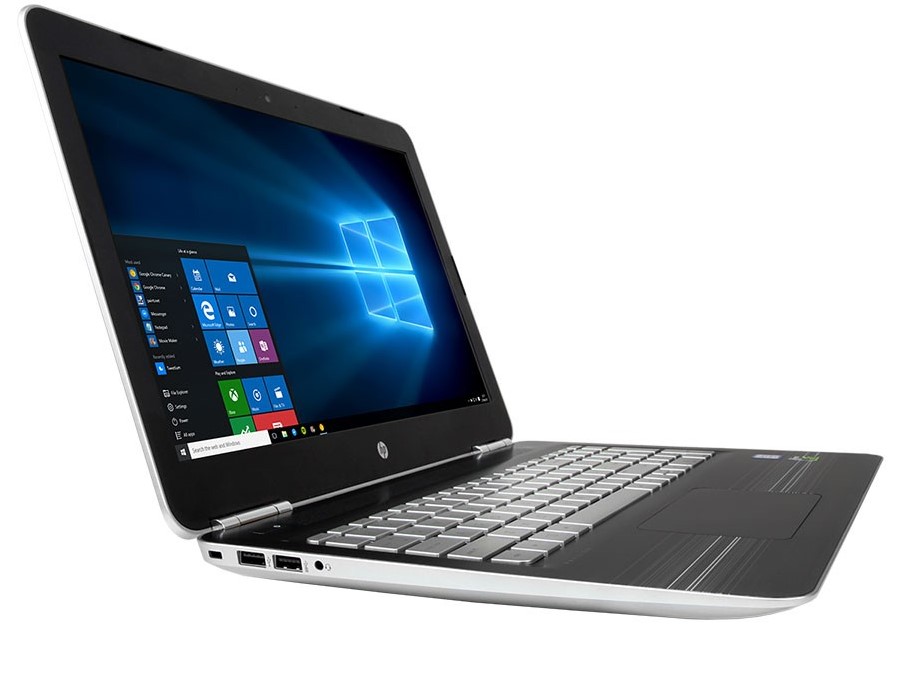
De nieuwe Pavilion 15 is de tussenstap tussen de met een GTX 950M-uitgeruste Pavilion 15 uit 2015 en de nieuwste met een GTX 965M-uitgeruste Omen 15 die enkele weken geleden gelanceerd is. De Pavilion is dan ook een paar honderd dollar lager geprijsd dan de grafisch krachtiger Omen 15. Omdat deze beide modellen verder weinig verschillen is de Pavilion 15 aantrekkelijker en betaalbaarder voor gebruikers die goede 1080p game prestaties willen voor $1.000 of minder. In essentie is de Pavilion 15 een all-round notebook geschikt voor werk en ontspanning.
Hoewel de Pavilion 15 op zichzelf geen ondermaatse prestaties levert, is er te weinig vernieuwd om zich te kunnen onderscheiden van zijn voorganger en biedt niet genoeg om boven het maaiveld uit te steken. Dit zou niet een probleem zijn als er geen alternatieven zoals de Asus UX501 of Dell XPS 15 zouden zijn. Beide zijn steviger gebouwd met behoudt van de krachtige GTX 960M GPU. De XPS 15 is ook aanmerkelijk lichter en draagbaar en het wordt daarmee moeilijk om de HP aan te raden wanneer er zulke goede alternatieven beschikbaar zijn. In dit geval is het grootste voordeel van de Pavilion 15 zijn lagere prijs. Ook is het wellicht beter UHD panelen over te slaan en bij FHD te blijven, gezien deze beter passen bij de prestaties van de GPU.
Een multimedia en game systeem zonder fratsen voor een lagere prijs dan de concurrentie. De hardware en features zijn wat minder in vergelijking met de concurrentie, maar de game prestaties zouden genoeg moeten zijn voor gamers met een budget op zoek naar een alles-in-één notebook.
HP Pavilion 15 UHD T9Y85AV
-
05-08-2016 v5.1(old)
Allen Ngo
Pricecompare
