 Deutsch
 English
 Español
 Français
 Italiano
 Nederlands
 Polski
 Português
 Русский
 Türkçe
 Svenska
 Chinese
 Magyar
Kort testrapport HP Elite x2 1013 G3 (i5-8350U, SSD, 3k) 2-in-1
| |||||||||||||||||||||||||
Helderheidsverdeling: 85 %
Helderheid in Batterij-modus: 456 cd/m²
Contrast: 942:1 (Zwart: 0.48 cd/m²)
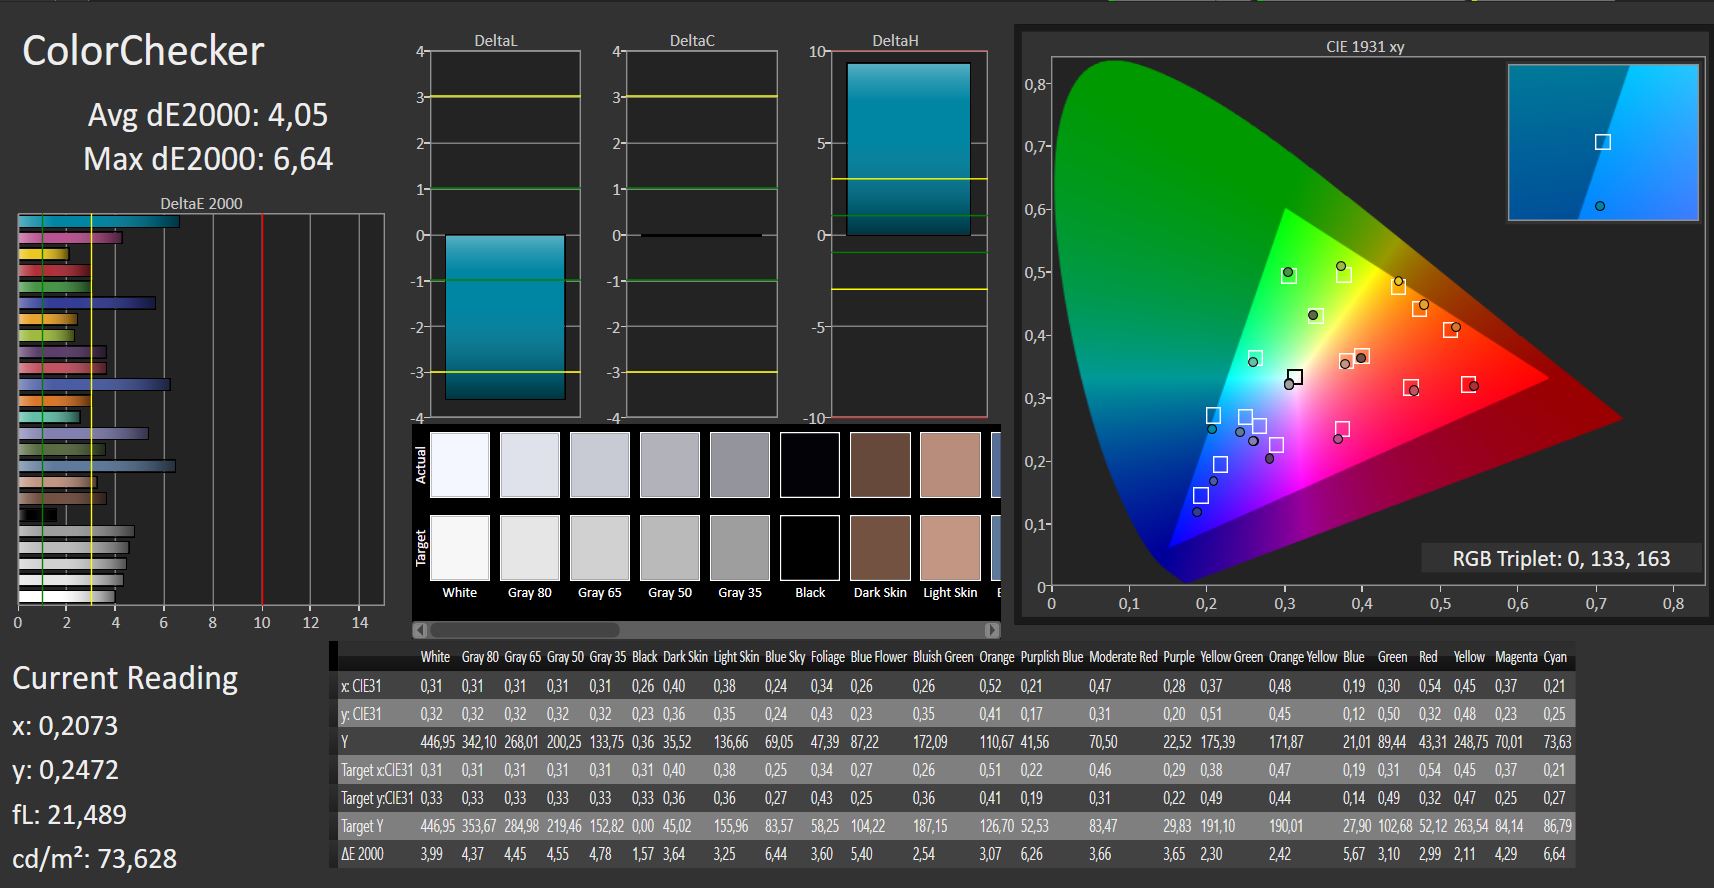
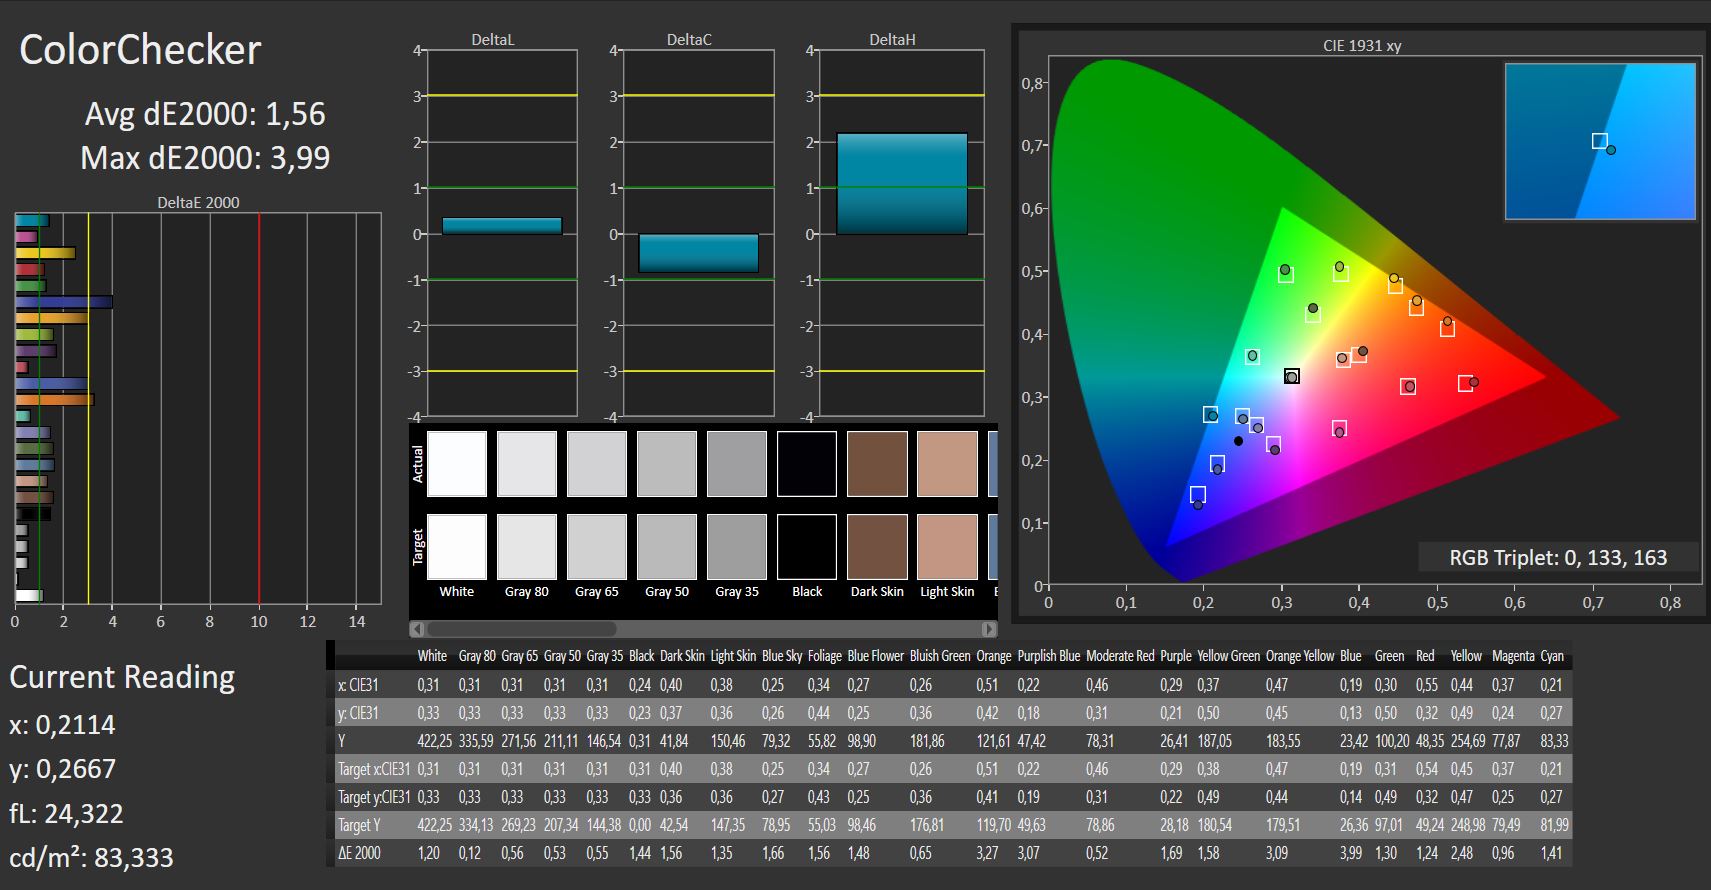
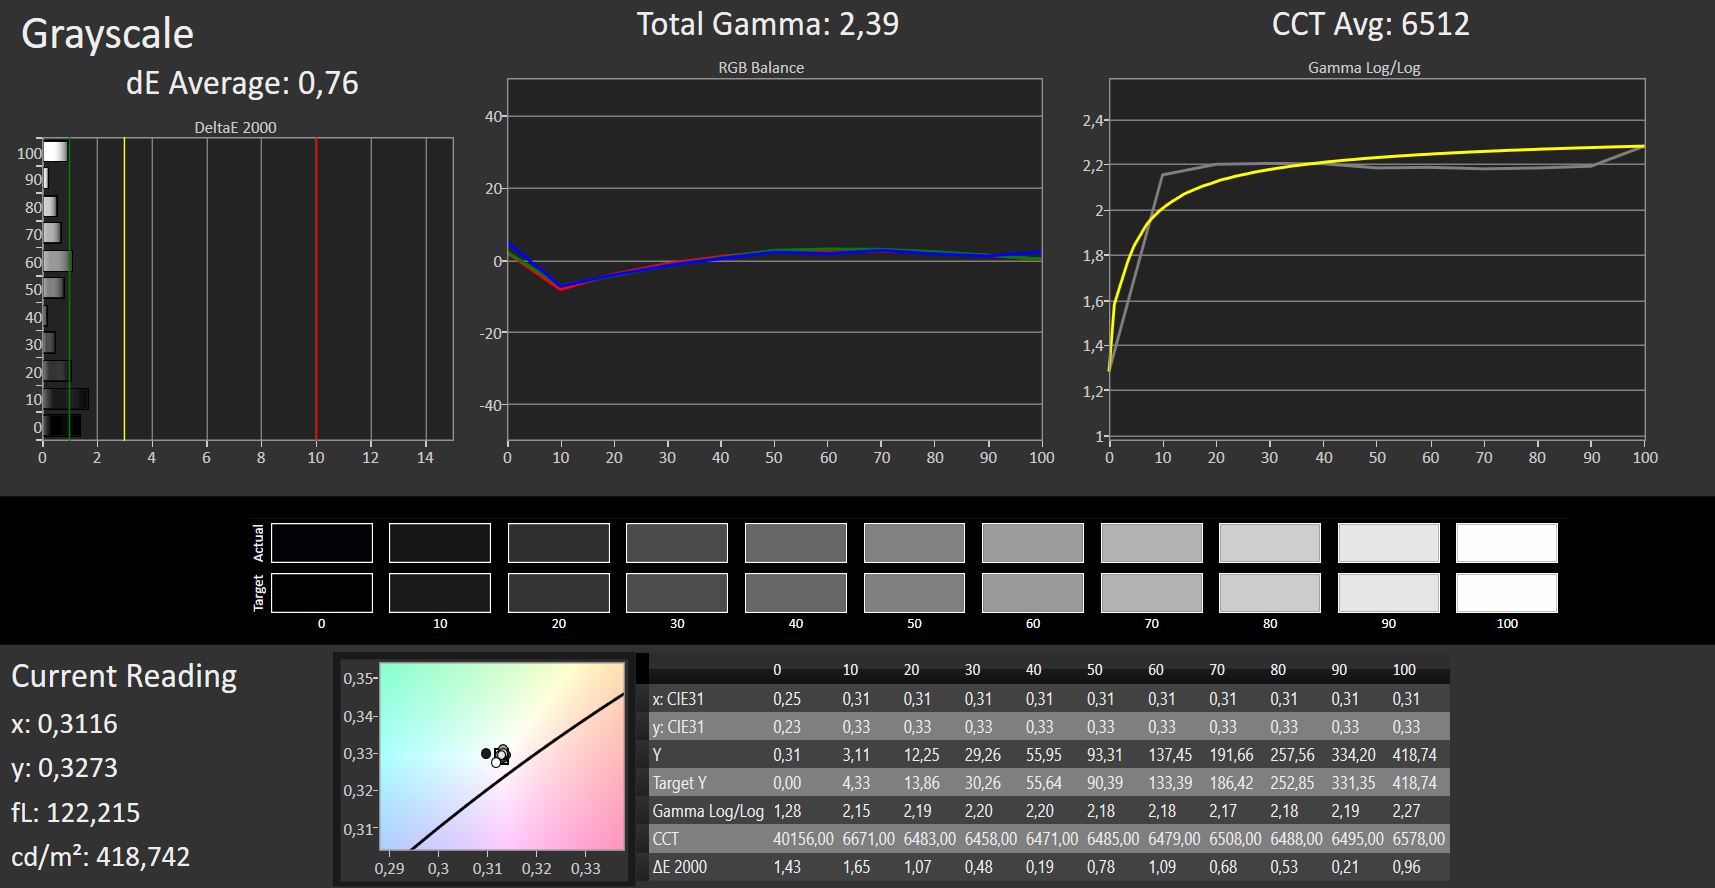
ΔE Color 4.05 | 0.5-29.43 Ø5, calibrated: 1.56
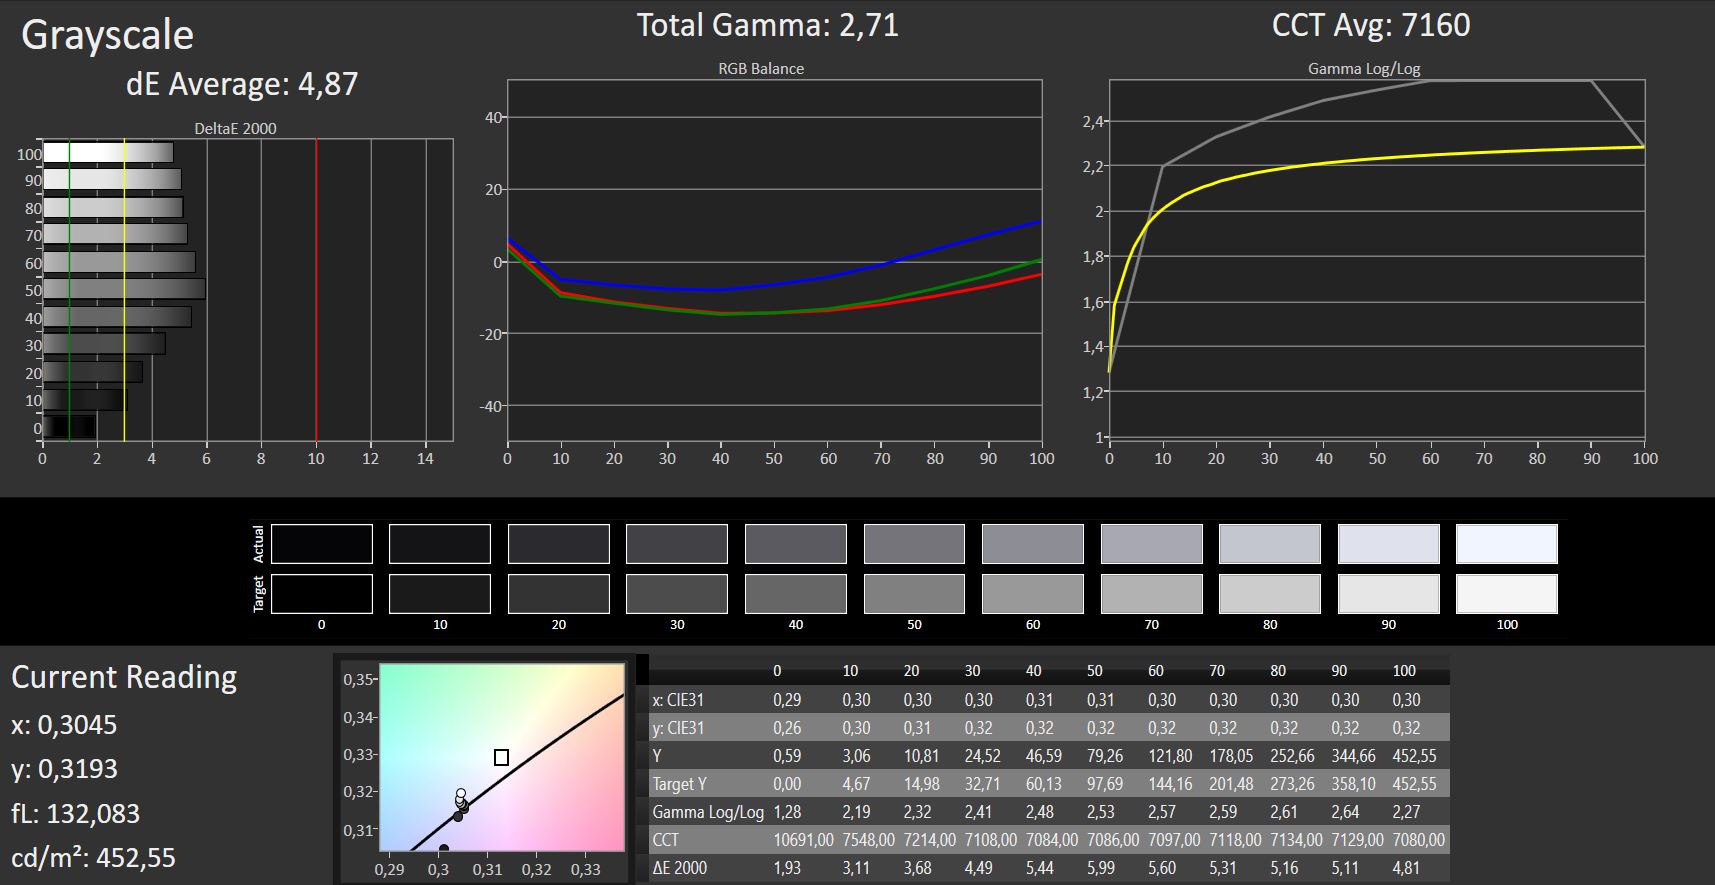
ΔE Greyscale 4.87 | 0.57-98 Ø5.3
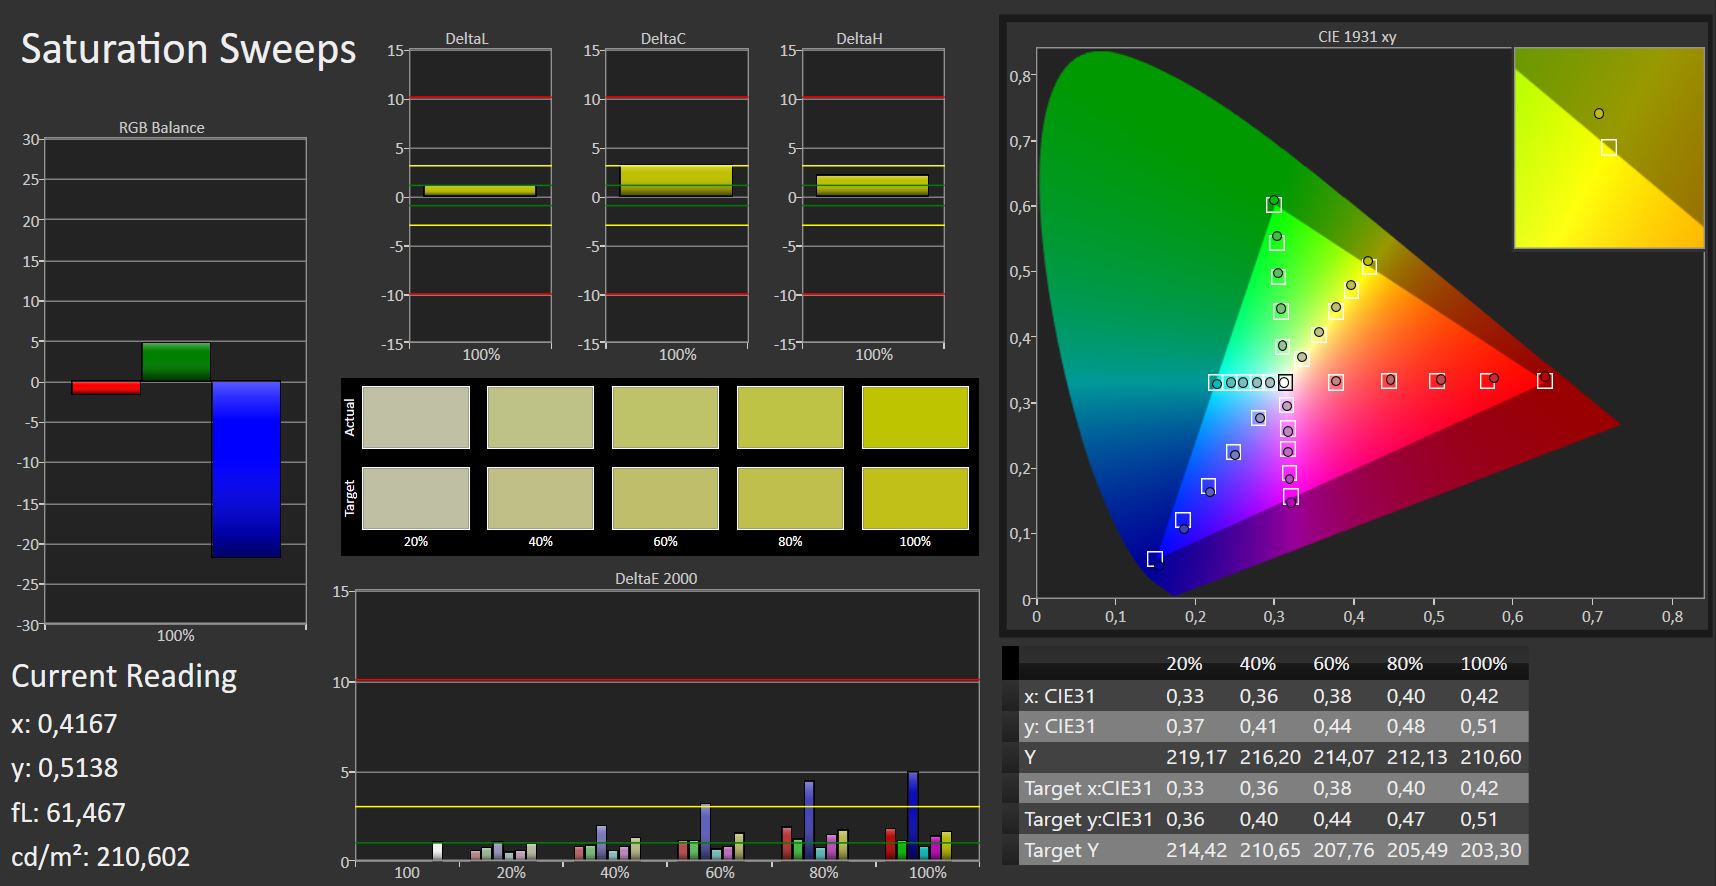
97% sRGB (Argyll 1.6.3 3D)
62% AdobeRGB 1998 (Argyll 1.6.3 3D)
68.2% AdobeRGB 1998 (Argyll 2.2.0 3D)
96.7% sRGB (Argyll 2.2.0 3D)
67.5% Display P3 (Argyll 2.2.0 3D)
Gamma: 2.71
| HP Elite x2 1013 G3-2TT14EA IPS, 3000x2000, 13.00 | HP Elite x2 1012 G2-1LV76EA IPS, 2716x1824, 12.30 | Lenovo Miix 520-12IKB 20M3000LGE IPS, 1920x1200, 12.20 | Dell Latitude 12 5285 2-in-1 IPS, 1920x1280, 12.30 | Asus Transformer 4 Pro (i7-7500U, HD620) IPS, 2160x1440, 12.60 | Microsoft Surface Pro (2017) i7 IPS, 2736x1824, 12.30 | Microsoft Surface Pro (2017) i5 IPS, 2736x1824, 12.30 | |
|---|---|---|---|---|---|---|---|
| Display | 0% | -3% | -5% | -2% | -1% | 1% | |
| Display P3 Coverage | 67.5 | 66.7 -1% | 66.1 -2% | 62.8 -7% | 69.6 3% | 66.6 -1% | 67.6 0% |
| sRGB Coverage | 96.7 | 98 1% | 91.6 -5% | 94 -3% | 90 -7% | 96.5 0% | 99 2% |
| AdobeRGB 1998 Coverage | 68.2 | 68.7 1% | 66.7 -2% | 64.7 -5% | 65.9 -3% | 67.8 -1% | 69.1 1% |
| Response Times | 10% | 18% | -4% | 3% | 13% | -1% | |
| Response Time Grey 50% / Grey 80% * | 47 ? | 45.6 ? 3% | 36 ? 23% | 42.4 ? 10% | 41 ? 13% | 37 ? 21% | 42 ? 11% |
| Response Time Black / White * | 26 ? | 21.6 ? 17% | 23 ? 12% | 30.8 ? -18% | 28 ? -8% | 25 ? 4% | 29 ? -12% |
| PWM Frequency | 2119 ? | 200 ? | 210.1 ? | 22130 ? | 21000 | ||
| Screen | 16% | -19% | 5% | 1% | 5% | 15% | |
| Brightness middle | 452 | 443 -2% | 384 -15% | 523.2 16% | 262 -42% | 482 7% | 417 -8% |
| Brightness | 412 | 446 8% | 355 -14% | 522 27% | 254 -38% | 466 13% | 401 -3% |
| Brightness Distribution | 85 | 88 4% | 80 -6% | 88 4% | 89 5% | 92 8% | 88 4% |
| Black Level * | 0.48 | 0.41 15% | 0.56 -17% | 0.42 12% | 0.26 46% | 0.395 18% | 0.29 40% |
| Contrast | 942 | 1080 15% | 686 -27% | 1246 32% | 1008 7% | 1220 30% | 1438 53% |
| Colorchecker dE 2000 * | 4.05 | 2.6 36% | 4.58 -13% | 4 1% | 3.34 18% | 4 1% | 3.63 10% |
| Colorchecker dE 2000 max. * | 6.64 | 4 40% | 11.63 -75% | 8.6 -30% | 7.12 -7% | 7.2 -8% | 6.74 -2% |
| Colorchecker dE 2000 calibrated * | 1.56 | ||||||
| Greyscale dE 2000 * | 4.87 | 3 38% | 5.63 -16% | 5.5 -13% | 3.28 33% | 5.7 -17% | 2.18 55% |
| Gamma | 2.71 81% | 2.38 92% | 2.45 90% | 2.16 102% | 2.47 89% | 2.28 96% | 3.09 71% |
| CCT | 7160 91% | 6780 96% | 7571 86% | 7546 86% | 7180 91% | 7950 82% | 6767 96% |
| Color Space (Percent of AdobeRGB 1998) | 62 | 62.6 1% | 60 -3% | 64.86 5% | 59 -5% | 62 0% | 63 2% |
| Color Space (Percent of sRGB) | 97 | 98 1% | 92 -5% | 93.97 -3% | 90 -7% | 96 -1% | 99 2% |
| Totaal Gemiddelde (Programma / Instellingen) | 9% /
12% | -1% /
-11% | -1% /
2% | 1% /
1% | 6% /
5% | 5% /
10% |
* ... kleiner is beter
Screen Flickering / PWM (Pulse-Width Modulation)
| Screen flickering / PWM niet waargenomen | 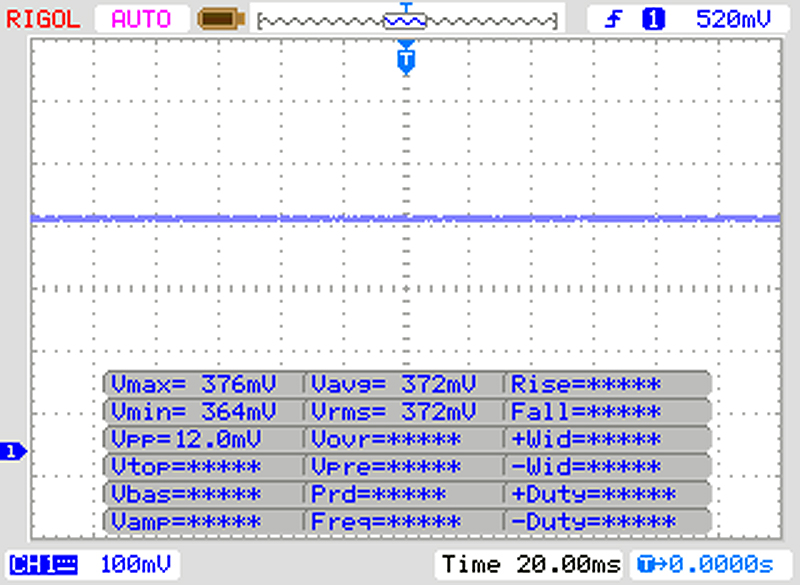 | ||
Ter vergelijking: 53 % van alle geteste toestellen maakten geen gebruik van PWM om de schermhelderheid te verlagen. Als het wel werd gebruikt, werd een gemiddelde van 17900 (minimum: 5 - maximum: 3846000) Hz waargenomen. | |||
Responstijd Scherm
| ↔ Responstijd Zwart naar Wit | ||
|---|---|---|
| 26 ms ... stijging ↗ en daling ↘ gecombineerd | ↗ 14 ms stijging | 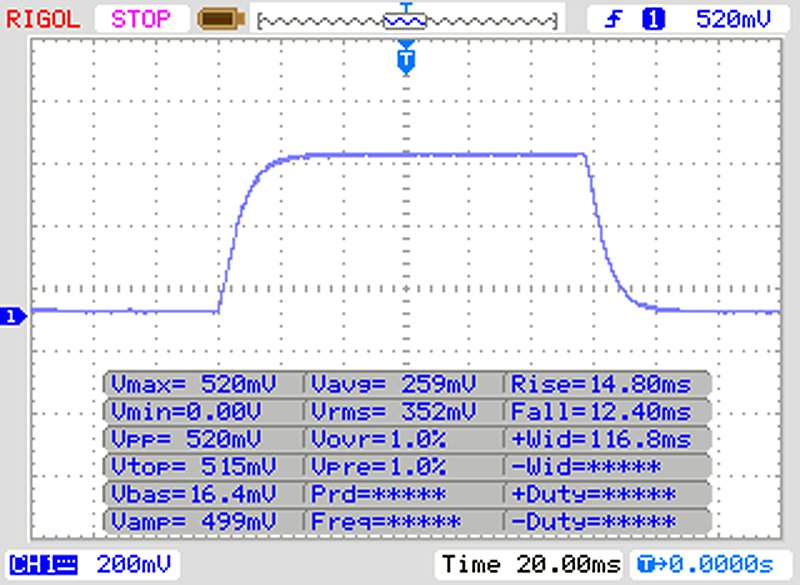 |
| ↘ 12 ms daling | ||
| Het scherm vertoonde relatief trage responstijden in onze tests en is misschien te traag voor games. Ter vergelijking: alle testtoestellen variëren van 0.1 (minimum) tot 240 (maximum) ms. » 57 % van alle toestellen zijn beter. Dit betekent dat de gemeten responstijd slechter is dan het gemiddelde (21.5 ms) van alle geteste toestellen. | ||
| ↔ Responstijd 50% Grijs naar 80% Grijs | ||
| 47 ms ... stijging ↗ en daling ↘ gecombineerd | ↗ 23 ms stijging | 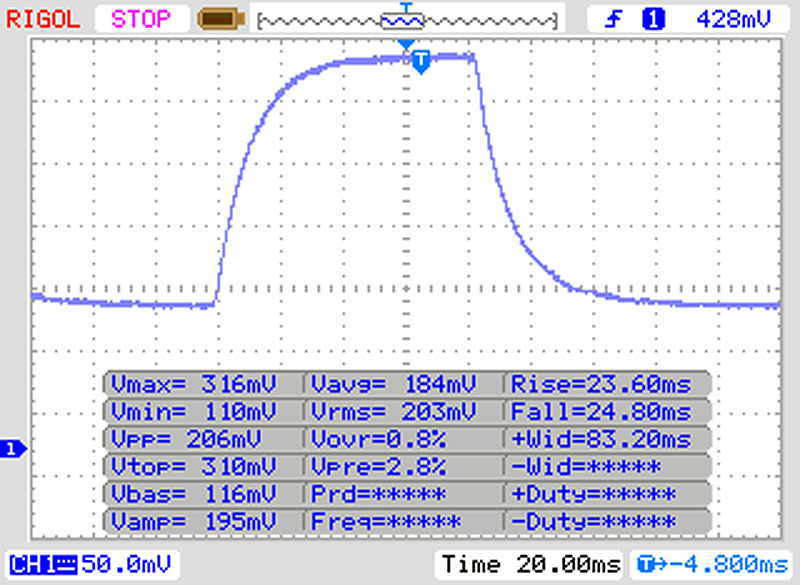 |
| ↘ 24 ms daling | ||
| Het scherm vertoonde trage responstijden in onze tests en is misschien te traag voor games. Ter vergelijking: alle testtoestellen variëren van 0.2 (minimum) tot 636 (maximum) ms. » 78 % van alle toestellen zijn beter. Dit betekent dat de gemeten responstijd slechter is dan het gemiddelde (33.7 ms) van alle geteste toestellen. | ||
| Geekbench 3 | |
| 32 Bit Multi-Core Score | |
| Lenovo Miix 520-12IKB 20M3000LGE | |
| HP Elite x2 1013 G3-2TT14EA | |
| Gemiddeld Intel Core i5-8350U () | |
| 32 Bit Single-Core Score | |
| Lenovo Miix 520-12IKB 20M3000LGE | |
| HP Elite x2 1013 G3-2TT14EA | |
| Gemiddeld Intel Core i5-8350U () | |
| Geekbench 4.0 | |
| 64 Bit Multi-Core Score | |
| Lenovo Miix 520-12IKB 20M3000LGE | |
| Gemiddeld Intel Core i5-8350U (12679 - 12920, n=2) | |
| HP Elite x2 1013 G3-2TT14EA | |
| 64 Bit Single-Core Score | |
| Lenovo Miix 520-12IKB 20M3000LGE | |
| Gemiddeld Intel Core i5-8350U (4160 - 4260, n=2) | |
| HP Elite x2 1013 G3-2TT14EA | |
| Mozilla Kraken 1.1 - Total | |
| HP Elite x2 1013 G3-2TT14EA (Edge 42) | |
| HP Elite x2 1012 G2-1LV76EA (Edge 40.15063.0.0) | |
| Gemiddeld Intel Core i5-8350U (1017 - 1289, n=5) | |
| Asus Transformer 4 Pro (i7-7500U, HD620) | |
| Microsoft Surface Pro (2017) i7 (Edge 40) | |
| Gemiddelde van klas Convertible (472 - 3989, n=65, laatste 2 jaar) | |
| Octane V2 - Total Score | |
| Gemiddelde van klas Convertible (70338 - 92146, n=14, laatste 2 jaar) | |
| Microsoft Surface Pro (2017) i7 (Edge 40) | |
| Microsoft Surface Pro (2017) i5 | |
| Gemiddeld Intel Core i5-8350U (28223 - 38722, n=5) | |
| Asus Transformer 4 Pro (i7-7500U, HD620) | |
| HP Elite x2 1013 G3-2TT14EA (Edge 42) | |
| HP Elite x2 1012 G2-1LV76EA (Edge 40.15063.0.0) | |
| JetStream 1.1 - Total Score | |
| Gemiddelde van klas Convertible (338 - 443, n=4, laatste 2 jaar) | |
| Lenovo Miix 520-12IKB 20M3000LGE (Edge 41) | |
| Microsoft Surface Pro (2017) i7 (Edge 40) | |
| HP Elite x2 1013 G3-2TT14EA (Edge 42) | |
| Microsoft Surface Pro (2017) i5 | |
| HP Elite x2 1012 G2-1LV76EA (Edge 40.15063.0.0) | |
| Gemiddeld Intel Core i5-8350U (173 - 232, n=5) | |
| Asus Transformer 4 Pro (i7-7500U, HD620) | |
| Fujitsu Stylistic Q738 | |
| Huawei Matebook E | |
* ... kleiner is beter
| PCMark 7 Score | 5676 punten | |
| PCMark 8 Home Score Accelerated v2 | 3413 punten | |
| PCMark 8 Creative Score Accelerated v2 | 4669 punten | |
| PCMark 8 Work Score Accelerated v2 | 4200 punten | |
| PCMark 10 Score | 3559 punten | |
Help | ||

| HP Elite x2 1013 G3-2TT14EA Samsung PM961 MZVLW256HEHP | HP Elite x2 1012 G2-1LV76EA Samsung PM961 MZVLW256HEHP | Lenovo Miix 520-12IKB 20M3000LGE Samsung SSD PM961 1TB M.2 PCIe 3.0 x4 NVMe (MZVLW1T0) | Dell Latitude 12 5285 2-in-1 Samsung PM961 MZVLW256HEHP | Asus Transformer 4 Pro (i7-7500U, HD620) SK Hynix HFS256G39TND-N210A | Microsoft Surface Pro (2017) i7 Samsung PM971 KUS040202M | Microsoft Surface Pro (2017) i5 Samsung PM971 KUS030202M | Gemiddeld Samsung PM961 MZVLW256HEHP | |
|---|---|---|---|---|---|---|---|---|
| CrystalDiskMark 3.0 | 30% | 14% | -9% | -45% | 4% | -15% | 14% | |
| Read Seq | 1786 | 1875 5% | 883 -51% | 1294 -28% | 475.3 -73% | 1308 -27% | 723 -60% | 1627 ? -9% |
| Write Seq | 1209 | 1261 4% | 932 -23% | 865 -28% | 260.9 -78% | 961 -21% | 853 -29% | 1136 ? -6% |
| Read 512 | 717 | 1235 72% | 586 -18% | 406 -43% | 289.3 -60% | 227.5 -68% | 225 -69% | 887 ? 24% |
| Write 512 | 798 | 844 6% | 627 -21% | 589 -26% | 260.7 -67% | 792 -1% | 445 -44% | 781 ? -2% |
| Read 4k | 49.66 | 56.9 15% | 54.8 10% | 31.75 -36% | 30.06 -39% | 53.6 8% | 46 -7% | 53 ? 7% |
| Write 4k | 104.2 | 145.4 40% | 139.3 34% | 72.2 -31% | 73.5 -29% | 136.3 31% | 125 20% | 126.7 ? 22% |
| Read 4k QD32 | 286 | 398.3 39% | 607 112% | 493.3 72% | 296.8 4% | 485.6 70% | 423 48% | 419 ? 47% |
| Write 4k QD32 | 298.4 | 472.5 58% | 498.5 67% | 434.5 46% | 239.8 -20% | 421.5 41% | 373 25% | 384 ? 29% |
| 3DMark 06 Standard Score | 10622 punten | |
| 3DMark 11 Performance | 1851 punten | |
| 3DMark Ice Storm Standard Score | 56649 punten | |
| 3DMark Cloud Gate Standard Score | 7437 punten | |
| 3DMark Fire Strike Score | 1026 punten | |
| 3DMark Time Spy Score | 384 punten | |
Help | ||
| 3DMark 11 - 1280x720 Performance GPU | |
| Gemiddelde van klas Convertible (471 - 40768, n=65, laatste 2 jaar) | |
| Microsoft Surface Pro (2017) i7 | |
| Gemiddeld Intel UHD Graphics 620 (1144 - 3432, n=244) | |
| Lenovo Miix 520-12IKB 20M3000LGE (Cool Mode Off) | |
| Lenovo Miix 520-12IKB 20M3000LGE (Cool Mode On) | |
| HP Elite x2 1013 G3-2TT14EA | |
| Dell Latitude 12 5285 2-in-1 | |
| HP Elite x2 1012 G2-1LV76EA | |
| Asus Transformer 4 Pro (i7-7500U, HD620) | |
| Huawei Matebook E | |
| Fujitsu Stylistic Q738 | |
| lage | gem. | hoge | ultra | |
| Tomb Raider (2013) | 91.5 | 45 | 28.6 | 12.8 |
| BioShock Infinite (2013) | 60.6 | 31.1 | 26.8 | 8.7 |
| Rise of the Tomb Raider (2016) | 17.2 | 11.4 | 6 | 3.1 |
| Tomb Raider - 1024x768 Low Preset | |
| HP Elite x2 1013 G3-2TT14EA | |
| Dell Latitude 12 5285 2-in-1 | |
| Gemiddeld Intel UHD Graphics 620 (24.3 - 114.4, n=18) | |
Geluidsniveau
| Onbelast |
| 30.3 / 30.3 / 31.2 dB (A) |
| Belasting |
| 32.8 / 32.9 dB (A) |
 | ||
30 dB stil 40 dB(A) hoorbaar 50 dB(A) luid |
||
min: | ||
| HP Elite x2 1013 G3-2TT14EA i5-8350U, UHD Graphics 620 | HP Elite x2 1012 G2-1LV76EA i5-7200U, HD Graphics 620 | Lenovo Miix 520-12IKB 20M3000LGE i5-8550U, UHD Graphics 620 | Dell Latitude 12 5285 2-in-1 i7-7600U, HD Graphics 620 | Asus Transformer 4 Pro (i7-7500U, HD620) i7-7500U, HD Graphics 620 | Microsoft Surface Pro (2017) i7 i7-7660U, Iris Plus Graphics 640 | Gemiddeld Intel UHD Graphics 620 | Gemiddelde van klas Convertible | |
|---|---|---|---|---|---|---|---|---|
| Noise | 4% | -1% | 6% | 1% | 1% | 1% | 9% | |
| uit / omgeving * | 30.3 | 29.5 3% | 30.2 -0% | 28.2 7% | 30.2 -0% | 29.6 2% | 29 ? 4% | 24 ? 21% |
| Idle Minimum * | 30.3 | 29.5 3% | 30.2 -0% | 28.2 7% | 30.2 -0% | 29.6 2% | 29.1 ? 4% | 24.3 ? 20% |
| Idle Average * | 30.3 | 29.5 3% | 30.2 -0% | 28.2 7% | 30.2 -0% | 29.6 2% | 29.1 ? 4% | 24.5 ? 19% |
| Idle Maximum * | 31.2 | 29.5 5% | 30.2 3% | 28.2 10% | 29.6 5% | 29.7 ? 5% | 25.4 ? 19% | |
| Load Average * | 32.8 | 30.6 7% | 33.4 -2% | 30.4 7% | 30.8 6% | 33.4 -2% | 33.5 ? -2% | 34.6 ? -5% |
| Load Maximum * | 32.9 | 32.5 1% | 34.2 -4% | 34 -3% | 32.9 -0% | 34.1 -4% | 36.1 ? -10% | 40.3 ? -22% |
| Witcher 3 ultra * | 33.4 |
* ... kleiner is beter
(-) De maximumtemperatuur aan de bovenzijde bedraagt 49.4 °C / 121 F, vergeleken met het gemiddelde van 35.3 °C / 96 F, variërend van 19.6 tot 55.7 °C voor de klasse Convertible.
(-) De bodem warmt op tot een maximum van 47.1 °C / 117 F, vergeleken met een gemiddelde van 36.8 °C / 98 F
(±) Bij onbelast gebruik bedraagt de gemiddelde temperatuur voor de bovenzijde 32.2 °C / 90 F, vergeleken met het apparaatgemiddelde van 30.2 °C / 86 F.
(-) De palmsteunen en het touchpad kunnen zeer heet aanvoelen met een maximum van ###max## °C / 105.8 F.
(-) De gemiddelde temperatuur van de handpalmsteun van soortgelijke toestellen bedroeg 28.1 °C / 82.6 F (-12.9 °C / -23.2 F).
| HP Elite x2 1013 G3-2TT14EA i5-8350U, UHD Graphics 620 | HP Elite x2 1012 G2-1LV76EA i5-7200U, HD Graphics 620 | Lenovo Miix 520-12IKB 20M3000LGE i5-8550U, UHD Graphics 620 | Dell Latitude 12 5285 2-in-1 i7-7600U, HD Graphics 620 | Asus Transformer 4 Pro (i7-7500U, HD620) i7-7500U, HD Graphics 620 | Microsoft Surface Pro (2017) i7 i7-7660U, Iris Plus Graphics 640 | Microsoft Surface Pro (2017) i5 i5-7300U, HD Graphics 620 | Gemiddeld Intel UHD Graphics 620 | Gemiddelde van klas Convertible | |
|---|---|---|---|---|---|---|---|---|---|
| Heat | 15% | 5% | 12% | 16% | 13% | 8% | 16% | 14% | |
| Maximum Upper Side * | 49.4 | 42.3 14% | 43.7 12% | 38.2 23% | 40.5 18% | 42 15% | 39.2 21% | 41.1 ? 17% | 40.6 ? 18% |
| Maximum Bottom * | 47.1 | 44.5 6% | 44.5 6% | 48.6 -3% | 37 21% | 42 11% | 40.3 14% | 44.3 ? 6% | 43.3 ? 8% |
| Idle Upper Side * | 38 | 29.5 22% | 38 -0% | 29.6 22% | 31.1 18% | 31 18% | 37 3% | 26.8 ? 29% | 28.5 ? 25% |
| Idle Bottom * | 30.8 | 25.2 18% | 30.8 -0% | 28.8 6% | 28.2 8% | 28 9% | 32.3 -5% | 27.7 ? 10% | 29.4 ? 5% |
* ... kleiner is beter
HP Elite x2 1013 G3-2TT14EA audioanalyse
(±) | luidspreker luidheid is gemiddeld maar goed (74.4 dB)
Bas 100 - 315 Hz
(-) | bijna geen lage tonen - gemiddeld 15.1% lager dan de mediaan
(±) | lineariteit van de lage tonen is gemiddeld (10.9% delta ten opzichte van de vorige frequentie)
Mids 400 - 2000 Hz
(±) | hogere middens - gemiddeld 7.9% hoger dan de mediaan
(±) | lineariteit van de middentonen is gemiddeld (11.3% delta ten opzichte van de vorige frequentie)
Hoog 2 - 16 kHz
(±) | higher highs - on average 5.2% higher than median
(+) | de hoge tonen zijn lineair (6.8% delta naar de vorige frequentie)
Algemeen 100 - 16.000 Hz
(±) | lineariteit van het totale geluid is gemiddeld (20.8% verschil met de mediaan)
Vergeleken met dezelfde klasse
» 50% van alle geteste apparaten in deze klasse waren beter, 11% vergelijkbaar, 39% slechter
» De beste had een delta van 6%, het gemiddelde was 21%, de slechtste was 57%
Vergeleken met alle geteste toestellen
» 51% van alle geteste apparaten waren beter, 8% gelijk, 41% slechter
» De beste had een delta van 4%, het gemiddelde was 25%, de slechtste was 134%
Apple MacBook 12 (Early 2016) 1.1 GHz audioanalyse
(+) | luidsprekers kunnen relatief luid spelen (83.6 dB)
Bas 100 - 315 Hz
(±) | verminderde zeebaars - gemiddeld 11.3% lager dan de mediaan
(±) | lineariteit van de lage tonen is gemiddeld (14.2% delta ten opzichte van de vorige frequentie)
Mids 400 - 2000 Hz
(+) | evenwichtige middens - slechts 2.4% verwijderd van de mediaan
(+) | de middentonen zijn lineair (5.5% delta ten opzichte van de vorige frequentie)
Hoog 2 - 16 kHz
(+) | evenwichtige hoogtepunten - slechts 2% verwijderd van de mediaan
(+) | de hoge tonen zijn lineair (4.5% delta naar de vorige frequentie)
Algemeen 100 - 16.000 Hz
(+) | het totale geluid is lineair (10.2% verschil met de mediaan)
Vergeleken met dezelfde klasse
» 5% van alle geteste apparaten in deze klasse waren beter, 2% vergelijkbaar, 93% slechter
» De beste had een delta van 5%, het gemiddelde was 19%, de slechtste was 53%
Vergeleken met alle geteste toestellen
» 3% van alle geteste apparaten waren beter, 1% gelijk, 96% slechter
» De beste had een delta van 4%, het gemiddelde was 25%, de slechtste was 134%
| Uit / Standby | |
| Inactief | |
| Belasting |
|
| HP Elite x2 1013 G3-2TT14EA i5-8350U, UHD Graphics 620 | HP Elite x2 1012 G2-1LV76EA i5-7200U, HD Graphics 620 | Lenovo Miix 520-12IKB 20M3000LGE i5-8550U, UHD Graphics 620 | Dell Latitude 12 5285 2-in-1 i7-7600U, HD Graphics 620 | Asus Transformer 4 Pro (i7-7500U, HD620) i7-7500U, HD Graphics 620 | Microsoft Surface Pro (2017) i7 i7-7660U, Iris Plus Graphics 640 | Microsoft Surface Pro (2017) i5 i5-7300U, HD Graphics 620 | Gemiddeld Intel UHD Graphics 620 | Gemiddelde van klas Convertible | |
|---|---|---|---|---|---|---|---|---|---|
| Power Consumption | -6% | 14% | 19% | 34% | -7% | 22% | 5% | -26% | |
| Idle Minimum * | 4.9 | 4.1 16% | 3.9 20% | 2.85 42% | 3.4 31% | 4.2 14% | 3.6 27% | 3.81 ? 22% | 5.44 ? -11% |
| Idle Average * | 8.9 | 9.2 -3% | 8.2 8% | 6.76 24% | 5.7 36% | 10.1 -13% | 8.1 9% | 6.94 ? 22% | 8.27 ? 7% |
| Idle Maximum * | 11 | 11.1 -1% | 8.4 24% | 6.91 37% | 7.4 33% | 14 -27% | 8.7 21% | 8.75 ? 20% | 10.8 ? 2% |
| Load Average * | 32 | 33.8 -6% | 25.2 21% | 32.88 -3% | 15 53% | 37.4 -17% | 25.5 20% | 35 ? -9% | 46.7 ? -46% |
| Load Maximum * | 36 | 49.2 -37% | 37 -3% | 37.41 -4% | 29.7 17% | 34 6% | 23.5 35% | 47.5 ? -32% | 65.4 ? -82% |
| Witcher 3 ultra * | 38.1 |
* ... kleiner is beter
| HP Elite x2 1013 G3-2TT14EA i5-8350U, UHD Graphics 620, 50 Wh | HP Elite x2 1012 G2-1LV76EA i5-7200U, HD Graphics 620, 47 Wh | Lenovo Miix 520-12IKB 20M3000LGE i5-8550U, UHD Graphics 620, 38 Wh | Dell Latitude 12 5285 2-in-1 i7-7600U, HD Graphics 620, 42 Wh | Asus Transformer 4 Pro (i7-7500U, HD620) i7-7500U, HD Graphics 620, 39 Wh | Microsoft Surface Pro (2017) i7 i7-7660U, Iris Plus Graphics 640, 45 Wh | Microsoft Surface Pro (2017) i5 i5-7300U, HD Graphics 620, 45 Wh | Gemiddelde van klas Convertible | |
|---|---|---|---|---|---|---|---|---|
| Batterijduur | -3% | -27% | 7% | -15% | 16% | 40% | 38% | |
| Reader / Idle | 781 | 833 7% | 1075 38% | 842 8% | 1054 35% | 1112 ? 42% | ||
| H.264 | 389 | 377 -3% | 614 58% | 769 ? 98% | ||||
| WiFi v1.3 | 459 | 378 -18% | 334 -27% | 486 6% | 280 -39% | 489 7% | 744 62% | 564 ? 23% |
| Load | 137 | 138 1% | 105 -23% | 118 -14% | 112 -18% | 168 23% | 121.7 ? -11% | |
| Witcher 3 ultra | 115 | 90 ? |
Pro
Contra
Dit is de verkorte versie van het volledige artikel. Het volledige, Engelse testrapport vind je hier.
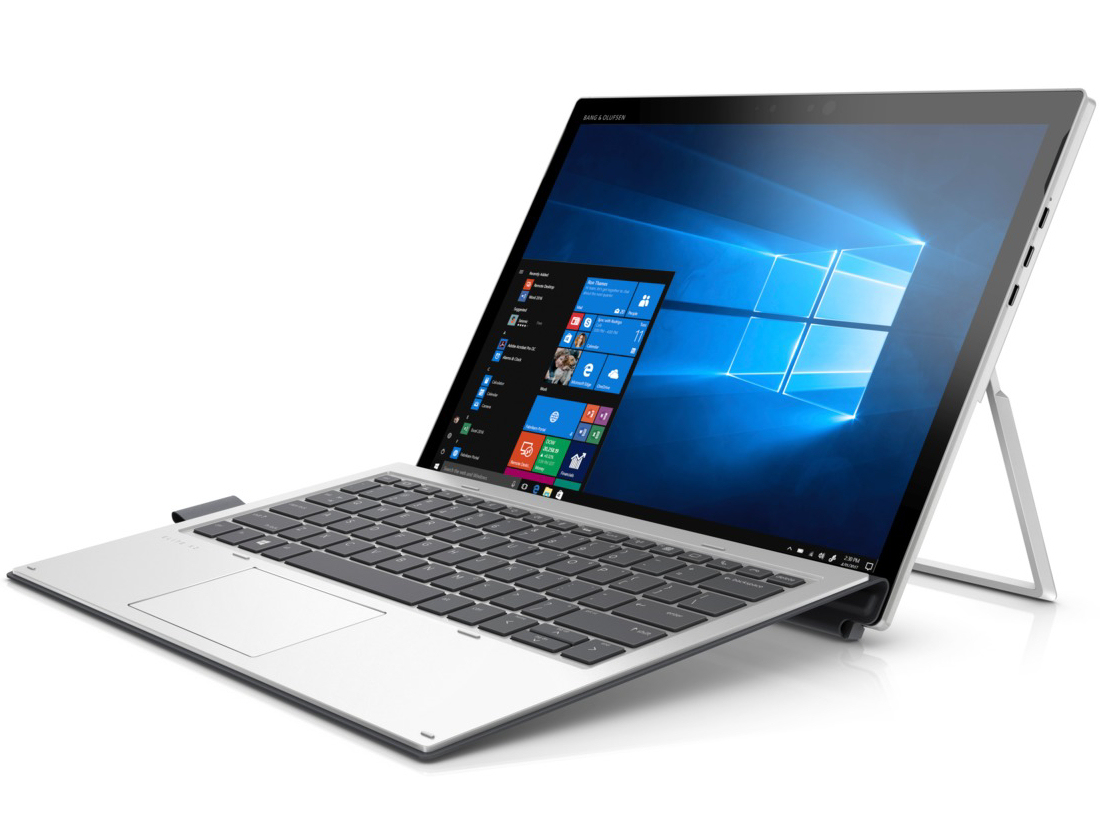
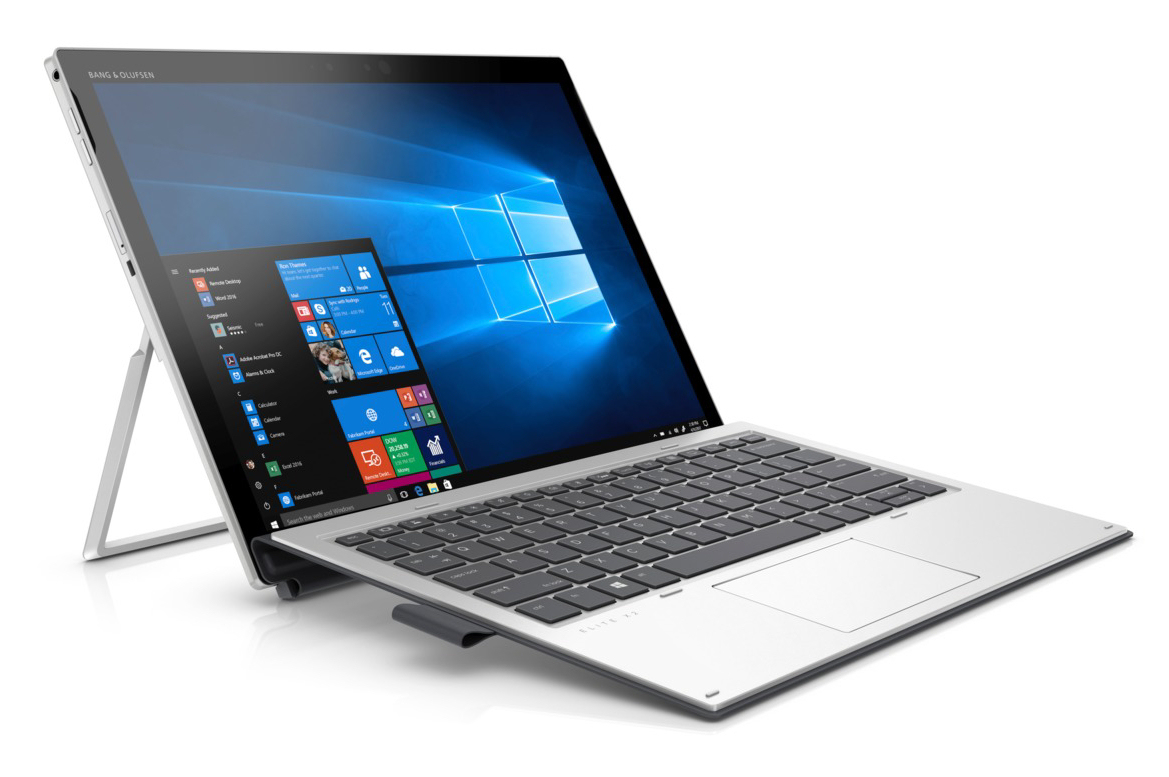
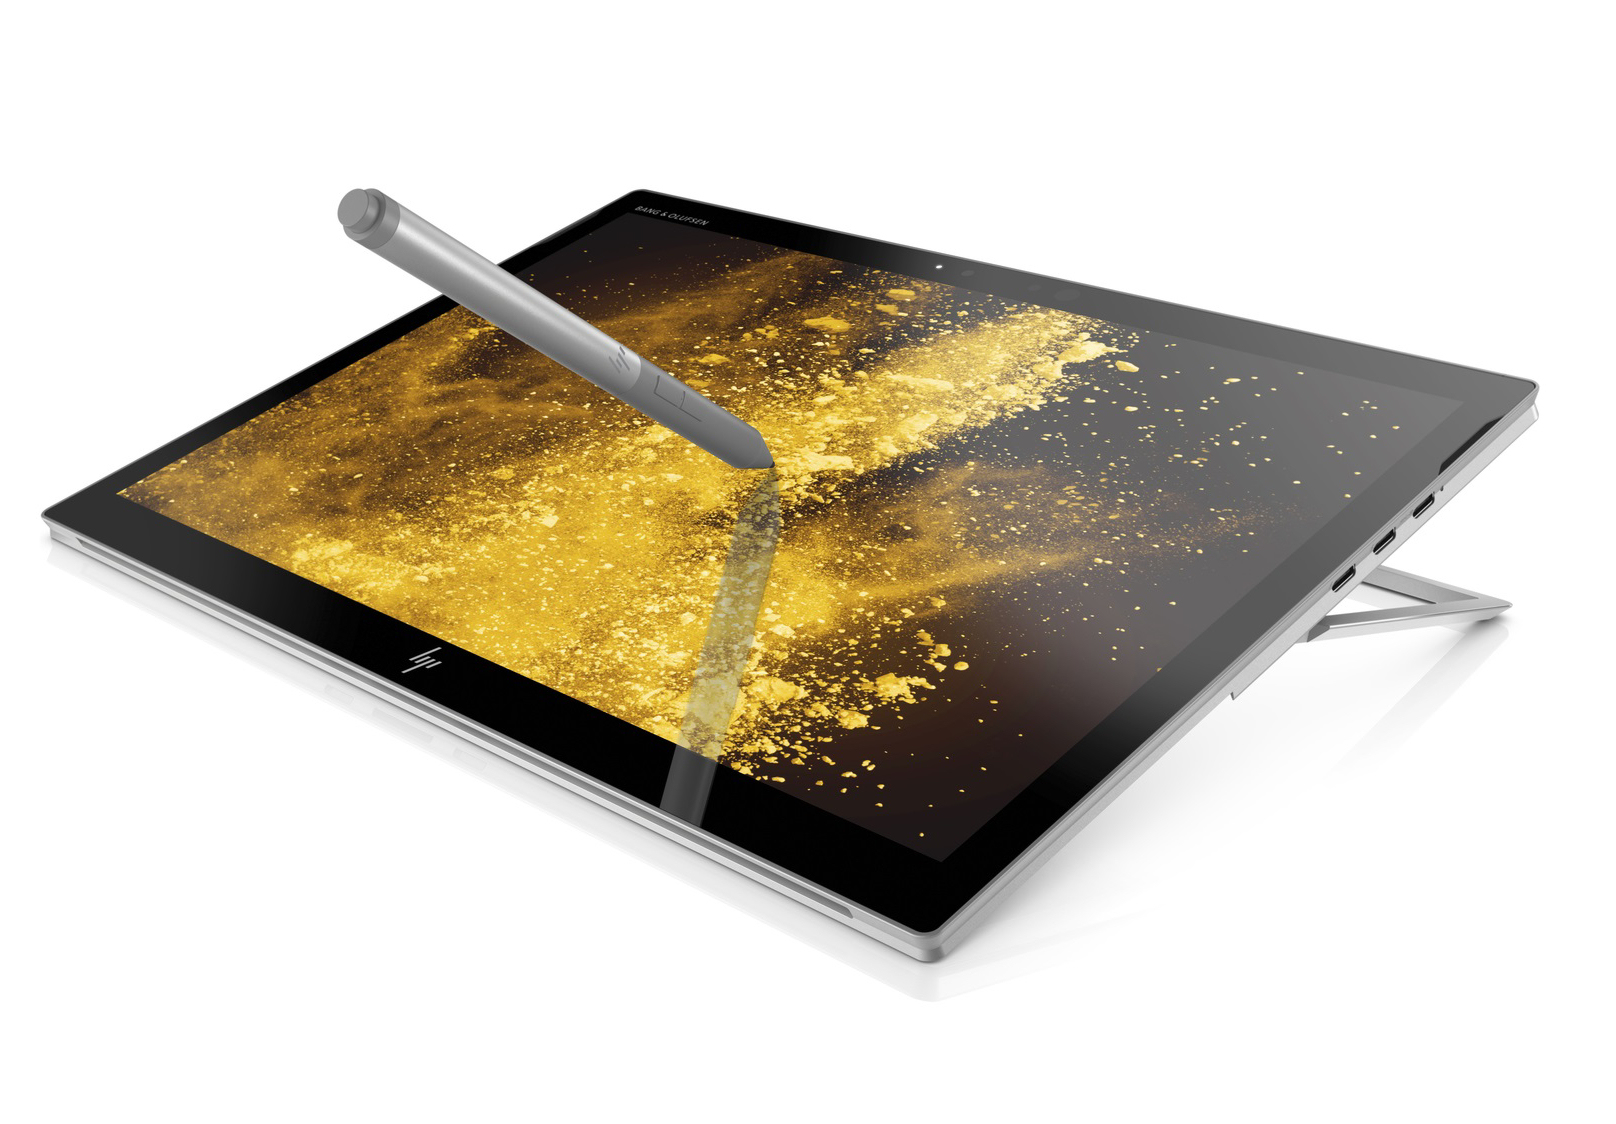
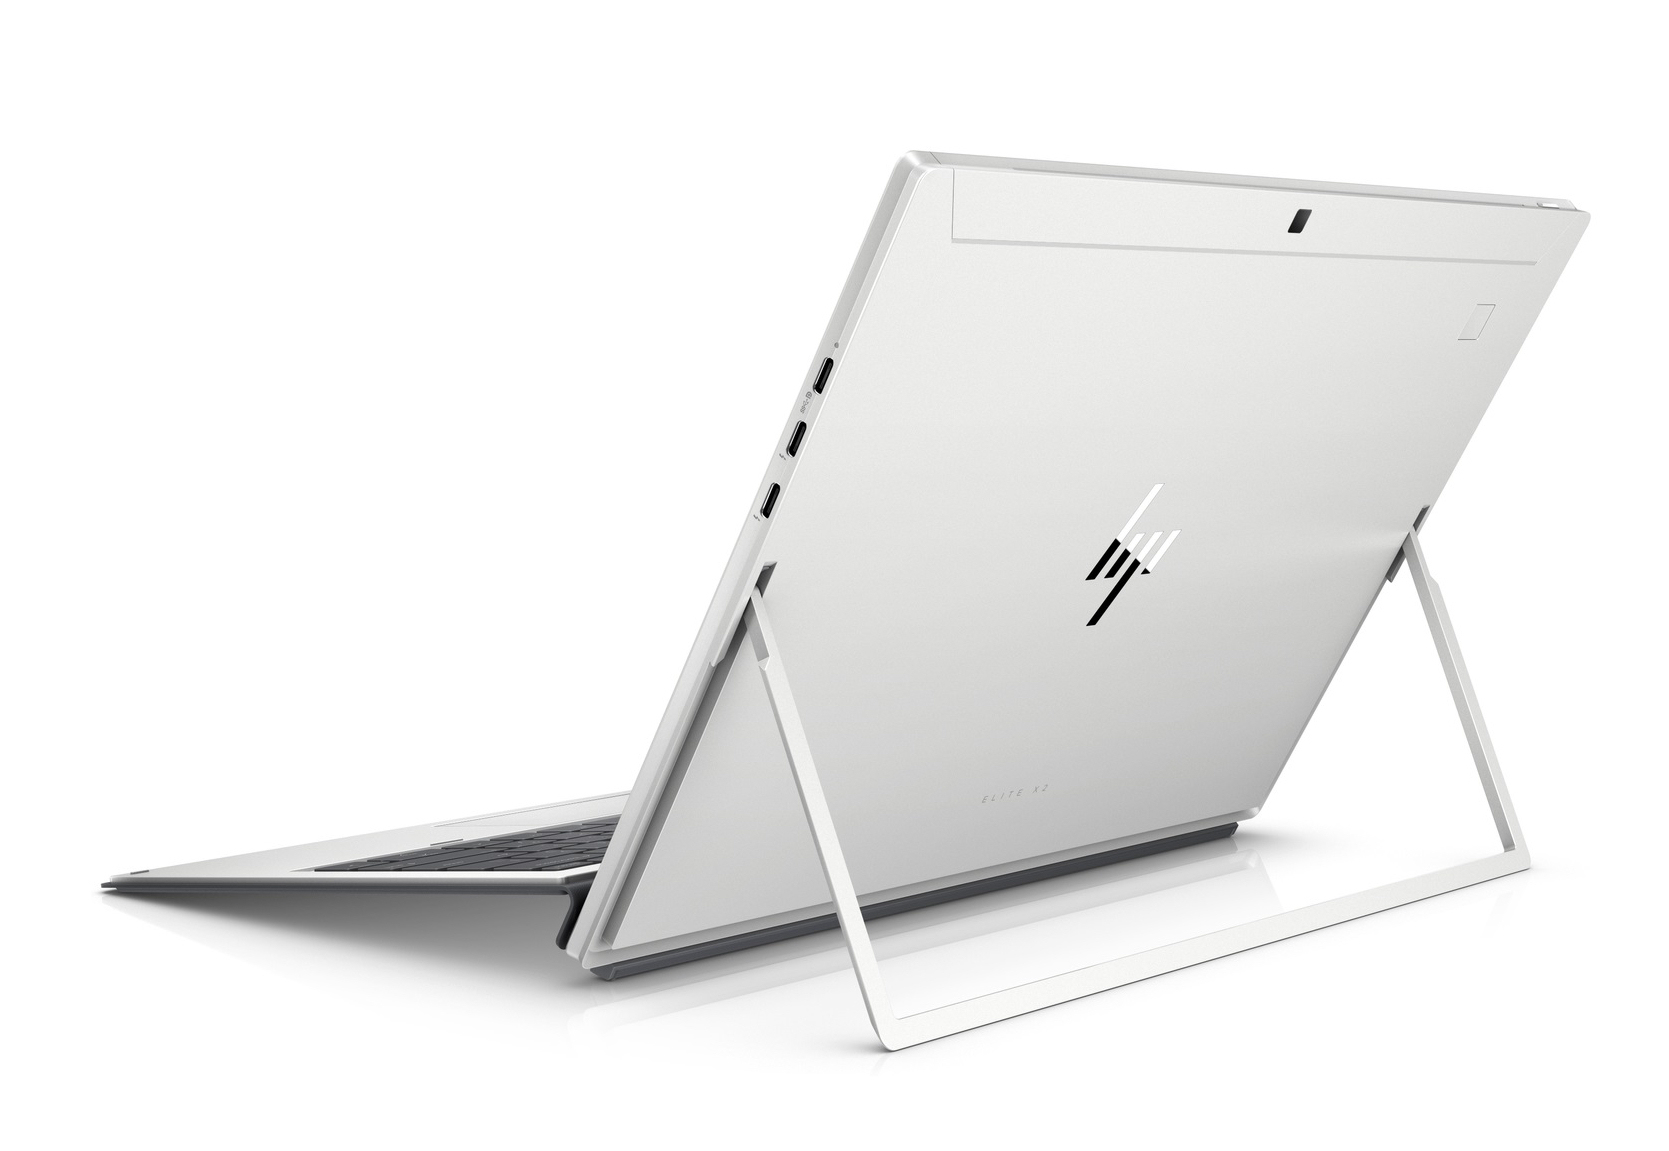
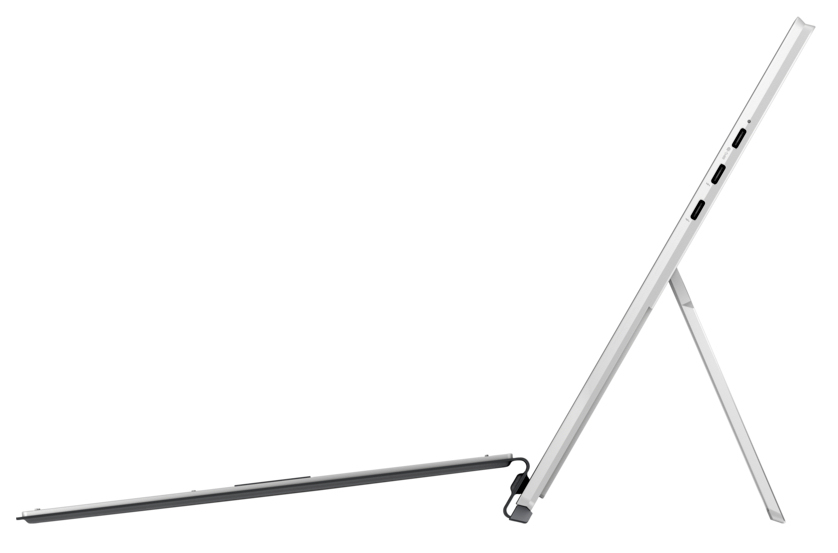
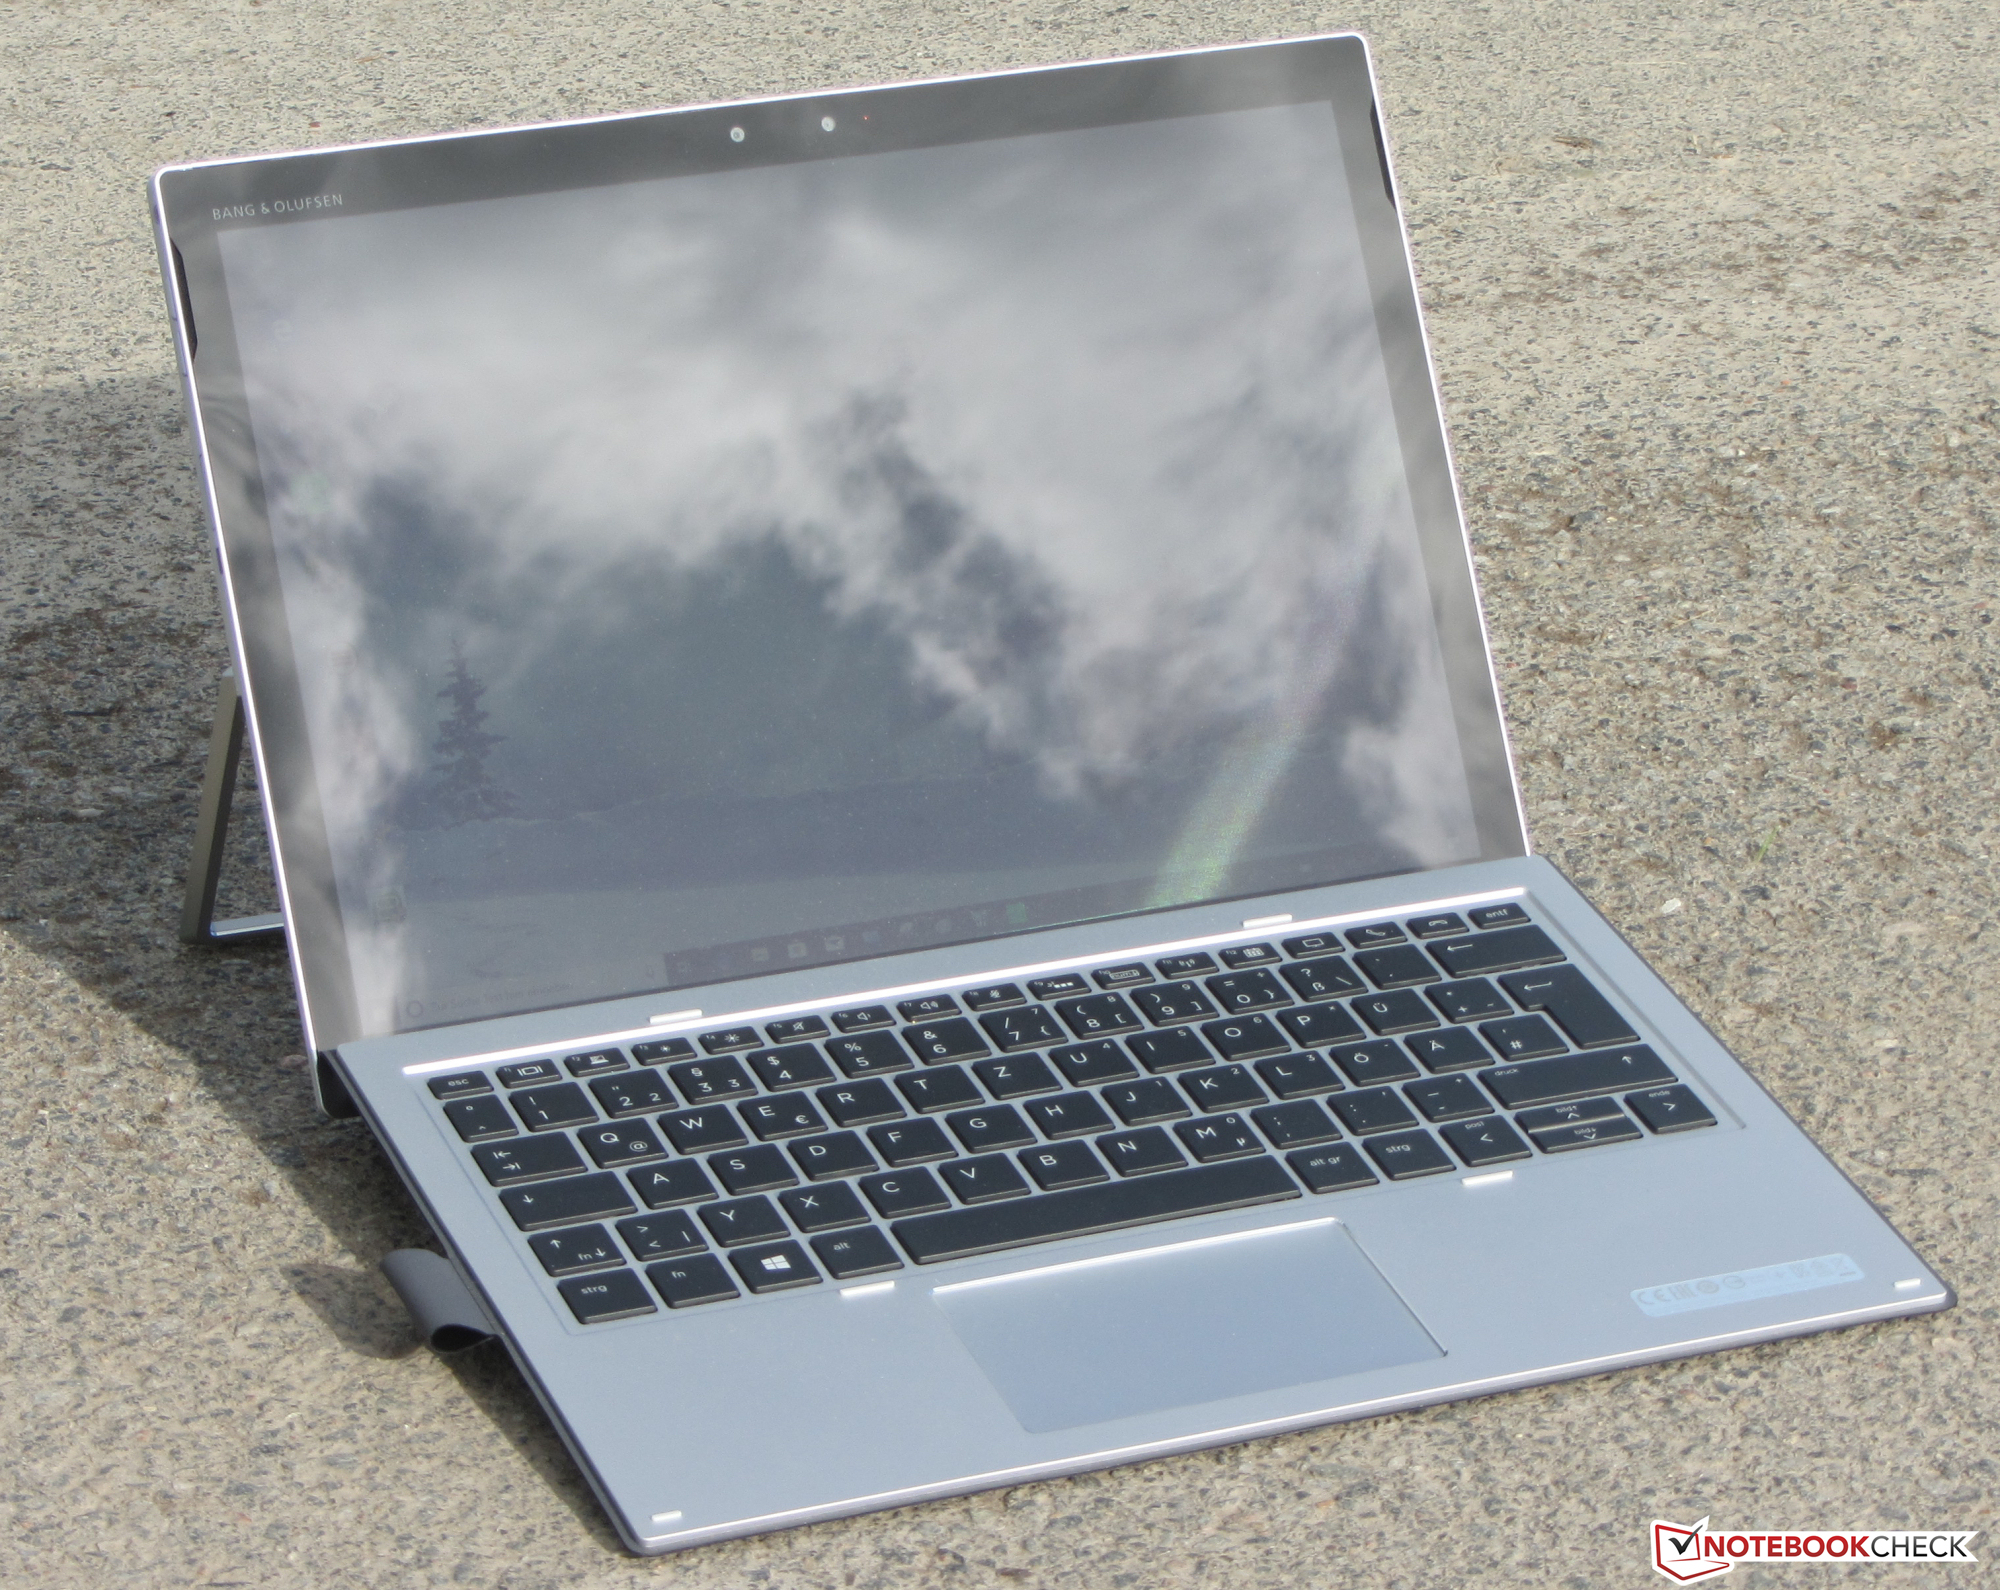
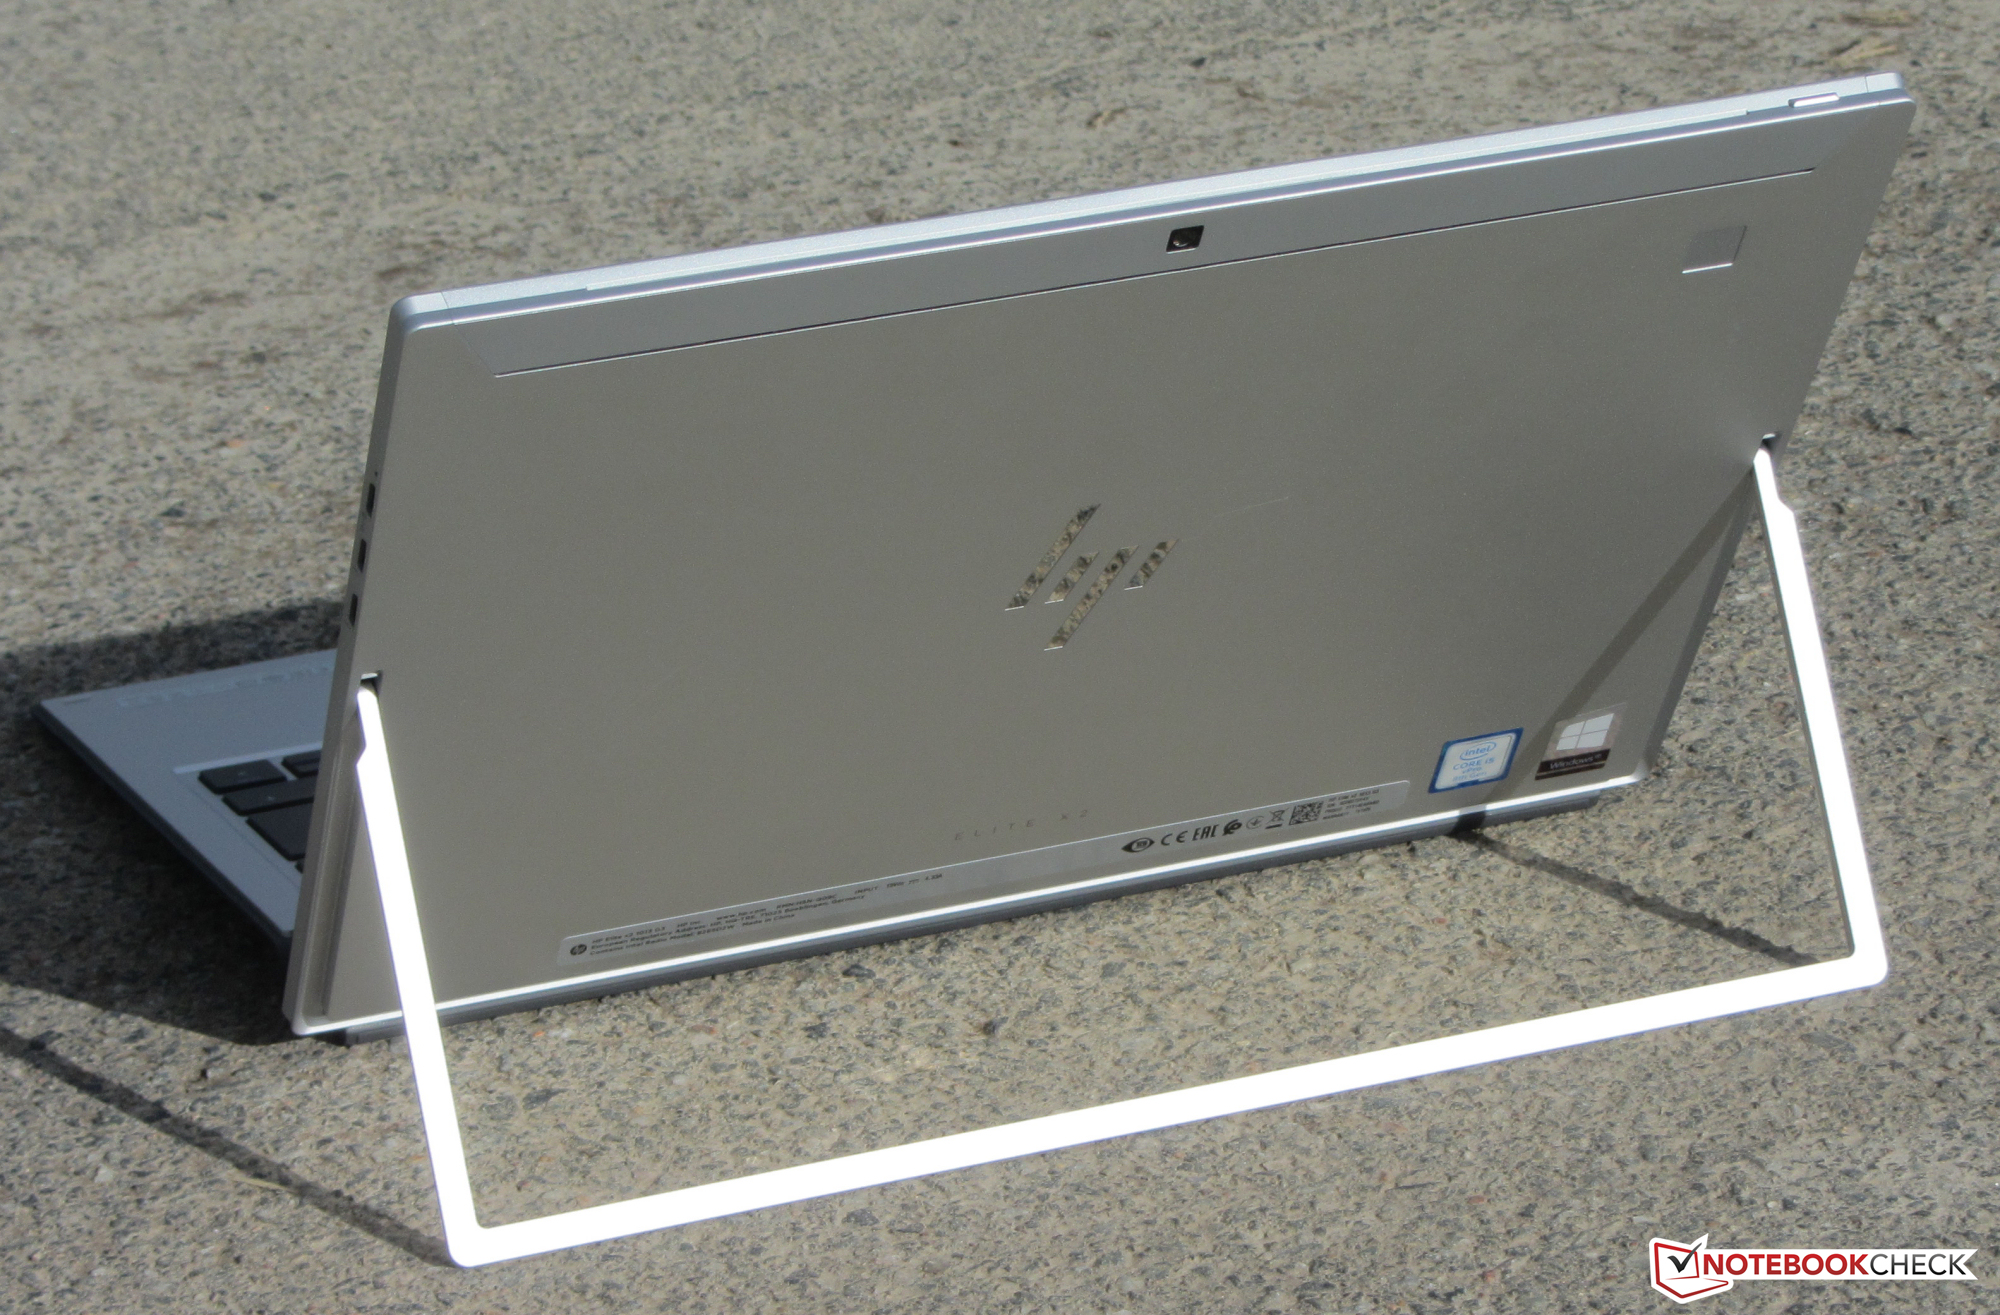
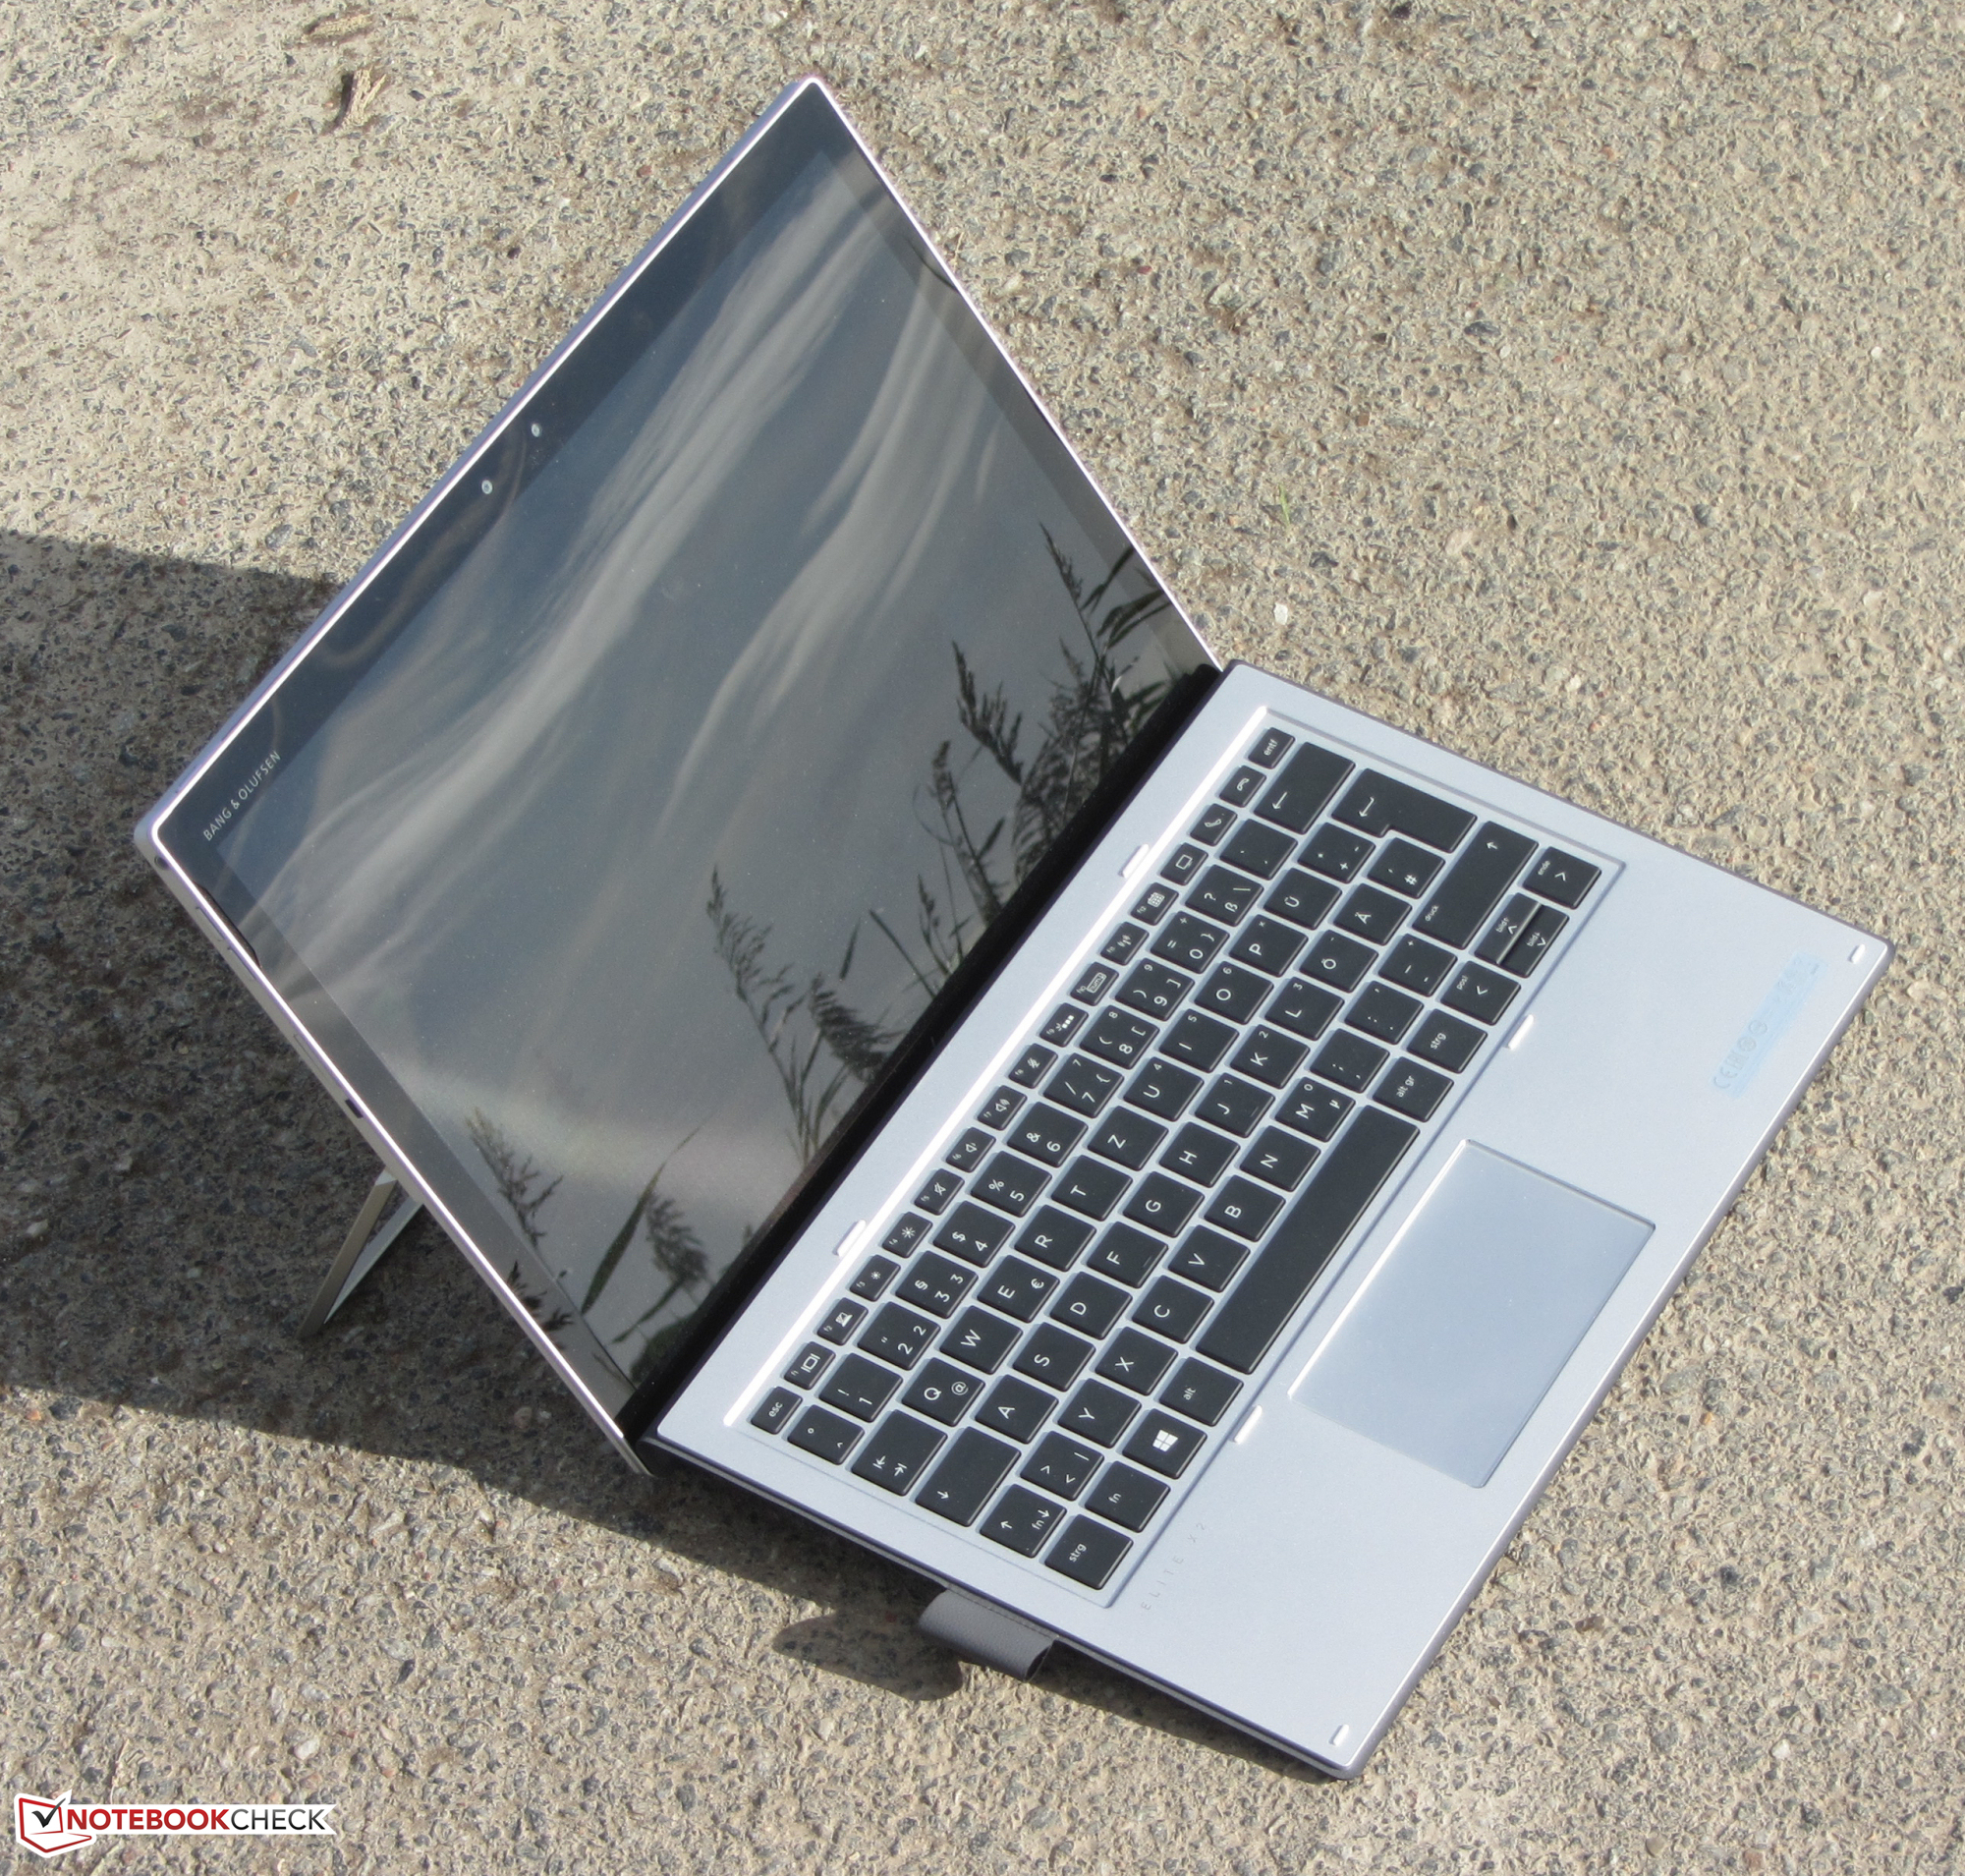
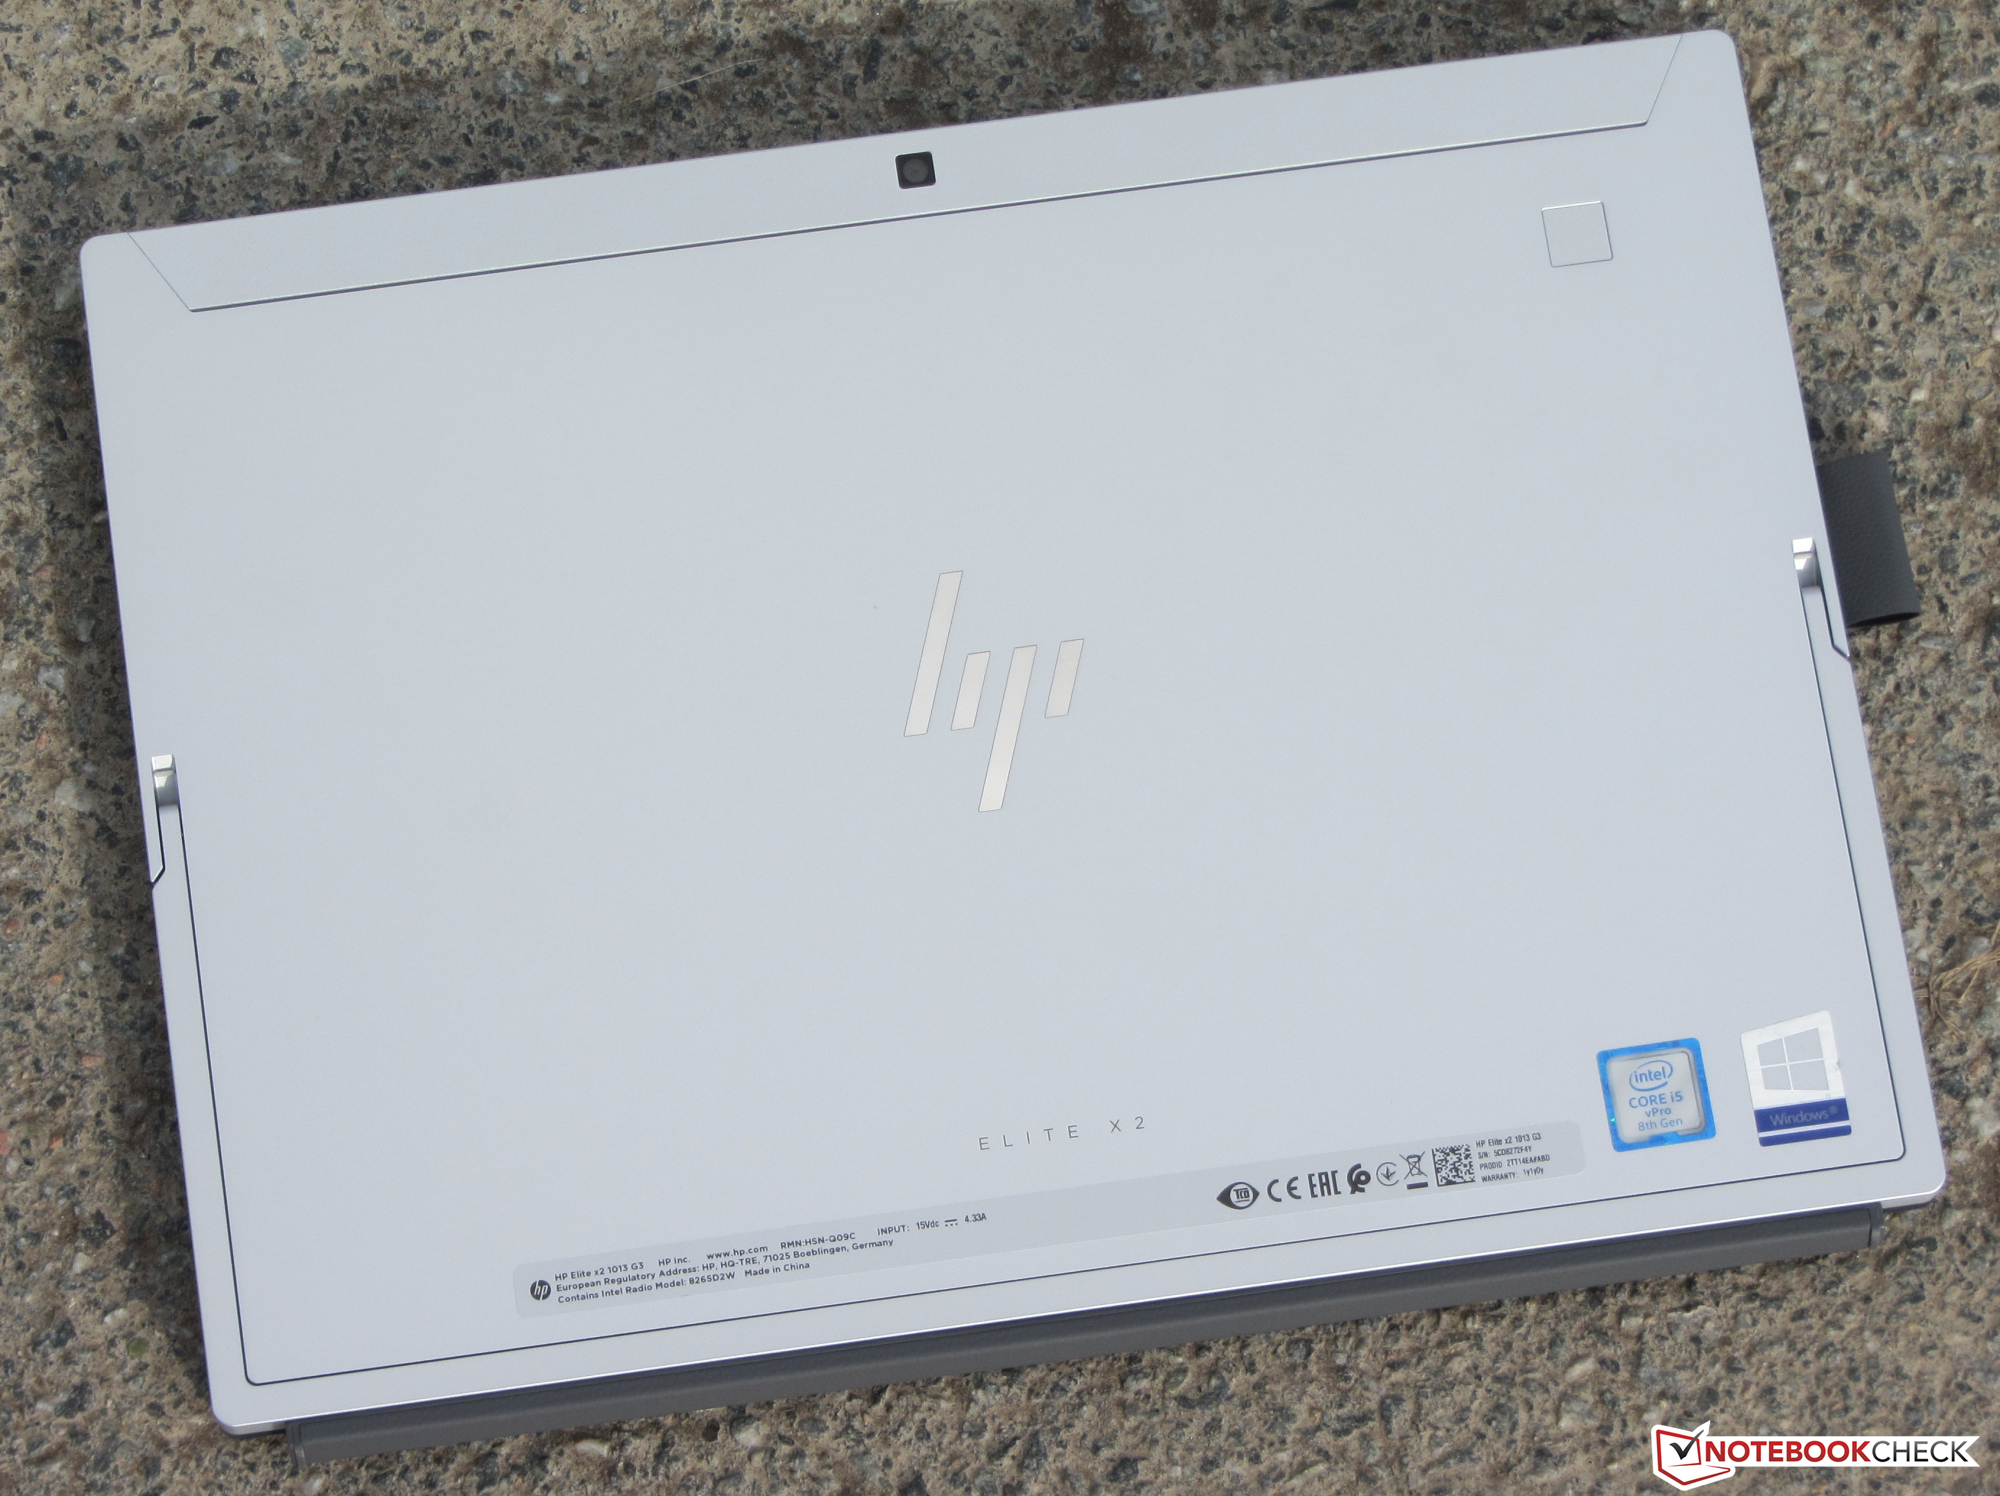
HP’s Elite x2 1013 G3 is een 13-inch 2-in-1-toestel dat vooral bedoeld is voor zakelijke klanten. Het is de opvolger van de Elite x2 1012 G2. Aangezien de 1013 G3 volledig herontworpen is, hebben de twee weinig gemeen. Subjectief gezien is het nieuwe toestel eleganter en dunner dan zijn voorganger.
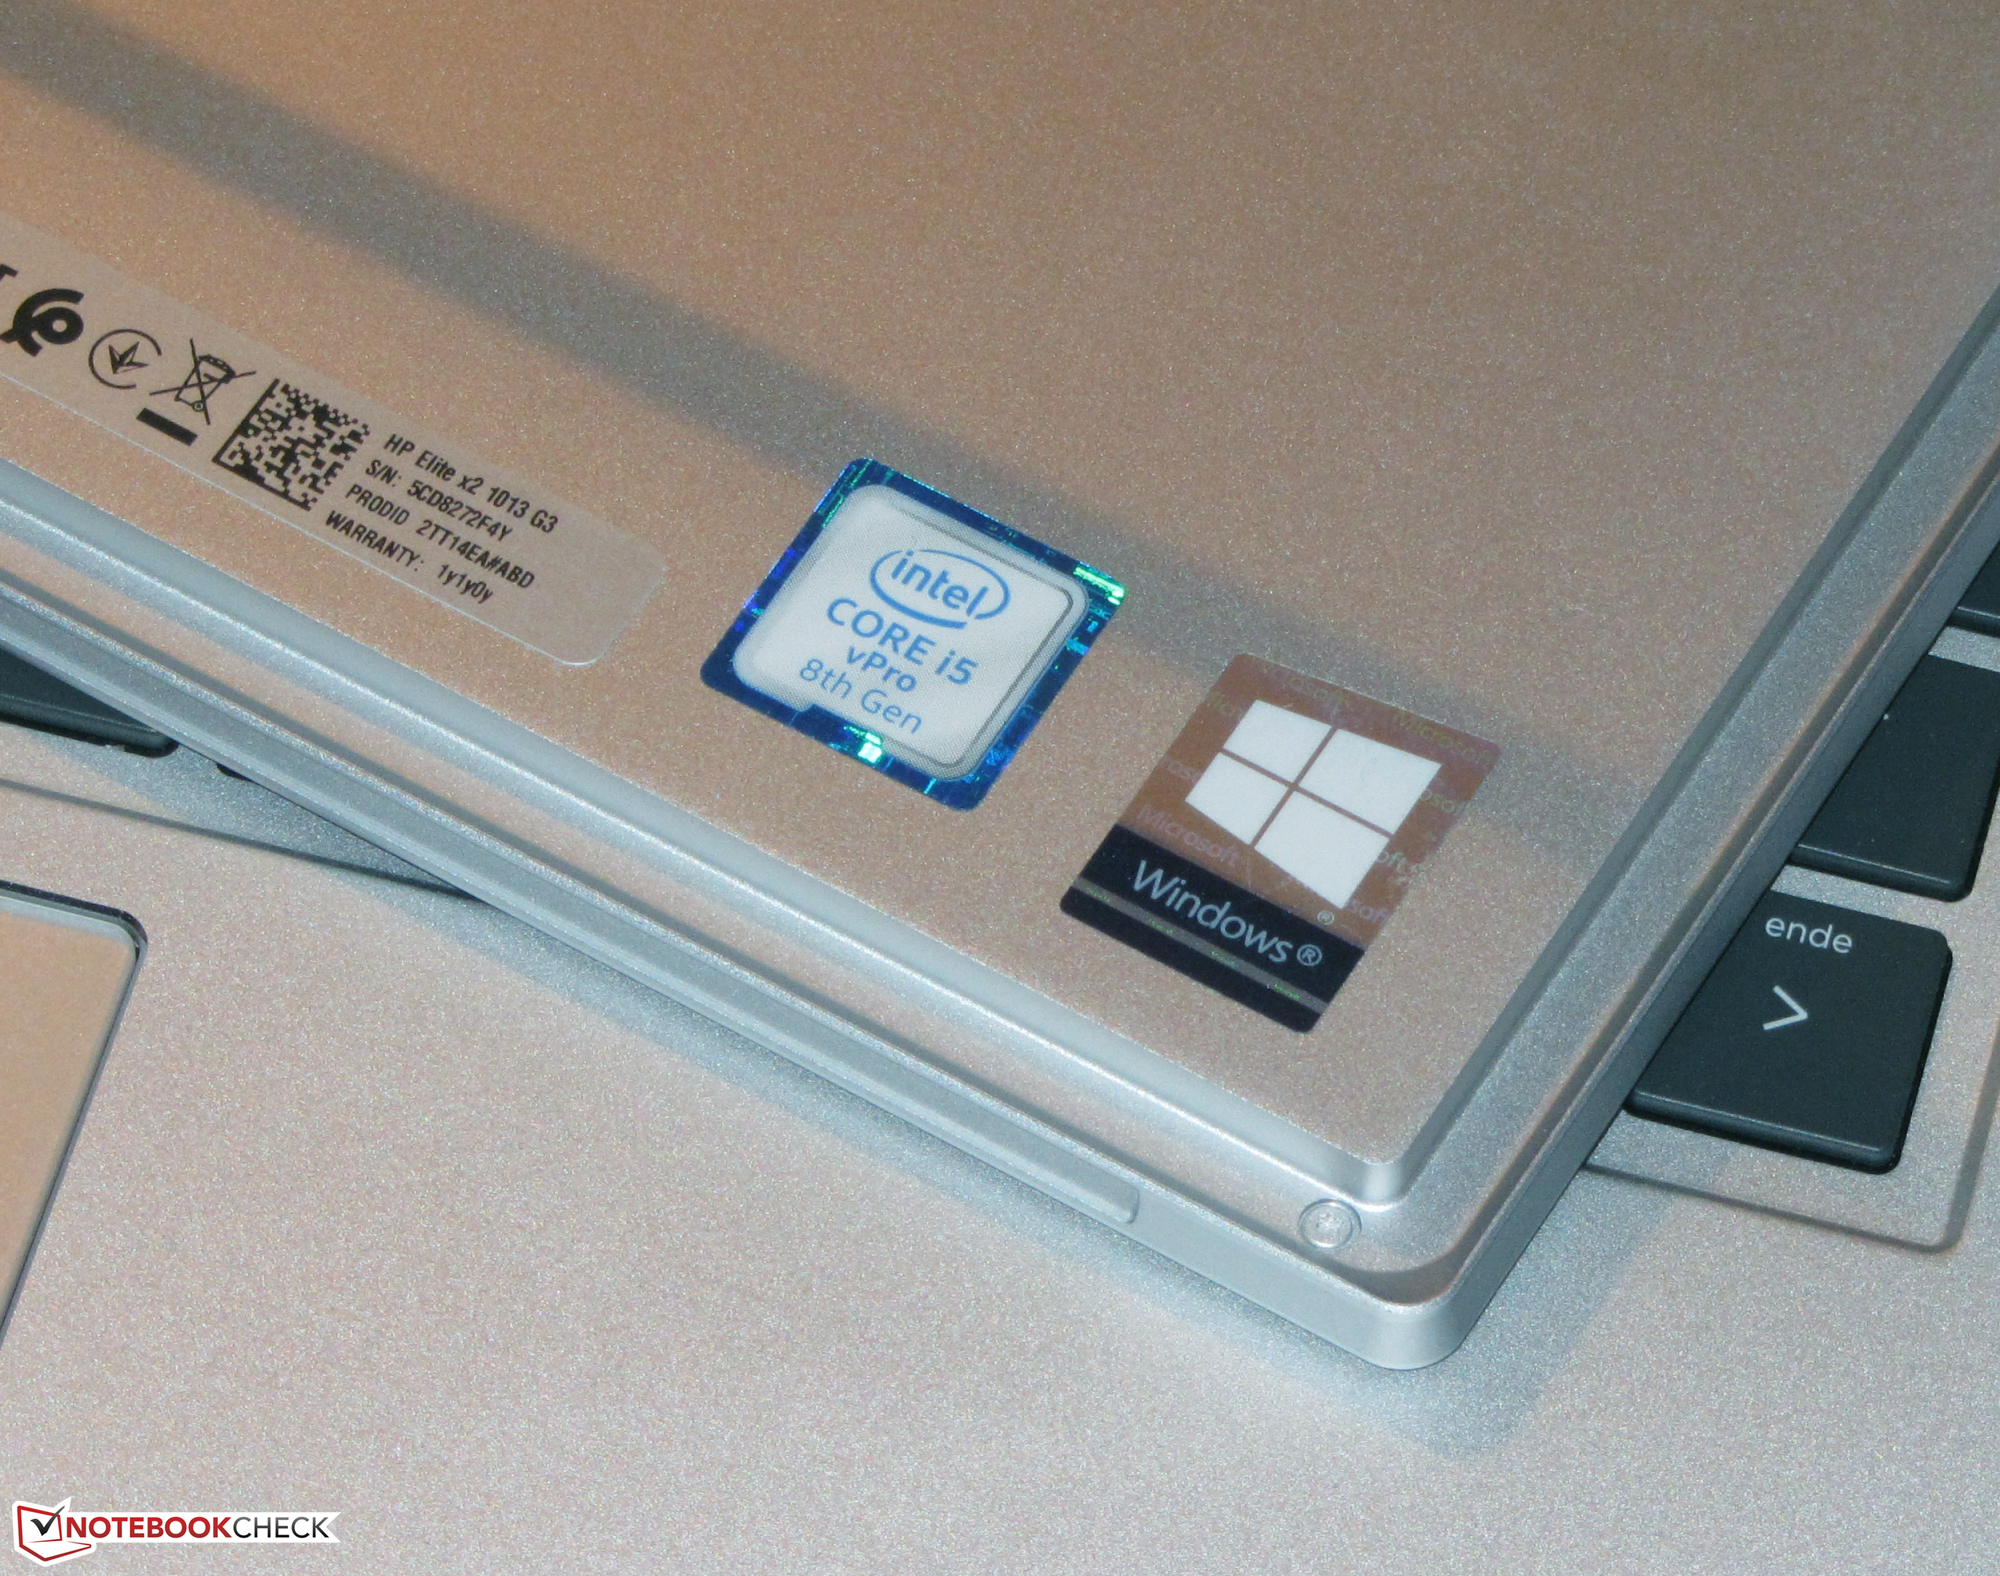
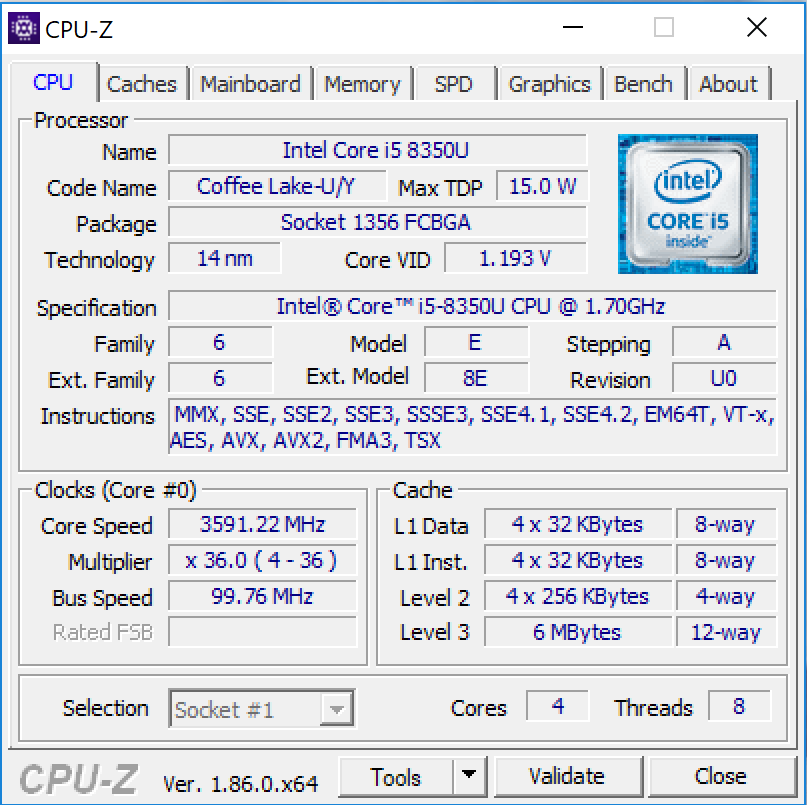
De G3 wordt aangedreven door een Core i5-8350U-CPU die meer dan krachtig genoeg is voor alledaagse kantoor- en Internet-gebaseerde taken. Het toestel blijft erg stil, onafhankelijk van de belasting, en redelijk koel bij alledaags gebruik. Snelheid is geen probleem dankzij zijn NVMe-SSD, die ook vervangen kan worden.
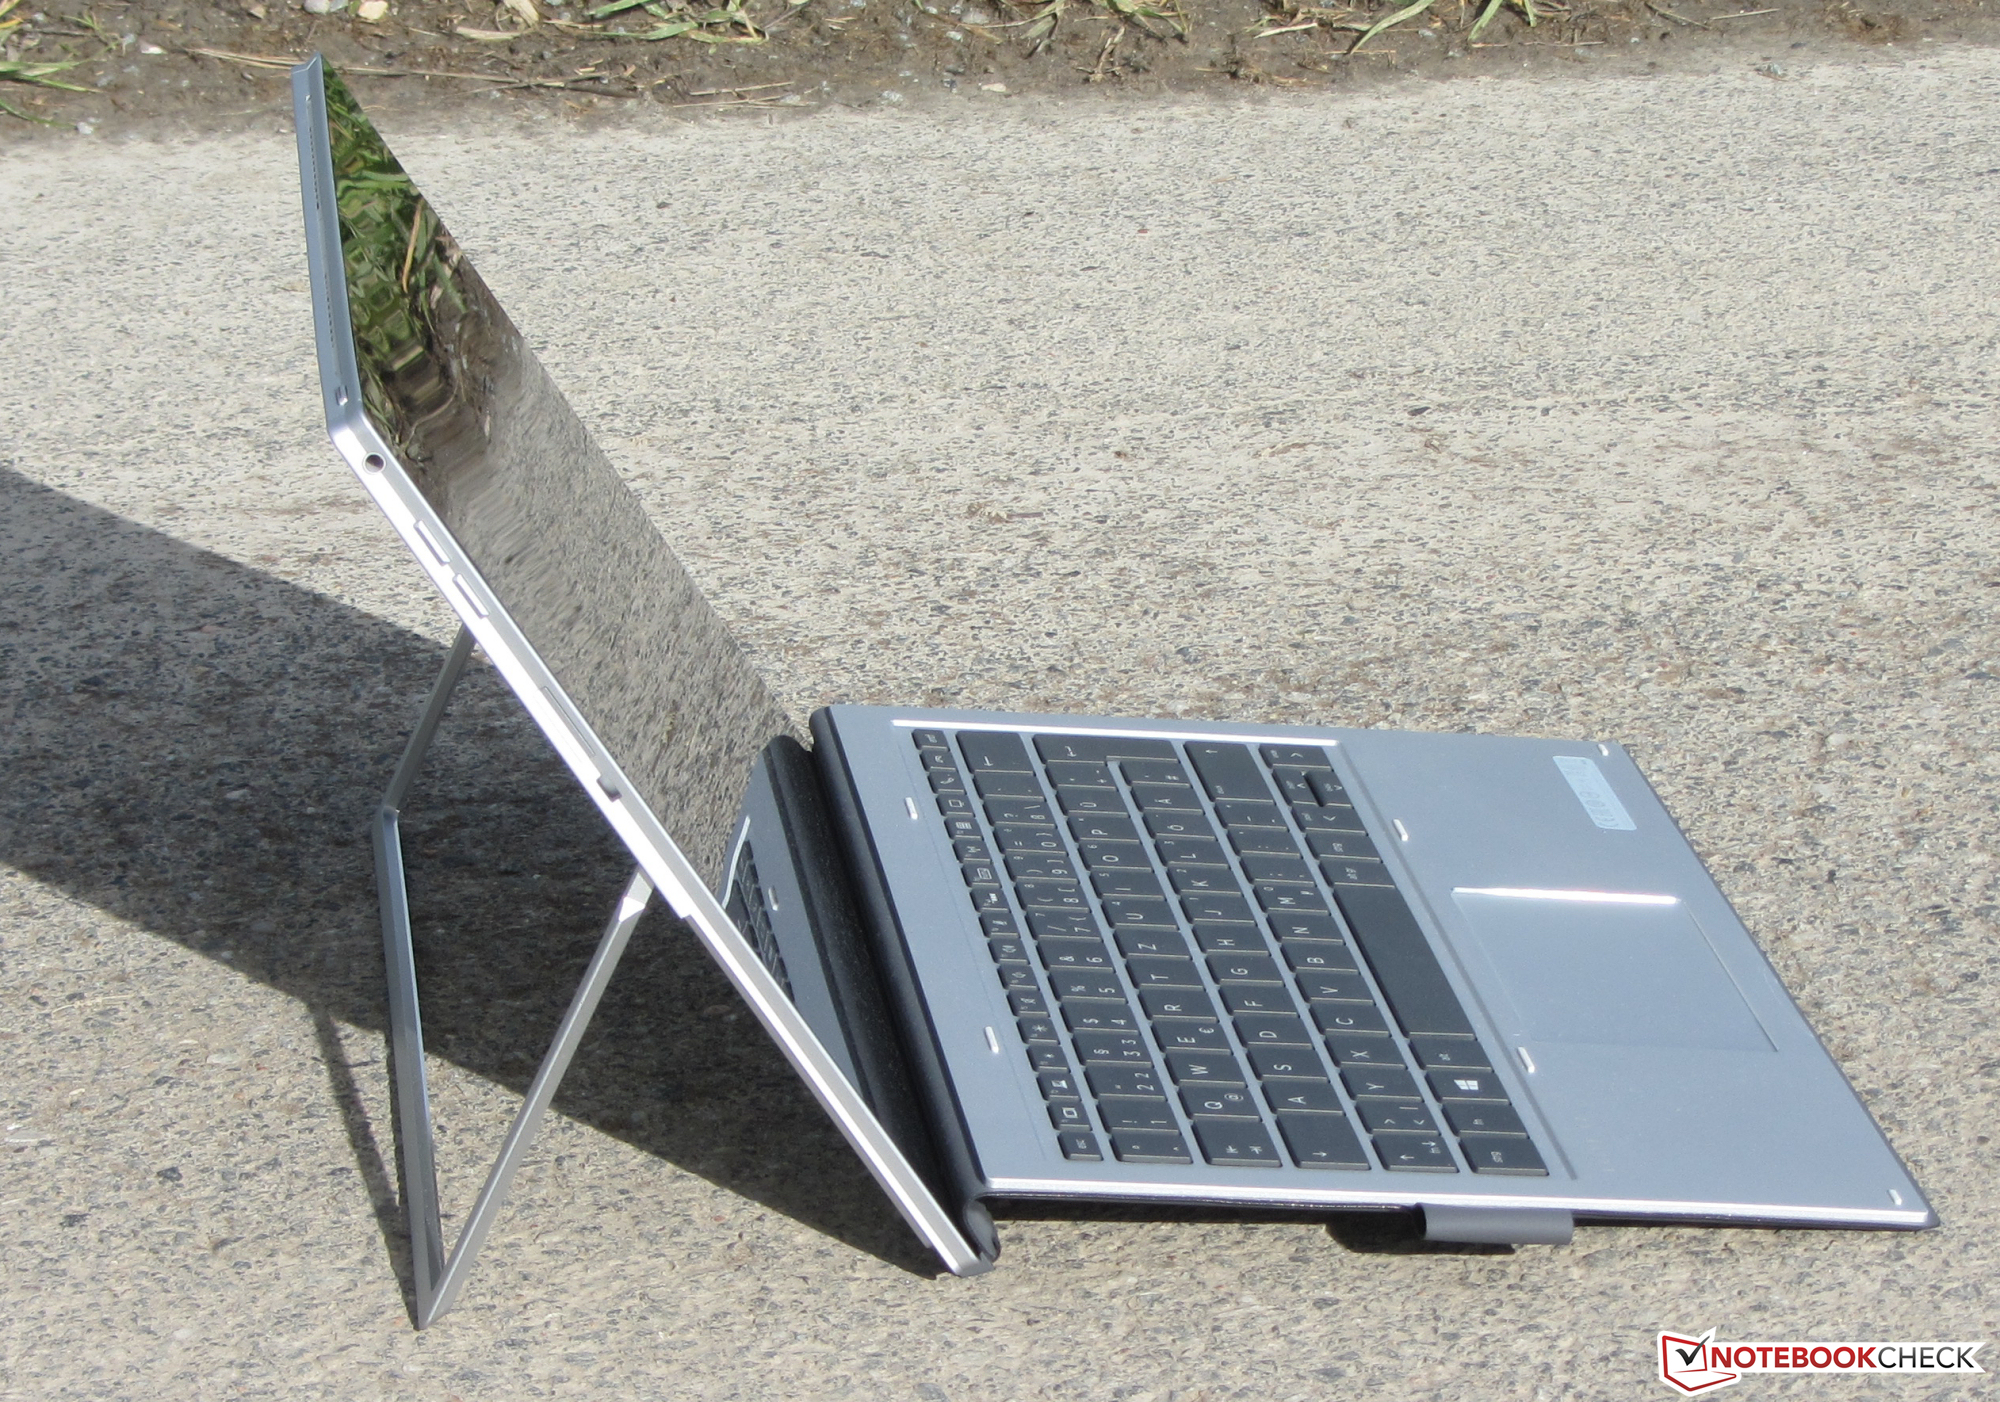
HP’s Elite x2 1013 G3 is degelijk 2-in-1-toestel. We hebben slechts enkele punten van kritiek. Zo zouden we voor de hoge prijs van bijna 2000 euro graag een LTE-modem hebben gezien.
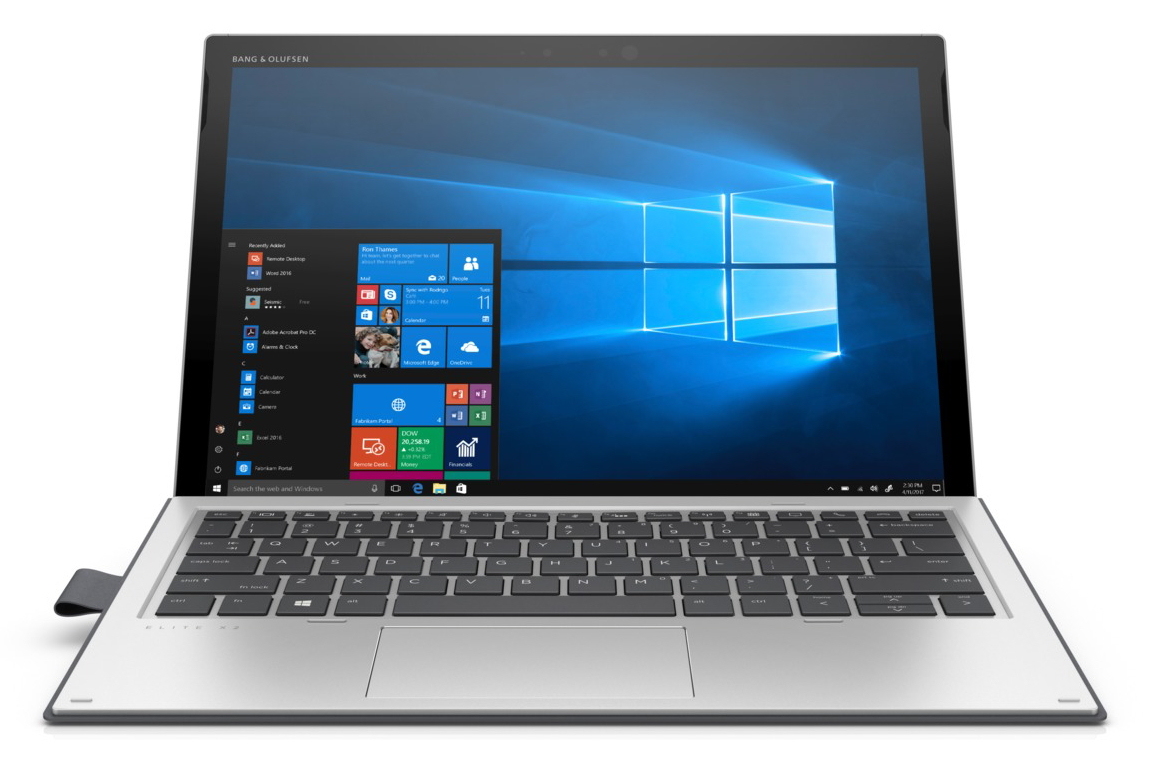
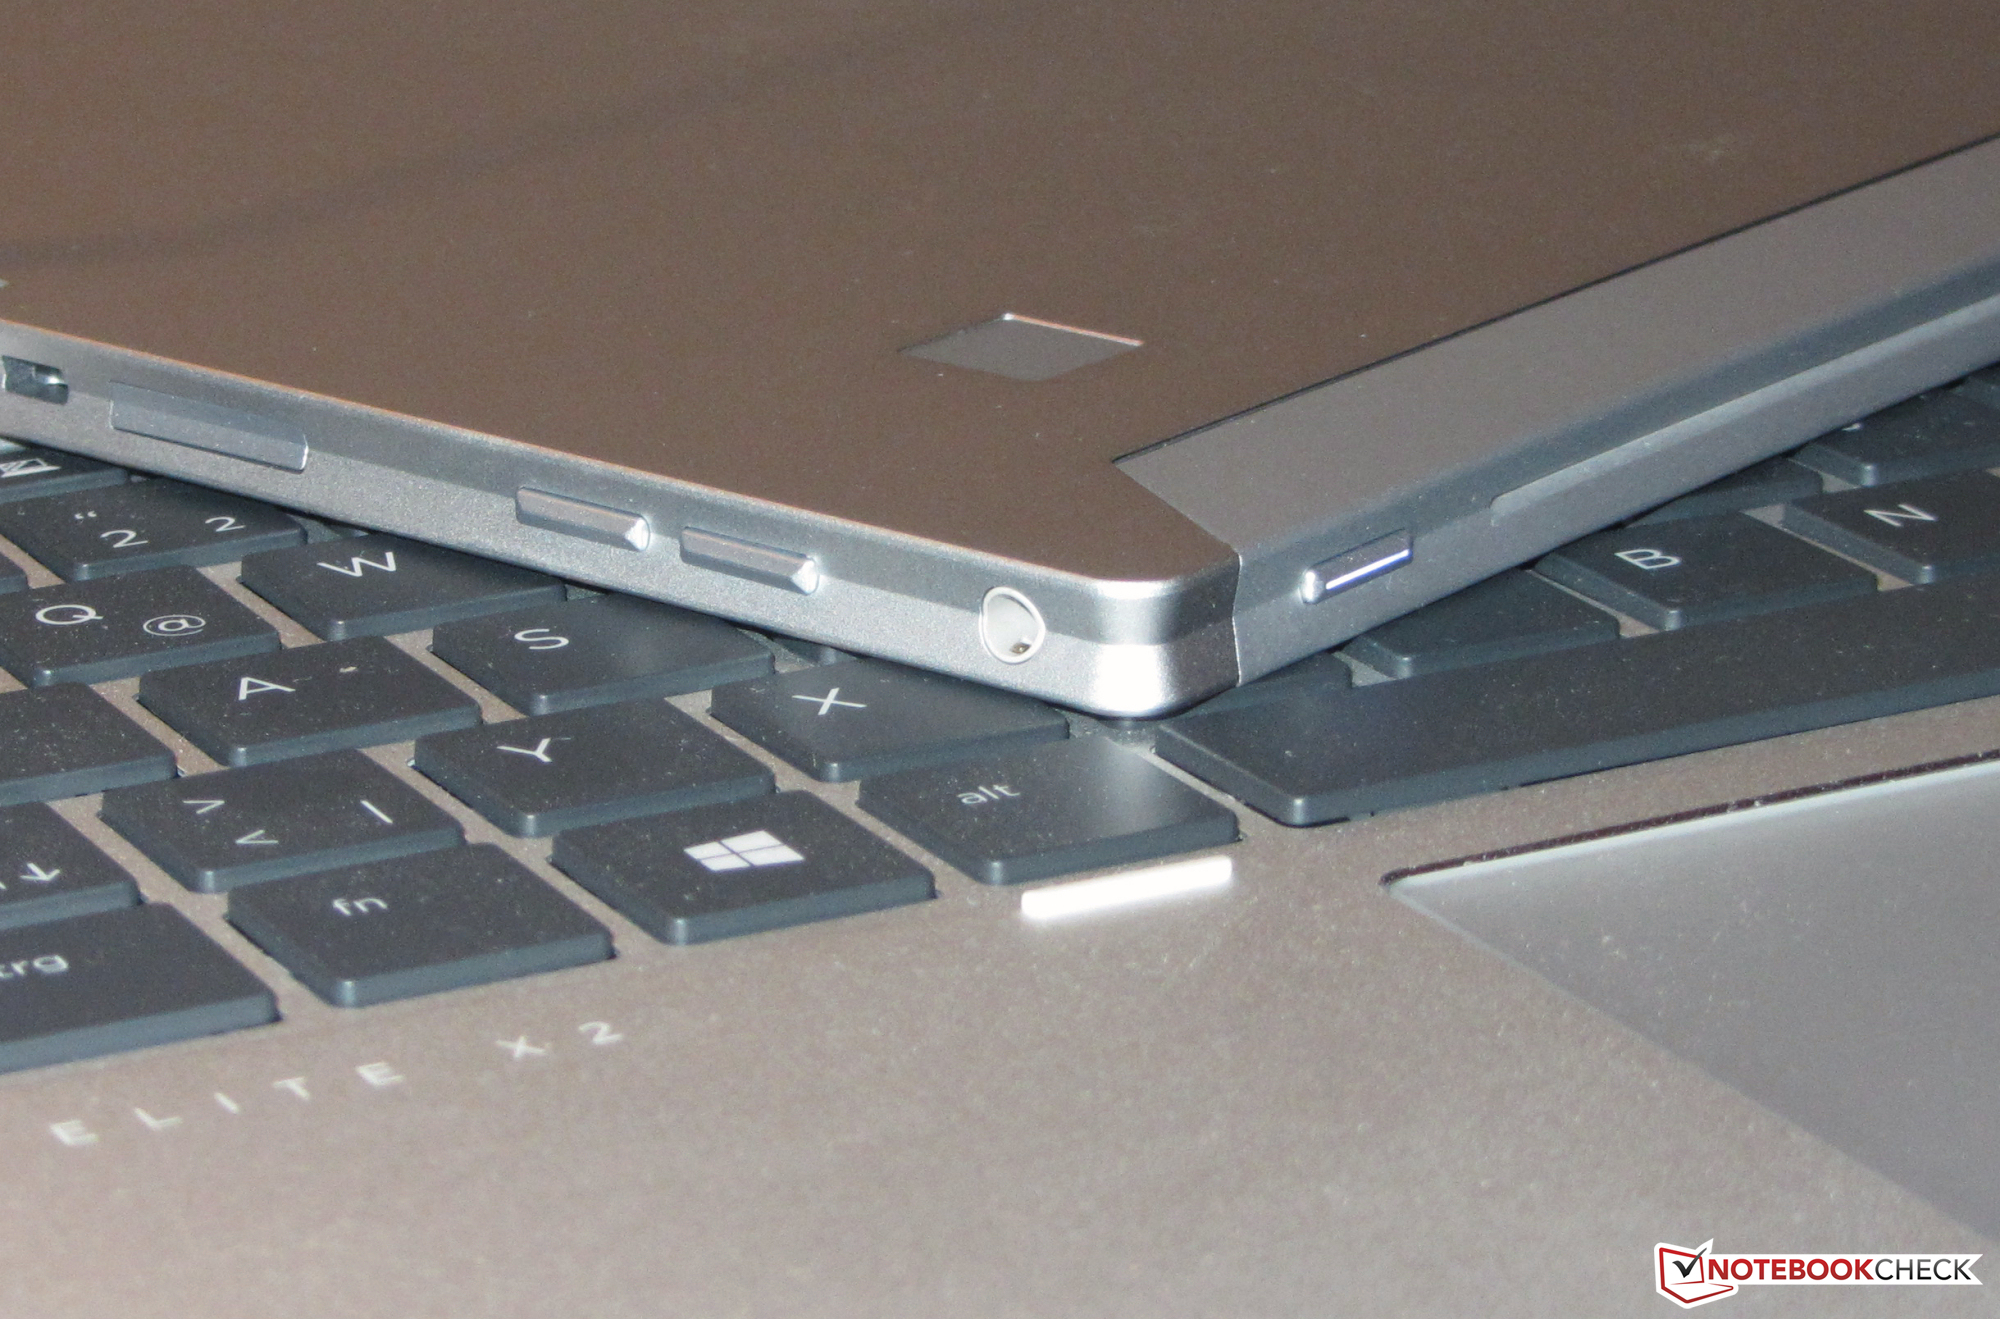
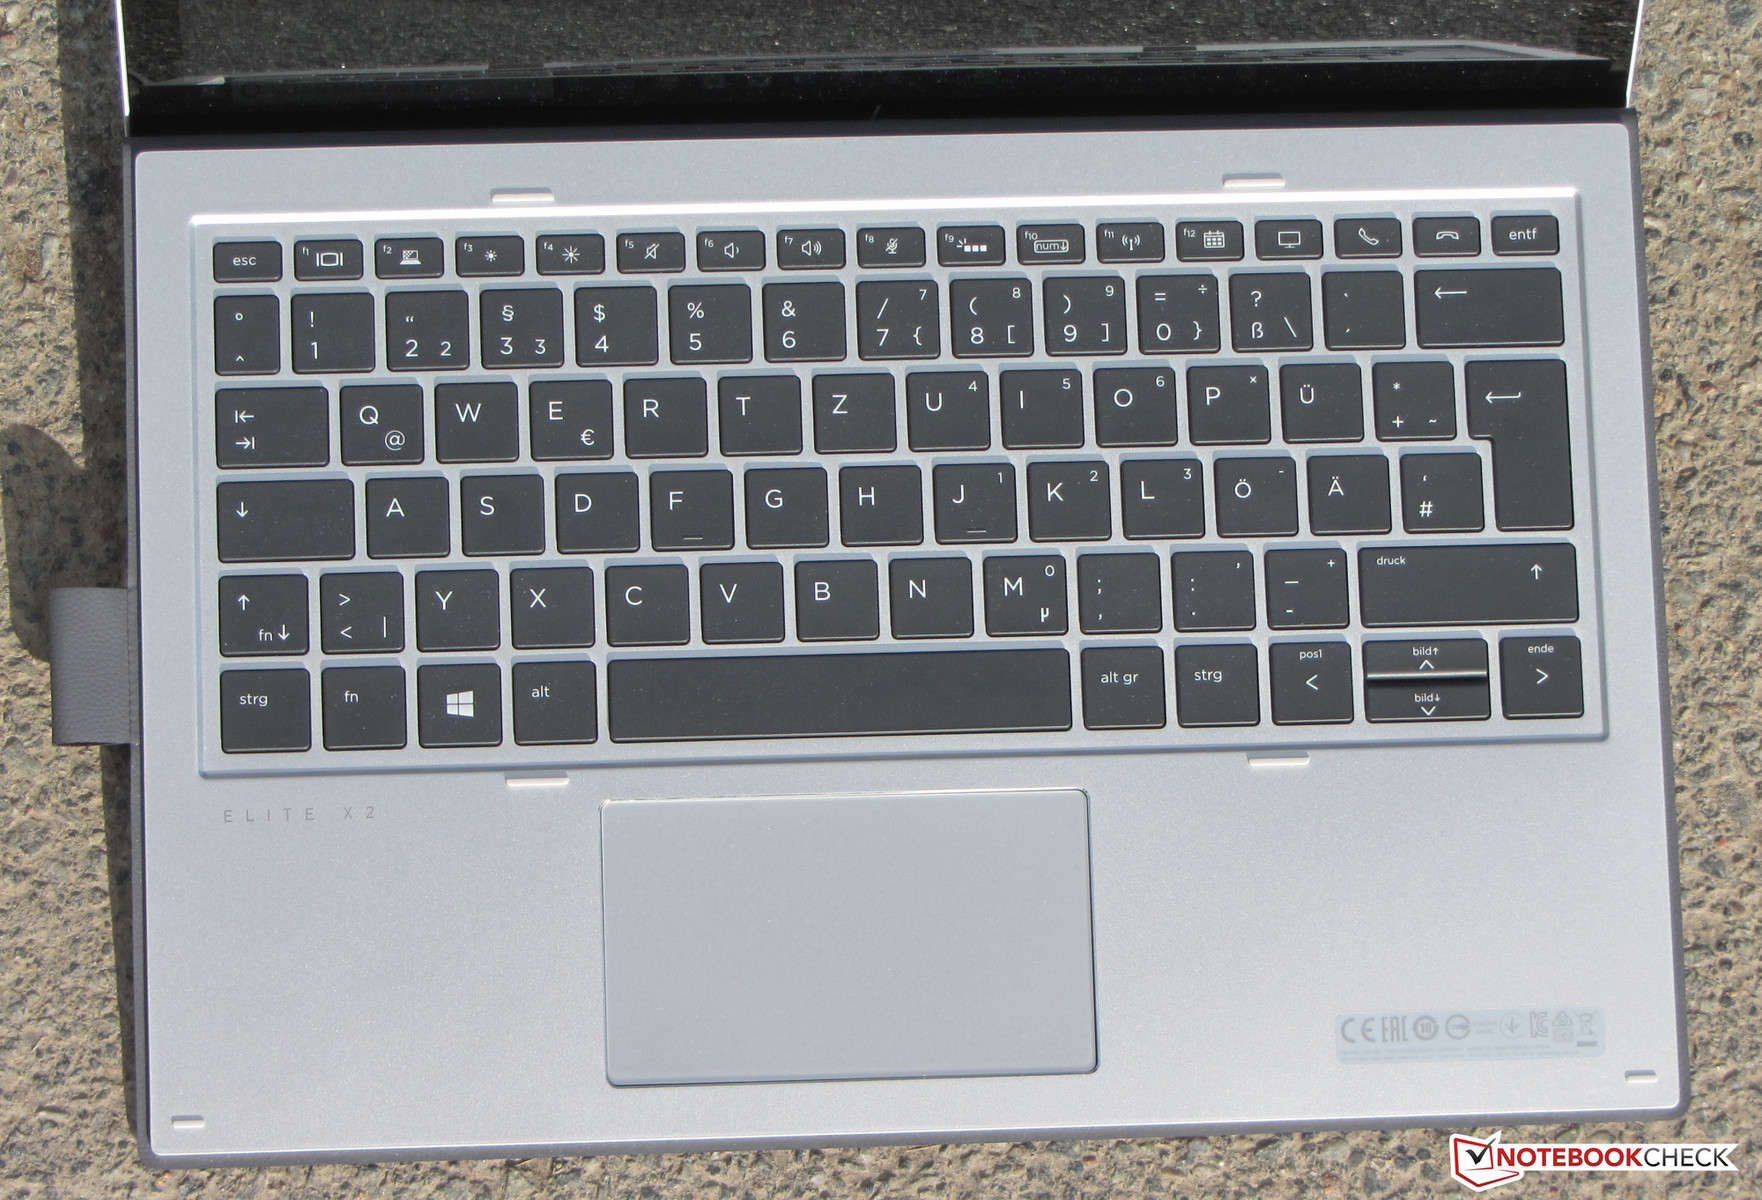
De inbegrepen toetsenbord-dock werkte erg goed. Het toetsenbord typt erg vlot en was zelfs geschikt voor langdurige typ-sessies. De toetsenbordverlichting is eveneens een pluspunt. Batterijduur was degelijk. De Surface Pro (2017) heeft in dit opzicht heel wat meer te bieden.
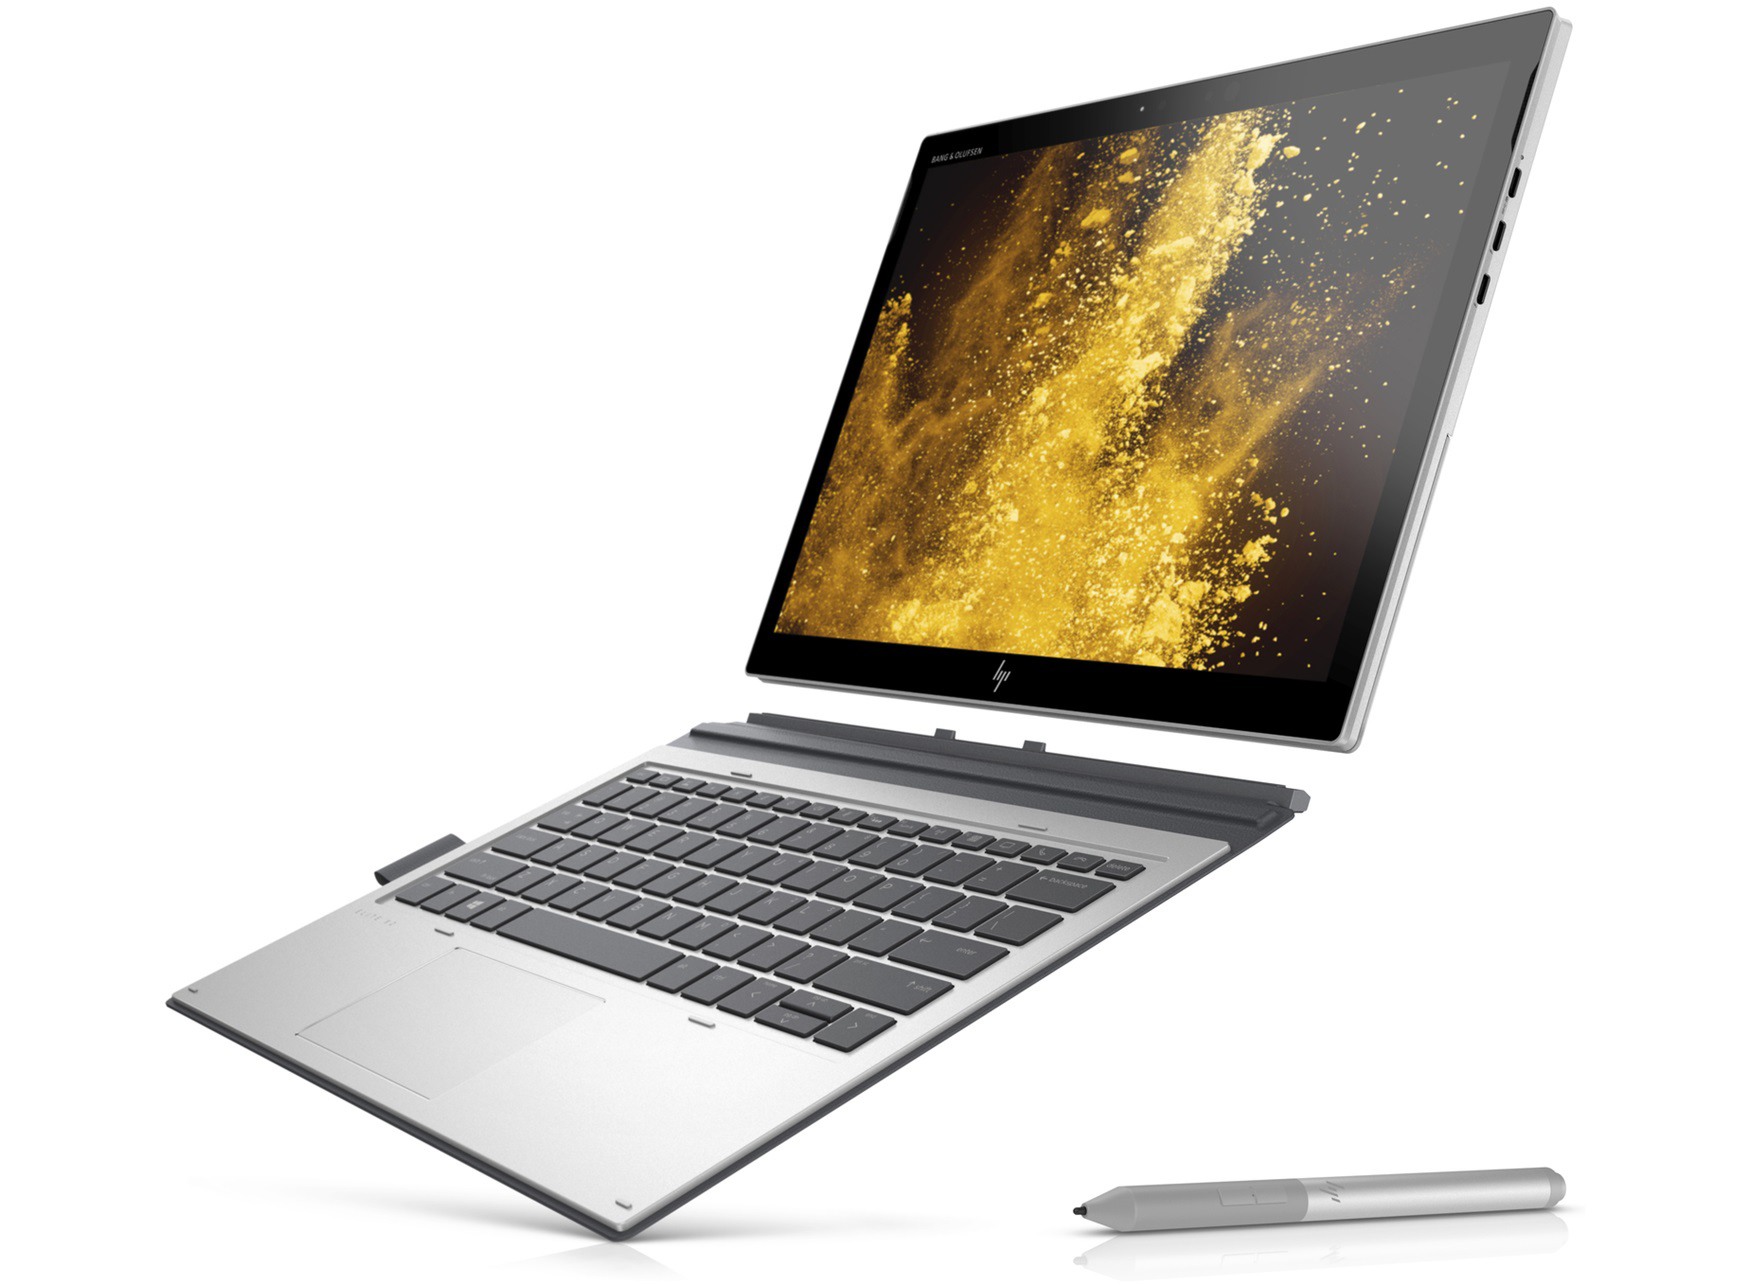
Het 13-inch 3:2 scherm was erg helder en bood een hoog contrast en wijde kijkhoeken. Het touchscreen biedt ondersteuning voor input van zowel vingers als stylus. Ons testtoestel miste een LTE-modem, maar had wel ondersteuning voor WWAN. In andere woorden: een LTE-modem kan achteraf nog toegevoegd worden.
HP Elite x2 1013 G3-2TT14EA
-
17-10-2019 v7
Sascha Mölck
Pricecompare
