 Deutsch
 English
 Español
 Français
 Italiano
 Nederlands
 Polski
 Português
 Русский
 Türkçe
 Svenska
 Chinese
 Magyar
Kort testrapport Dell Latitude 14 E5470 6440HQ Notebook

| SD Card Reader | |
| average JPG Copy Test (av. of 3 runs) | |
| Dell Latitude 14 E5470 | |
| Dell Latitude 14 E5470 | |
| HP ProBook 440 G4-Y8B51EA | |
| Acer TravelMate P648-M-757N | |
| Lenovo ThinkPad T460-20FN003LGE | |
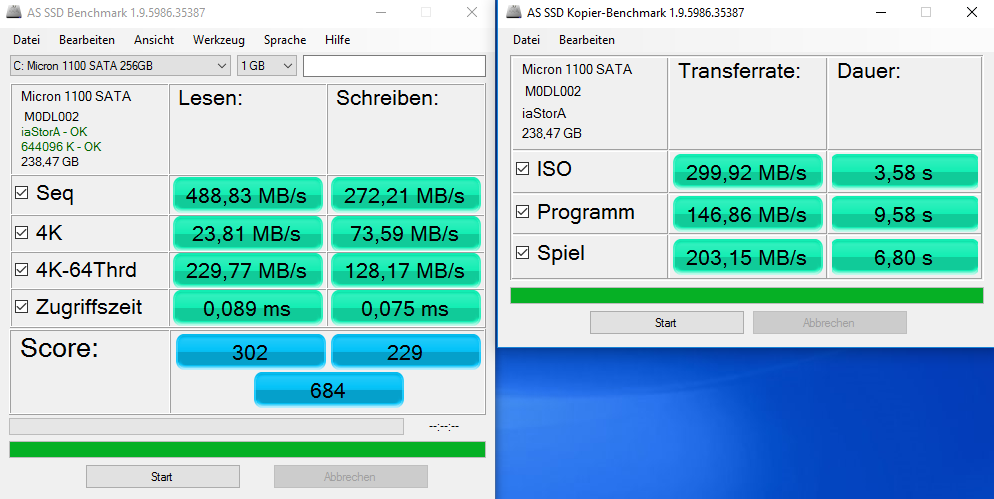
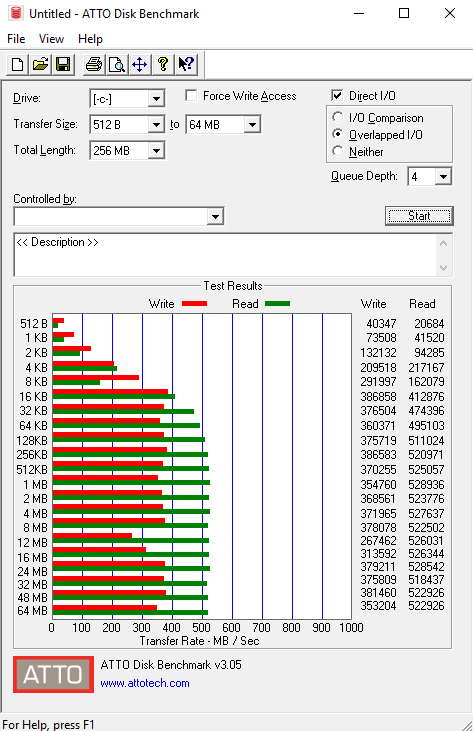
| maximum AS SSD Seq Read Test (1GB) | |
| Dell Latitude 14 E5470 | |
| Dell Latitude 14 E5470 | |
| Lenovo ThinkPad T460-20FN003LGE | |
| HP ProBook 440 G4-Y8B51EA | |
| Networking | |
| iperf3 transmit AX12 | |
| Lenovo IdeaPad 710S Plus-13IKB | |
| Dell Vostro 15-5568 | |
| Dell Latitude 14 E5470 (jseb) | |
| HP Pavilion 14-al103ng | |
| iperf3 receive AX12 | |
| Dell Latitude 14 E5470 (jseb) | |
| Lenovo IdeaPad 710S Plus-13IKB | |
| Dell Vostro 15-5568 | |
| HP Pavilion 14-al103ng | |
| |||||||||||||||||||||||||
Helderheidsverdeling: 79 %
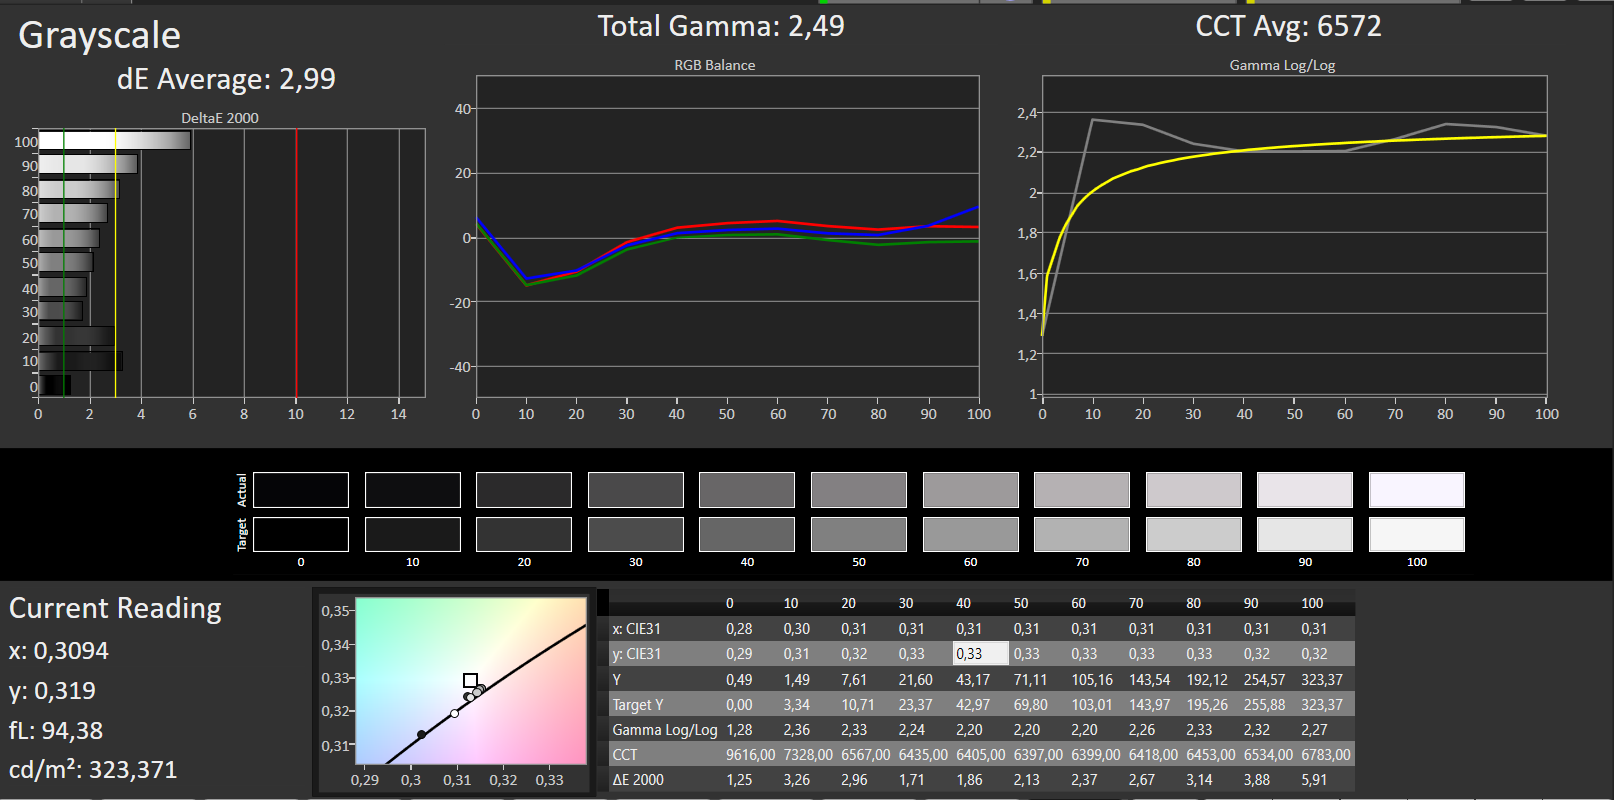
Helderheid in Batterij-modus: 323 cd/m²
Contrast: 567:1 (Zwart: 0.57 cd/m²)
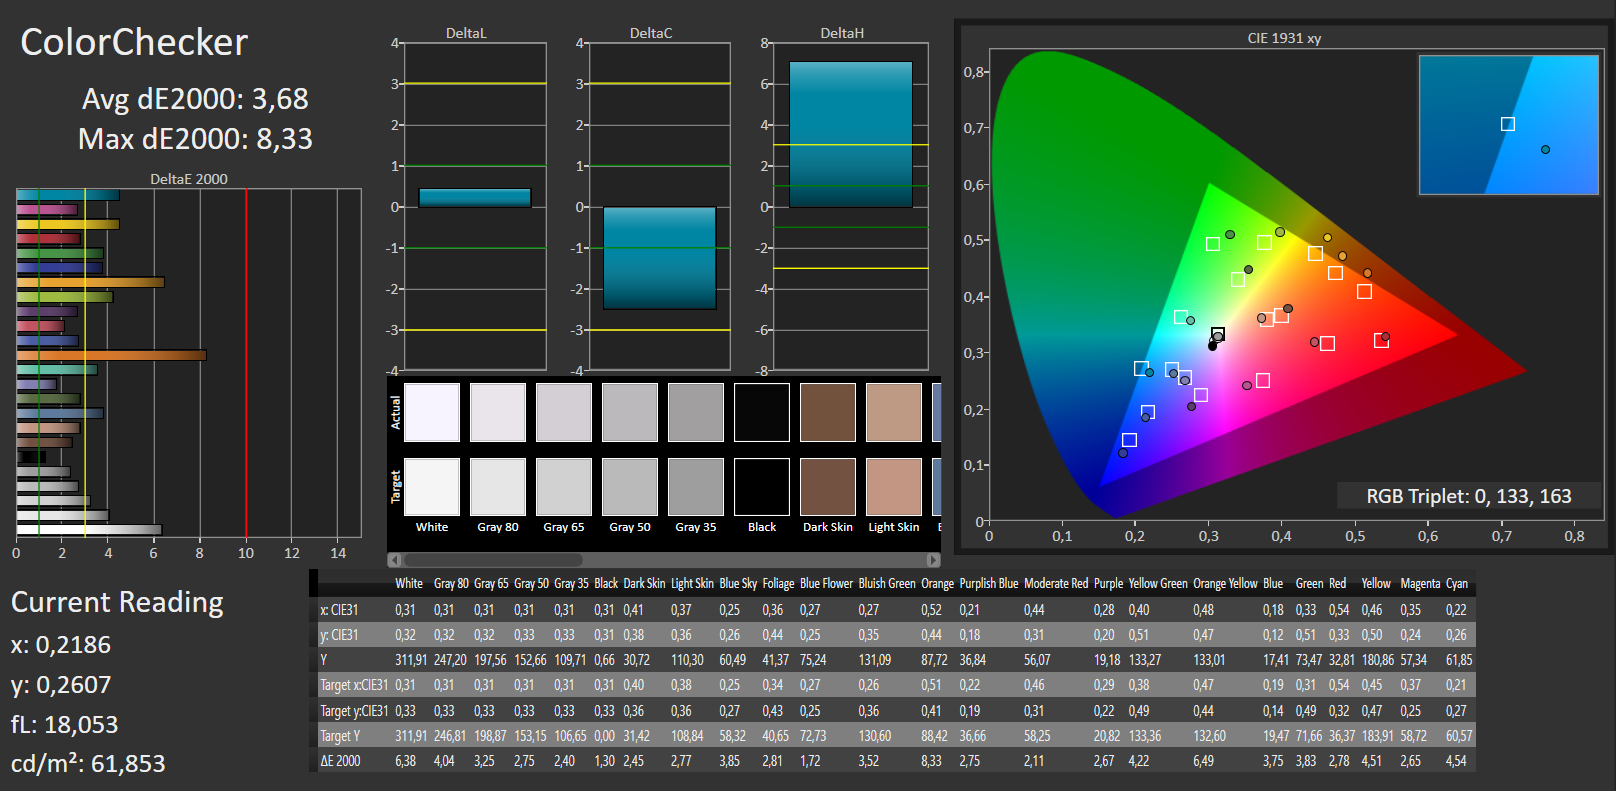
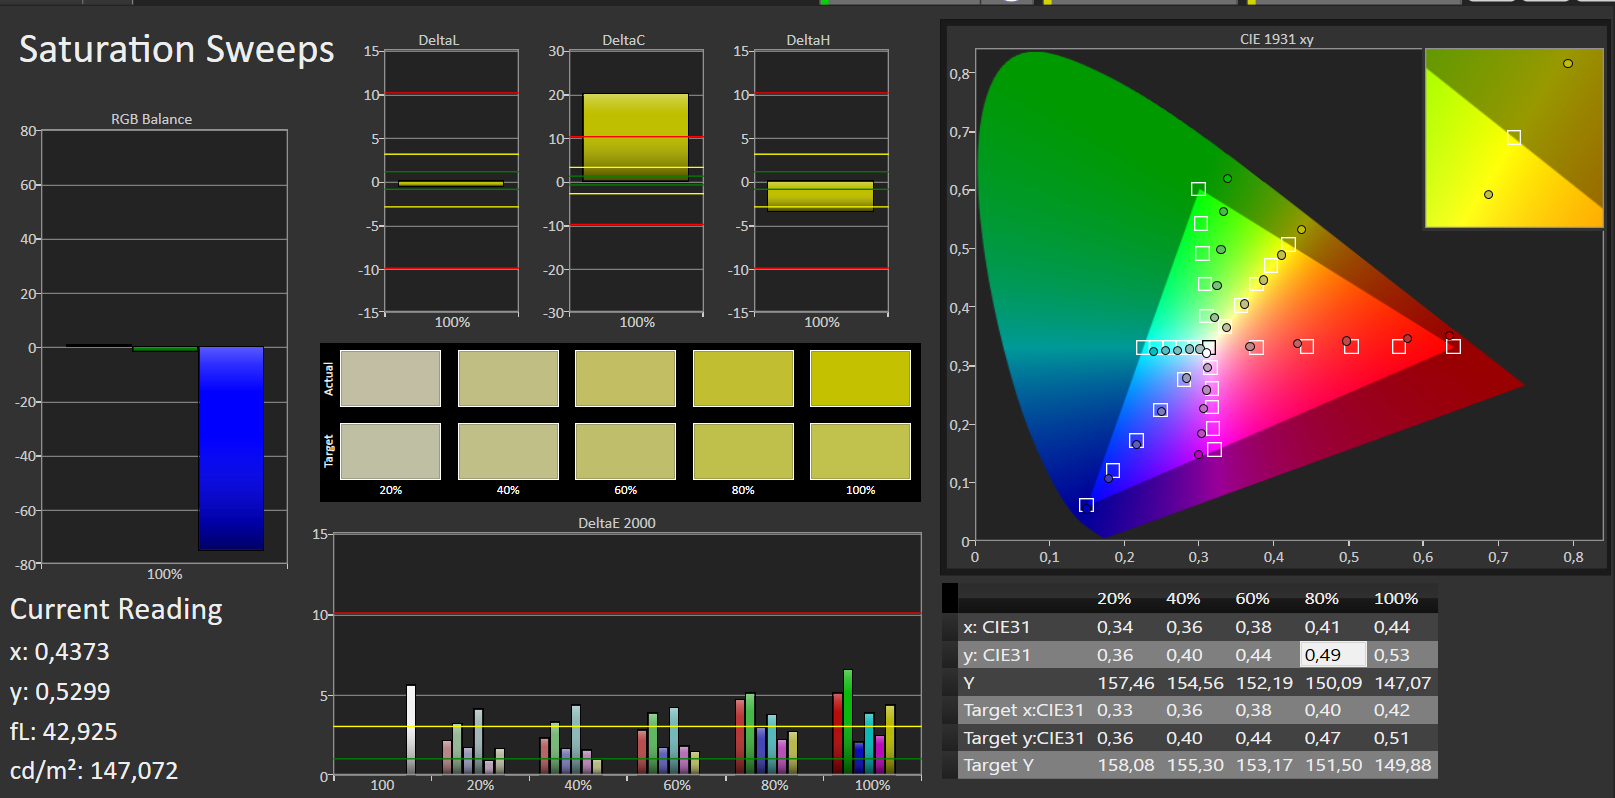
ΔE Color 3.68 | 0.5-29.43 Ø5
ΔE Greyscale 2.99 | 0.57-98 Ø5.3
85% sRGB (Argyll 1.6.3 3D)
55% AdobeRGB 1998 (Argyll 1.6.3 3D)
62% AdobeRGB 1998 (Argyll 2.2.0 3D)
84.8% sRGB (Argyll 2.2.0 3D)
64.8% Display P3 (Argyll 2.2.0 3D)
Gamma: 2.49
| Dell Latitude 14 E5470 LP140WF3, 1920x1080, 14.00 | Dell Latitude 14 E5470 LG Philips LGD04B1 140WHU, 1366x768, 14.00 | HP ProBook 440 G4-Y8B51EA AUO1E3D, 1920x1080, 14.00 | Lenovo ThinkPad T460-20FN003LGE Lenovo LEN40A9 / N140HCE-EAA, 1920x1080, 14.00 | Acer TravelMate P648-M-757N AU Optronics B140HAN02.1, 1920x1080, 14.00 | |
|---|---|---|---|---|---|
| Display | -33% | -37% | -31% | -41% | |
| Display P3 Coverage | 64.8 | 40.06 -38% | 37.6 -42% | 42.09 -35% | 35.53 -45% |
| sRGB Coverage | 84.8 | 60.3 -29% | 56.6 -33% | 62 -27% | 53.3 -37% |
| AdobeRGB 1998 Coverage | 62 | 41.42 -33% | 38.85 -37% | 43.6 -30% | 36.72 -41% |
| Response Times | -29% | -3% | -2% | -5% | |
| Response Time Grey 50% / Grey 80% * | 39 ? | 56.8 ? -46% | 43.2 ? -11% | 42.4 ? -9% | 44 ? -13% |
| Response Time Black / White * | 26 ? | 28.8 ? -11% | 24.4 ? 6% | 24.8 ? 5% | 25 ? 4% |
| PWM Frequency | |||||
| Screen | -73% | -57% | -35% | 5% | |
| Brightness middle | 323 | 229 -29% | 216 -33% | 230 -29% | 254 -21% |
| Brightness | 316 | 207 -34% | 203 -36% | 216 -32% | 243 -23% |
| Brightness Distribution | 79 | 80 1% | 83 5% | 85 8% | 90 14% |
| Black Level * | 0.57 | 0.69 -21% | 0.47 18% | 0.26 54% | 0.19 67% |
| Contrast | 567 | 332 -41% | 460 -19% | 885 56% | 1337 136% |
| Colorchecker dE 2000 * | 3.68 | 10.16 -176% | 8.98 -144% | 7.32 -99% | 4.93 -34% |
| Colorchecker dE 2000 max. * | 8.33 | 17.18 -106% | 14.07 -69% | 18.14 -118% | 10.14 -22% |
| Greyscale dE 2000 * | 2.99 | 10.87 -264% | 9.61 -221% | 6.98 -133% | 2.71 9% |
| Gamma | 2.49 88% | 2.41 91% | 2.63 84% | 2.5 88% | 2.36 93% |
| CCT | 6572 99% | 12881 50% | 11265 58% | 6683 97% | 6914 94% |
| Color Space (Percent of AdobeRGB 1998) | 55 | 38.4 -30% | 35.9 -35% | 39.97 -27% | 34 -38% |
| Color Space (Percent of sRGB) | 85 | 60.4 -29% | 56.7 -33% | 61.55 -28% | 53 -38% |
| Totaal Gemiddelde (Programma / Instellingen) | -45% /
-59% | -32% /
-46% | -23% /
-30% | -14% /
-5% |
* ... kleiner is beter
Responstijd Scherm
| ↔ Responstijd Zwart naar Wit | ||
|---|---|---|
| 26 ms ... stijging ↗ en daling ↘ gecombineerd | ↗ 5 ms stijging | 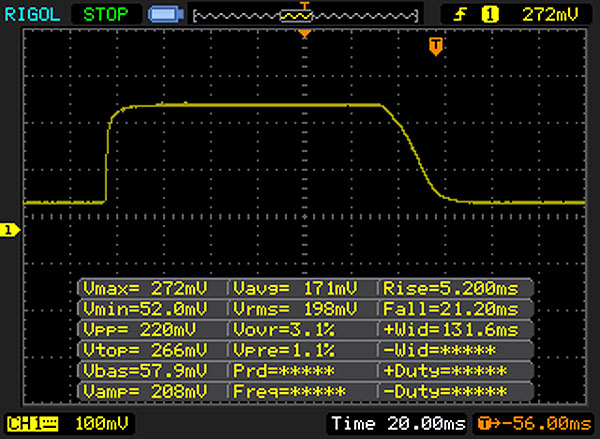 |
| ↘ 21 ms daling | ||
| Het scherm vertoonde relatief trage responstijden in onze tests en is misschien te traag voor games. Ter vergelijking: alle testtoestellen variëren van 0.1 (minimum) tot 240 (maximum) ms. » 57 % van alle toestellen zijn beter. Dit betekent dat de gemeten responstijd slechter is dan het gemiddelde (21.5 ms) van alle geteste toestellen. | ||
| ↔ Responstijd 50% Grijs naar 80% Grijs | ||
| 39 ms ... stijging ↗ en daling ↘ gecombineerd | ↗ 15 ms stijging | 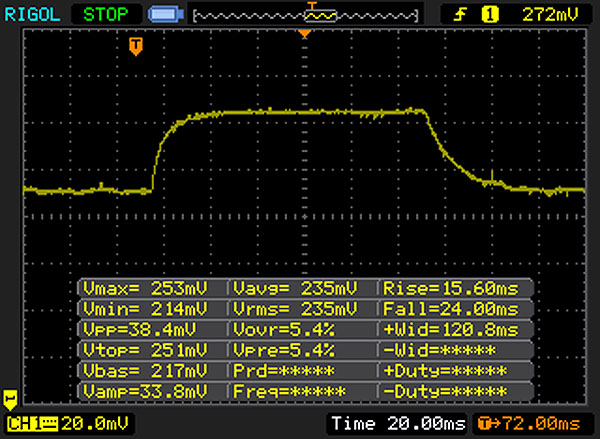 |
| ↘ 24 ms daling | ||
| Het scherm vertoonde trage responstijden in onze tests en is misschien te traag voor games. Ter vergelijking: alle testtoestellen variëren van 0.2 (minimum) tot 636 (maximum) ms. » 53 % van alle toestellen zijn beter. Dit betekent dat de gemeten responstijd slechter is dan het gemiddelde (33.7 ms) van alle geteste toestellen. | ||
Screen Flickering / PWM (Pulse-Width Modulation)
| Screen flickering / PWM niet waargenomen | ||
Ter vergelijking: 53 % van alle geteste toestellen maakten geen gebruik van PWM om de schermhelderheid te verlagen. Als het wel werd gebruikt, werd een gemiddelde van 17900 (minimum: 5 - maximum: 3846000) Hz waargenomen. | ||
| Cinebench R11.5 | |
| CPU Multi 64Bit | |
| Dell Latitude 14 E5470 | |
| HP ProBook 440 G4-Y8B51EA | |
| Dell Latitude 14 E5470 | |
| Acer TravelMate P648-M-757N | |
| CPU Single 64Bit | |
| HP ProBook 440 G4-Y8B51EA | |
| Dell Latitude 14 E5470 | |
| Dell Latitude 14 E5470 | |
| Acer TravelMate P648-M-757N | |
| Cinebench R10 | |
| Rendering Multiple CPUs 64Bit | |
| Dell Latitude 14 E5470 | |
| Dell Latitude 14 E5470 | |
| Rendering Single CPUs 64Bit | |
| Dell Latitude 14 E5470 | |
| Dell Latitude 14 E5470 | |
| JetStream 1.1 - Total Score | |
| Dell Latitude 14 E5470 | |
| HP ProBook 440 G4-Y8B51EA | |
| Lenovo ThinkPad T460-20FN003LGE | |
| Acer TravelMate P648-M-757N | |
| Octane V2 - Total Score | |
| Dell Latitude 14 E5470 | |
| HP ProBook 440 G4-Y8B51EA | |
| Dell Latitude 14 E5470 | |
| Lenovo ThinkPad T460-20FN003LGE | |
| Acer TravelMate P648-M-757N | |
| Mozilla Kraken 1.1 - Total | |
| Acer TravelMate P648-M-757N | |
| Lenovo ThinkPad T460-20FN003LGE | |
| Dell Latitude 14 E5470 | |
| Dell Latitude 14 E5470 | |
| HP ProBook 440 G4-Y8B51EA | |
* ... kleiner is beter
| PCMark 8 | |
| Home Score Accelerated v2 | |
| HP ProBook 440 G4-Y8B51EA | |
| Acer TravelMate P648-M-757N | |
| Dell Latitude 14 E5470 | |
| Dell Latitude 14 E5470 | |
| Lenovo ThinkPad T460-20FN003LGE | |
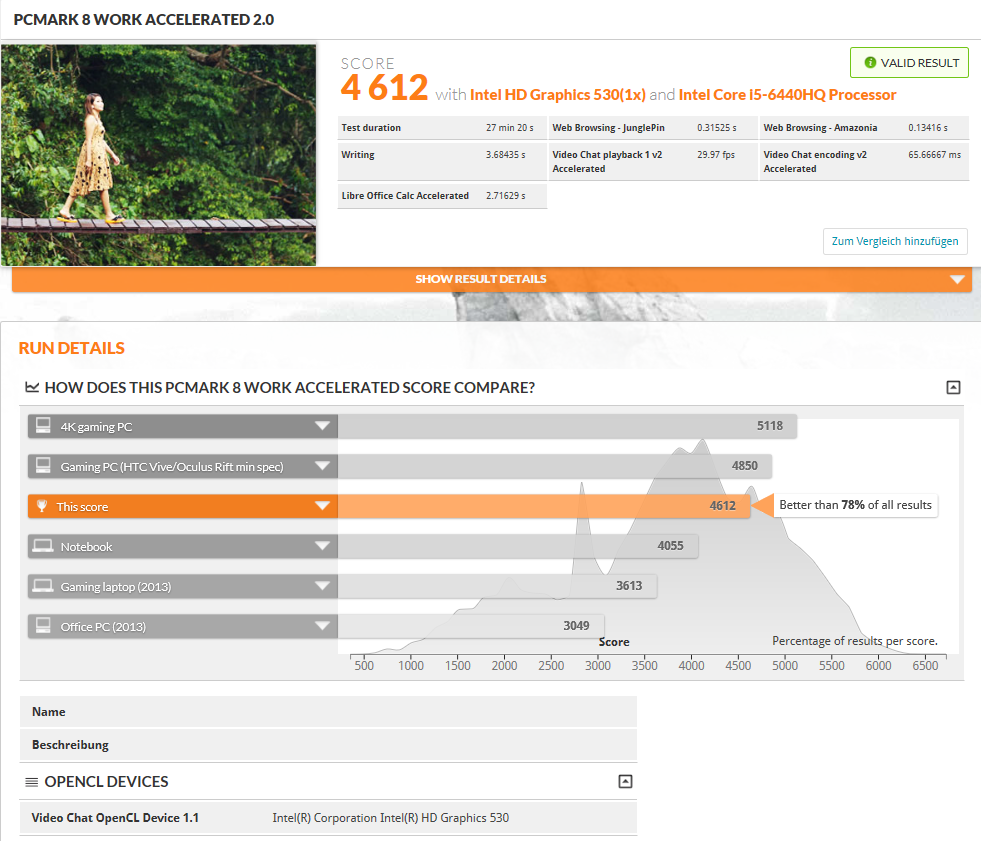
| Work Score Accelerated v2 | |
| HP ProBook 440 G4-Y8B51EA | |
| Dell Latitude 14 E5470 | |
| Dell Latitude 14 E5470 | |
| Acer TravelMate P648-M-757N | |
| Lenovo ThinkPad T460-20FN003LGE | |
| Creative Score Accelerated v2 | |
| HP ProBook 440 G4-Y8B51EA | |
| Dell Latitude 14 E5470 | |
| Dell Latitude 14 E5470 | |
| Acer TravelMate P648-M-757N | |
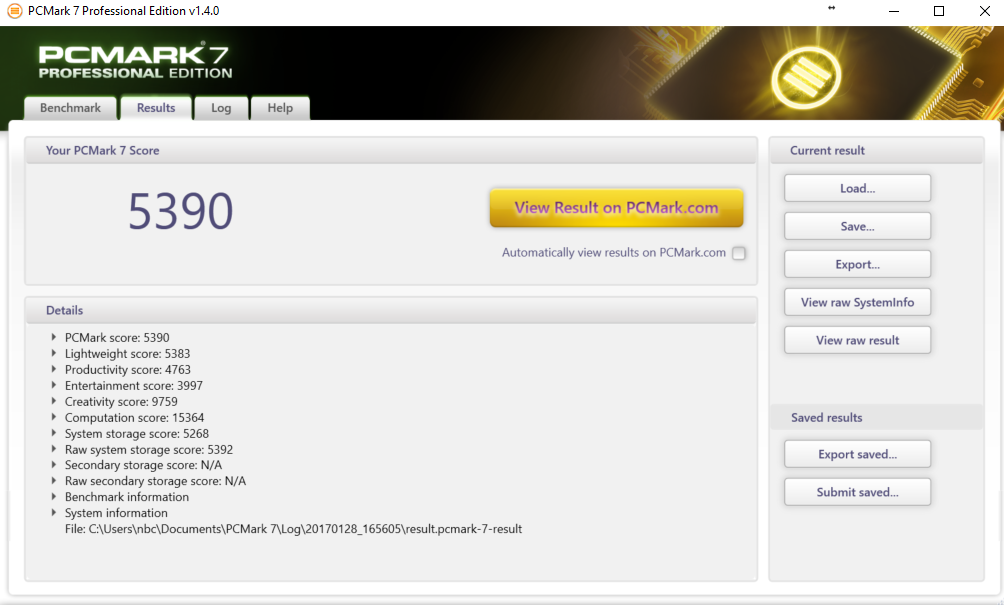
| PCMark 7 Score | 5390 punten | |
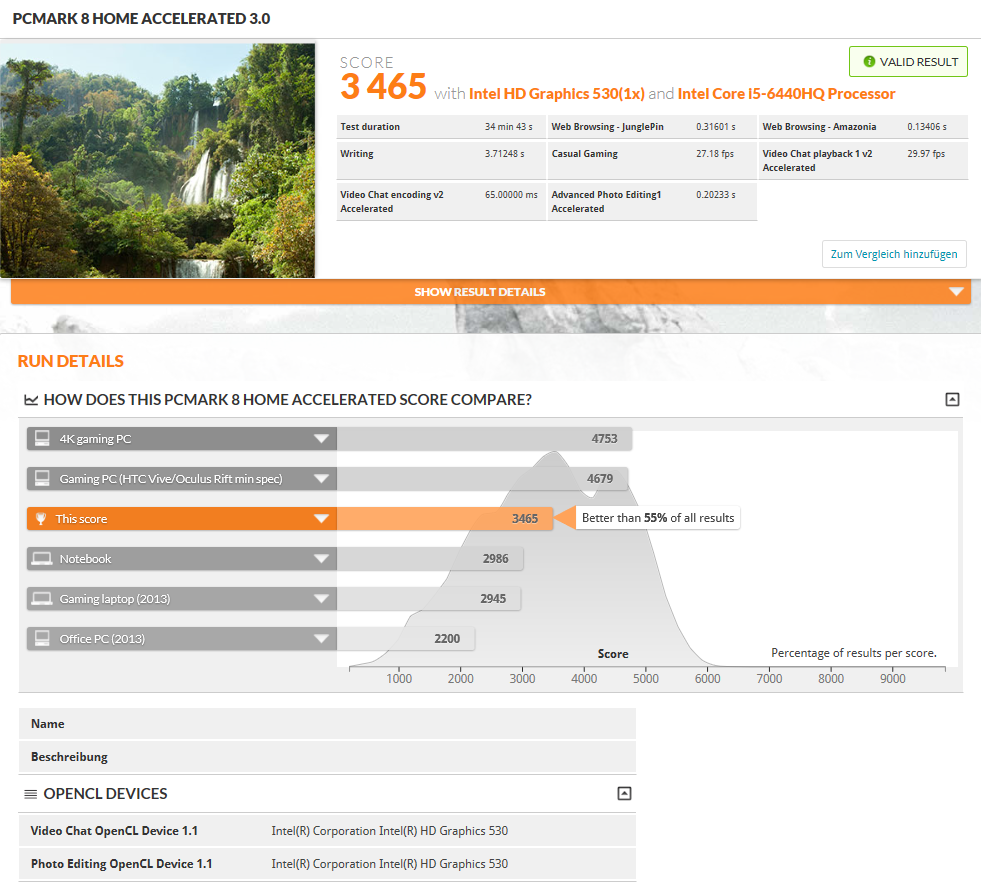
| PCMark 8 Home Score Accelerated v2 | 3465 punten | |
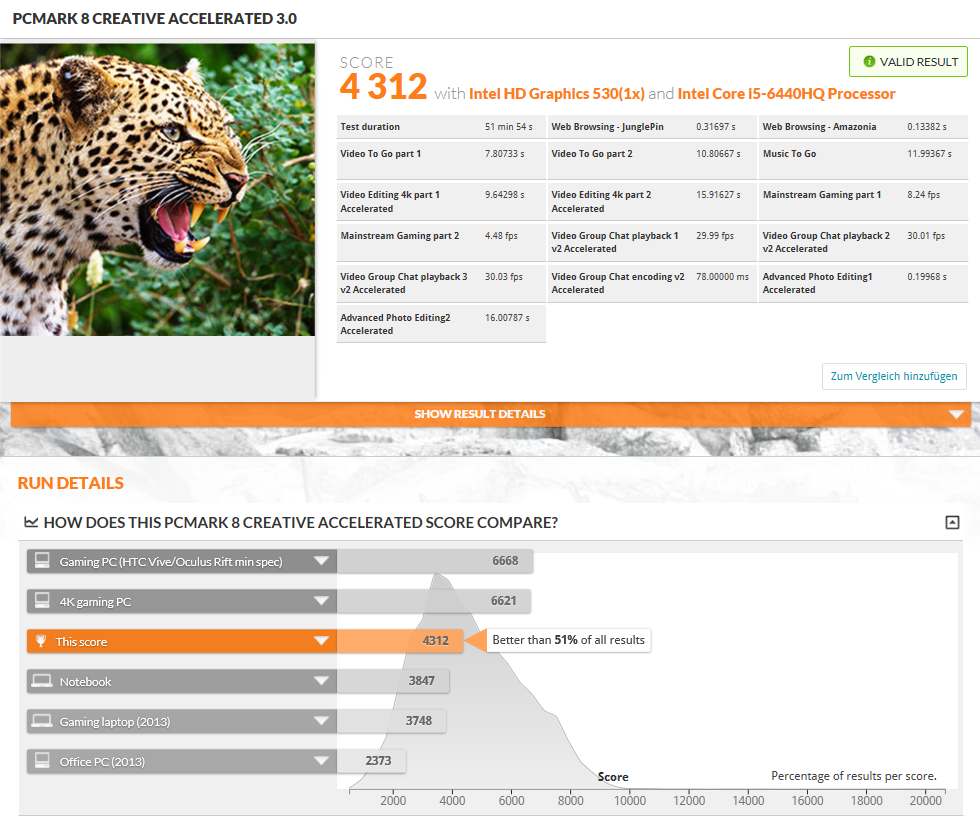
| PCMark 8 Creative Score Accelerated v2 | 4312 punten | |
| PCMark 8 Work Score Accelerated v2 | 4612 punten | |
Help | ||
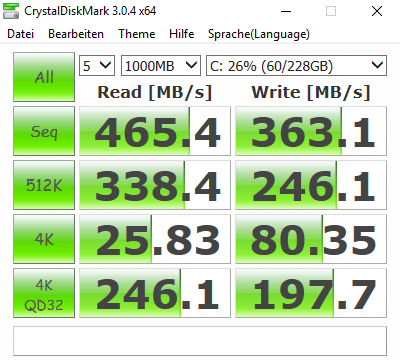
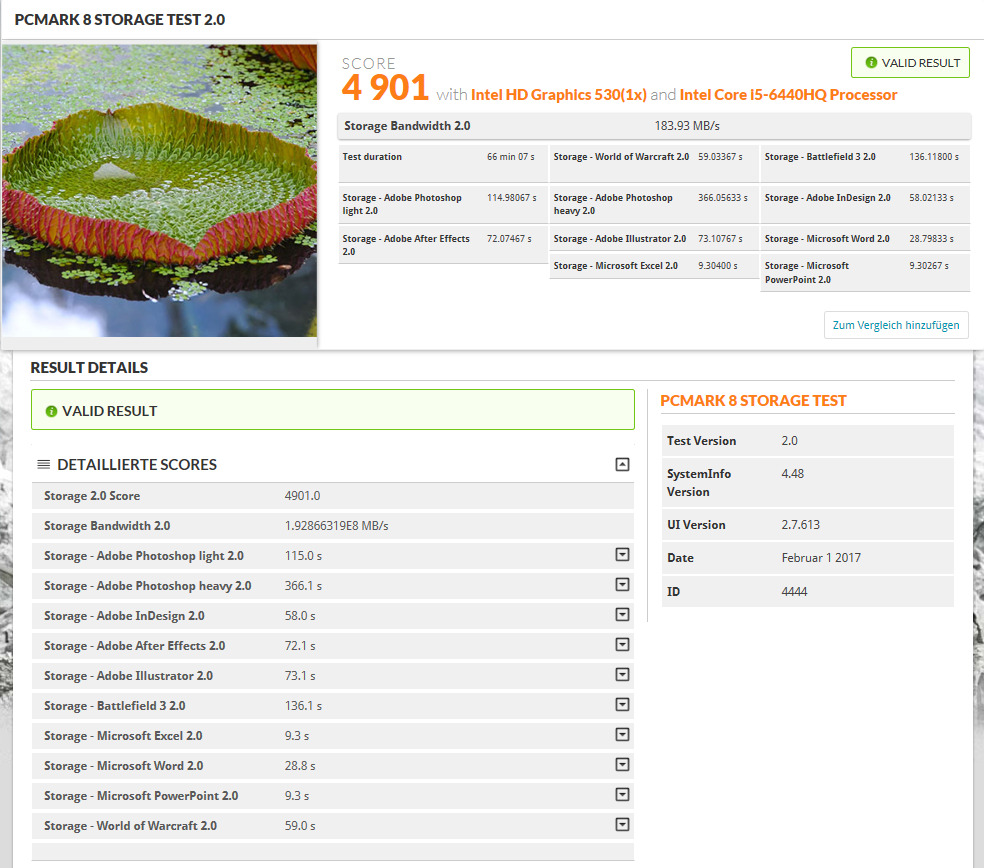
| Dell Latitude 14 E5470 Micron SSD 1100 (MTFDDAV256TBN) | Dell Latitude 14 E5470 Liteon L8H-256V2G | HP ProBook 440 G4-Y8B51EA SanDisk SD8SNAT256G1002 | Lenovo ThinkPad T460-20FN003LGE Toshiba HG6 THNSFJ256GCSU | Acer TravelMate P648-M-757N Lite-On CV1-8B256 | |
|---|---|---|---|---|---|
| CrystalDiskMark 3.0 | 12% | -6% | 6% | 13% | |
| Read Seq | 465.4 | 508 9% | 491.2 6% | 458.9 -1% | 531 14% |
| Write Seq | 363.1 | 360.6 -1% | 322.2 -11% | 394.4 9% | 358.8 -1% |
| Read 512 | 338.4 | 374.1 11% | 310.1 -8% | 371.3 10% | 384.8 14% |
| Write 512 | 246.1 | 300.2 22% | 276 12% | 232.7 -5% | 363 48% |
| Read 4k | 25.83 | 31.98 24% | 19.57 -24% | 21.7 -16% | 31.3 21% |
| Write 4k | 80.3 | 93.1 16% | 77.8 -3% | 72.9 -9% | 80.3 0% |
| Read 4k QD32 | 246.1 | 274.7 12% | 146.3 -41% | 369.9 50% | 239.4 -3% |
| Write 4k QD32 | 197.7 | 205.6 4% | 241.4 22% | 216 9% | 225.3 14% |

| 3DMark | |
| 1280x720 Cloud Gate Standard Graphics | |
| HP ProBook 440 G4-Y8B51EA | |
| Acer TravelMate P648-M-757N | |
| Dell Latitude 14 E5470 | |
| Dell Latitude 14 E5470 | |
| Lenovo ThinkPad T460-20FN003LGE | |
| 1920x1080 Fire Strike Graphics | |
| HP ProBook 440 G4-Y8B51EA | |
| Acer TravelMate P648-M-757N | |
| Dell Latitude 14 E5470 | |
| Dell Latitude 14 E5470 | |
| 3DMark 11 - 1280x720 Performance GPU | |
| HP ProBook 440 G4-Y8B51EA | |
| Dell Latitude 14 E5470 | |
| Dell Latitude 14 E5470 | |
| Acer TravelMate P648-M-757N | |
| Lenovo ThinkPad T460-20FN003LGE | |
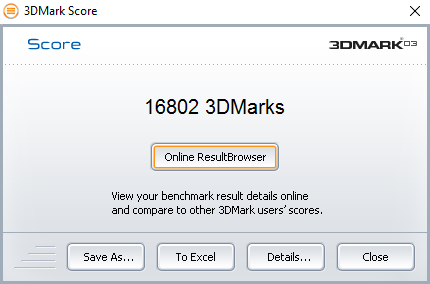
| 3DMark 03 Standard | 16802 punten | |
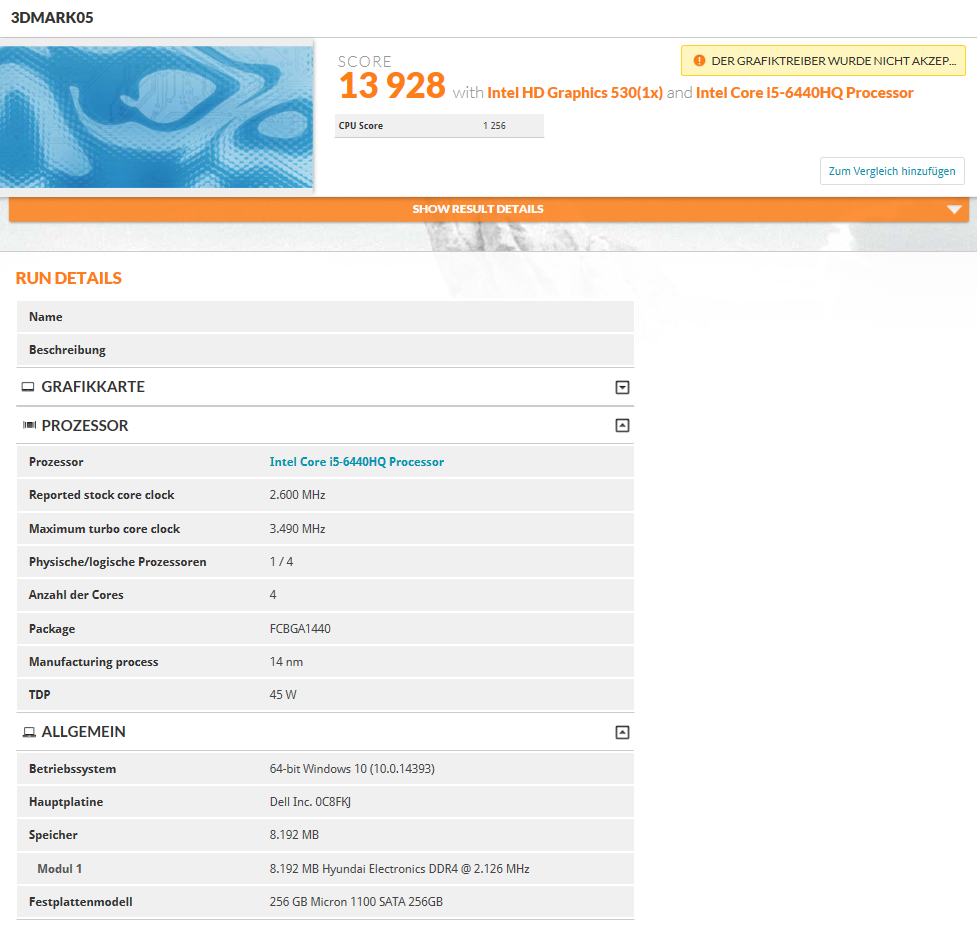
| 3DMark 05 Standard | 13920 punten | |
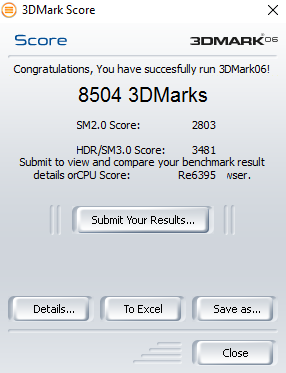
| 3DMark 06 Standard Score | 8504 punten | |
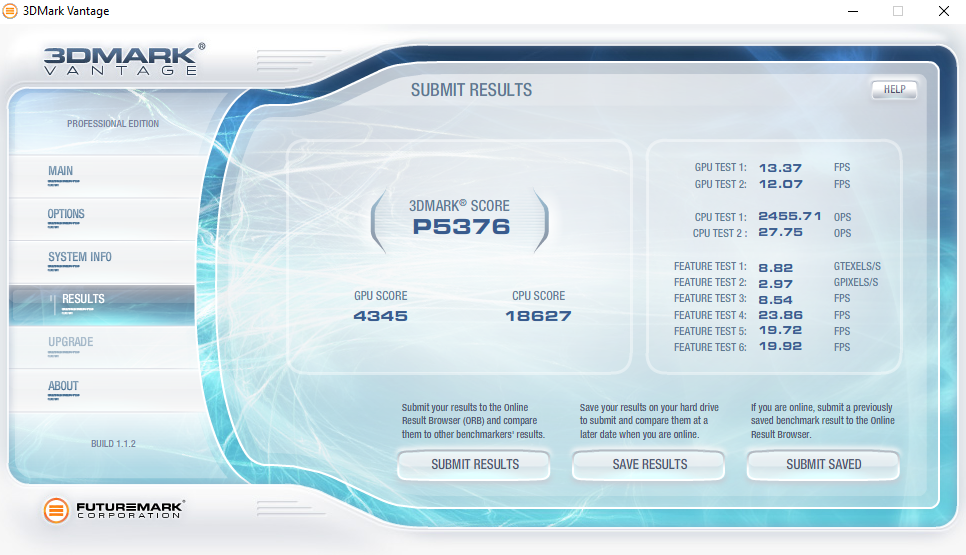
| 3DMark Vantage P Result | 5376 punten | |
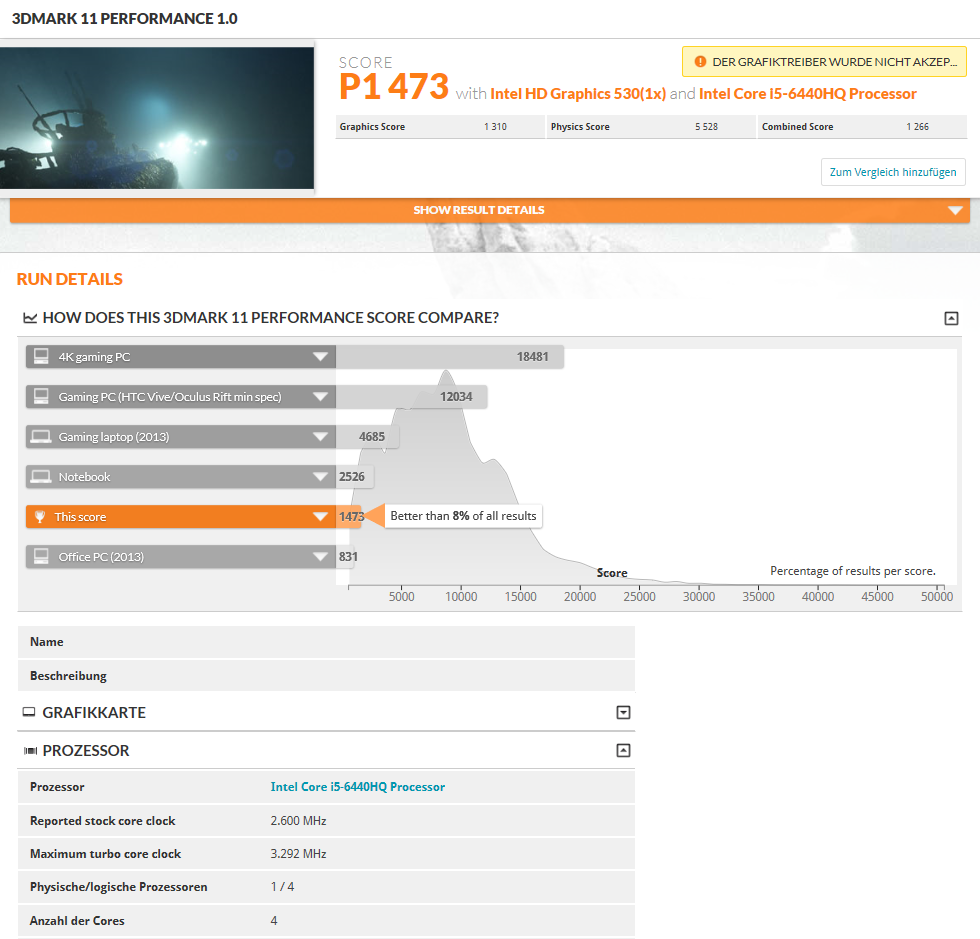
| 3DMark 11 Performance | 1473 punten | |
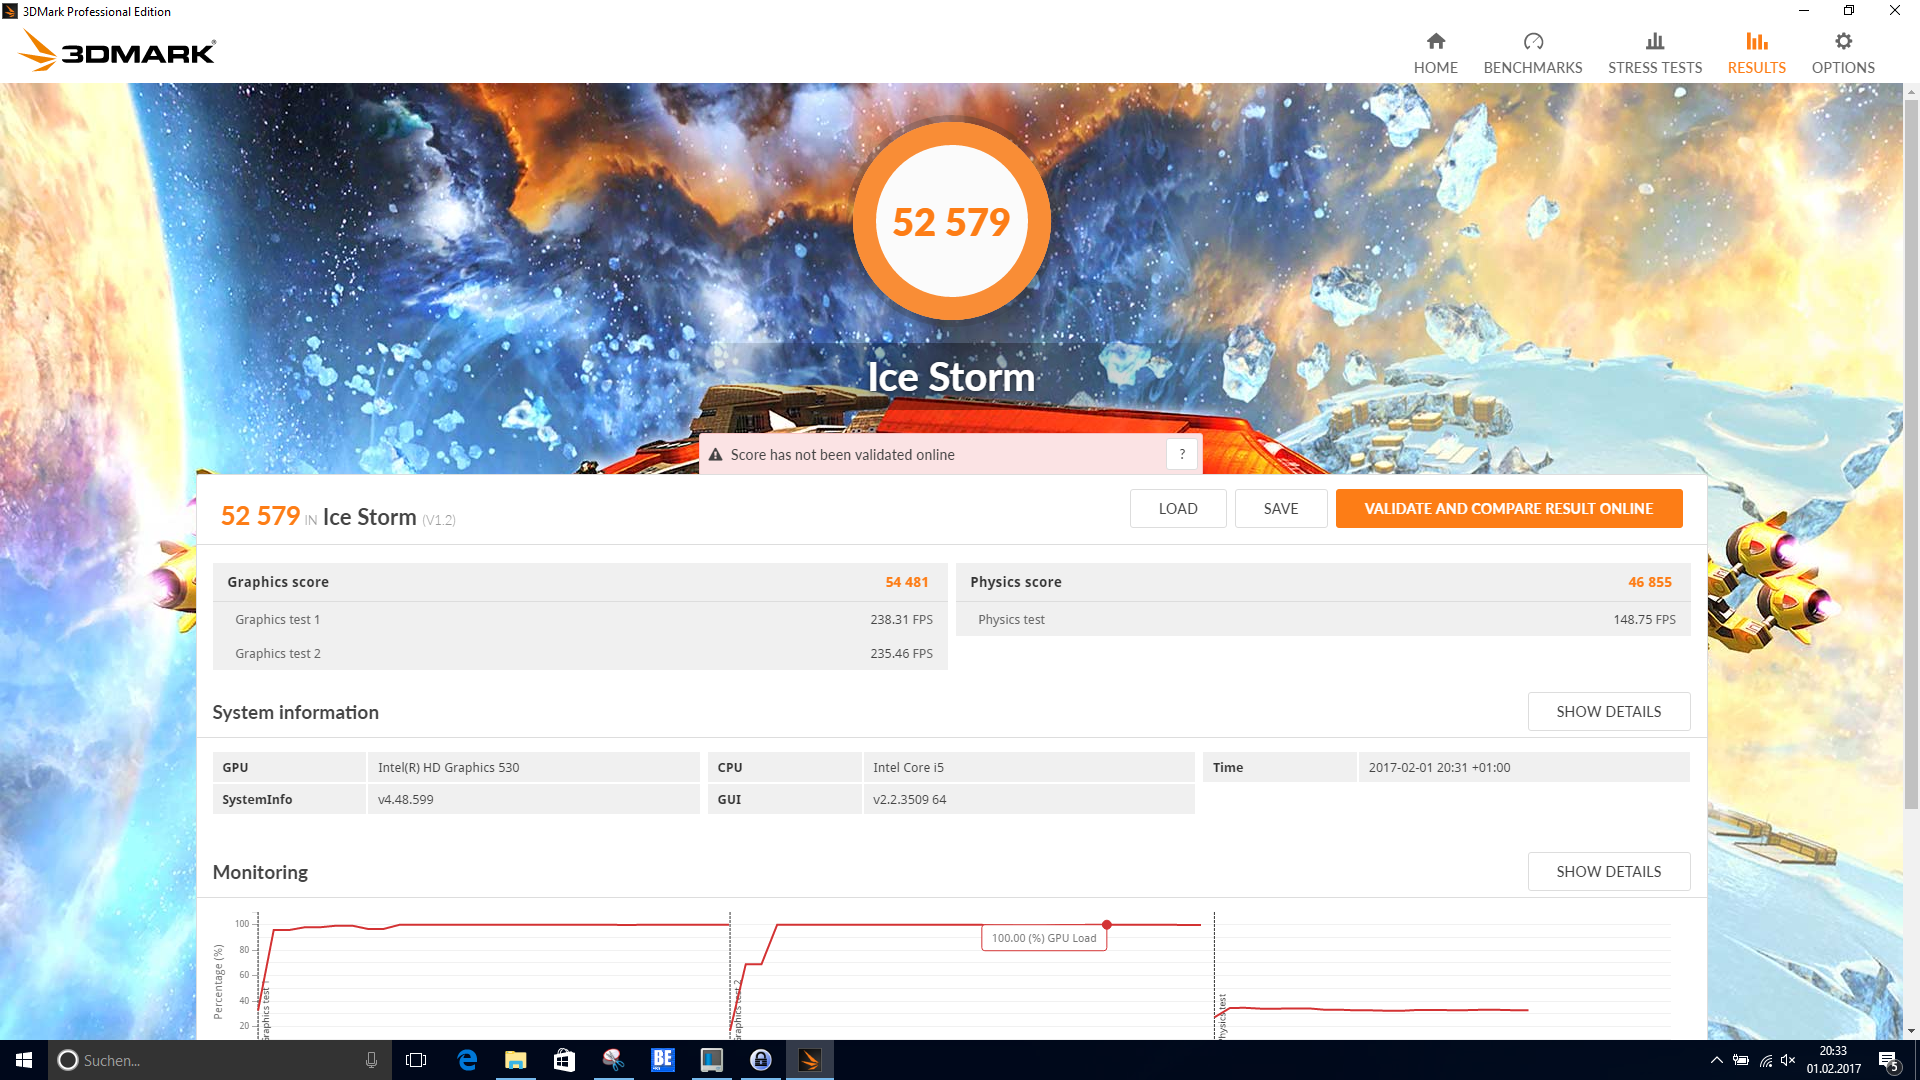
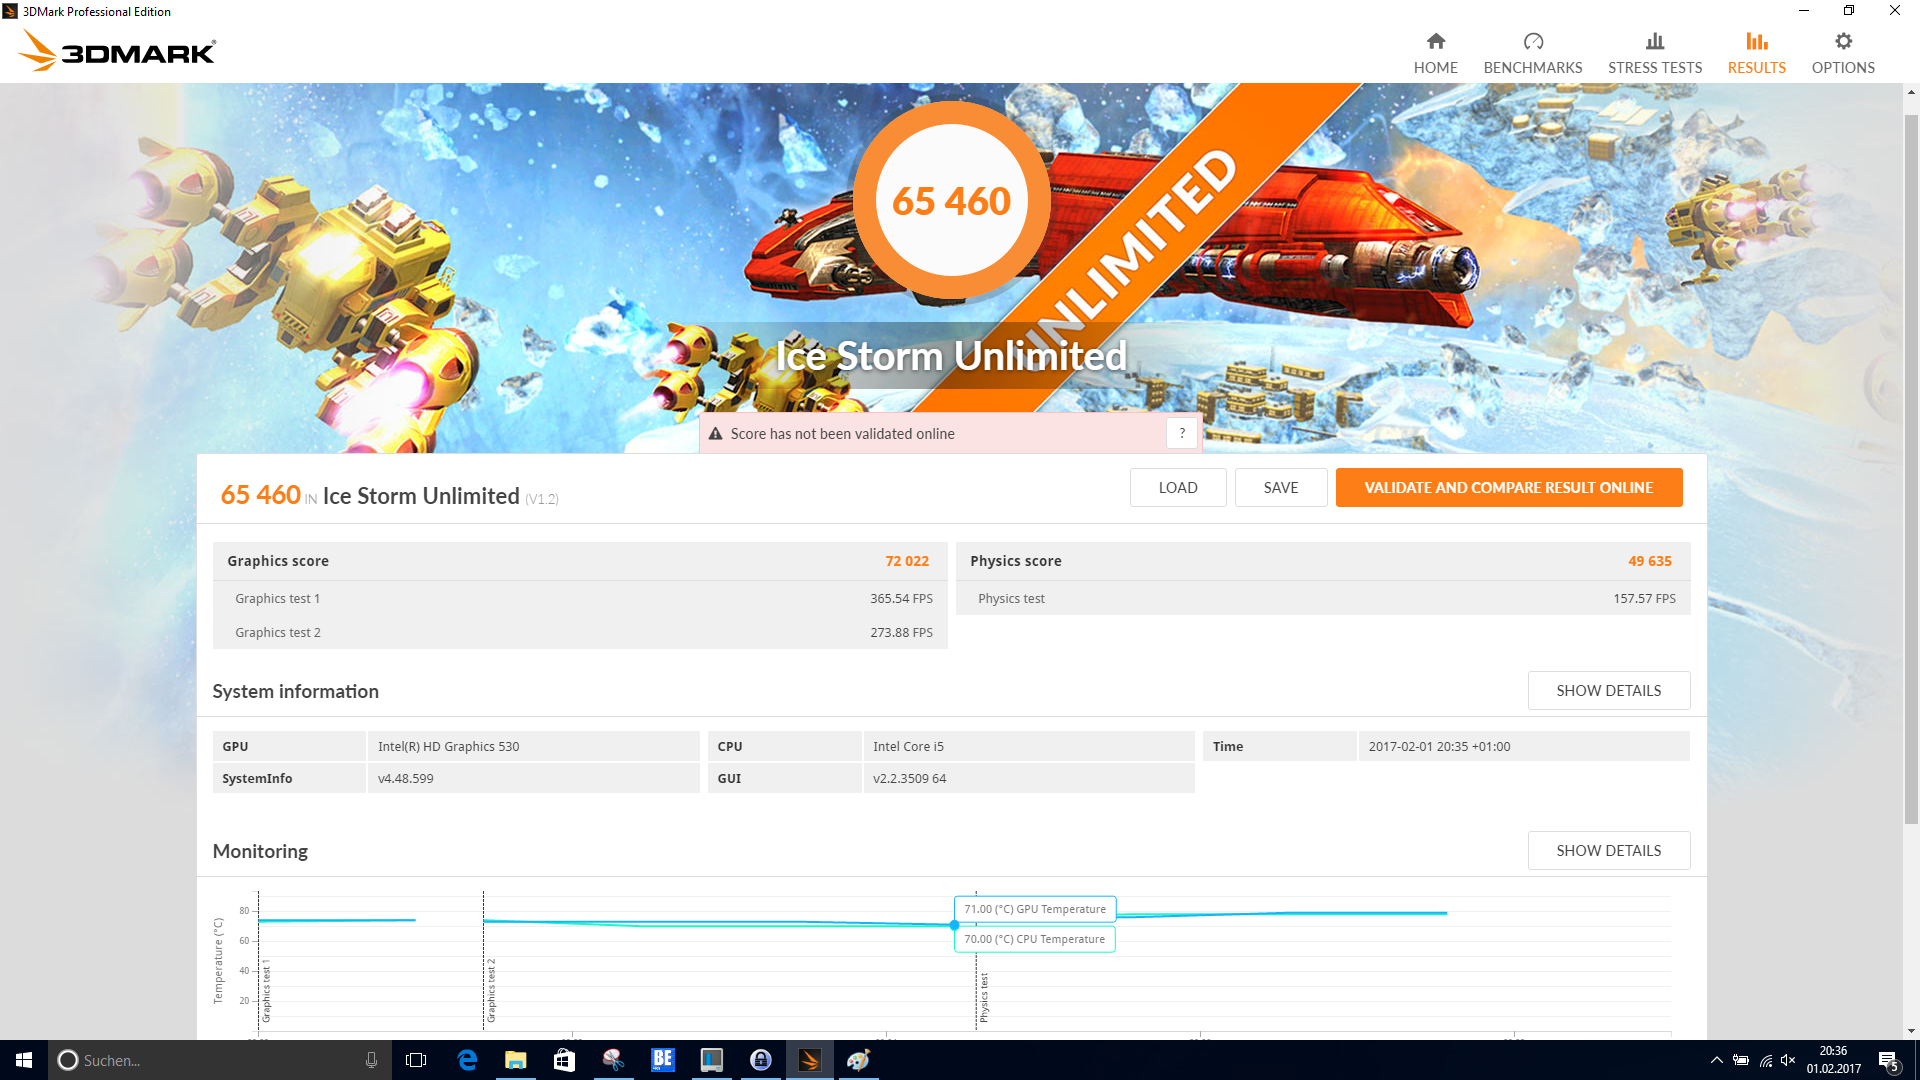
| 3DMark Ice Storm Standard Score | 52579 punten | |
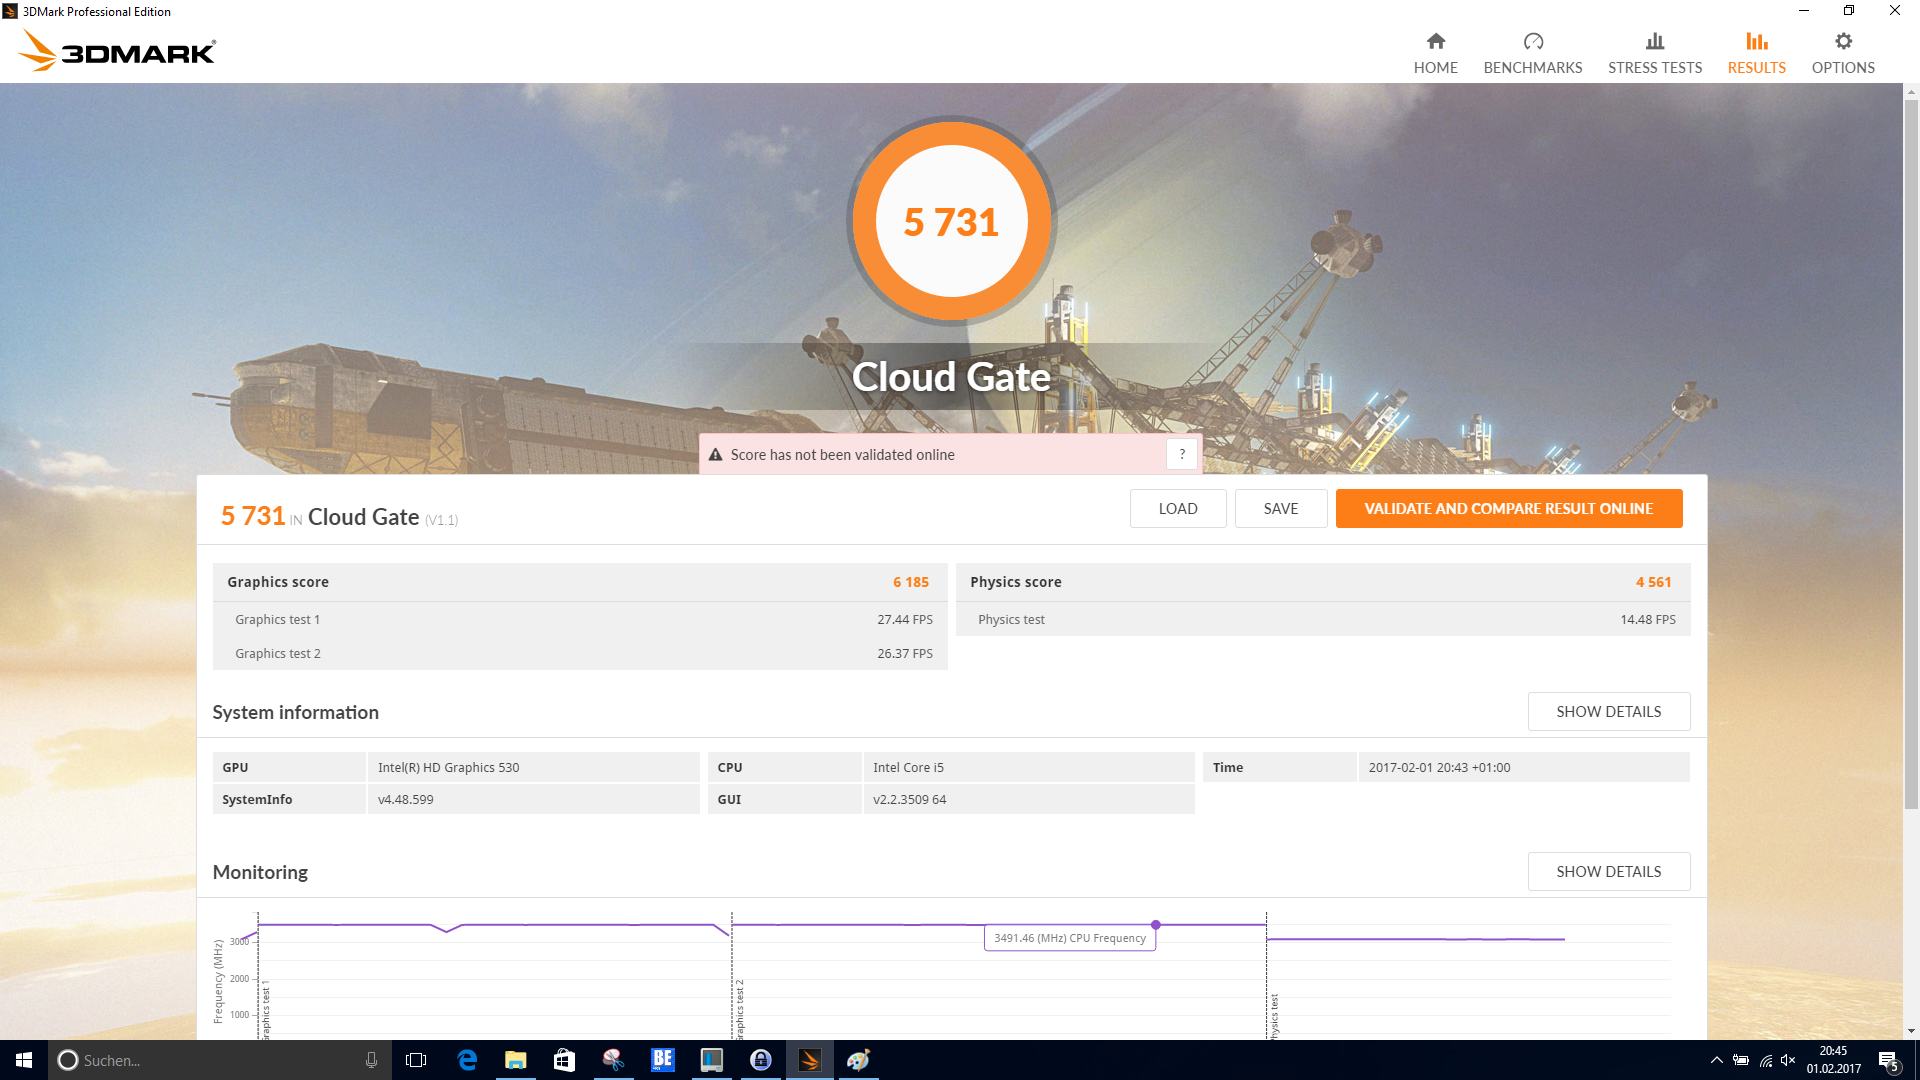
| 3DMark Cloud Gate Standard Score | 5731 punten | |
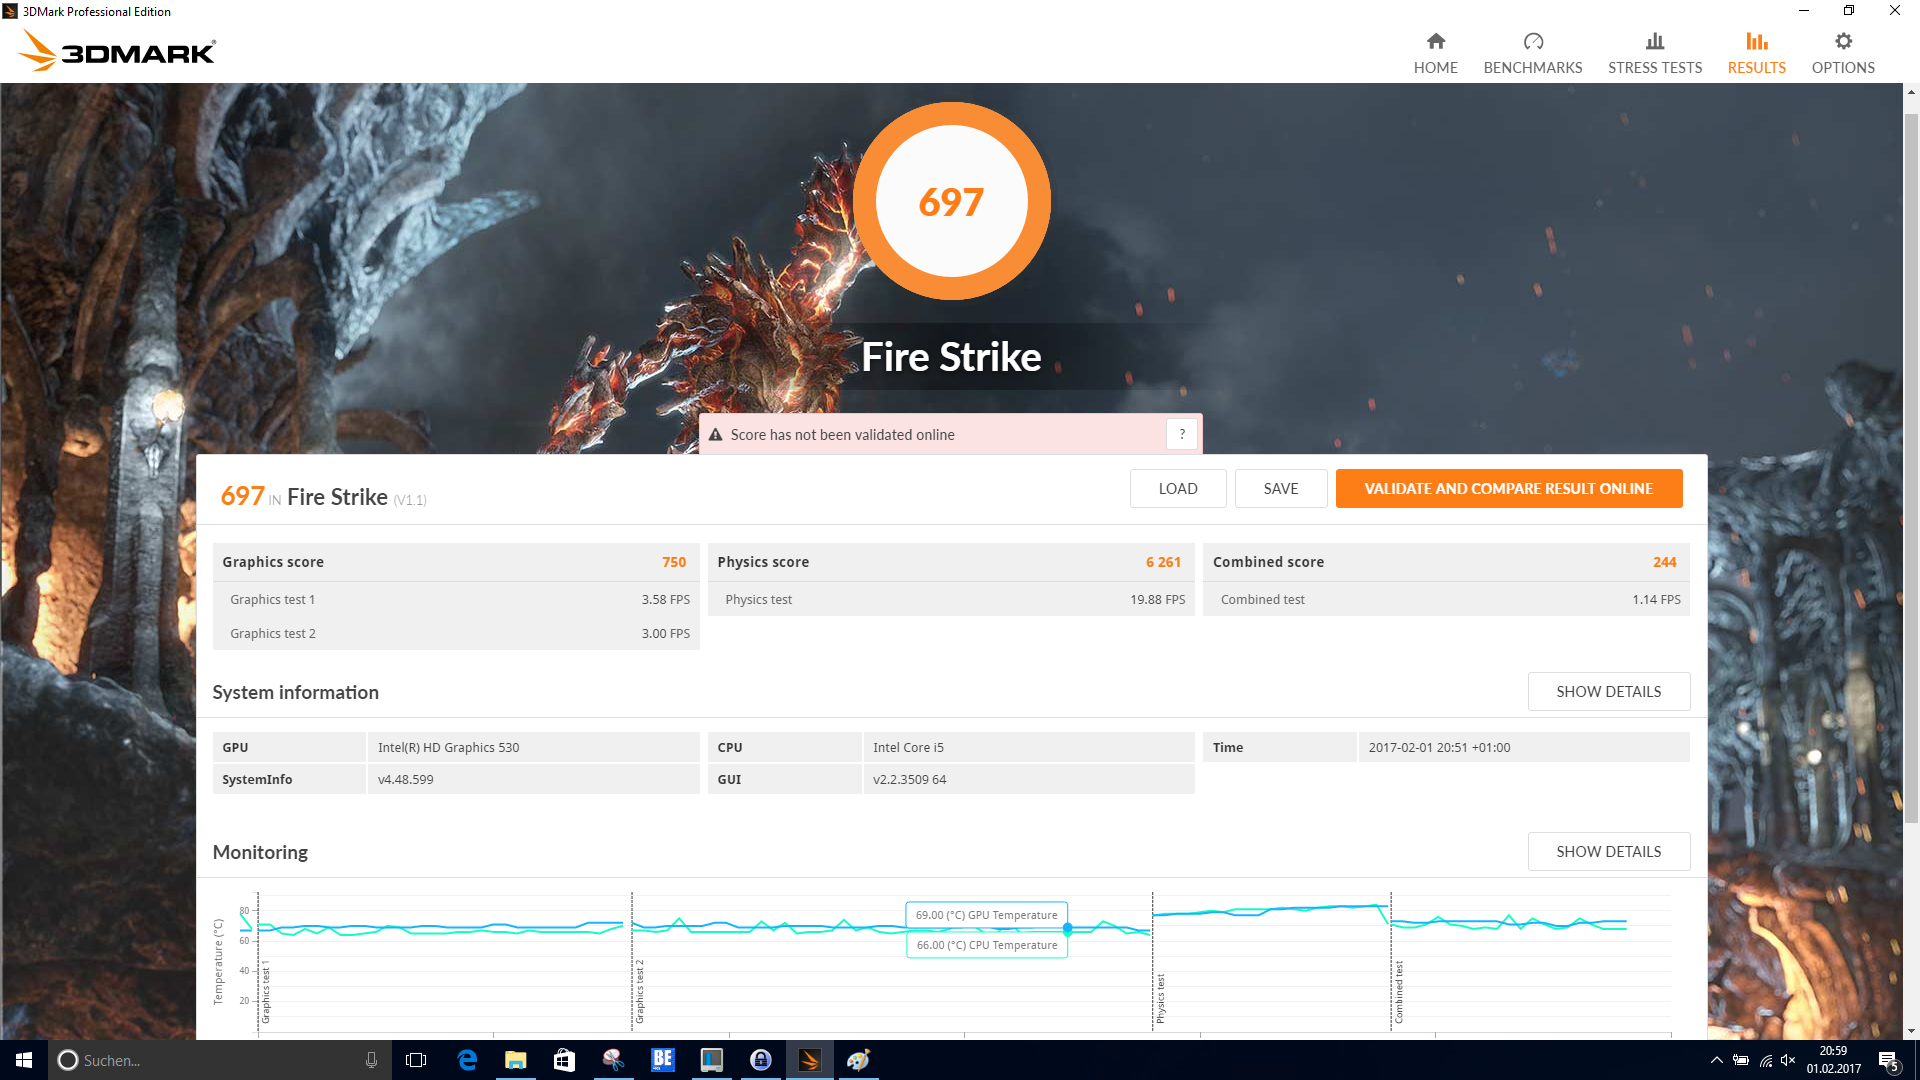
| 3DMark Fire Strike Score | 697 punten | |
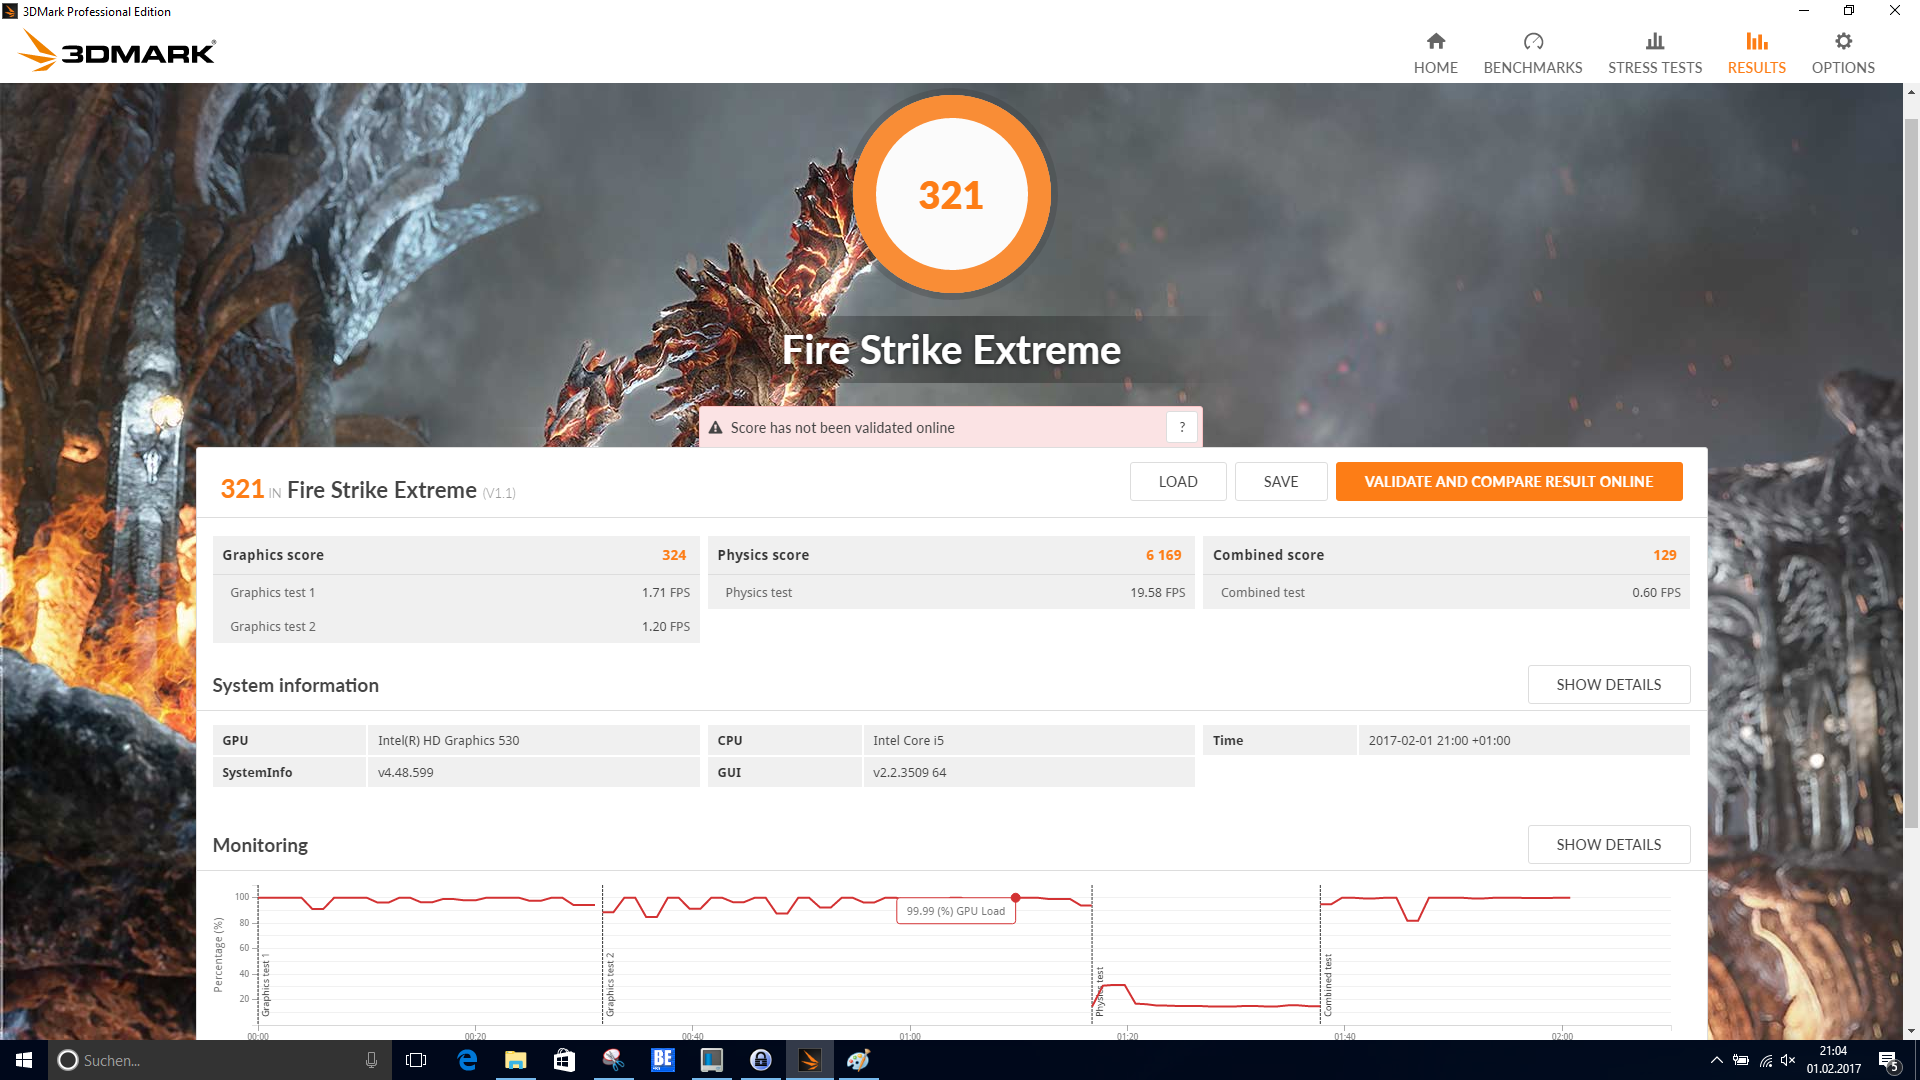
| 3DMark Fire Strike Extreme Score | 321 punten | |
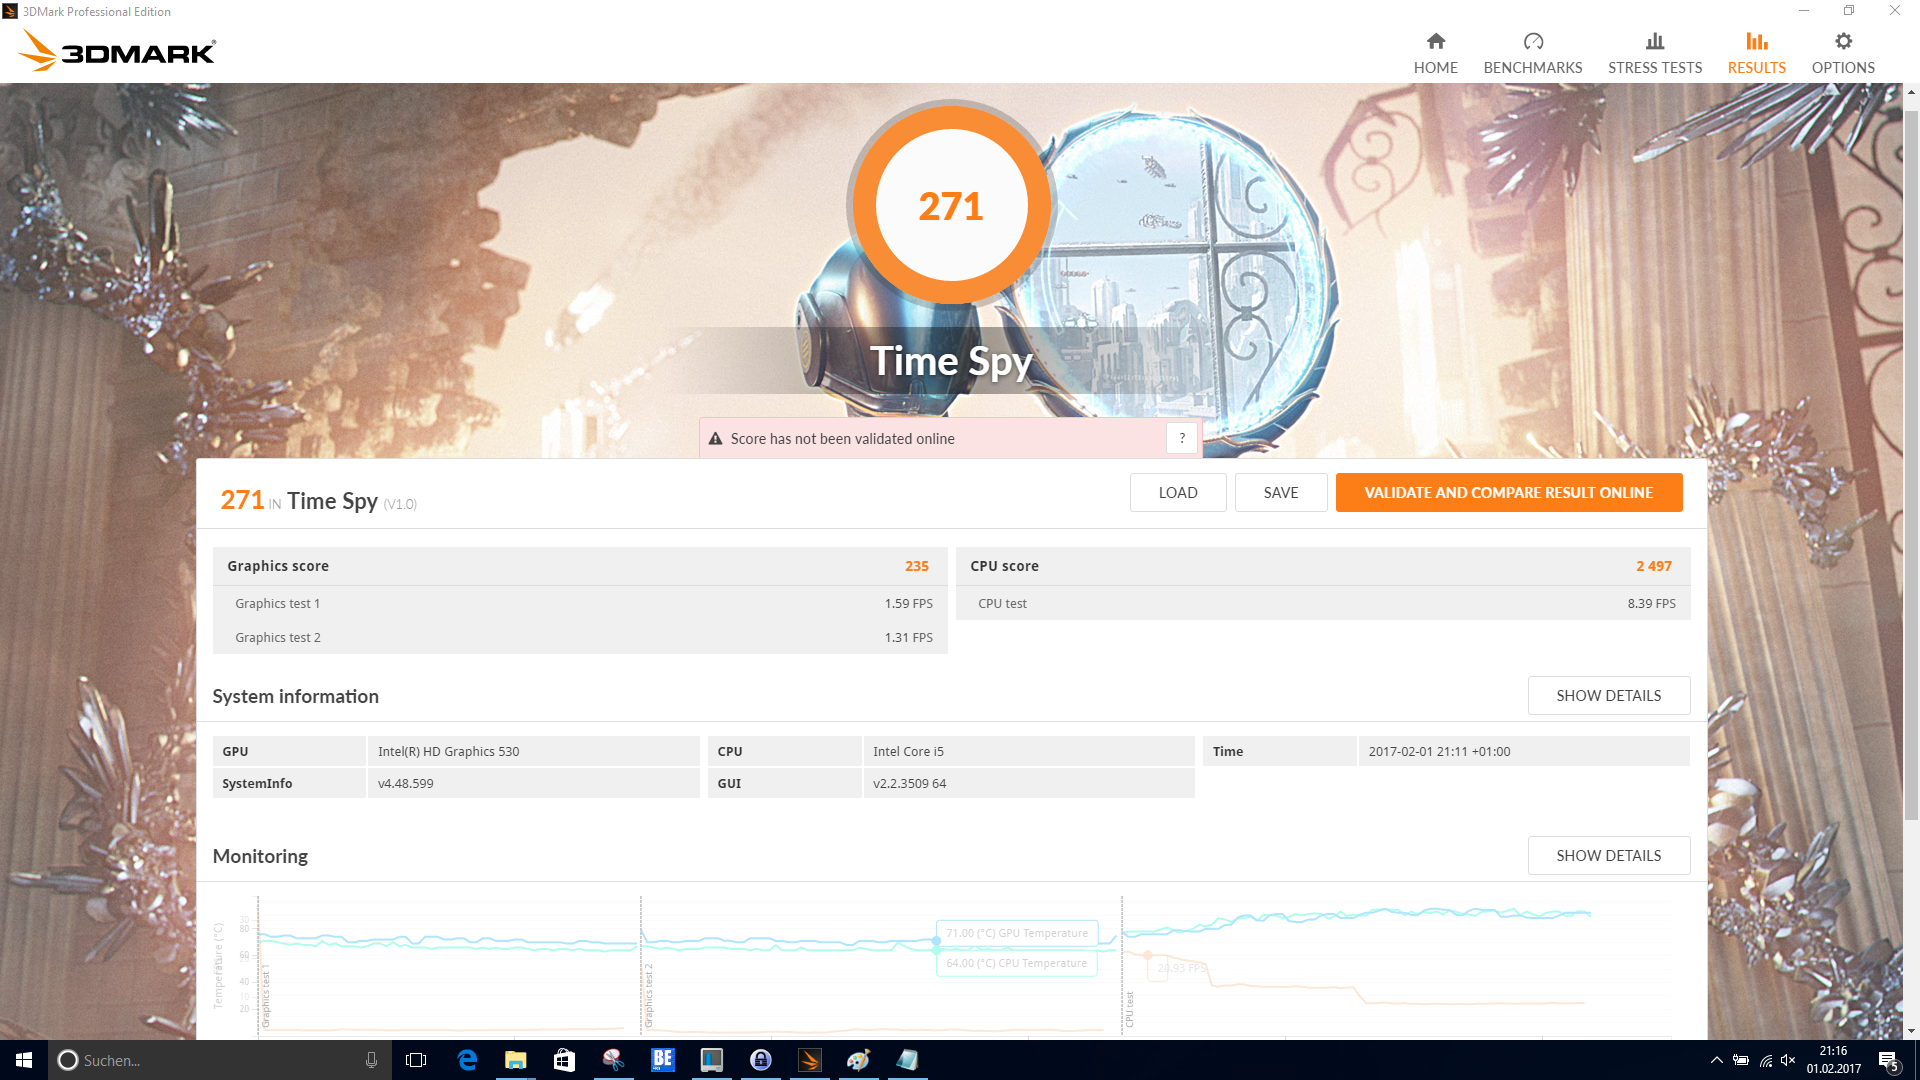
| 3DMark Time Spy Score | 271 punten | |
Help | ||
| BioShock Infinite - 1366x768 Medium Preset | |
| HP ProBook 440 G4-Y8B51EA | |
| Acer TravelMate P648-M-757N | |
| Dell Latitude 14 E5470 | |
| Dell Latitude 14 E5470 | |
| Lenovo ThinkPad T460-20FN003LGE | |
| Battlefield 4 - 1366x768 Medium Preset | |
| HP ProBook 440 G4-Y8B51EA | |
| Dell Latitude 14 E5470 | |
| Acer TravelMate P648-M-757N | |
| Dell Latitude 14 E5470 | |
| Lenovo ThinkPad T460-20FN003LGE | |
| lage | gem. | hoge | ultra | |
| BioShock Infinite (2013) | 45.6 | 23.7 | 19.5 | 5.5 |
| Battlefield 4 (2013) | 41.2 | 27.8 | 18.3 | 4.9 |
| Rise of the Tomb Raider (2016) | 15 |
Geluidsniveau
| Onbelast |
| 30.3 / 30.3 / 30.3 dB (A) |
| Belasting |
| 31.6 / 35 dB (A) |
 | ||
30 dB stil 40 dB(A) hoorbaar 50 dB(A) luid |
||
min: | ||
| Dell Latitude 14 E5470 6440HQ, HD Graphics 530 | Dell Latitude 14 E5470 6300U, HD Graphics 520 | HP ProBook 440 G4-Y8B51EA i7-7500U, GeForce 930MX | Lenovo ThinkPad T460-20FN003LGE 6200U, HD Graphics 520 | Acer TravelMate P648-M-757N 6500U, HD Graphics 520 | |
|---|---|---|---|---|---|
| Noise | 2% | -2% | 0% | -2% | |
| uit / omgeving * | 30.3 | 29.2 4% | 29 4% | 29 4% | 31.2 -3% |
| Idle Minimum * | 30.3 | 29.2 4% | 29 4% | 29 4% | 31.2 -3% |
| Idle Average * | 30.3 | 29.2 4% | 29 4% | 29 4% | 31.2 -3% |
| Idle Maximum * | 30.3 | 29.2 4% | 29 4% | 29 4% | 31.6 -4% |
| Load Average * | 31.6 | 32.1 -2% | 37.4 -18% | 34.2 -8% | 33.3 -5% |
| Load Maximum * | 35 | 36.8 -5% | 39 -11% | 37.8 -8% | 32.4 7% |
* ... kleiner is beter
(±) De maximumtemperatuur aan de bovenzijde bedraagt 43 °C / 109 F, vergeleken met het gemiddelde van 34.2 °C / 94 F, variërend van 21.2 tot 62.5 °C voor de klasse Office.
(±) De bodem warmt op tot een maximum van 43 °C / 109 F, vergeleken met een gemiddelde van 36.7 °C / 98 F
(+) Bij onbelast gebruik bedraagt de gemiddelde temperatuur voor de bovenzijde 27.8 °C / 82 F, vergeleken met het apparaatgemiddelde van 29.5 °C / 85 F.
(+) De palmsteunen en het touchpad zijn met een maximum van ###max## °C / 79.2 F koeler dan de huidtemperatuur en voelen daarom koel aan.
(±) De gemiddelde temperatuur van de handpalmsteun van soortgelijke toestellen bedroeg 27.7 °C / 81.9 F (+1.5 °C / 2.7 F).
| Dell Latitude 14 E5470 6440HQ, HD Graphics 530 | Dell Latitude 14 E5470 6300U, HD Graphics 520 | HP ProBook 440 G4-Y8B51EA i7-7500U, GeForce 930MX | Lenovo ThinkPad T460-20FN003LGE 6200U, HD Graphics 520 | Acer TravelMate P648-M-757N 6500U, HD Graphics 520 | |
|---|---|---|---|---|---|
| Heat | 7% | 8% | 5% | 7% | |
| Maximum Upper Side * | 43 | 41.5 3% | 41.5 3% | 37.3 13% | 38.5 10% |
| Maximum Bottom * | 43 | 41.4 4% | 38.1 11% | 44.3 -3% | 36.7 15% |
| Idle Upper Side * | 31.2 | 26.9 14% | 28.4 9% | 29 7% | 31.5 -1% |
| Idle Bottom * | 31.3 | 29.6 5% | 28.3 10% | 30.1 4% | 29.6 5% |
* ... kleiner is beter
Dell Latitude 14 E5470 audioanalyse
(±) | luidspreker luidheid is gemiddeld maar goed (73 dB)
Bas 100 - 315 Hz
(-) | bijna geen lage tonen - gemiddeld 16.2% lager dan de mediaan
(+) | de lage tonen zijn lineair (4.3% delta naar de vorige frequentie)
Mids 400 - 2000 Hz
(±) | hogere middens - gemiddeld 5.3% hoger dan de mediaan
(+) | de middentonen zijn lineair (5.2% delta ten opzichte van de vorige frequentie)
Hoog 2 - 16 kHz
(±) | higher highs - on average 6.8% higher than median
(+) | de hoge tonen zijn lineair (2.9% delta naar de vorige frequentie)
Algemeen 100 - 16.000 Hz
(±) | lineariteit van het totale geluid is gemiddeld (19.7% verschil met de mediaan)
Vergeleken met dezelfde klasse
» 35% van alle geteste apparaten in deze klasse waren beter, 7% vergelijkbaar, 58% slechter
» De beste had een delta van 7%, het gemiddelde was 22%, de slechtste was 53%
Vergeleken met alle geteste toestellen
» 44% van alle geteste apparaten waren beter, 7% gelijk, 48% slechter
» De beste had een delta van 4%, het gemiddelde was 25%, de slechtste was 134%
Apple MacBook 12 (Early 2016) 1.1 GHz audioanalyse
(+) | luidsprekers kunnen relatief luid spelen (83.6 dB)
Bas 100 - 315 Hz
(±) | verminderde zeebaars - gemiddeld 11.3% lager dan de mediaan
(±) | lineariteit van de lage tonen is gemiddeld (14.2% delta ten opzichte van de vorige frequentie)
Mids 400 - 2000 Hz
(+) | evenwichtige middens - slechts 2.4% verwijderd van de mediaan
(+) | de middentonen zijn lineair (5.5% delta ten opzichte van de vorige frequentie)
Hoog 2 - 16 kHz
(+) | evenwichtige hoogtepunten - slechts 2% verwijderd van de mediaan
(+) | de hoge tonen zijn lineair (4.5% delta naar de vorige frequentie)
Algemeen 100 - 16.000 Hz
(+) | het totale geluid is lineair (10.2% verschil met de mediaan)
Vergeleken met dezelfde klasse
» 5% van alle geteste apparaten in deze klasse waren beter, 2% vergelijkbaar, 93% slechter
» De beste had een delta van 5%, het gemiddelde was 19%, de slechtste was 53%
Vergeleken met alle geteste toestellen
» 3% van alle geteste apparaten waren beter, 1% gelijk, 96% slechter
» De beste had een delta van 4%, het gemiddelde was 25%, de slechtste was 134%
| Uit / Standby | |
| Inactief | |
| Belasting |
|
| Dell Latitude 14 E5470 6440HQ, HD Graphics 530, Micron SSD 1100 (MTFDDAV256TBN) | Dell Latitude 14 E5470 6300U, HD Graphics 520, Liteon L8H-256V2G | HP ProBook 440 G4-Y8B51EA i7-7500U, GeForce 930MX, SanDisk SD8SNAT256G1002 | Lenovo ThinkPad T460-20FN003LGE 6200U, HD Graphics 520, Toshiba HG6 THNSFJ256GCSU | Acer TravelMate P648-M-757N 6500U, HD Graphics 520, Lite-On CV1-8B256 | |
|---|---|---|---|---|---|
| Power Consumption | 29% | 14% | 23% | -0% | |
| Idle Minimum * | 4.1 | 3.5 15% | 3 27% | 3.5 15% | 5.3 -29% |
| Idle Average * | 8.1 | 5.3 35% | 5.4 33% | 6.7 17% | 9.3 -15% |
| Idle Maximum * | 11.4 | 6 47% | 6.3 45% | 7.3 36% | 11.5 -1% |
| Load Average * | 33.5 | 26.3 21% | 37.5 -12% | 28.2 16% | 30.8 8% |
| Load Maximum * | 49 | 36.6 25% | 61.1 -25% | 34.6 29% | 32 35% |
* ... kleiner is beter
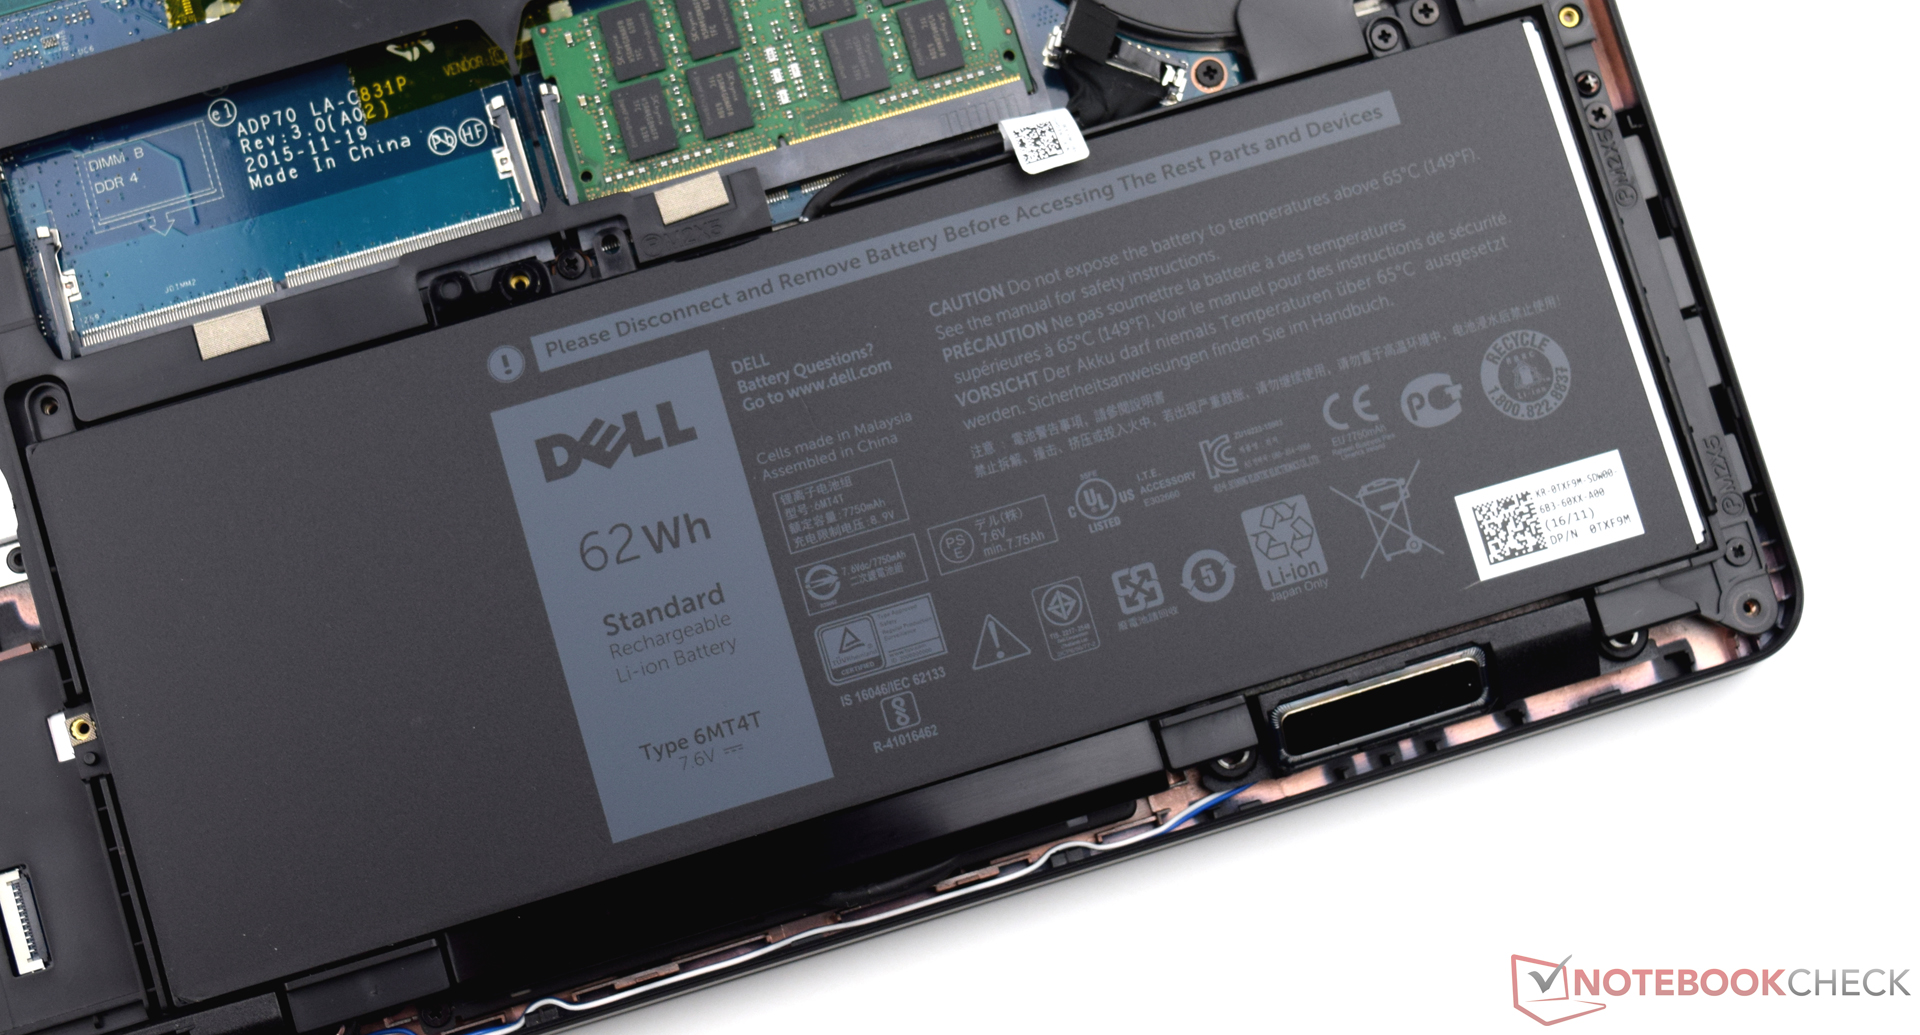
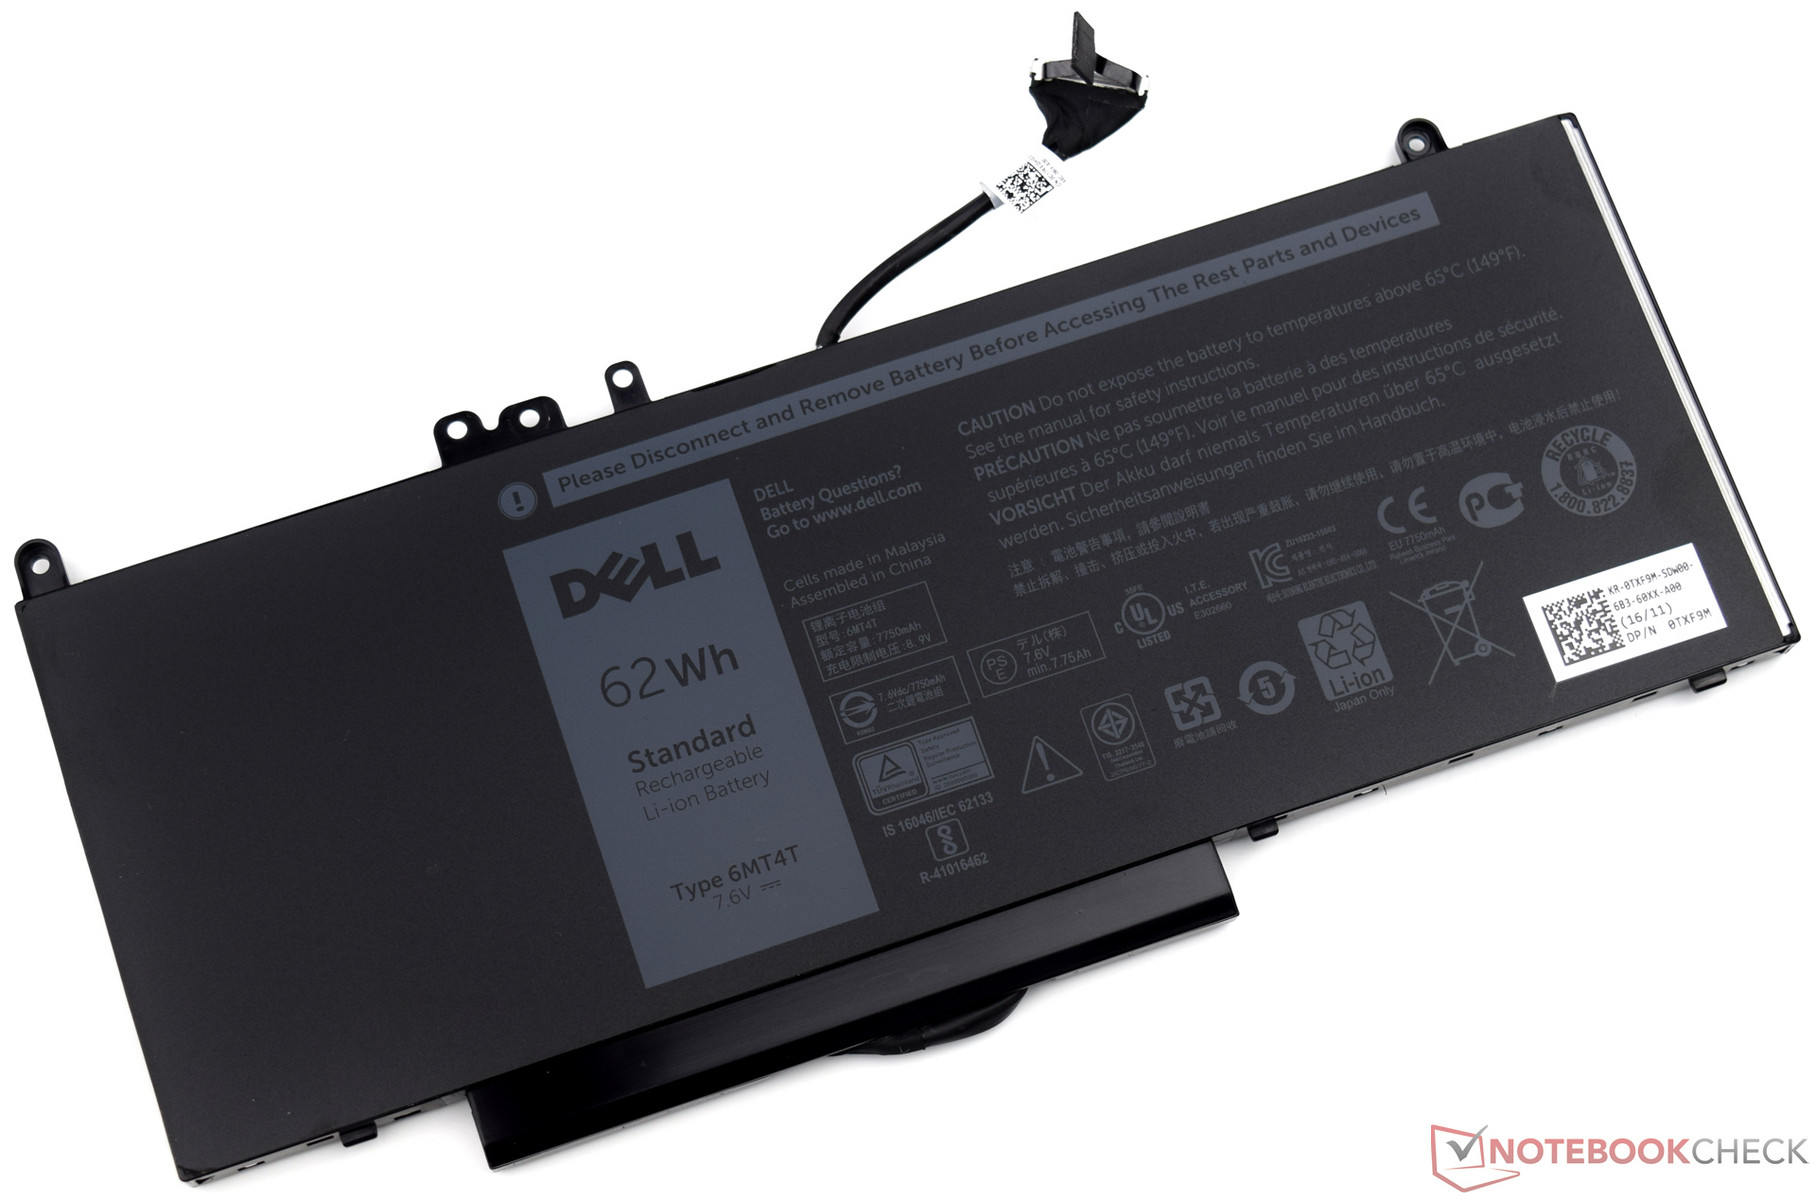

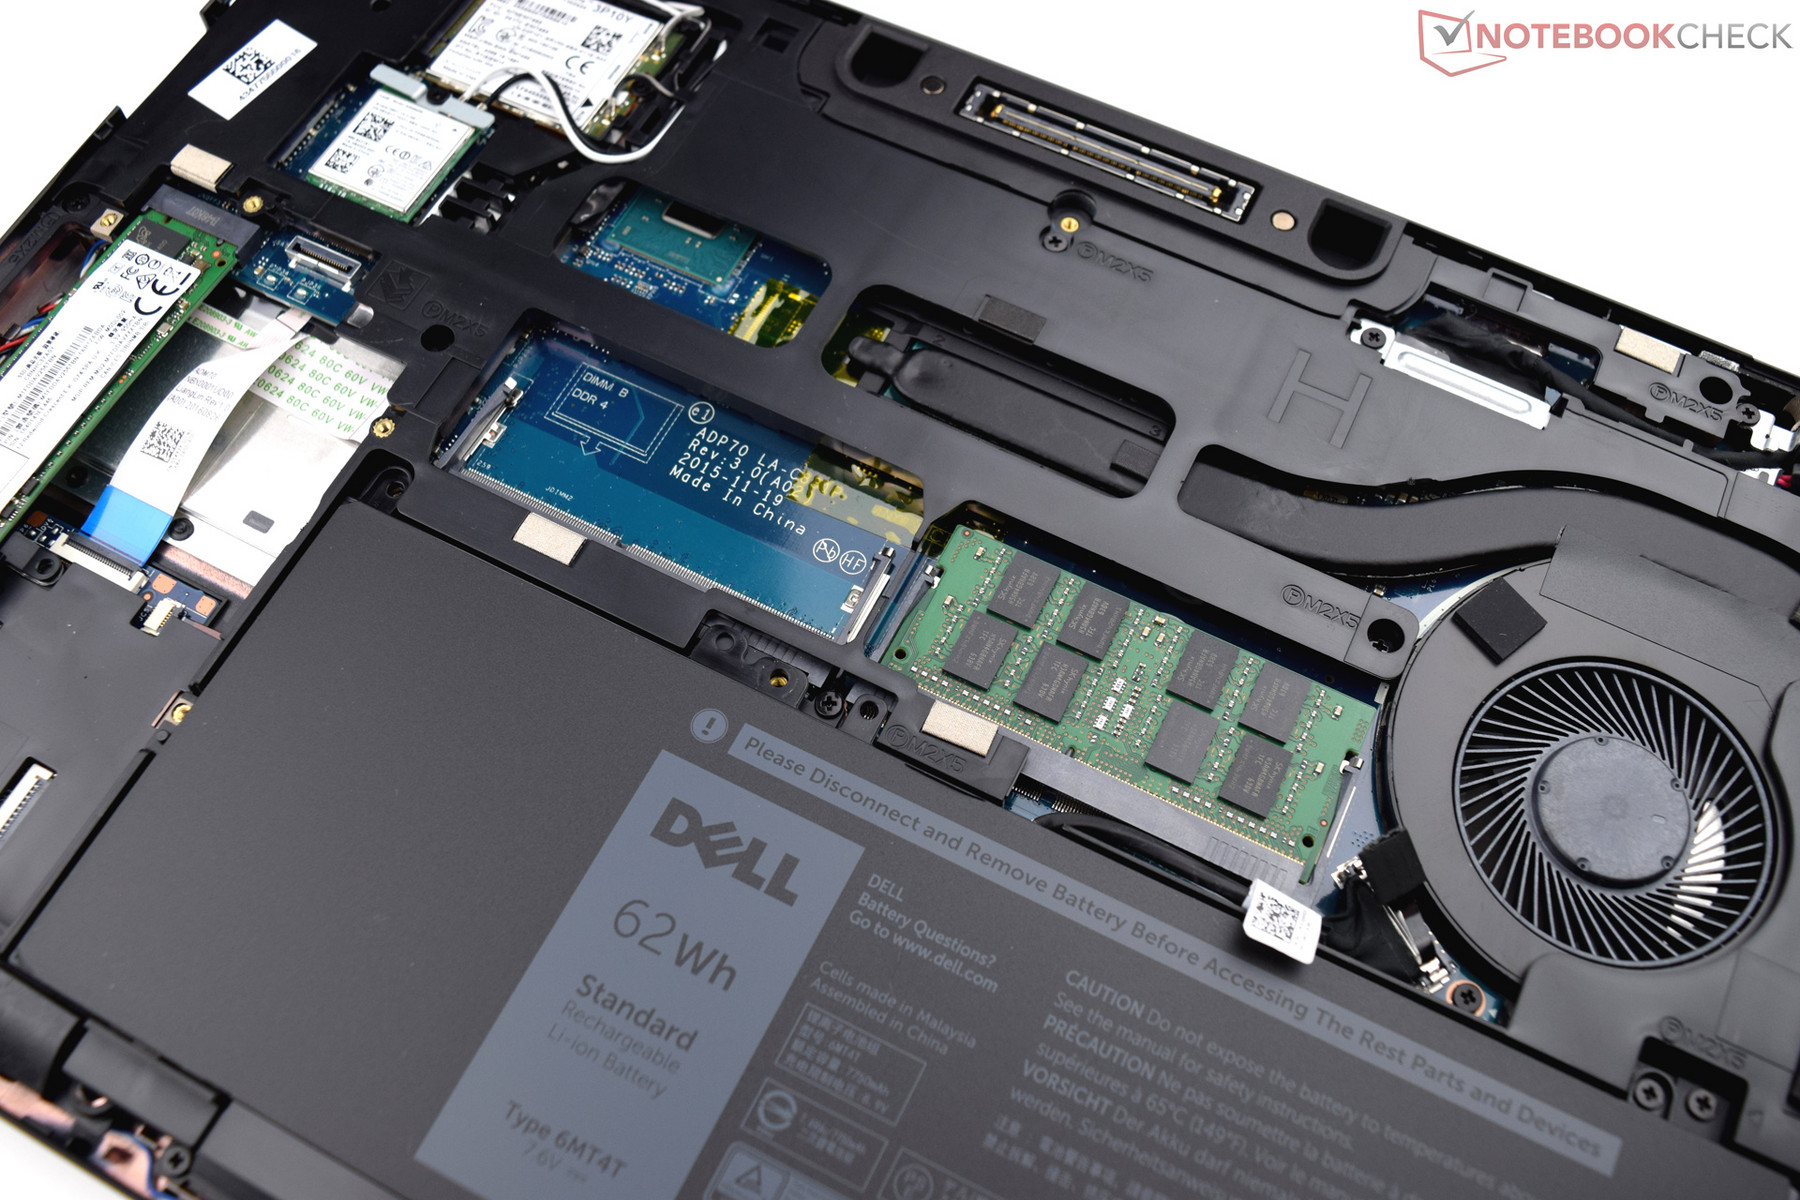
| Dell Latitude 14 E5470 6440HQ, HD Graphics 530, 62 Wh | Dell Latitude 14 E5470 6300U, HD Graphics 520, 62 Wh | HP ProBook 440 G4-Y8B51EA i7-7500U, GeForce 930MX, 48 Wh | Lenovo ThinkPad T460-20FN003LGE 6200U, HD Graphics 520, 46 Wh | Acer TravelMate P648-M-757N 6500U, HD Graphics 520, 54 Wh | |
|---|---|---|---|---|---|
| Batterijduur | 64% | 33% | 6% | 27% | |
| Reader / Idle | 913 | 1304 43% | 1083 19% | 953 4% | 1083 19% |
| H.264 | 411 | 645 57% | 571 39% | 512 25% | 545 33% |
| WiFi v1.3 | 432 | 667 54% | 414 -4% | 338 -22% | 543 26% |
| Load | 85 | 172 102% | 151 78% | 98 15% | 110 29% |
Pro
Contra
Dit is de verkorte versie van het originele artikel. Het volledige, Engelse testrapport vind je hier.
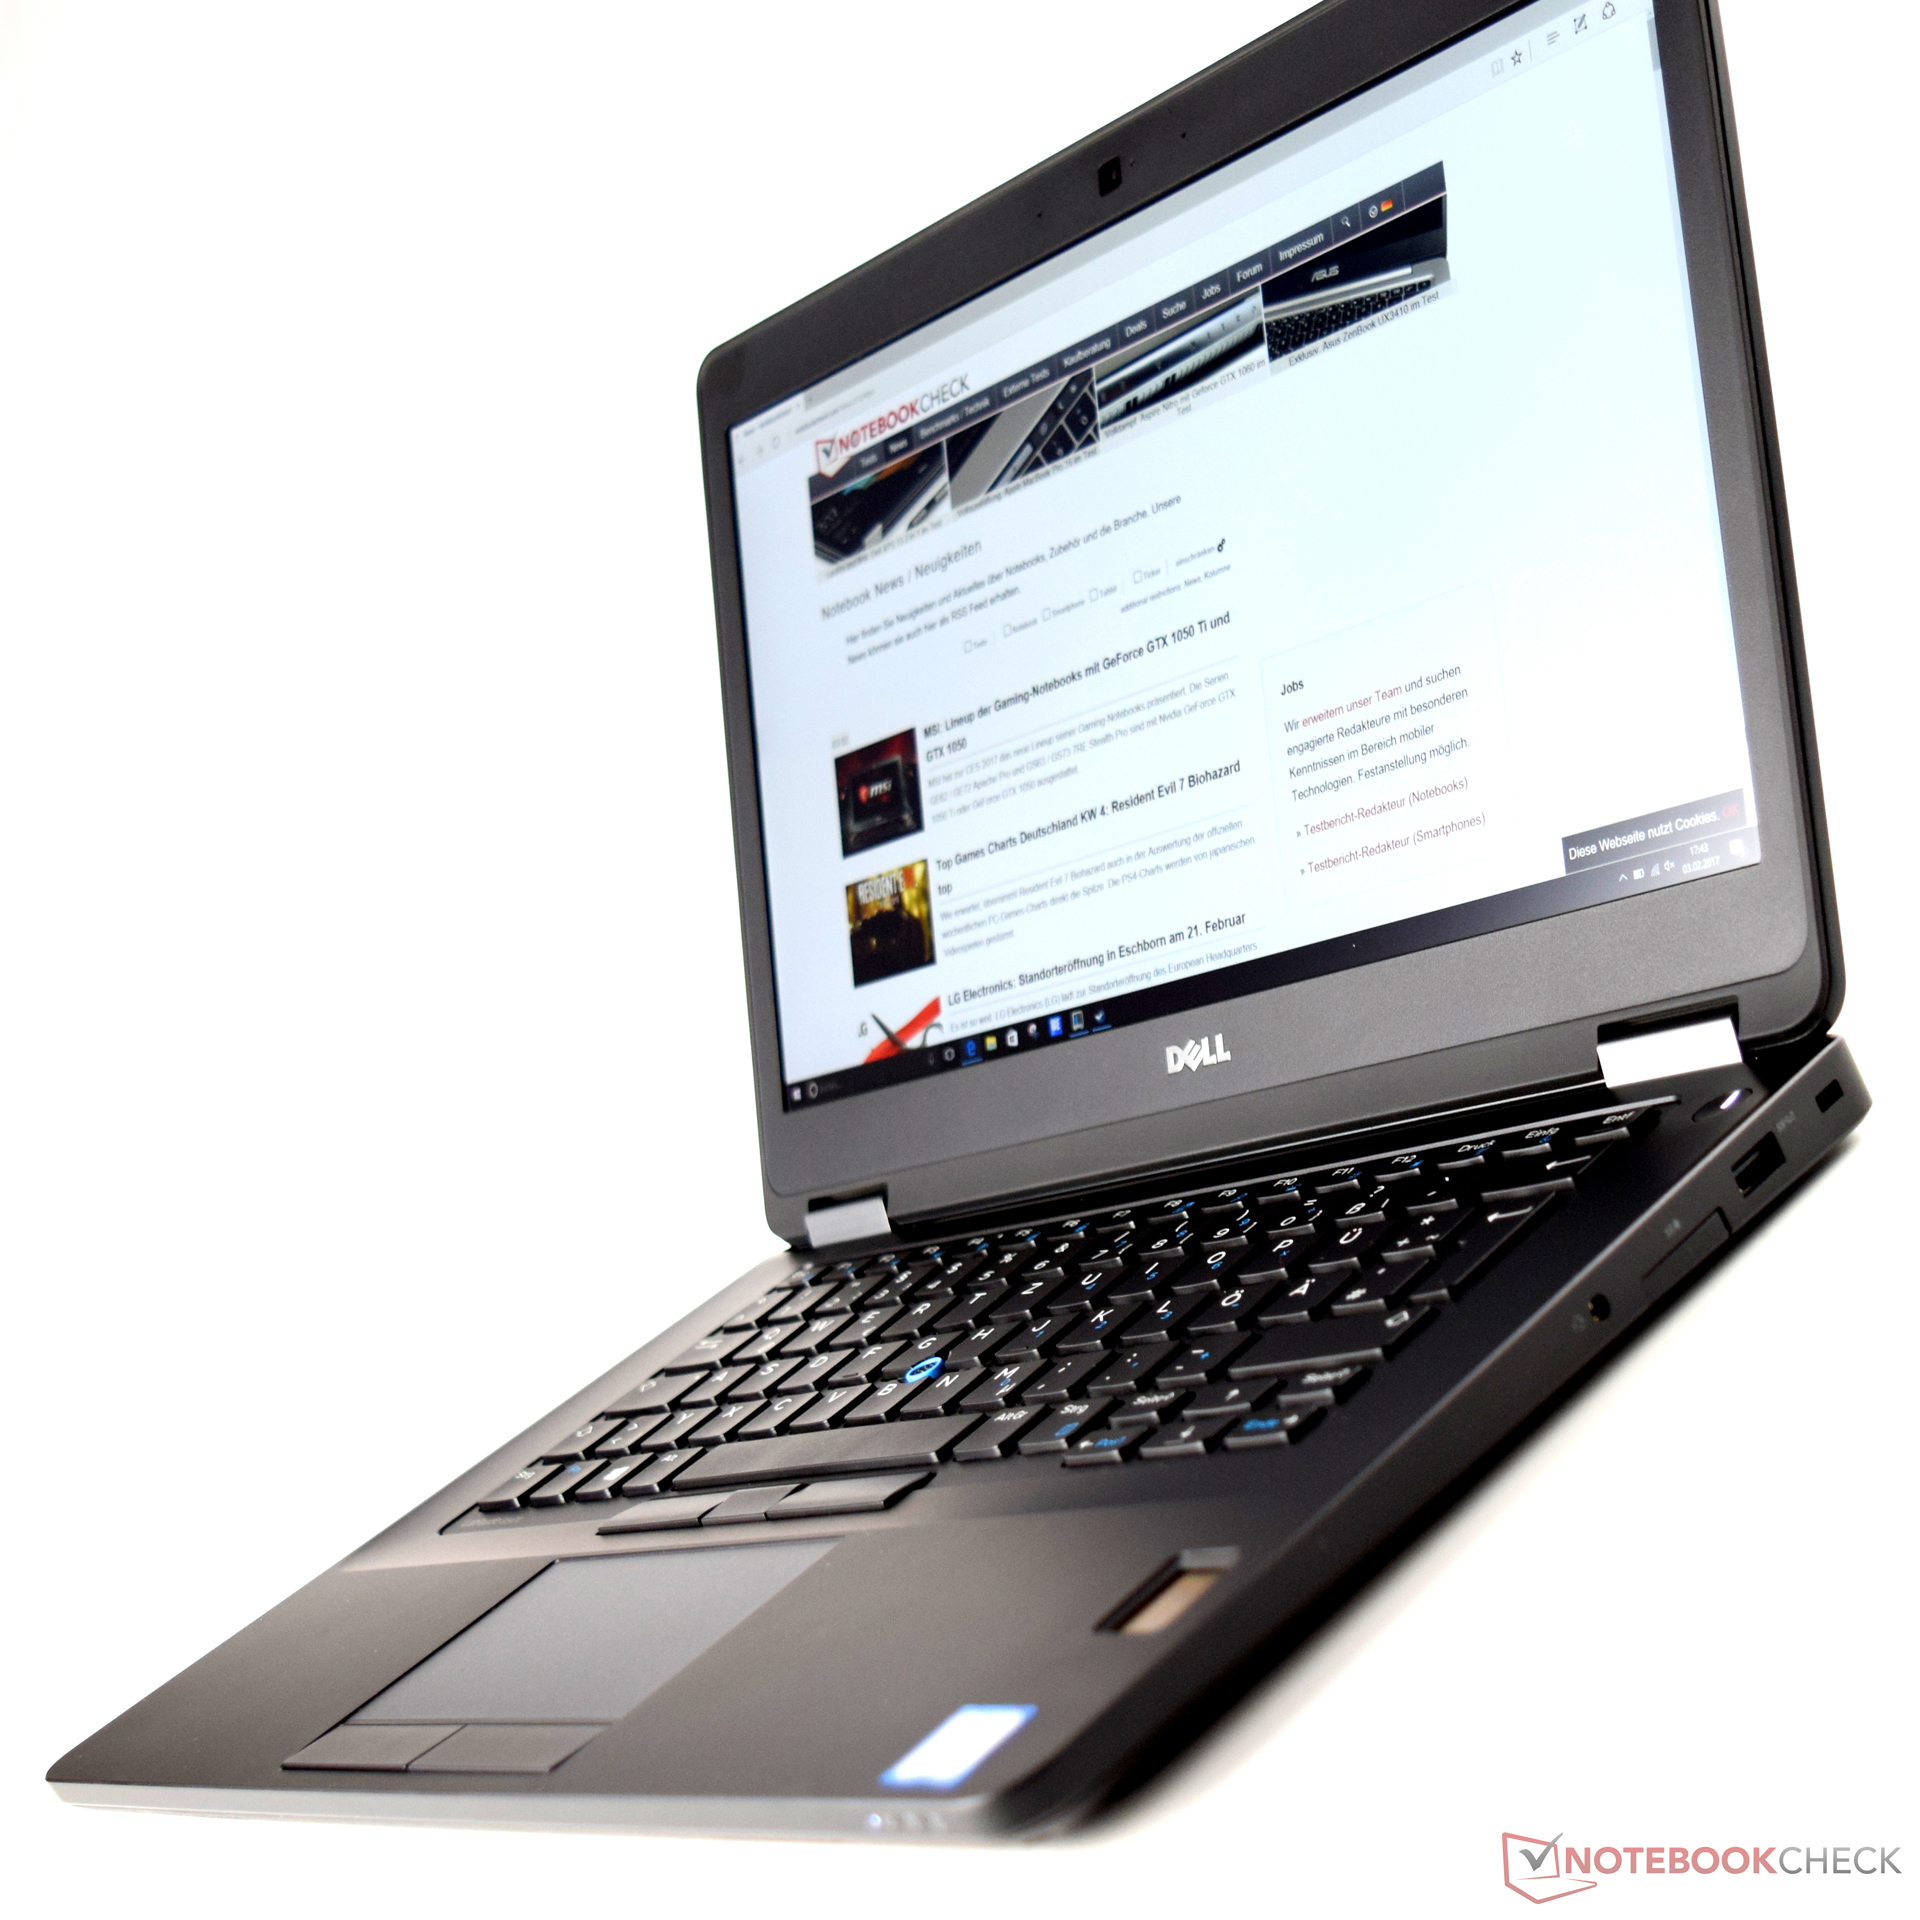
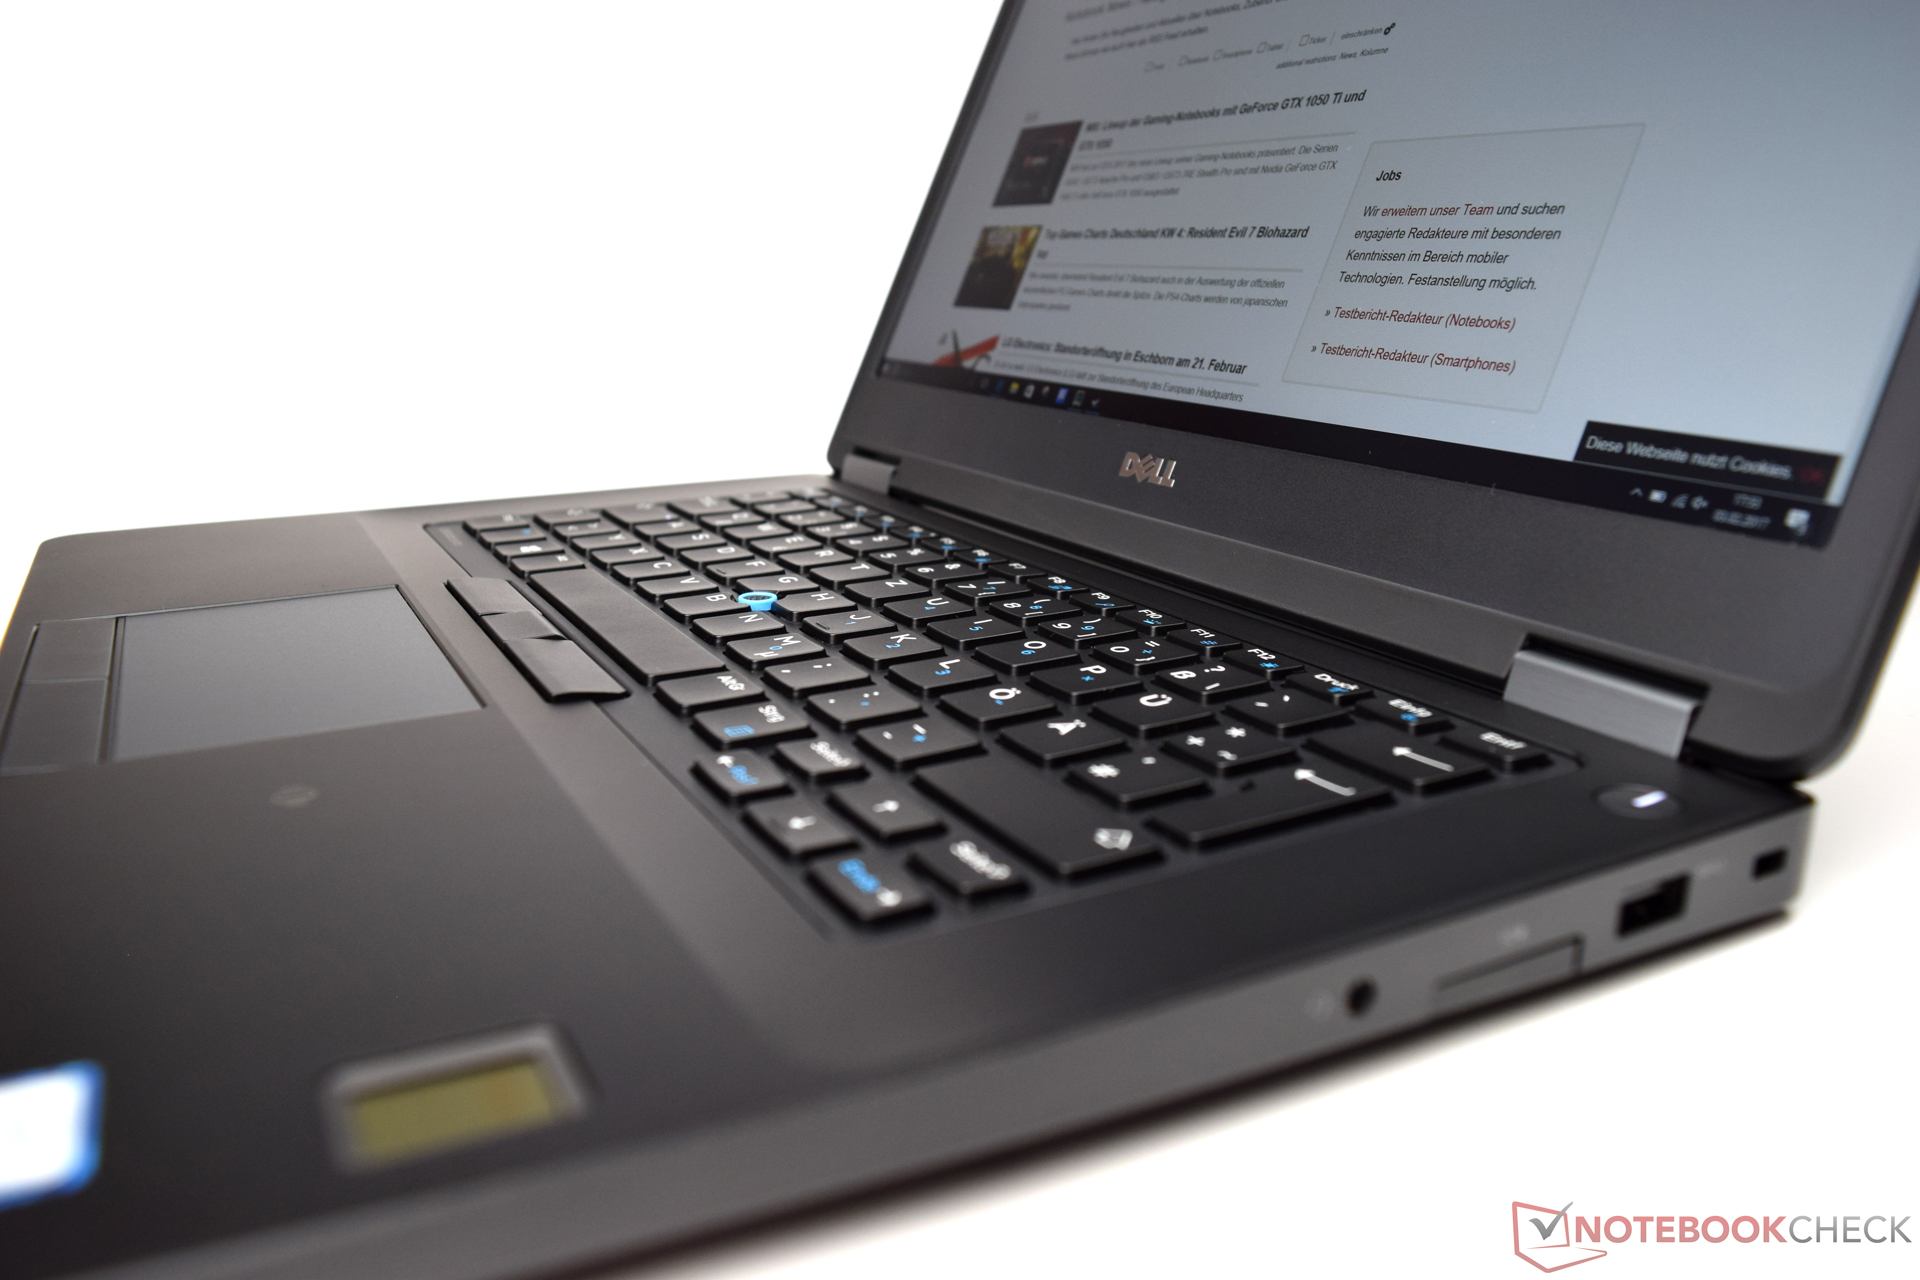
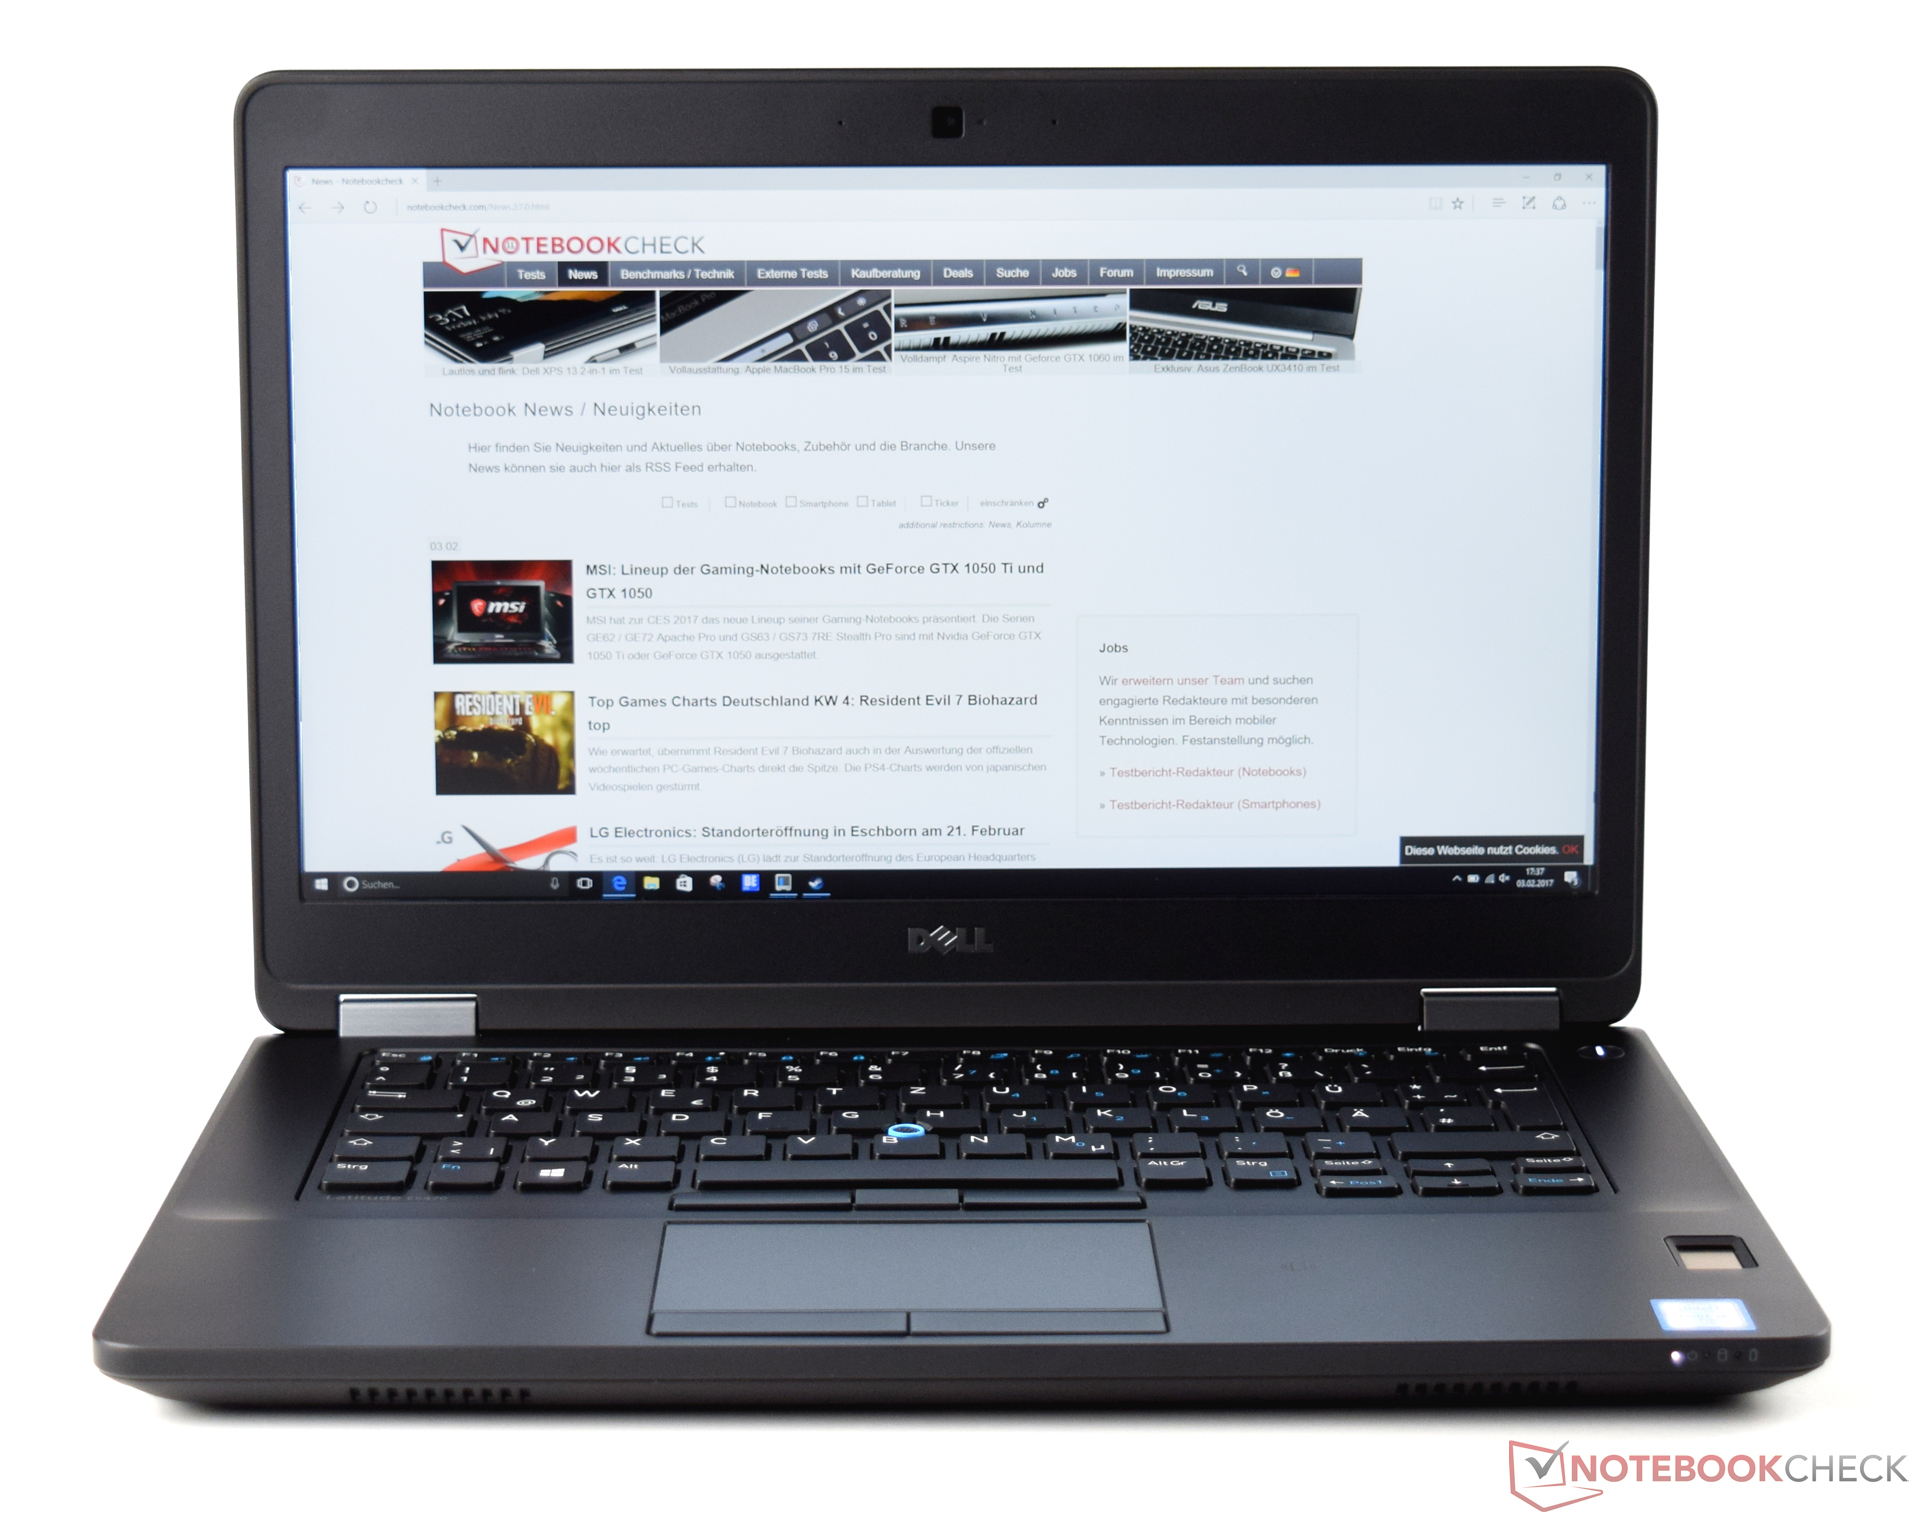
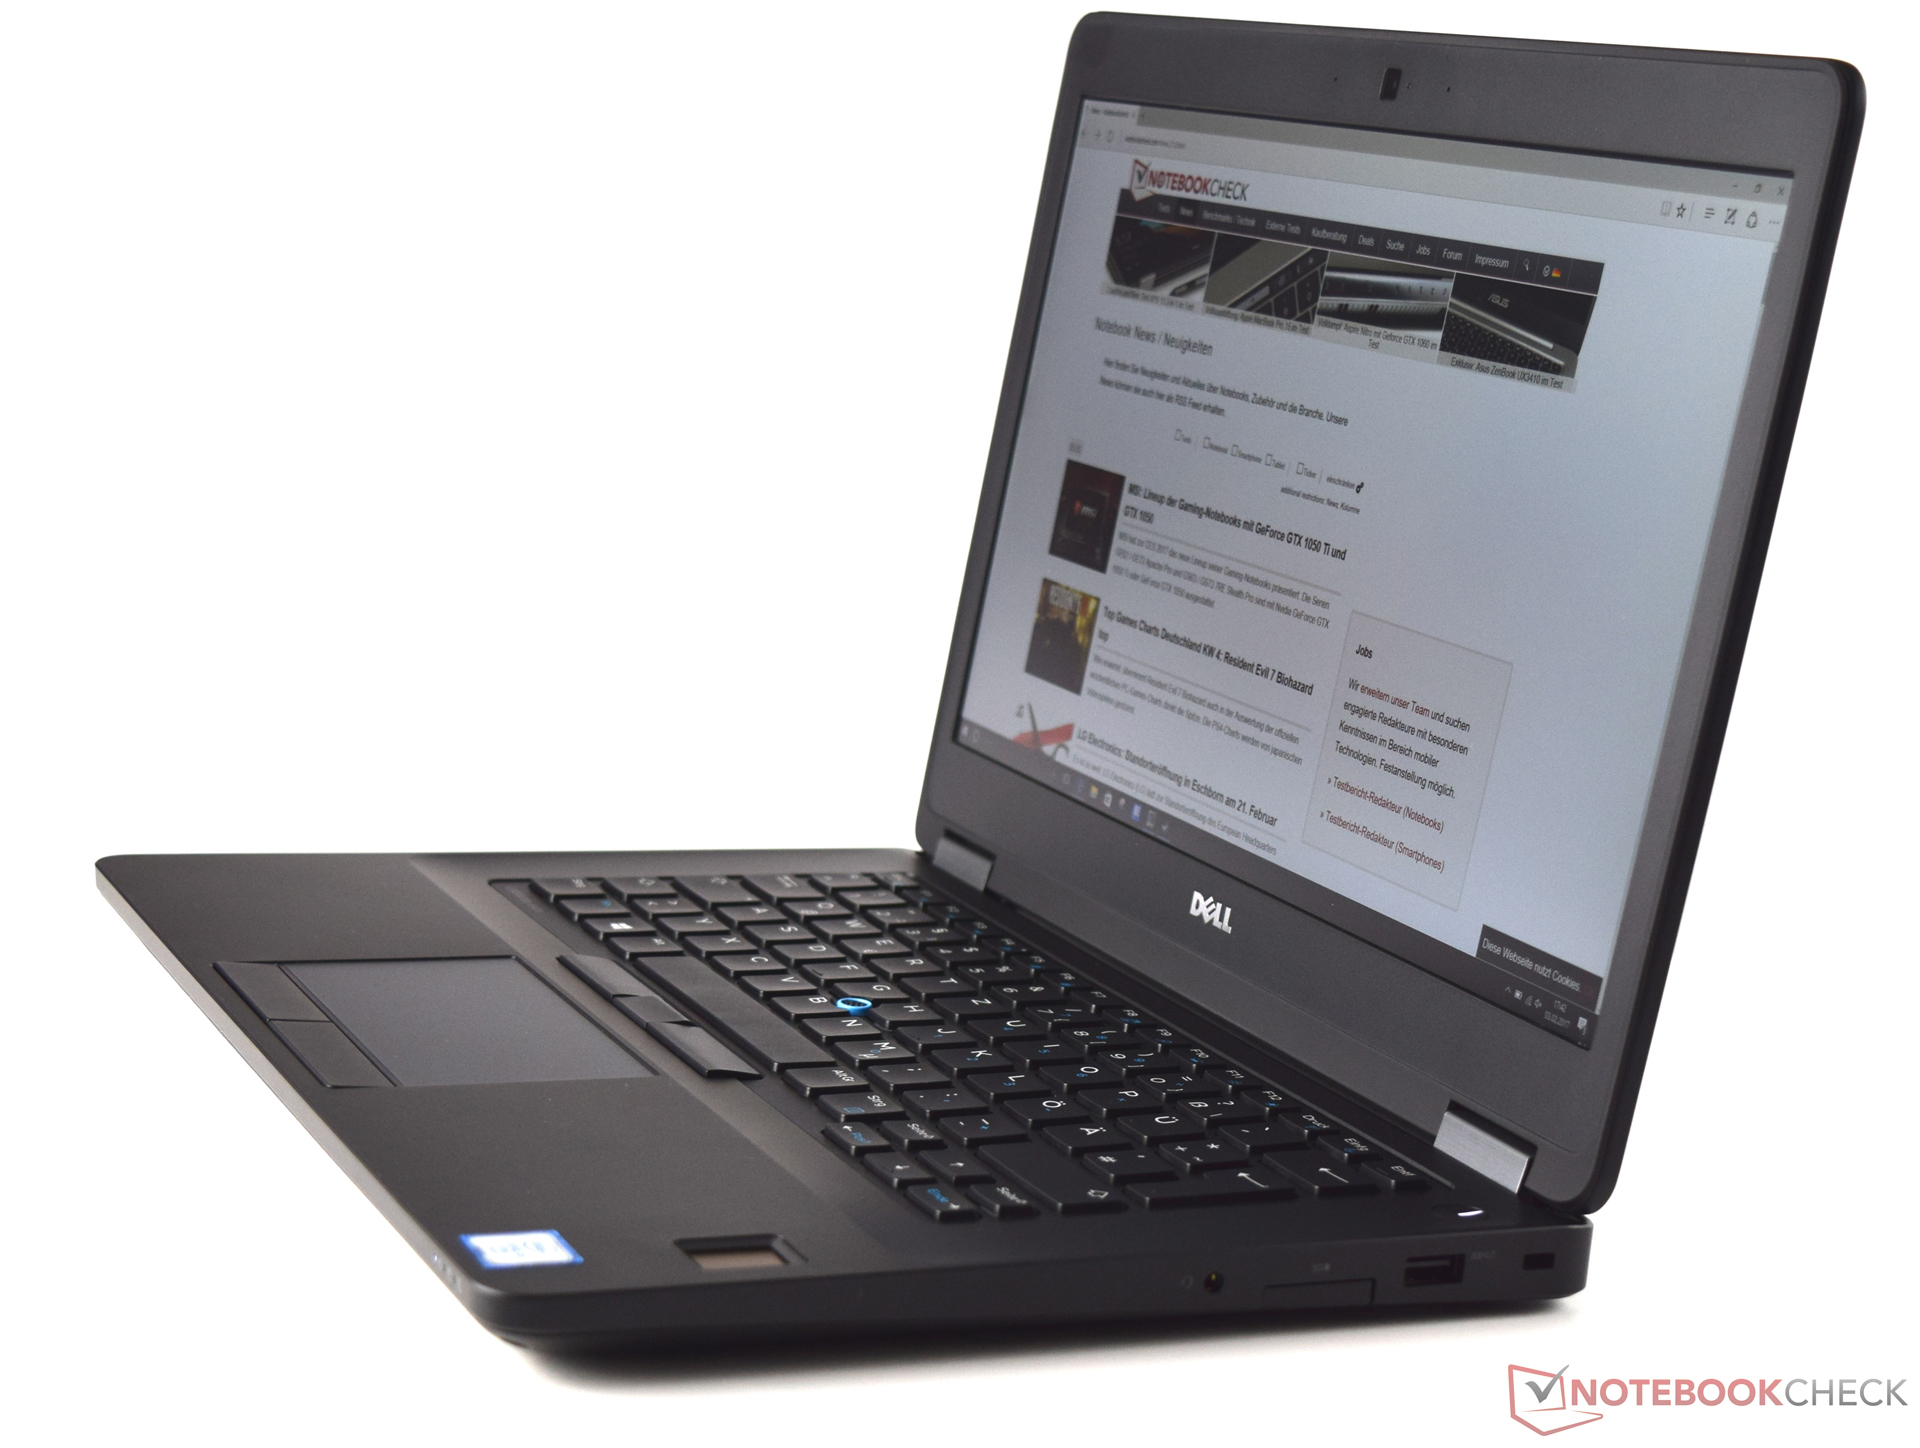
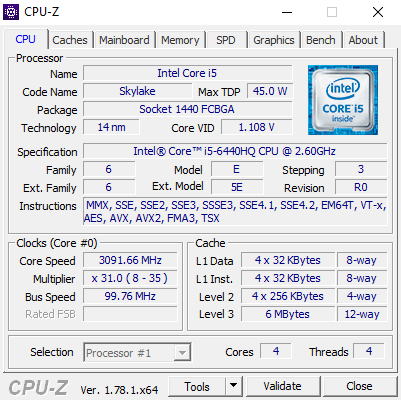
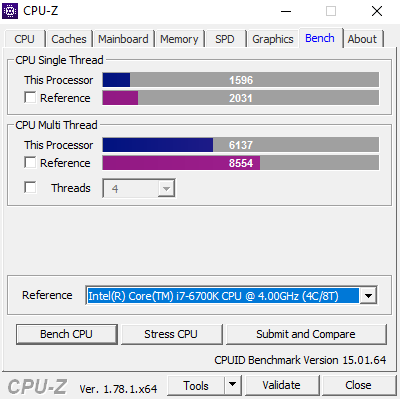
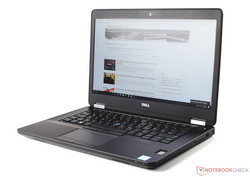
Dell presenteert een prachtig gebouwde zakelijke notebook met fatsoenlijke prestaties. Hoewel een wat oudere Skylake processor gebruikt is in de Dell Latitude 14 E5470, presteert deze in enkele gevallen beter dan nieuwe Kaby Lake processoren. Vier fysieke cores zijn simpelweg efficiënter wanneer de applicaties multithreading ondersteunen. De combinatie van een sterke processor, 8 GB werkgeheugen en een 256 GB SSD verzekeren een vloeiend draaien systeem.
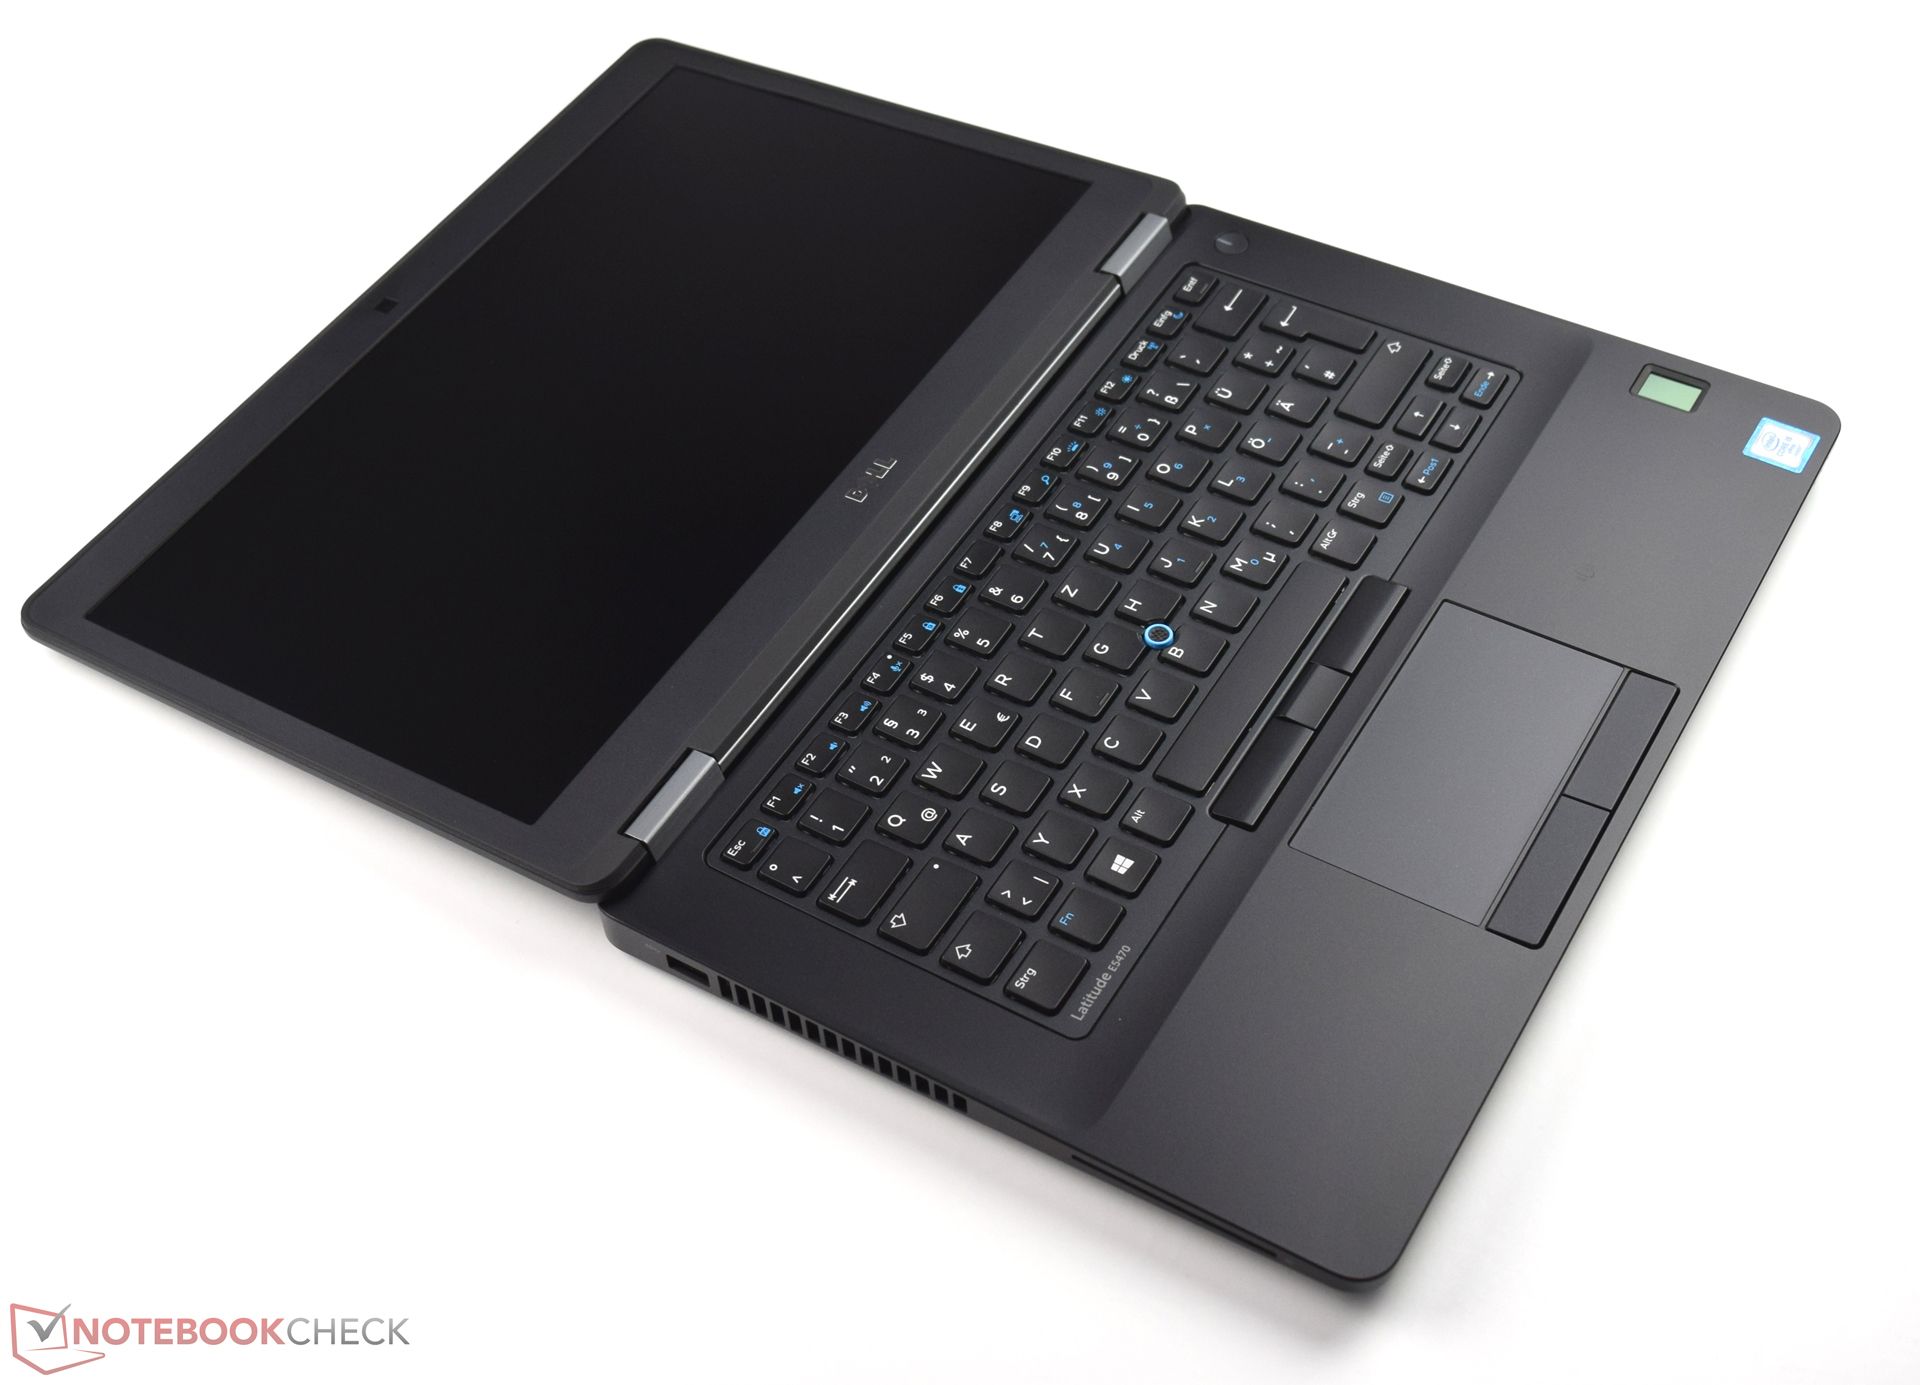
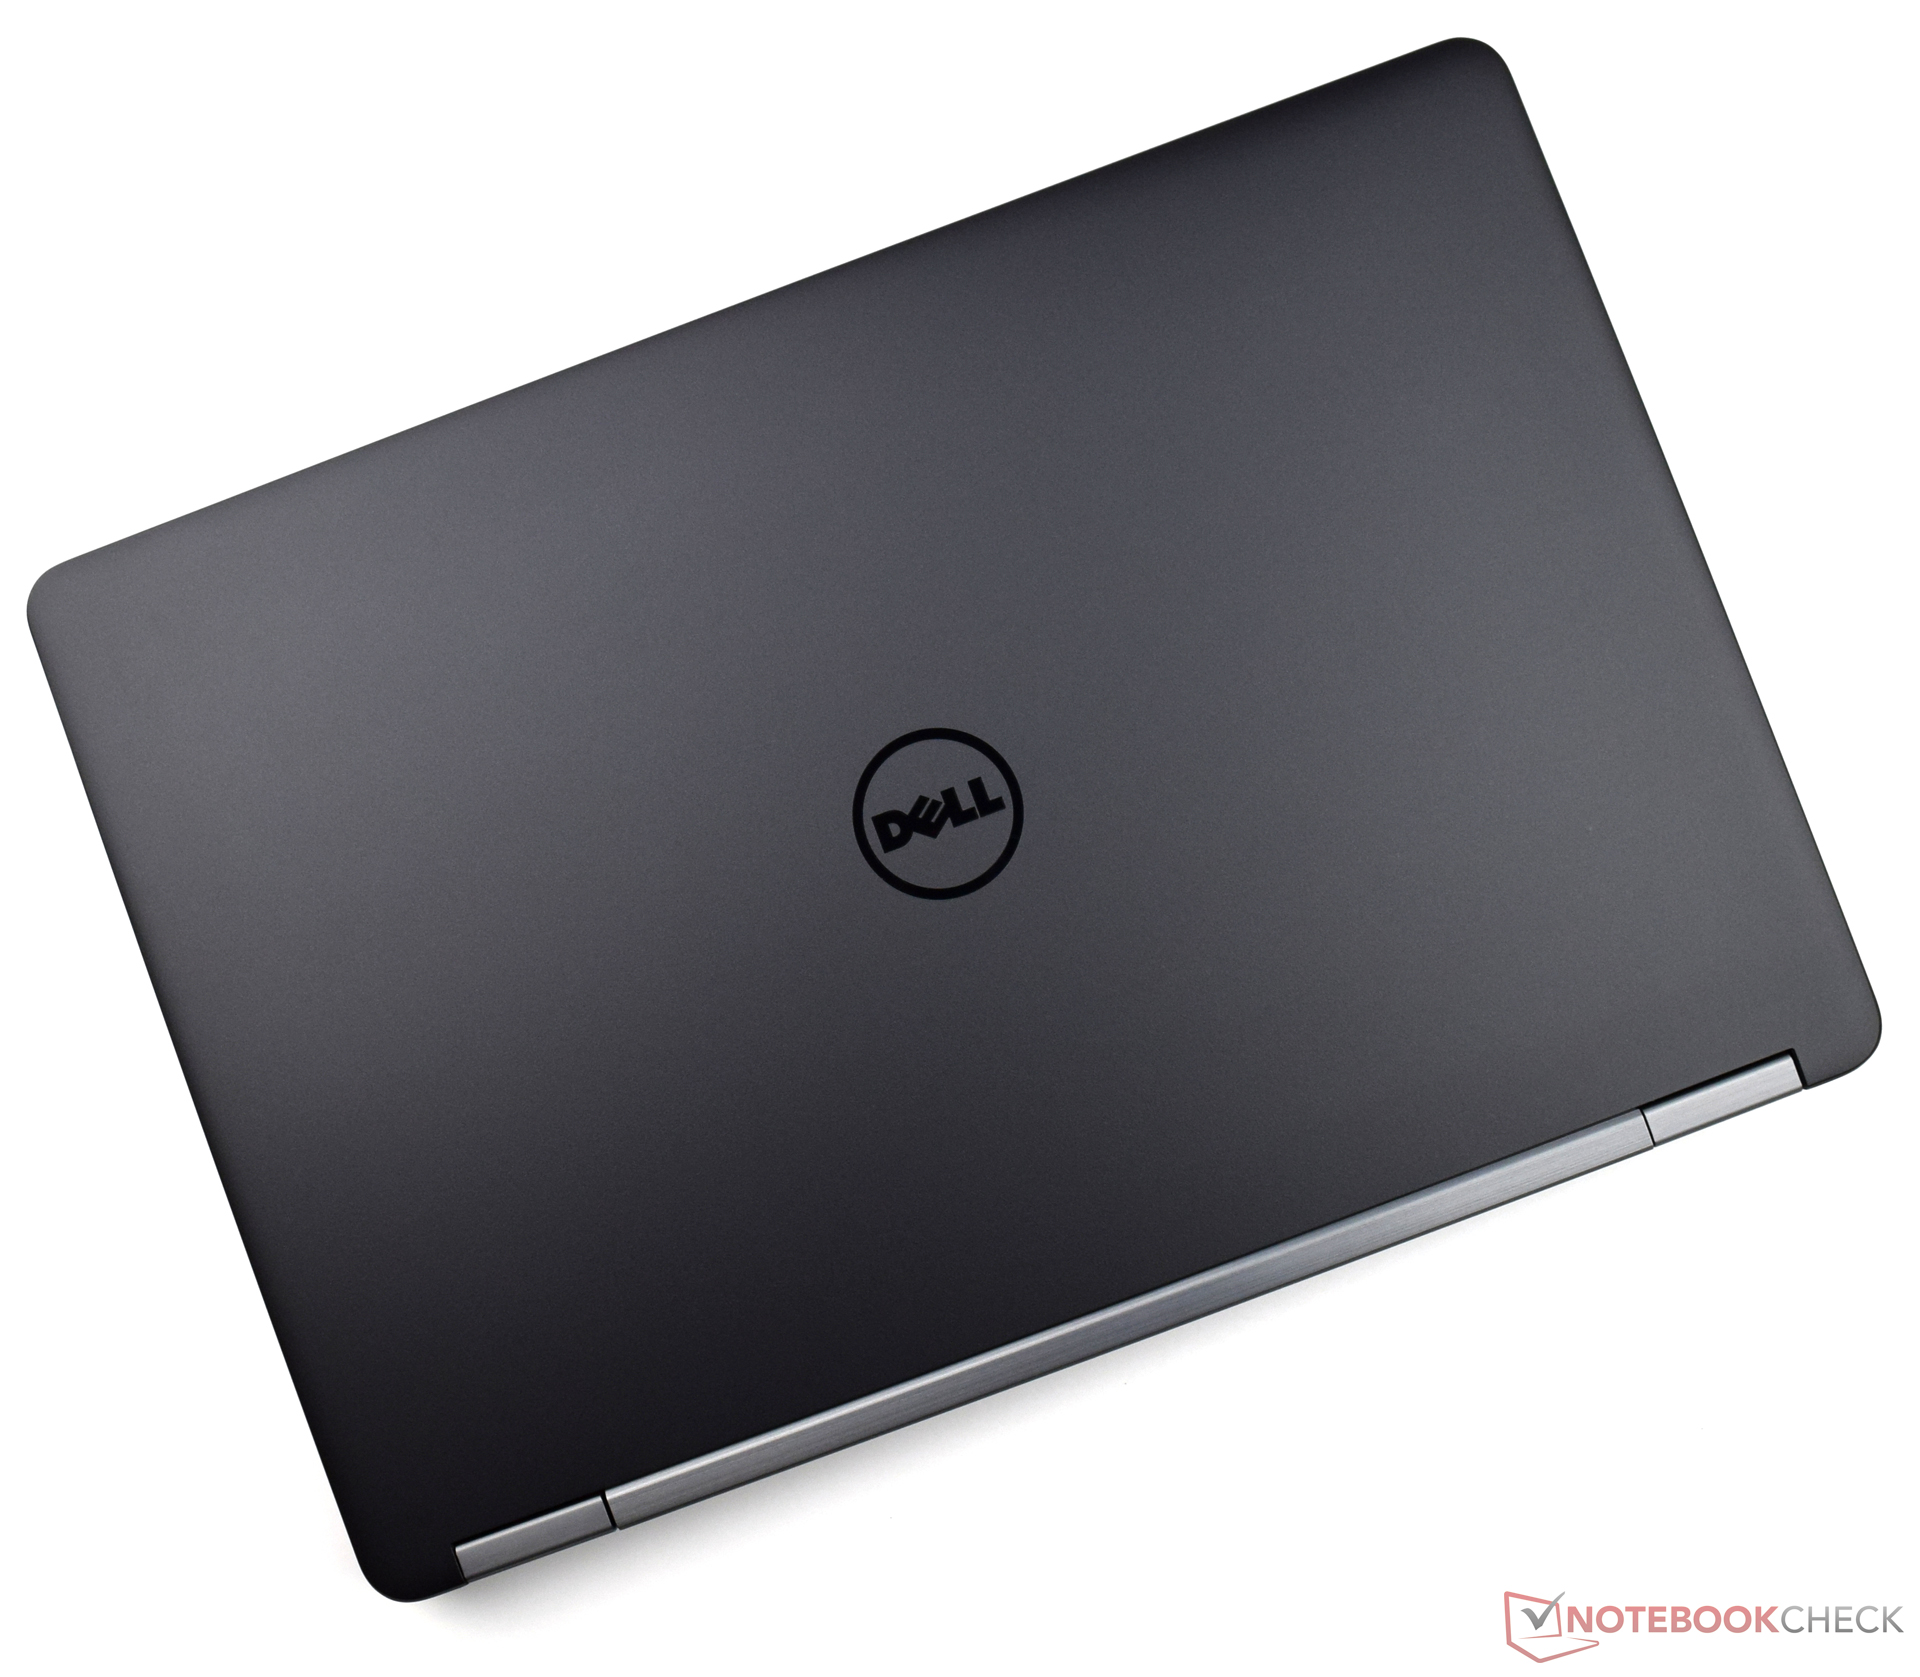
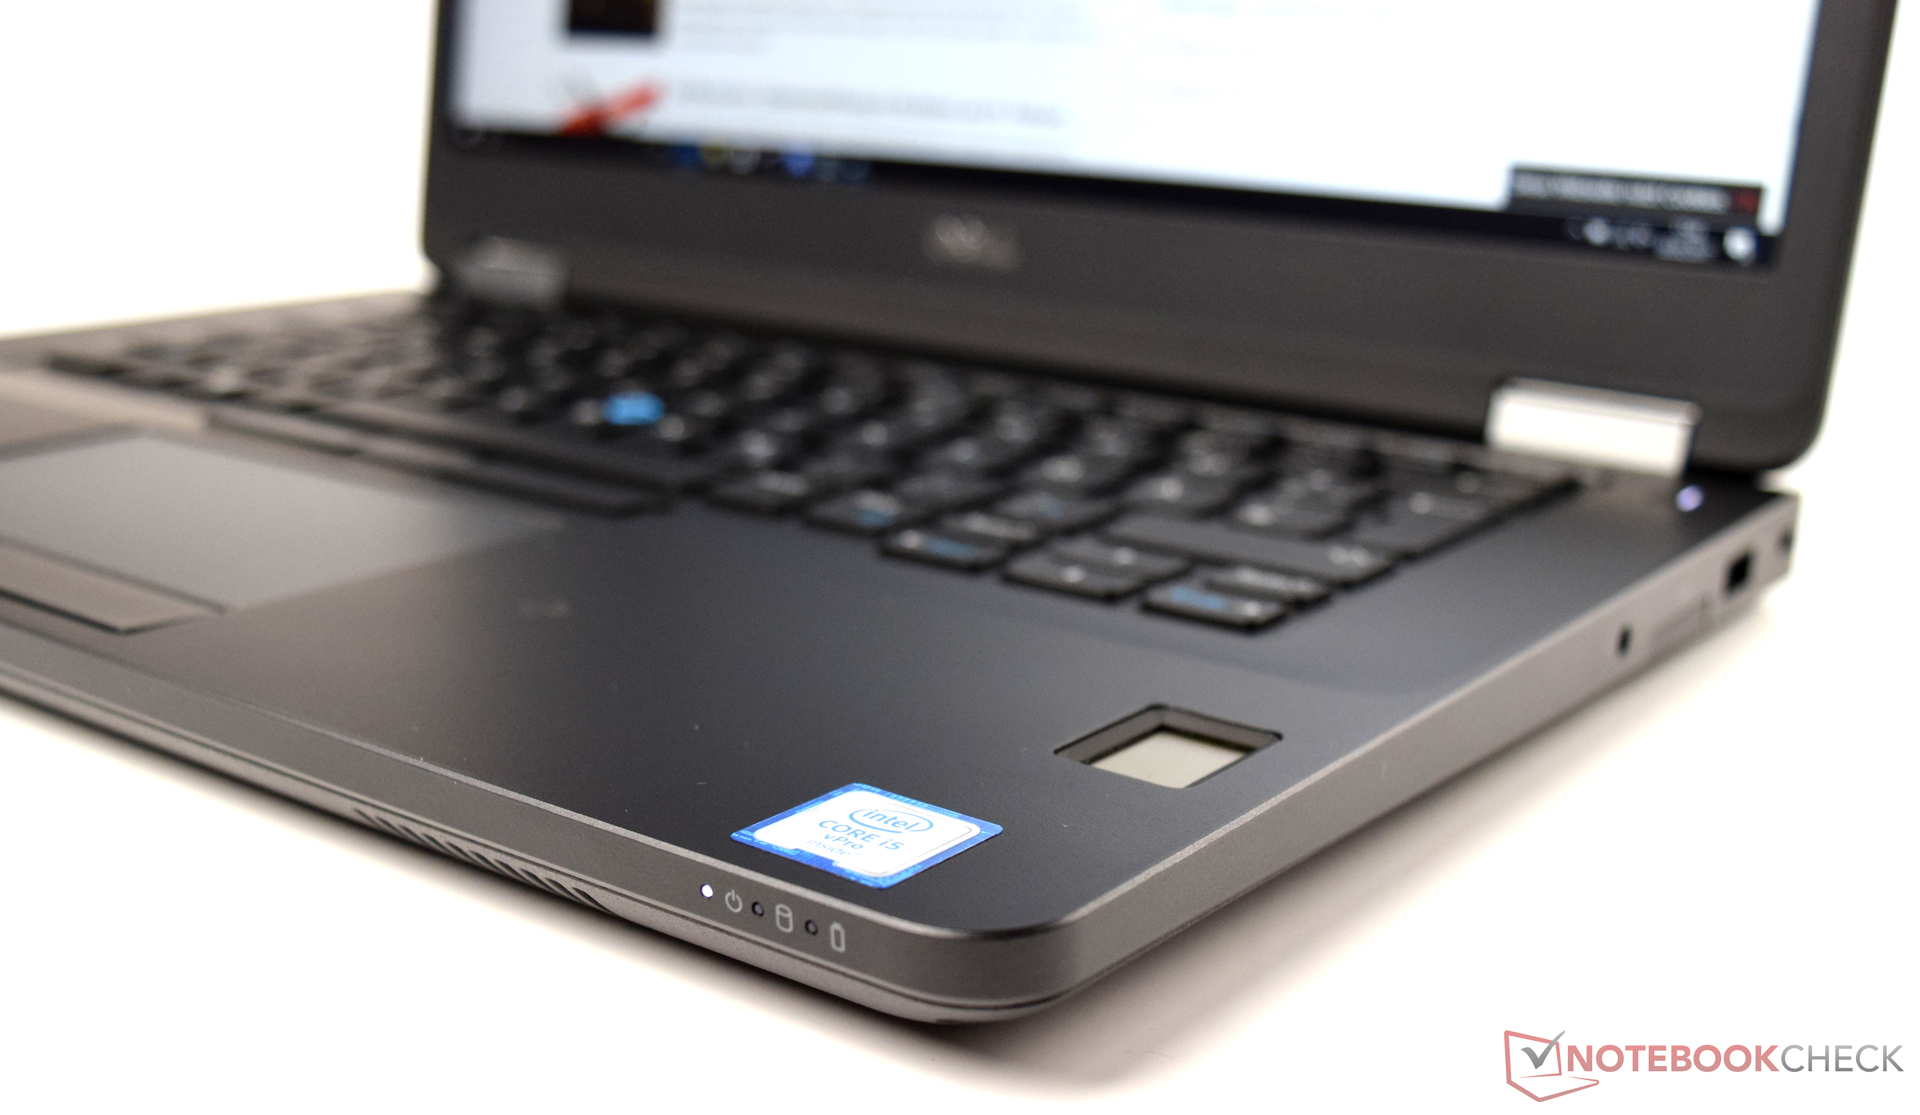
Dell's Latitude 14 E5470 overtuigd ons met zijn goede systeem prestaties in de test. De invoerapparaten, de solide en stijlvolle behuizing en hoge kwaliteit fabricage zorgen allen voor een lange levensduur. Verscheidene beveiligingsfunctionaliteiten ondersteunen gebruik in een kantooromgeving.
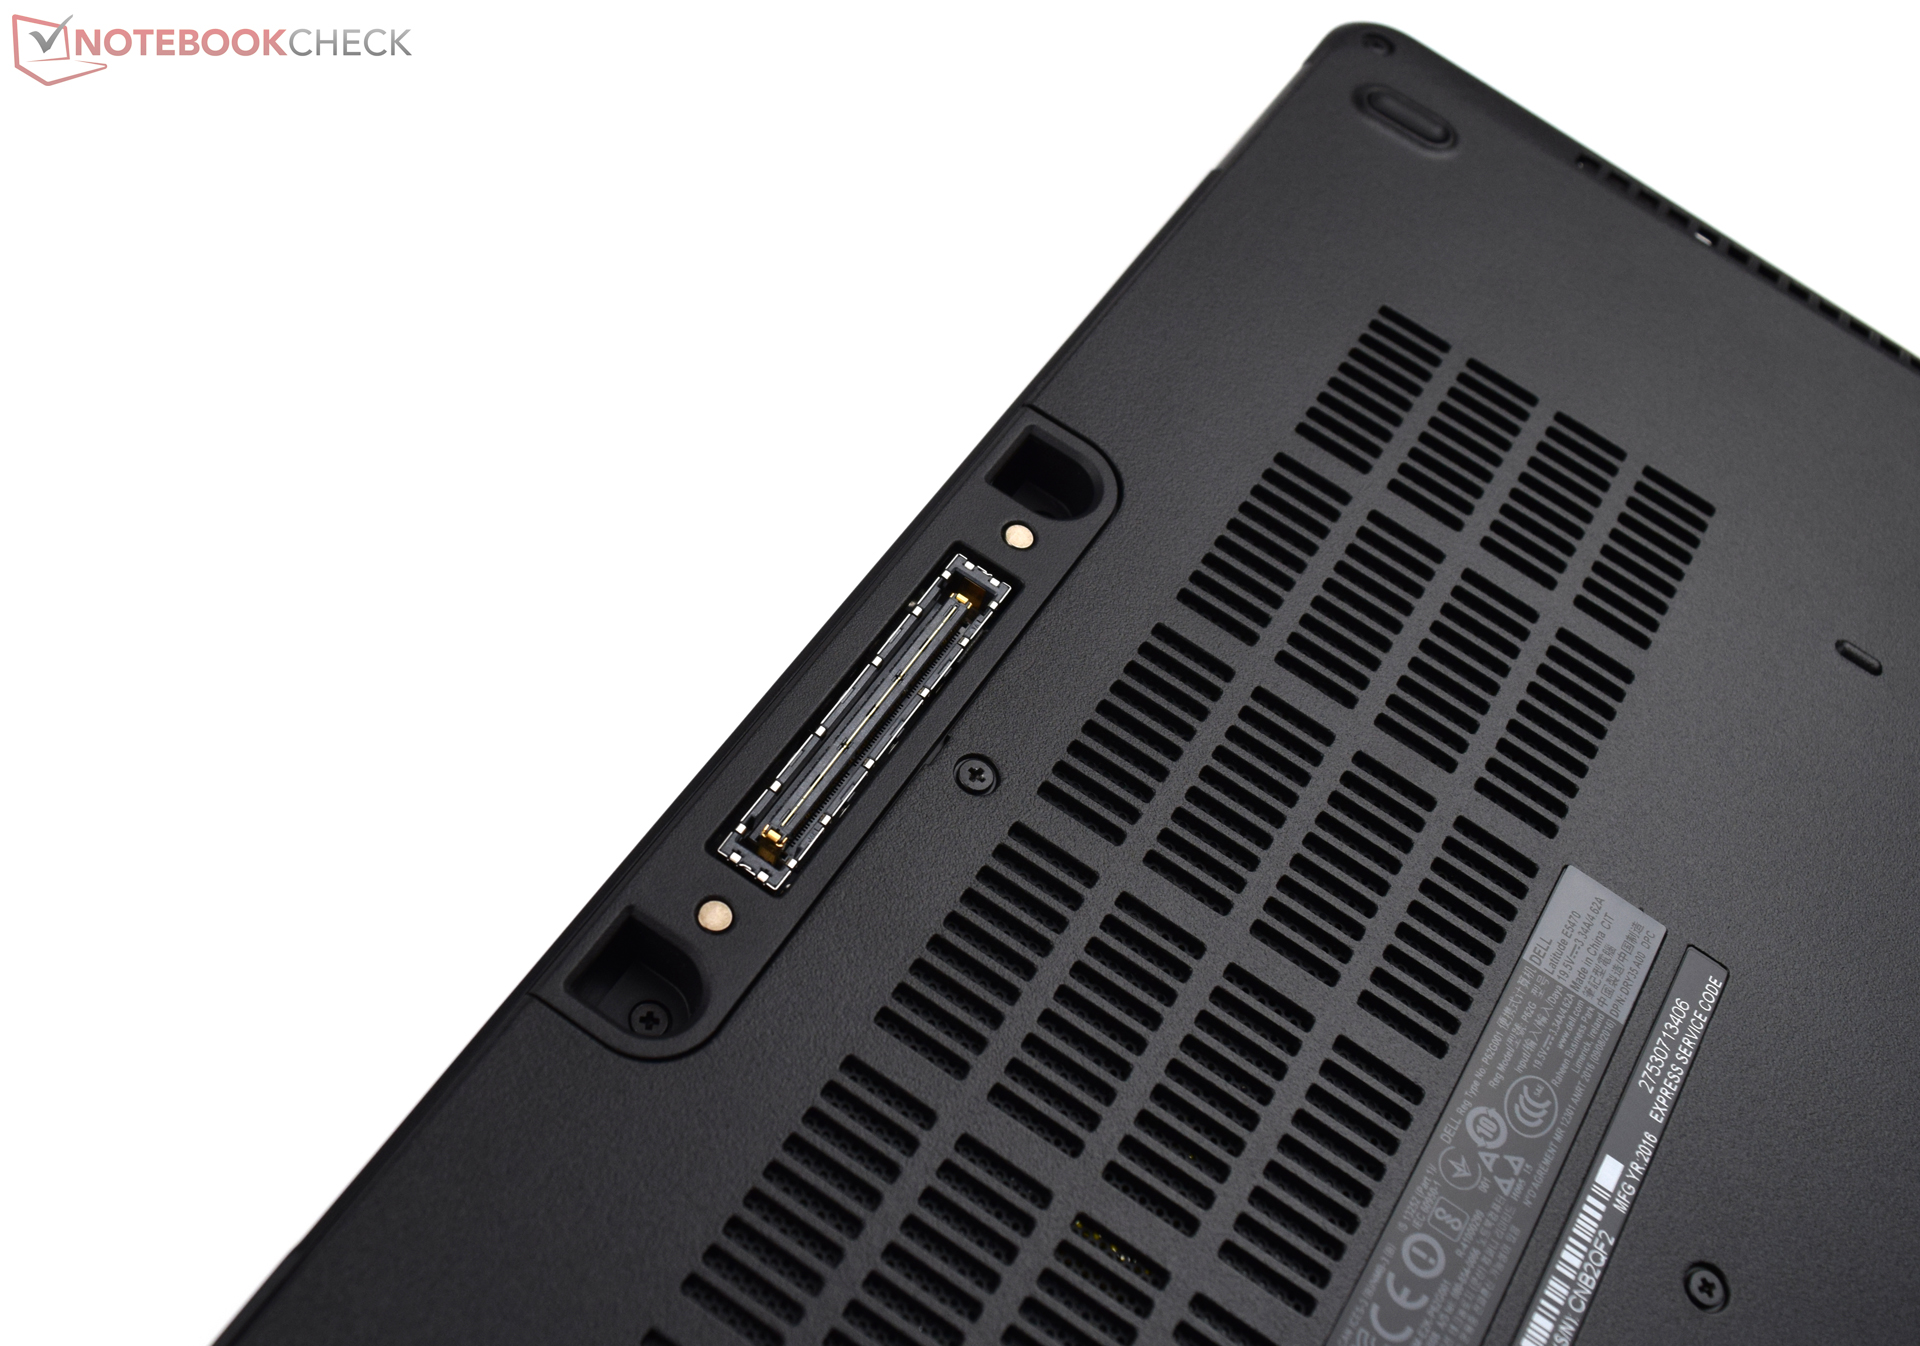
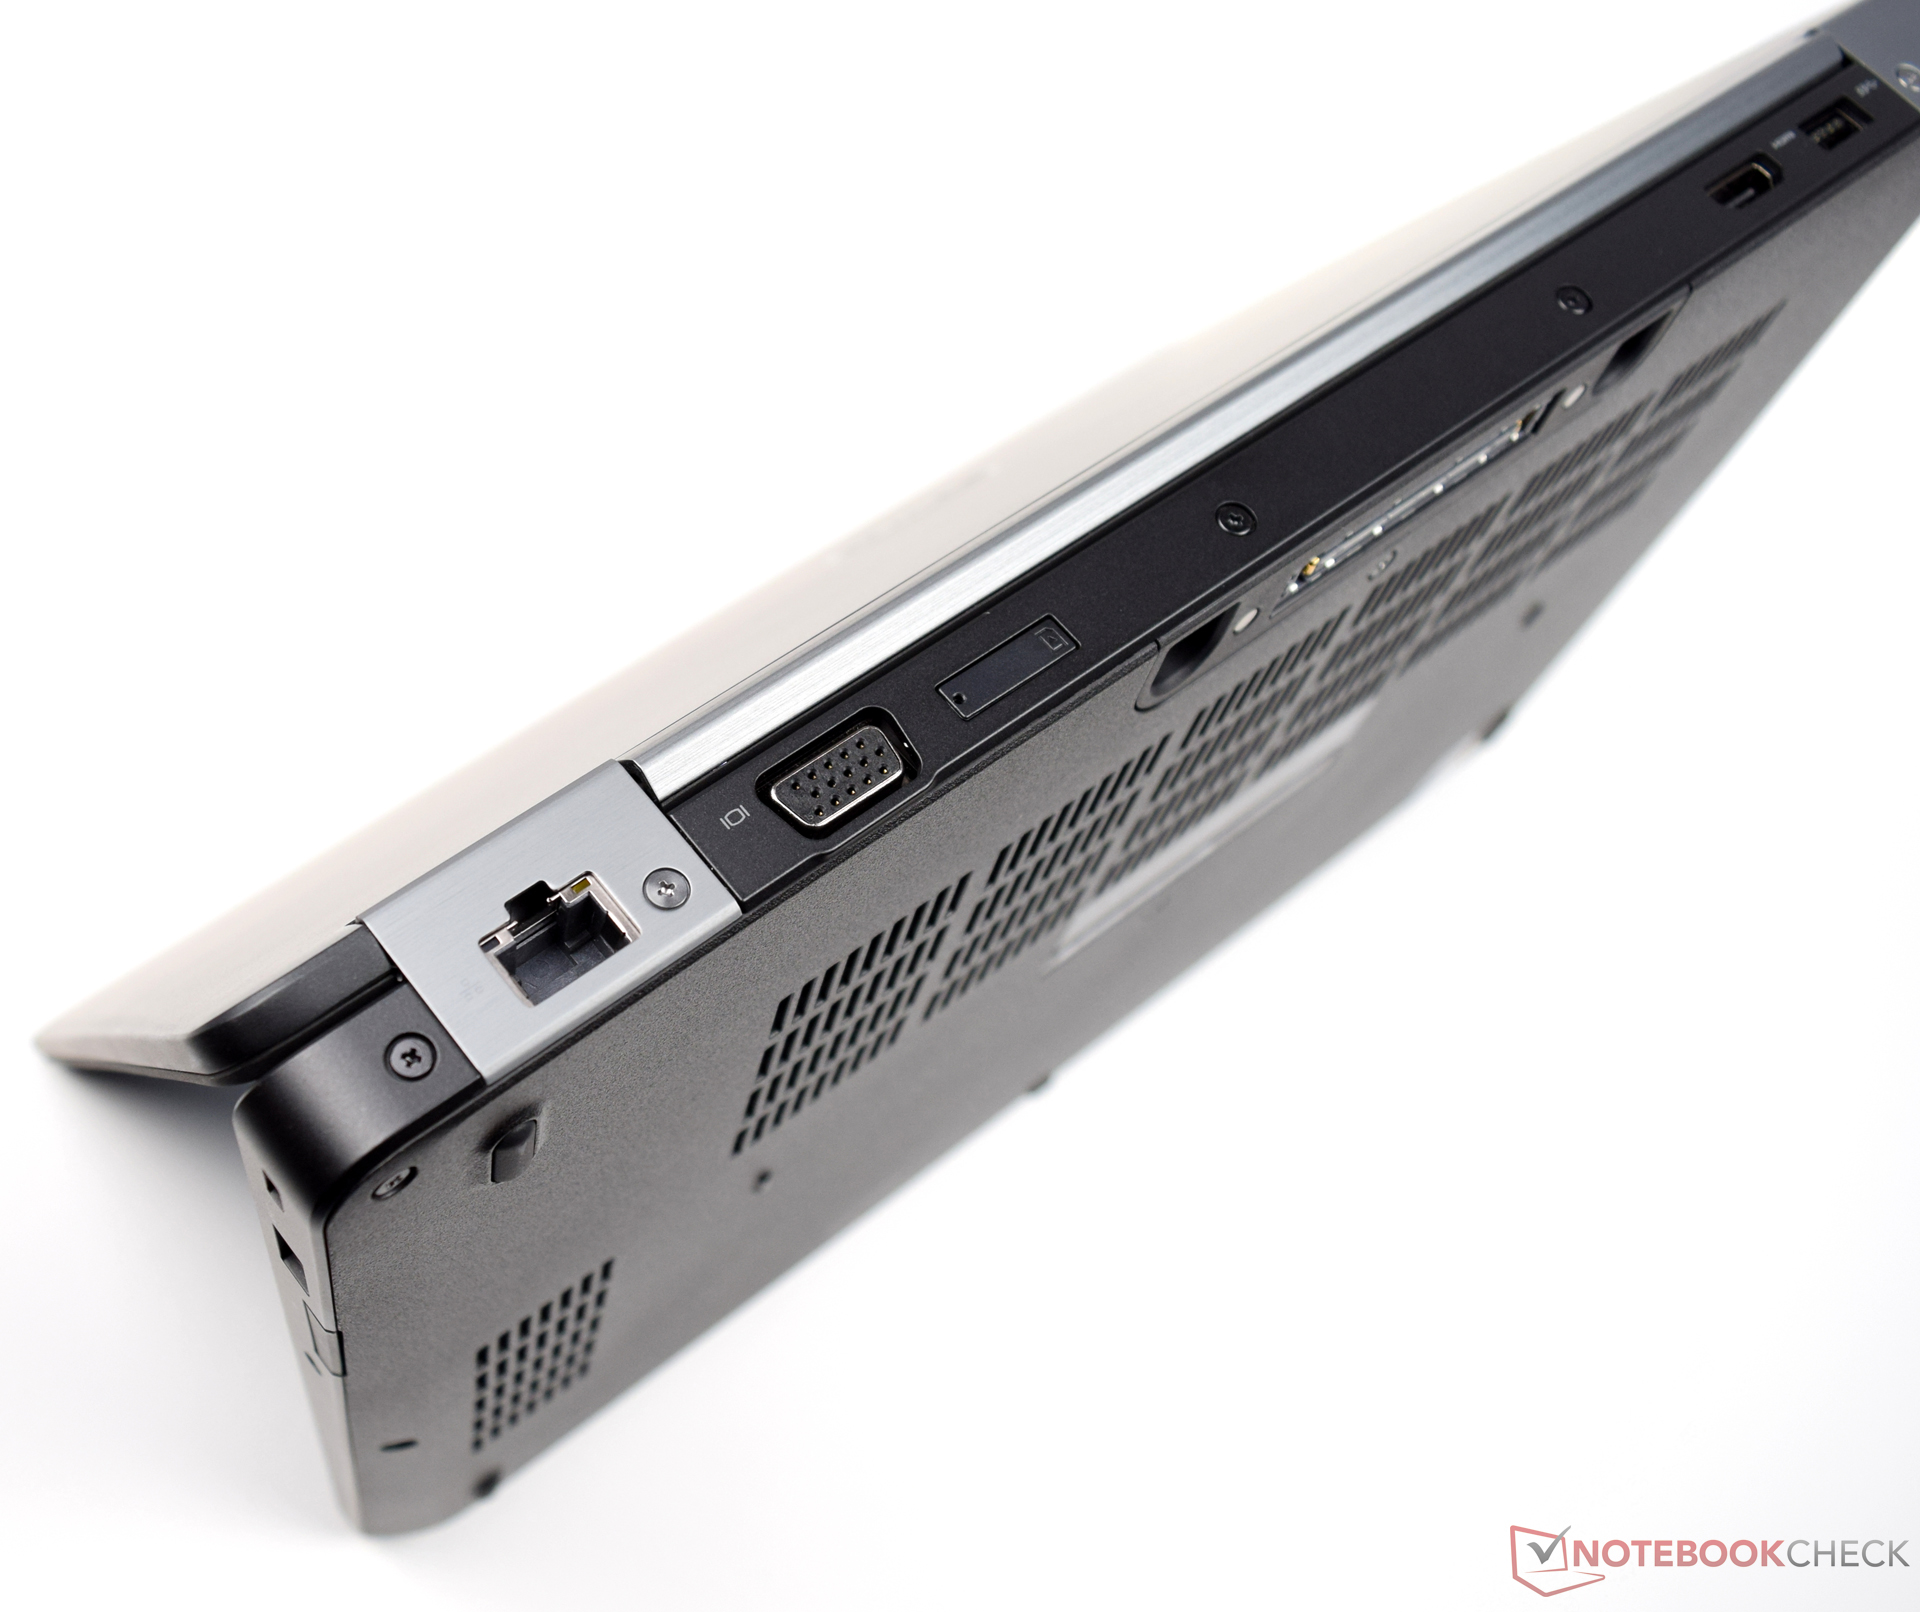
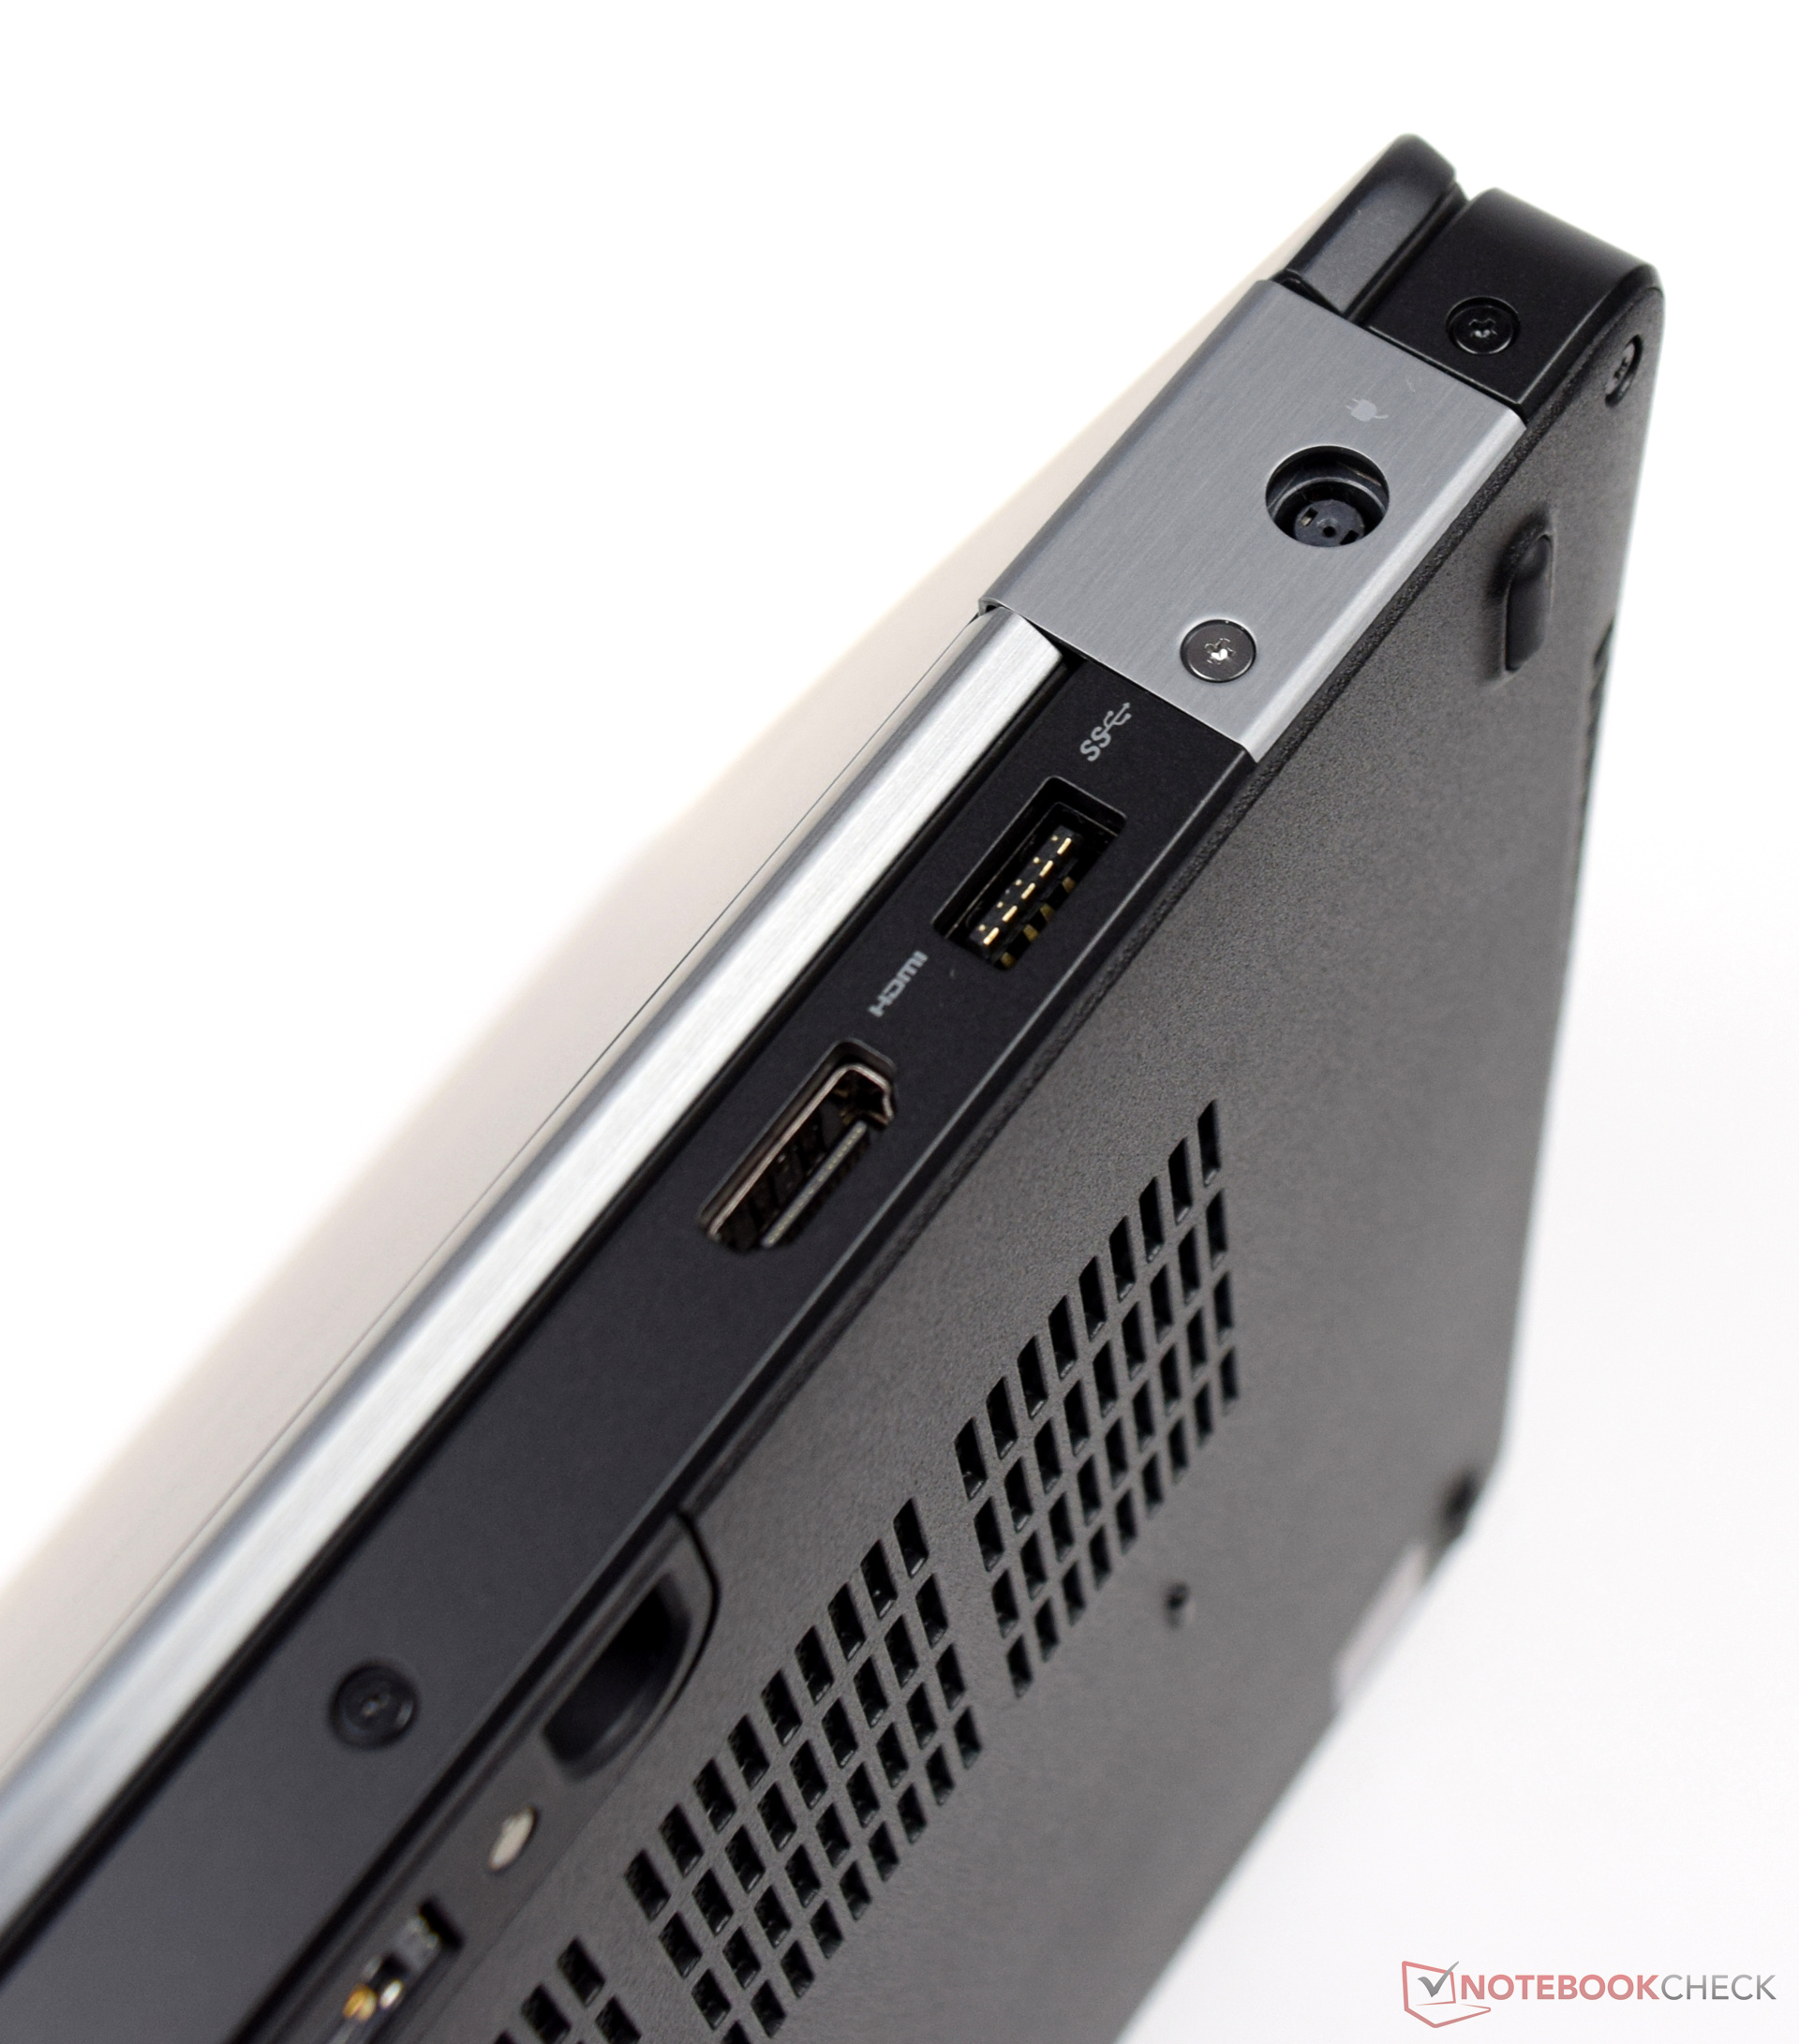
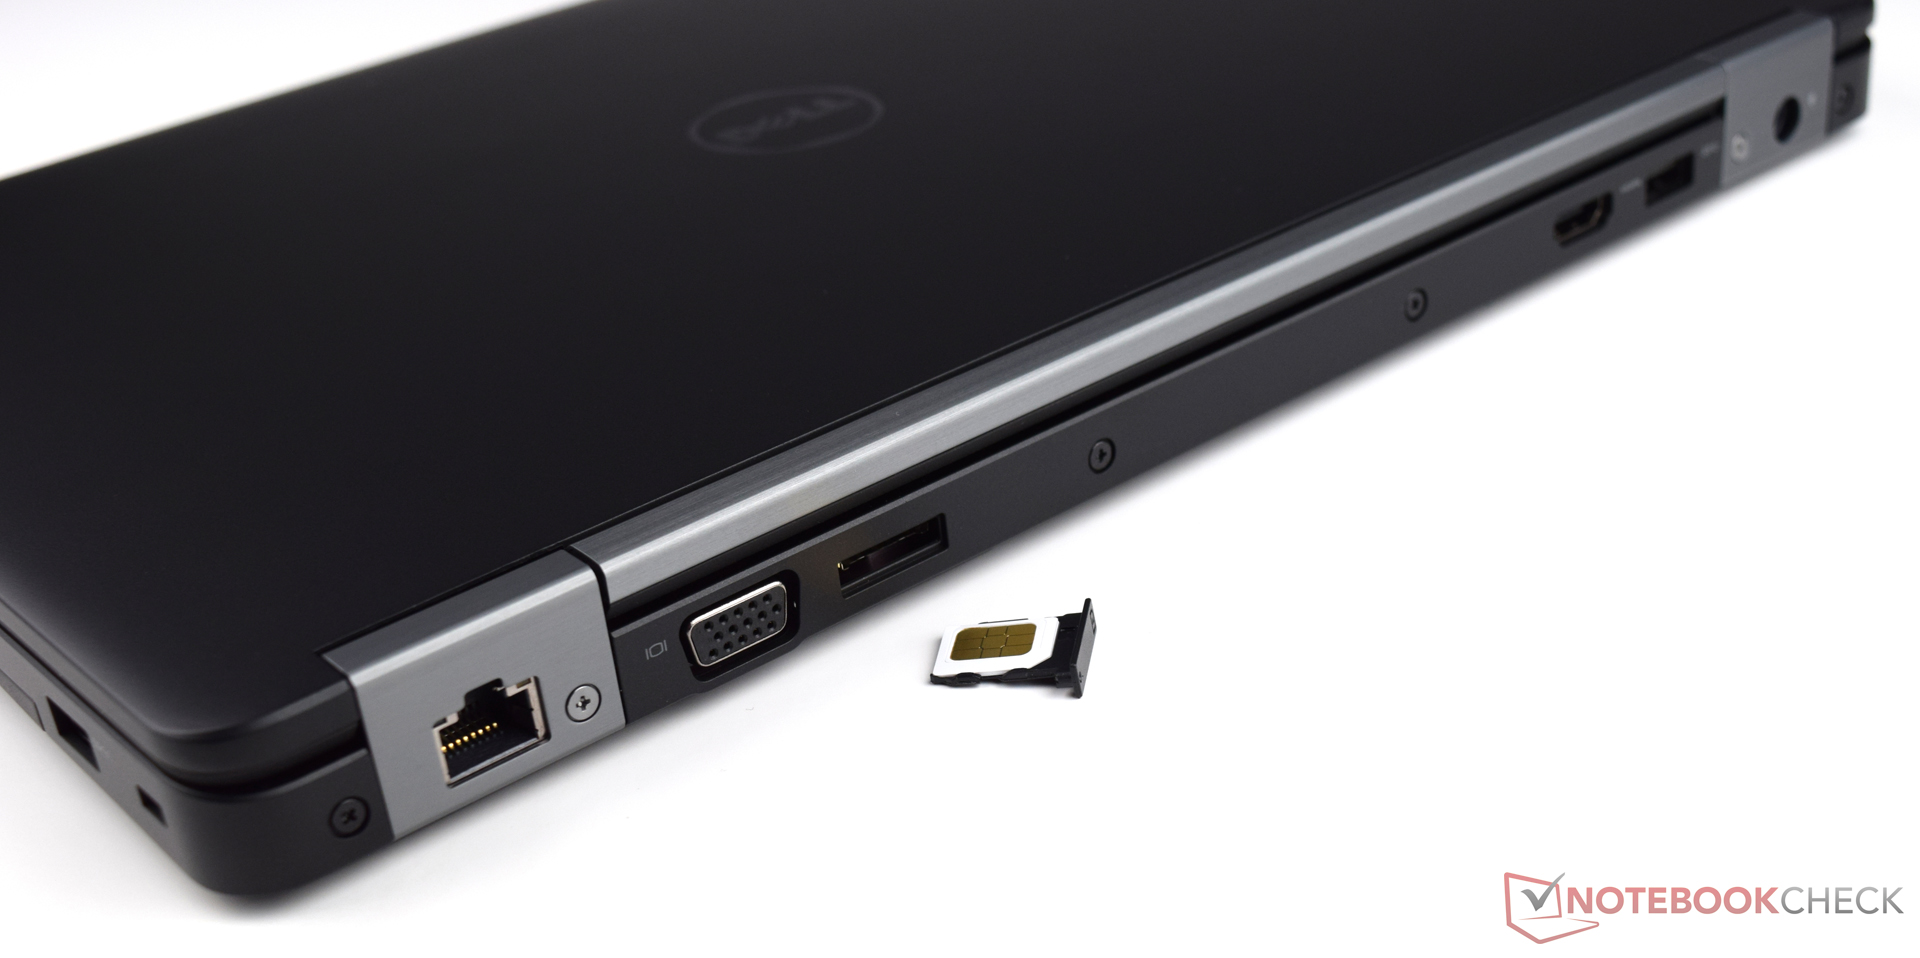
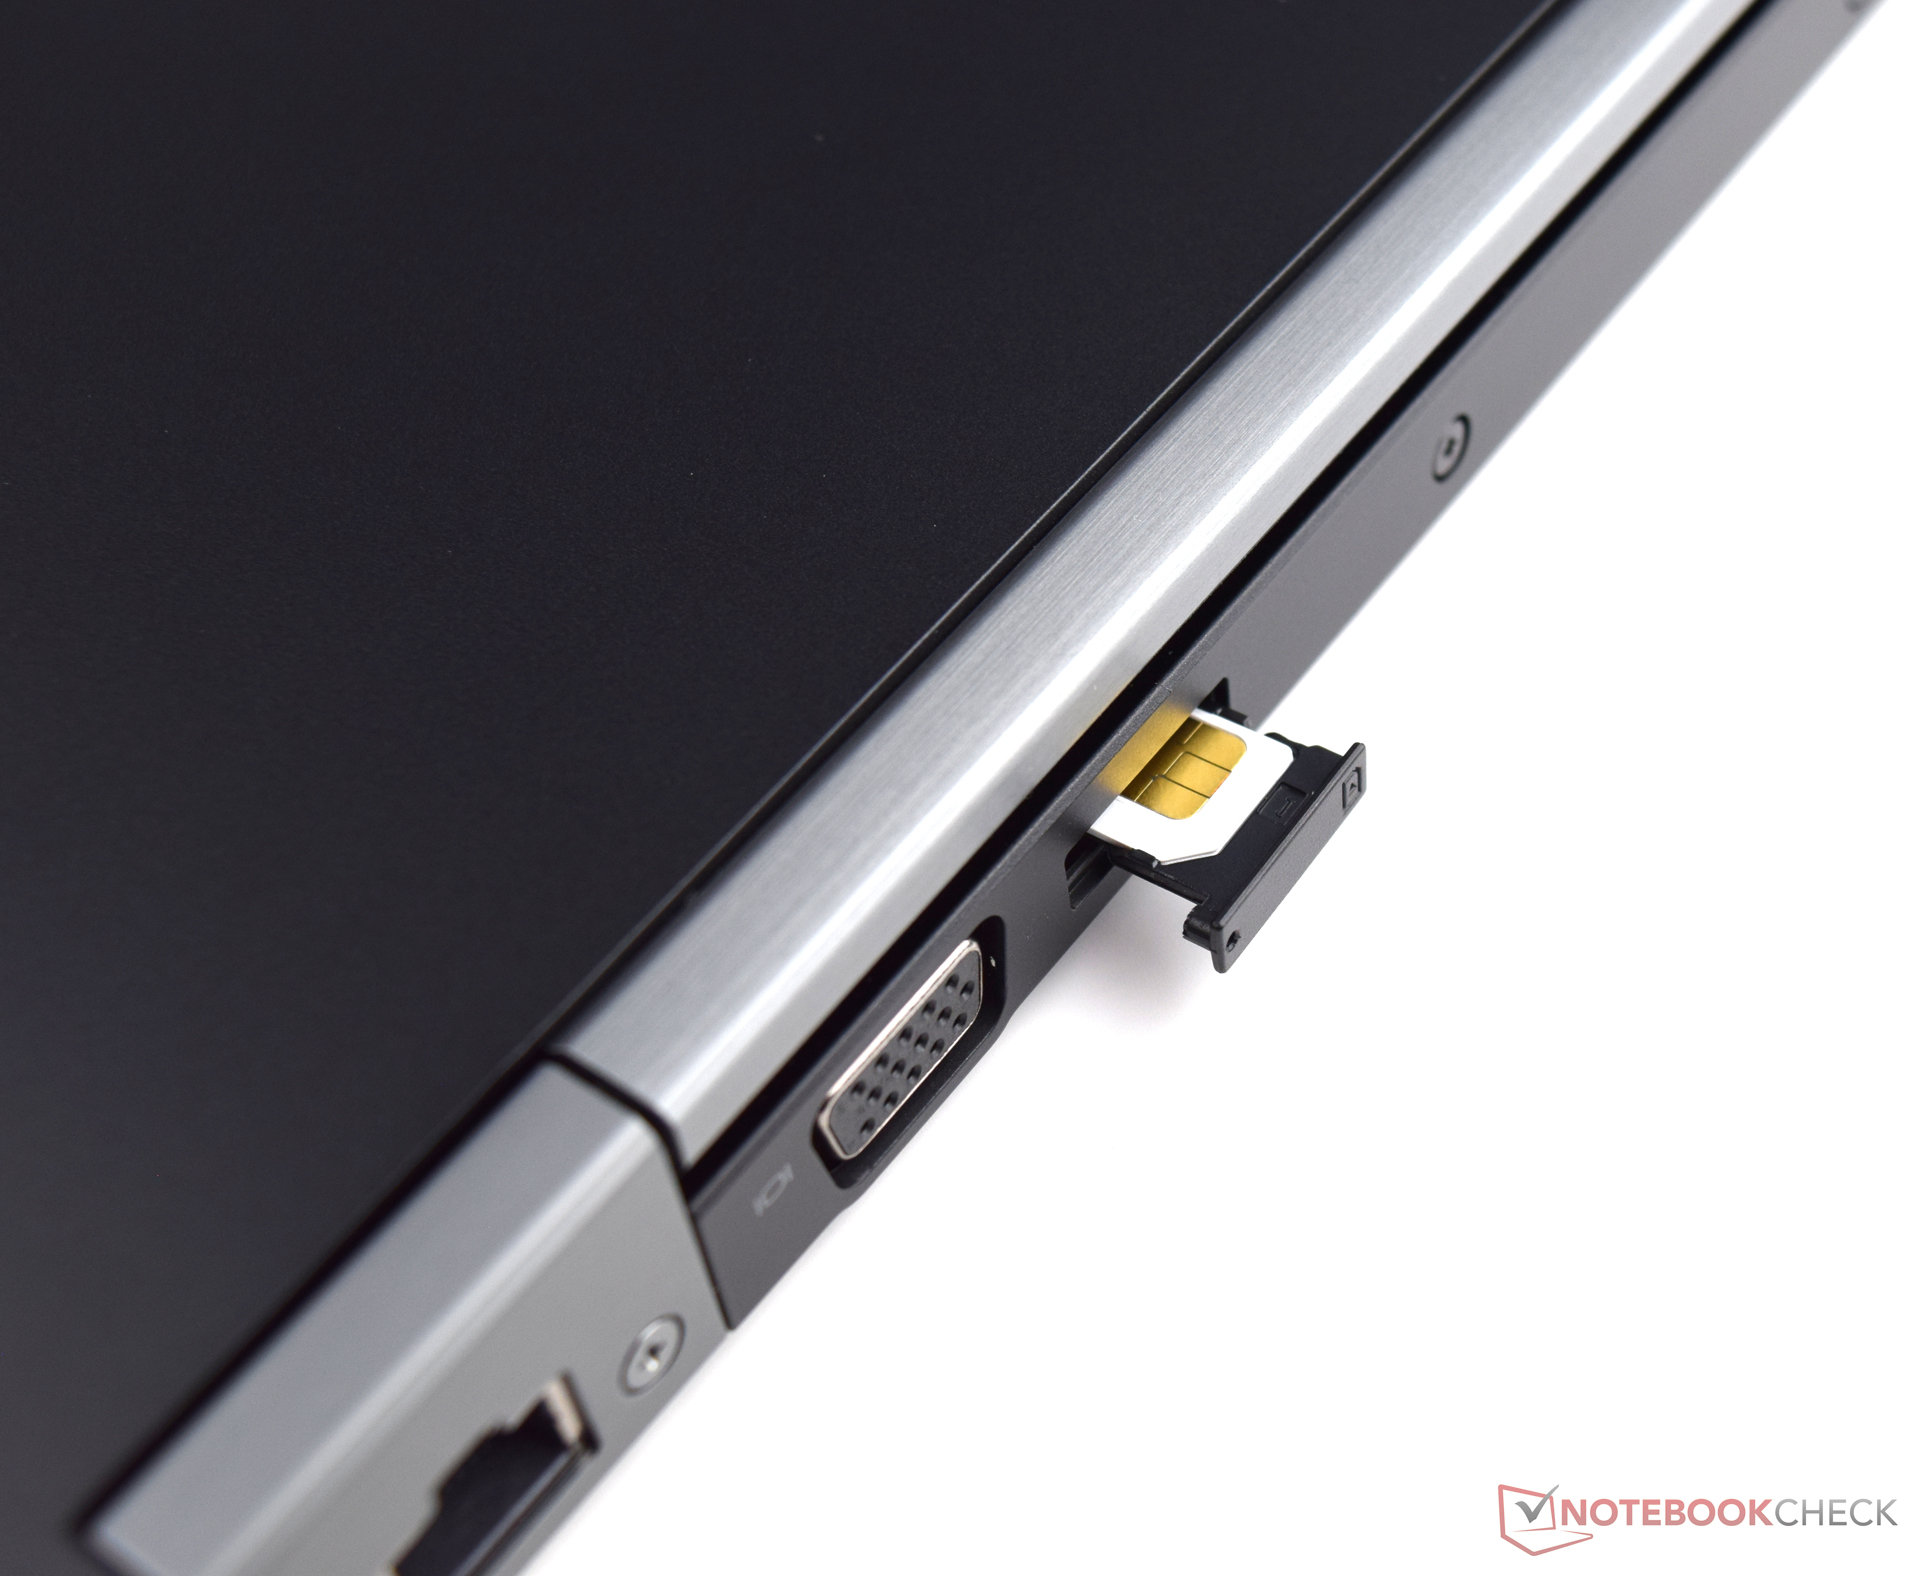
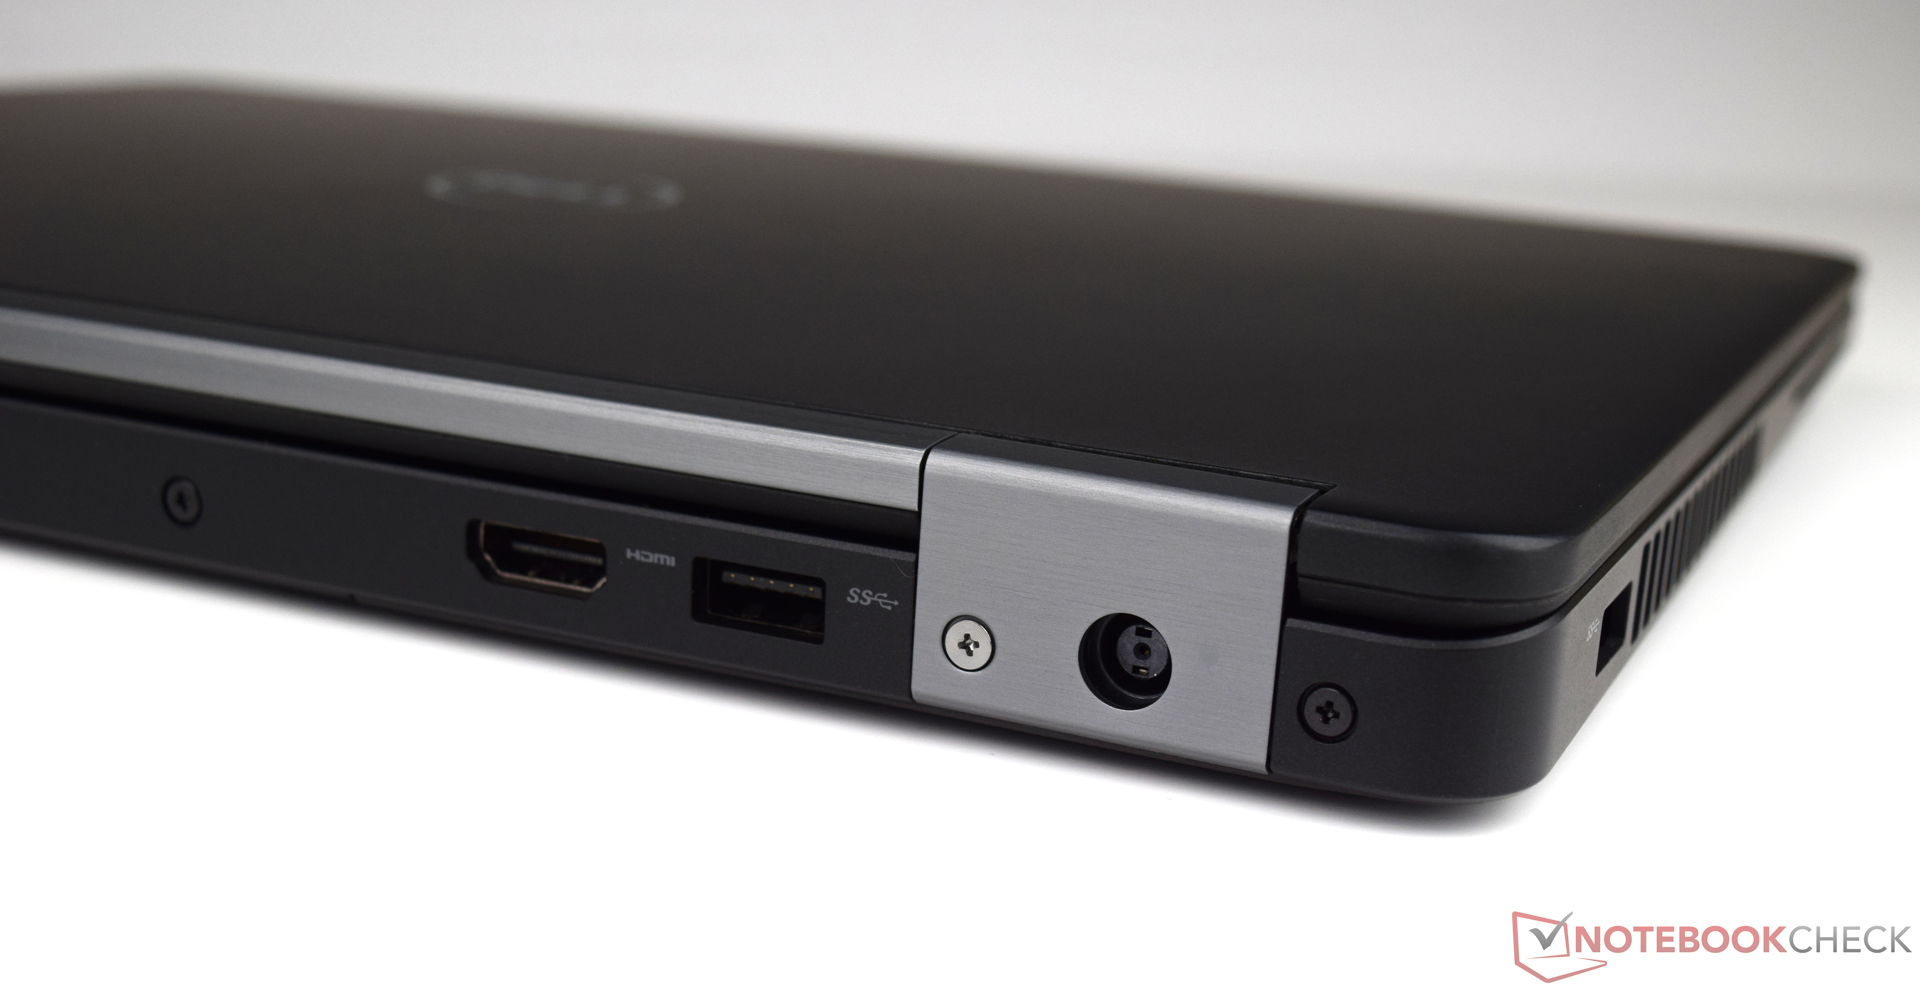
Dell's Latitude 14 E5470 geeft niet veel reden tot klagen, maar we hadden op zijn minst een USB Type-C Gen.2 poort willen zien voor toekomstbestendigheid. Het beeldscherm dat vooral goede scores haalt is een erg goede stap, maar in deze prijsklasse hadden we toch een iets hoge contrast verwacht.
Onder aan de streep kunnen we stellen dat Dell's Latitude 14 E5470 een goed kantoorapparaat is voor veeleisende zakelijke omgevingen. De verscheidene beveiligingsfuncties zijn een bonus die doorslaggevend kunnen zijn in de aanschafbeslissing.
Dell Latitude 14 E5470
-
10-02-2017 v6(old)
Sebastian Bade