 Deutsch
 English
 Español
 Français
 Italiano
 Nederlands
 Polski
 Português
 Русский
 Türkçe
 Svenska
 Chinese
 Magyar
Kort testrapport Dell Inspiron 17 7778 Convertible


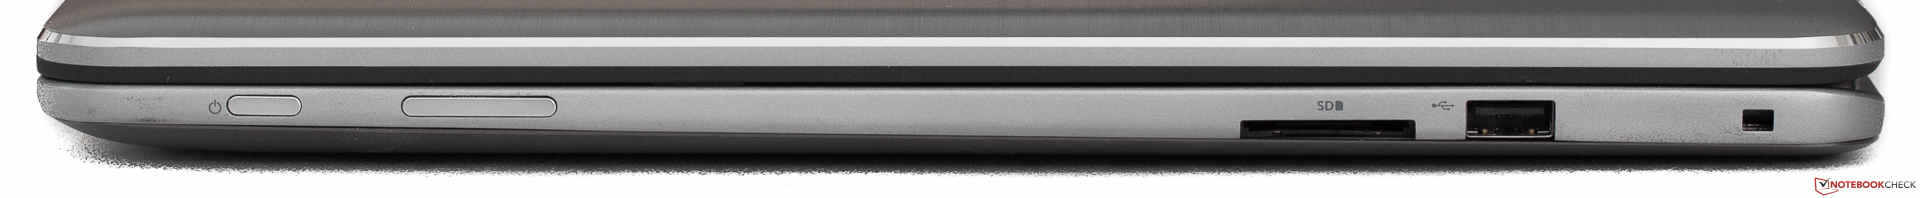
| SD Card Reader | |
| average JPG Copy Test (av. of 3 runs) | |
| HP Envy 15-w103ng x360 | |
| Dell Inspiron 17 7778 | |
| Dell Inspiron 15 5568 | |
| Acer TravelMate P278-MG-76L2 | |
| maximum AS SSD Seq Read Test (1GB) | |
| HP Envy 15-w103ng x360 | |
| Acer TravelMate P278-MG-76L2 | |
| Dell Inspiron 15 5568 | |
| Dell Inspiron 17 7778 | |
| Networking | |
| WiFi Speed Client 1m | |
| WiFi Speed Server 1m |
| |||||||||||||||||||||||||
Helderheidsverdeling: 87 %
Helderheid in Batterij-modus: 334 cd/m²
Contrast: 1090:1 (Zwart: 0.3 cd/m²)
ΔE Color 6.75 | 0.5-29.43 Ø5
ΔE Greyscale 7.91 | 0.57-98 Ø5.3
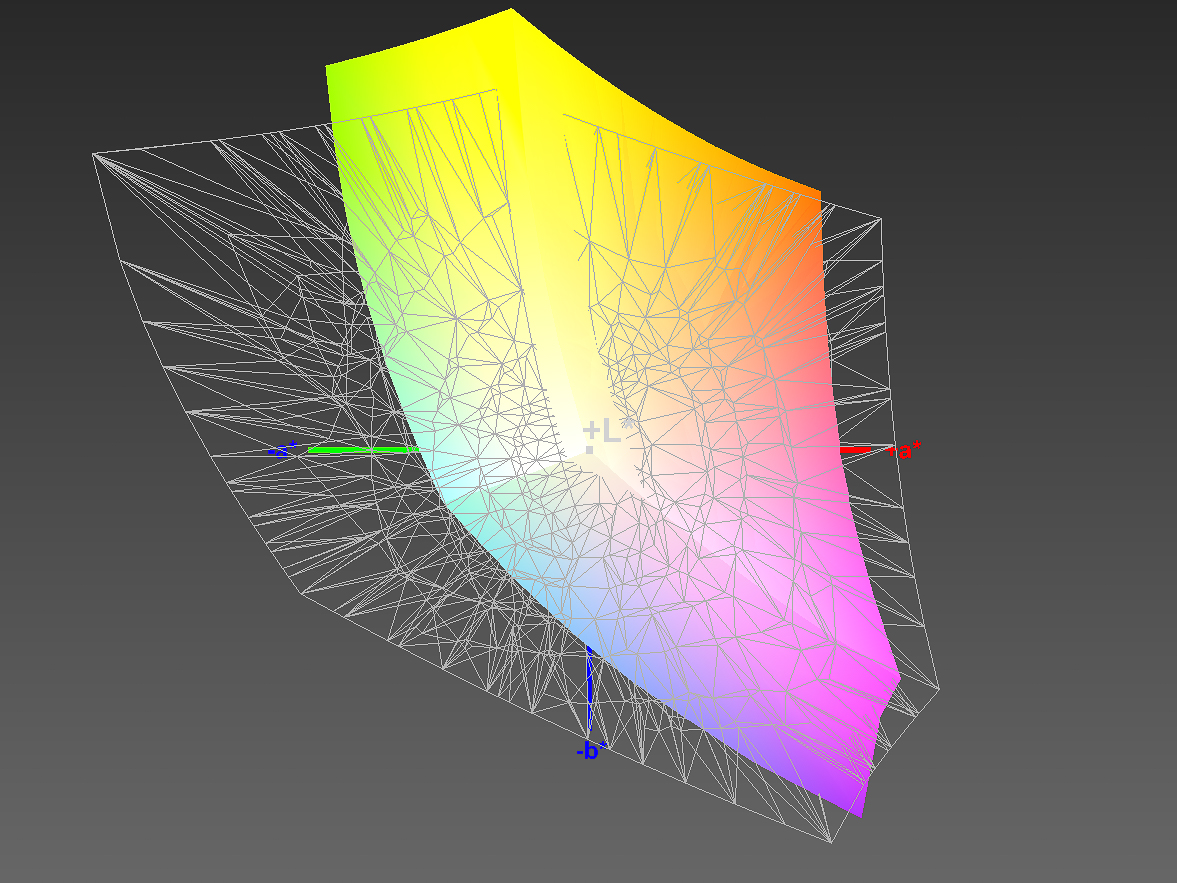
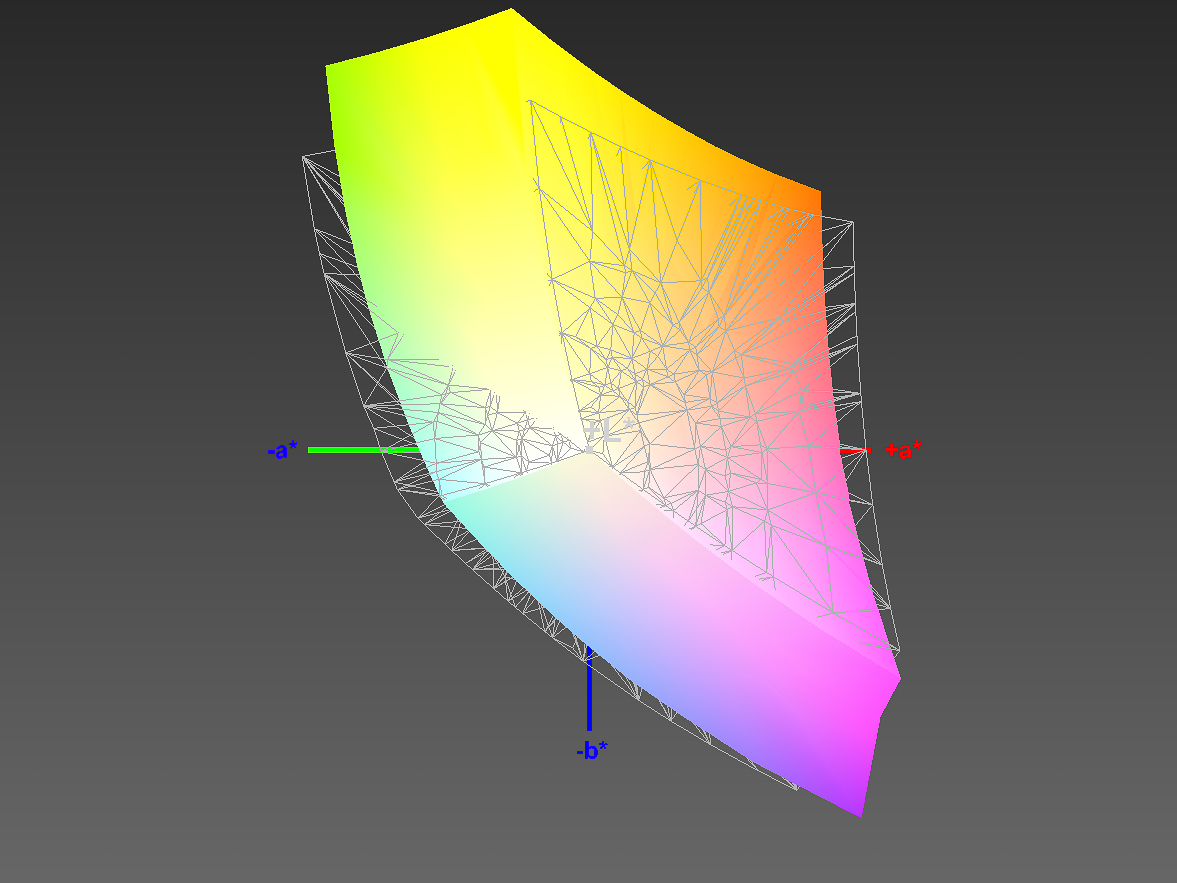
86% sRGB (Argyll 1.6.3 3D)
57% AdobeRGB 1998 (Argyll 1.6.3 3D)
63.1% AdobeRGB 1998 (Argyll 2.2.0 3D)
86.3% sRGB (Argyll 2.2.0 3D)
67.4% Display P3 (Argyll 2.2.0 3D)
Gamma: 2.31
| Dell Inspiron 17 7778 LG Philips LGD 0513 / 173WF4, , 1920x1080, 17.30 | HP Spectre x360 15-ap012dx 3840x2160, 15.60 | Dell Inspiron 15 5568 AU Optronics B156HW01 V0, , 1920x1080, 15.60 | HP Envy 15-w103ng x360 LG Philips, , 1920x1080, 15.60 | Acer TravelMate P278-MG-76L2 AUO B173HTN01.1 (AUO119D), , 1920x1080, 17.30 | |
|---|---|---|---|---|---|
| Display | -1% | -39% | -36% | 4% | |
| Display P3 Coverage | 67.4 | 62.8 -7% | 38.04 -44% | 39.97 -41% | 68.8 2% |
| sRGB Coverage | 86.3 | 88.2 2% | 57.1 -34% | 59.8 -31% | 90.6 5% |
| AdobeRGB 1998 Coverage | 63.1 | 63.9 1% | 39.3 -38% | 41.32 -35% | 66.3 5% |
| Response Times | -9% | -9% | -15% | -10% | |
| Response Time Grey 50% / Grey 80% * | 36 ? | 32.8 ? 9% | 42 ? -17% | 37 ? -3% | 41 ? -14% |
| Response Time Black / White * | 22 ? | 28 ? -27% | 22 ? -0% | 28 ? -27% | 23 ? -5% |
| PWM Frequency | 1000 ? | ||||
| Screen | -1% | -1% | -17% | -21% | |
| Brightness middle | 327 | 298 -9% | 266 -19% | 208 -36% | 362 11% |
| Brightness | 314 | 295 -6% | 249 -21% | 205 -35% | 344 10% |
| Brightness Distribution | 87 | 88 1% | 85 -2% | 80 -8% | 84 -3% |
| Black Level * | 0.3 | 0.57 -90% | 0.26 13% | 0.26 13% | 0.57 -90% |
| Contrast | 1090 | 523 -52% | 1023 -6% | 800 -27% | 635 -42% |
| Colorchecker dE 2000 * | 6.75 | 4.43 34% | 4.98 26% | 6.97 -3% | 9.54 -41% |
| Colorchecker dE 2000 max. * | 11.82 | 6.62 44% | 11.82 -0% | 16.11 -36% | |
| Greyscale dE 2000 * | 7.91 | 2.45 69% | 2.68 66% | 7.37 7% | 10.39 -31% |
| Gamma | 2.31 95% | 2.45 90% | 2.27 97% | 2.34 94% | 2.55 86% |
| CCT | 7642 85% | 6326 103% | 6583 99% | 6823 95% | 11093 59% |
| Color Space (Percent of AdobeRGB 1998) | 57 | 57.2 0% | 36 -37% | 38 -33% | 59 4% |
| Color Space (Percent of sRGB) | 86 | 87.8 2% | 57 -34% | 59 -31% | 90 5% |
| Totaal Gemiddelde (Programma / Instellingen) | -4% /
-2% | -16% /
-10% | -23% /
-21% | -9% /
-15% |
* ... kleiner is beter
Responstijd Scherm
| ↔ Responstijd Zwart naar Wit | ||
|---|---|---|
| 22 ms ... stijging ↗ en daling ↘ gecombineerd | ↗ 5 ms stijging | 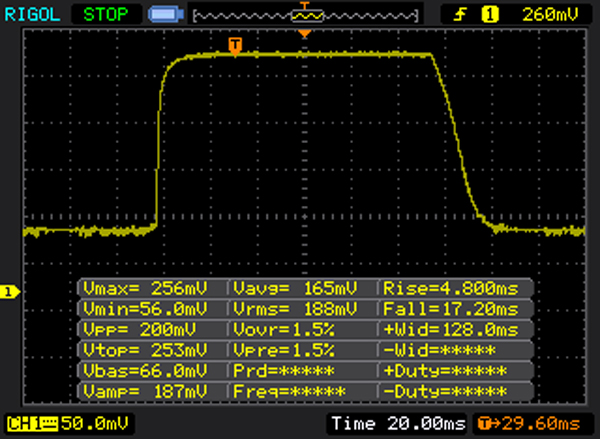 |
| ↘ 17 ms daling | ||
| Het scherm vertoonde prima responstijden in onze tests maar is misschien wat te traag voor competitieve games. Ter vergelijking: alle testtoestellen variëren van 0.1 (minimum) tot 240 (maximum) ms. » 42 % van alle toestellen zijn beter. Dit betekent dat de gemeten responstijd vergelijkbaar is met het gemiddelde (21.5 ms) van alle geteste toestellen. | ||
| ↔ Responstijd 50% Grijs naar 80% Grijs | ||
| 36 ms ... stijging ↗ en daling ↘ gecombineerd | ↗ 14 ms stijging | 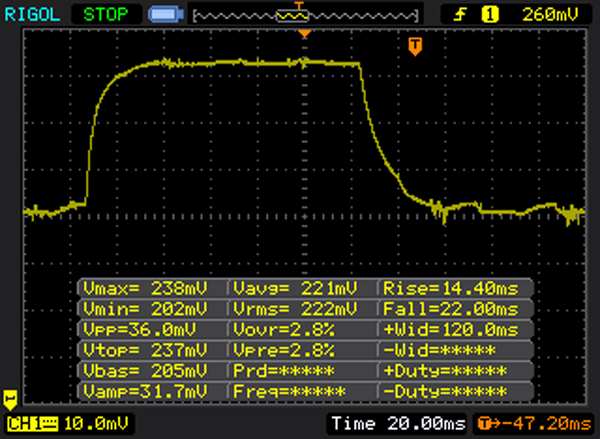 |
| ↘ 22 ms daling | ||
| Het scherm vertoonde trage responstijden in onze tests en is misschien te traag voor games. Ter vergelijking: alle testtoestellen variëren van 0.2 (minimum) tot 636 (maximum) ms. » 44 % van alle toestellen zijn beter. Dit betekent dat de gemeten responstijd vergelijkbaar is met het gemiddelde (33.7 ms) van alle geteste toestellen. | ||
Screen Flickering / PWM (Pulse-Width Modulation)
| Screen flickering / PWM niet waargenomen | ||
Ter vergelijking: 53 % van alle geteste toestellen maakten geen gebruik van PWM om de schermhelderheid te verlagen. Als het wel werd gebruikt, werd een gemiddelde van 17900 (minimum: 5 - maximum: 3846000) Hz waargenomen. | ||

| Cinebench R15 | |
| CPU Single 64Bit | |
| Acer TravelMate P278-MG-76L2 | |
| Dell Inspiron 15 5568 | |
| Dell Inspiron 17 7778 | |
| HP Spectre x360 15-ap012dx | |
| HP Envy 15-w103ng x360 | |
| CPU Multi 64Bit | |
| Acer TravelMate P278-MG-76L2 | |
| HP Spectre x360 15-ap012dx | |
| Dell Inspiron 15 5568 | |
| Dell Inspiron 17 7778 | |
| HP Envy 15-w103ng x360 | |
| PCMark 8 | |
| Home Score Accelerated v2 | |
| Dell Inspiron 17 7778 | |
| Dell Inspiron 15 5568 | |
| Acer TravelMate P278-MG-76L2 | |
| HP Envy 15-w103ng x360 | |
| HP Spectre x360 15-ap012dx | |
| Work Score Accelerated v2 | |
| Dell Inspiron 17 7778 | |
| Acer TravelMate P278-MG-76L2 | |
| Dell Inspiron 15 5568 | |
| HP Envy 15-w103ng x360 | |
| HP Spectre x360 15-ap012dx | |
| PCMark 8 Home Score Accelerated v2 | 3696 punten | |
| PCMark 8 Work Score Accelerated v2 | 4572 punten | |
Help | ||
| Dell Inspiron 17 7778 Liteonit CV3-CE512 | HP Spectre x360 15-ap012dx Sandisk X300 SD7SN6S-256G-1006 | Dell Inspiron 15 5568 Toshiba THNSNK256GCS8 | HP Envy 15-w103ng x360 Samsung SSD PM851 256 GB MZNTE256HMHP | Acer TravelMate P278-MG-76L2 Lite-On CV1-8B256 | |
|---|---|---|---|---|---|
| CrystalDiskMark 3.0 | -4% | -8% | 2% | -4% | |
| Read Seq | 486.4 | 475.6 -2% | 458.6 -6% | 515 6% | 473 -3% |
| Write Seq | 438.4 | 425 -3% | 270 -38% | 240.7 -45% | 366.3 -16% |
| Read 512 | 232.8 | 258.4 11% | 397.4 71% | 391.3 68% | 329.4 41% |
| Write 512 | 386.7 | 318.9 -18% | 242 -37% | 240 -38% | 357.3 -8% |
| Read 4k | 32.3 | 35.48 10% | 19.88 -38% | 27.64 -14% | 30.83 -5% |
| Write 4k | 65.8 | 93 41% | 86.7 32% | 95.2 45% | 74.8 14% |
| Read 4k QD32 | 334.4 | 281.2 -16% | 275.3 -18% | 367.9 10% | 245.1 -27% |
| Write 4k QD32 | 289.5 | 138.7 -52% | 197.6 -32% | 239 -17% | 217.3 -25% |

| 3DMark 11 - 1280x720 Performance GPU | |
| Dell Inspiron 17 7778 | |
| Acer TravelMate P278-MG-76L2 | |
| HP Envy 15-w103ng x360 | |
| Dell Inspiron 15 5568 | |
| HP Spectre x360 15-ap012dx | |
| 3DMark | |
| 1280x720 Cloud Gate Standard Graphics | |
| Dell Inspiron 17 7778 | |
| Acer TravelMate P278-MG-76L2 | |
| Dell Inspiron 15 5568 | |
| HP Envy 15-w103ng x360 | |
| HP Spectre x360 15-ap012dx | |
| 1920x1080 Fire Strike Graphics | |
| Dell Inspiron 17 7778 | |
| Acer TravelMate P278-MG-76L2 | |
| HP Envy 15-w103ng x360 | |
| HP Spectre x360 15-ap012dx | |
| 3DMark 11 Performance | 2867 punten | |
| 3DMark Cloud Gate Standard Score | 7674 punten | |
| 3DMark Fire Strike Score | 1748 punten | |
Help | ||
| Mirror's Edge Catalyst | |
| 1920x1080 High Preset AF:16x | |
| MSI CX72 6QD | |
| Dell Inspiron 17 7778 | |
| 1366x768 Medium Preset AF:4x | |
| MSI CX72 6QD | |
| Asus VivoBook X556UQ-XO076T | |
| Dell Inspiron 17 7778 | |
| Far Cry Primal | |
| 1920x1080 High Preset AA:SM | |
| Dell Inspiron 17 7778 | |
| MSI CX72 6QD | |
| Lenovo ThinkPad T560-20FH002RGE | |
| 1920x1080 Medium Preset AA:SM | |
| MSI CX72 6QD | |
| Dell Inspiron 17 7778 | |
| Lenovo ThinkPad T560-20FH002RGE | |
| Rise of the Tomb Raider | |
| 1920x1080 High Preset AA:FX AF:4x | |
| Dell Inspiron 17 7778 | |
| MSI CX72 6QD | |
| Lenovo ThinkPad T560-20FH002RGE | |
| Acer TravelMate P278-MG-76L2 | |
| 1366x768 Medium Preset AF:2x | |
| Dell Inspiron 17 7778 | |
| MSI CX72 6QD | |
| Lenovo ThinkPad T560-20FH002RGE | |
| Acer TravelMate P278-MG-76L2 | |
| Just Cause 3 | |
| 1920x1080 High / On AA:FX AF:8x | |
| MSI CX72 6QD | |
| Lenovo ThinkPad T560-20FH002RGE | |
| Dell Inspiron 17 7778 | |
| 1366x768 Medium / Off AF:4x | |
| MSI CX72 6QD | |
| Lenovo ThinkPad T560-20FH002RGE | |
| Dell Inspiron 17 7778 | |
| Rainbow Six Siege | |
| 1920x1080 High Preset AA:T AF:4x | |
| MSI CX72 6QD | |
| Dell Inspiron 17 7778 | |
| Lenovo ThinkPad T560-20FH002RGE | |
| 1366x768 Medium Preset AA:T AF:2x | |
| MSI CX72 6QD | |
| Lenovo ThinkPad T560-20FH002RGE | |
| Dell Inspiron 17 7778 | |
| Assassin's Creed Syndicate | |
| 1920x1080 High Preset AA:FX | |
| Dell Inspiron 17 7778 | |
| HP Envy 15-w103ng x360 | |
| 1366x768 Medium Preset AA:FX | |
| Dell Inspiron 17 7778 | |
| MSI CX72 6QD | |
| HP Envy 15-w103ng x360 | |
| Star Wars Battlefront | |
| 1920x1080 High Preset AA:FX | |
| Dell Inspiron 17 7778 | |
| MSI CX72 6QD | |
| Lenovo ThinkPad T560-20FH002RGE | |
| HP Envy 15-w103ng x360 | |
| 1366x768 Medium Preset AA:FX | |
| MSI CX72 6QD | |
| Lenovo ThinkPad T560-20FH002RGE | |
| Asus VivoBook X556UQ-XO076T | |
| Dell Inspiron 17 7778 | |
| HP Envy 15-w103ng x360 | |
| Fallout 4 | |
| 1920x1080 High Preset AA:T AF:16x | |
| Dell Inspiron 17 7778 | |
| MSI CX72 6QD | |
| Lenovo ThinkPad T560-20FH002RGE | |
| HP Envy 15-w103ng x360 | |
| 1366x768 Medium Preset AA:T AF:16x | |
| Dell Inspiron 17 7778 | |
| MSI CX72 6QD | |
| Lenovo ThinkPad T560-20FH002RGE | |
| HP Envy 15-w103ng x360 | |
| Anno 2205 | |
| 1920x1080 High Preset AA:4x | |
| Dell Inspiron 17 7778 | |
| Lenovo ThinkPad T560-20FH002RGE | |
| MSI CX72 6QD | |
| HP Envy 15-w103ng x360 | |
| 1366x768 Medium Preset AA:2x | |
| MSI CX72 6QD | |
| Dell Inspiron 17 7778 | |
| Lenovo ThinkPad T560-20FH002RGE | |
| HP Envy 15-w103ng x360 | |
| FIFA 16 | |
| 1920x1080 High Preset AA:4x MS | |
| Dell Inspiron 17 7778 | |
| MSI CX72 6QD | |
| HP Envy 15-w103ng x360 | |
| 1366x768 High Preset AA:2x MS | |
| MSI CX72 6QD | |
| HP Envy 15-w103ng x360 | |
| Dirt Rally | |
| 1920x1080 High Preset | |
| Dell Inspiron 17 7778 | |
| Lenovo ThinkPad T560-20FH002RGE | |
| 1366x768 Medium Preset | |
| Dell Inspiron 17 7778 | |
| Lenovo ThinkPad T560-20FH002RGE | |
| The Witcher 3 | |
| 1920x1080 High Graphics & Postprocessing (Nvidia HairWorks Off) | |
| Dell Inspiron 17 7778 | |
| MSI CX72 6QD | |
| Lenovo ThinkPad T560-20FH002RGE | |
| HP Envy 15-w103ng x360 | |
| 1366x768 Medium Graphics & Postprocessing | |
| Dell Inspiron 17 7778 | |
| MSI CX72 6QD | |
| Lenovo ThinkPad T560-20FH002RGE | |
| HP Envy 15-w103ng x360 | |
| Battlefield 4 | |
| 1366x768 High Preset | |
| Dell Inspiron 17 7778 | |
| Lenovo ThinkPad T560-20FH002RGE | |
| Asus VivoBook X556UQ-XO076T | |
| Acer TravelMate P278-MG-76L2 | |
| 1366x768 Medium Preset | |
| Lenovo ThinkPad T560-20FH002RGE | |
| Asus VivoBook X556UQ-XO076T | |
| Dell Inspiron 17 7778 | |
| Acer TravelMate P278-MG-76L2 | |
| Metro: Last Light | |
| 1366x768 High (DX11) AF:16x | |
| Dell Inspiron 17 7778 | |
| Lenovo ThinkPad T560-20FH002RGE | |
| 1366x768 Medium (DX10) AF:4x | |
| Dell Inspiron 17 7778 | |
| Lenovo ThinkPad T560-20FH002RGE | |
| BioShock Infinite | |
| 1366x768 High Preset | |
| Dell Inspiron 17 7778 | |
| Lenovo ThinkPad T560-20FH002RGE | |
| Acer TravelMate P278-MG-76L2 | |
| Asus VivoBook X556UQ-XO076T | |
| 1366x768 Medium Preset | |
| Dell Inspiron 17 7778 | |
| Lenovo ThinkPad T560-20FH002RGE | |
| Acer TravelMate P278-MG-76L2 | |
| Asus VivoBook X556UQ-XO076T | |
| Crysis 3 | |
| 1366x768 High Preset AA:FX AF:16x | |
| Dell Inspiron 17 7778 | |
| Lenovo ThinkPad T560-20FH002RGE | |
| 1366x768 Medium Preset AF:16x | |
| Dell Inspiron 17 7778 | |
| Lenovo ThinkPad T560-20FH002RGE | |
| lage | gem. | hoge | ultra | |
| Crysis 3 (2013) | 51.5 | 28.1 | 21.7 | |
| BioShock Infinite (2013) | 107.8 | 60.1 | 53.1 | 19.3 |
| Metro: Last Light (2013) | 55.2 | 42.6 | 25.2 | |
| Battlefield 4 (2013) | 40.6 | 32.4 | 14.3 | |
| Dirt Rally (2015) | 52.4 | 30.7 | ||
| The Witcher 3 (2015) | 36.9 | 21.7 | 11.2 | |
| FIFA 16 (2015) | 45.8 | |||
| Anno 2205 (2015) | 39.4 | 27 | 13.2 | |
| Fallout 4 (2015) | 37.1 | 25.2 | 13.9 | |
| Star Wars Battlefront (2015) | 40.1 | 29.6 | 16.5 | |
| Assassin's Creed Syndicate (2015) | 20.7 | 20.1 | 11.1 | |
| Rainbow Six Siege (2015) | 79.1 | 40.4 | 22.5 | |
| Just Cause 3 (2015) | 31.9 | 25.7 | 13.4 | |
| Rise of the Tomb Raider (2016) | 37.7 | 22.3 | 13.1 | |
| Far Cry Primal (2016) | 32 | 14 | 14 | |
| The Division (2016) | 40.2 | 20.7 | 8.8 | |
| Hitman 2016 (2016) | 21.7 | 23.4 | ||
| Mirror's Edge Catalyst (2016) | 44 | 19.3 | 8.3 |
Geluidsniveau
| Onbelast |
| 32.1 / 32.1 / 34 dB (A) |
| Belasting |
| 40.3 / 42.6 dB (A) |
 | ||
30 dB stil 40 dB(A) hoorbaar 50 dB(A) luid |
||
min: | ||
(±) De maximumtemperatuur aan de bovenzijde bedraagt 44.7 °C / 112 F, vergeleken met het gemiddelde van 36.9 °C / 98 F, variërend van 21.1 tot 71 °C voor de klasse Multimedia.
(-) De bodem warmt op tot een maximum van 45.5 °C / 114 F, vergeleken met een gemiddelde van 39.1 °C / 102 F
(+) Bij onbelast gebruik bedraagt de gemiddelde temperatuur voor de bovenzijde 29.9 °C / 86 F, vergeleken met het apparaatgemiddelde van 31.2 °C / 88 F.
(+) De handpalmsteunen en het touchpad bereiken maximaal de huidtemperatuur (33.5 °C / 92.3 F) en zijn dus niet heet.
(-) De gemiddelde temperatuur van de handpalmsteun van soortgelijke toestellen bedroeg 28.8 °C / 83.8 F (-4.7 °C / -8.5 F).
Dell Inspiron 17 7778 audioanalyse
(±) | luidspreker luidheid is gemiddeld maar goed (74 dB)
Bas 100 - 315 Hz
(±) | verminderde zeebaars - gemiddeld 7.5% lager dan de mediaan
(+) | de lage tonen zijn lineair (6.4% delta naar de vorige frequentie)
Mids 400 - 2000 Hz
(+) | evenwichtige middens - slechts 4.9% verwijderd van de mediaan
(+) | de middentonen zijn lineair (6.6% delta ten opzichte van de vorige frequentie)
Hoog 2 - 16 kHz
(+) | evenwichtige hoogtepunten - slechts 1.7% verwijderd van de mediaan
(+) | de hoge tonen zijn lineair (4.5% delta naar de vorige frequentie)
Algemeen 100 - 16.000 Hz
(+) | het totale geluid is lineair (12.5% verschil met de mediaan)
Vergeleken met dezelfde klasse
» 17% van alle geteste apparaten in deze klasse waren beter, 3% vergelijkbaar, 80% slechter
» De beste had een delta van 5%, het gemiddelde was 18%, de slechtste was 45%
Vergeleken met alle geteste toestellen
» 8% van alle geteste apparaten waren beter, 2% gelijk, 90% slechter
» De beste had een delta van 4%, het gemiddelde was 25%, de slechtste was 134%
| Uit / Standby | |
| Inactief | |
| Belasting |
|
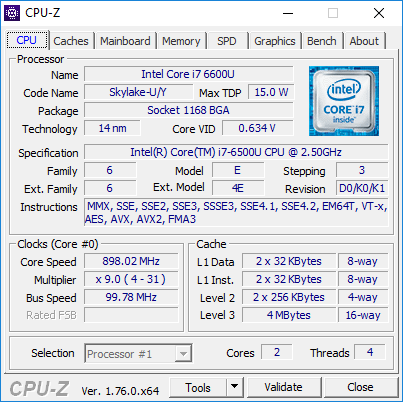
| Dell Inspiron 17 7778 6500U, GeForce 940MX, Liteonit CV3-CE512, IPS, 1920x1080, 17.30 | HP Spectre x360 15-ap012dx 6200U, HD Graphics 520, Sandisk X300 SD7SN6S-256G-1006, IPS, 3840x2160, 15.60 | Dell Inspiron 15 5568 6500U, HD Graphics 520, Toshiba THNSNK256GCS8, IPS, 1920x1080, 15.60 | HP Envy 15-w103ng x360 6200U, GeForce 930M, Samsung SSD PM851 256 GB MZNTE256HMHP, IPS, 1920x1080, 15.60 | Acer TravelMate P278-MG-76L2 6500U, GeForce 940M, Lite-On CV1-8B256, TN LED, 1920x1080, 17.30 | |
|---|---|---|---|---|---|
| Power Consumption | -0% | 31% | 24% | -13% | |
| Idle Minimum * | 5.6 | 6.5 -16% | 4.34 22% | 4.15 26% | 5.8 -4% |
| Idle Average * | 11.2 | 13.3 -19% | 7.5 33% | 8.2 27% | 11.6 -4% |
| Idle Maximum * | 11.9 | 15.1 -27% | 8.4 29% | 8.2 31% | 13.6 -14% |
| Load Average * | 46 | 30.8 33% | 30.4 34% | 34.6 25% | 51 -11% |
| Load Maximum * | 53 | 38.5 27% | 32.5 39% | 48 9% | 69 -30% |
* ... kleiner is beter
| Dell Inspiron 17 7778 6500U, GeForce 940MX, 56 Wh | HP Spectre x360 15-ap012dx 6200U, HD Graphics 520, 65 Wh | Dell Inspiron 15 5568 6500U, HD Graphics 520, 42 Wh | HP Envy 15-w103ng x360 6200U, GeForce 930M, 48 Wh | Acer TravelMate P278-MG-76L2 6500U, GeForce 940M, 37 Wh | |
|---|---|---|---|---|---|
| Batterijduur | -8% | -33% | -20% | -24% | |
| Reader / Idle | 811 | 705 -13% | 449 -45% | 601 -26% | |
| WiFi v1.3 | 495 | 431 -13% | 299 -40% | 398 -20% | 297 -40% |
| Load | 110 | 113 3% | 93 -15% | 104 -5% | |
| H.264 | 298 | 288 |
Pro
Contra
Dit is de verkorte versie van het originele artikel. Het volledige, Engelse testrapport vind je hier.
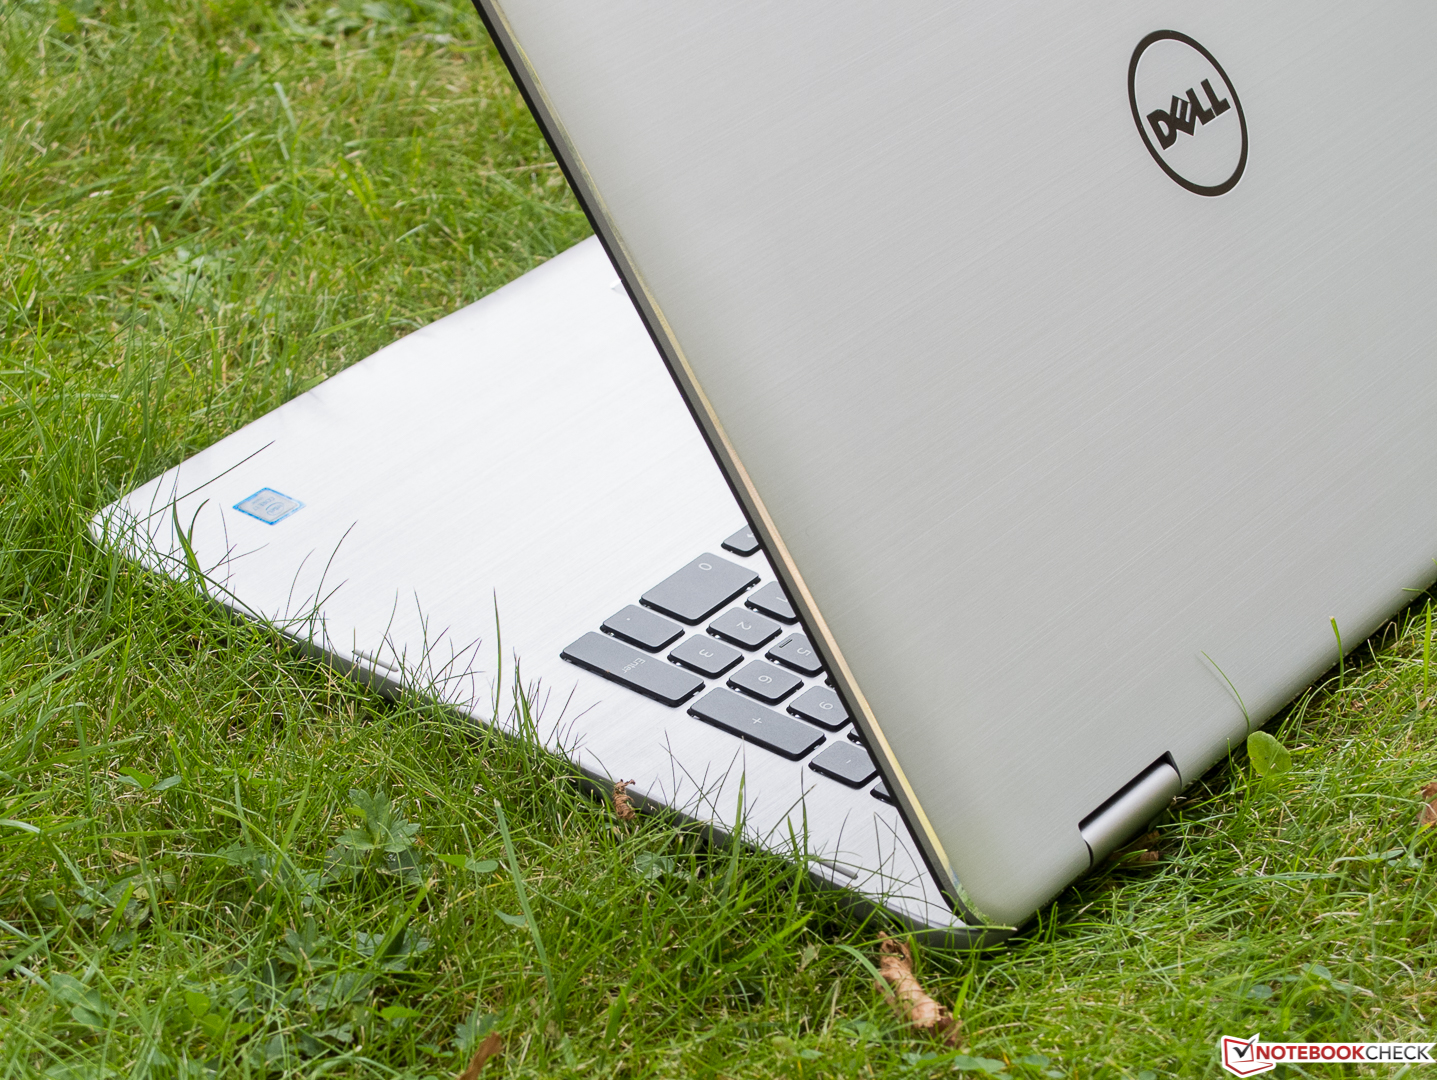
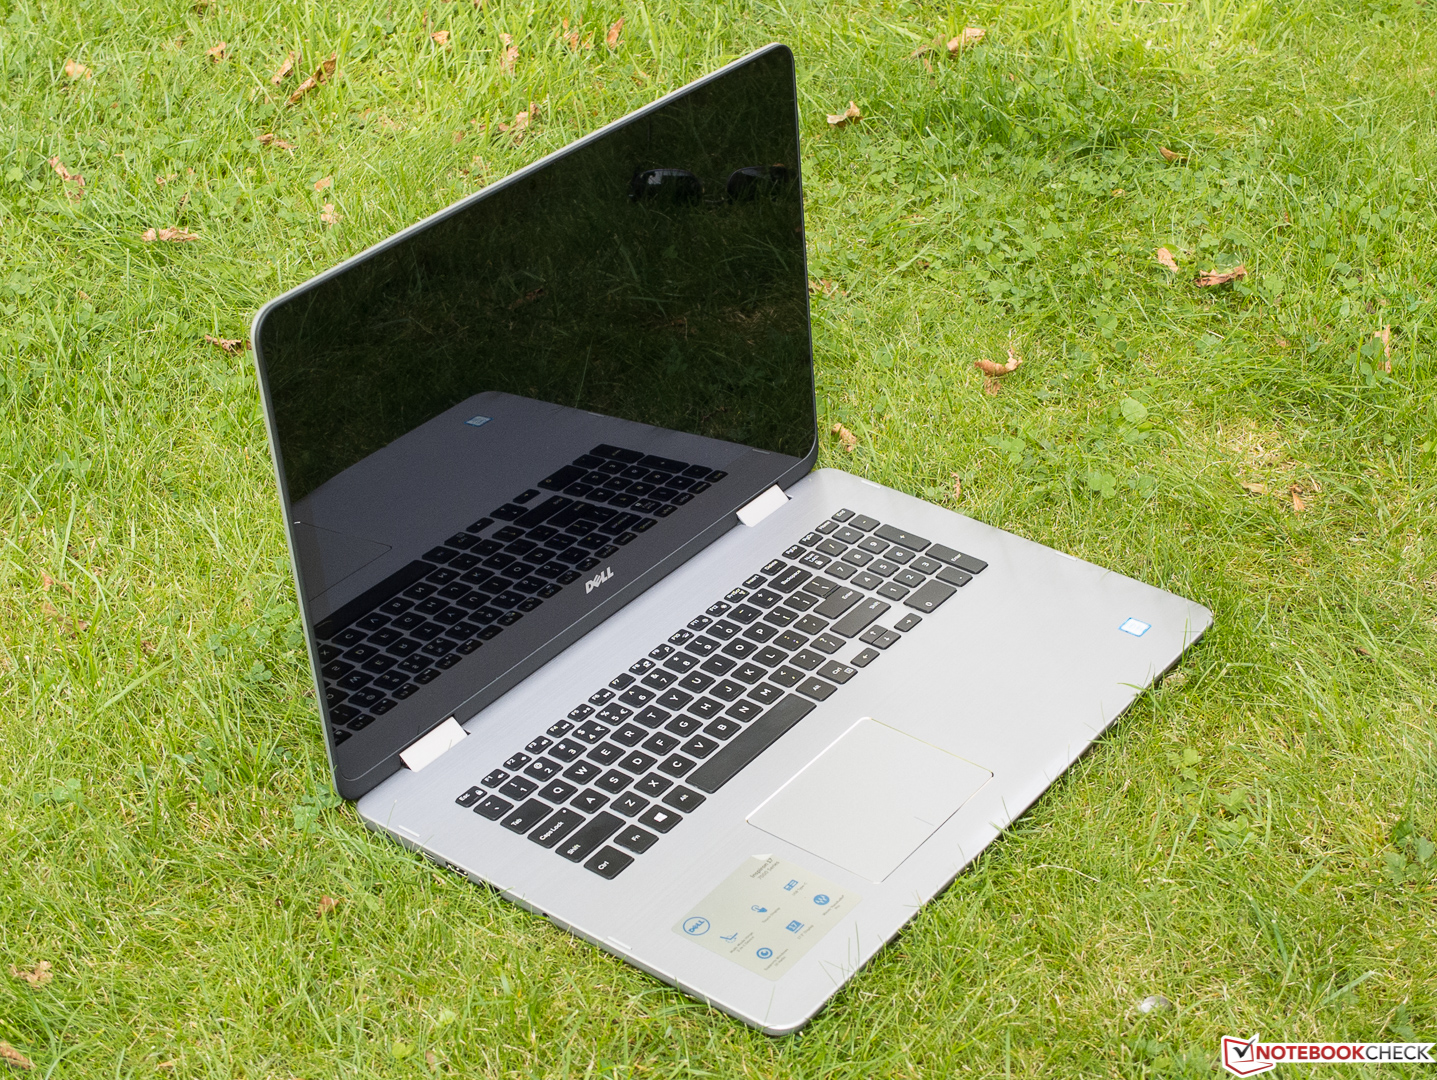
Dell's nieuwe Inspiron 17 7778 2-in-1 is ongetwijfeld een ietwat exotische convertible, wiens mobiele aspecten minder belangrijk zijn dan in kleinere convertibles, puur vanwege het formaat en gewicht. Maar dat is geen nadeel omdat de extra modi die typisch zijn voor een convertible simpelweg een bonus zijn in een apparaat dat perfect gebruikt kan worden als traditioneel multimedia laptop. Zelfs een spelletje spelen kan af en toe dankzij de GeForce 940MX. De behuizing kan absoluut overtuigen en het beeldscherm ook voor het grootste gedeelte. Het systeem draait normaliter erg stil. Een lang uithoudingsvermogen zonder tussentijds opladen zal gebruikers bevallen indien ze onderweg zijn met de 7778.
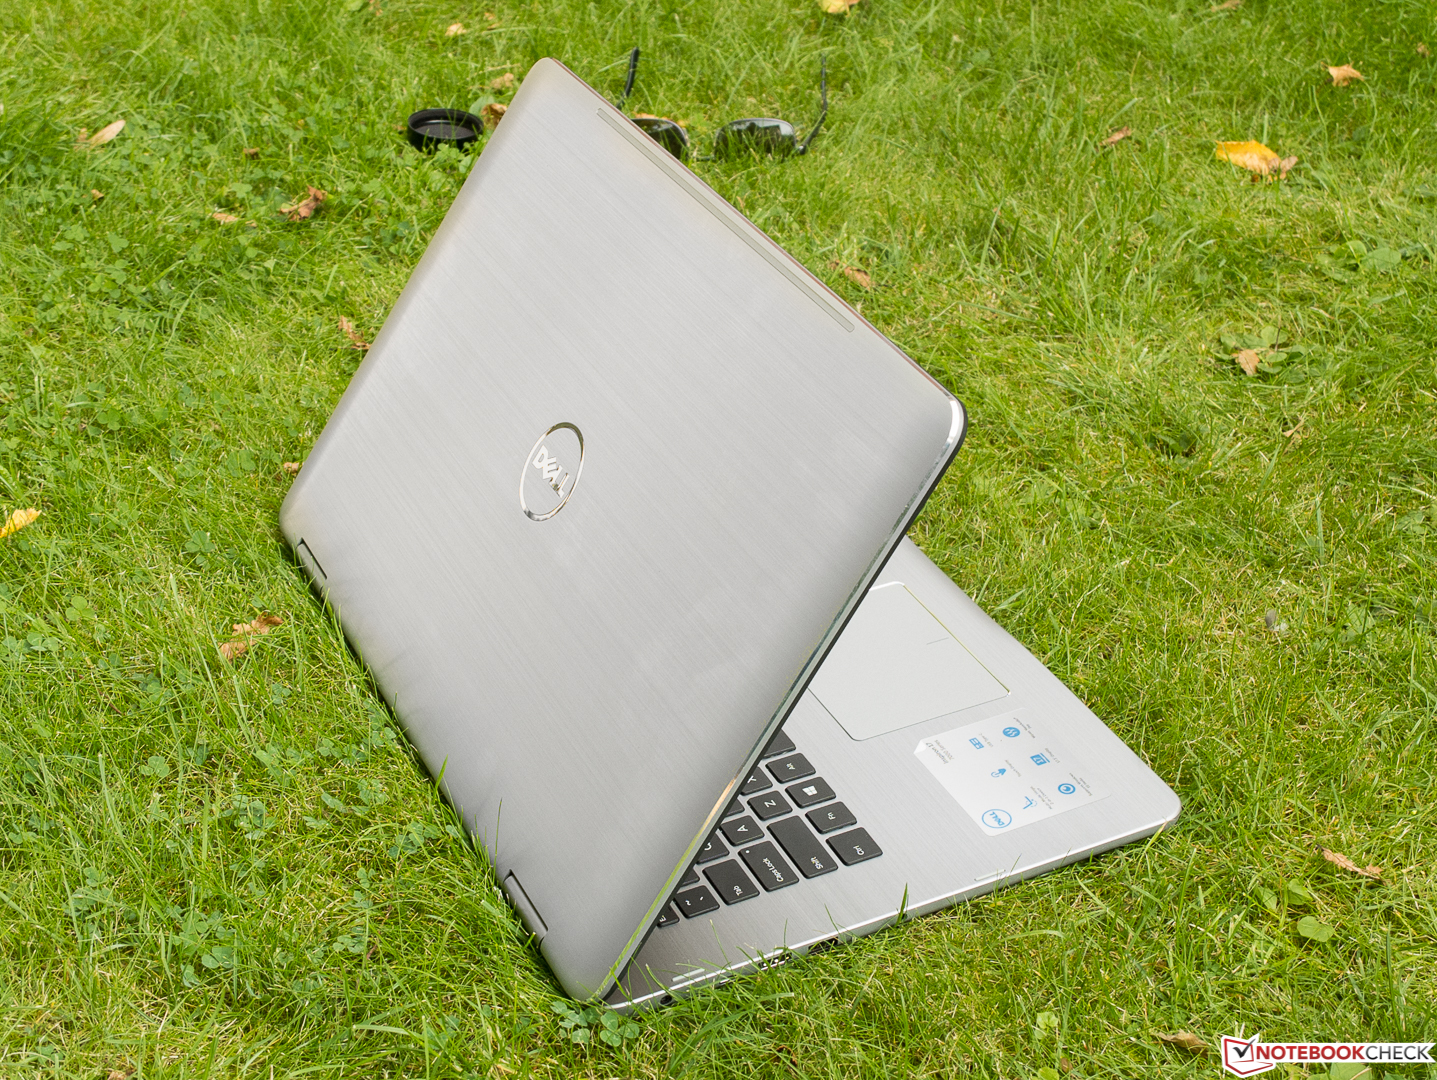
Behalve de in sommige modi hinderlijke scharnier, hebben we kritiek op het suboptimale toetsenbord. Deze zal de meeste schrijvers niet tevreden kunnen stellen. De grafische kaart heeft de neiging tot throttlen, wat eigenlijk minder belangrijk is. De tester wil nog vermelden dat het touchscherm minder goed gebruikt kan worden met vochtige vingers.
Al met al is Dell's Inspiron 17 7778 een flexibele, stijlvolle en voor het grootste deel weldoordachte gigantische convertible die slechts om een paar compromissen vraagt van fans van hybride oplossingen.
Dell Inspiron 17 7778
-
09-09-2016 v5.1(old)
Sven Kloevekorn