 Deutsch
 English
 Español
 Français
 Italiano
 Nederlands
 Polski
 Português
 Русский
 Türkçe
 Svenska
 Chinese
 Magyar
Kort testrapport Asus VivoBook S15 S510UA (i5-7200U, FHD) Laptop


| SD Card Reader | |
| average JPG Copy Test (av. of 3 runs) | |
| HP Pavilion 15t-au100 CTO (W0P31AV) | |
| Asus VivoBook S15 S510UA | |
| Dell Inspiron 15 7000 7567 | |
| maximum AS SSD Seq Read Test (1GB) | |
| HP Pavilion 15t-au100 CTO (W0P31AV) | |
| Asus VivoBook S15 S510UA | |
| Dell Inspiron 15 7000 7567 | |
| Networking | |
| iperf3 transmit AX12 | |
| Asus VivoBook S15 S510UA | |
| Lenovo V510-15IKB 80WQ0002GE | |
| Dell Inspiron 15 7000 7567 (jseb) | |
| iperf3 receive AX12 | |
| Asus VivoBook S15 S510UA | |
| Lenovo V510-15IKB 80WQ0002GE | |
| Dell Inspiron 15 7000 7567 (jseb) | |
| |||||||||||||||||||||||||
Helderheidsverdeling: 89 %
Helderheid in Batterij-modus: 277.5 cd/m²
Contrast: 793:1 (Zwart: 0.35 cd/m²)
ΔE Color 4.8 | 0.5-29.43 Ø5
ΔE Greyscale 3 | 0.57-98 Ø5.3
69.3% sRGB (Argyll 1.6.3 3D)
37.7% AdobeRGB 1998 (Argyll 1.6.3 3D)
41.11% AdobeRGB 1998 (Argyll 2.2.0 3D)
59.5% sRGB (Argyll 2.2.0 3D)
39.9% Display P3 (Argyll 2.2.0 3D)
Gamma: 2.39
| Asus VivoBook S15 S510UA ID: LGD0573, Name: LG Display LP156WF9-SPK2, IPS, 15.60, 1920x1080 | Lenovo V510-15IKB 80WQ0002GE LG Philips LP156WF6-SPK3, IPS, 15.60, 1920x1080 | HP Pavilion 15t-au100 CTO (W0P31AV) BOE0693, IPS, 15.60, 1920x1080 | Apple MacBook Pro 15 2016 (2.9 GHz, 460) Apple APPA030, IPS, 15.40, 2880x1800 | HP Envy 15-as133cl Chi Mei CMN15D8, IPS, 15.60, 1920x1080 | Dell Inspiron 15 7000 7567 AU Optronics AUO38ED B156HTN 28H80, TN, 15.60, 1920x1080 | |
|---|---|---|---|---|---|---|
| Display | -2% | 9% | 109% | 8% | -8% | |
| Display P3 Coverage | 39.9 | 38.8 -3% | 43.27 8% | 99 148% | 42.95 8% | 36.42 -9% |
| sRGB Coverage | 59.5 | 58.1 -2% | 64.9 9% | 100 68% | 64.3 8% | 54.9 -8% |
| AdobeRGB 1998 Coverage | 41.11 | 40.12 -2% | 44.71 9% | 87.3 112% | 44.41 8% | 37.62 -8% |
| Response Times | -8% | -18% | -66% | -15% | -15% | |
| Response Time Grey 50% / Grey 80% * | 38.4 ? | 39 ? -2% | 42 ? -9% | 46 ? -20% | 44.4 ? -16% | 36 ? 6% |
| Response Time Black / White * | 26.4 ? | 30 ? -14% | 33.6 ? -27% | 56 ? -112% | 30 ? -14% | 36 ? -36% |
| PWM Frequency | 20000 ? | 198.4 | 119000 ? | 1000 ? | ||
| Screen | -6% | -9% | 46% | 2% | -75% | |
| Brightness middle | 277.5 | 256 -8% | 186.5 -33% | 420 51% | 262.3 -5% | 246 -11% |
| Brightness | 265 | 252 -5% | 174 -34% | 401 51% | 240 -9% | 235 -11% |
| Brightness Distribution | 89 | 87 -2% | 69 -22% | 90 1% | 83 -7% | 75 -16% |
| Black Level * | 0.35 | 0.3 14% | 0.18 49% | 0.3 14% | 0.24 31% | 0.55 -57% |
| Contrast | 793 | 853 8% | 1036 31% | 1400 77% | 1093 38% | 447 -44% |
| Colorchecker dE 2000 * | 4.8 | 5.4 -13% | 5.7 -19% | 3.33 31% | 5 -4% | 10.97 -129% |
| Colorchecker dE 2000 max. * | 17.8 | 9.36 47% | 22.5 -26% | 5.11 71% | 20.6 -16% | |
| Greyscale dE 2000 * | 3 | 5.37 -79% | 4.4 -47% | 2.73 9% | 3.2 -7% | 14.25 -375% |
| Gamma | 2.39 92% | 2.58 85% | 2.35 94% | 2.48 89% | 2.45 90% | 1.83 120% |
| CCT | 6854 95% | 6795 96% | 6963 93% | 6457 101% | 6817 95% | 11200 58% |
| Color Space (Percent of AdobeRGB 1998) | 37.7 | 37 -2% | 44.71 19% | 78.09 107% | 40.5 7% | 35 -7% |
| Color Space (Percent of sRGB) | 69.3 | 58 -16% | 64.95 -6% | 99.97 44% | 63.5 -8% | 55 -21% |
| Totaal Gemiddelde (Programma / Instellingen) | -5% /
-5% | -6% /
-7% | 30% /
43% | -2% /
1% | -33% /
-52% |
* ... kleiner is beter
Responstijd Scherm
| ↔ Responstijd Zwart naar Wit | ||
|---|---|---|
| 26.4 ms ... stijging ↗ en daling ↘ gecombineerd | ↗ 15.6 ms stijging | 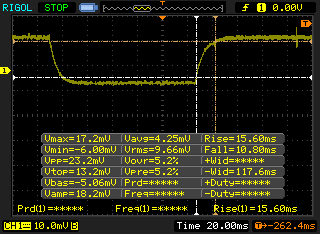 |
| ↘ 10.8 ms daling | ||
| Het scherm vertoonde relatief trage responstijden in onze tests en is misschien te traag voor games. Ter vergelijking: alle testtoestellen variëren van 0.1 (minimum) tot 240 (maximum) ms. » 61 % van alle toestellen zijn beter. Dit betekent dat de gemeten responstijd slechter is dan het gemiddelde (21.5 ms) van alle geteste toestellen. | ||
| ↔ Responstijd 50% Grijs naar 80% Grijs | ||
| 38.4 ms ... stijging ↗ en daling ↘ gecombineerd | ↗ 19.2 ms stijging | 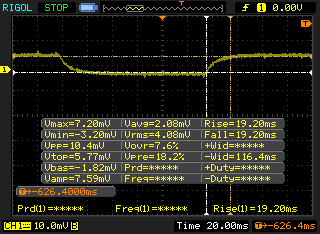 |
| ↘ 19.2 ms daling | ||
| Het scherm vertoonde trage responstijden in onze tests en is misschien te traag voor games. Ter vergelijking: alle testtoestellen variëren van 0.2 (minimum) tot 636 (maximum) ms. » 52 % van alle toestellen zijn beter. Dit betekent dat de gemeten responstijd slechter is dan het gemiddelde (33.7 ms) van alle geteste toestellen. | ||
Screen Flickering / PWM (Pulse-Width Modulation)
| Screen flickering / PWM niet waargenomen | 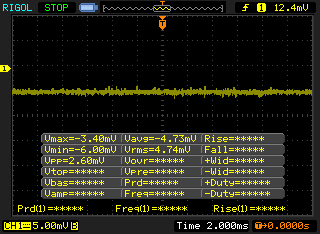 | ||
Ter vergelijking: 53 % van alle geteste toestellen maakten geen gebruik van PWM om de schermhelderheid te verlagen. Als het wel werd gebruikt, werd een gemiddelde van 17924 (minimum: 5 - maximum: 3846000) Hz waargenomen. | |||
| Cinebench R15 | |
| CPU Single 64Bit | |
| Lenovo ThinkPad 13-20J2S00G00 | |
| Lenovo ThinkPad T470s-20HF0012US | |
| Apple MacBook Pro 13 2016 (2.9 GHz) | |
| Asus VivoBook S15 S510UA | |
| Dell Latitude 5280 | |
| HP ProBook 640 G2-T9X60ET | |
| HP 250 G4 T6P08ES | |
| Lenovo IdeaPad Z40-59422614 | |
| Lenovo Thinkpad 13-20J1001BUS | |
| HP EliteBook 725 G4 | |
| CPU Multi 64Bit | |
| Lenovo ThinkPad T470s-20HF0012US | |
| Lenovo ThinkPad 13-20J2S00G00 | |
| Apple MacBook Pro 13 2016 (2.9 GHz) | |
| Asus VivoBook S15 S510UA | |
| Dell Latitude 5280 | |
| HP ProBook 640 G2-T9X60ET | |
| HP 250 G4 T6P08ES | |
| Lenovo Thinkpad 13-20J1001BUS | |
| HP EliteBook 725 G4 | |
| Lenovo IdeaPad Z40-59422614 | |
| Cinebench R11.5 | |
| CPU Single 64Bit | |
| Lenovo ThinkPad 13-20J2S00G00 | |
| Lenovo ThinkPad T470s-20HF0012US | |
| Asus VivoBook S15 S510UA | |
| Dell Latitude 5280 | |
| HP ProBook 640 G2-T9X60ET | |
| HP 250 G4 T6P08ES | |
| Lenovo IdeaPad Z40-59422614 | |
| Lenovo Thinkpad 13-20J1001BUS | |
| HP EliteBook 725 G4 | |
| CPU Multi 64Bit | |
| Lenovo ThinkPad T470s-20HF0012US | |
| Lenovo ThinkPad 13-20J2S00G00 | |
| Asus VivoBook S15 S510UA | |
| Dell Latitude 5280 | |
| HP ProBook 640 G2-T9X60ET | |
| Lenovo Thinkpad 13-20J1001BUS | |
| HP 250 G4 T6P08ES | |
| Lenovo IdeaPad Z40-59422614 | |
| HP EliteBook 725 G4 | |
| Cinebench R10 | |
| Rendering Multiple CPUs 32Bit | |
| Asus VivoBook S15 S510UA | |
| Dell Latitude 5280 | |
| Lenovo ThinkPad 13-20J2S00G00 | |
| HP ProBook 640 G2-T9X60ET | |
| Lenovo Thinkpad 13-20J1001BUS | |
| HP 250 G4 T6P08ES | |
| Lenovo IdeaPad Z40-59422614 | |
| HP EliteBook 725 G4 | |
| Rendering Single 32Bit | |
| Asus VivoBook S15 S510UA | |
| Dell Latitude 5280 | |
| Lenovo ThinkPad 13-20J2S00G00 | |
| HP ProBook 640 G2-T9X60ET | |
| HP 250 G4 T6P08ES | |
| Lenovo Thinkpad 13-20J1001BUS | |
| Lenovo IdeaPad Z40-59422614 | |
| HP EliteBook 725 G4 | |
| wPrime 2.10 - 1024m | |
| Lenovo IdeaPad Z40-59422614 | |
| Lenovo Thinkpad 13-20J1001BUS | |
| HP EliteBook 725 G4 | |
| Dell Latitude 5280 | |
| Asus VivoBook S15 S510UA | |
| Lenovo ThinkPad T470s-20HF0012US | |
* ... kleiner is beter
| PCMark 8 | |
| Home Score Accelerated v2 | |
| Apple MacBook Pro 15 2016 (2.9 GHz, 460) | |
| Asus VivoBook S15 S510UA | |
| HP Pavilion 15t-au100 CTO (W0P31AV) | |
| Work Score Accelerated v2 | |
| Apple MacBook Pro 15 2016 (2.9 GHz, 460) | |
| Asus VivoBook S15 S510UA | |
| HP Pavilion 15t-au100 CTO (W0P31AV) | |
| Creative Score Accelerated v2 | |
| Apple MacBook Pro 15 2016 (2.9 GHz, 460) | |
| Asus VivoBook S15 S510UA | |
| HP Pavilion 15t-au100 CTO (W0P31AV) | |
| PCMark 8 Home Score Accelerated v2 | 3831 punten | |
| PCMark 8 Creative Score Accelerated v2 | 4627 punten | |
| PCMark 8 Work Score Accelerated v2 | 4746 punten | |
Help | ||
| Asus VivoBook S15 S510UA Toshiba HG6 THNSNJ128G8NY | Lenovo V510-15IKB 80WQ0002GE Samsung CM871a MZNTY256HDHP | HP Pavilion 15t-au100 CTO (W0P31AV) Toshiba MQ01ABD100 | Apple MacBook Pro 15 2016 (2.9 GHz, 460) Apple SSD SM1024L | Dell Inspiron 15 7000 7567 Intel SSDSCKKF256H6 | |
|---|---|---|---|---|---|
| CrystalDiskMark 3.0 | 51% | -91% | 165% | 29% | |
| Read Seq | 503 | 532 6% | 109.5 -78% | 1458 190% | 485.8 -3% |
| Write Seq | 396 | 511 29% | 105.2 -73% | 1440 264% | 422.8 7% |
| Read 512 | 417.7 | 414.8 -1% | 34.08 -92% | 914 119% | 338.9 -19% |
| Write 512 | 342 | 307.7 -10% | 40.02 -88% | 1058 209% | 304 -11% |
| Read 4k | 19.48 | 39.51 103% | 0.429 -98% | 9.786 -50% | 27.11 39% |
| Write 4k | 64.6 | 108.1 67% | 1.008 -98% | 10.9 -83% | 85.4 32% |
| Read 4k QD32 | 250.3 | 361.6 44% | 0.81 -100% | 679 171% | 279.6 12% |
| Write 4k QD32 | 94.3 | 253 168% | 0.893 -99% | 562 496% | 255.1 171% |

| 3DMark | |
| 1280x720 Cloud Gate Standard Graphics | |
| Apple MacBook Pro 13 2016 (2.9 GHz) | |
| HP Spectre x360 15-bl002xx | |
| Asus VivoBook S15 S510UA | |
| Acer TravelMate P249-M-5452 | |
| Dell Latitude 5280 | |
| HP 250 G4 T6P08ES | |
| HP EliteBook 725 G4 | |
| 1920x1080 Fire Strike Graphics | |
| HP Spectre x360 15-bl002xx | |
| Apple MacBook Pro 13 2016 (2.9 GHz) | |
| HP EliteBook 725 G4 | |
| HP EliteBook 725 G4 | |
| Asus VivoBook S15 S510UA | |
| HP 250 G4 T6P08ES | |
| Acer TravelMate P249-M-5452 | |
| Dell Latitude 5280 | |
| 1920x1080 Ice Storm Extreme Graphics | |
| Asus VivoBook S15 S510UA | |
| Acer TravelMate P249-M-5452 | |
| Dell Latitude 5280 | |
| HP Spectre x360 15-bl002xx | |
| HP EliteBook 725 G4 | |
| 3DMark 11 Performance | 1768 punten | |
| 3DMark Ice Storm Standard Score | 69286 punten | |
| 3DMark Cloud Gate Standard Score | 6704 punten | |
| 3DMark Fire Strike Score | 965 punten | |
| 3DMark Fire Strike Extreme Score | 449 punten | |
Help | ||
| lage | gem. | hoge | ultra | |
| BioShock Infinite (2013) | 62.7 | 33.9 | 28.6 | 8.8 |
| Dota 2 Reborn (2015) | 82 | 56 | 20 |
Geluidsniveau
| Onbelast |
| 30.2 / 30.2 / 30.2 dB (A) |
| HDD |
| 30.2 dB (A) |
| Belasting |
| 36.9 / 37 dB (A) |
 | ||
30 dB stil 40 dB(A) hoorbaar 50 dB(A) luid |
||
min: | ||
| Asus VivoBook S15 S510UA HD Graphics 620, i5-7200U, Toshiba HG6 THNSNJ128G8NY | Lenovo V510-15IKB 80WQ0002GE HD Graphics 620, i5-7200U, Samsung CM871a MZNTY256HDHP | HP Pavilion 15t-au100 CTO (W0P31AV) GeForce 940MX, i7-7500U, Toshiba MQ01ABD100 | Apple MacBook Pro 15 2016 (2.9 GHz, 460) Radeon Pro 460, 6920HQ, Apple SSD SM1024L | Dell Inspiron 15 7000 7567 GeForce GTX 1050 Ti Mobile, i7-7700HQ, Intel SSDSCKKF256H6 | |
|---|---|---|---|---|---|
| Noise | 0% | -9% | -4% | -11% | |
| uit / omgeving * | 28.2 | 30.2 -7% | 29 -3% | 30.3 -7% | |
| Idle Minimum * | 30.2 | 30.2 -0% | 32.2 -7% | 30.3 -0% | 30.9 -2% |
| Idle Average * | 30.2 | 30.2 -0% | 32.2 -7% | 30.3 -0% | 30.9 -2% |
| Idle Maximum * | 30.2 | 32 -6% | 33.7 -12% | 30.3 -0% | 31 -3% |
| Load Average * | 36.9 | 34.7 6% | 39.4 -7% | 35.1 5% | 46.5 -26% |
| Load Maximum * | 37 | 33.9 8% | 42.2 -14% | 46 -24% | 46.8 -26% |
* ... kleiner is beter
(-) De maximumtemperatuur aan de bovenzijde bedraagt 46 °C / 115 F, vergeleken met het gemiddelde van 36.9 °C / 98 F, variërend van 21.1 tot 71 °C voor de klasse Multimedia.
(±) De bodem warmt op tot een maximum van 45 °C / 113 F, vergeleken met een gemiddelde van 39.1 °C / 102 F
(+) Bij onbelast gebruik bedraagt de gemiddelde temperatuur voor de bovenzijde 23.5 °C / 74 F, vergeleken met het apparaatgemiddelde van 31.2 °C / 88 F.
(+) De handpalmsteunen en het touchpad bereiken maximaal de huidtemperatuur (32.4 °C / 90.3 F) en zijn dus niet heet.
(-) De gemiddelde temperatuur van de handpalmsteun van soortgelijke toestellen bedroeg 28.8 °C / 83.8 F (-3.6 °C / -6.5 F).
Asus VivoBook S15 S510UA audioanalyse
(-) | niet erg luide luidsprekers (66.4 dB)
Bas 100 - 315 Hz
(-) | bijna geen lage tonen - gemiddeld 15.3% lager dan de mediaan
(±) | lineariteit van de lage tonen is gemiddeld (12.2% delta ten opzichte van de vorige frequentie)
Mids 400 - 2000 Hz
(+) | evenwichtige middens - slechts 1.6% verwijderd van de mediaan
(+) | de middentonen zijn lineair (6.8% delta ten opzichte van de vorige frequentie)
Hoog 2 - 16 kHz
(+) | evenwichtige hoogtepunten - slechts 3.8% verwijderd van de mediaan
(±) | lineariteit van de hoogtepunten is gemiddeld (10.6% delta ten opzichte van de vorige frequentie)
Algemeen 100 - 16.000 Hz
(±) | lineariteit van het totale geluid is gemiddeld (19.8% verschil met de mediaan)
Vergeleken met dezelfde klasse
» 61% van alle geteste apparaten in deze klasse waren beter, 7% vergelijkbaar, 32% slechter
» De beste had een delta van 5%, het gemiddelde was 18%, de slechtste was 45%
Vergeleken met alle geteste toestellen
» 45% van alle geteste apparaten waren beter, 7% gelijk, 48% slechter
» De beste had een delta van 4%, het gemiddelde was 25%, de slechtste was 134%
Apple MacBook 12 (Early 2016) 1.1 GHz audioanalyse
(+) | luidsprekers kunnen relatief luid spelen (83.6 dB)
Bas 100 - 315 Hz
(±) | verminderde zeebaars - gemiddeld 11.3% lager dan de mediaan
(±) | lineariteit van de lage tonen is gemiddeld (14.2% delta ten opzichte van de vorige frequentie)
Mids 400 - 2000 Hz
(+) | evenwichtige middens - slechts 2.4% verwijderd van de mediaan
(+) | de middentonen zijn lineair (5.5% delta ten opzichte van de vorige frequentie)
Hoog 2 - 16 kHz
(+) | evenwichtige hoogtepunten - slechts 2% verwijderd van de mediaan
(+) | de hoge tonen zijn lineair (4.5% delta naar de vorige frequentie)
Algemeen 100 - 16.000 Hz
(+) | het totale geluid is lineair (10.2% verschil met de mediaan)
Vergeleken met dezelfde klasse
» 5% van alle geteste apparaten in deze klasse waren beter, 2% vergelijkbaar, 93% slechter
» De beste had een delta van 5%, het gemiddelde was 19%, de slechtste was 53%
Vergeleken met alle geteste toestellen
» 3% van alle geteste apparaten waren beter, 1% gelijk, 96% slechter
» De beste had een delta van 4%, het gemiddelde was 25%, de slechtste was 134%
| Uit / Standby | |
| Inactief | |
| Belasting |
|
| Asus VivoBook S15 S510UA i5-7200U, HD Graphics 620, Toshiba HG6 THNSNJ128G8NY, IPS, 1920x1080, 15.60 | Lenovo V510-15IKB 80WQ0002GE i5-7200U, HD Graphics 620, Samsung CM871a MZNTY256HDHP, IPS, 1920x1080, 15.60 | HP Pavilion 15t-au100 CTO (W0P31AV) i7-7500U, GeForce 940MX, Toshiba MQ01ABD100, IPS, 1920x1080, 15.60 | Apple MacBook Pro 15 2016 (2.9 GHz, 460) 6920HQ, Radeon Pro 460, Apple SSD SM1024L, IPS, 2880x1800, 15.40 | HP Envy 15-as133cl i7-7500U, HD Graphics 620, HGST Travelstar 5K1000 HTS541010A7E630, IPS, 1920x1080, 15.60 | |
|---|---|---|---|---|---|
| Power Consumption | -5% | -33% | -62% | 10% | |
| Idle Minimum * | 4.6 | 4 13% | 6.16 -34% | 3 35% | 4.6 -0% |
| Idle Average * | 7.6 | 9.6 -26% | 8.48 -12% | 9.9 -30% | 7.7 -1% |
| Idle Maximum * | 7.7 | 9.7 -26% | 9.62 -25% | 12.5 -62% | 7.8 -1% |
| Load Average * | 35.1 | 27.7 21% | 41.63 -19% | 70.6 -101% | 30.5 13% |
| Load Maximum * | 36.2 | 38.4 -6% | 63.22 -75% | 90.8 -151% | 22.7 37% |
* ... kleiner is beter
| Asus VivoBook S15 S510UA i5-7200U, HD Graphics 620, 42 Wh | Lenovo V510-15IKB 80WQ0002GE i5-7200U, HD Graphics 620, 32 Wh | HP Pavilion 15t-au100 CTO (W0P31AV) i7-7500U, GeForce 940MX, 41 Wh | Apple MacBook Pro 15 2016 (2.9 GHz, 460) 6920HQ, Radeon Pro 460, 76 Wh | HP Envy 15-as133cl i7-7500U, HD Graphics 620, 52 Wh | |
|---|---|---|---|---|---|
| Batterijduur | -13% | 2% | 57% | 18% | |
| Reader / Idle | 614 | 438 -29% | 573 -7% | ||
| WiFi v1.3 | 259 | 225 -13% | 220 -15% | 619 139% | 408 58% |
| Load | 70 | 106 51% | 52 -26% | 72 3% |
Pro
Contra

Voor het volledige, Engelse testrapport, klik hier.
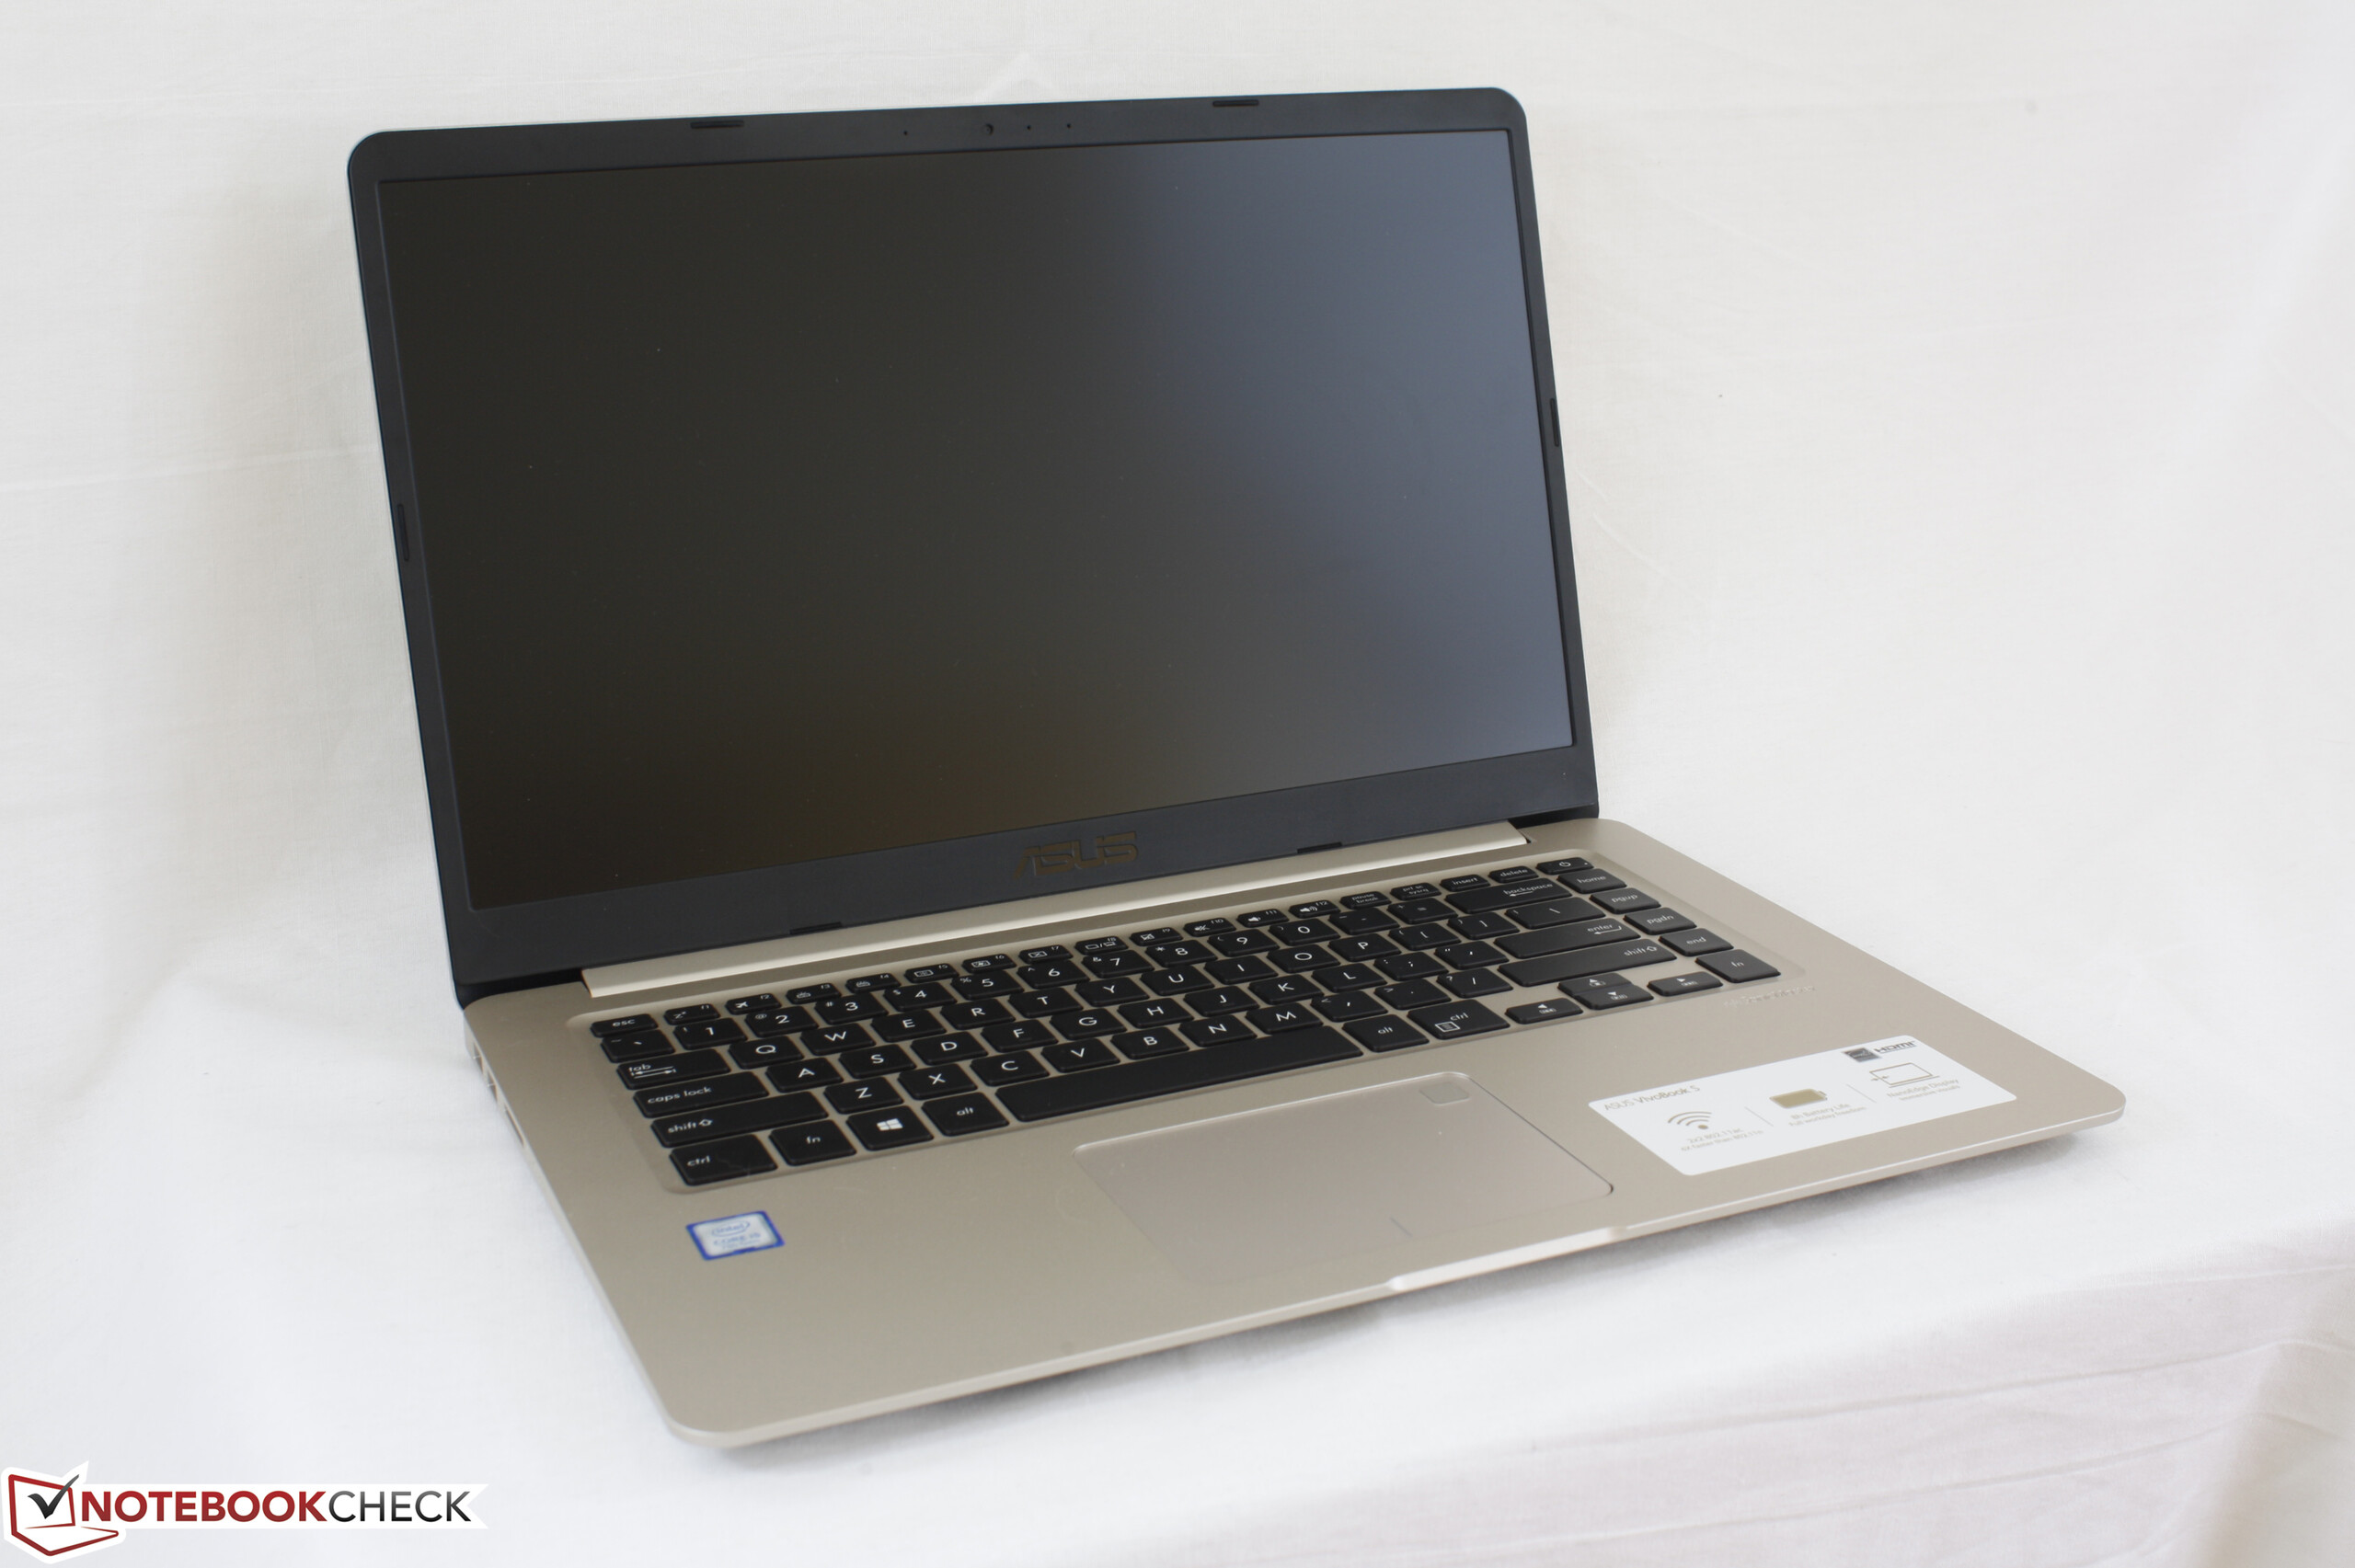
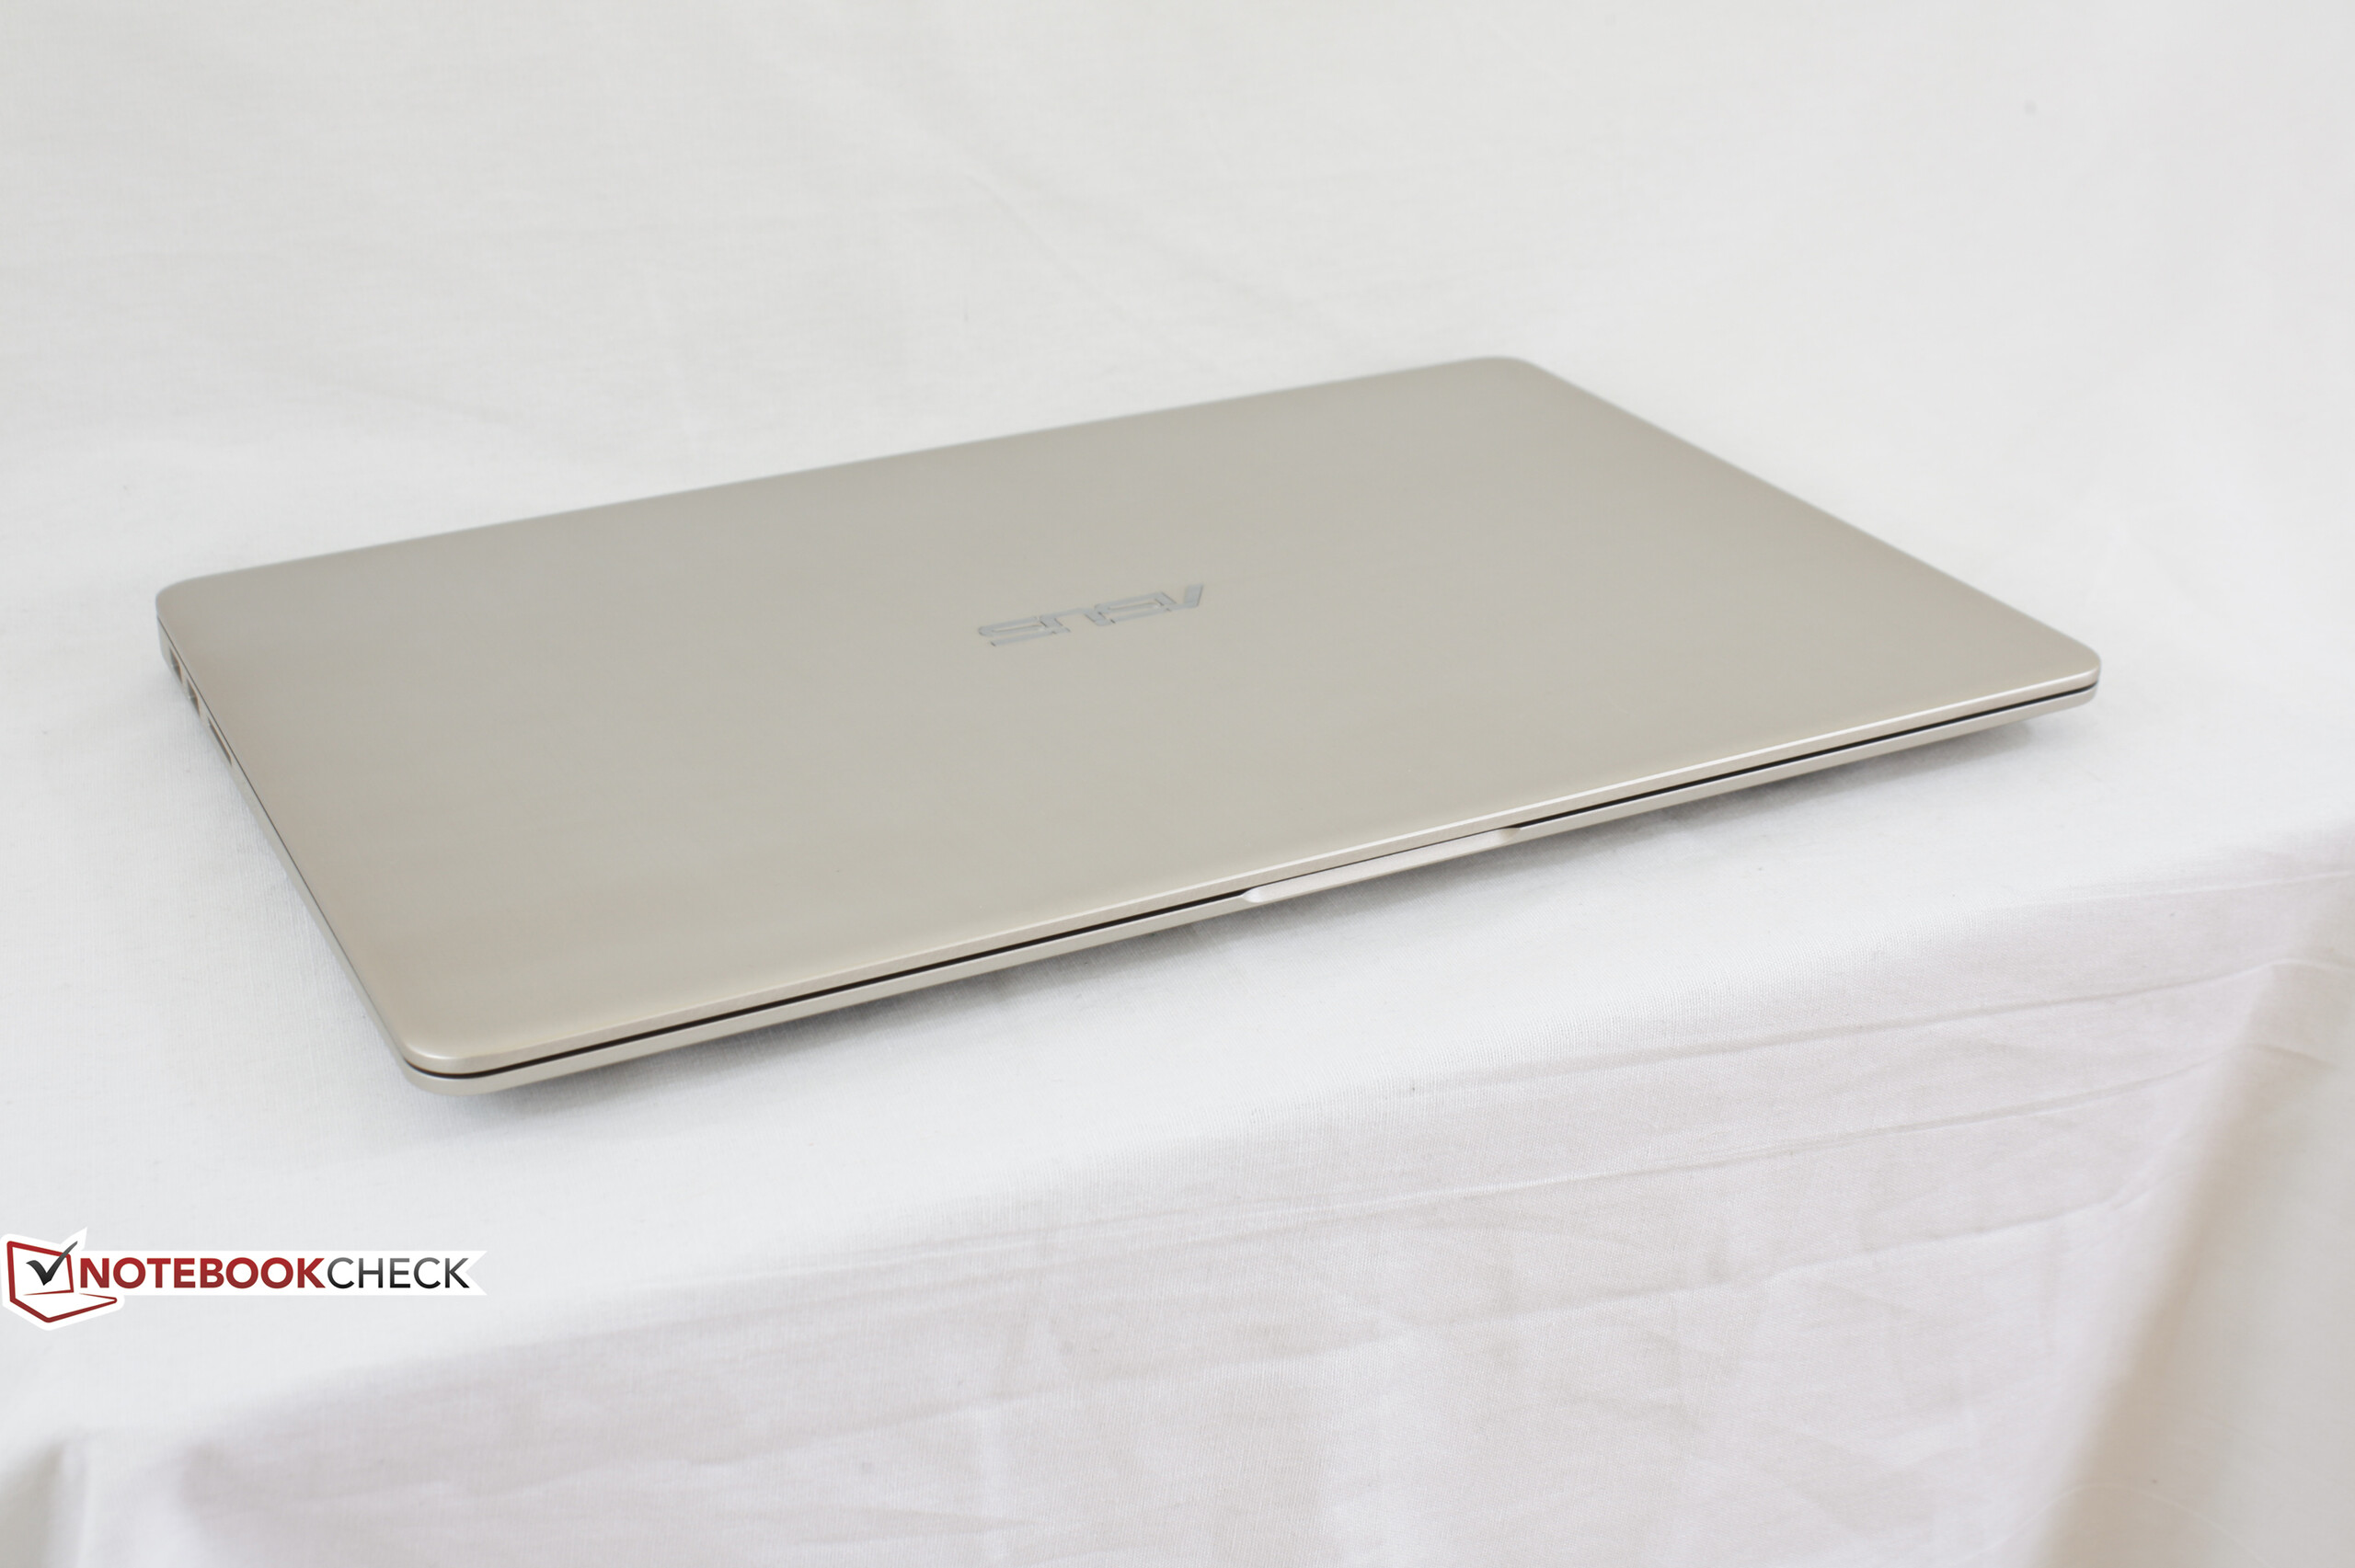
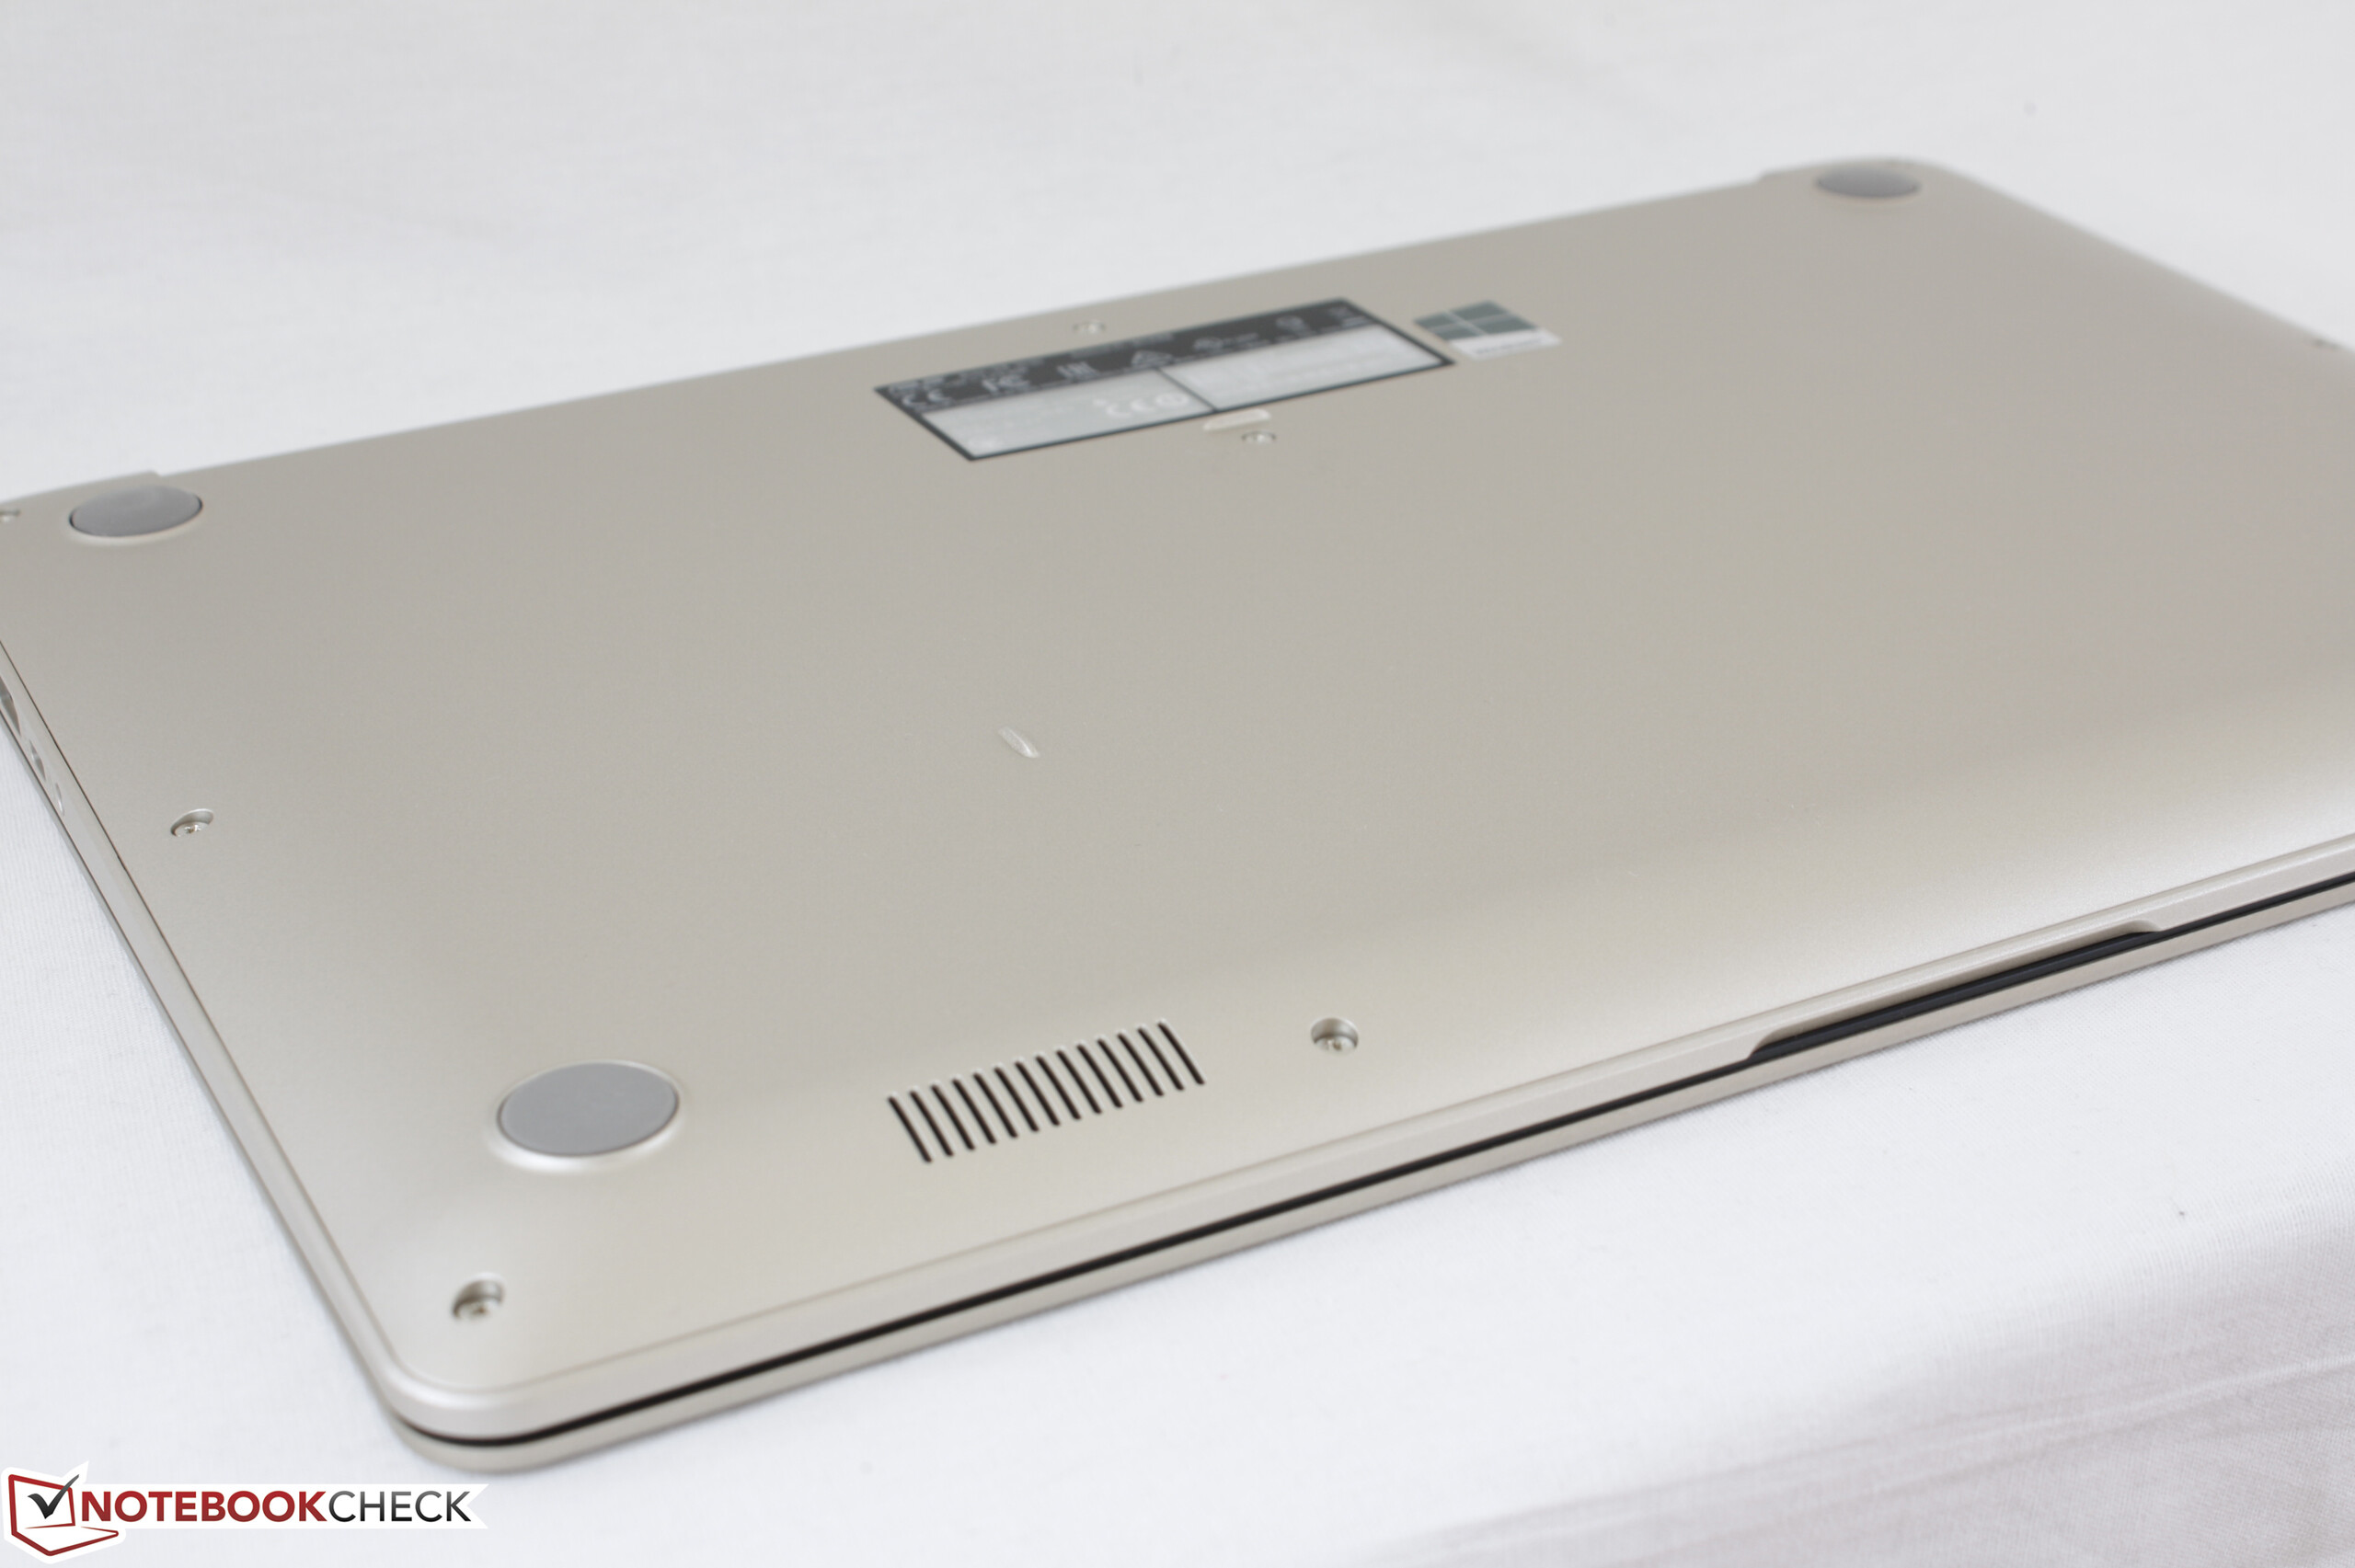
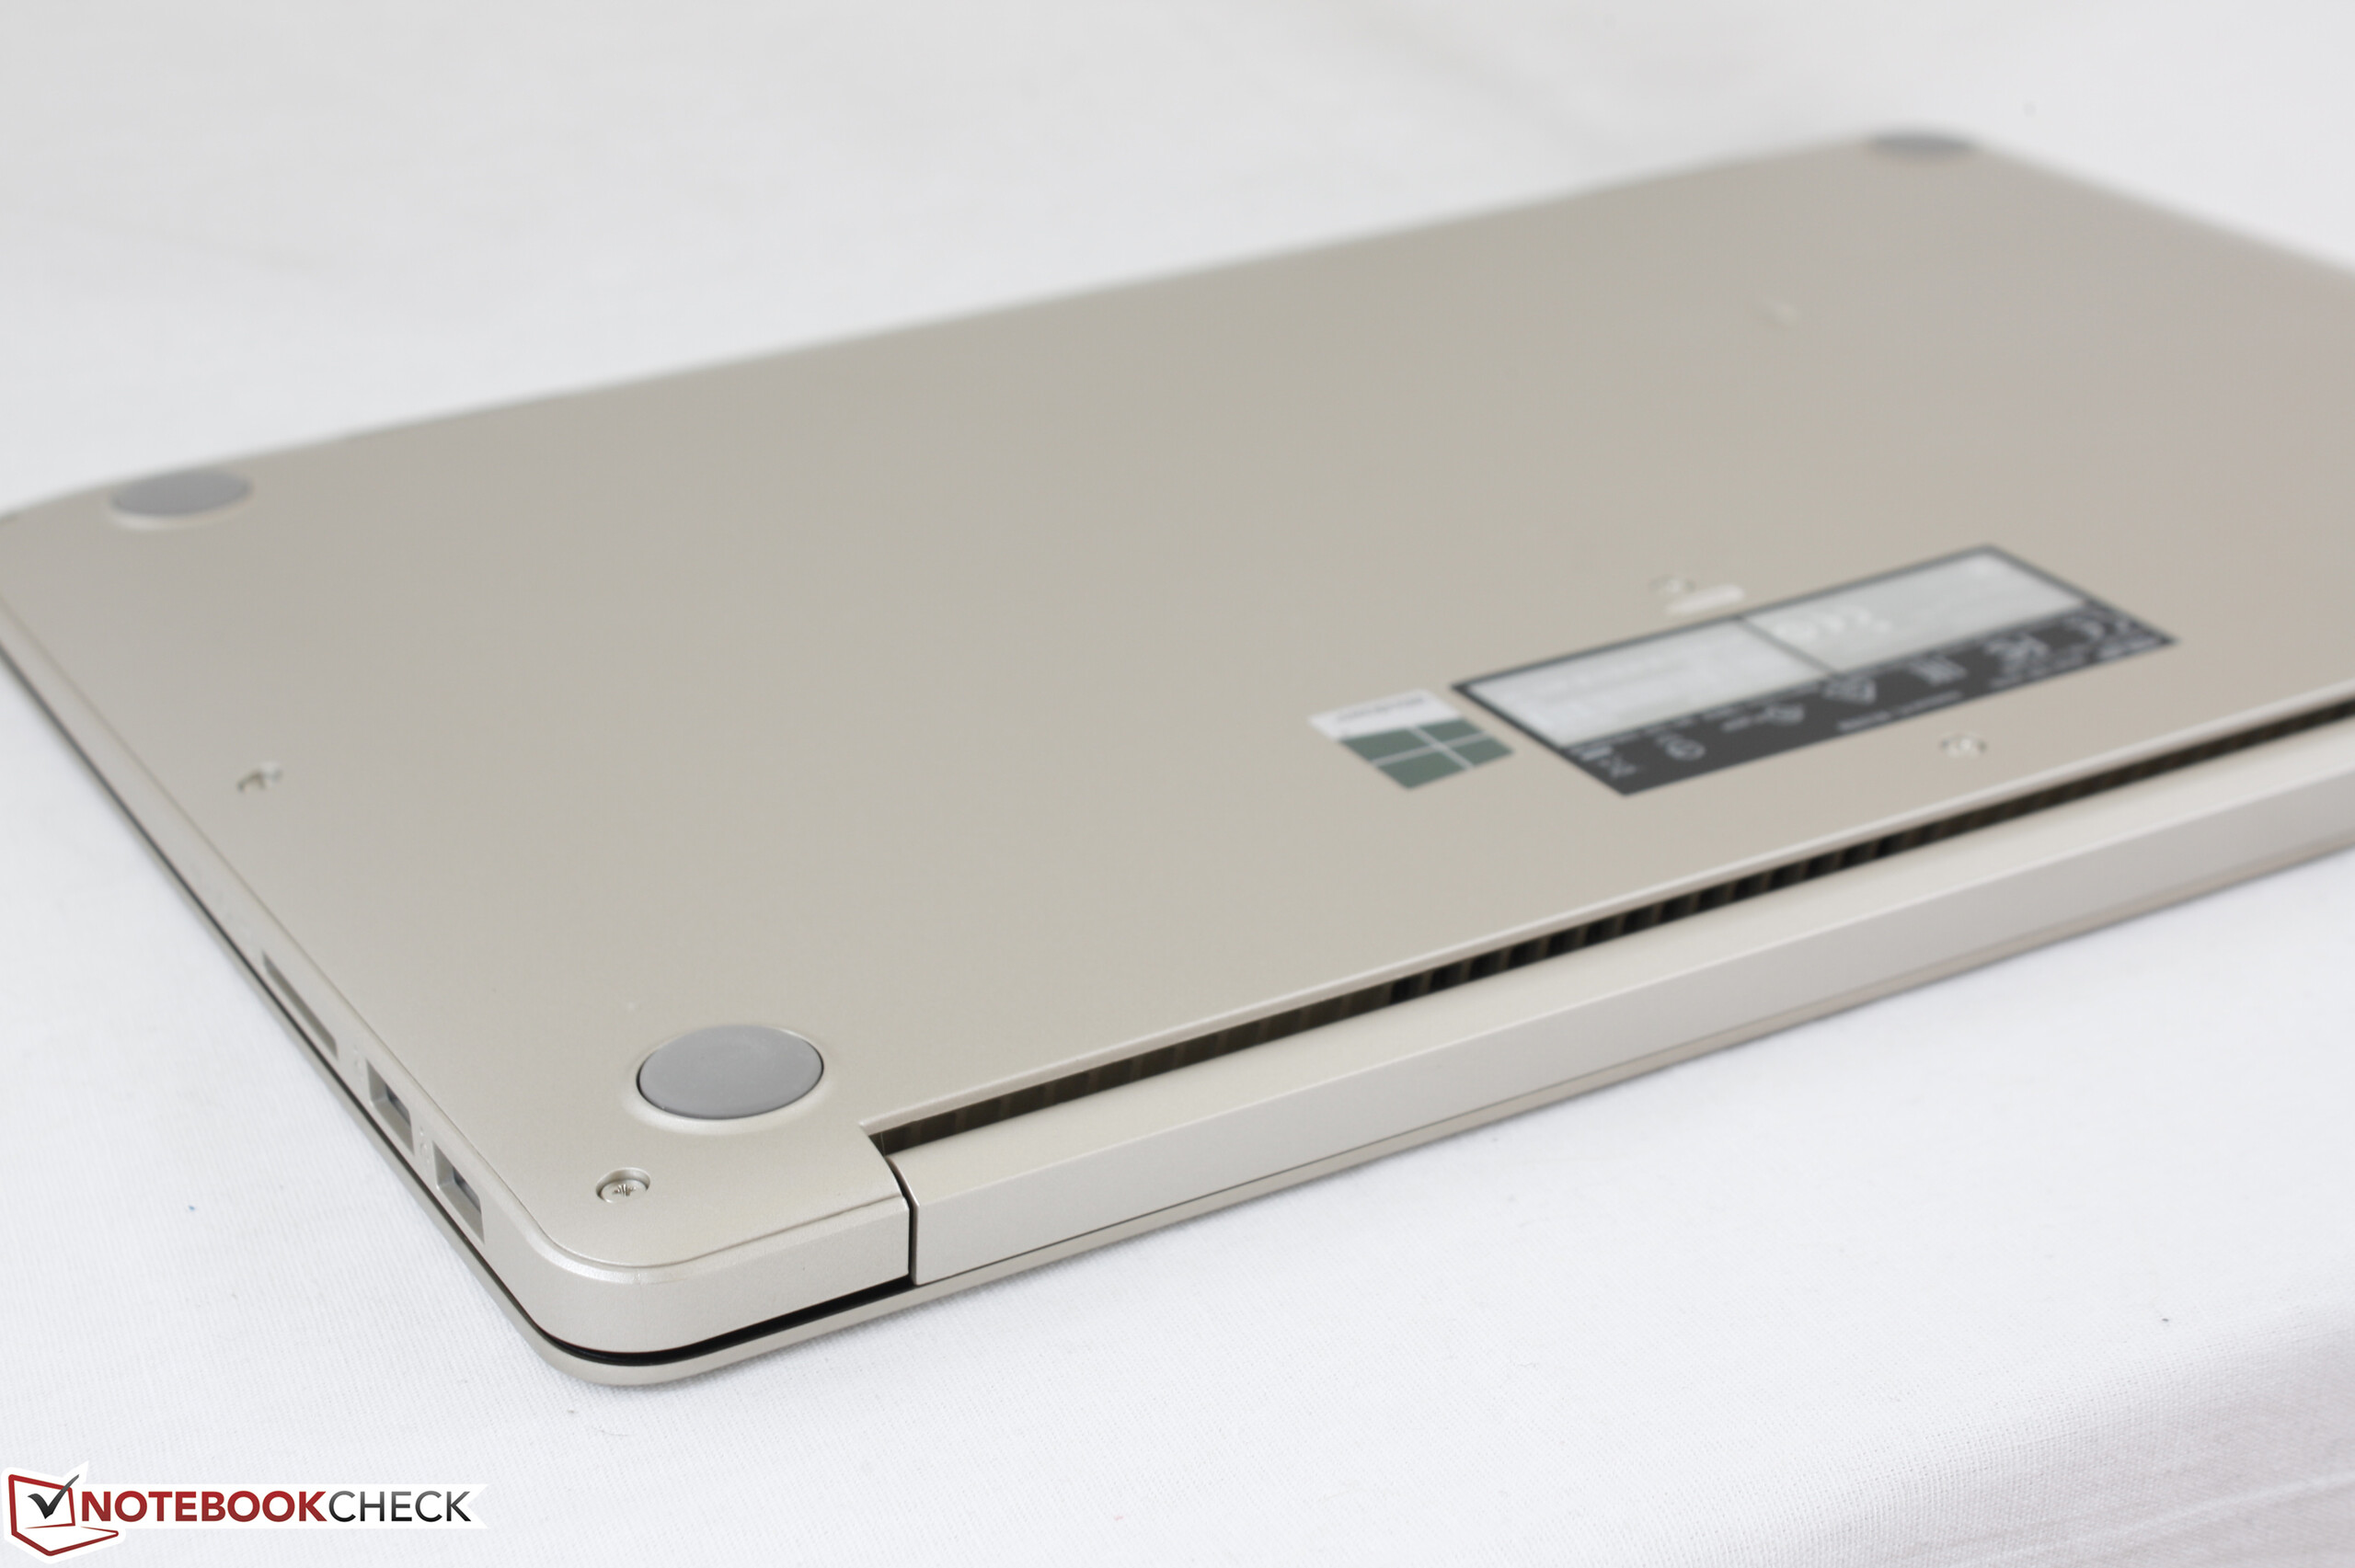
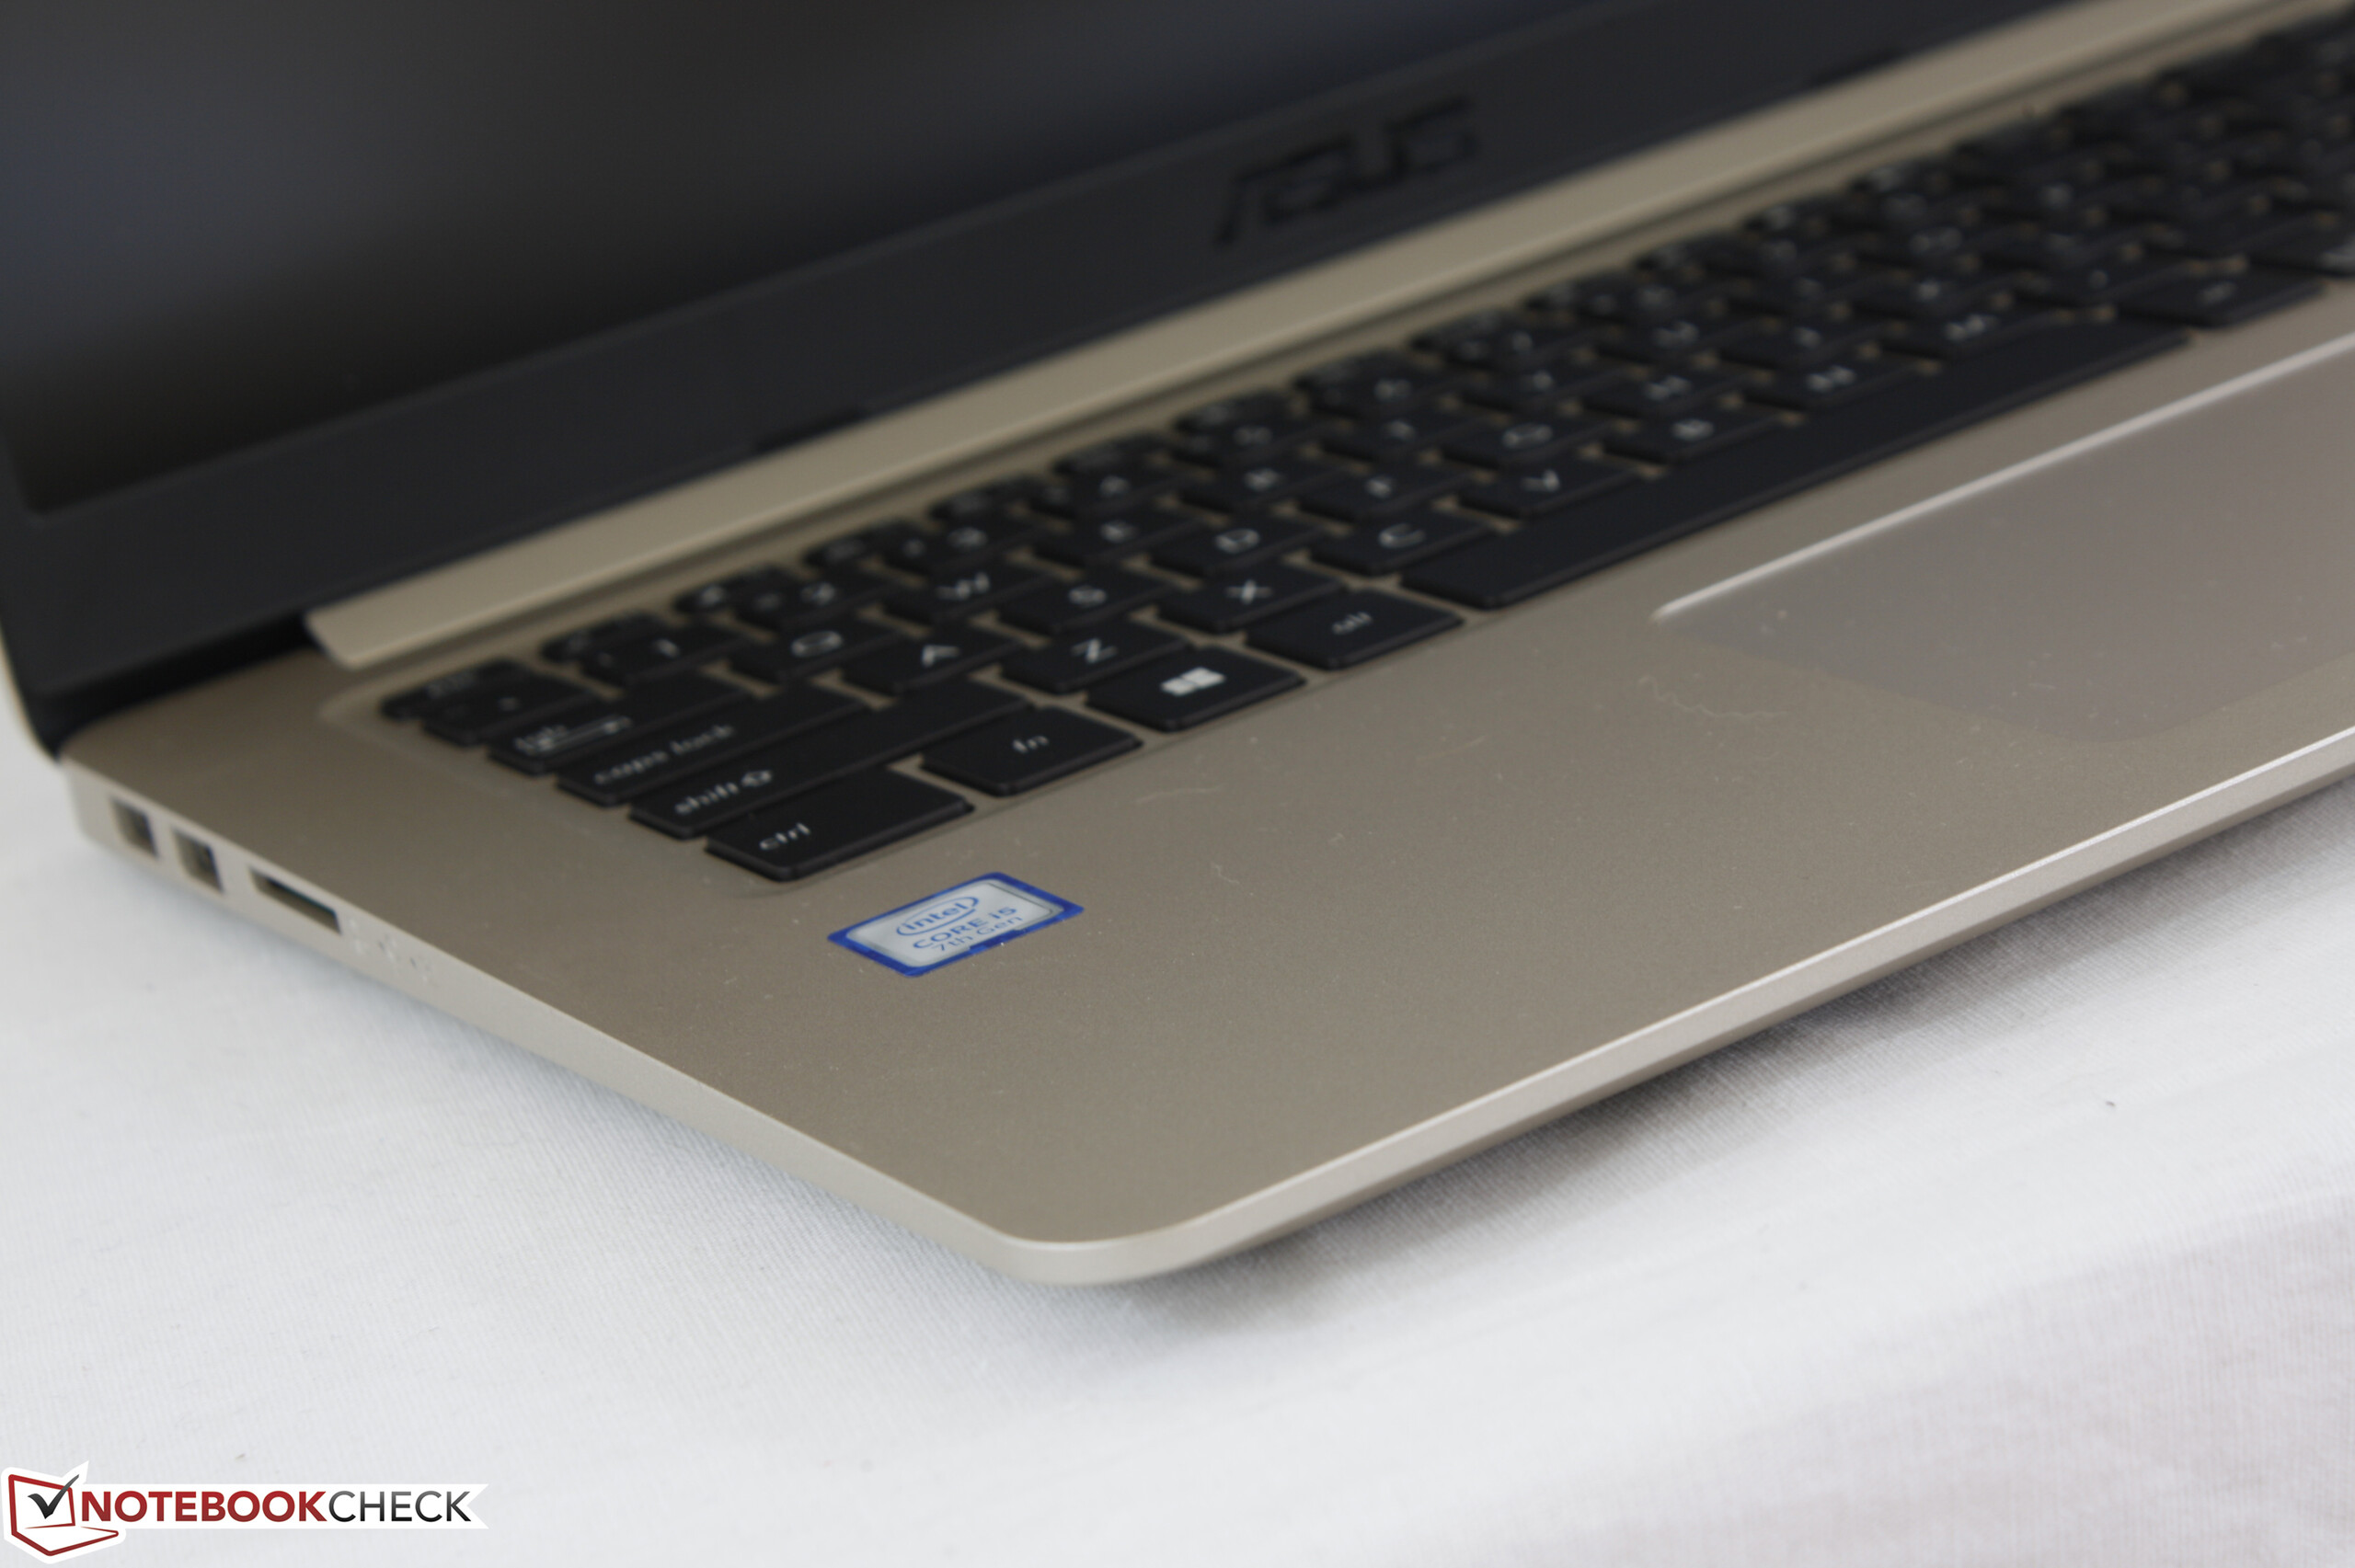
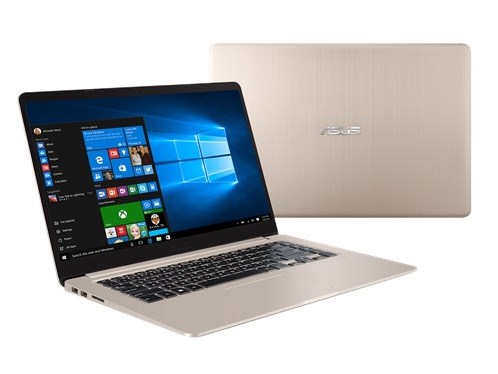
De VivoBook S510 is bedoeld als goedkoper alternatief voor de ZenBook, XPS of Spectre serie, zonder daarbij mobiliteit op te geven. In feite is het een budget notebook in een superdunne behuizing. Asus is hierin geslaagd, aangezien de S510UA voor minder dan $1000 verkrijgbaar is en een kleinere voetafdruk heeft dan typische budget notebooks zoals de Pavilion, Inspiron of IdeaPad modellen. We zijn vooral te spreken over het hoogwaardige beeldscherm en de optimale CPU Turbo Boost prestaties. De relatief lage geluidsproductie van de ventilator is een ander sterk punt.
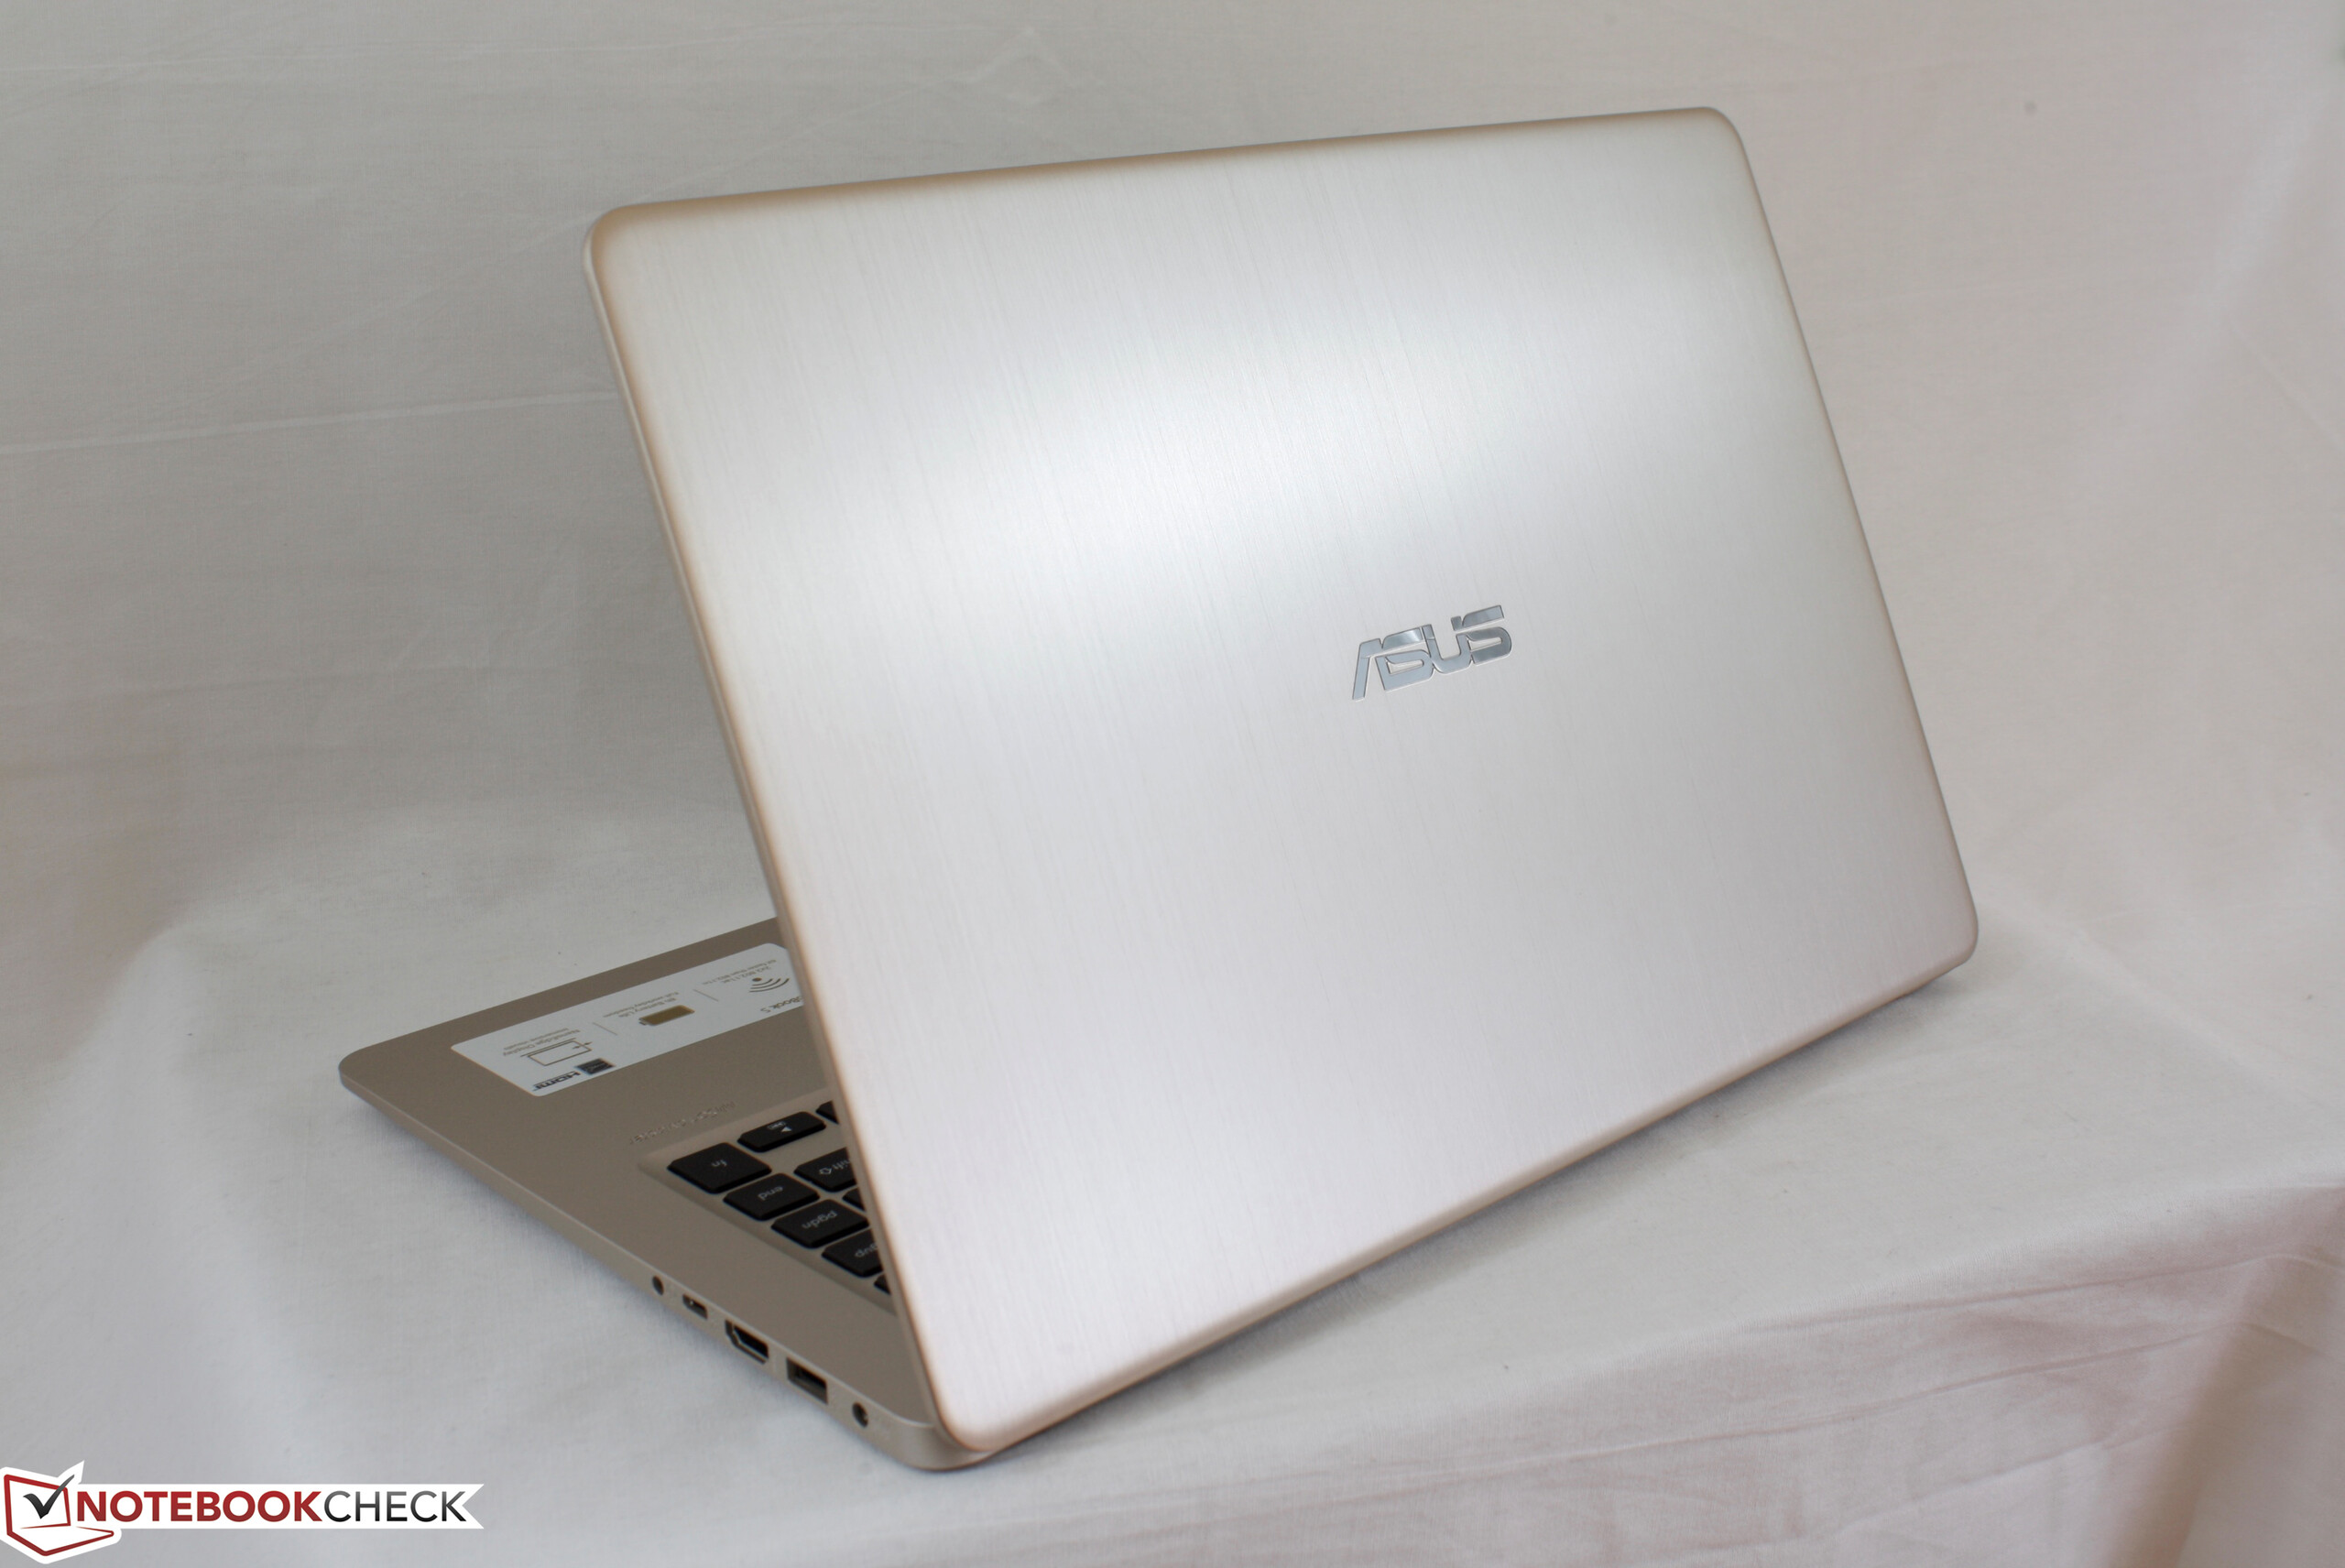
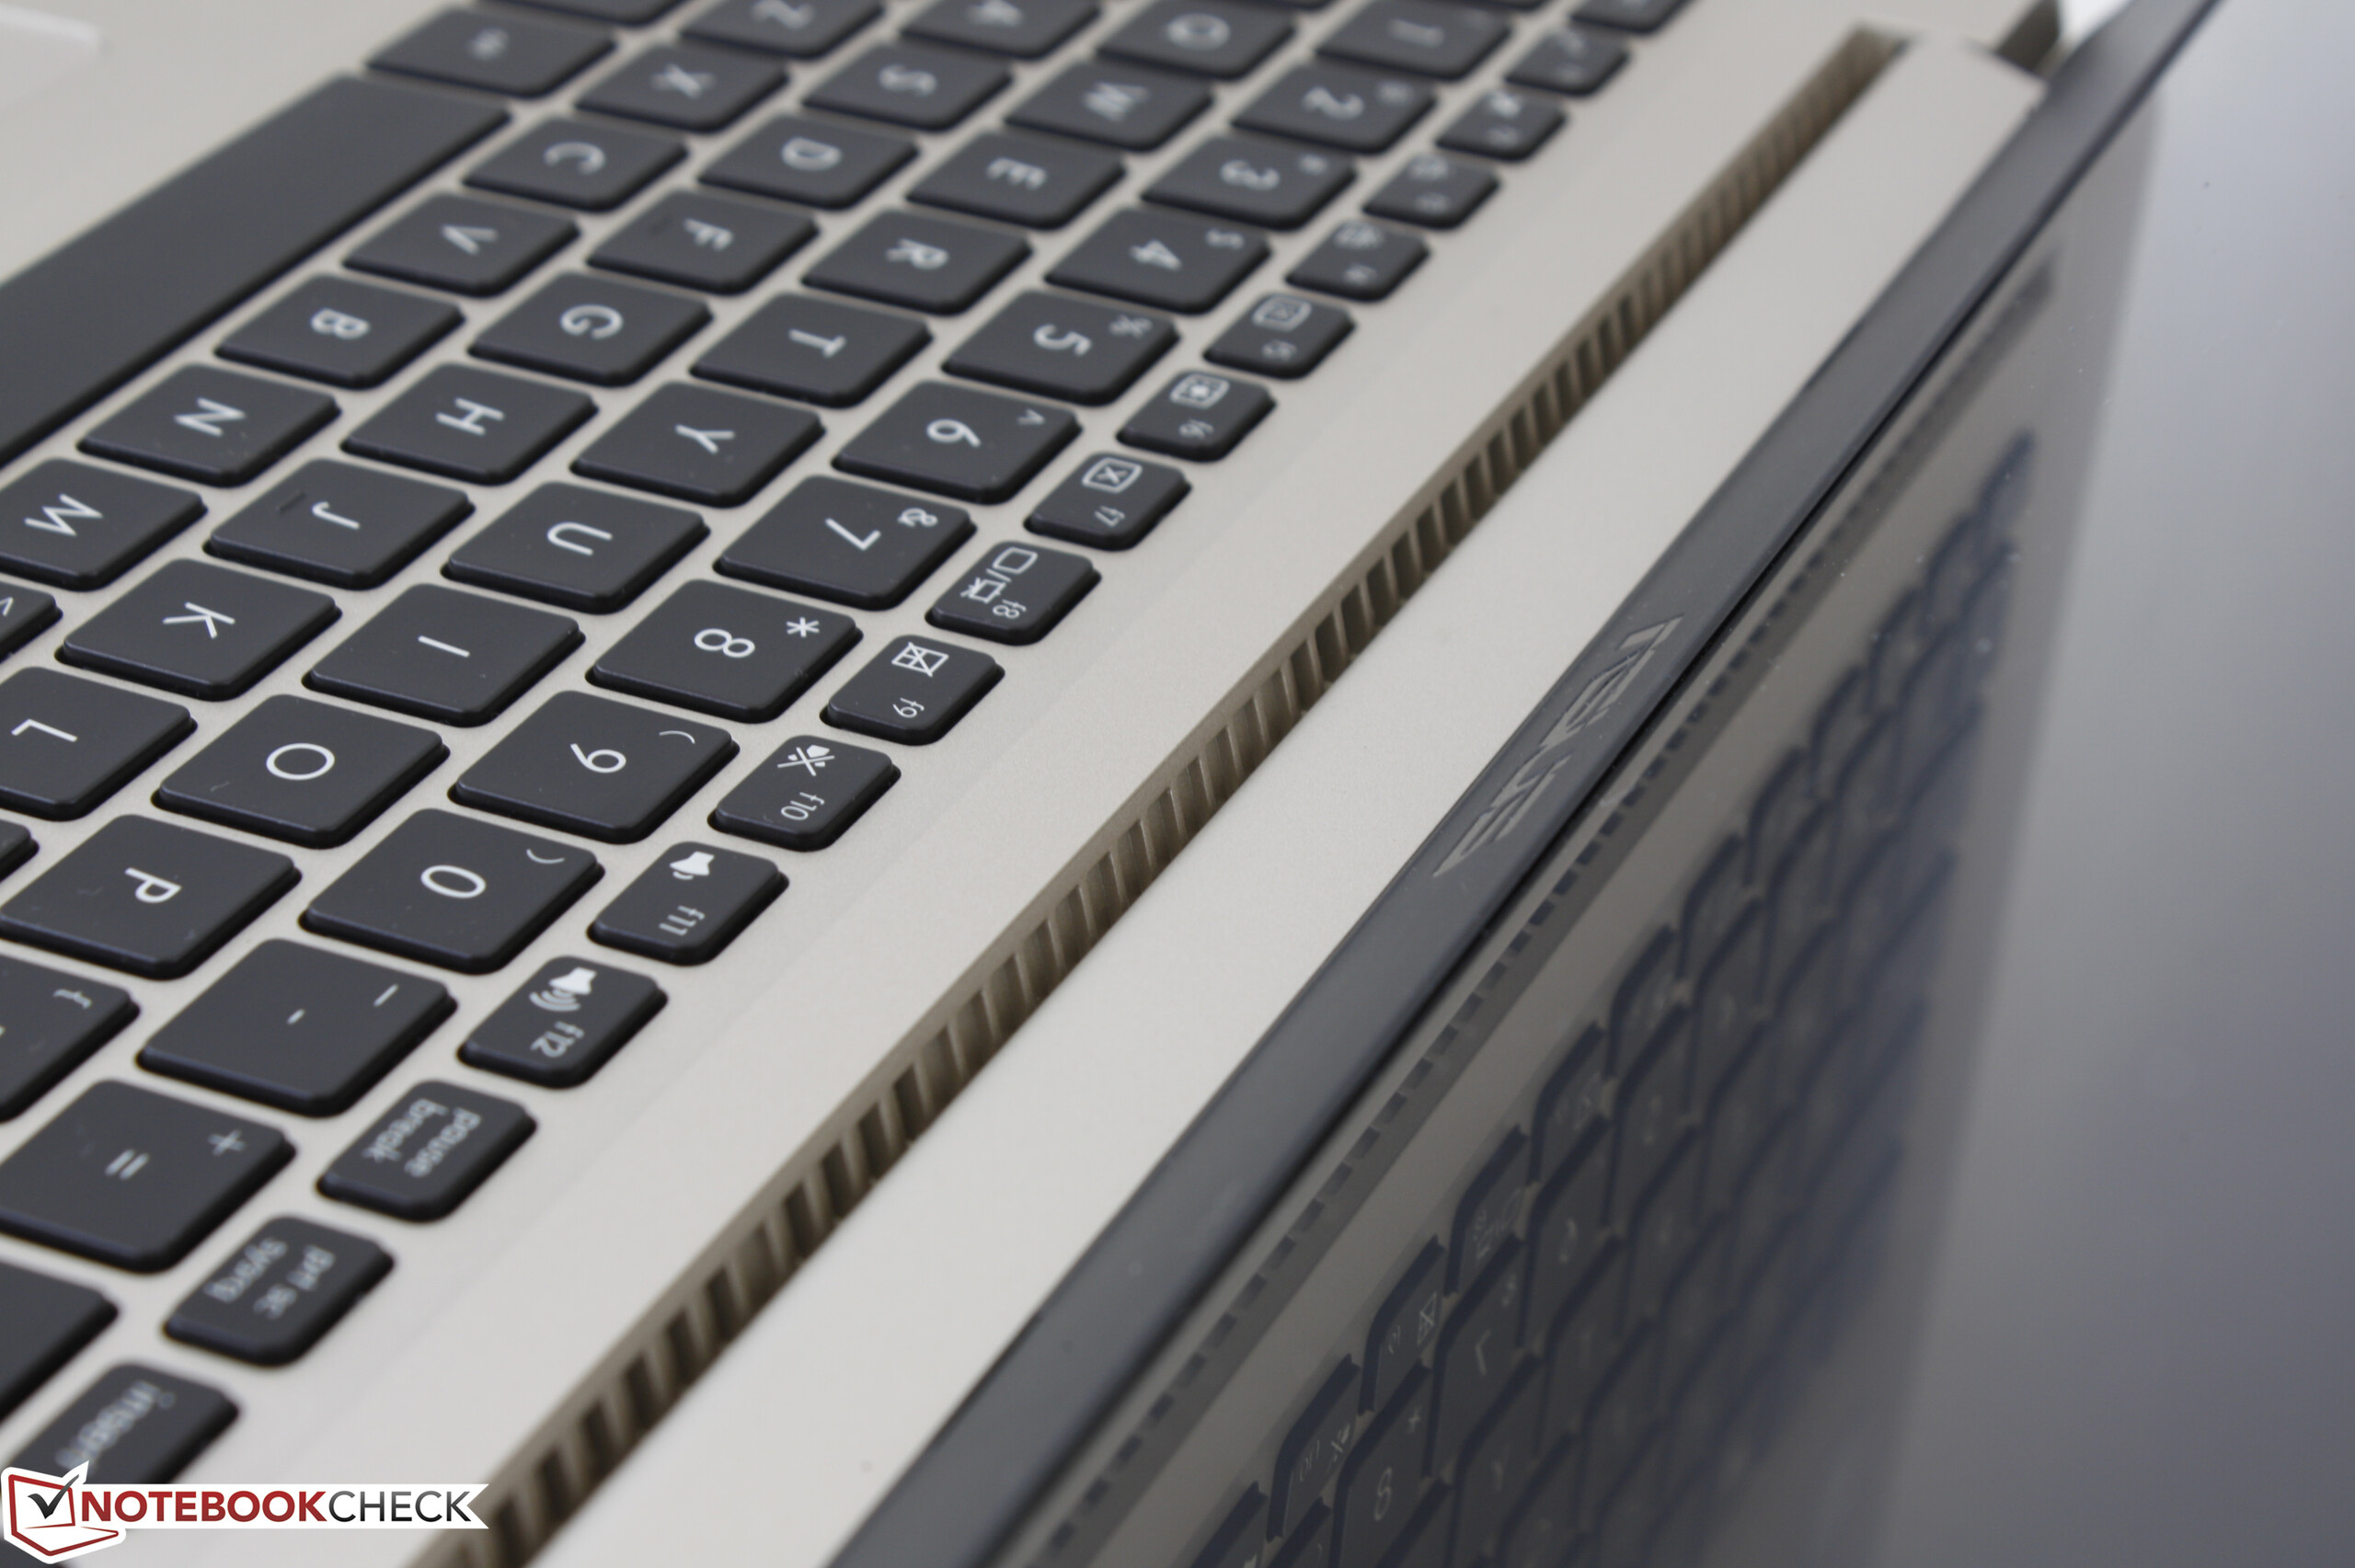
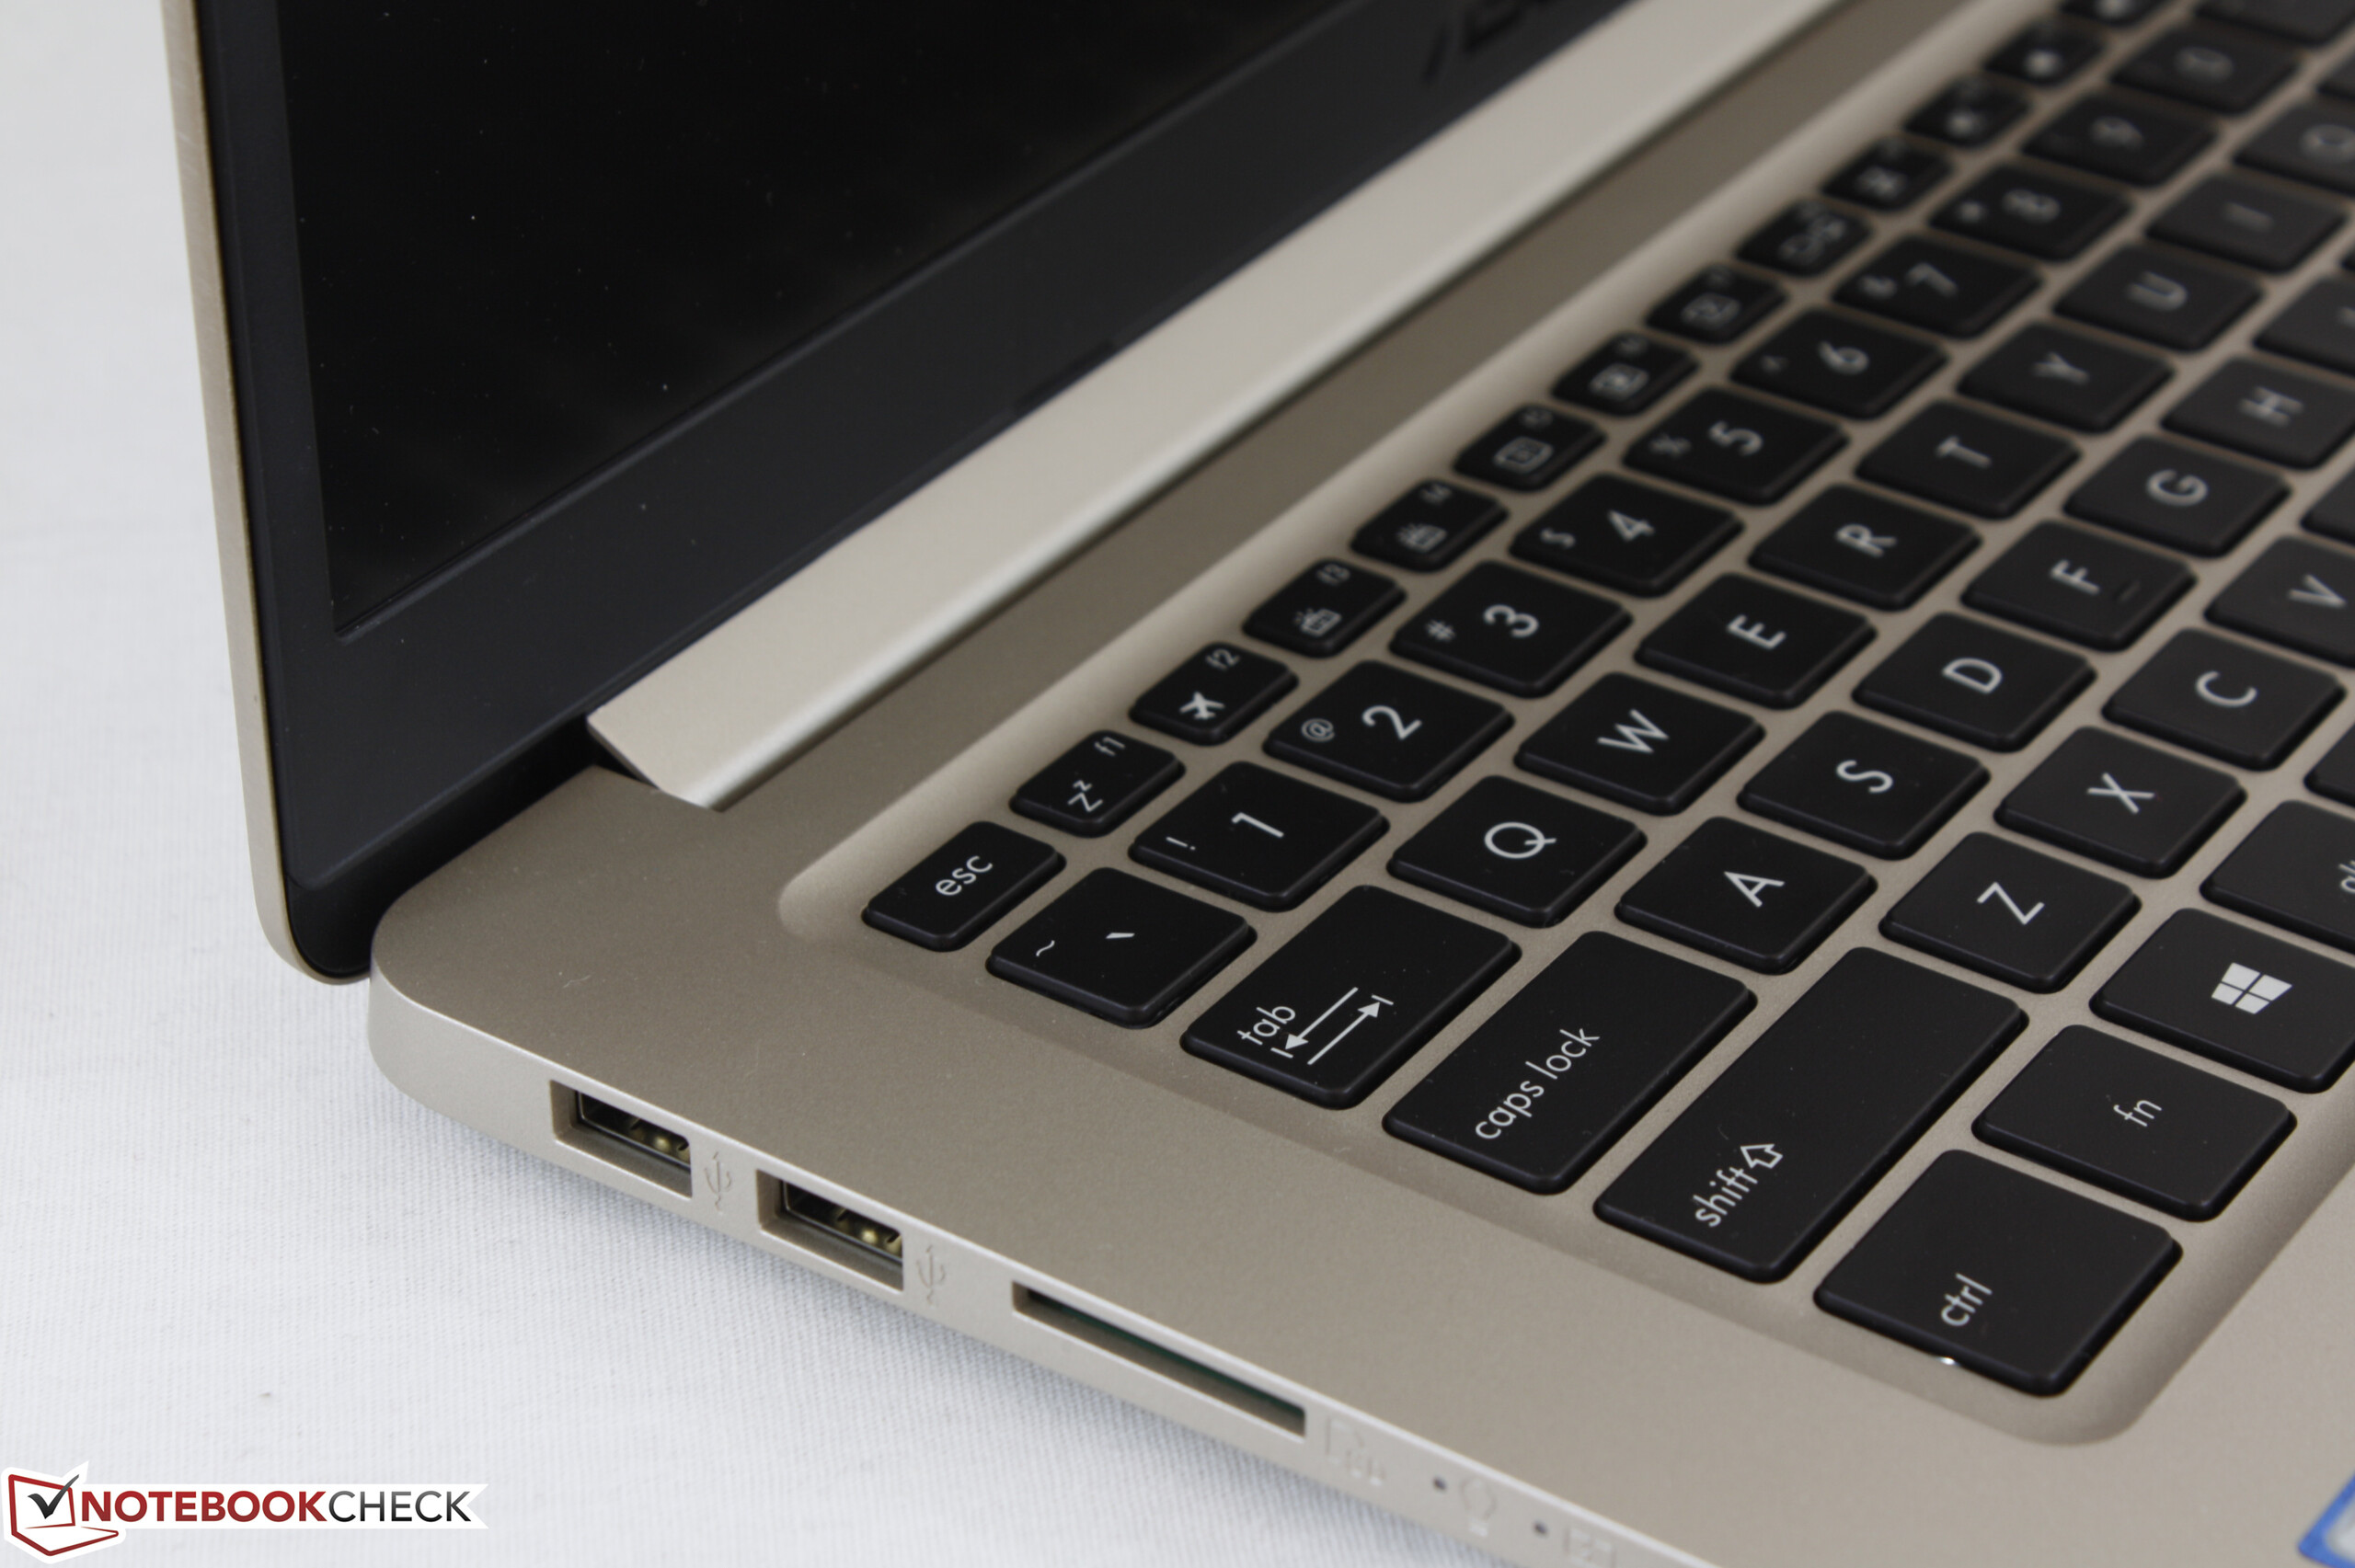
De S510UA laat echter (belangrijke) steken vallen. De behuizing is niet stevig en zowel het toetsenbord als het trackpad voelen zeer slap aan. De behuizing oogt misschien als een topmodel, maar komt daar in de praktijk niet bij in de buurt. De batterijlevensduur is nogal kort en de oppervlakkige deuk rondom de processor duidt ook op een economisch ontwerp. Hopelijk zijn deze vreemde gebreken bij ons testmodel niet representatief voor de gehele VivoBook S15 serie. In de toekomst zullen we andere SKU modellen testen voor een beter perspectief.
We geven de VivoBook S15 S510 zeker de voorkeur boven een oudere HP Pavilion 15 of Asus F serie als betaalbaarheid en draagbaarheid van uiterst belang zijn. Anderzijds zouden potentiële kopers ongeveer $200 - $300 meer moeten investeren in een ZenBook, XPS of Spectre SKU voor een ongekend betere ervaring.
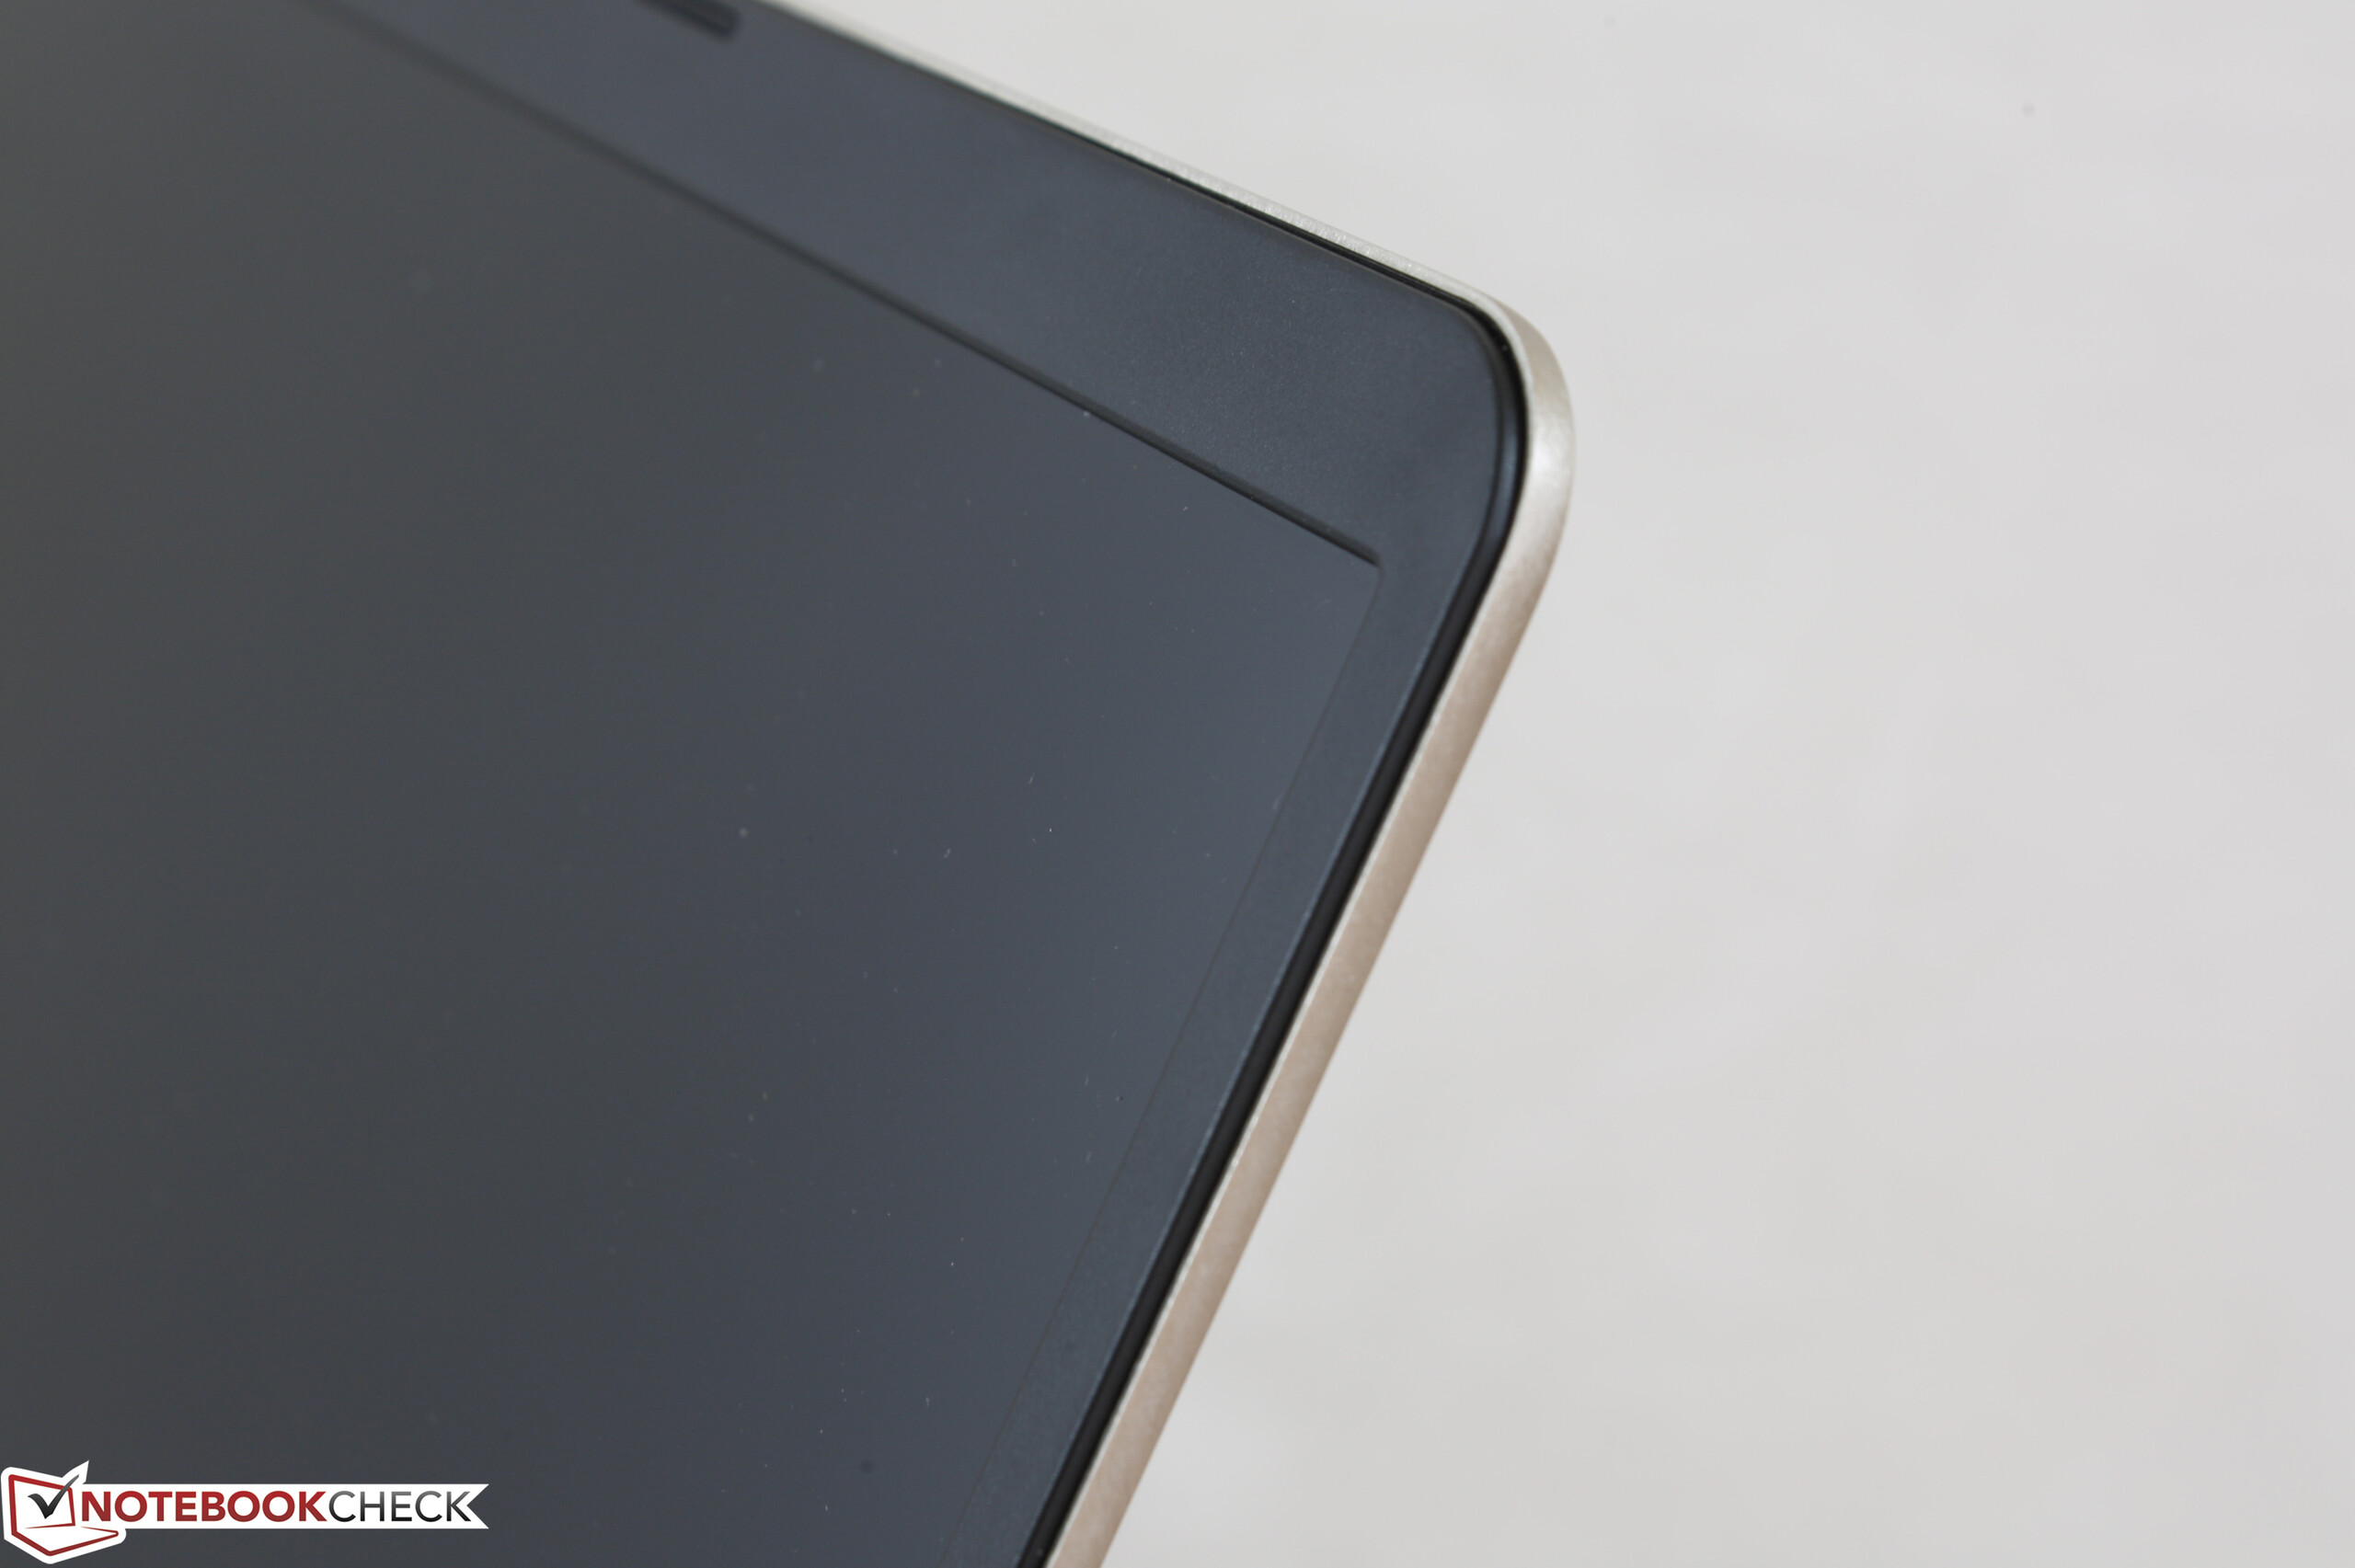
De lichtgewicht S510UA oogt sluik, presteert goed en bevat een respectabel 1080p IPS mat beeldscherm. Het slappe toetsenbord, de ondermaatse looptijden en vreemde hardware gerelateerde gebreken weerhouden ons echter van een volledige, overtuigende aanbeveling.
Asus VivoBook S15 S510UA
-
11-06-2017 v6(old)
Allen Ngo
Pricecompare
