 Deutsch
 English
 Español
 Français
 Italiano
 Nederlands
 Polski
 Português
 Русский
 Türkçe
 Svenska
 Chinese
 Magyar
Kort testrapport Asus VivoBook S14 S410UQ (i7-8550U, 940MX, Full HD) Laptop
| SD Card Reader | |
| average JPG Copy Test (av. of 3 runs) | |
| Dell XPS 13 9370 i5 UHD (Toshiba Exceria Pro M501 64 GB UHS-II) | |
| Gemiddelde van klas Multimedia (17.6 - 205, n=65, laatste 2 jaar) | |
| Dell Latitude 7480 (Toshiba (Exceria Pro SDXC UHS-II 64 GB) | |
| Asus ZenBook 13 UX331UN (Toshiba Exceria Pro M501) | |
| Lenovo IdeaPad 320s-14IKB (Toshiba Exceria Pro SDXC 64 GB UHS-II) | |
| Asus VivoBook S410UQ-NH74 (Toshiba Exceria Pro SDXC 64 GB UHS-II) | |
| Acer Swift 3 SF314-52G-89SL (Toshiba Exceria Pro SDXC 64 GB UHS-II) | |
| maximum AS SSD Seq Read Test (1GB) | |
| Dell XPS 13 9370 i5 UHD (Toshiba Exceria Pro M501 64 GB UHS-II) | |
| Gemiddelde van klas Multimedia (16.8 - 266, n=61, laatste 2 jaar) | |
| Dell Latitude 7480 (Toshiba (Exceria Pro SDXC UHS-II 64 GB) | |
| Lenovo IdeaPad 320s-14IKB (Toshiba Exceria Pro SDXC 64 GB UHS-II) | |
| Asus ZenBook 13 UX331UN (Toshiba Exceria Pro M501) | |
| Asus VivoBook S410UQ-NH74 (Toshiba Exceria Pro SDXC 64 GB UHS-II) | |
| Acer Swift 3 SF314-52G-89SL (Toshiba Exceria Pro SDXC 64 GB UHS-II) | |
| Networking | |
| iperf3 transmit AX12 | |
| Acer Swift 3 SF314-52G-89SL | |
| HP Spectre 13-af033ng | |
| Gemiddelde van klas Multimedia (285 - 998, n=2, laatste 2 jaar) | |
| Asus VivoBook S410UQ-NH74 | |
| Dell XPS 13 9370 i5 UHD | |
| Lenovo IdeaPad 320s-14IKB | |
| Asus VivoBook S14 S406UA-BV023T | |
| iperf3 receive AX12 | |
| Gemiddelde van klas Multimedia (1017 - 1675, n=2, laatste 2 jaar) | |
| Dell XPS 13 9370 i5 UHD | |
| Asus VivoBook S410UQ-NH74 | |
| HP Spectre 13-af033ng | |
| Asus VivoBook S14 S406UA-BV023T | |
| Lenovo IdeaPad 320s-14IKB | |
| Acer Swift 3 SF314-52G-89SL | |
| |||||||||||||||||||||||||
Helderheidsverdeling: 84 %
Helderheid in Batterij-modus: 253.9 cd/m²
Contrast: 819:1 (Zwart: 0.31 cd/m²)
ΔE Color 6.03 | 0.5-29.43 Ø5, calibrated: 4.52
ΔE Greyscale 5.9 | 0.57-98 Ø5.3
56.59% sRGB (Calman 2D)
56.59% sRGB (Argyll 1.6.3 3D)
39.3% AdobeRGB 1998 (Argyll 1.6.3 3D)
39.3% AdobeRGB 1998 (Argyll 2.2.0 3D)
56.6% sRGB (Argyll 2.2.0 3D)
38.04% Display P3 (Argyll 2.2.0 3D)
Gamma: 2.25
| Asus VivoBook S410UQ-NH74 AUO B140HAN04.2, IPS, 14.00, 1920x1080 | Asus Zenbook UX3410UQ-GV077T Chi Mei N140HCE-EN1, IPS, 14.00, 1920x1080 | Acer Swift 3 SF314-52G-89SL AU Optronics B140HAN02.1, IPS, 14.00, 1920x1080 | Lenovo IdeaPad 320s-14IKB BOE CQ NV140FHM-N49, IPS, 14.00, 1920x1080 | Dell XPS 13 9370 i5 UHD ID: Sharp SHP148B, Name: LQ133D1, Dell P/N: 8XDHY, IPS, 13.30, 3840x2160 | Asus VivoBook S14 S406UA-BV023T BOE CQ NT140WHM-N44, TN LED, 14.00, 1366x768 | |
|---|---|---|---|---|---|---|
| Display | 76% | -5% | 3% | 77% | 2% | |
| Display P3 Coverage | 38.04 | 67.2 77% | 36.09 -5% | 39.26 3% | 68.9 81% | 38.82 2% |
| sRGB Coverage | 56.6 | 99.2 75% | 54.2 -4% | 57.6 2% | 98.4 74% | 58.2 3% |
| AdobeRGB 1998 Coverage | 39.3 | 69.3 76% | 37.28 -5% | 40.56 3% | 69.5 77% | 40.11 2% |
| Response Times | -10% | 1% | -12% | -63% | 22% | |
| Response Time Grey 50% / Grey 80% * | 38.8 ? | 44 ? -13% | 41 ? -6% | 44 ? -13% | 67.2 ? -73% | 42 ? -8% |
| Response Time Black / White * | 27.2 ? | 29 ? -7% | 25 ? 8% | 30 ? -10% | 41.6 ? -53% | 13 ? 52% |
| PWM Frequency | 60 ? | 357 ? | 2500 ? | 200 ? | ||
| Screen | 42% | 6% | 19% | 45% | -20% | |
| Brightness middle | 253.9 | 381 50% | 233 -8% | 245 -4% | 496.4 96% | 215 -15% |
| Brightness | 239 | 368 54% | 217 -9% | 235 -2% | 469 96% | 208 -13% |
| Brightness Distribution | 84 | 84 0% | 88 5% | 71 -15% | 84 0% | 81 -4% |
| Black Level * | 0.31 | 0.3 3% | 0.27 13% | 0.21 32% | 0.5 -61% | 0.4 -29% |
| Contrast | 819 | 1270 55% | 863 5% | 1167 42% | 993 21% | 538 -34% |
| Colorchecker dE 2000 * | 6.03 | 2.84 53% | 5.85 3% | 4.85 20% | 2.9 52% | 9.37 -55% |
| Colorchecker dE 2000 max. * | 24.7 | 6.5 74% | 11.51 53% | 8.99 64% | 5.26 79% | 15.84 36% |
| Colorchecker dE 2000 calibrated * | 4.52 | |||||
| Greyscale dE 2000 * | 5.9 | 4.02 32% | 4.87 17% | 2.64 55% | 3.9 34% | 10.52 -78% |
| Gamma | 2.25 98% | 2.42 91% | 2.47 89% | 2.18 101% | 2.066 106% | 2.45 90% |
| CCT | 5814 112% | 7430 87% | 6908 94% | 6161 106% | 7169 91% | 11214 58% |
| Color Space (Percent of AdobeRGB 1998) | 39.3 | 56 42% | 34 -13% | 37 -6% | 63.9 63% | 37 -6% |
| Color Space (Percent of sRGB) | 56.59 | 86 52% | 54 -5% | 57 1% | 98.2 74% | 58 2% |
| Totaal Gemiddelde (Programma / Instellingen) | 36% /
42% | 1% /
3% | 3% /
11% | 20% /
37% | 1% /
-10% |
* ... kleiner is beter
Responstijd Scherm
| ↔ Responstijd Zwart naar Wit | ||
|---|---|---|
| 27.2 ms ... stijging ↗ en daling ↘ gecombineerd | ↗ 14 ms stijging | 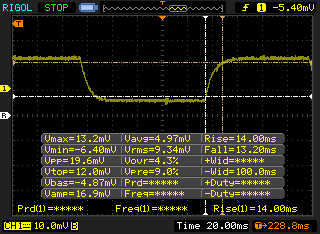 |
| ↘ 13.2 ms daling | ||
| Het scherm vertoonde relatief trage responstijden in onze tests en is misschien te traag voor games. Ter vergelijking: alle testtoestellen variëren van 0.1 (minimum) tot 240 (maximum) ms. » 65 % van alle toestellen zijn beter. Dit betekent dat de gemeten responstijd slechter is dan het gemiddelde (21.5 ms) van alle geteste toestellen. | ||
| ↔ Responstijd 50% Grijs naar 80% Grijs | ||
| 38.8 ms ... stijging ↗ en daling ↘ gecombineerd | ↗ 20 ms stijging | 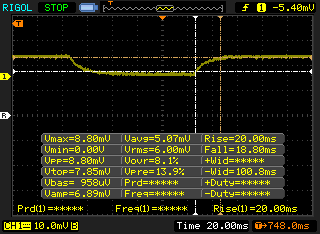 |
| ↘ 18.8 ms daling | ||
| Het scherm vertoonde trage responstijden in onze tests en is misschien te traag voor games. Ter vergelijking: alle testtoestellen variëren van 0.2 (minimum) tot 636 (maximum) ms. » 53 % van alle toestellen zijn beter. Dit betekent dat de gemeten responstijd slechter is dan het gemiddelde (33.7 ms) van alle geteste toestellen. | ||
Screen Flickering / PWM (Pulse-Width Modulation)
| Screen flickering / PWM niet waargenomen | 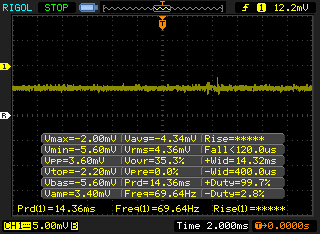 | ||
Ter vergelijking: 53 % van alle geteste toestellen maakten geen gebruik van PWM om de schermhelderheid te verlagen. Als het wel werd gebruikt, werd een gemiddelde van 17924 (minimum: 5 - maximum: 3846000) Hz waargenomen. | |||
| wPrime 2.10 - 1024m | |
| Gemiddelde van klas Multimedia (103.6 - 1259, n=2, laatste 2 jaar) | |
| Dell Latitude 7480 | |
| Asus VivoBook S410UQ-NH74 | |
| Gemiddeld Intel Core i7-8550U (258 - 435, n=11) | |
| Dell XPS 13 9370 i5 UHD | |
* ... kleiner is beter
| PCMark 8 | |
| Home Score Accelerated v2 | |
| Gemiddelde van klas Multimedia (4484 - 5583, n=10, laatste 2 jaar) | |
| Dell Latitude 7480 | |
| Acer Swift 3 SF314-52G-89SL | |
| Asus VivoBook S14 S406UA-BV023T | |
| Asus Zenbook UX3410UQ-GV077T | |
| Asus ZenBook 13 UX331UN | |
| Gemiddeld Intel Core i7-8550U, NVIDIA GeForce 940MX (3778 - 3906, n=3) | |
| Asus VivoBook S410UQ-NH74 | |
| HP Spectre 13-af033ng | |
| Lenovo IdeaPad 320s-14IKB | |
| Work Score Accelerated v2 | |
| Asus VivoBook S14 S406UA-BV023T | |
| Gemiddelde van klas Multimedia (3115 - 6078, n=10, laatste 2 jaar) | |
| Asus VivoBook S410UQ-NH74 | |
| Dell Latitude 7480 | |
| Asus ZenBook 13 UX331UN | |
| Gemiddeld Intel Core i7-8550U, NVIDIA GeForce 940MX (4987 - 5054, n=3) | |
| HP Spectre 13-af033ng | |
| Lenovo IdeaPad 320s-14IKB | |
| Creative Score Accelerated v2 | |
| HP Spectre 13-af033ng | |
| Dell Latitude 7480 | |
| Asus VivoBook S14 S406UA-BV023T | |
| Asus VivoBook S410UQ-NH74 | |
| Gemiddeld Intel Core i7-8550U, NVIDIA GeForce 940MX () | |
| Lenovo IdeaPad 320s-14IKB | |
| PCMark 8 Home Score Accelerated v2 | 3792 punten | |
| PCMark 8 Creative Score Accelerated v2 | 4871 punten | |
| PCMark 8 Work Score Accelerated v2 | 5054 punten | |
| PCMark 10 Score | 3433 punten | |
Help | ||
| Asus VivoBook S410UQ-NH74 Micron 1100 MTFDDAV256TBN | Acer Swift 3 SF314-52G-89SL Intel SSD 600p SSDPEKKW512G7 | Lenovo IdeaPad 320s-14IKB Liteonit CV3-DE256 | HP Spectre 13-af033ng Samsung PM961 NVMe MZVLW512HMJP | Asus Zenbook UX3410UQ-GV077T SanDisk SD8SNAT256G1002 | Dell Latitude 7480 Intel SSDSCKKF256H6 | Gemiddeld Micron 1100 MTFDDAV256TBN | |
|---|---|---|---|---|---|---|---|
| CrystalDiskMark 3.0 | 56% | -5% | 88% | -15% | 3% | -8% | |
| Write 4k QD32 | 295.6 | 496.2 68% | 238.7 -19% | 476 61% | 257.2 -13% | 252.8 -14% | 233 ? -21% |
| Read 4k QD32 | 248 | 462.6 87% | 334.8 35% | 543 119% | 147 -41% | 280.2 13% | 227 ? -8% |
| Write 4k | 101.9 | 133.6 31% | 61.6 -40% | 144 41% | 79.5 -22% | 90.5 -11% | 80.8 ? -21% |
| Read 4k | 28.01 | 13.98 -50% | 25.9 -8% | 60 114% | 22.78 -19% | 29.25 4% | 24.6 ? -12% |
| Write 512 | 352.3 | 483.3 37% | 258 -27% | 546 55% | 288 -18% | 306.8 -13% | 315 ? -11% |
| Read 512 | 259.4 | 616 137% | 272.8 5% | 515 99% | 289 11% | 354.3 37% | 315 ? 21% |
| Write Seq | 389.2 | 552 42% | 417.8 7% | 878 126% | 323.7 -17% | 418.6 8% | 379 ? -3% |
| Read Seq | 490.2 | 944 93% | 511 4% | 907 85% | 497 1% | 486.5 -1% | 465 ? -5% |

| 3DMark | |
| 1280x720 Cloud Gate Standard Graphics | |
| Gemiddelde van klas Multimedia (14679 - 150699, n=60, laatste 2 jaar) | |
| Asus ZenBook 13 UX331UN | |
| Acer Swift 3 SF315-41-R4W1 | |
| Gemiddeld NVIDIA GeForce 940MX (8165 - 14485, n=37) | |
| Asus VivoBook S410UQ-NH74 | |
| Lenovo IdeaPad 320s-14IKB | |
| Asus VivoBook S14 S406UA-BV023T | |
| Dell XPS 13 9370 i5 UHD | |
| HP Spectre 13-af033ng | |
| Dell Latitude 7480 | |
| 1920x1080 Fire Strike Graphics | |
| Gemiddelde van klas Multimedia (1835 - 46022, n=88, laatste 2 jaar) | |
| Asus ZenBook 13 UX331UN | |
| Acer Swift 3 SF315-41-R4W1 | |
| Asus VivoBook S410UQ-NH74 | |
| Gemiddeld NVIDIA GeForce 940MX (1540 - 2403, n=37) | |
| Lenovo IdeaPad 320s-14IKB | |
| Dell XPS 13 9370 i5 UHD | |
| Asus VivoBook S14 S406UA-BV023T | |
| HP Spectre 13-af033ng | |
| Dell Latitude 7480 | |
| 1920x1080 Ice Storm Extreme Graphics | |
| Gemiddelde van klas Multimedia (66941 - 354020, n=7, laatste 2 jaar) | |
| Lenovo IdeaPad 320s-14IKB | |
| Dell Latitude 7480 | |
| Gemiddeld NVIDIA GeForce 940MX (26424 - 67037, n=16) | |
| Dell XPS 13 9370 i5 UHD | |
| 3DMark 11 Performance | 2844 punten | |
| 3DMark Ice Storm Standard Score | 43801 punten | |
| 3DMark Cloud Gate Standard Score | 9025 punten | |
| 3DMark Fire Strike Score | 1917 punten | |
| 3DMark Fire Strike Extreme Score | 940 punten | |
Help | ||
| Tomb Raider | |
| 1920x1080 Ultra Preset AA:FX AF:16x (sorteer op waarde) | |
| Asus VivoBook S410UQ-NH74 | |
| Dell Latitude 7480 | |
| Acer Swift 3 SF315-41-R4W1 | |
| Gemiddeld NVIDIA GeForce 940MX (18.3 - 29.4, n=7) | |
| 1366x768 High Preset AA:FX AF:8x (sorteer op waarde) | |
| Asus VivoBook S410UQ-NH74 | |
| Dell Latitude 7480 | |
| Acer Swift 3 SF315-41-R4W1 | |
| Gemiddeld NVIDIA GeForce 940MX (34.5 - 62.6, n=8) | |
| 1366x768 Normal Preset AA:FX AF:4x (sorteer op waarde) | |
| Asus VivoBook S410UQ-NH74 | |
| Dell Latitude 7480 | |
| Acer Swift 3 SF315-41-R4W1 | |
| Gemiddeld NVIDIA GeForce 940MX (58.6 - 96.4, n=7) | |
| 1024x768 Low Preset (sorteer op waarde) | |
| Asus VivoBook S410UQ-NH74 | |
| Dell Latitude 7480 | |
| Acer Swift 3 SF315-41-R4W1 | |
| Gemiddeld NVIDIA GeForce 940MX (132.9 - 184.4, n=7) | |
| Rise of the Tomb Raider | |
| 1920x1080 Very High Preset AA:FX AF:16x (sorteer op waarde) | |
| Asus VivoBook S410UQ-NH74 | |
| Gemiddeld NVIDIA GeForce 940MX (8.2 - 13.8, n=10) | |
| 1920x1080 High Preset AA:FX AF:4x (sorteer op waarde) | |
| Asus VivoBook S410UQ-NH74 | |
| HP Spectre 13-af033ng | |
| Acer Swift 3 SF315-41-R4W1 | |
| Gemiddeld NVIDIA GeForce 940MX (10.4 - 17, n=17) | |
| 1366x768 Medium Preset AF:2x (sorteer op waarde) | |
| Asus VivoBook S410UQ-NH74 | |
| HP Spectre 13-af033ng | |
| Gemiddeld NVIDIA GeForce 940MX (13.4 - 30.6, n=20) | |
| 1024x768 Lowest Preset (sorteer op waarde) | |
| Asus VivoBook S410UQ-NH74 | |
| HP Spectre 13-af033ng | |
| Acer Swift 3 SF315-41-R4W1 | |
| Gemiddeld NVIDIA GeForce 940MX (26.9 - 52.8, n=20) | |
| lage | gem. | hoge | ultra | |
| Tomb Raider (2013) | 157.9 | 77 | 48.1 | 23.7 |
| BioShock Infinite (2013) | 108.4 | 63.1 | 53.2 | 19.8 |
| The Witcher 3 (2015) | 23 | |||
| Rise of the Tomb Raider (2016) | 44.8 | 26.5 | 14.5 | 11.3 |
Geluidsniveau
| Onbelast |
| 28.3 / 28.3 / 29.8 dB (A) |
| Belasting |
| 39 / 42.6 dB (A) |
 | ||
30 dB stil 40 dB(A) hoorbaar 50 dB(A) luid |
||
min: | ||
| Asus VivoBook S410UQ-NH74 GeForce 940MX, i5-8550U, Micron 1100 MTFDDAV256TBN | Acer Swift 3 SF314-52G-89SL GeForce MX150, i5-8550U, Intel SSD 600p SSDPEKKW512G7 | Asus ZenBook 13 UX331UN GeForce MX150, i5-8550U, SanDisk SD8SN8U512G1002 | Lenovo IdeaPad 320s-14IKB GeForce 920MX, i5-7200U, Liteonit CV3-DE256 | Dell Latitude 7480 HD Graphics 620, i7-7600U, Intel SSDSCKKF256H6 | HP Spectre 13-af033ng UHD Graphics 620, i5-8550U, Samsung PM961 NVMe MZVLW512HMJP | Dell XPS 13 9370 i5 UHD UHD Graphics 620, i5-8250U, Toshiba XG5 KXG50ZNV256G | Asus VivoBook S14 S406UA-BV023T UHD Graphics 620, i5-8250U, SanDisk SD8SN8U256G1002 | Acer Swift 3 SF315-41-R4W1 Vega 8, R5 2500U, Intel SSD 600p SSDPEKKW256G7 | |
|---|---|---|---|---|---|---|---|---|---|
| Noise | 2% | -4% | -1% | 10% | 4% | 4% | -4% | -2% | |
| uit / omgeving * | 28.3 | 30.5 -8% | 29.6 -5% | 30.13 -6% | 30.13 -6% | 29 -2% | 30.2 -7% | 31.8 -12% | |
| Idle Minimum * | 28.3 | 30.5 -8% | 29.6 -5% | 30.8 -9% | 28.6 -1% | 30.13 -6% | 29 -2% | 30.2 -7% | 31.8 -12% |
| Idle Average * | 28.3 | 30.5 -8% | 29.6 -5% | 30.8 -9% | 28.6 -1% | 30.13 -6% | 29 -2% | 30.2 -7% | 32.1 -13% |
| Idle Maximum * | 29.8 | 30.9 -4% | 29.6 1% | 30.8 -3% | 28.6 4% | 30.13 -1% | 29 3% | 31.3 -5% | 32.1 -8% |
| Load Average * | 39 | 35.6 9% | 41.7 -7% | 35.5 9% | 30.2 23% | 31.5 19% | 32 18% | 40.1 -3% | 33 15% |
| Witcher 3 ultra * | 40.6 | 35.1 14% | 43.5 -7% | ||||||
| Load Maximum * | 42.6 | 35.6 16% | 43.5 -2% | 36.2 15% | 31.2 27% | 33.5 21% | 40.1 6% | 40.4 5% | 34.8 18% |
* ... kleiner is beter
(+) De maximumtemperatuur aan de bovenzijde bedraagt 39 °C / 102 F, vergeleken met het gemiddelde van 36.9 °C / 98 F, variërend van 21.1 tot 71 °C voor de klasse Multimedia.
(-) De bodem warmt op tot een maximum van 47 °C / 117 F, vergeleken met een gemiddelde van 39.1 °C / 102 F
(+) Bij onbelast gebruik bedraagt de gemiddelde temperatuur voor de bovenzijde 25.8 °C / 78 F, vergeleken met het apparaatgemiddelde van 31.2 °C / 88 F.
(+) Bij het spelen van The Witcher 3 is de gemiddelde temperatuur voor de bovenzijde 27.9 °C / 82 F, vergeleken met het apparaatgemiddelde van 31.2 °C / 88 F.
(+) De palmsteunen en het touchpad zijn met een maximum van ###max## °C / 85.3 F koeler dan de huidtemperatuur en voelen daarom koel aan.
(±) De gemiddelde temperatuur van de handpalmsteun van soortgelijke toestellen bedroeg 28.8 °C / 83.8 F (-0.8 °C / -1.5 F).
Asus VivoBook S410UQ-NH74 audioanalyse
(-) | niet erg luide luidsprekers (59.9 dB)
Bas 100 - 315 Hz
(-) | bijna geen lage tonen - gemiddeld 15.6% lager dan de mediaan
(±) | lineariteit van de lage tonen is gemiddeld (13.5% delta ten opzichte van de vorige frequentie)
Mids 400 - 2000 Hz
(±) | lagere middens - gemiddeld 5.2% lager dan de mediaan
(±) | lineariteit van de middentonen is gemiddeld (8.3% delta ten opzichte van de vorige frequentie)
Hoog 2 - 16 kHz
(+) | evenwichtige hoogtepunten - slechts 2.9% verwijderd van de mediaan
(±) | lineariteit van de hoogtepunten is gemiddeld (9.9% delta ten opzichte van de vorige frequentie)
Algemeen 100 - 16.000 Hz
(±) | lineariteit van het totale geluid is gemiddeld (26.3% verschil met de mediaan)
Vergeleken met dezelfde klasse
» 91% van alle geteste apparaten in deze klasse waren beter, 2% vergelijkbaar, 7% slechter
» De beste had een delta van 5%, het gemiddelde was 18%, de slechtste was 45%
Vergeleken met alle geteste toestellen
» 78% van alle geteste apparaten waren beter, 4% gelijk, 18% slechter
» De beste had een delta van 4%, het gemiddelde was 25%, de slechtste was 134%
Apple MacBook 12 (Early 2016) 1.1 GHz audioanalyse
(+) | luidsprekers kunnen relatief luid spelen (83.6 dB)
Bas 100 - 315 Hz
(±) | verminderde zeebaars - gemiddeld 11.3% lager dan de mediaan
(±) | lineariteit van de lage tonen is gemiddeld (14.2% delta ten opzichte van de vorige frequentie)
Mids 400 - 2000 Hz
(+) | evenwichtige middens - slechts 2.4% verwijderd van de mediaan
(+) | de middentonen zijn lineair (5.5% delta ten opzichte van de vorige frequentie)
Hoog 2 - 16 kHz
(+) | evenwichtige hoogtepunten - slechts 2% verwijderd van de mediaan
(+) | de hoge tonen zijn lineair (4.5% delta naar de vorige frequentie)
Algemeen 100 - 16.000 Hz
(+) | het totale geluid is lineair (10.2% verschil met de mediaan)
Vergeleken met dezelfde klasse
» 5% van alle geteste apparaten in deze klasse waren beter, 2% vergelijkbaar, 93% slechter
» De beste had een delta van 5%, het gemiddelde was 19%, de slechtste was 53%
Vergeleken met alle geteste toestellen
» 3% van alle geteste apparaten waren beter, 1% gelijk, 96% slechter
» De beste had een delta van 4%, het gemiddelde was 25%, de slechtste was 134%
| Uit / Standby | |
| Inactief | |
| Belasting |
|
| Asus VivoBook S410UQ-NH74 i5-8550U, GeForce 940MX, Micron 1100 MTFDDAV256TBN, IPS, 1920x1080, 14.00 | Acer Swift 3 SF314-52G-89SL i5-8550U, GeForce MX150, Intel SSD 600p SSDPEKKW512G7, IPS, 1920x1080, 14.00 | Lenovo IdeaPad 320s-14IKB i5-7200U, GeForce 920MX, Liteonit CV3-DE256, IPS, 1920x1080, 14.00 | HP Spectre 13-af033ng i5-8550U, UHD Graphics 620, Samsung PM961 NVMe MZVLW512HMJP, IPS, 1920x1080, 13.30 | Dell XPS 13 9370 i5 UHD i5-8250U, UHD Graphics 620, Toshiba XG5 KXG50ZNV256G, IPS, 3840x2160, 13.30 | Asus VivoBook S14 S406UA-BV023T i5-8250U, UHD Graphics 620, SanDisk SD8SN8U256G1002, TN LED, 1366x768, 14.00 | Acer Swift 3 SF315-41-R4W1 R5 2500U, Vega 8, Intel SSD 600p SSDPEKKW256G7, IPS, 1920x1080, 15.60 | |
|---|---|---|---|---|---|---|---|
| Power Consumption | -14% | 12% | 7% | -14% | 9% | -47% | |
| Idle Minimum * | 3.5 | 4.4 -26% | 3.2 9% | 2.8 20% | 4.3 -23% | 3.7 -6% | 7.3 -109% |
| Idle Average * | 5.65 | 6.6 -17% | 5.9 -4% | 6.2 -10% | 8 -42% | 5.6 1% | 9.7 -72% |
| Idle Maximum * | 6.5 | 9.2 -42% | 6.7 -3% | 9.4 -45% | 8.1 -25% | 7.6 -17% | 13 -100% |
| Load Average * | 52.3 | 61 -17% | 36.7 30% | 32.2 38% | 46.6 11% | 37.4 28% | 40.4 23% |
| Witcher 3 ultra * | 46.2 | 40 13% | |||||
| Load Maximum * | 54.5 | 50 8% | 39 28% | 36.6 33% | 49.8 9% | 33 39% | 42.2 23% |
* ... kleiner is beter
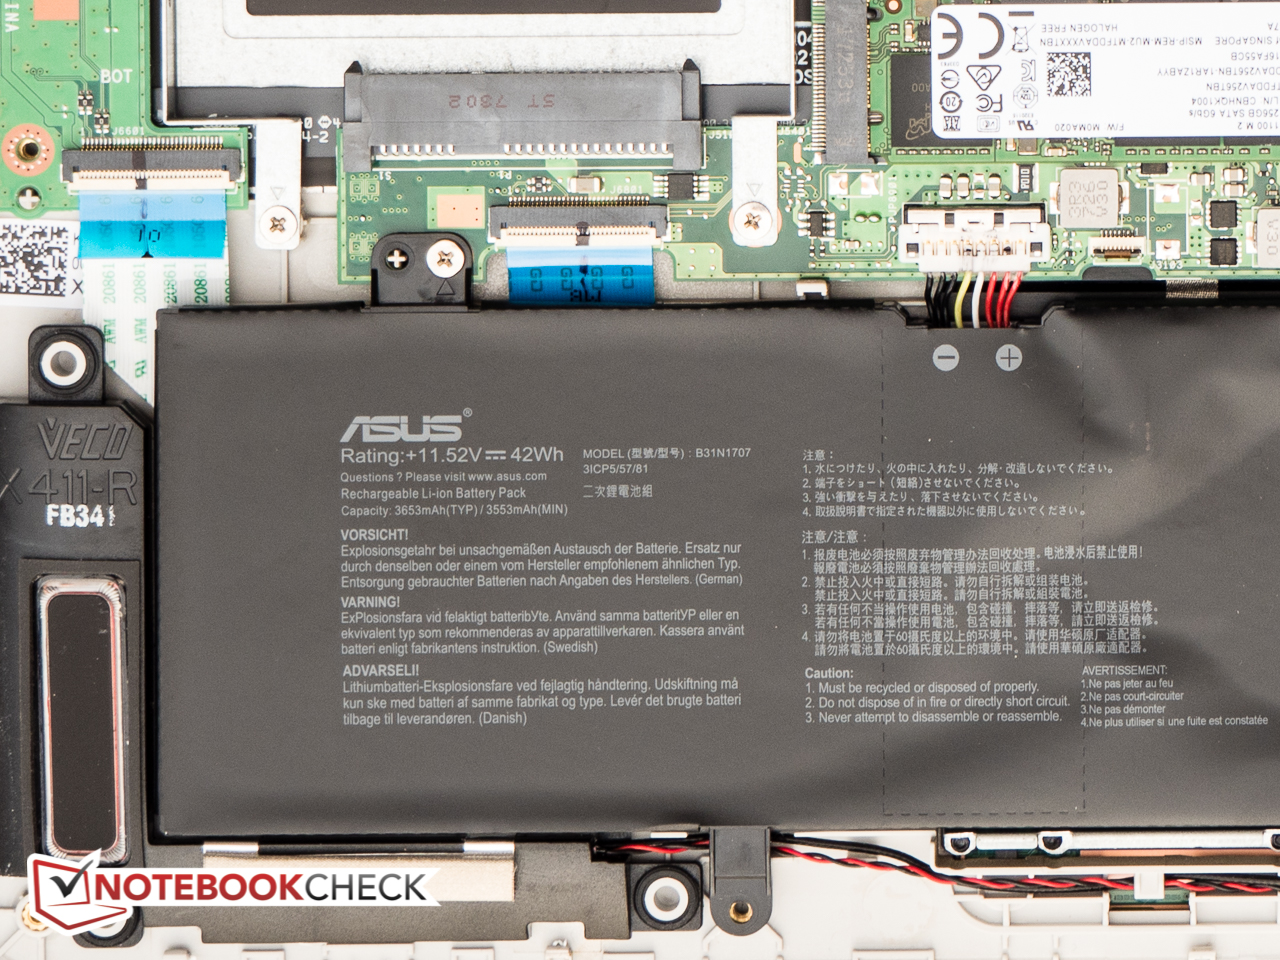
| Asus VivoBook S410UQ-NH74 i5-8550U, GeForce 940MX, 42 Wh | Acer Swift 3 SF314-52G-89SL i5-8550U, GeForce MX150, 48 Wh | Asus ZenBook 13 UX331UN i5-8550U, GeForce MX150, 50 Wh | Lenovo IdeaPad 320s-14IKB i5-7200U, GeForce 920MX, 52.5 Wh | Dell Latitude 7480 i7-7600U, HD Graphics 620, 60 Wh | HP Spectre 13-af033ng i5-8550U, UHD Graphics 620, 43 Wh | Dell XPS 13 9370 i5 UHD i5-8250U, UHD Graphics 620, 52 Wh | Asus VivoBook S14 S406UA-BV023T i5-8250U, UHD Graphics 620, 39 Wh | Acer Swift 3 SF315-41-R4W1 R5 2500U, Vega 8, 48 Wh | |
|---|---|---|---|---|---|---|---|---|---|
| Batterijduur | -5% | 36% | 9% | 85% | -8% | 5% | -2% | -17% | |
| Reader / Idle | 749 | 1321 76% | 1662 122% | 869 16% | 730 -3% | ||||
| WiFi v1.3 | 487 | 465 -5% | 504 3% | 530 9% | 719 48% | 352 -28% | 408 -16% | 476 -2% | 310 -36% |
| Load | 93 | 120 29% | 171 84% | 104 12% | 106 14% | 81 -13% |
Pro
Contra

Dit is de verkorte versie van het originele artikel. Het volledige, Engelse testrapport vind je hier.
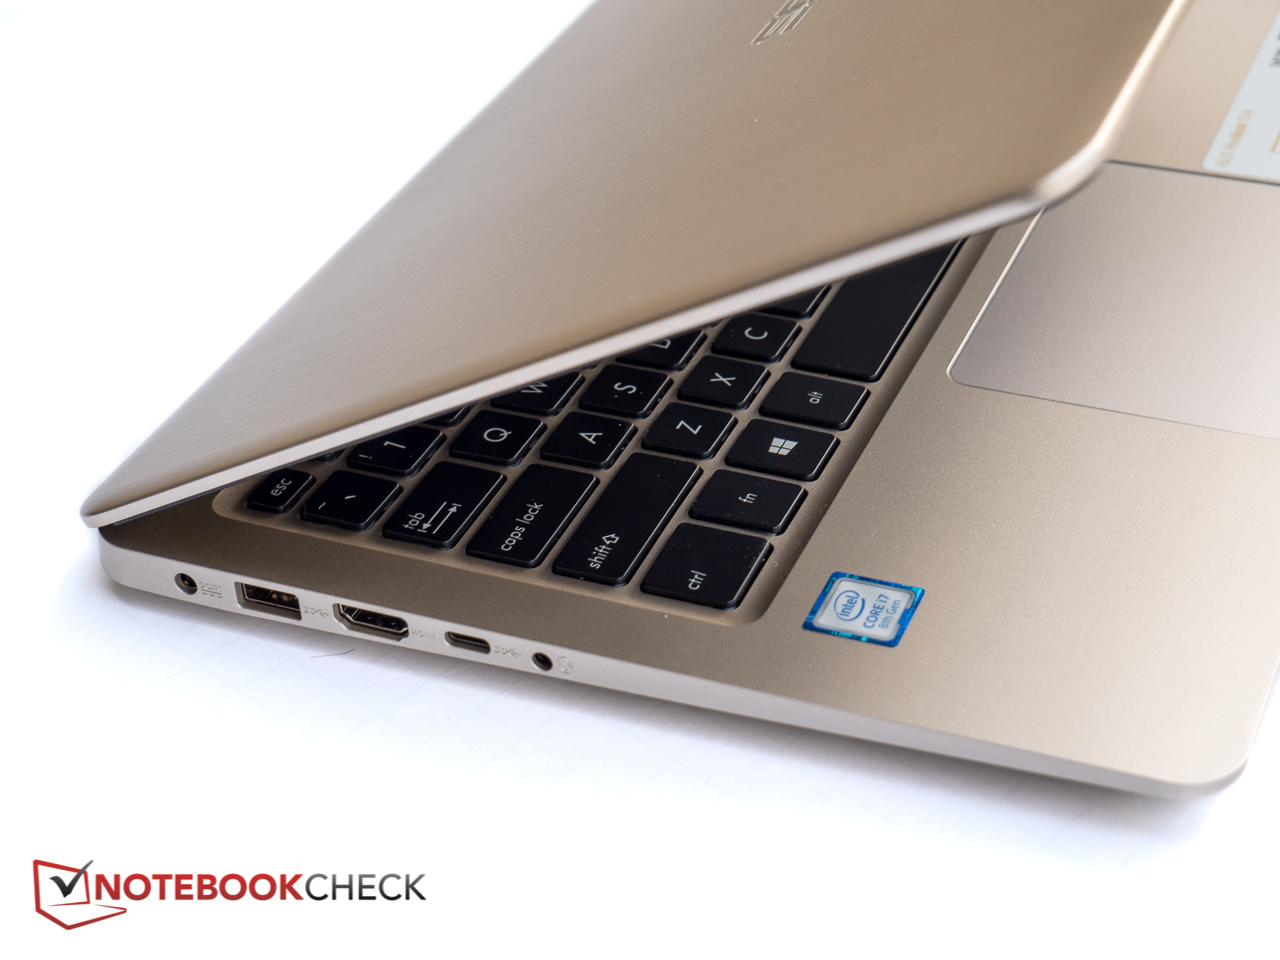
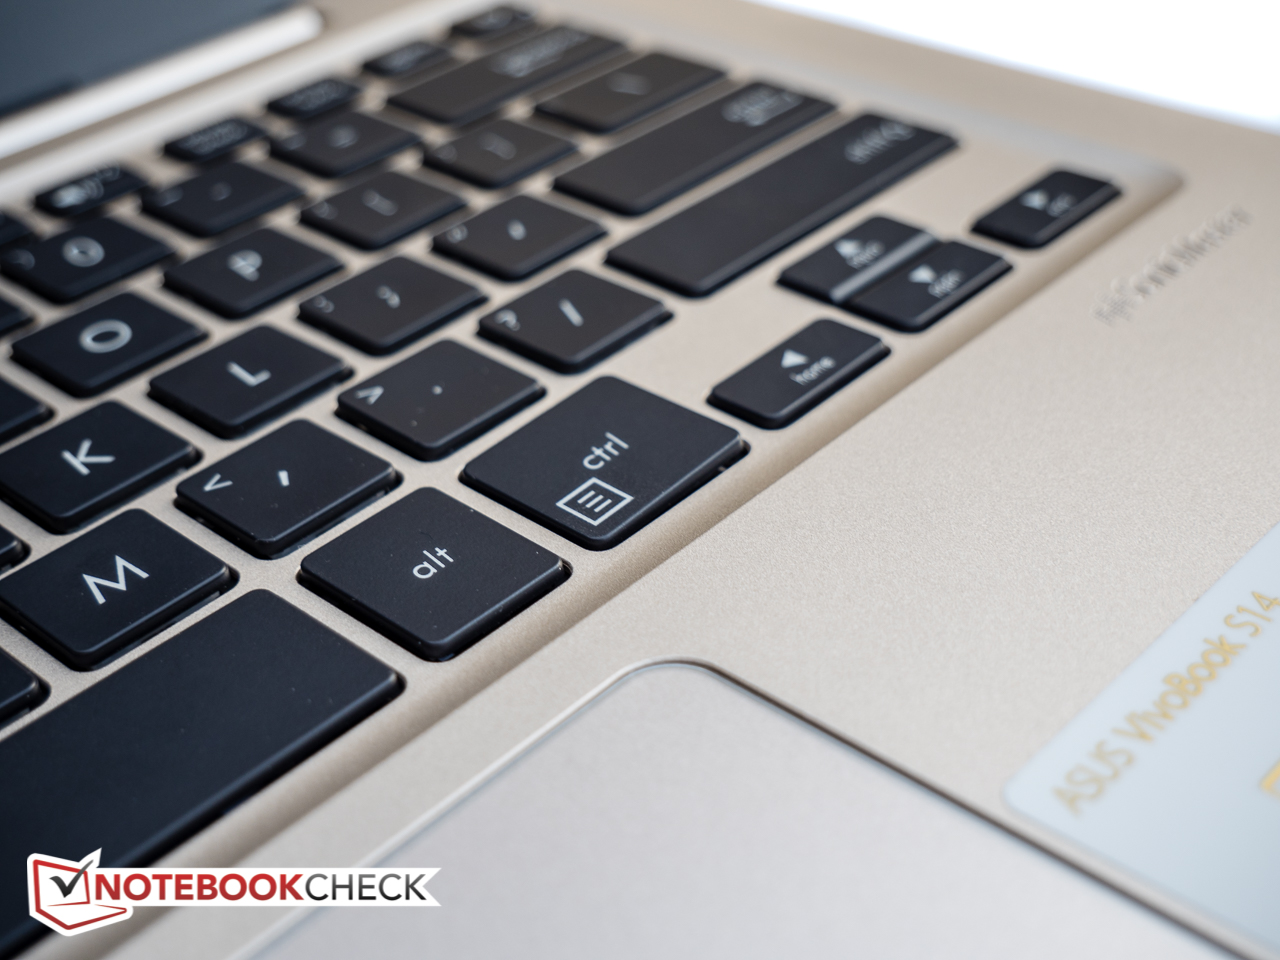
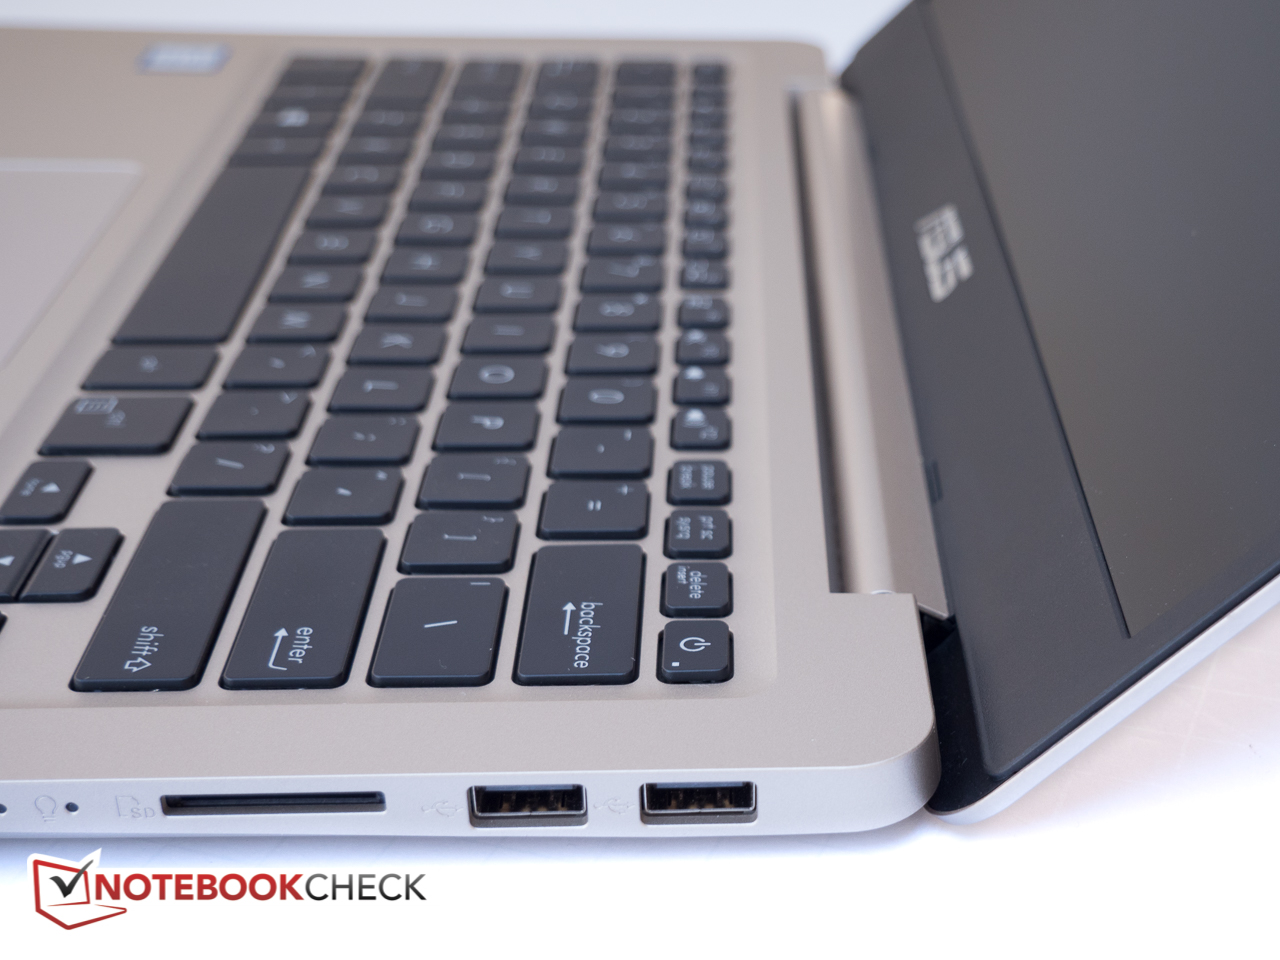
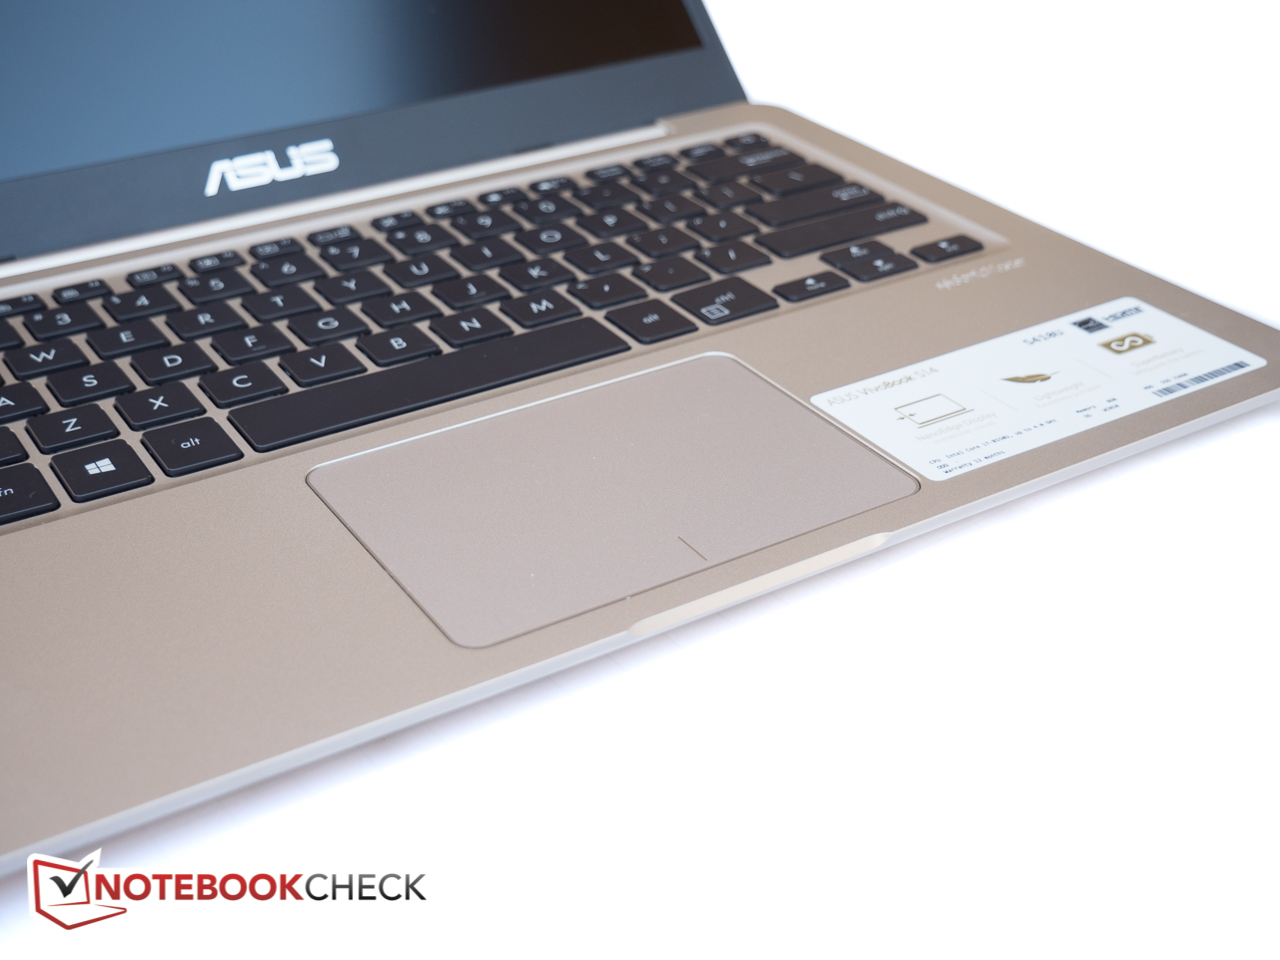
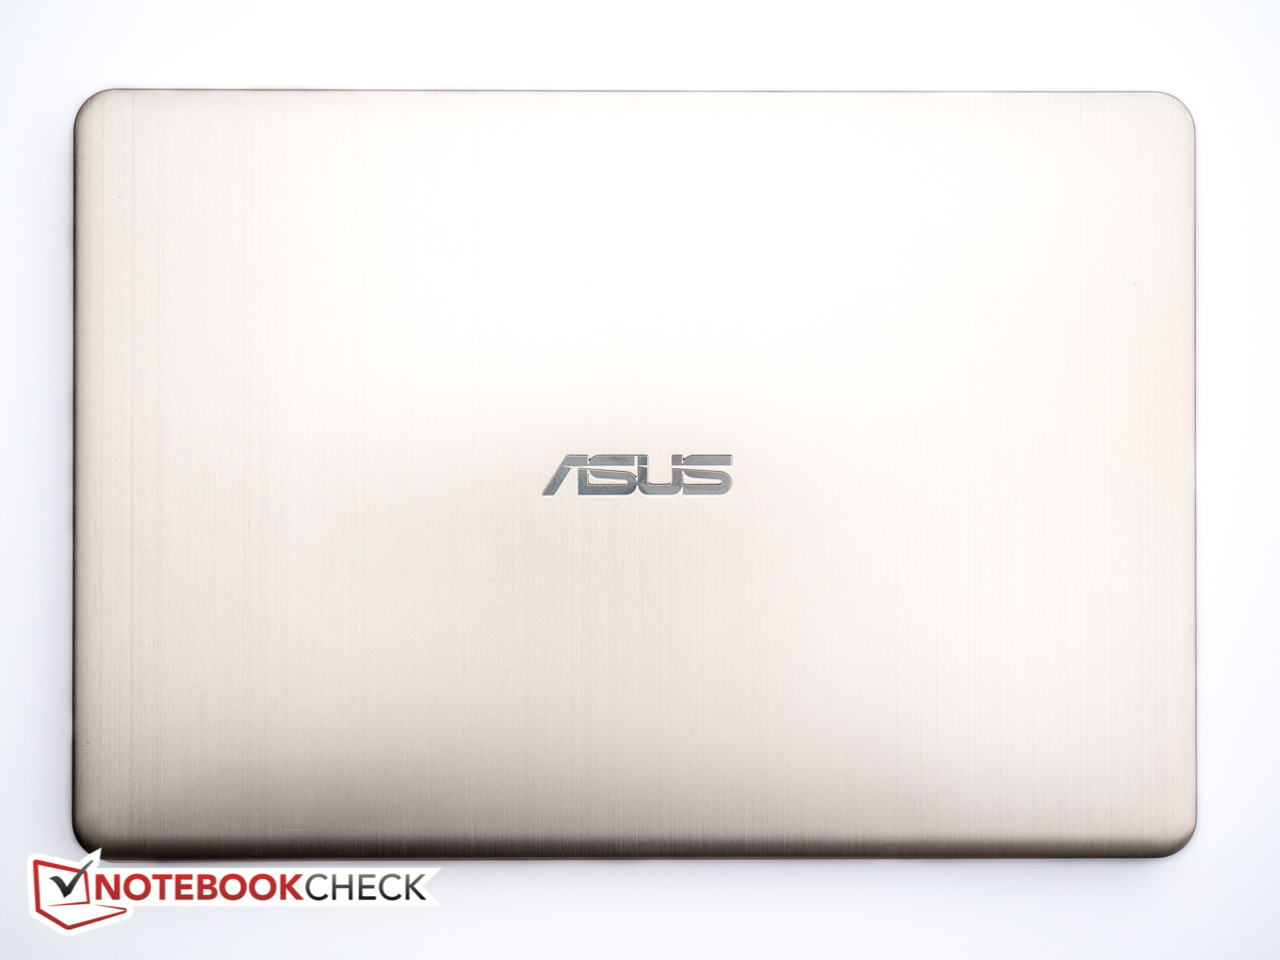
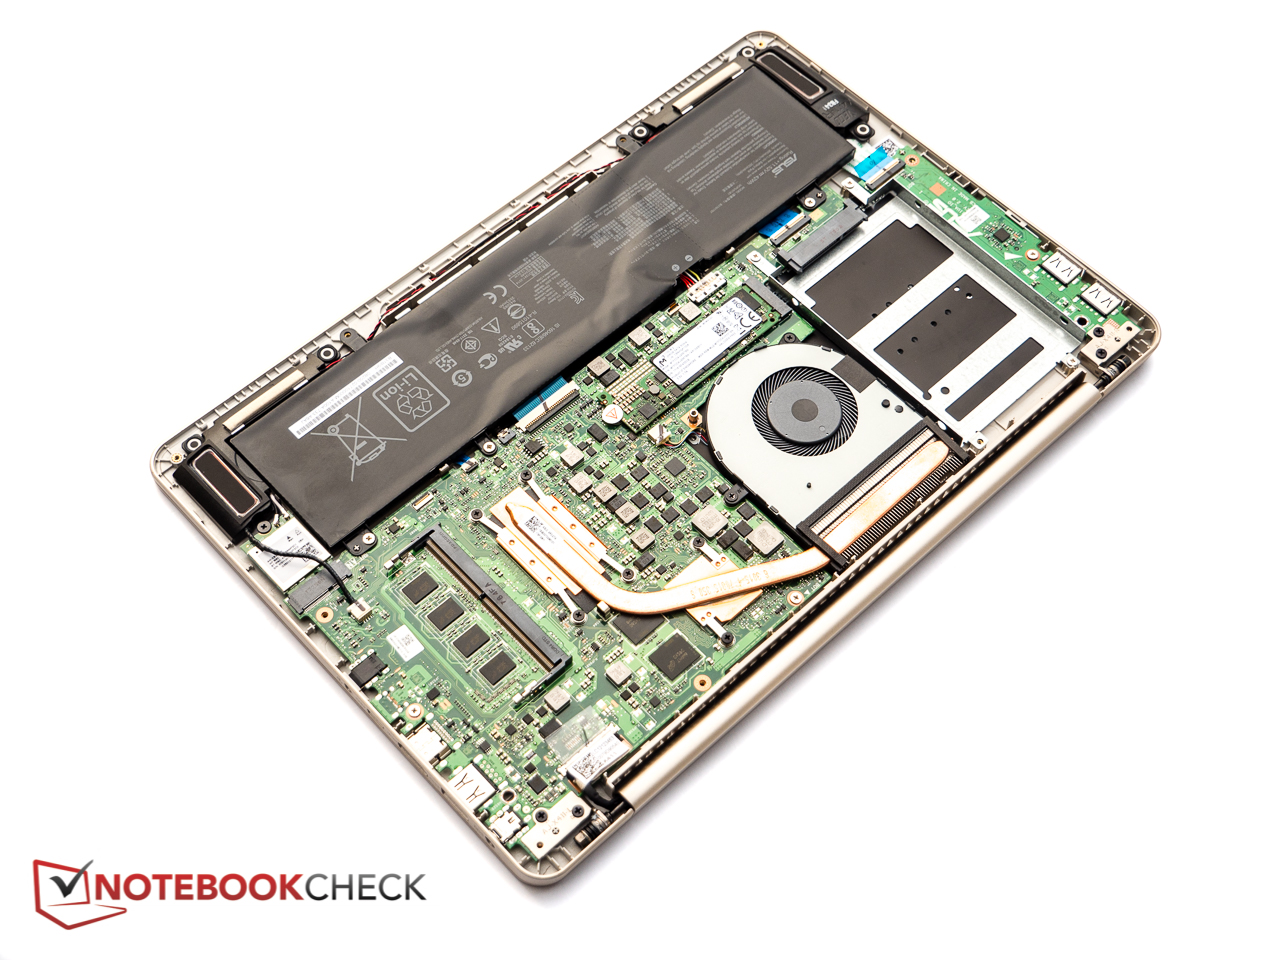
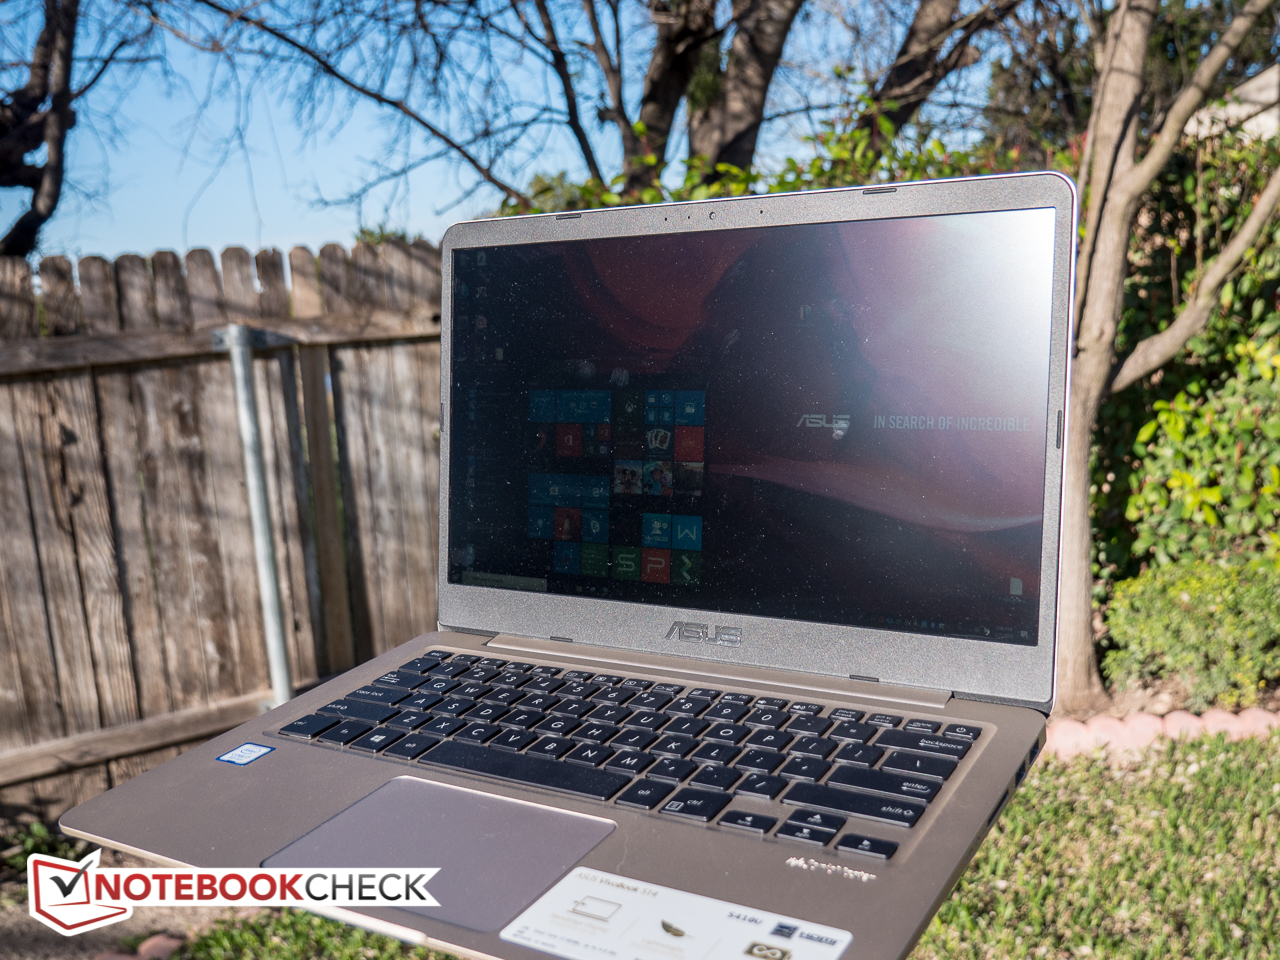
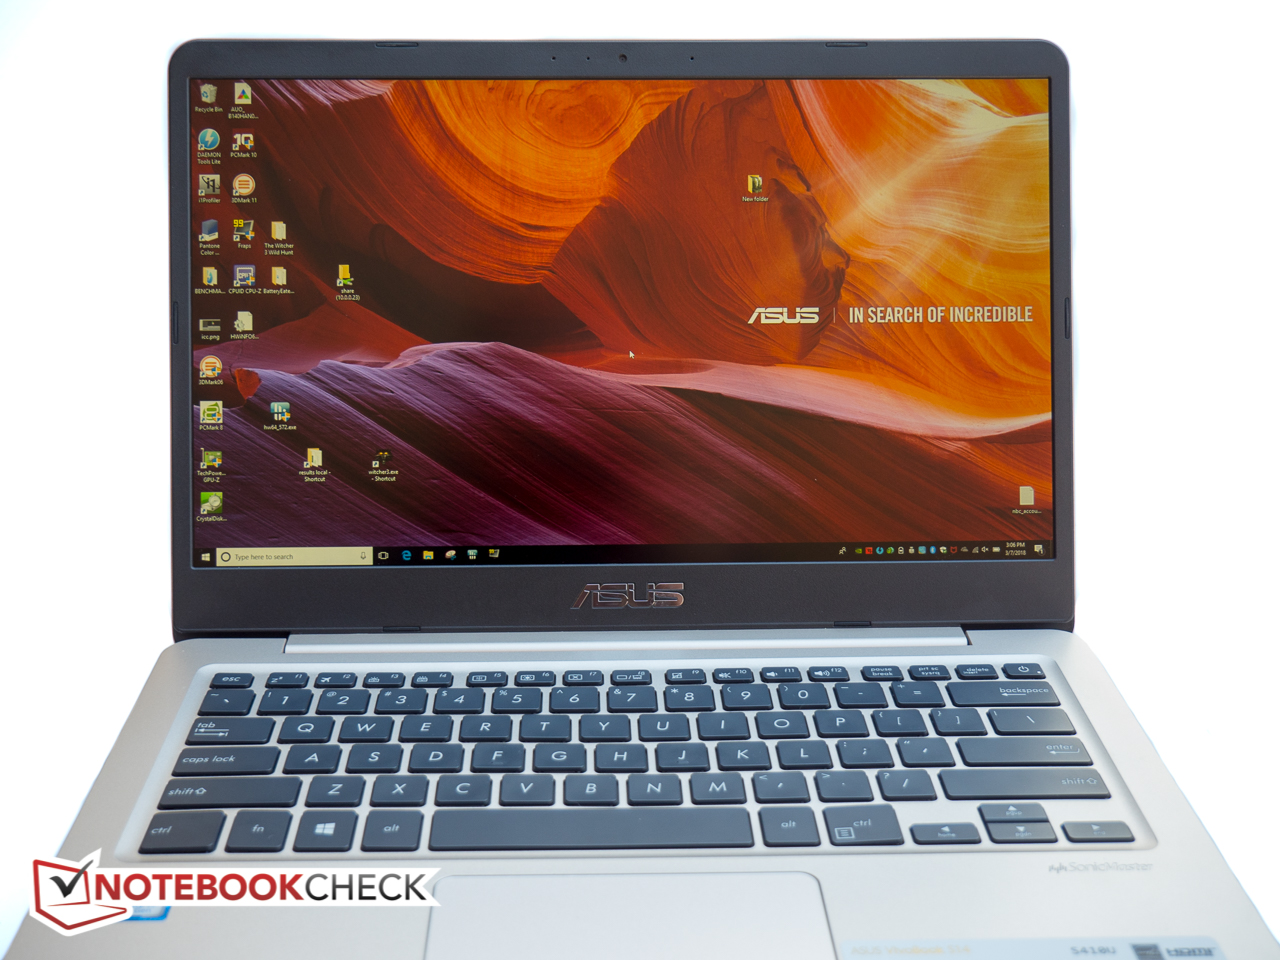
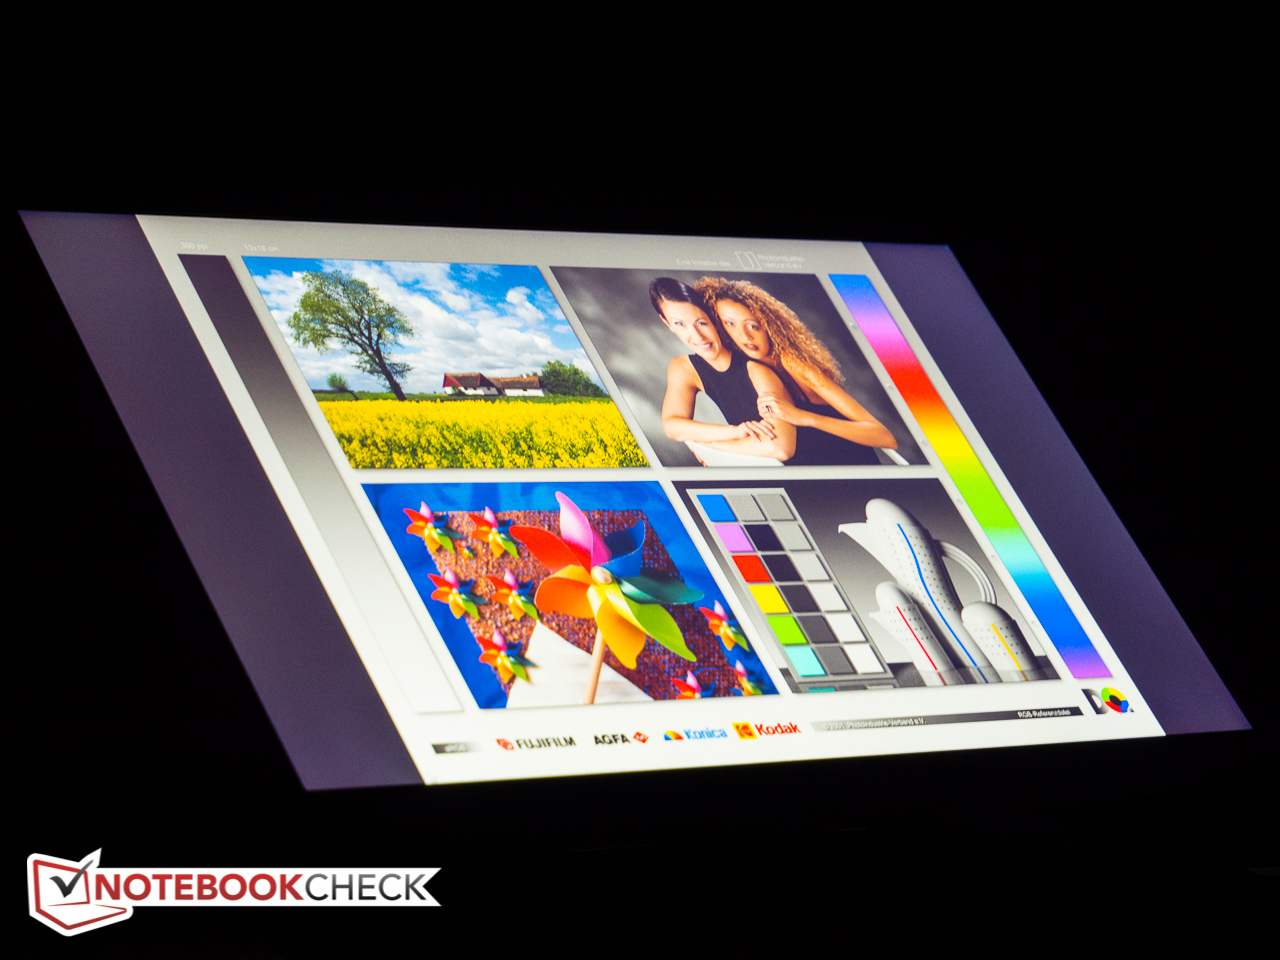
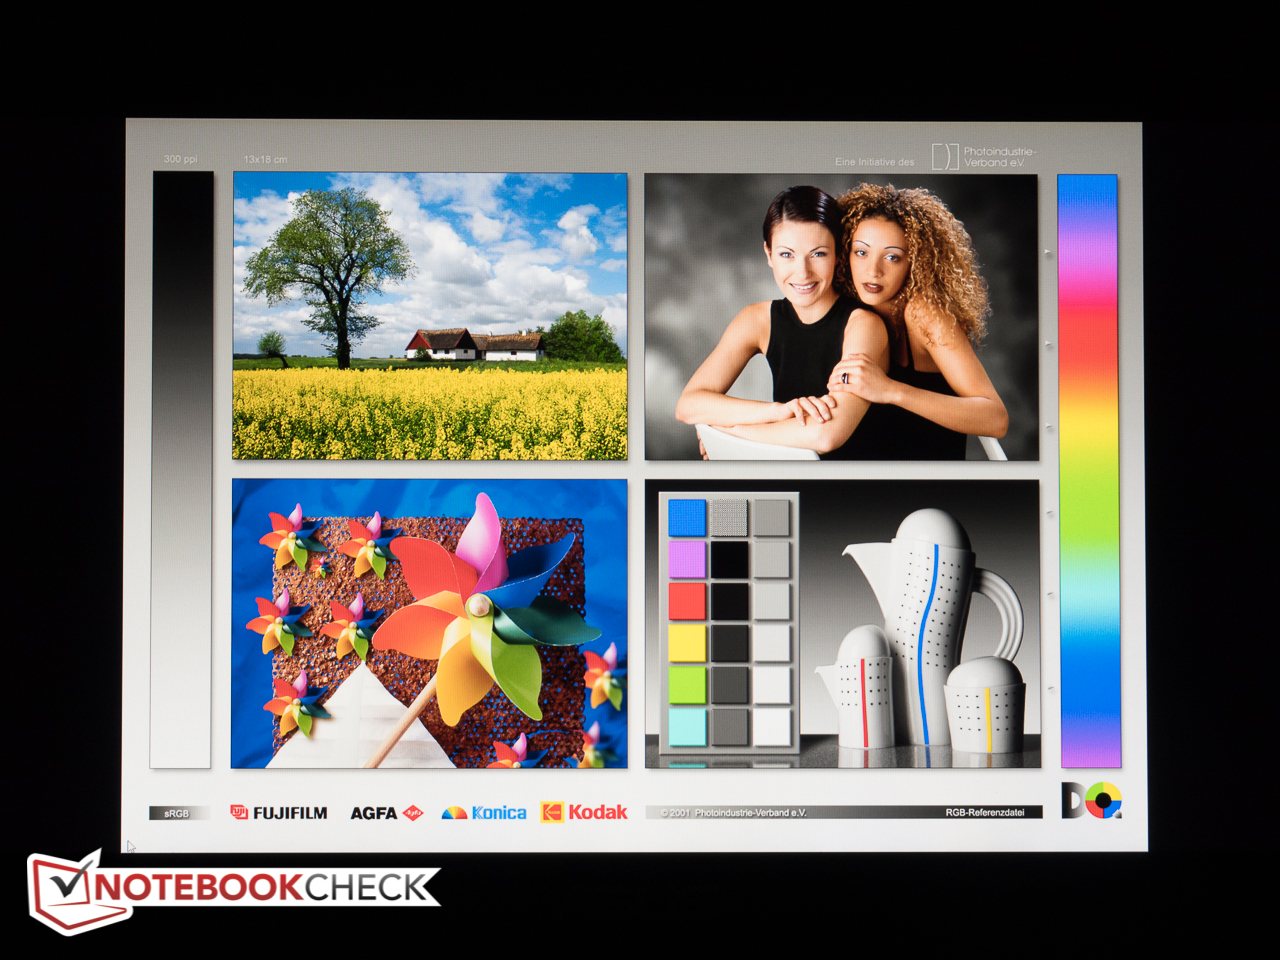
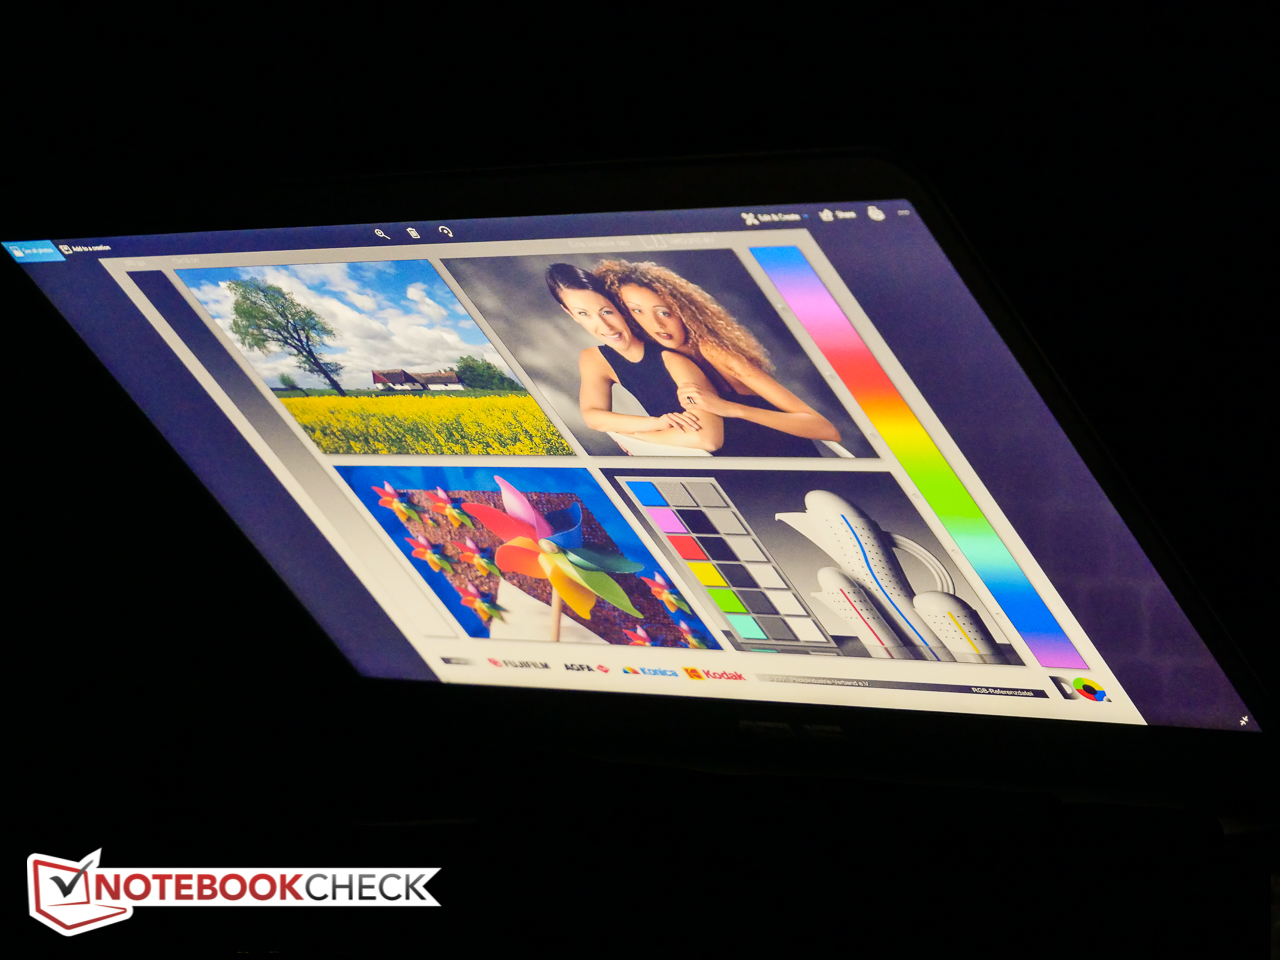
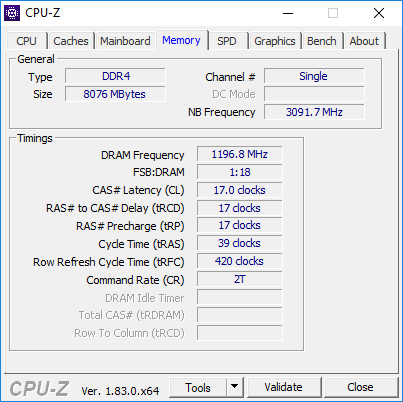
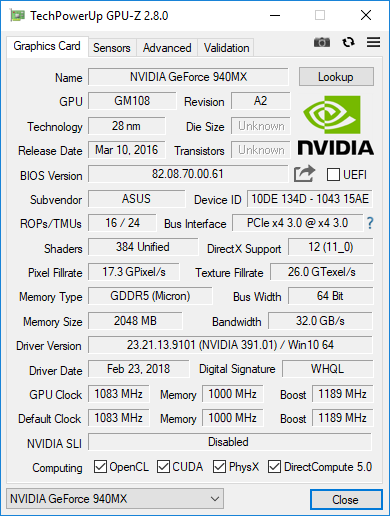
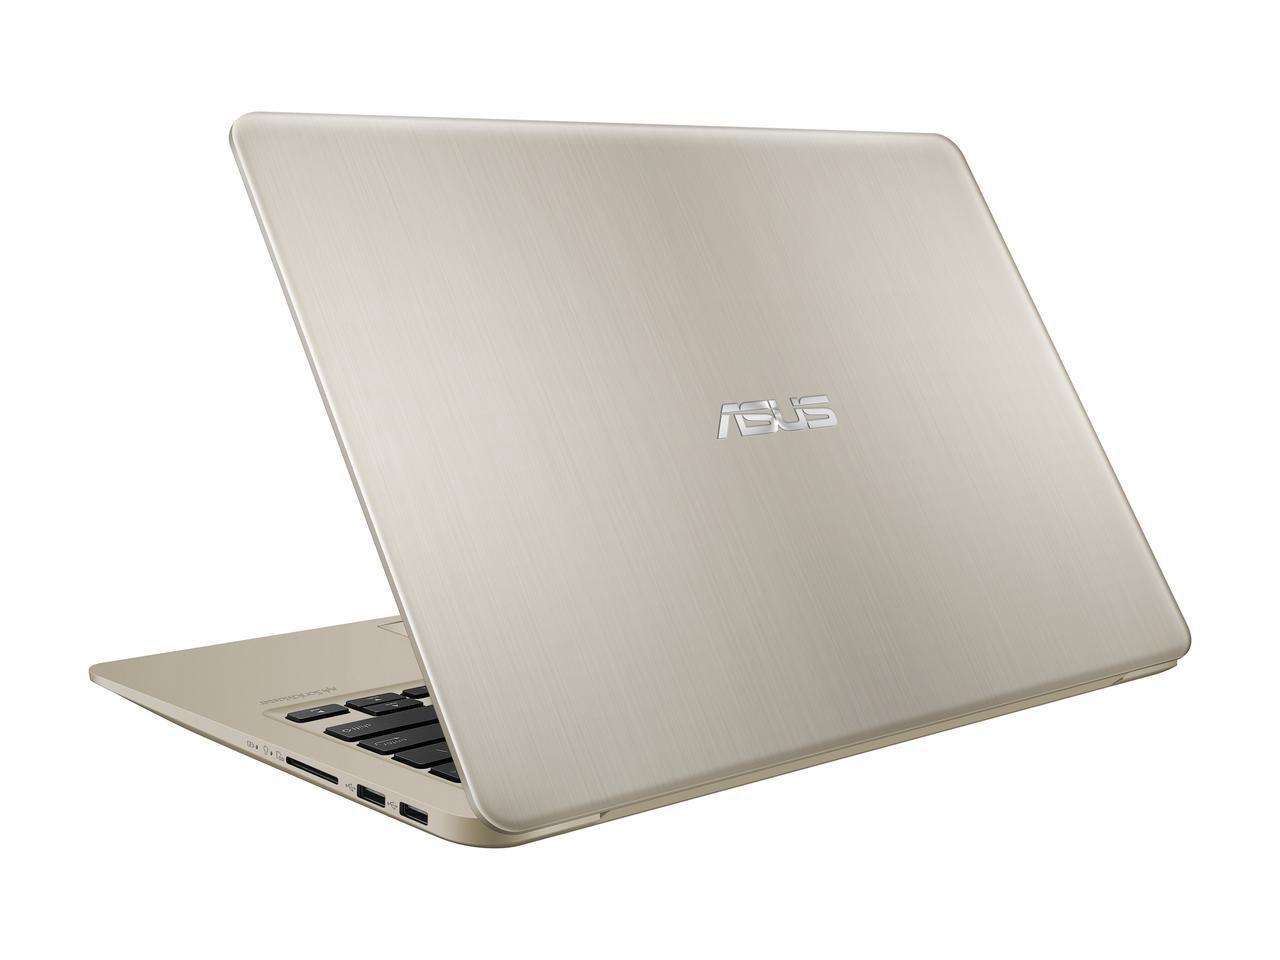
De VivoBook S14 S410UQ-NH74 beschikt over een Full HD 14-inch beeldscherm in een 13.3-inch behuizing. Helaas is het beeldscherm niet erg helder en heeft het last van onnauwkeurige kleurweergave en een slechts matige dekking van professionele kleurbereiken. Toch is het IPS beeldscherm zonder twijfel een verbetering ten opzichte van het HD TN paneel van de VivoBook S14 S406UA. Het notebook ziet er zeker goed uit met zijn slanke ontwerp van plastic en metaal, maar het toetsenbord buigt teveel door bij zelfs matige druk. Het gevolg is dat de type-ervaring bij lange na niet zo plezierig is als had gekund. De systeemprestaties zijn fatsoenlijk, maar bij maximale belasting zagen we zware throttling, omdat het koelsysteem met enkele ventilator en warmte-wisseling-buis de opgewerkte warmte niet snel genoeg kan afvoeren. We twijfelen ook aan de keuze van Asus om een 8e-generatie i7-CPU te combineren met een verouderde instapniveau grafische kaart. Veel concurrerende modellen gebruiken al de veel krachtiger GeForce MX150.
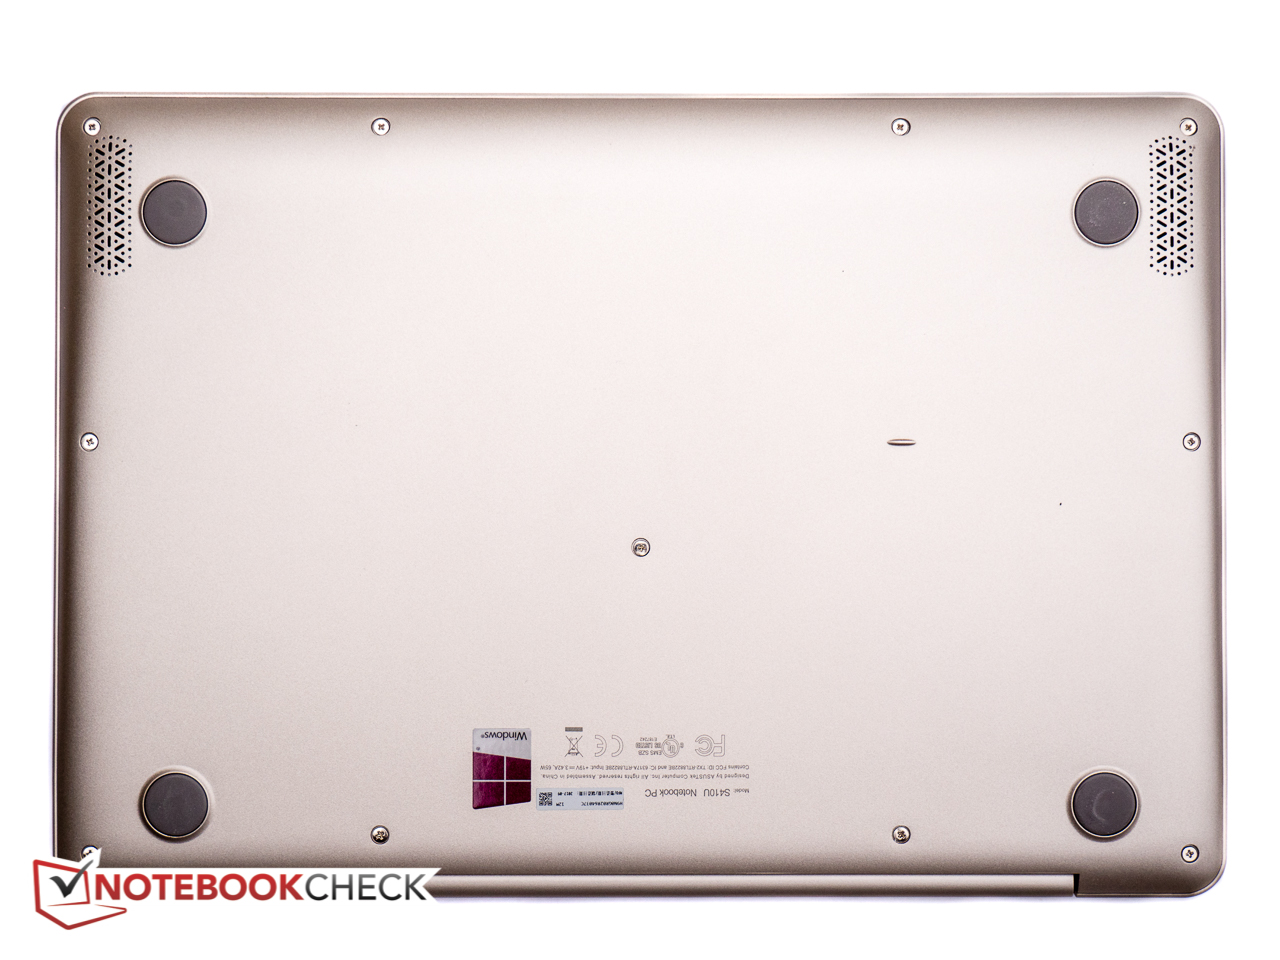
Bij mindere belastingen blijft het notebook echter prettig stil en gaat de batterij met wat zuinig gebruik een hele werkdag mee. We waarderen het dun-en-lichte, aantrekkelijke ontwerp en ook de aanwezigheid van een lege 2.5-inch harde schijf sleuf met SATA 3-aansluiting. Gebruikers met behoefte aan meer opslagcapaciteit kunnen dus makkelijk en goedkoop de opslag uitbreiden, zonder externe harde schijven te hoeven gebruiken.
Doordat het toetsenbord erg makkelijk erg veel doorbuigt, is de VivoBook S14 niet een van de grootste uitdagers in het multimedia segment, maar het notebook is nog steeds een fatsoenlijke keuze voor gebruikers die kunnen leven met de benoemde minpunten.
Asus VivoBook S410UQ-NH74
-
10-03-2018 v6(old)
Bernie Pechlaner
Pricecompare
